Since the last update on June 2nd, there have been new state polls in Kansas, Arizona (x4), Florida (x4), Michigan (x6), North Carolina (x4), Pennsylvania (x2), Wisconsin (x3), Texas (x2), Ohio, California, Iowa (x3), Oklahoma, Tennessee, Kentucky, Georgia, Missouri, Arkansas, New Mexico, and Mississippi.
Now, there has been lots of reporting in the last couple of weeks about national polls moving strongly away from Trump and toward Biden.
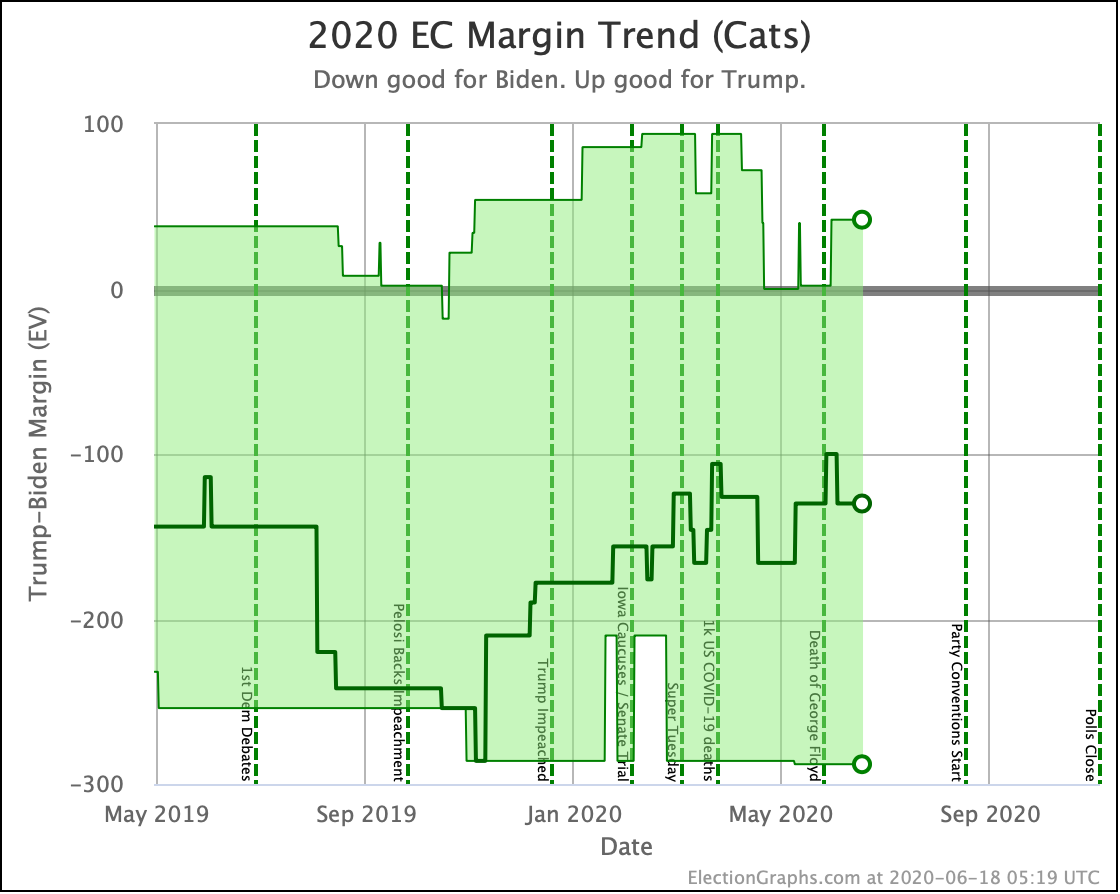
The view here looking at state polls is a bit more complicated. Some states moved toward Trump while some moved toward Biden. And combining that into an Electoral College view, Trump strengthened a bit at the start, then Biden made up all of that ground and then some by the end. Overall Biden is a bit stronger now than at our last update.
Anyway, let's start with the summary table of changes, then get into the graphs:
| Model | Metric | 2 Jun | 18 Jun | 𝚫 |
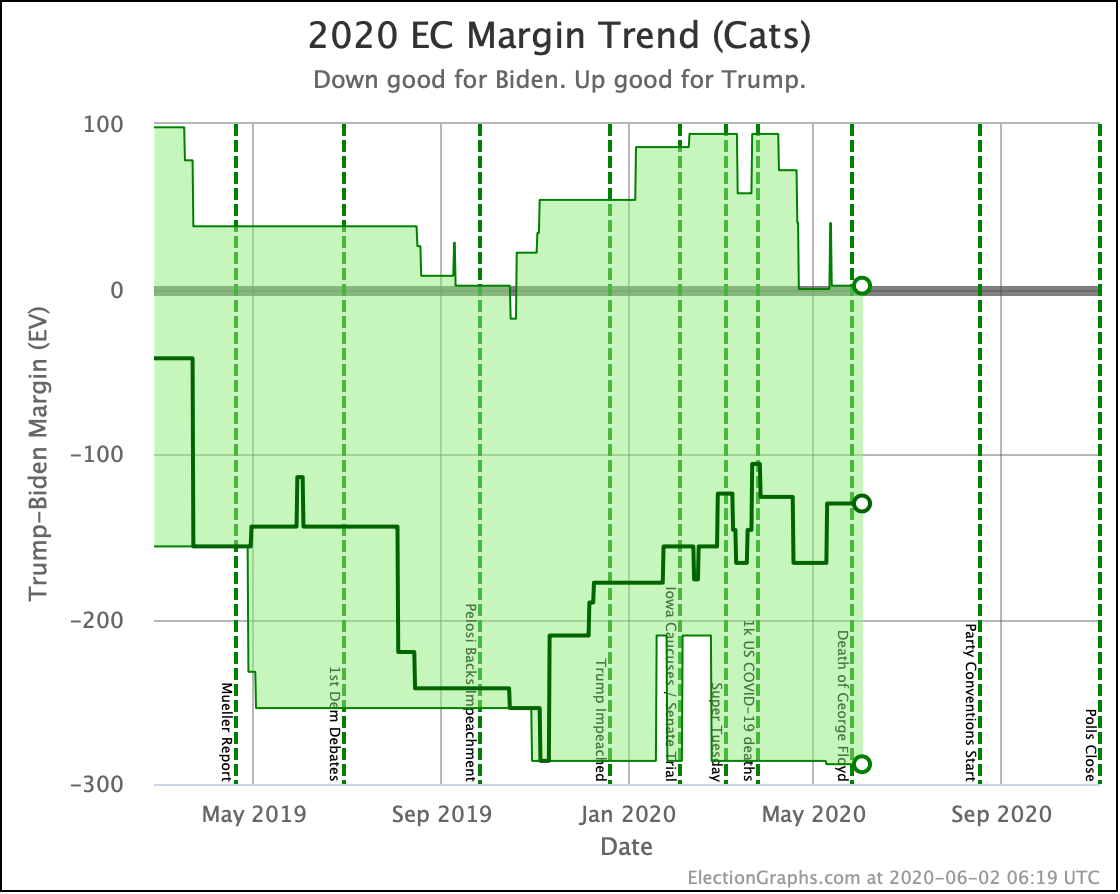
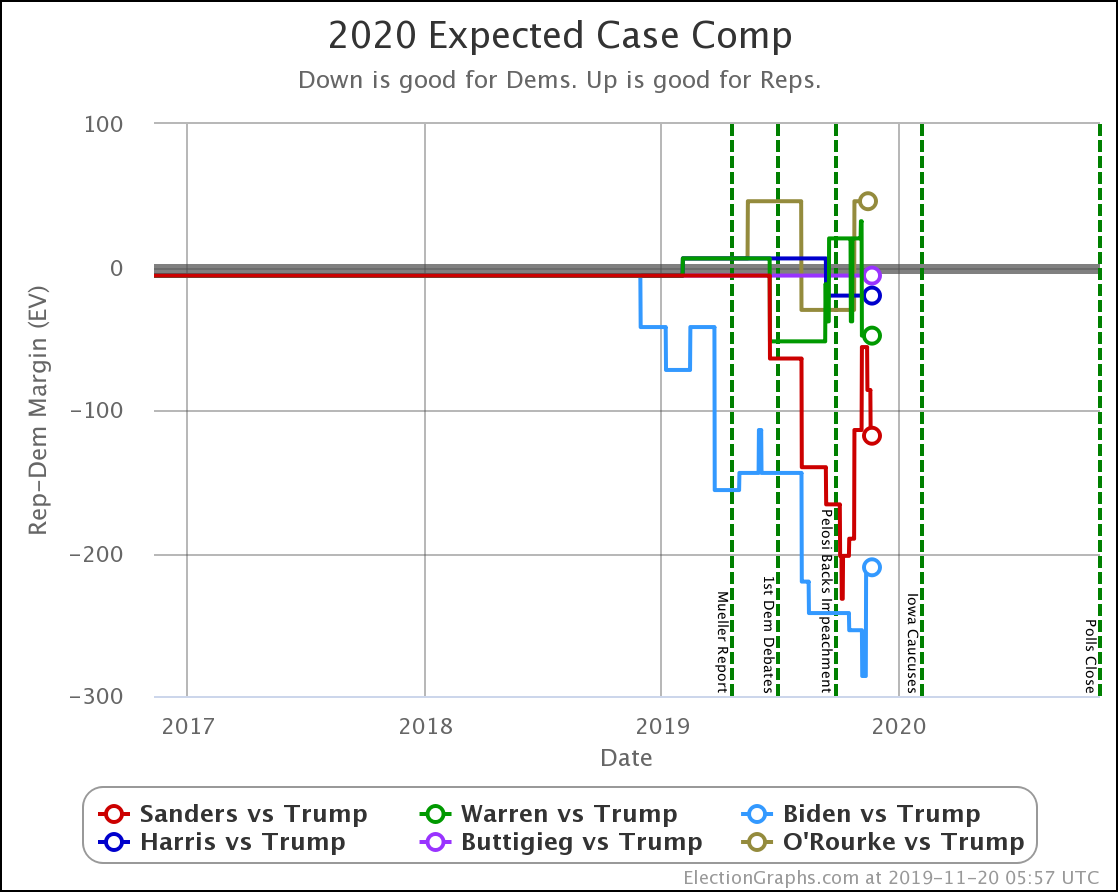
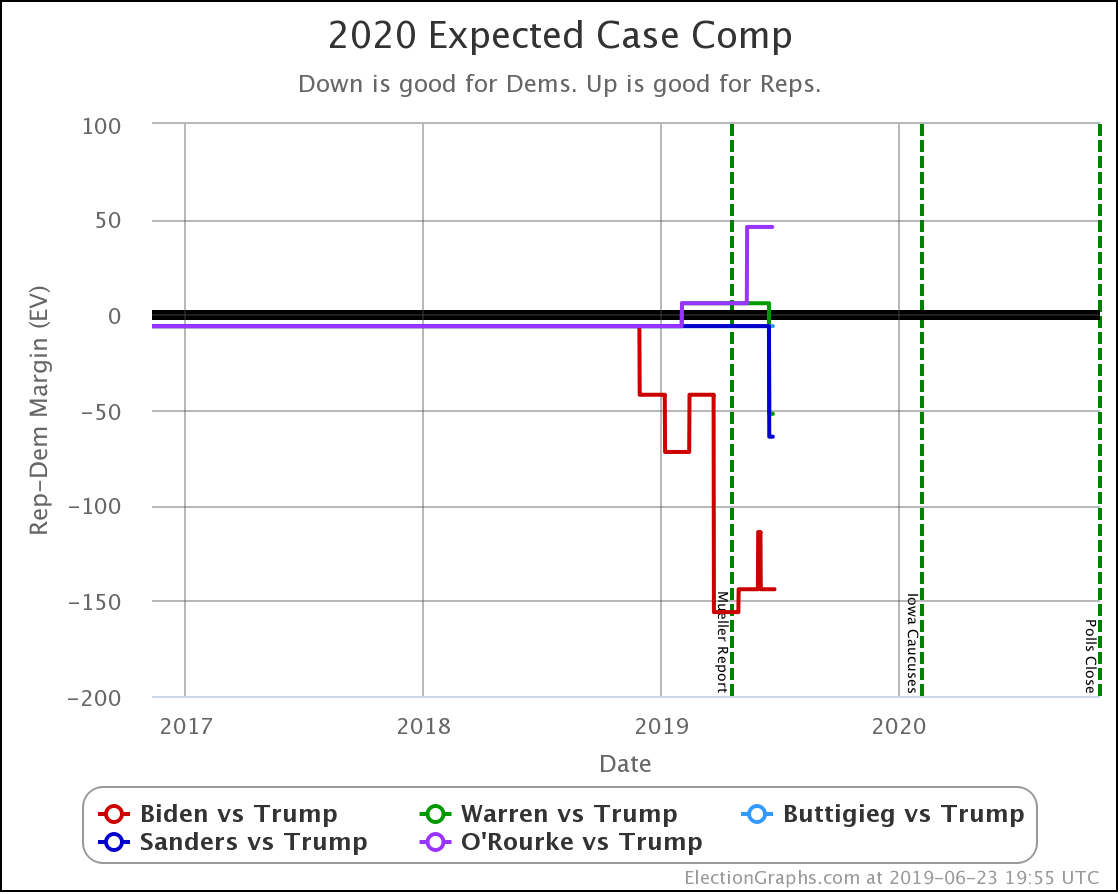
| Categories | Trump Best Expected Biden Best |
Trump +2 Biden +130 Biden +288 |
Trump +42 Biden +130 Biden +288 |
Trump +40 FLAT FLAT |
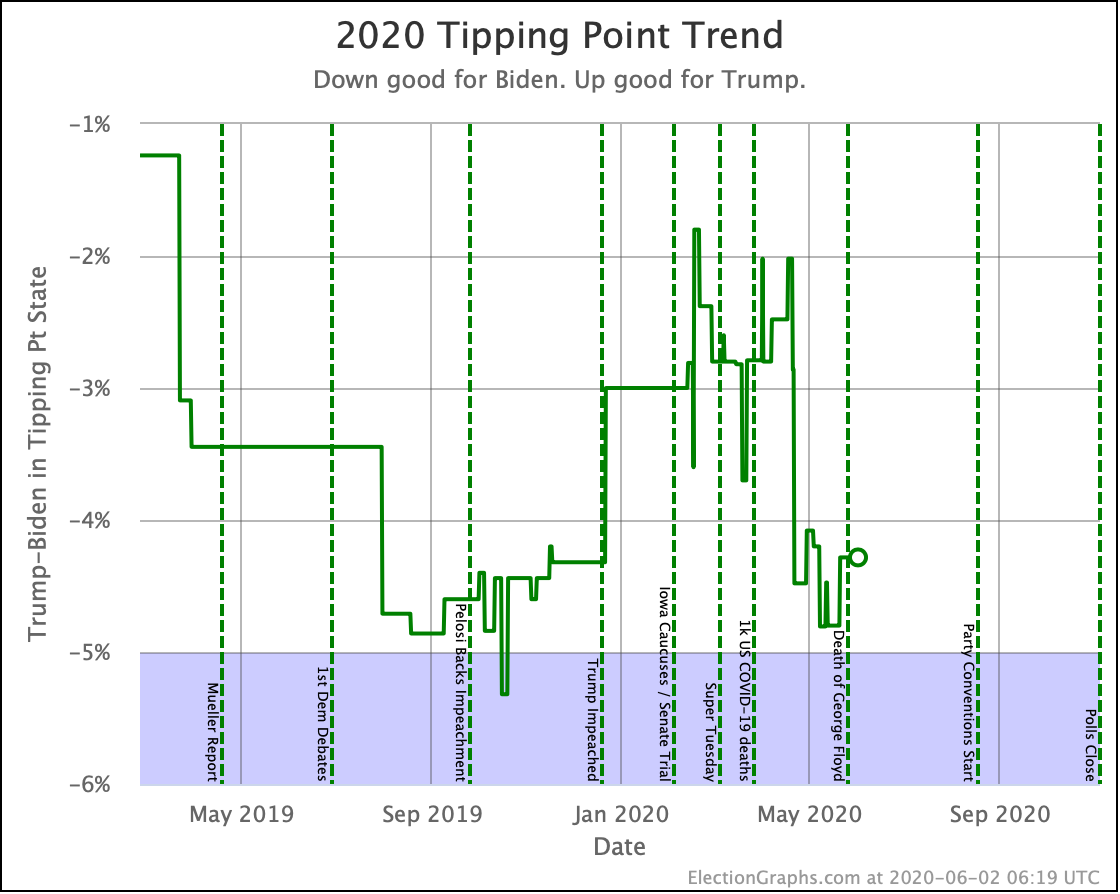
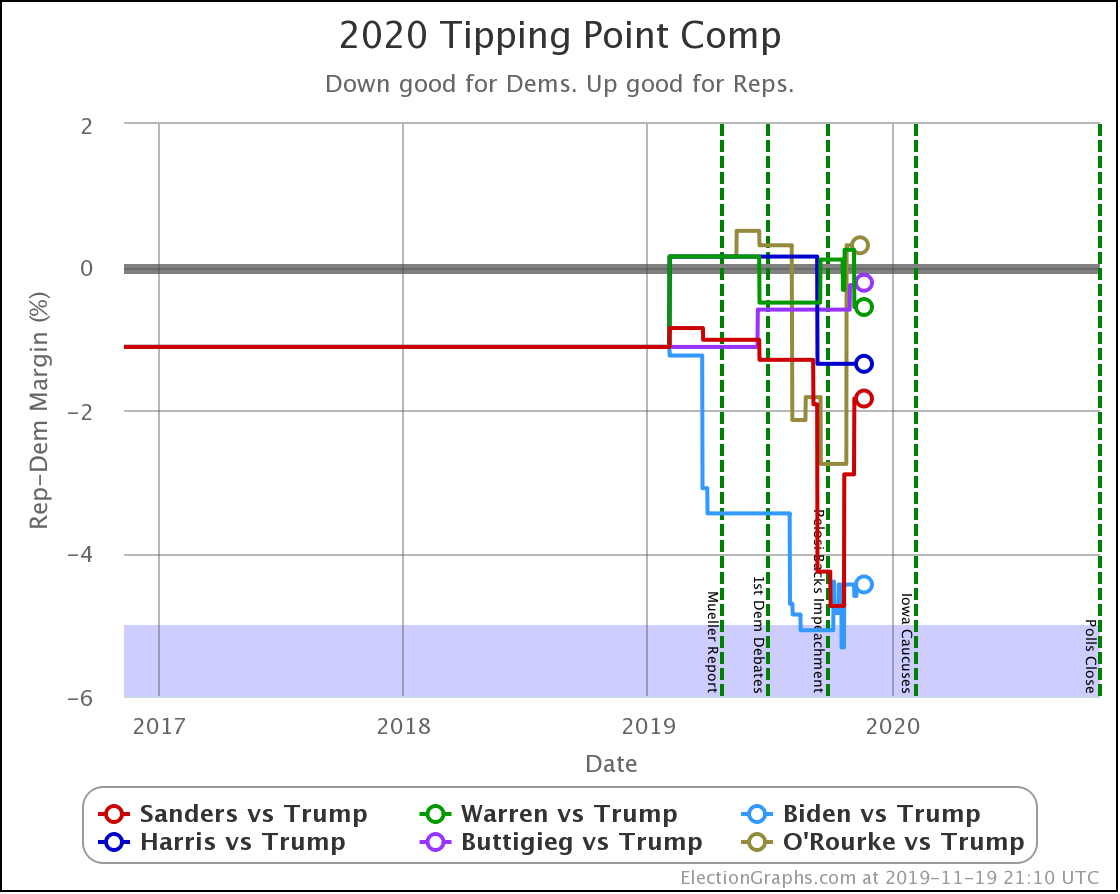
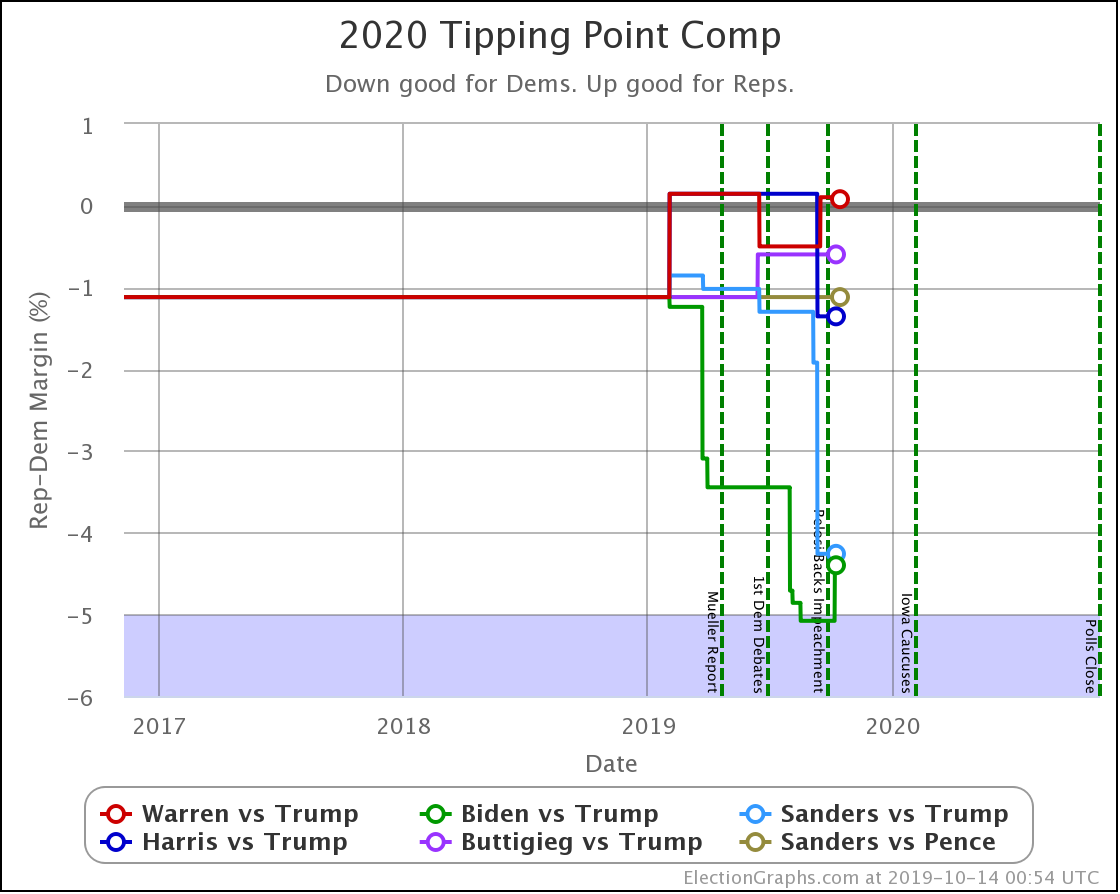
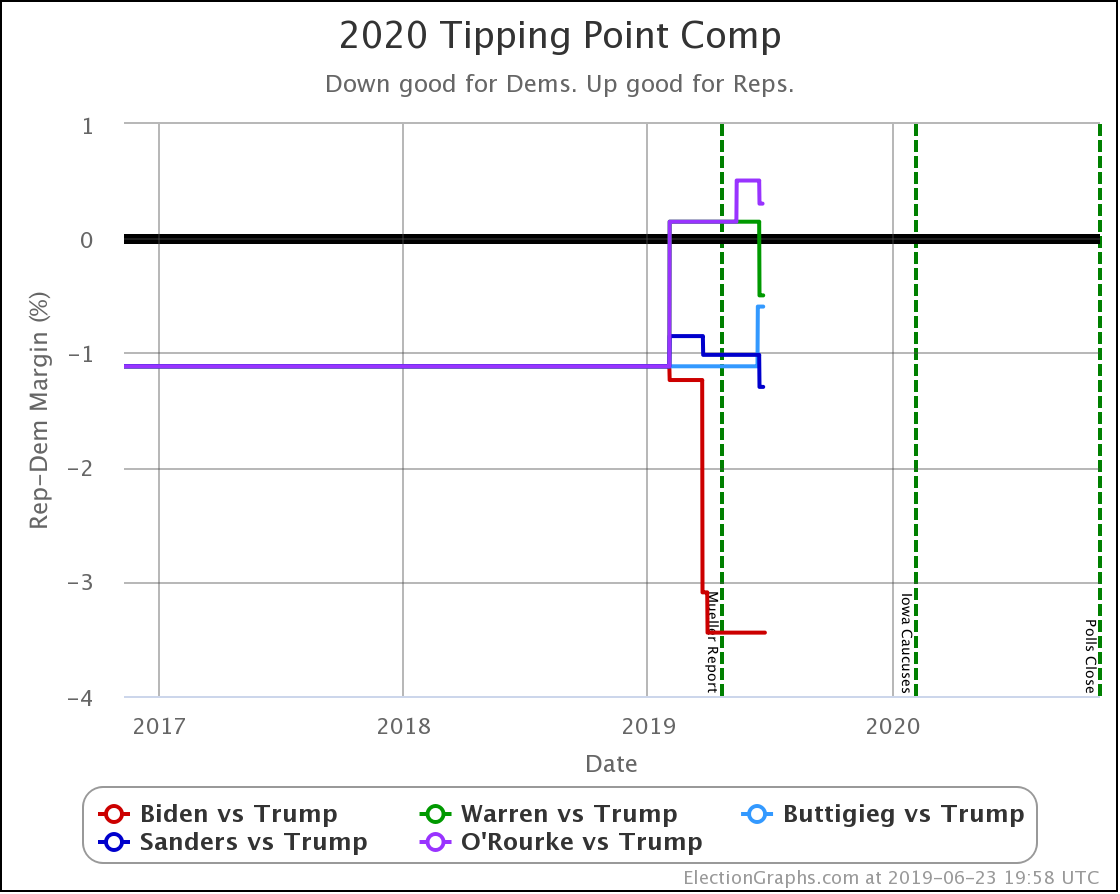
| Tipping Point | Biden +4.3 | Biden +4.8% | Biden +0.5% | |
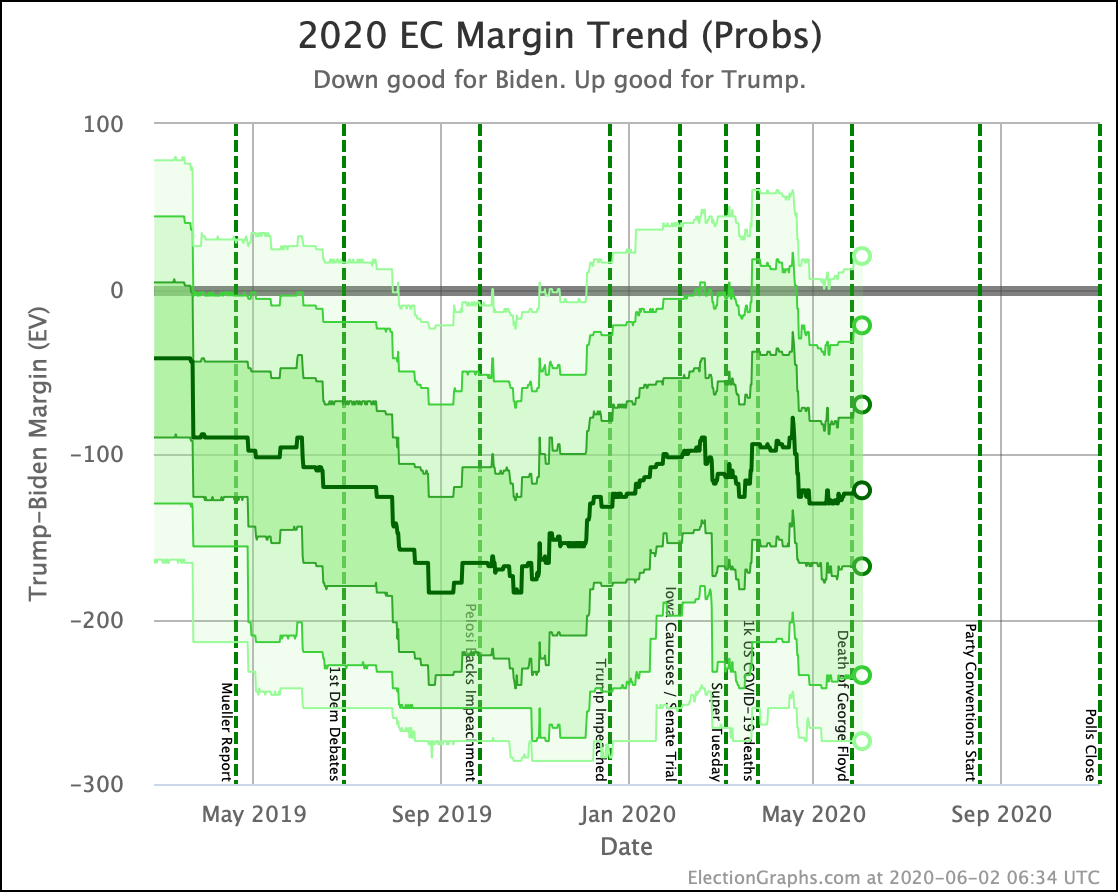
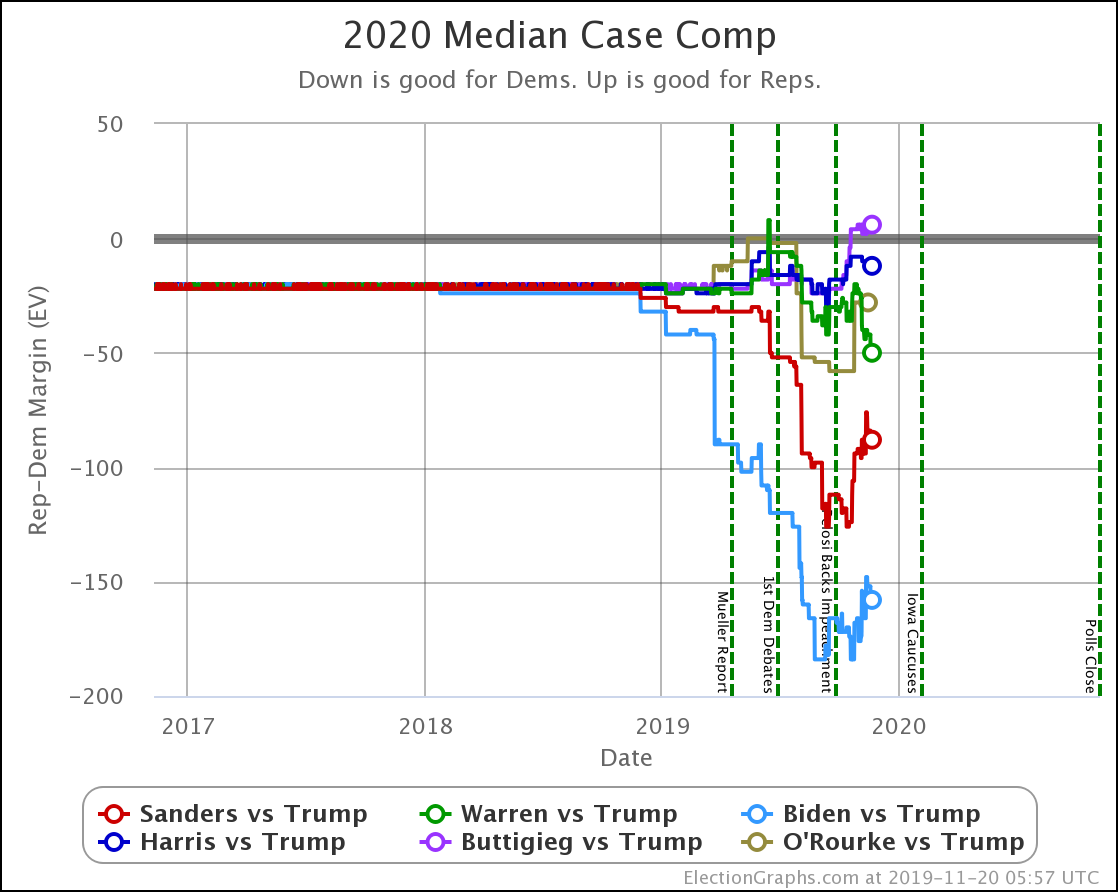
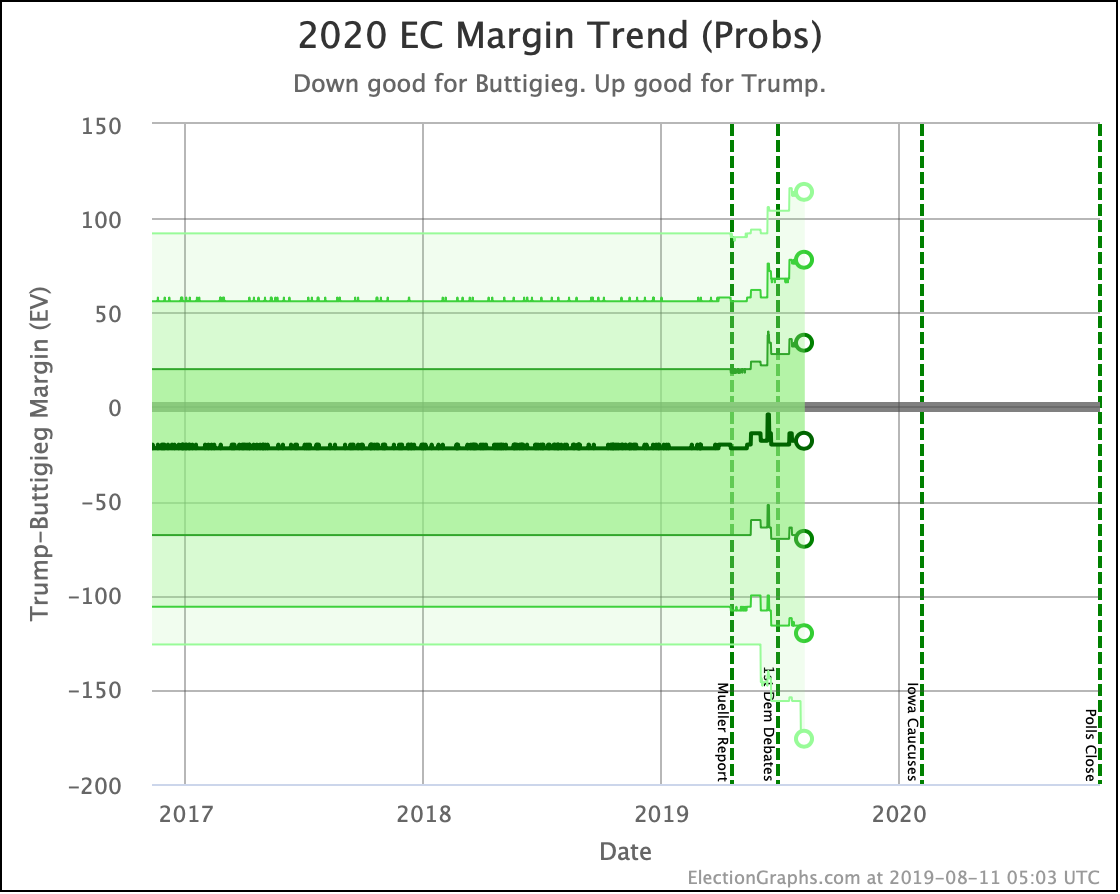
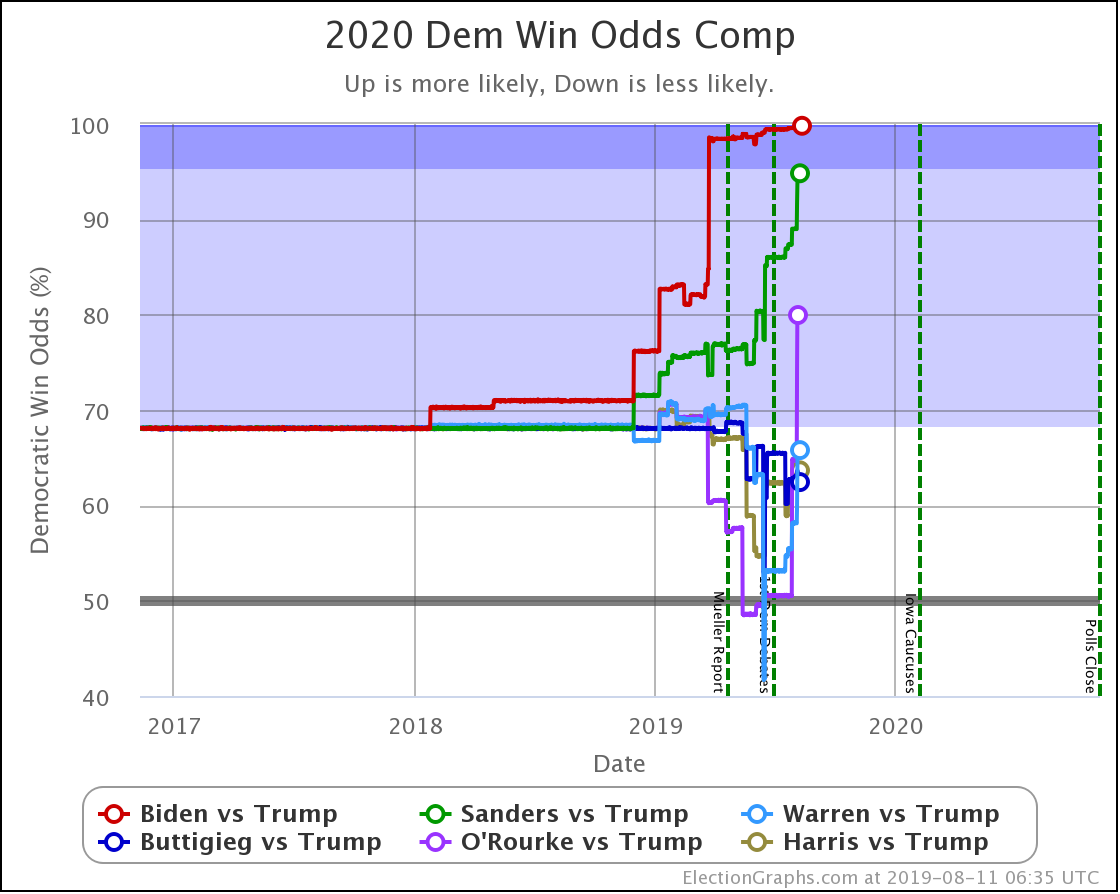
| Probabilities | Trump 2σ Median Biden 2σ |
Biden +22 Biden +122 Biden +234 |
Biden +32 Biden +132 Biden +242 |
Biden +10 Biden +10 Biden +8 |
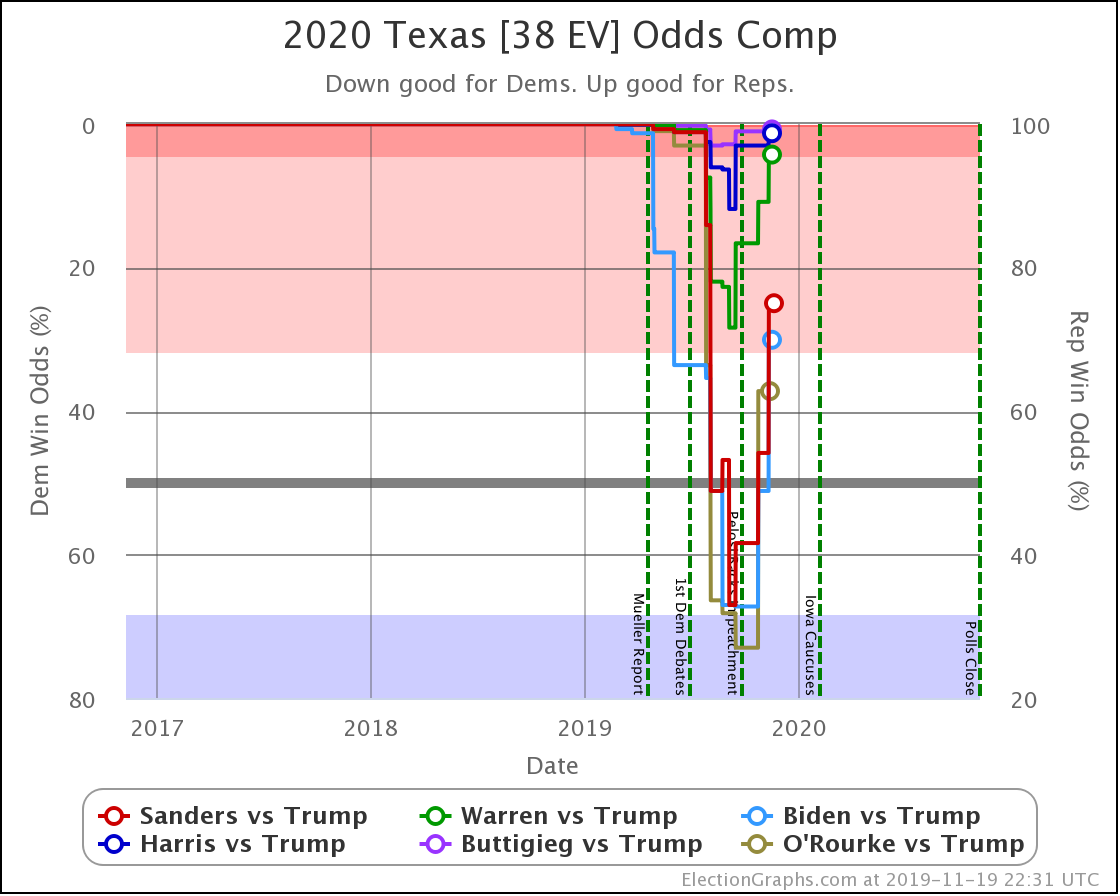
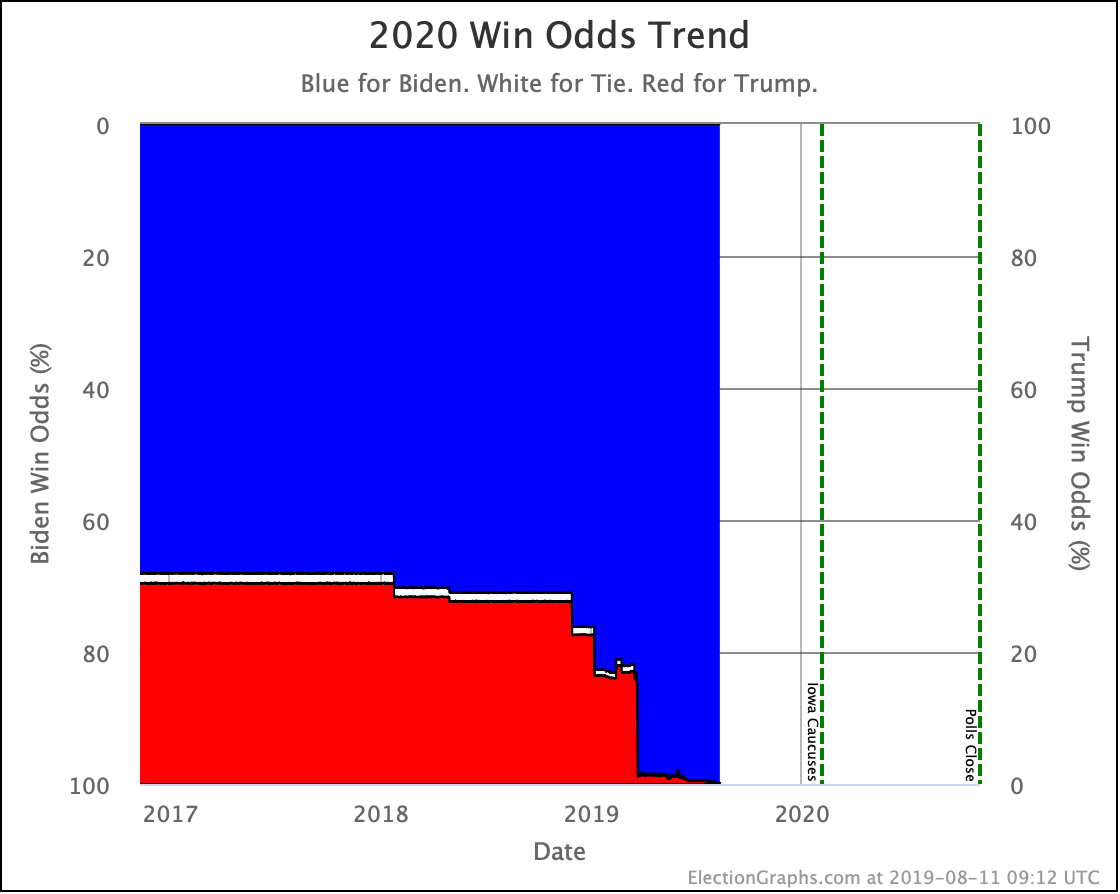
| Trump Win Tie Biden Win |
0.5% 0.1% 99.4% |
0.3% 0.1% 99.6% |
-0.2% FLAT +0.2% |
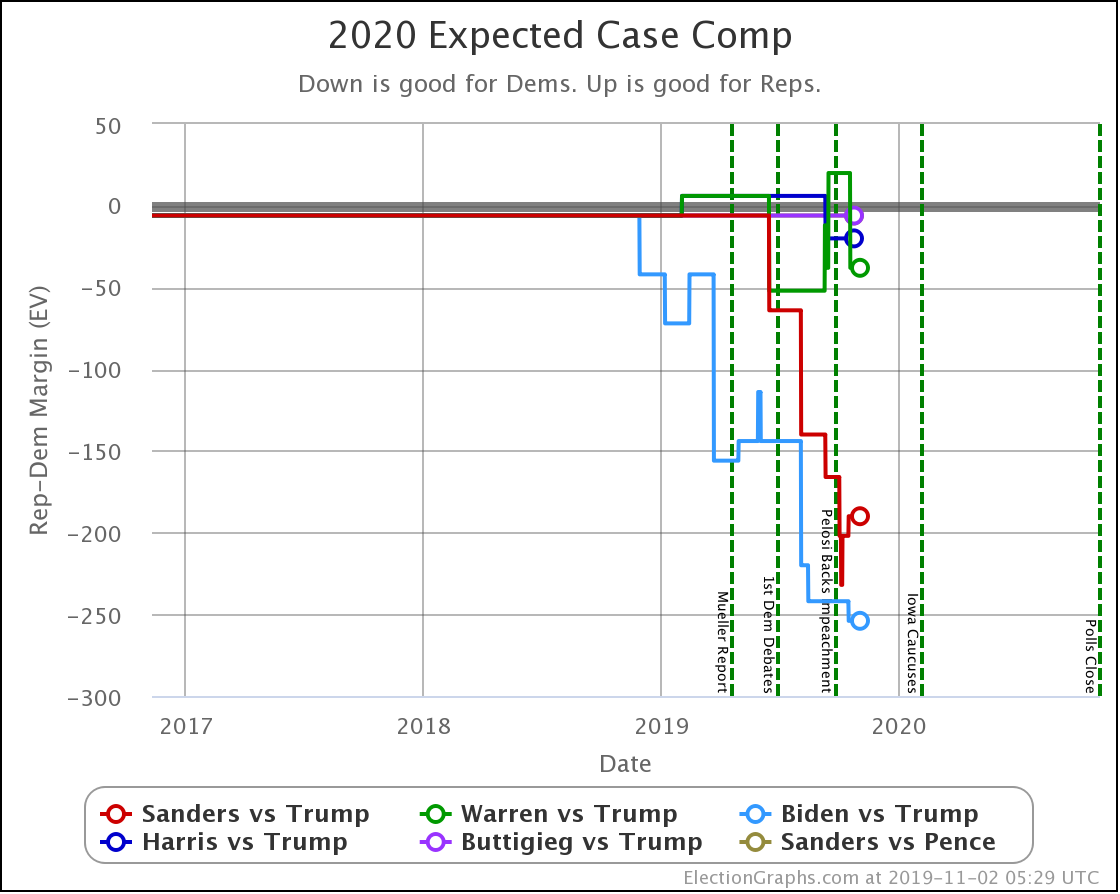
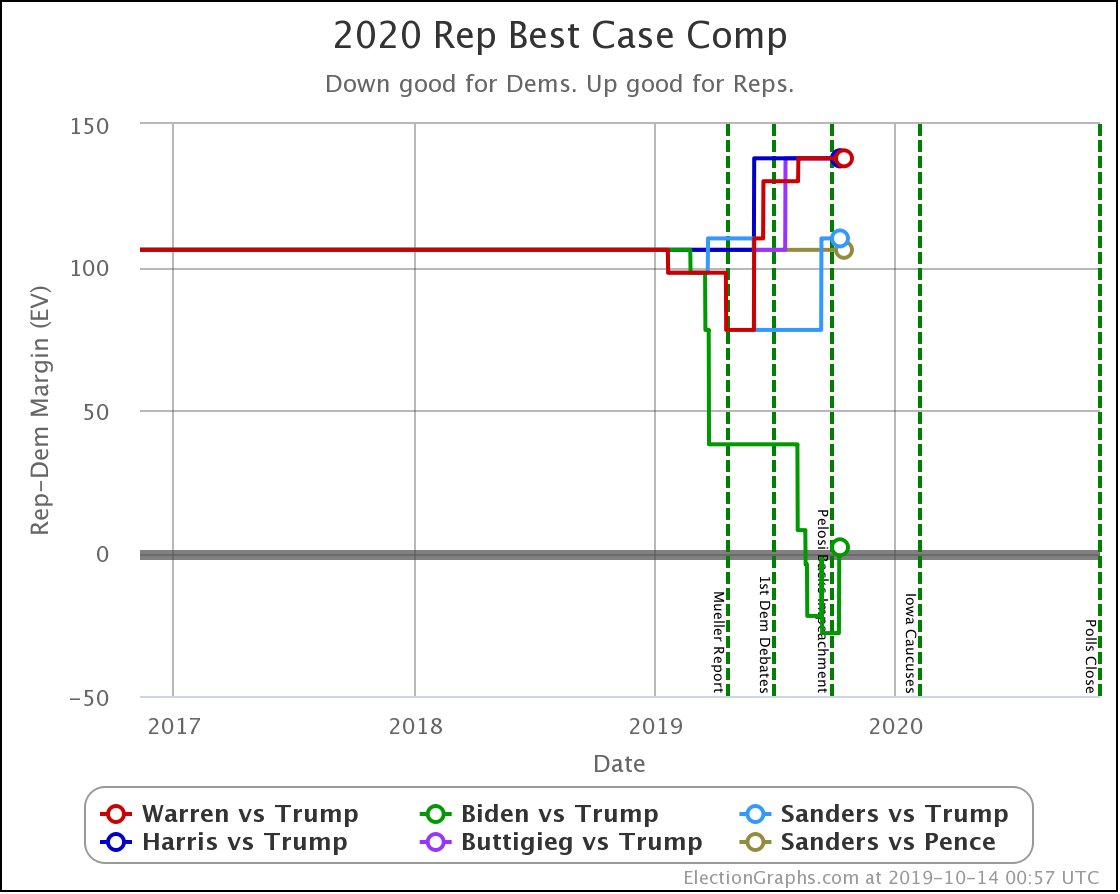
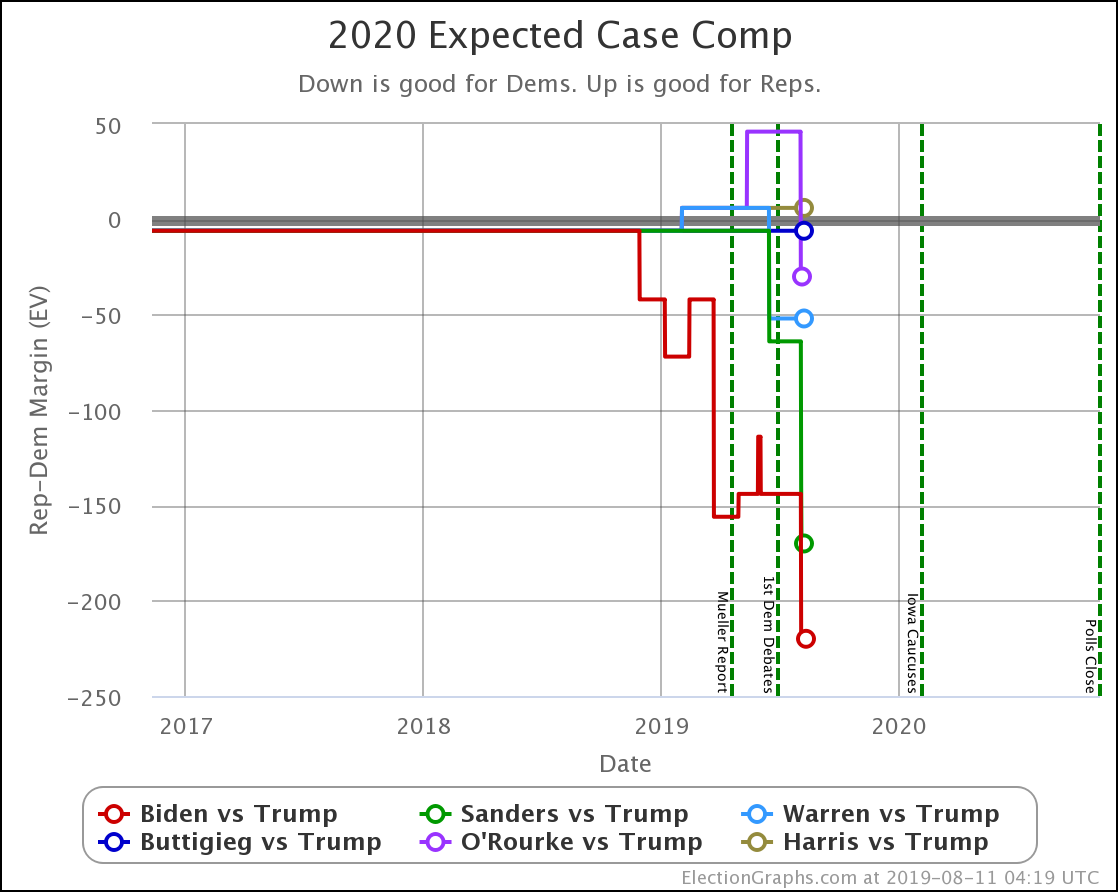
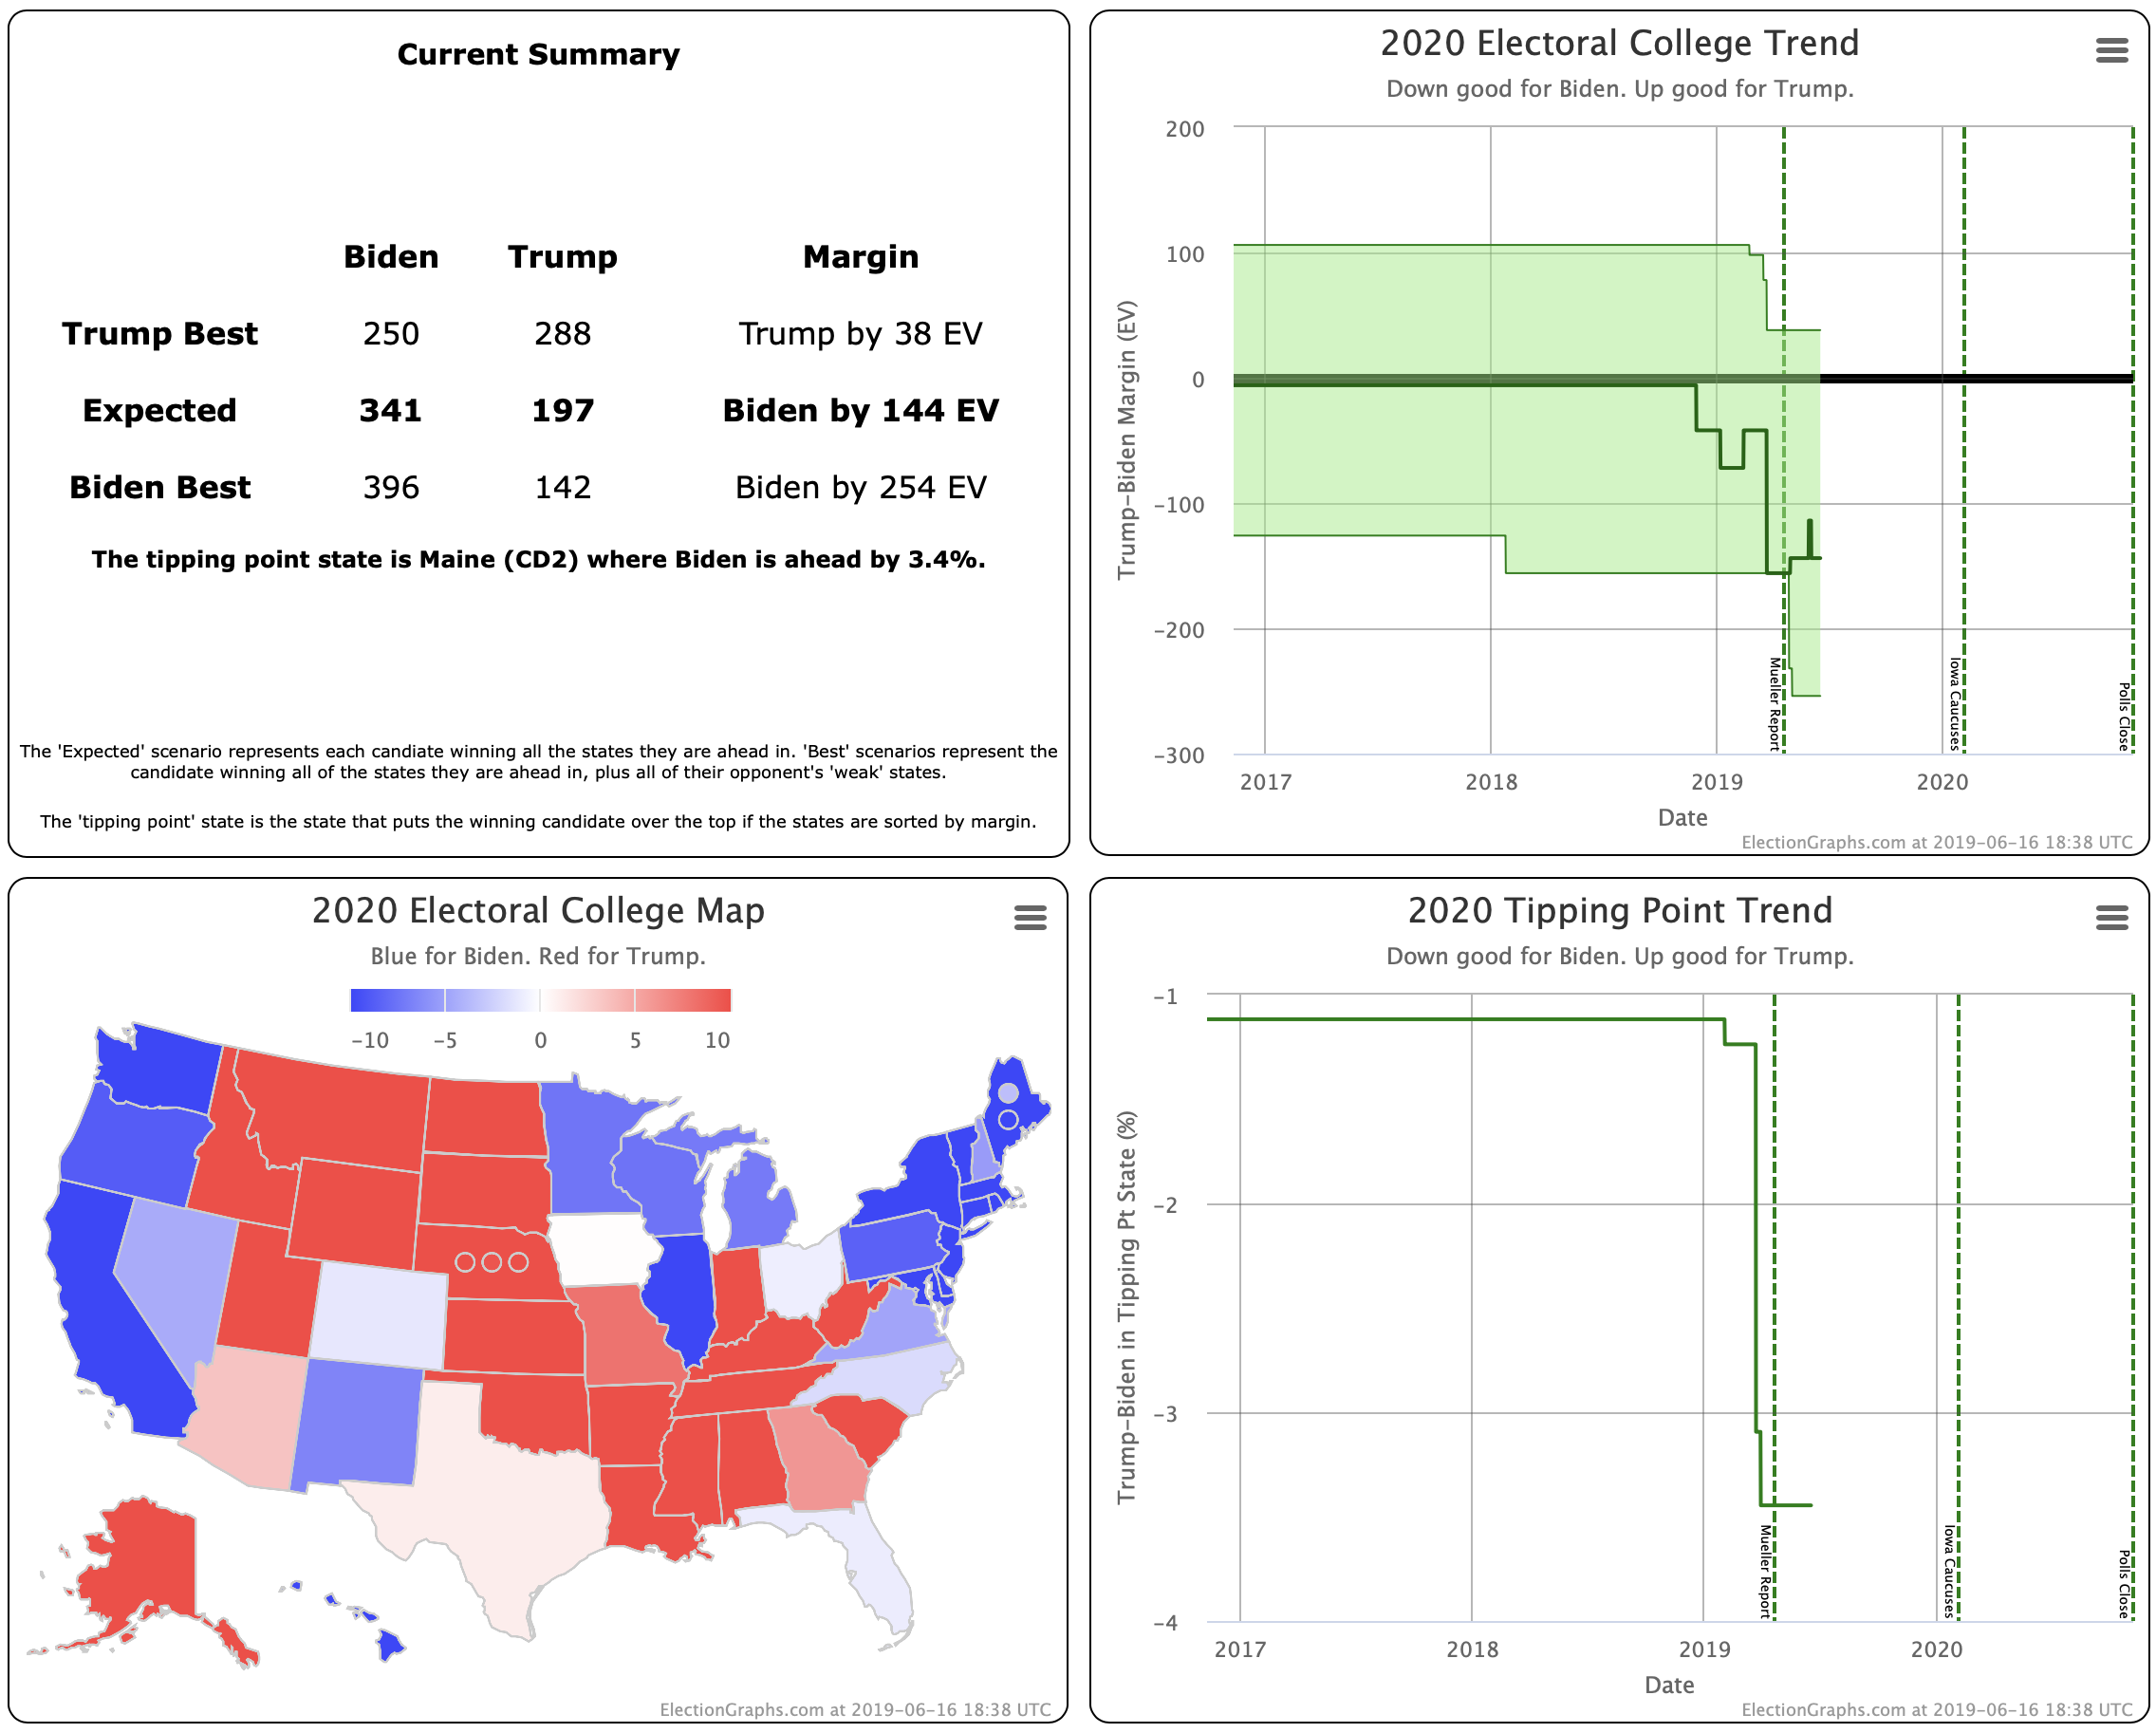
The most obvious change here is the improvement of Trump's best case in the categorization view by 40 EV.
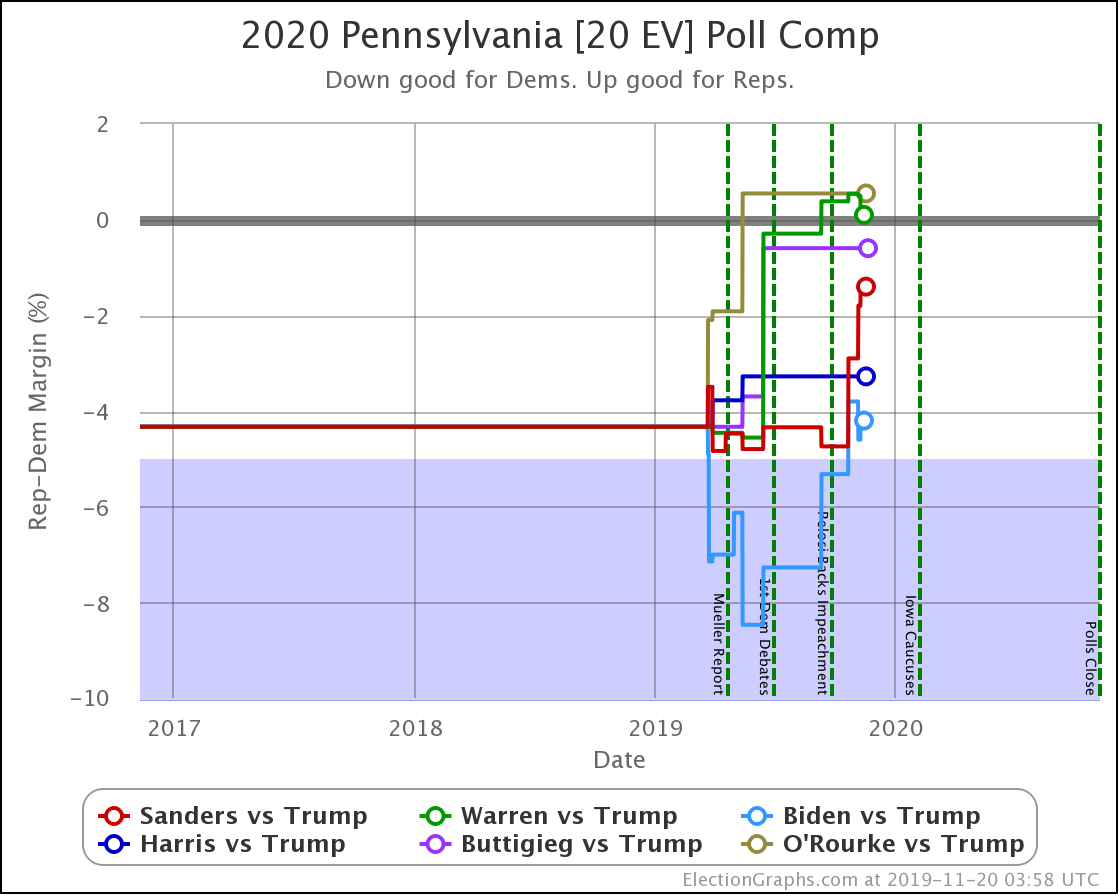
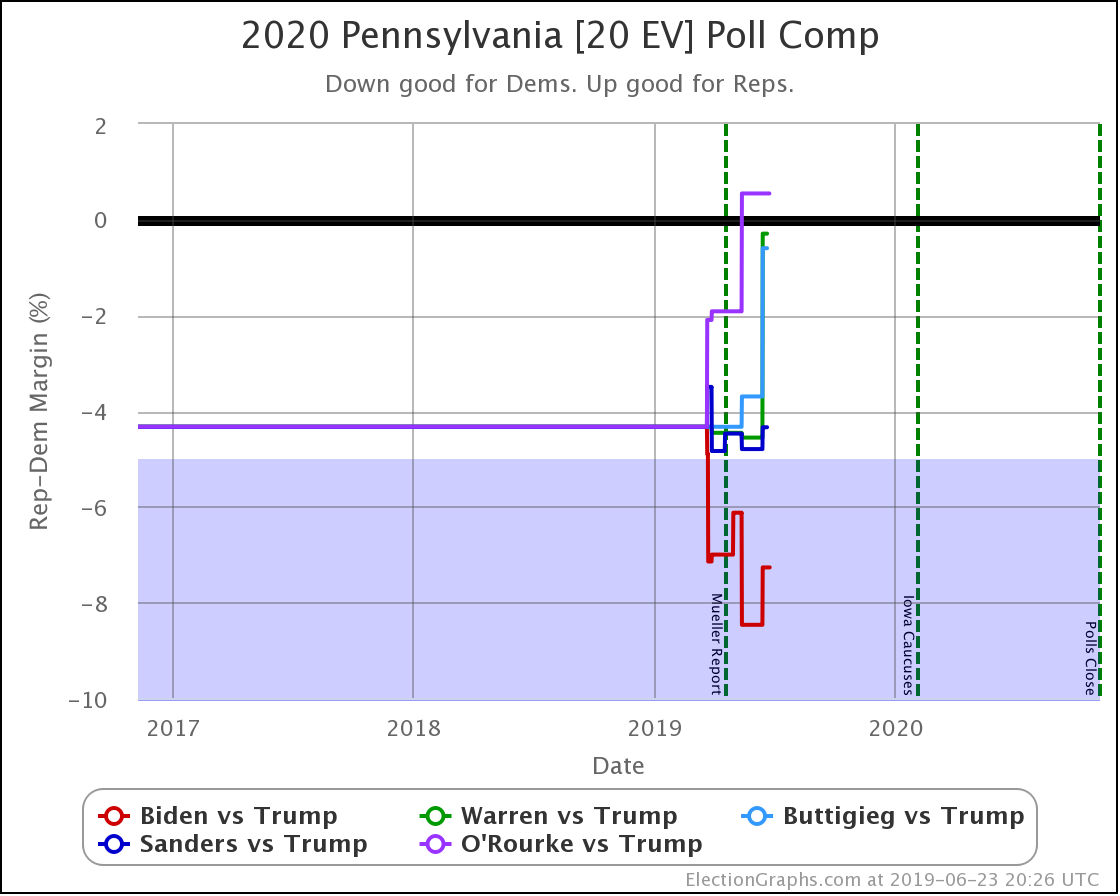
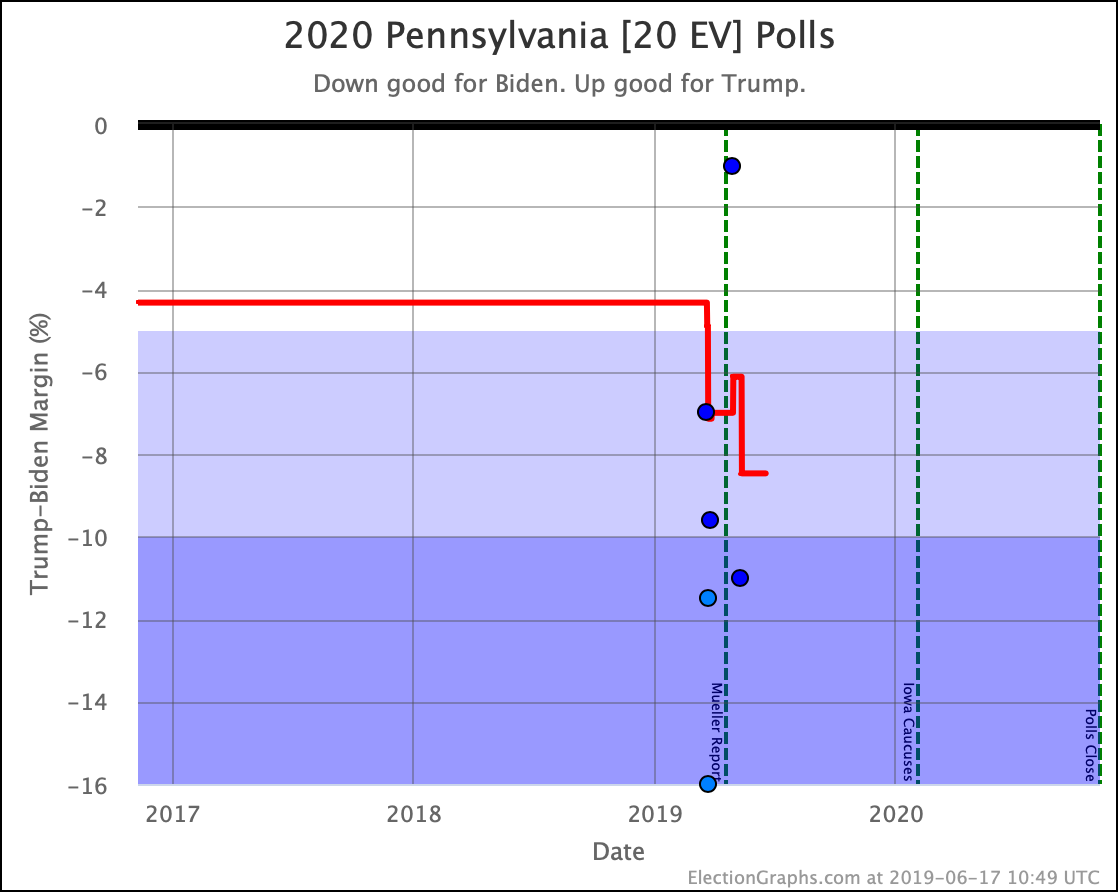
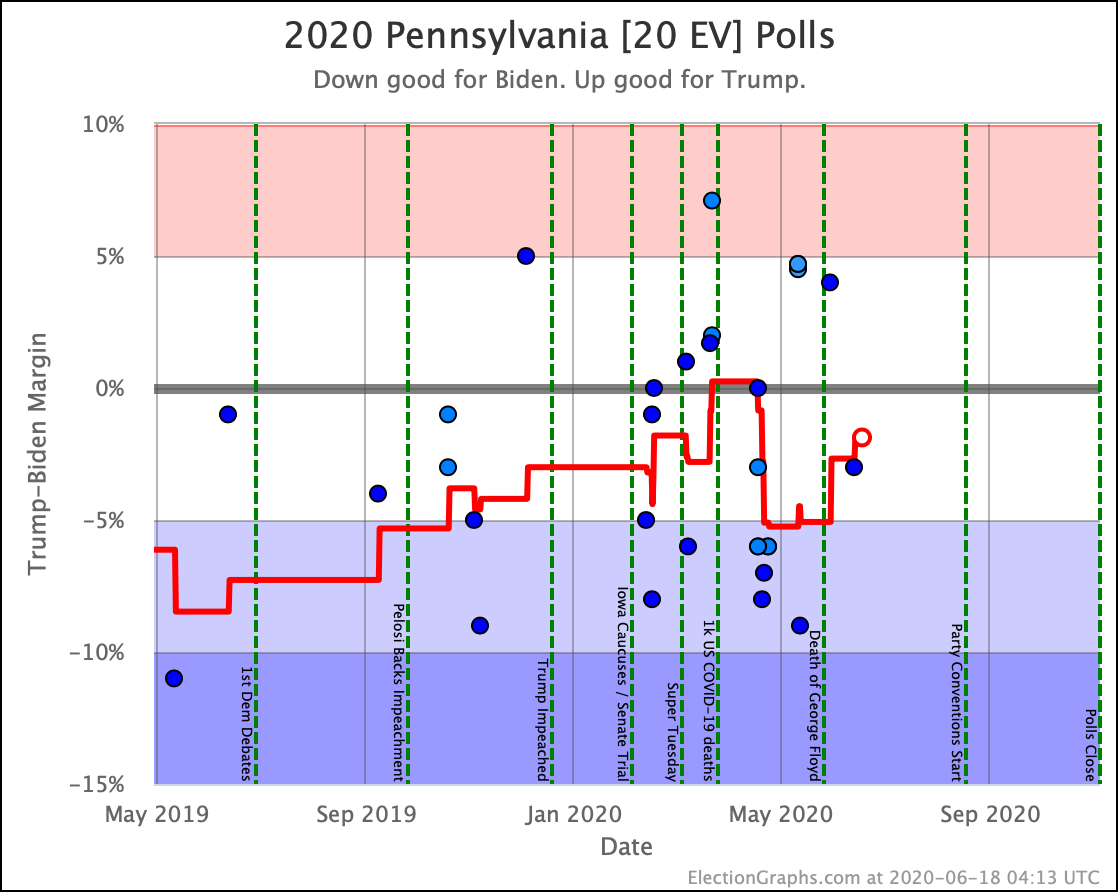
For the categorization view, a state is considered to be "in play" if the margin is less than 5%. This change was driven by Biden's lead in the Pennsylvania poll average dropping below 5%.
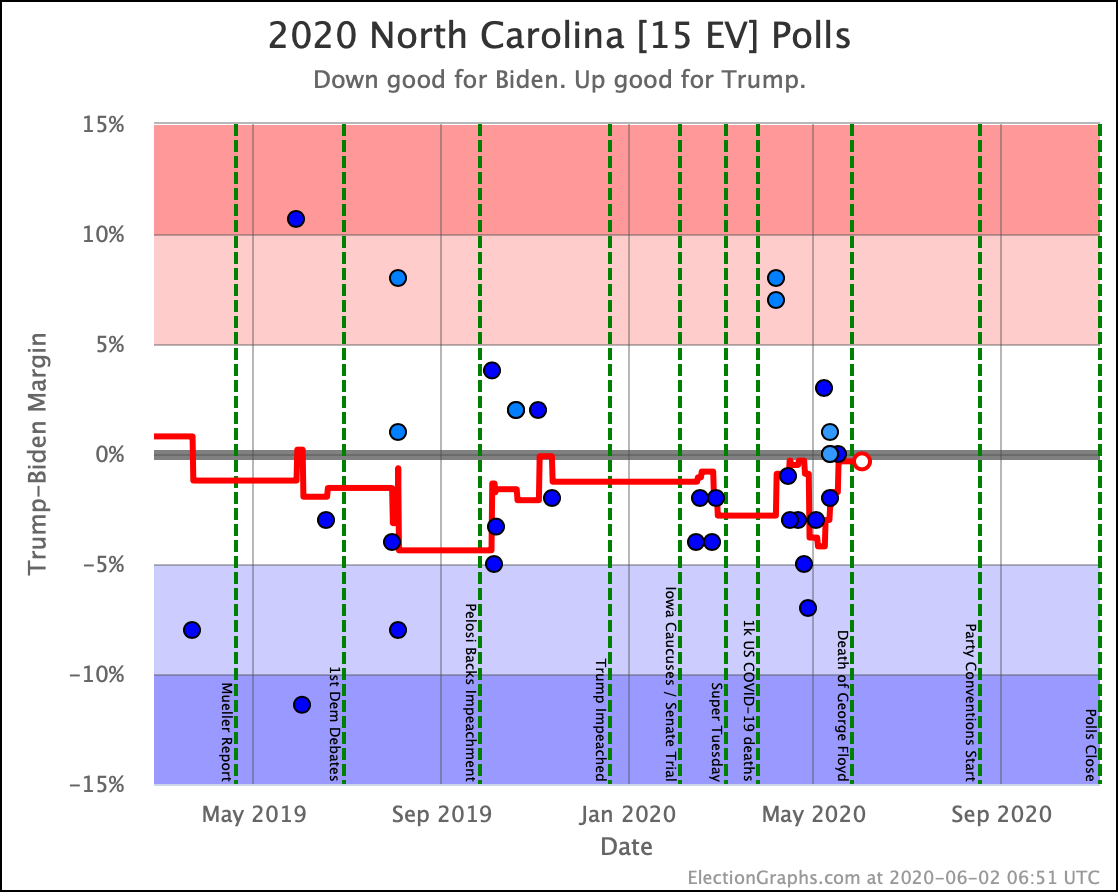
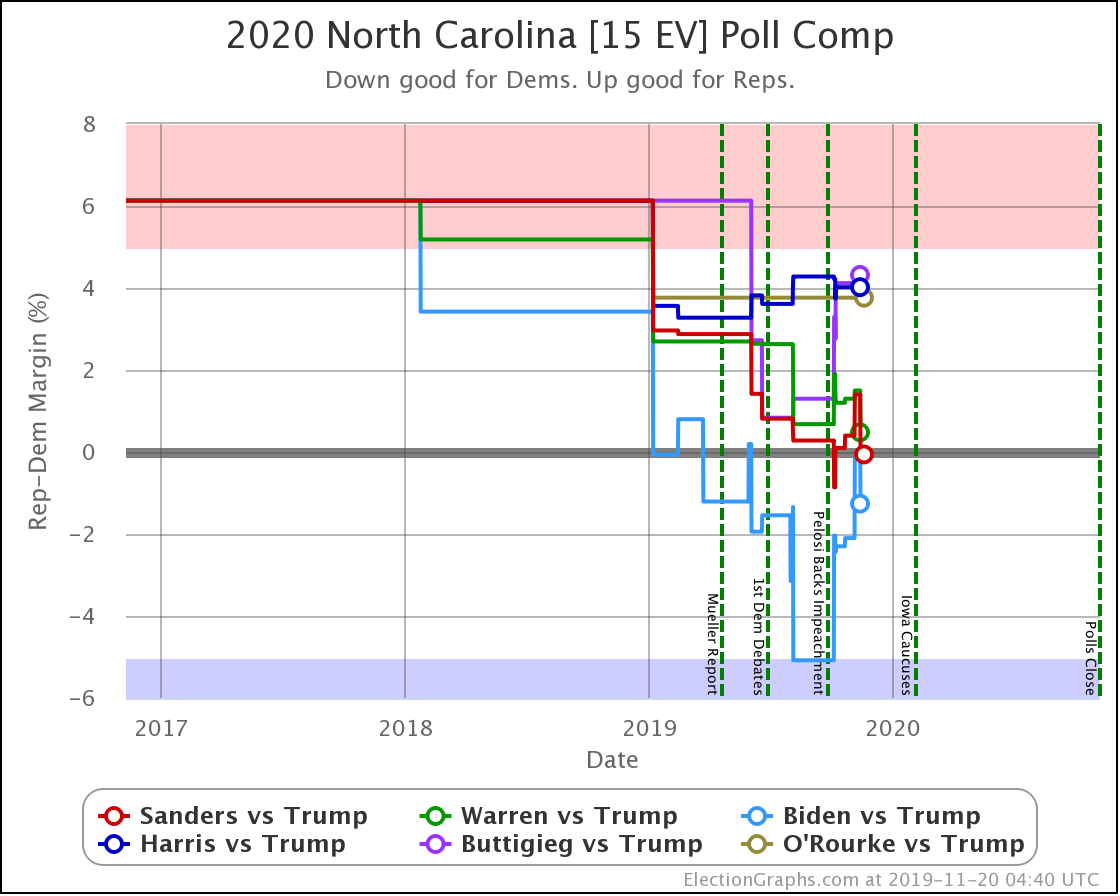
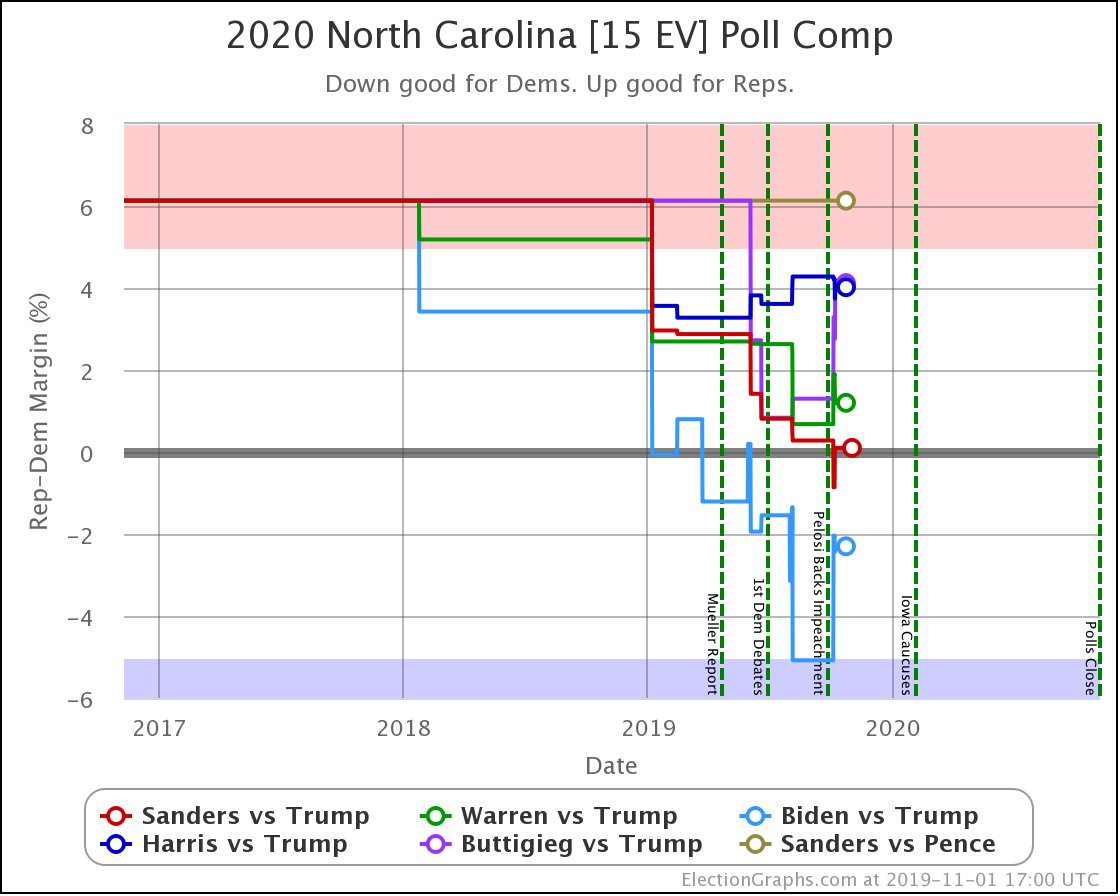
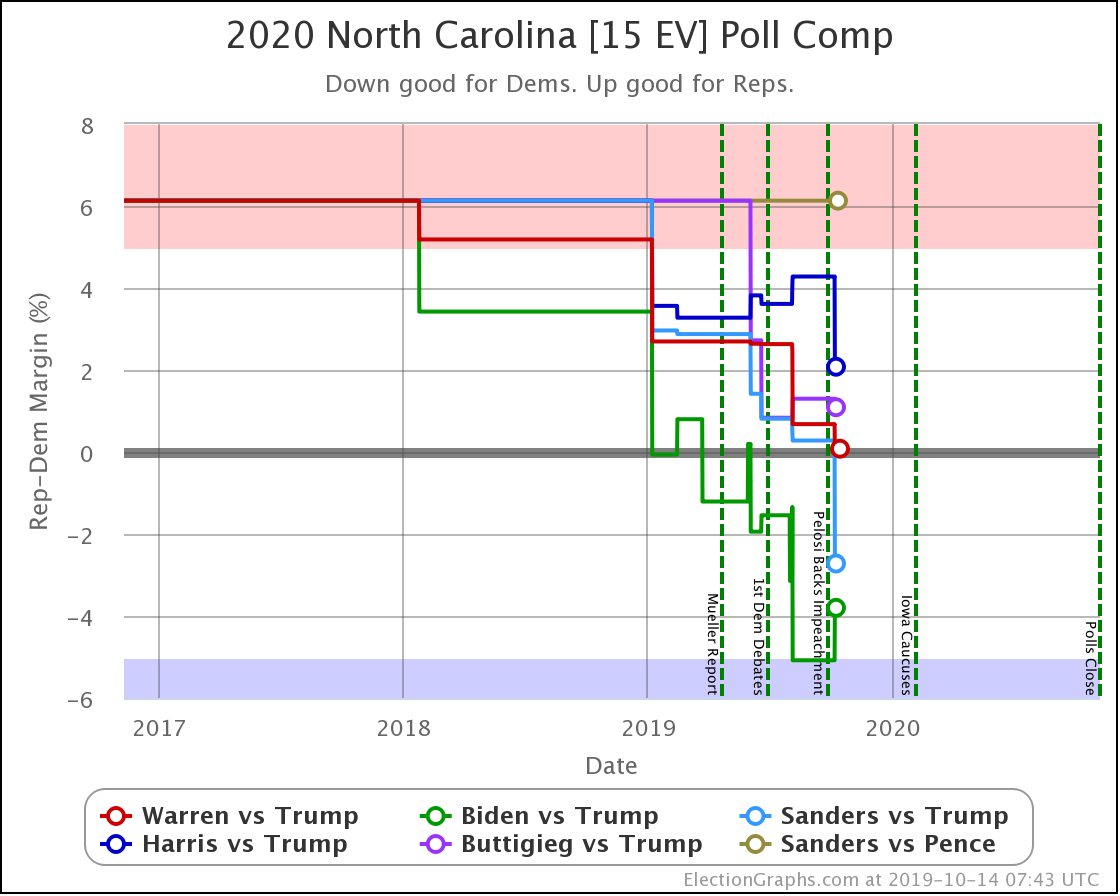
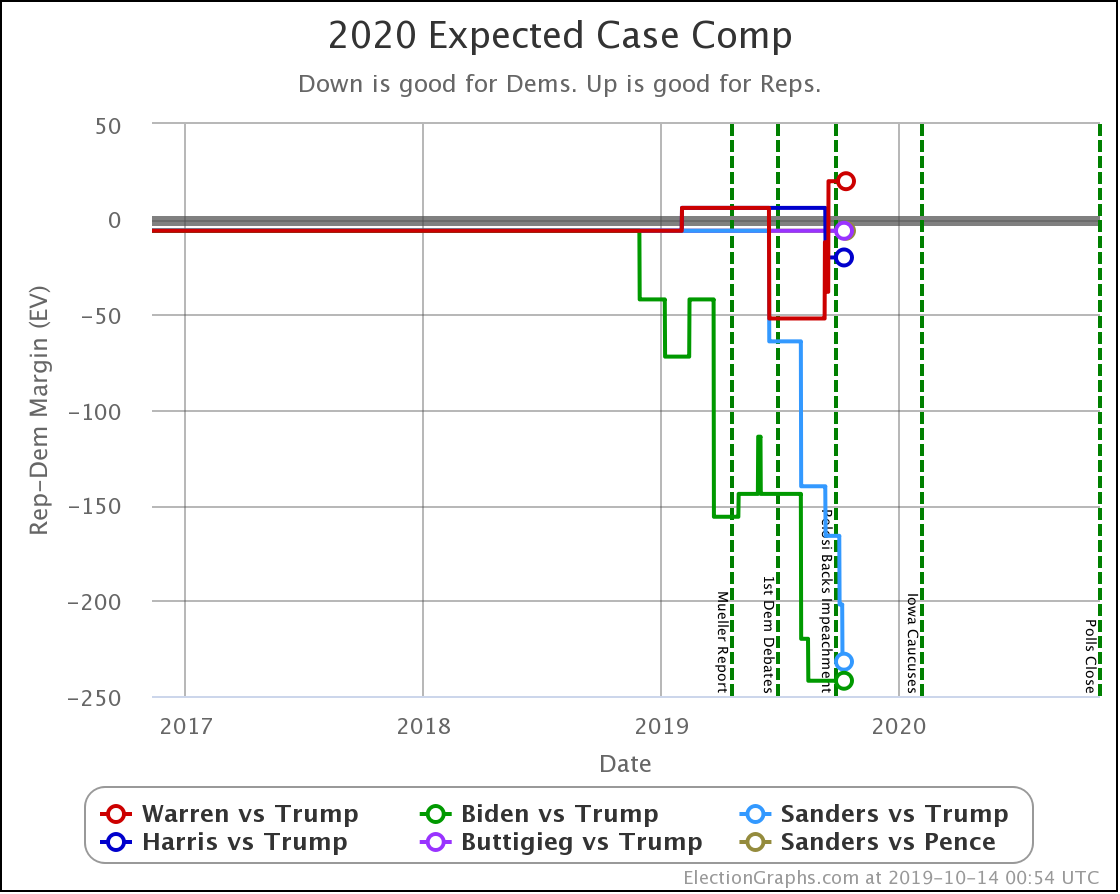
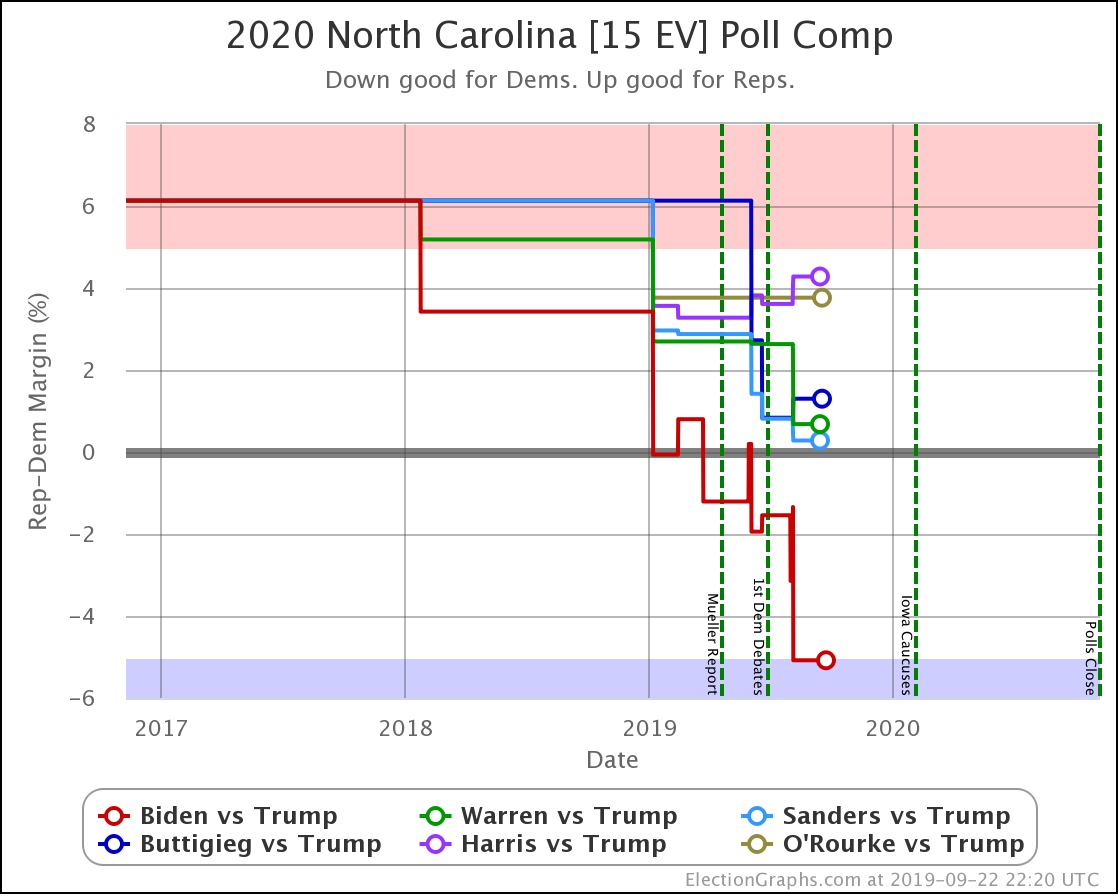
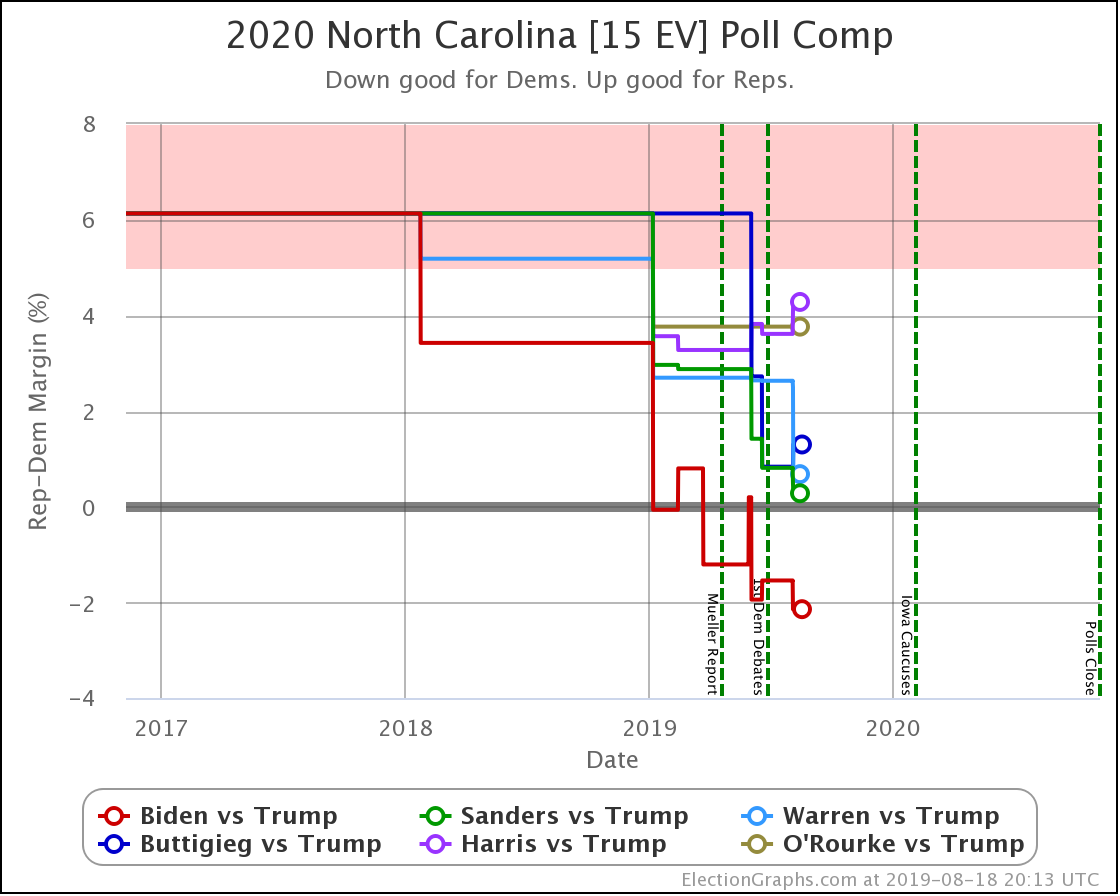
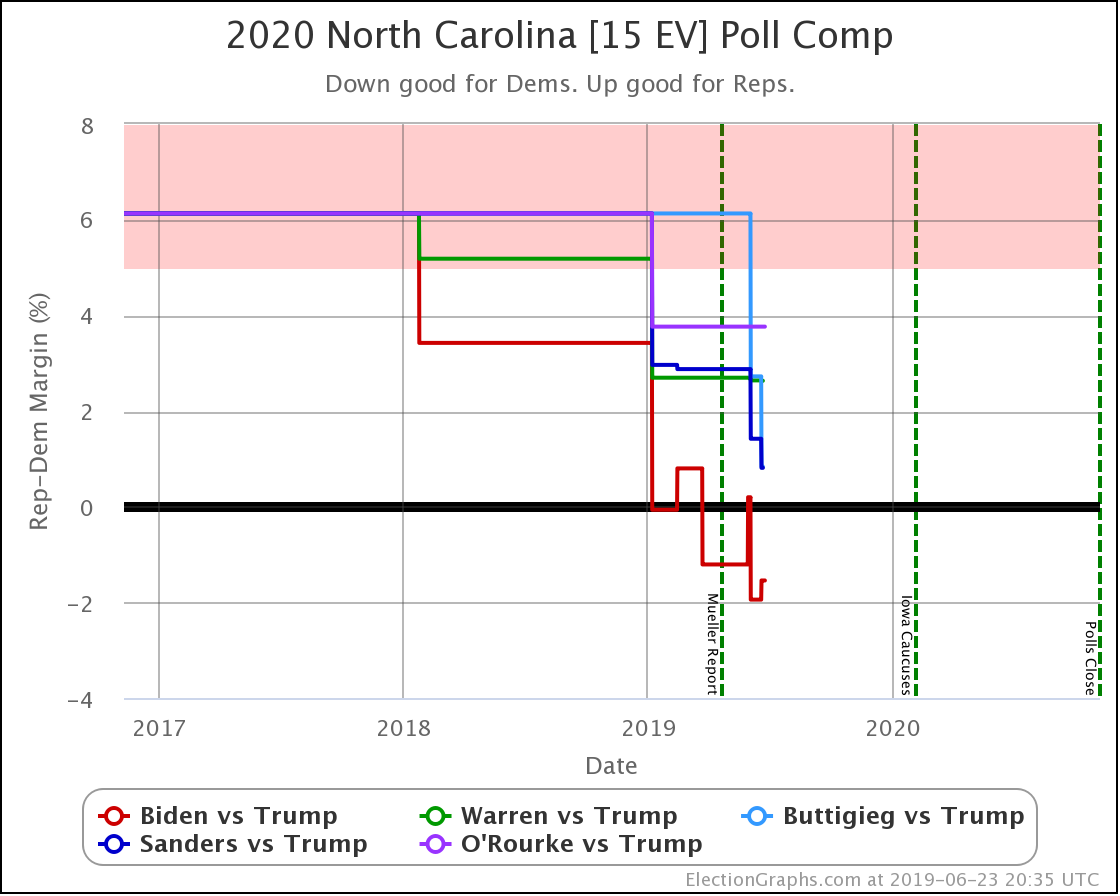
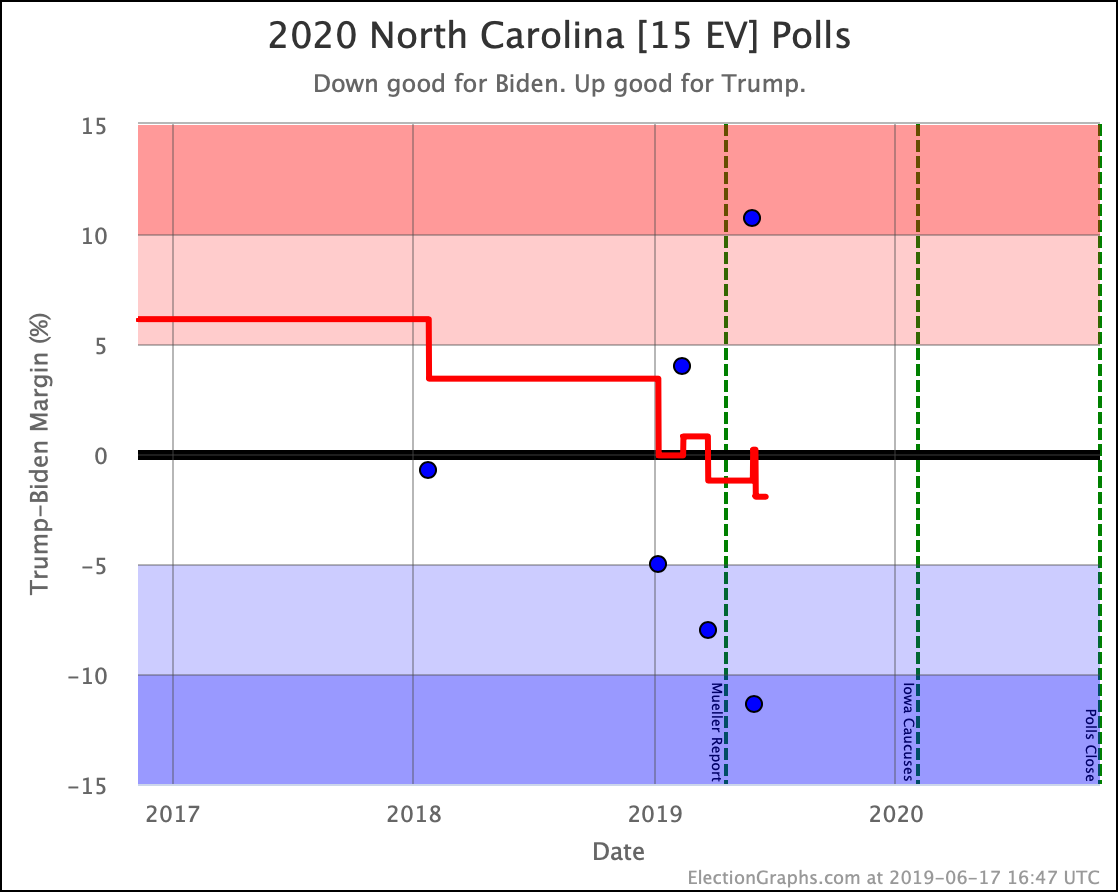
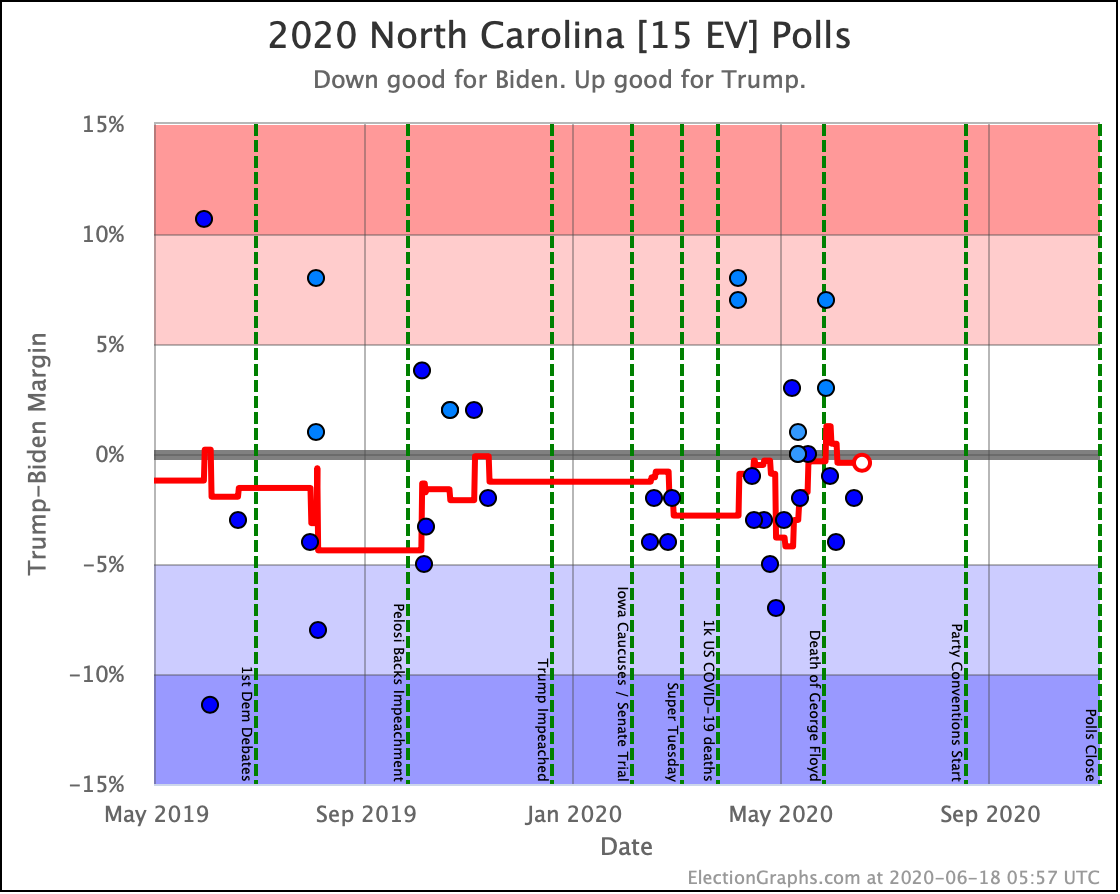
You'll also notice that the "Expected Case" in the categorization view moved 30 EV toward Trump, then reverted to what it was before. This is due to the average in North Carolina moving from just barely Biden, to just barely Trump, and back again within the scope of a few days.
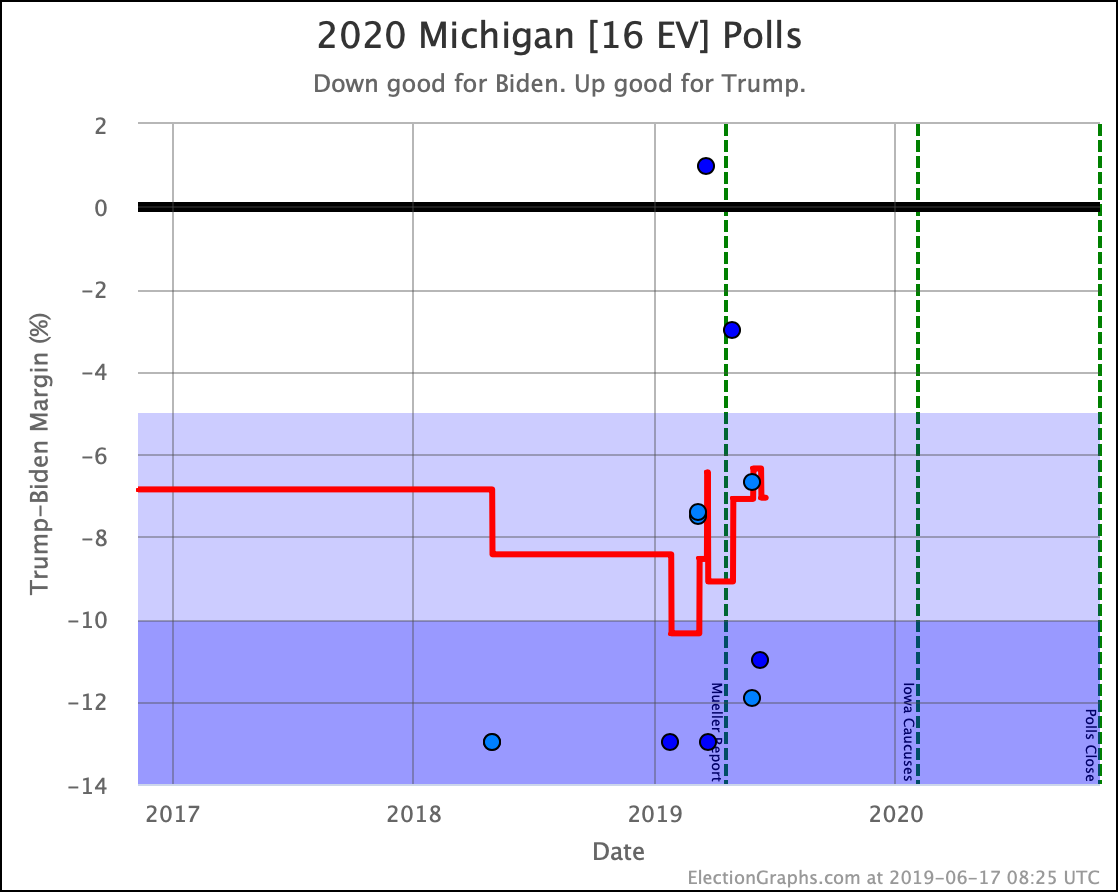
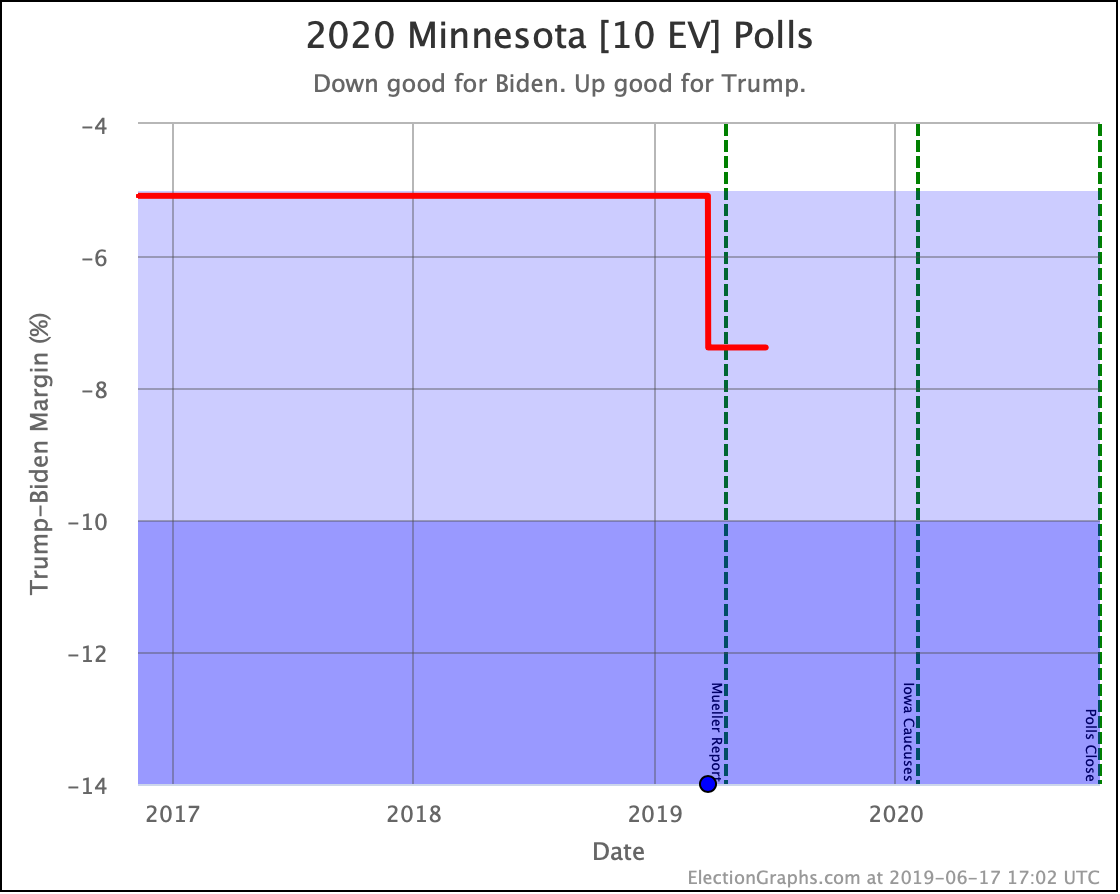
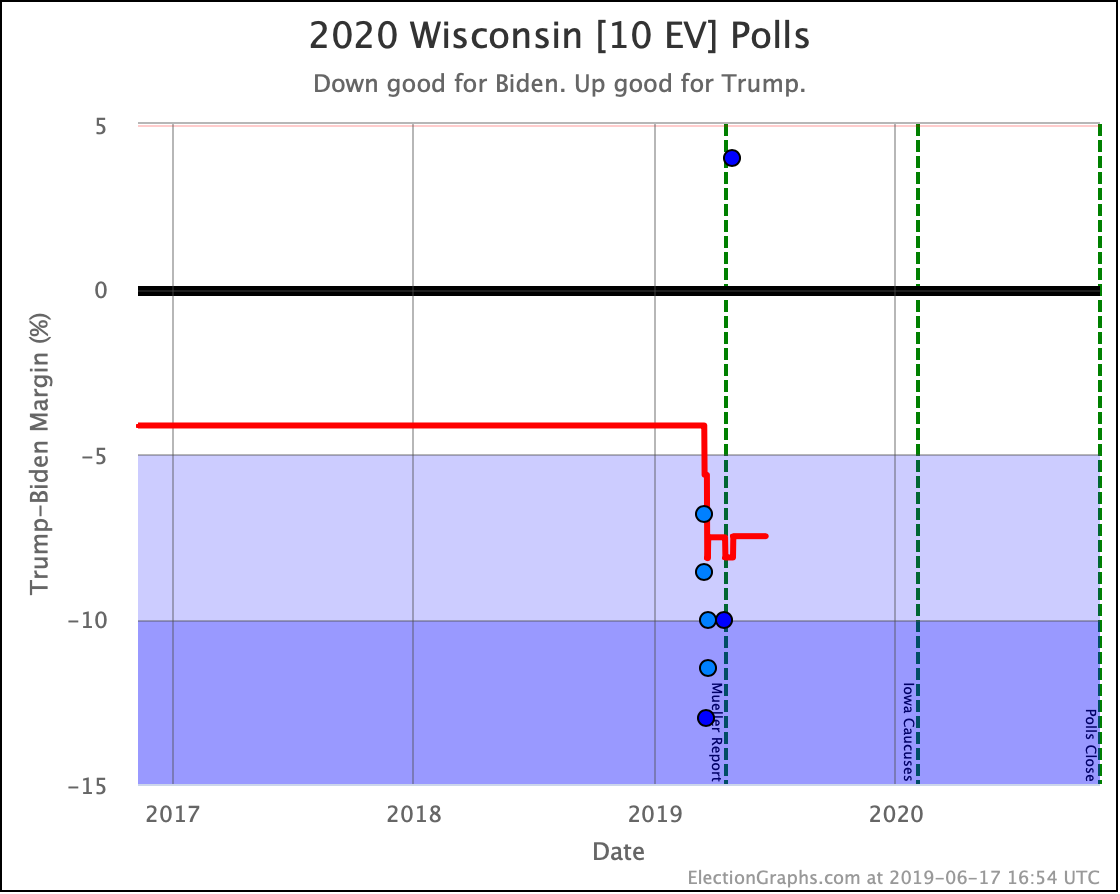
Those are the states that actually shifted categories since the last update. But let's look at the other close states that have new polling this time around too:
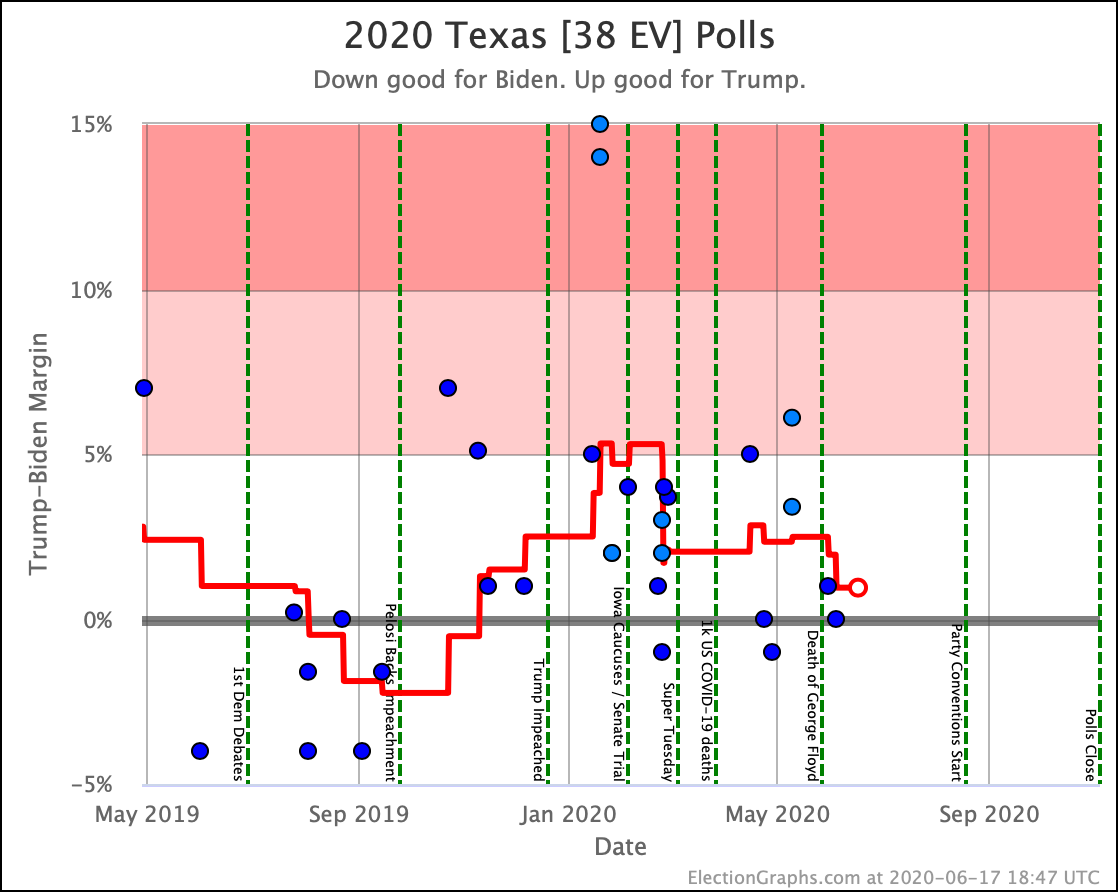
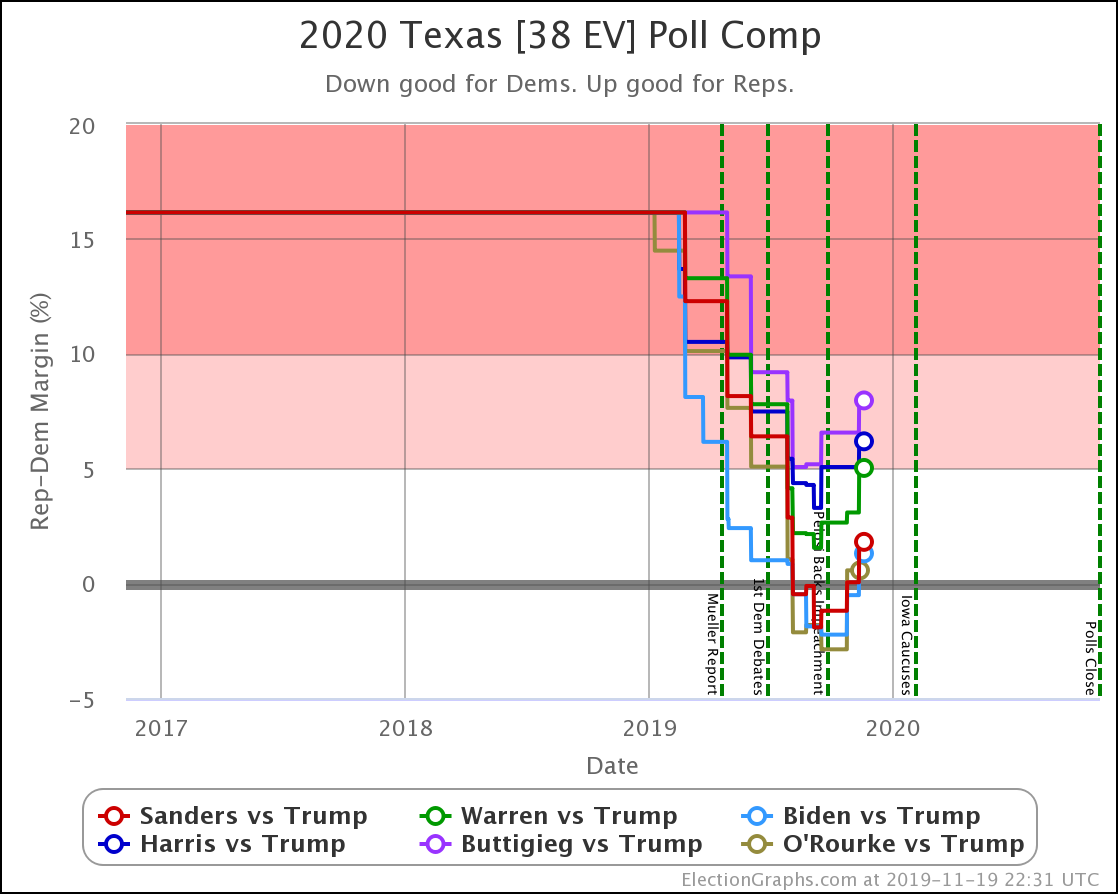
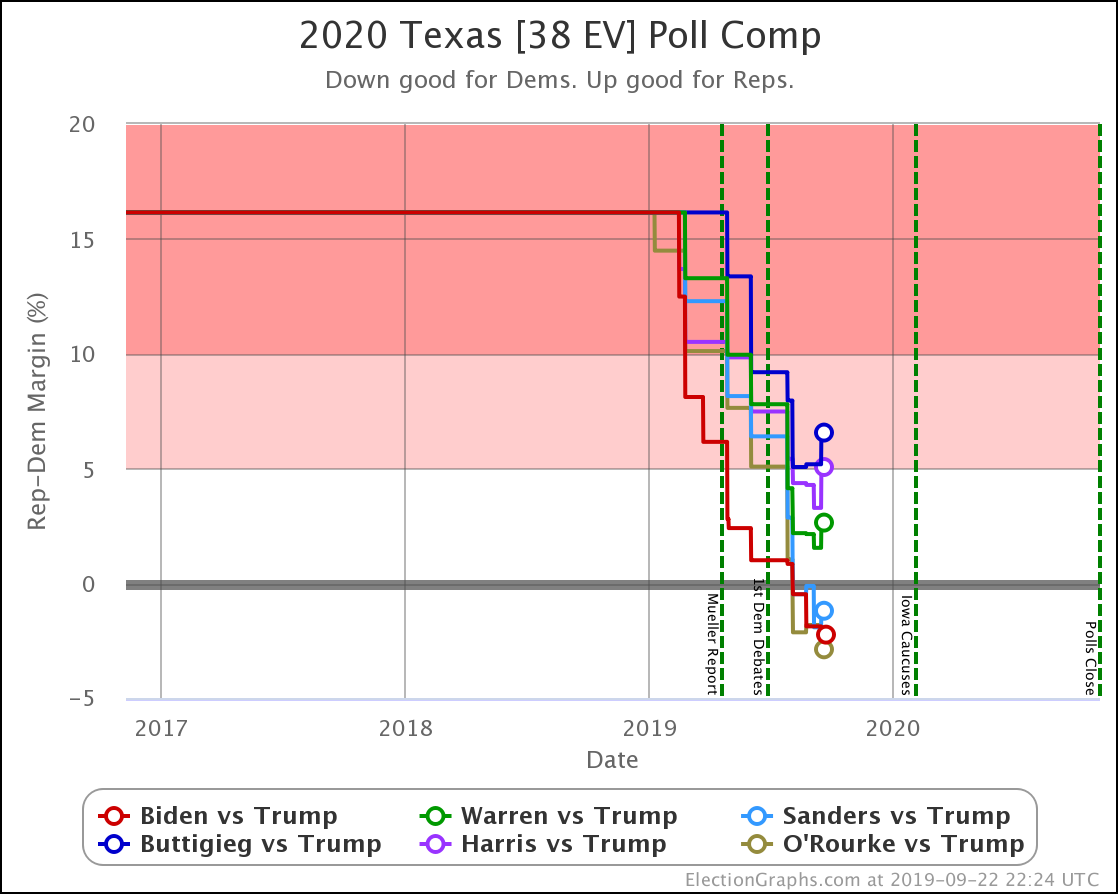
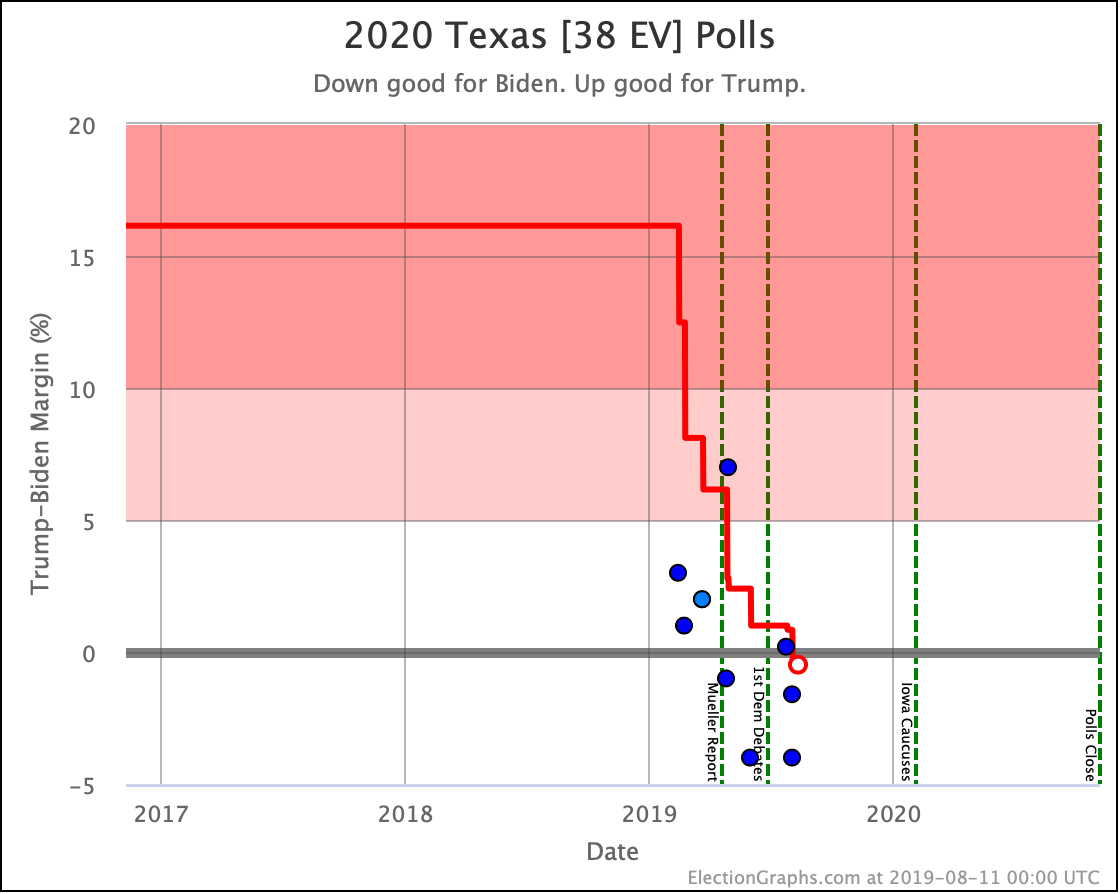
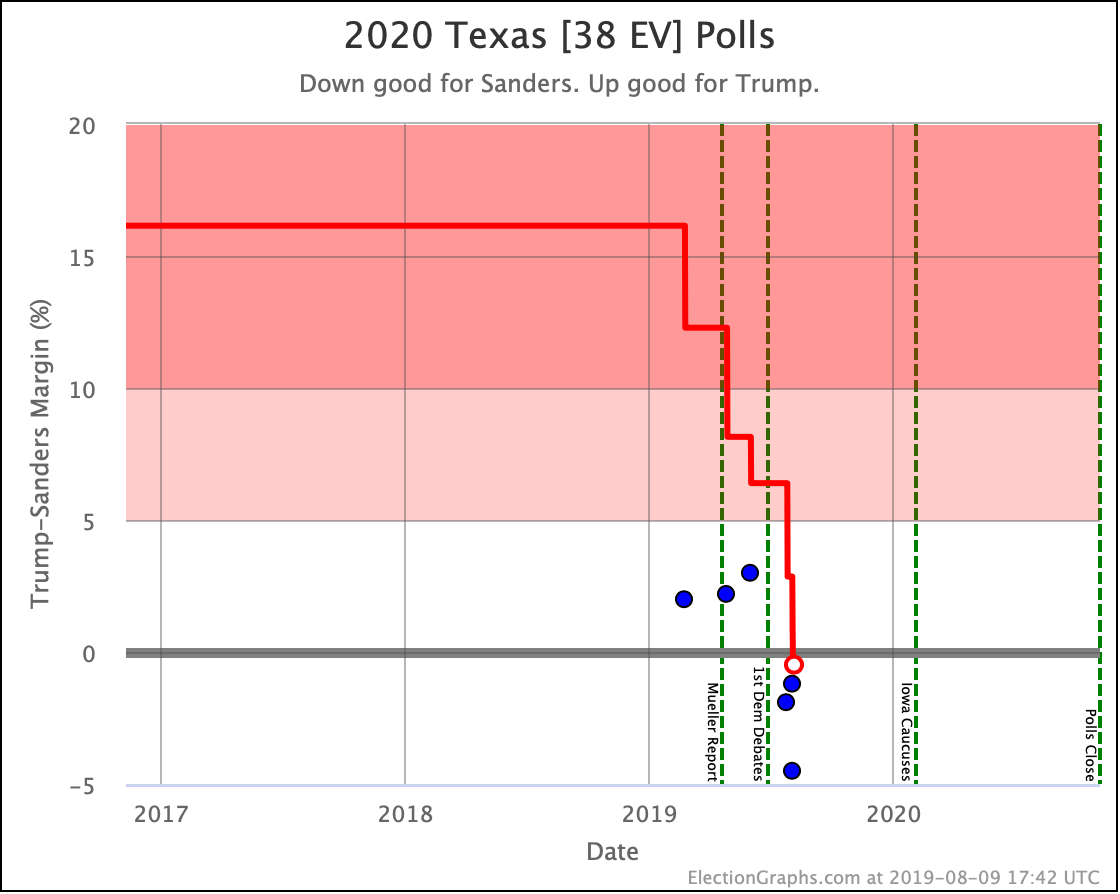
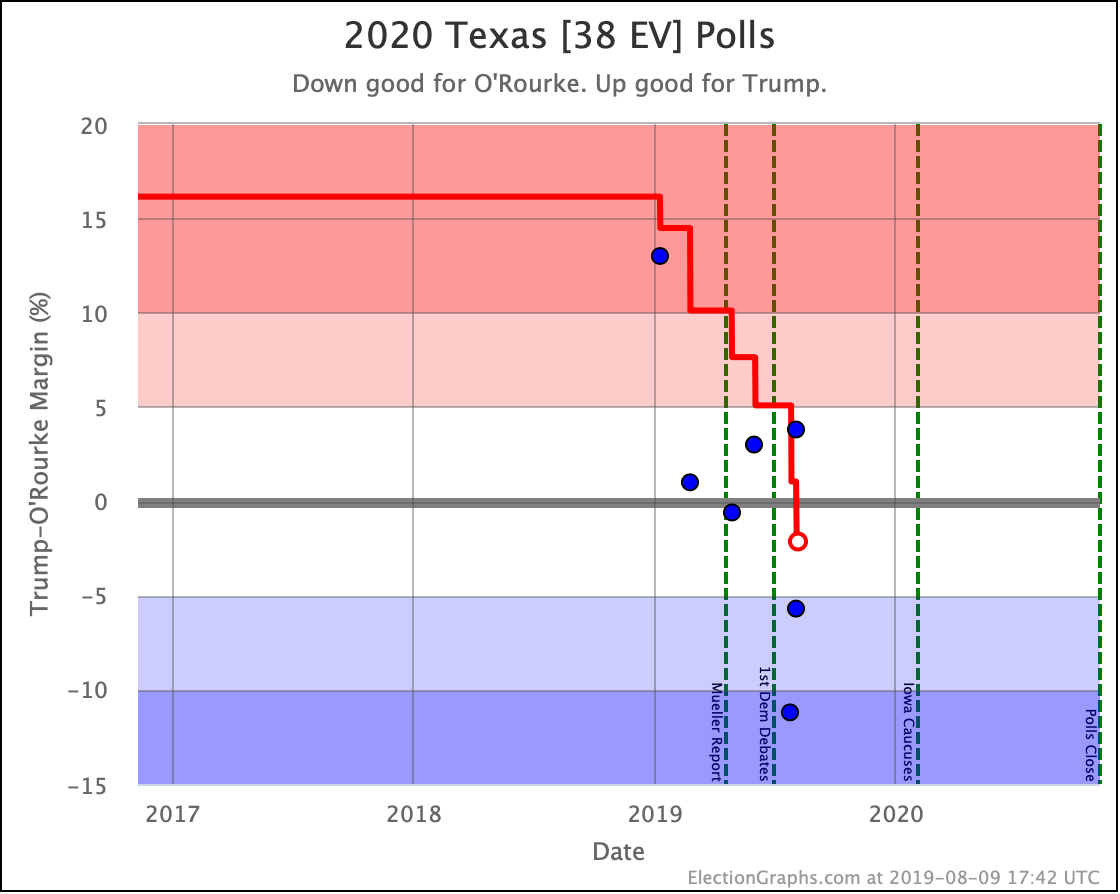
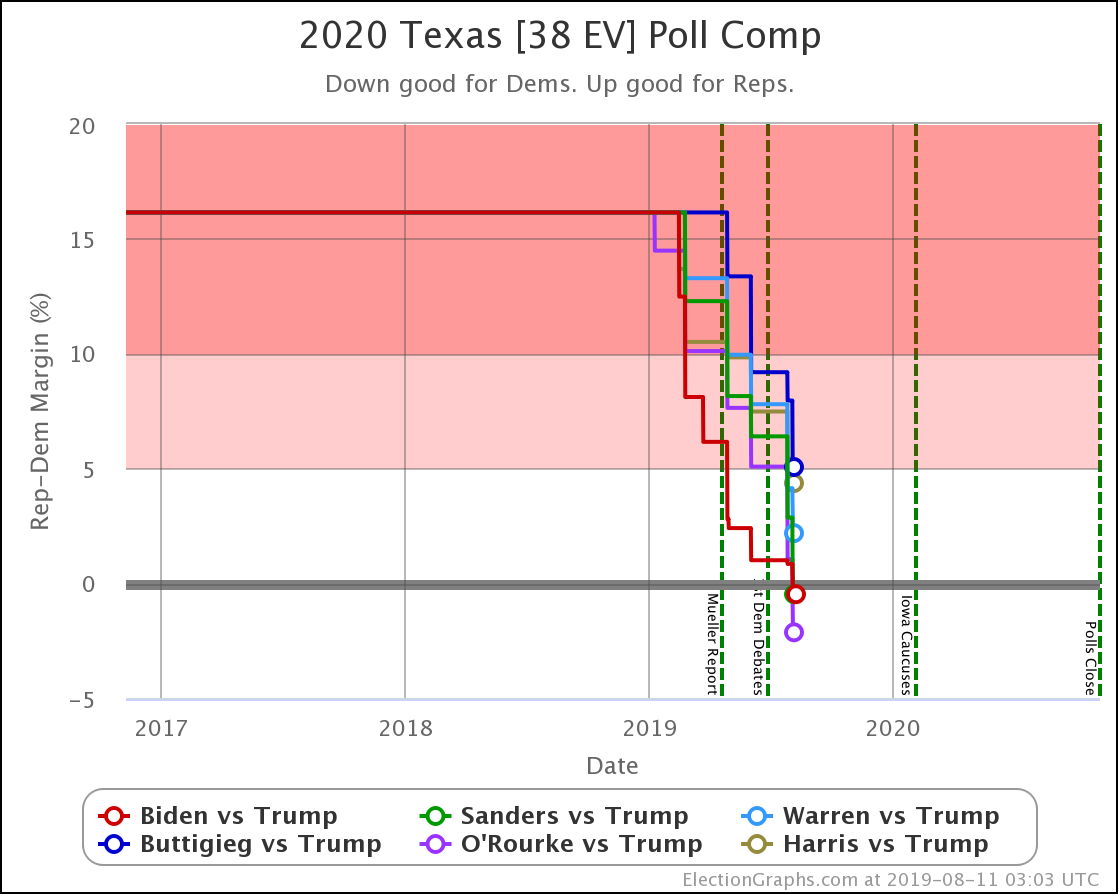
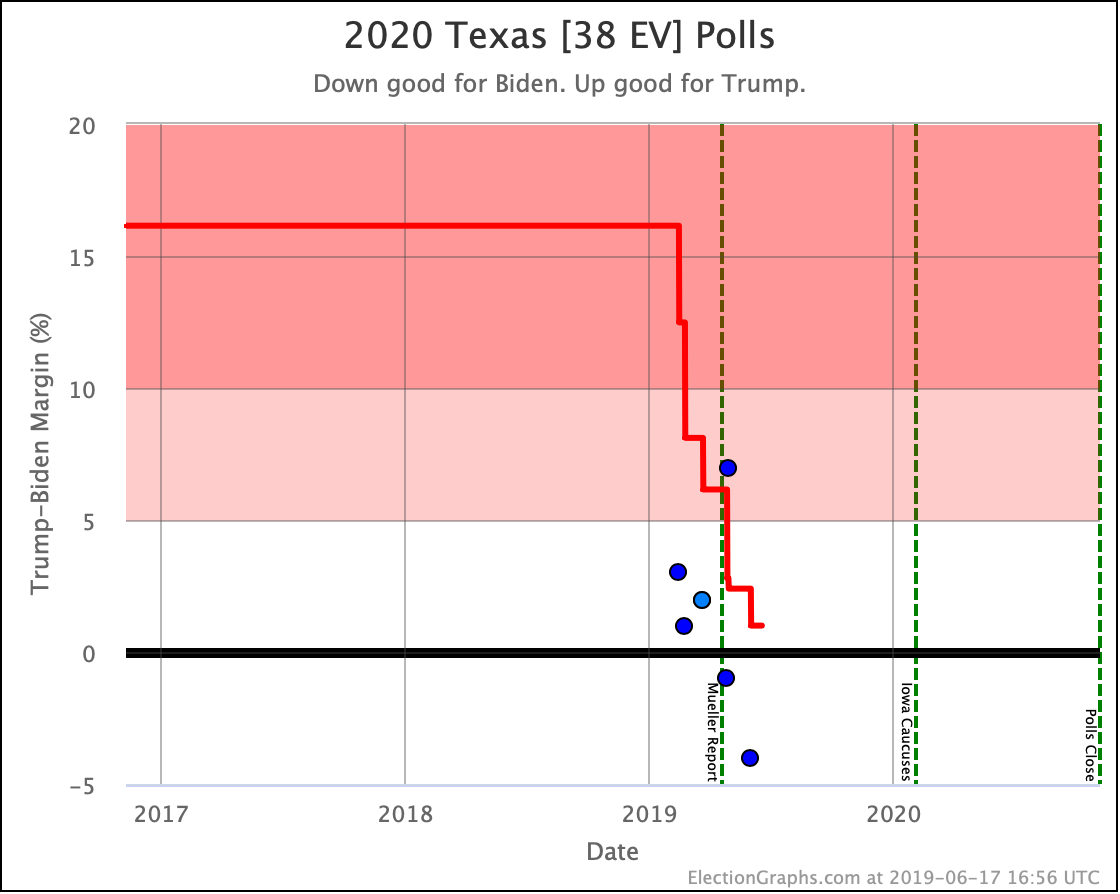
Trump is still leading Texas, but it has been moving toward Biden recently. A blue Texas would change the game completely. Biden isn't quite there. But it is close enough it should make the Trump camp nervous.
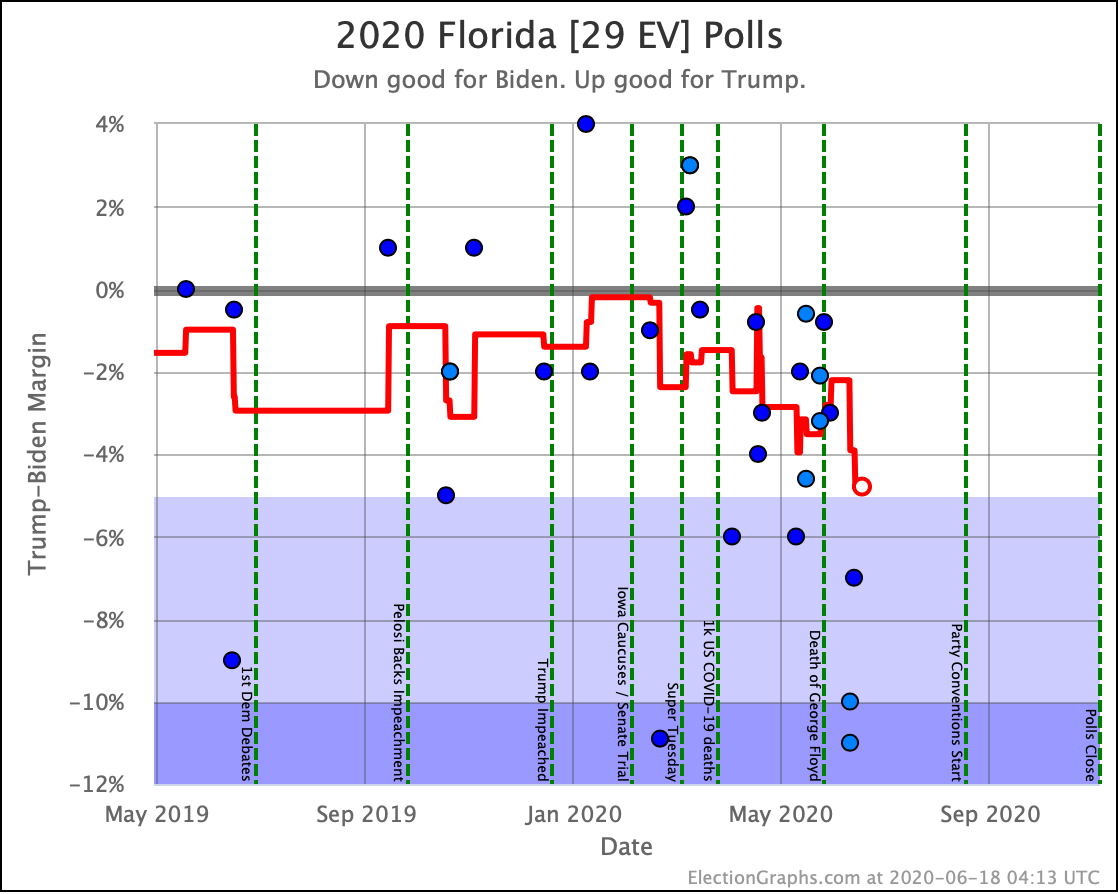
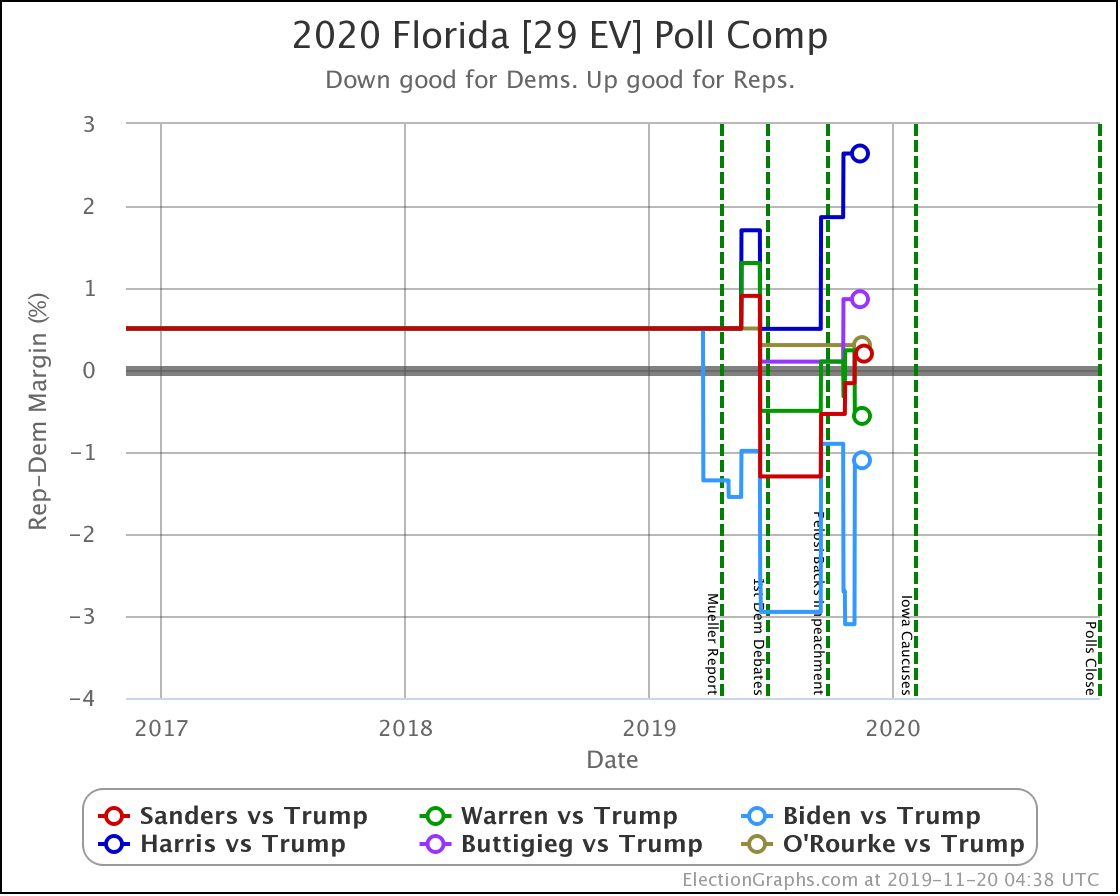
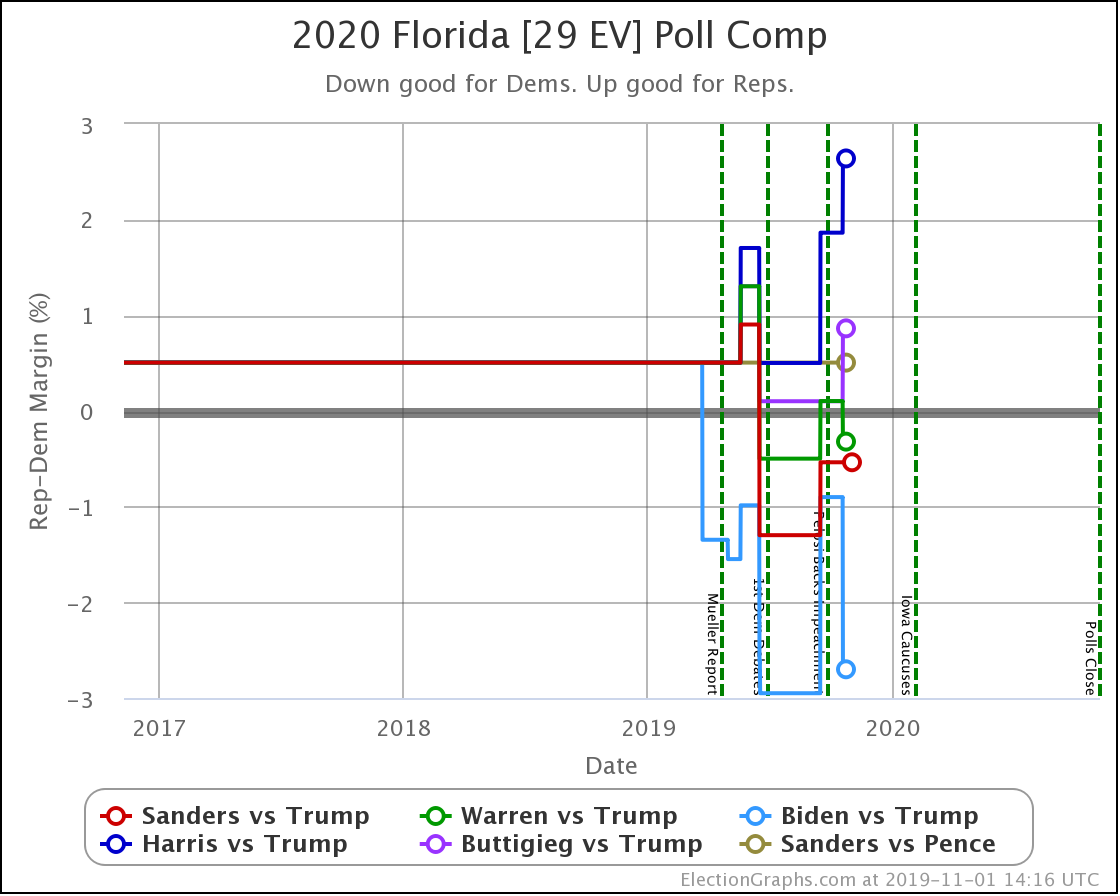
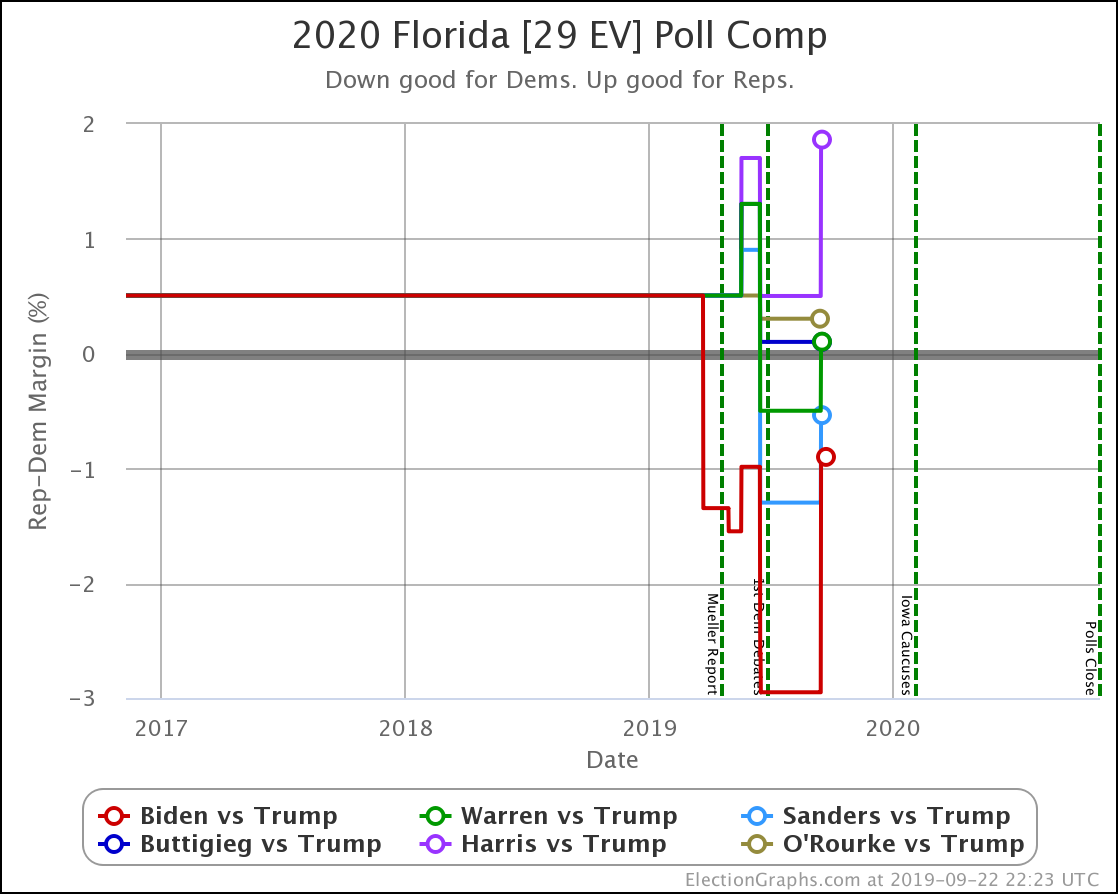
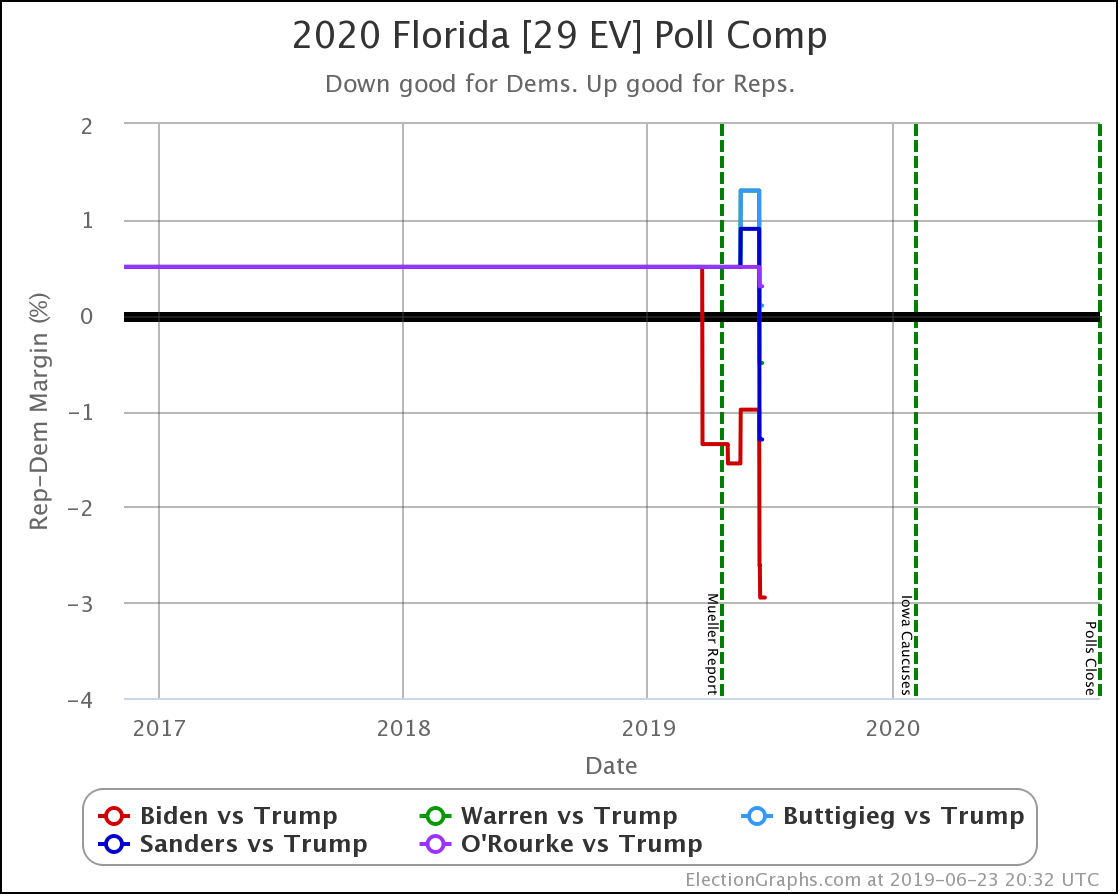
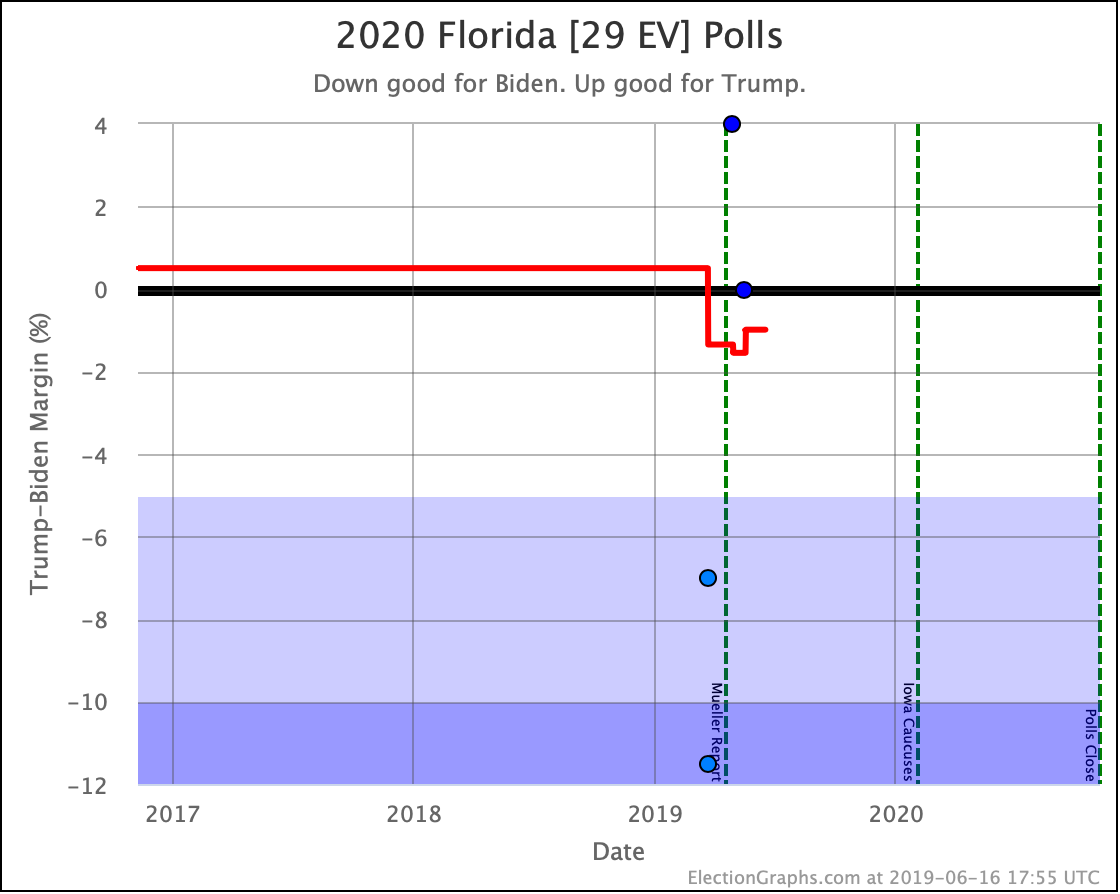
Biden has had a small lead in the Florida average all along, but it has been trending further in his direction lately. Another really strong poll and Florida might even move over the 5% threshold so we wouldn't even classify it as a close state. (Although it is just as likely that the TIPP poll showing Biden with a greater than 10% lead is an outlier and the average will soon revert to a small Biden lead.)
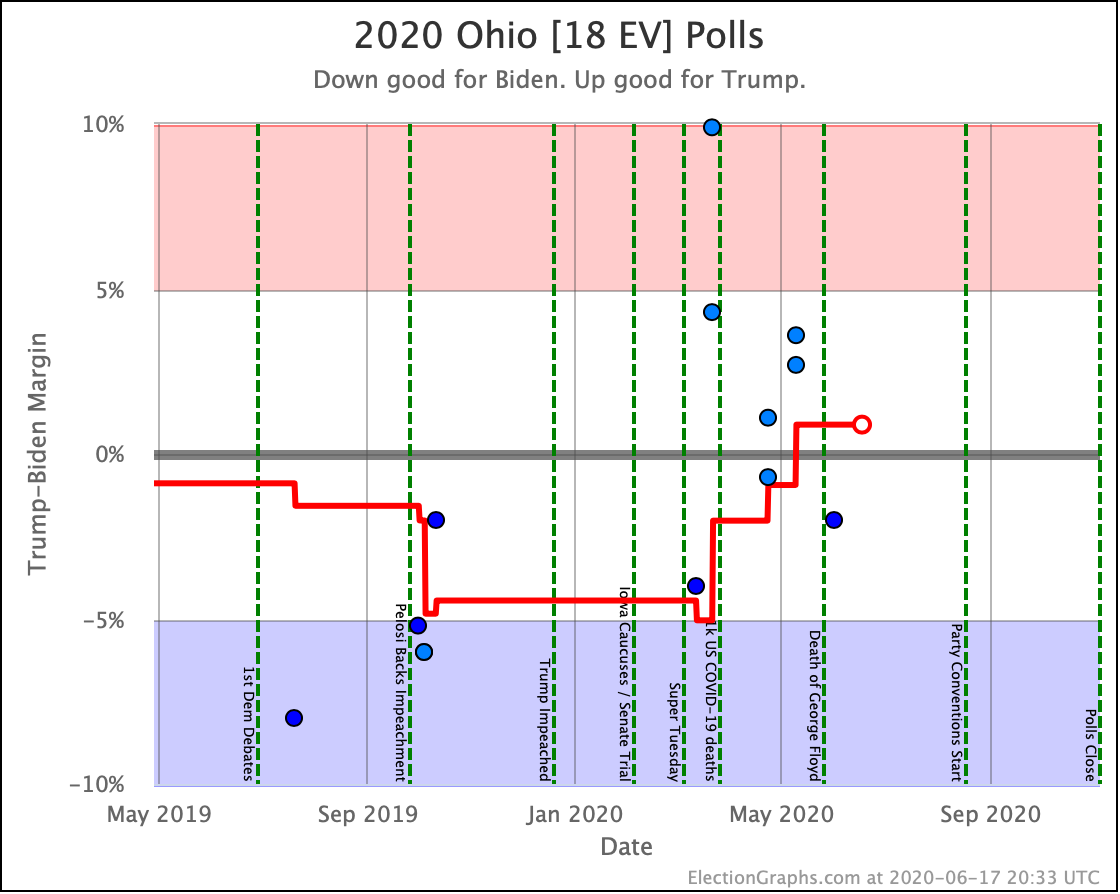
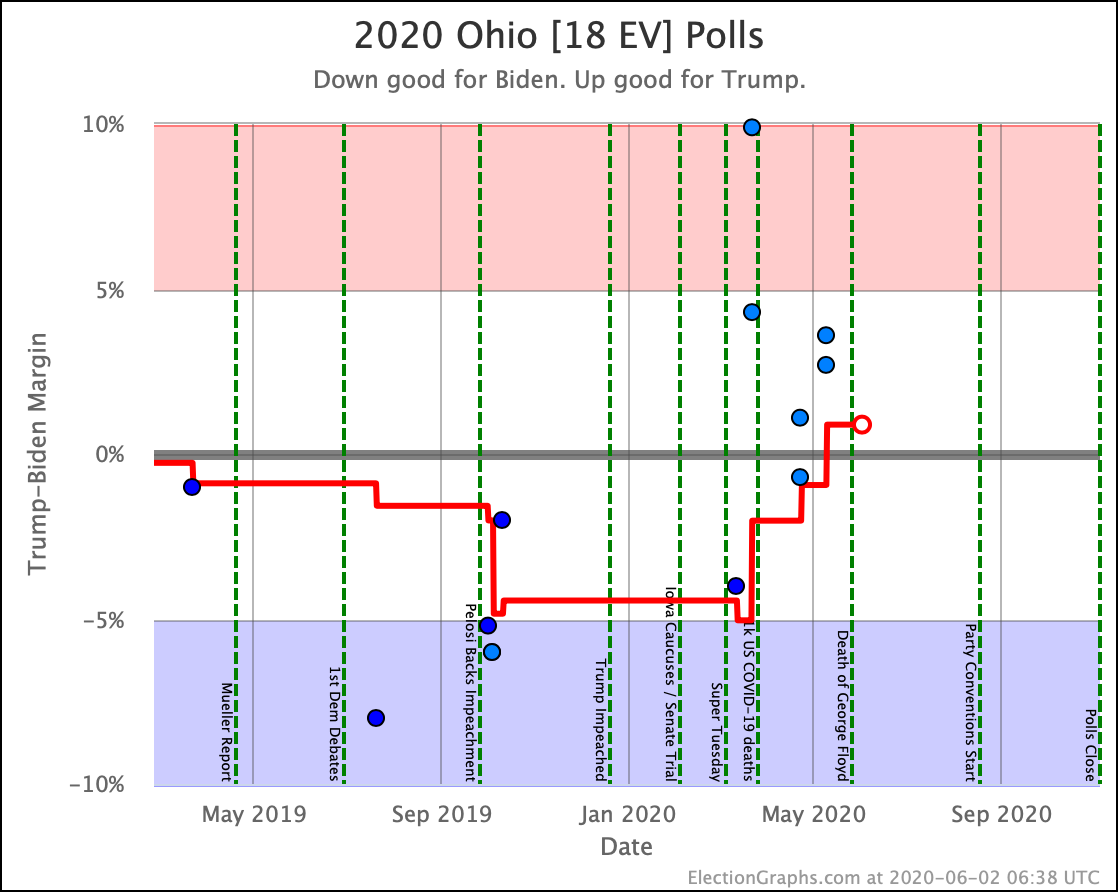
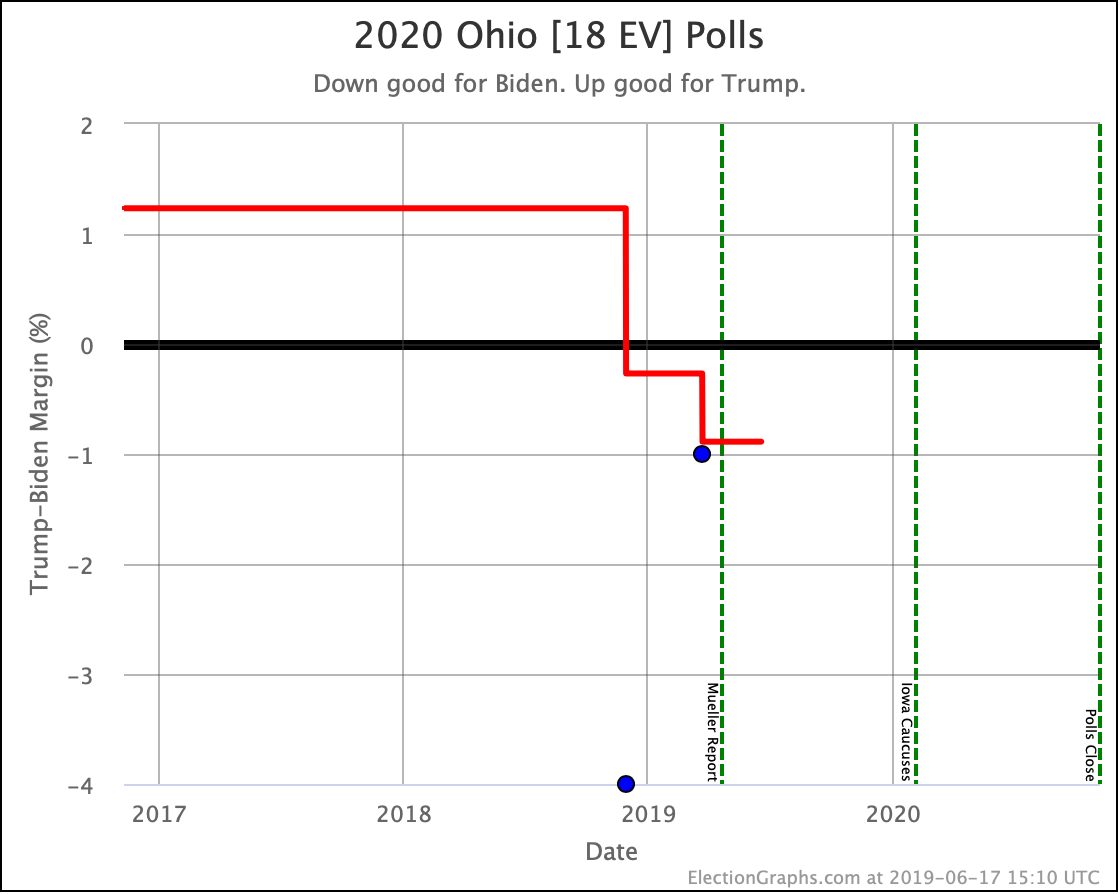
Ohio is surprisingly sparsely polled, but the average flipped from Biden to Trump in May and the one new poll in the last month didn't move the average at all.
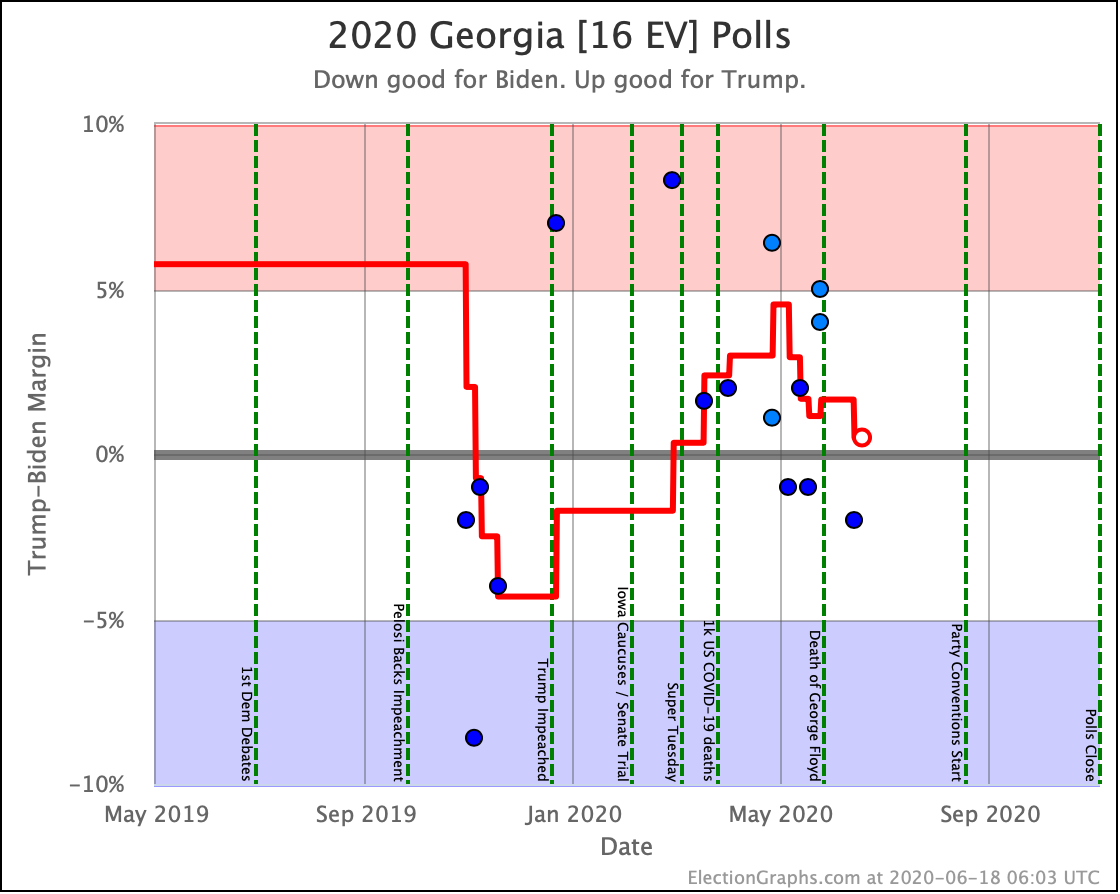
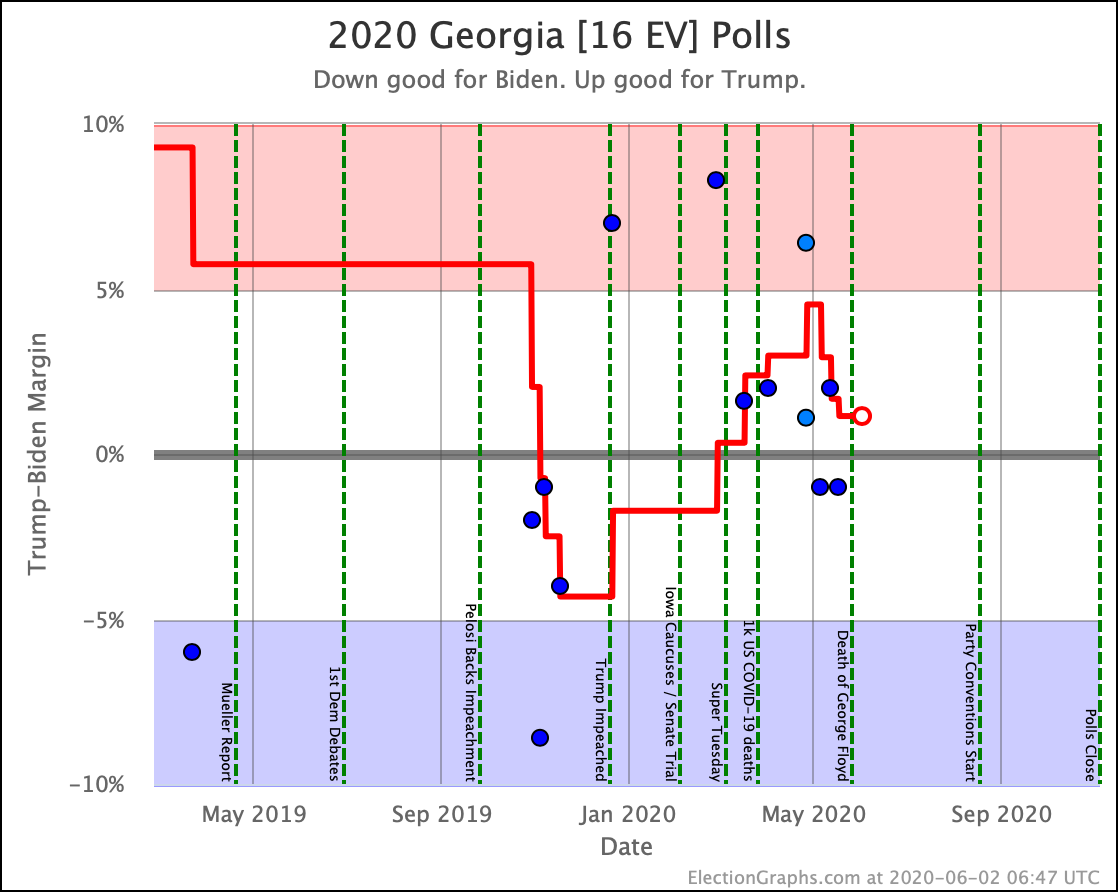
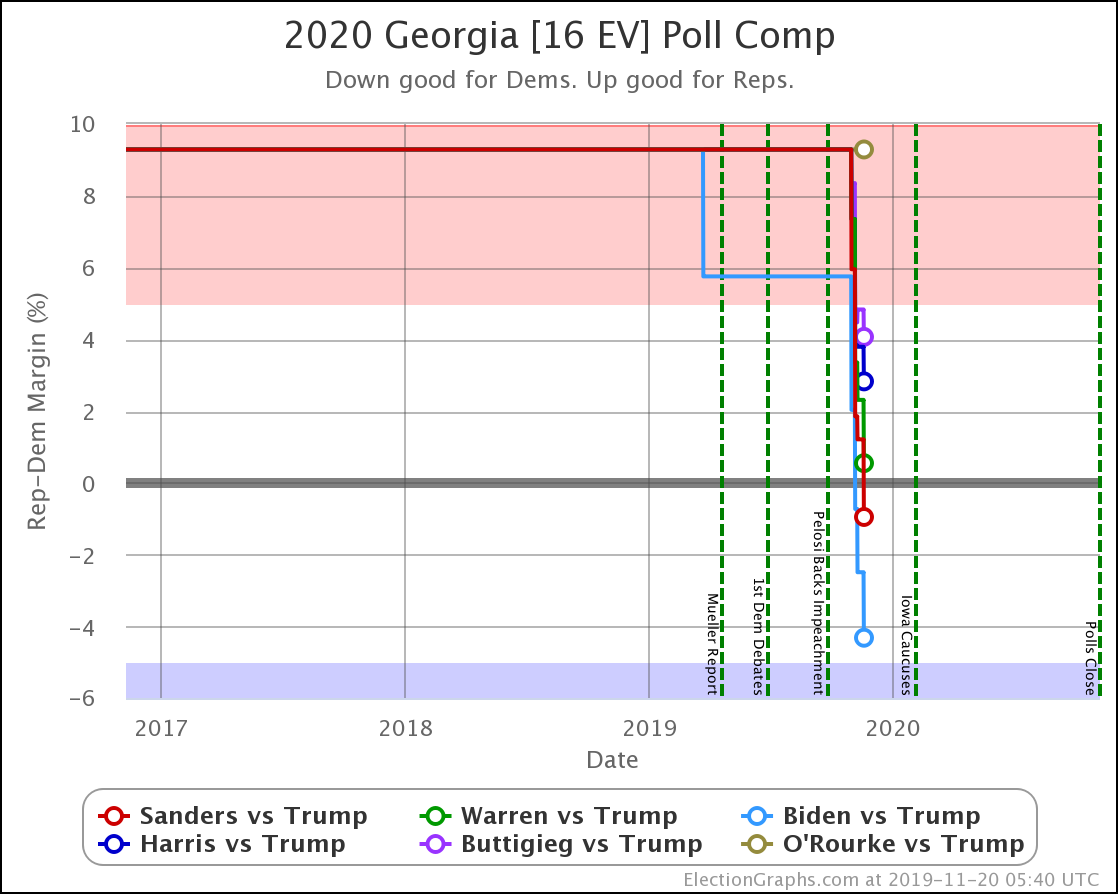
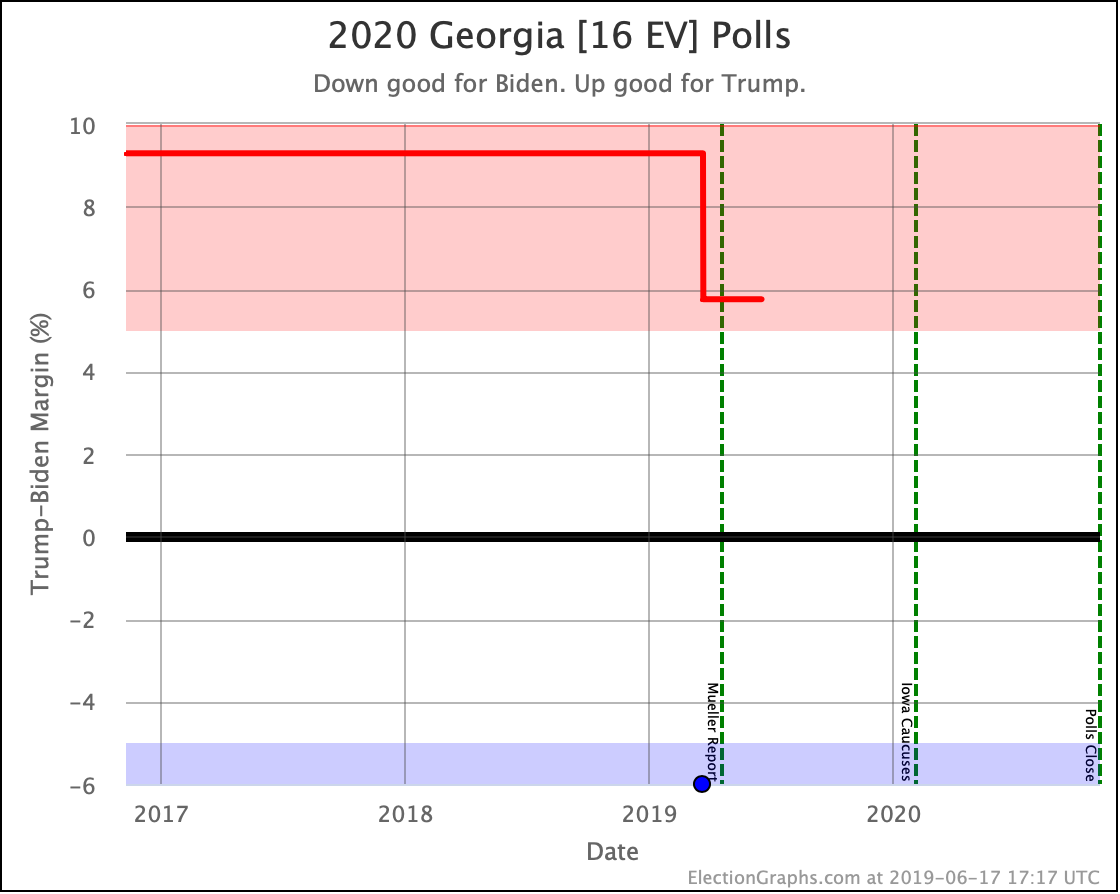
Georgia is barely on the Trump side of the line, and trending toward Biden.
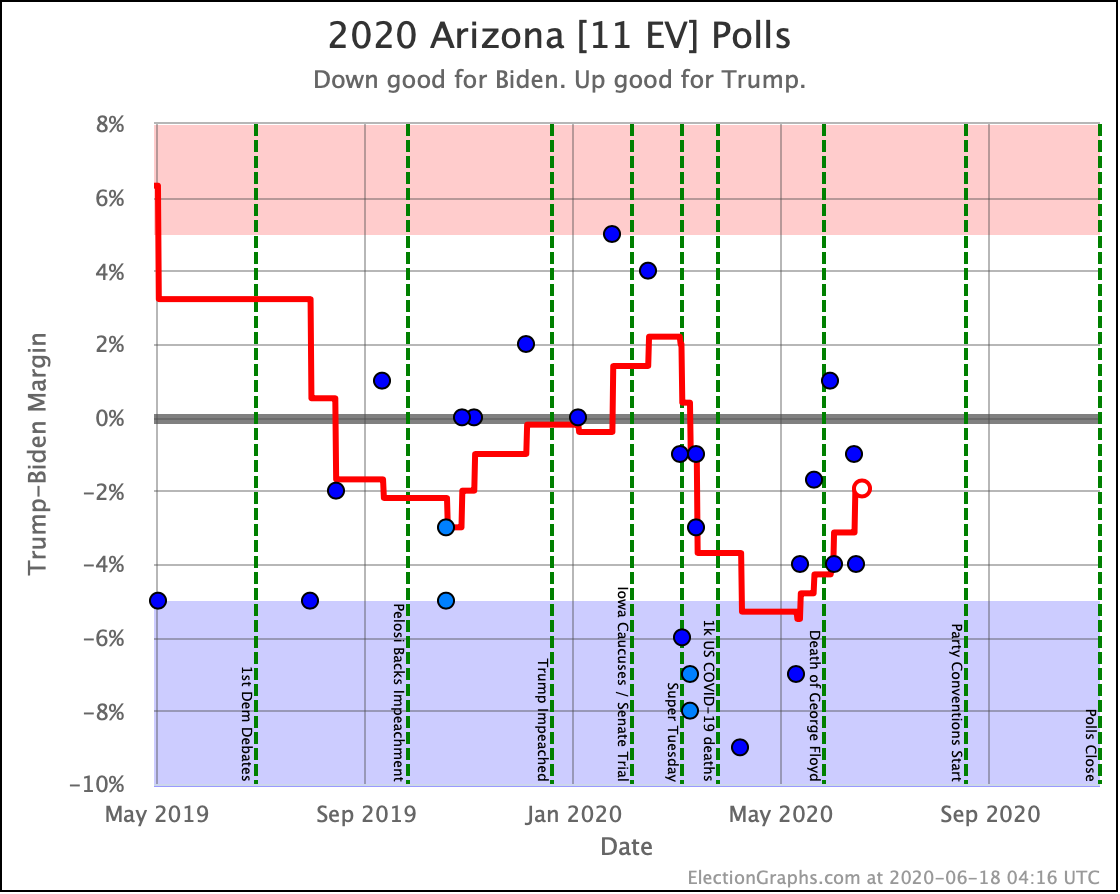
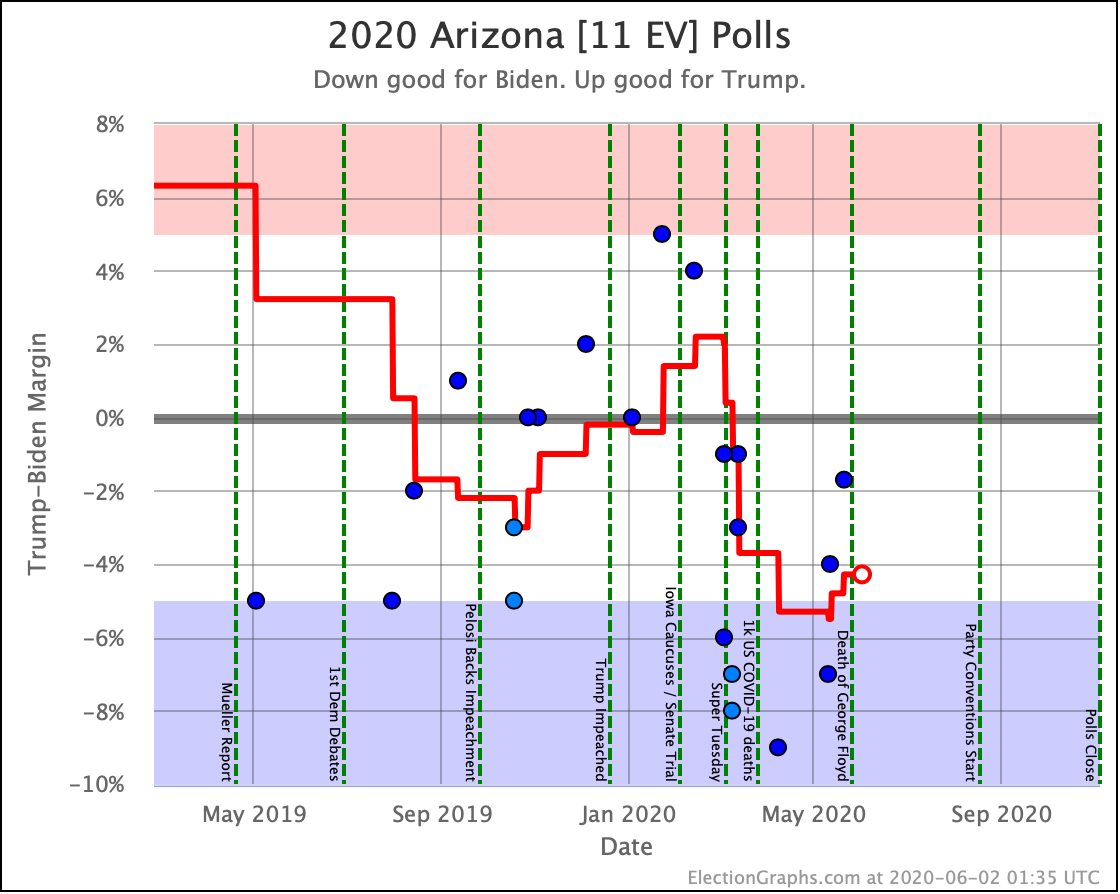
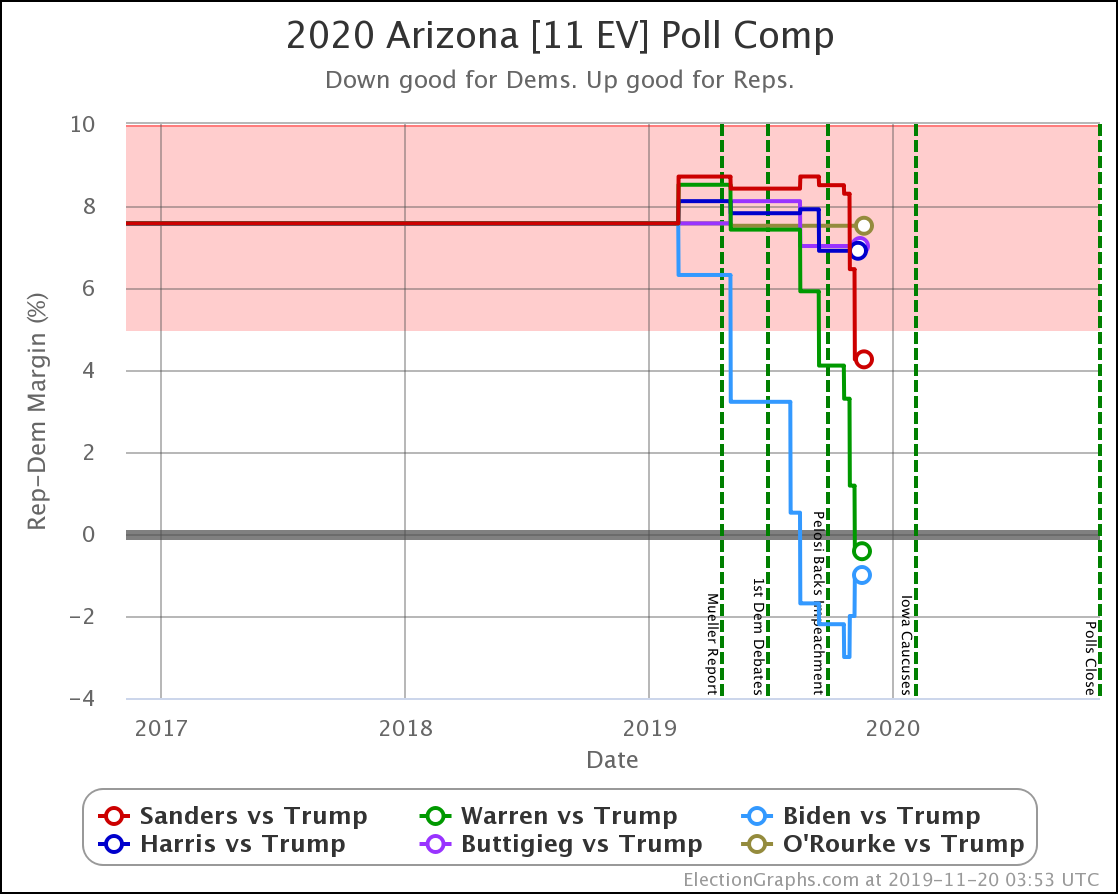
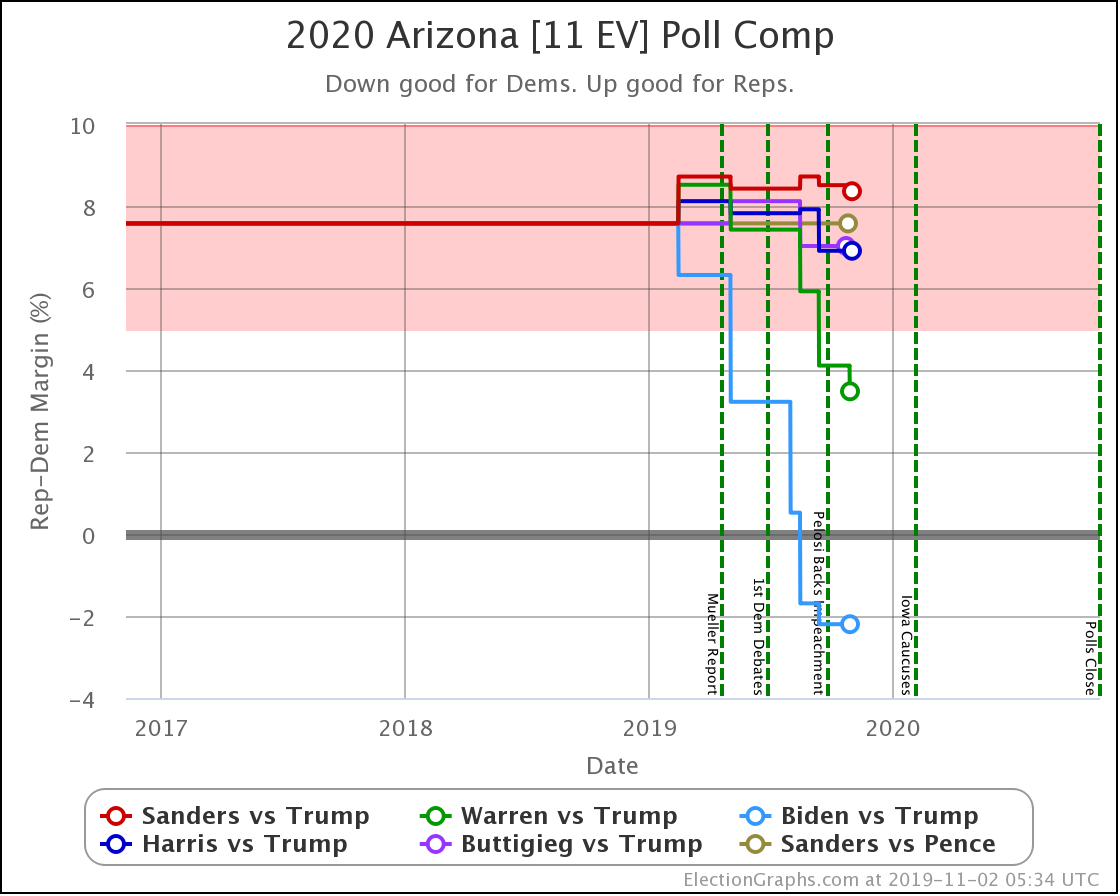
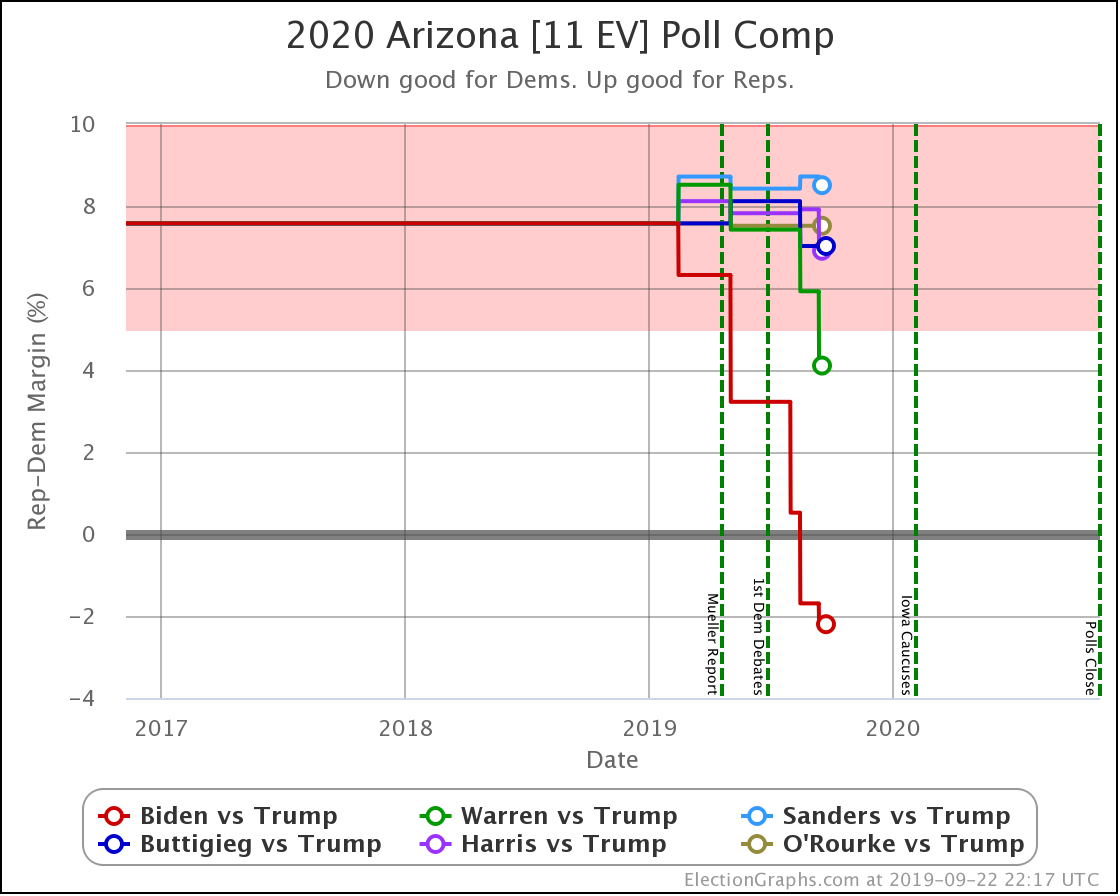
In Arizona Biden has moved from our "strong lead" to our "weak lead" category since May. He still leads, but Trump has been closing the gap.
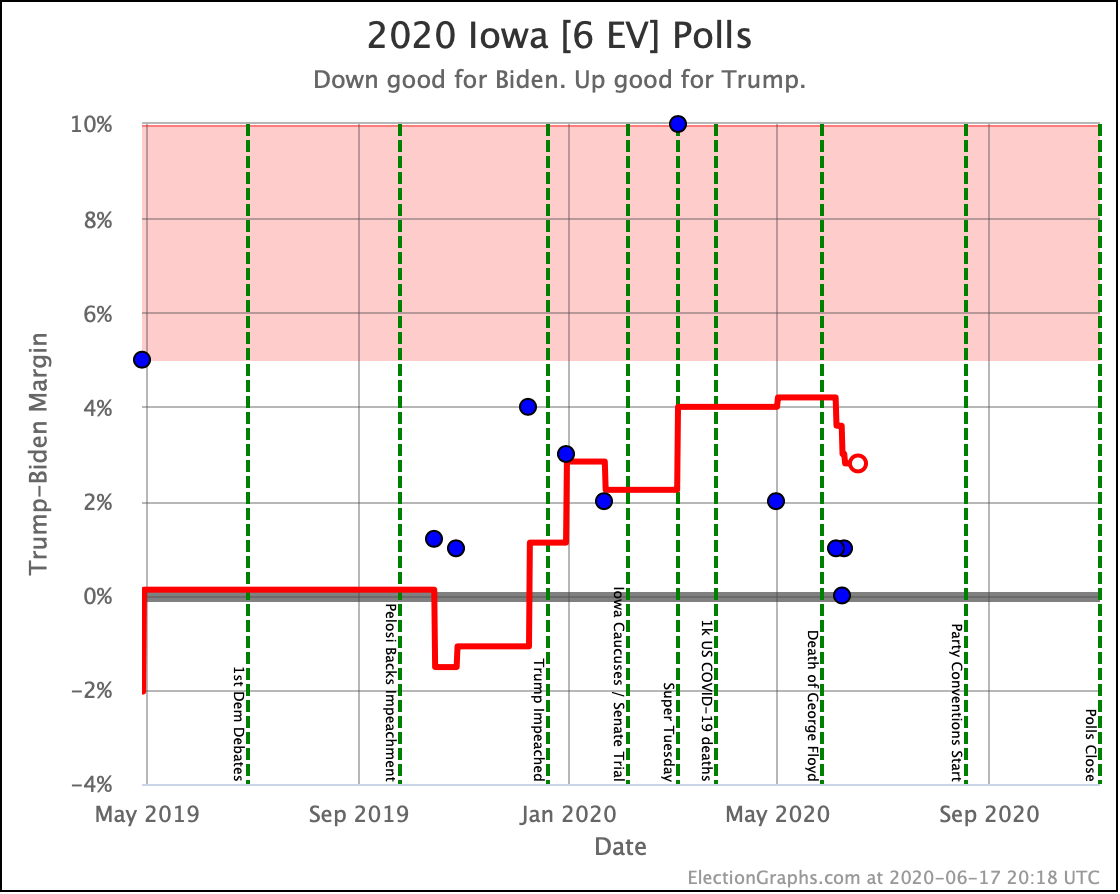
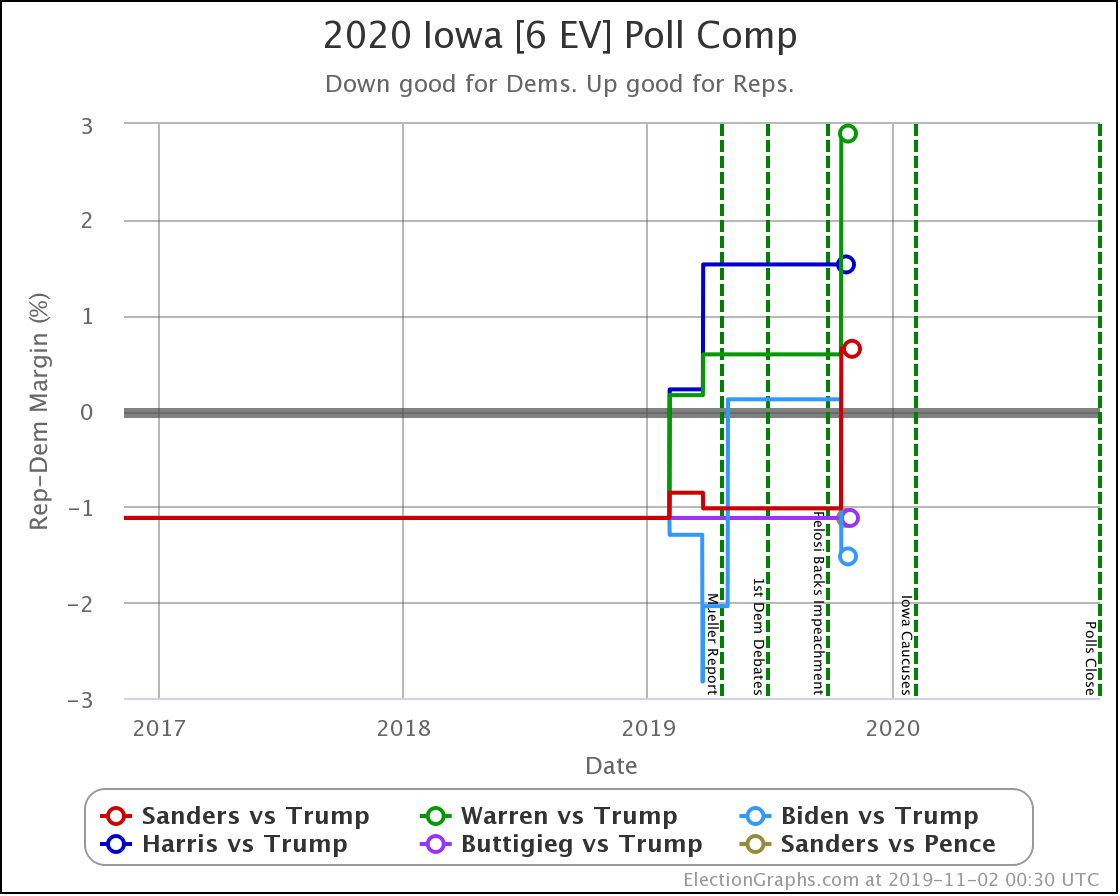
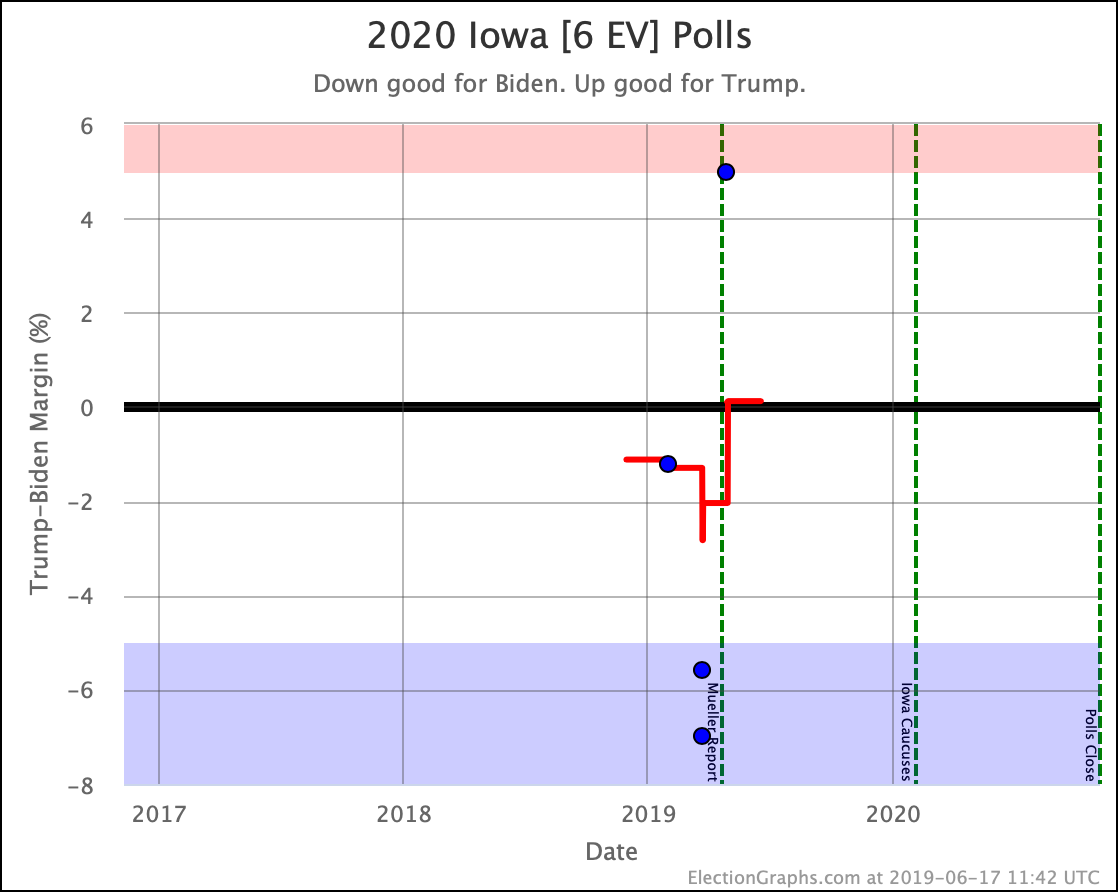
Iowa is still a Trump state, but the average has been tightening there too.
If you count these up, you'll see five of the eight close states with new polls have been moving toward Biden, and three have been moving toward Trump.
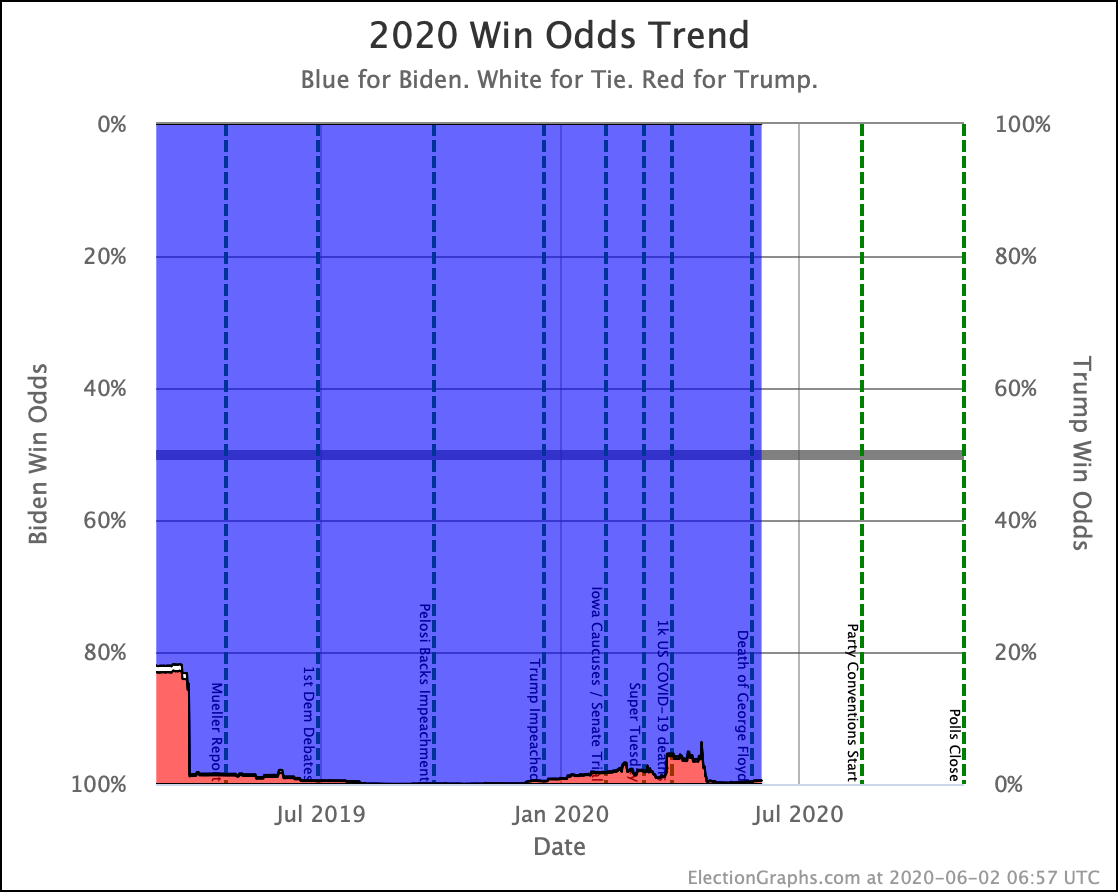
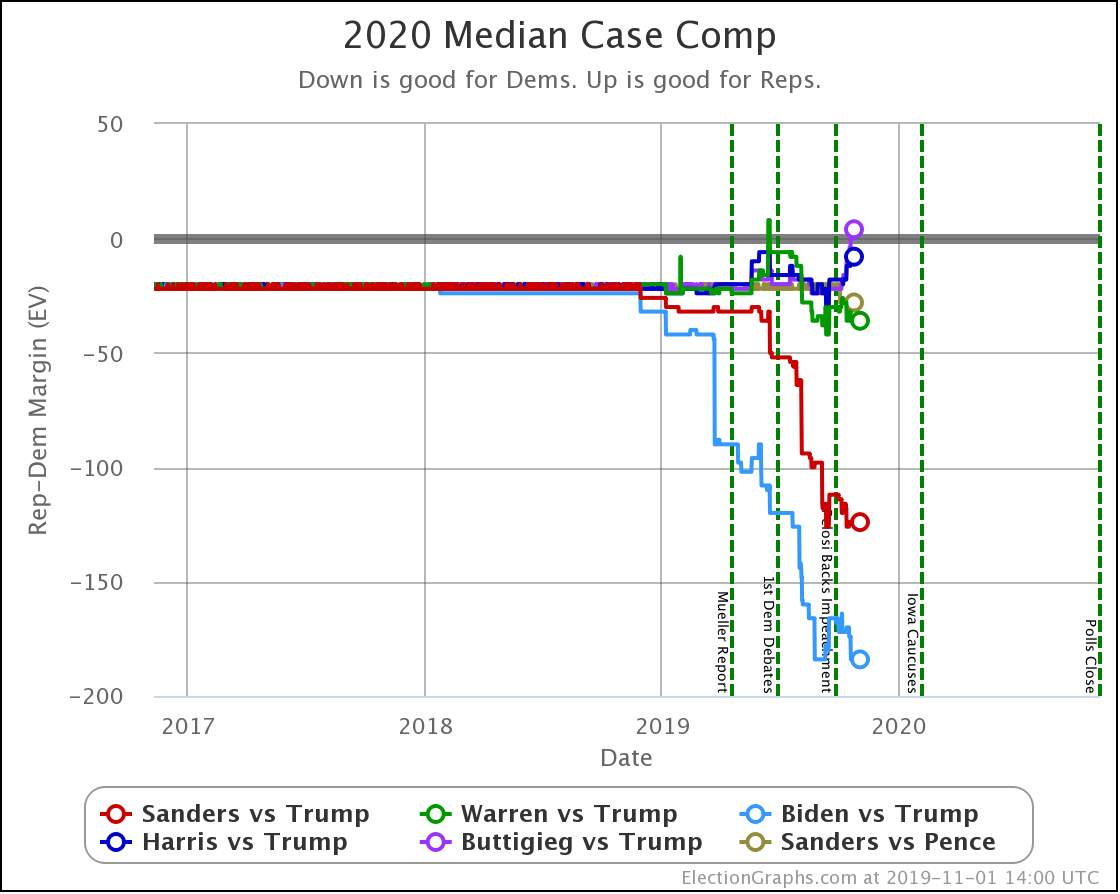
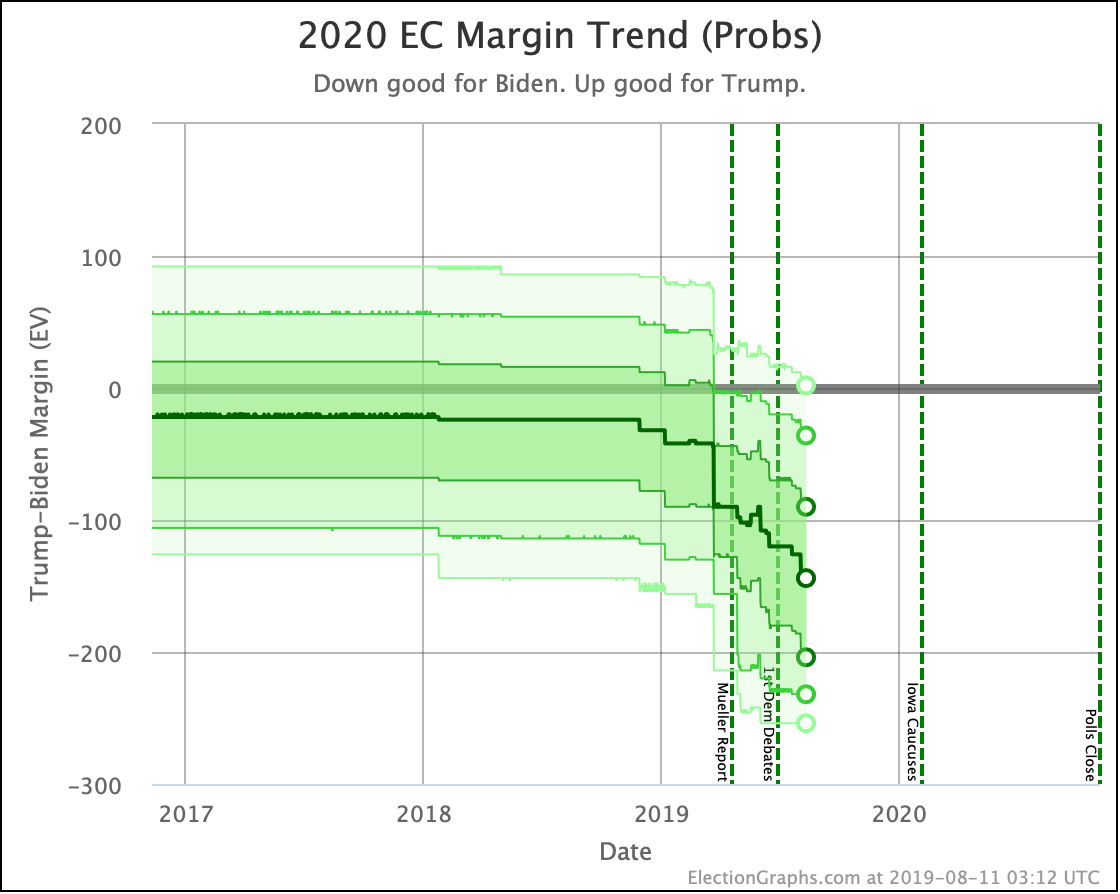
When you mash all this together into our probabilistic model, you get this:
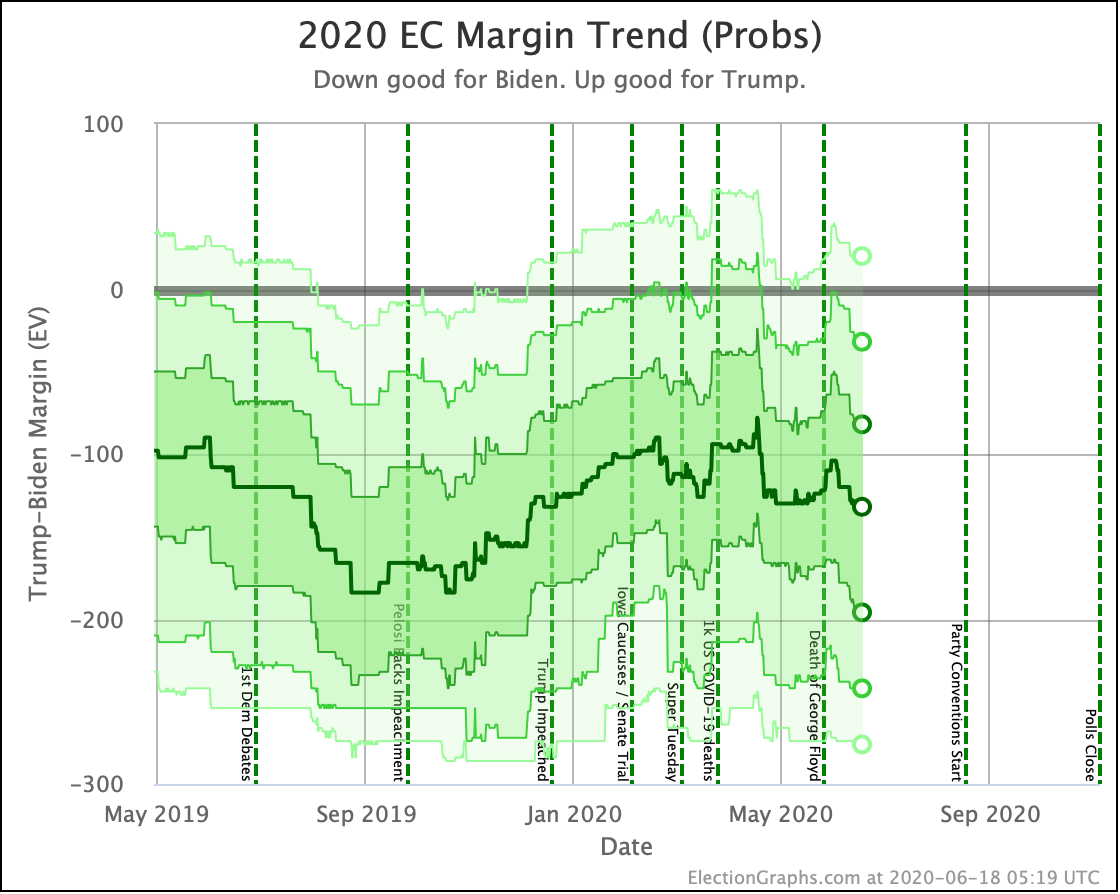
In the last couple of weeks, things moved toward Trump for a little bit, then started moving back toward Biden, and his median position is now 10 EV better than it was when we did our last update.
The switch from things improving for Trump to improving for Biden does seem to be just a few days after the death of George Floyd, just when the aftermath of that event was dominating the news.
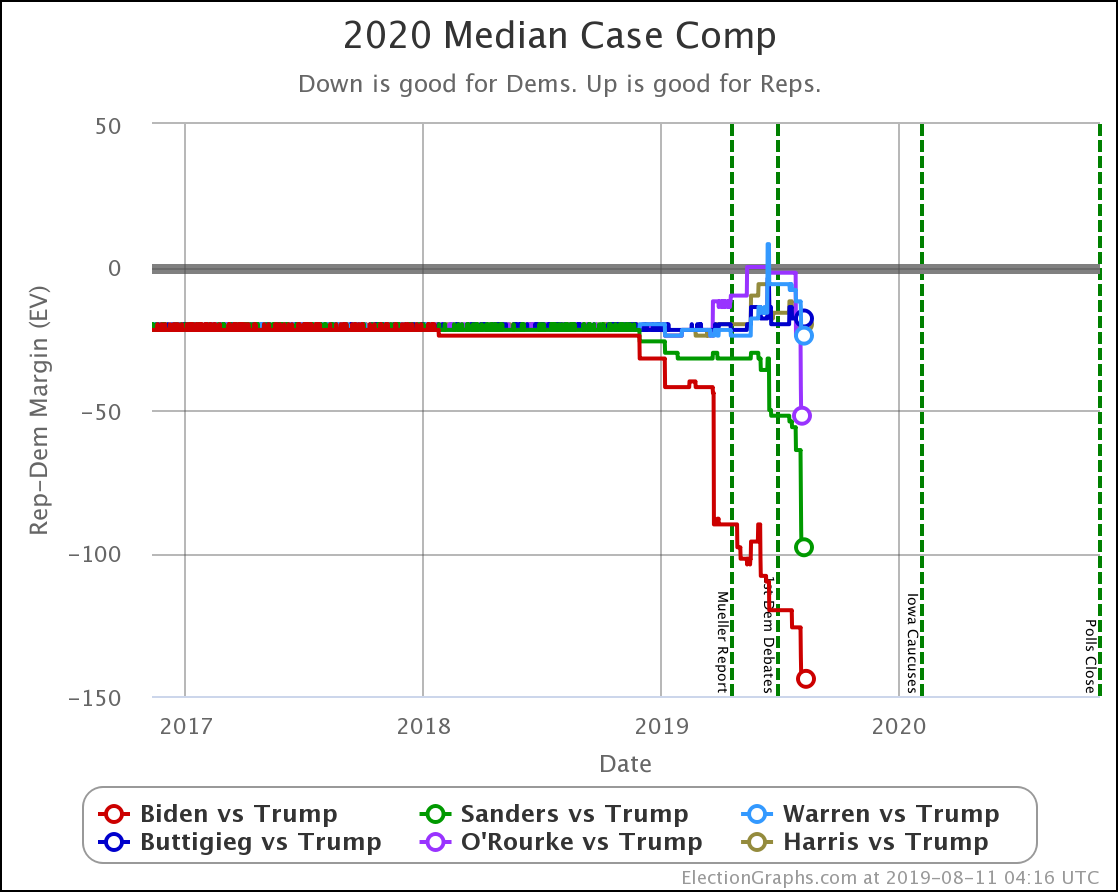
In terms of the median case of our simulations, the last time Biden was doing better than he is today was on December 5th.
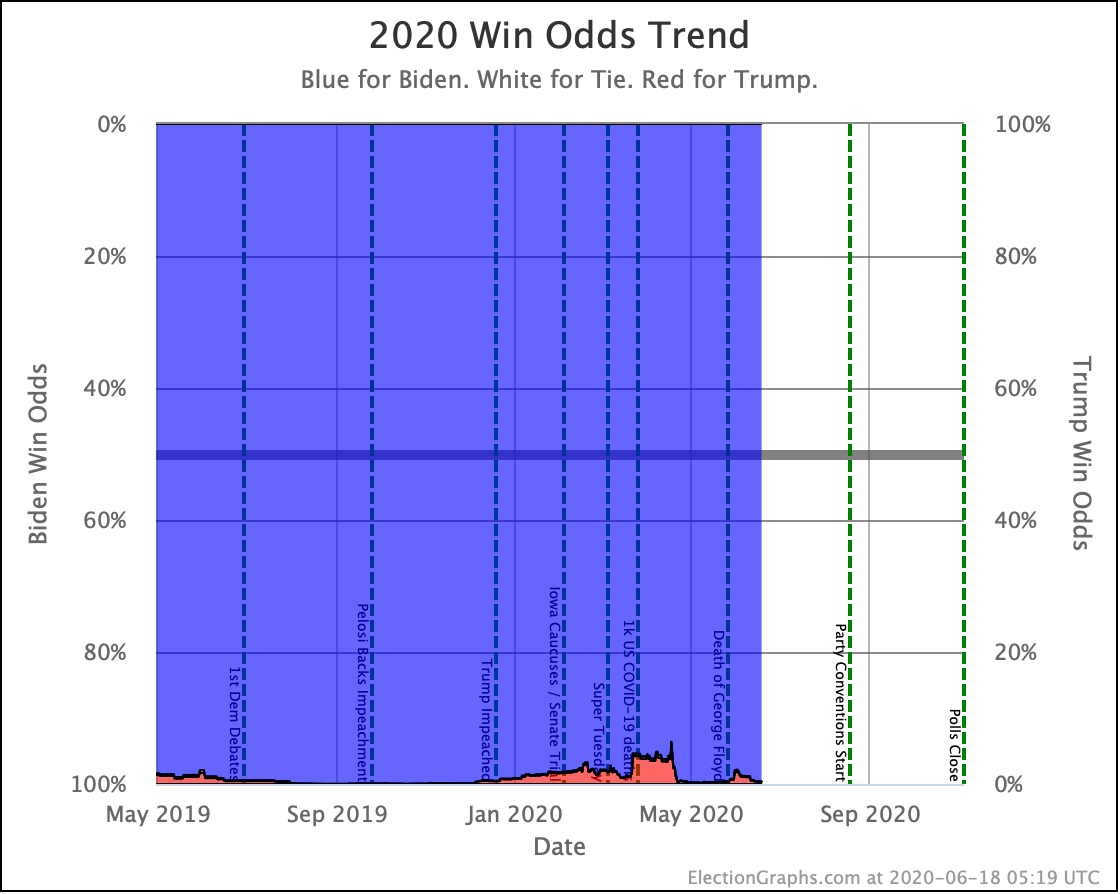
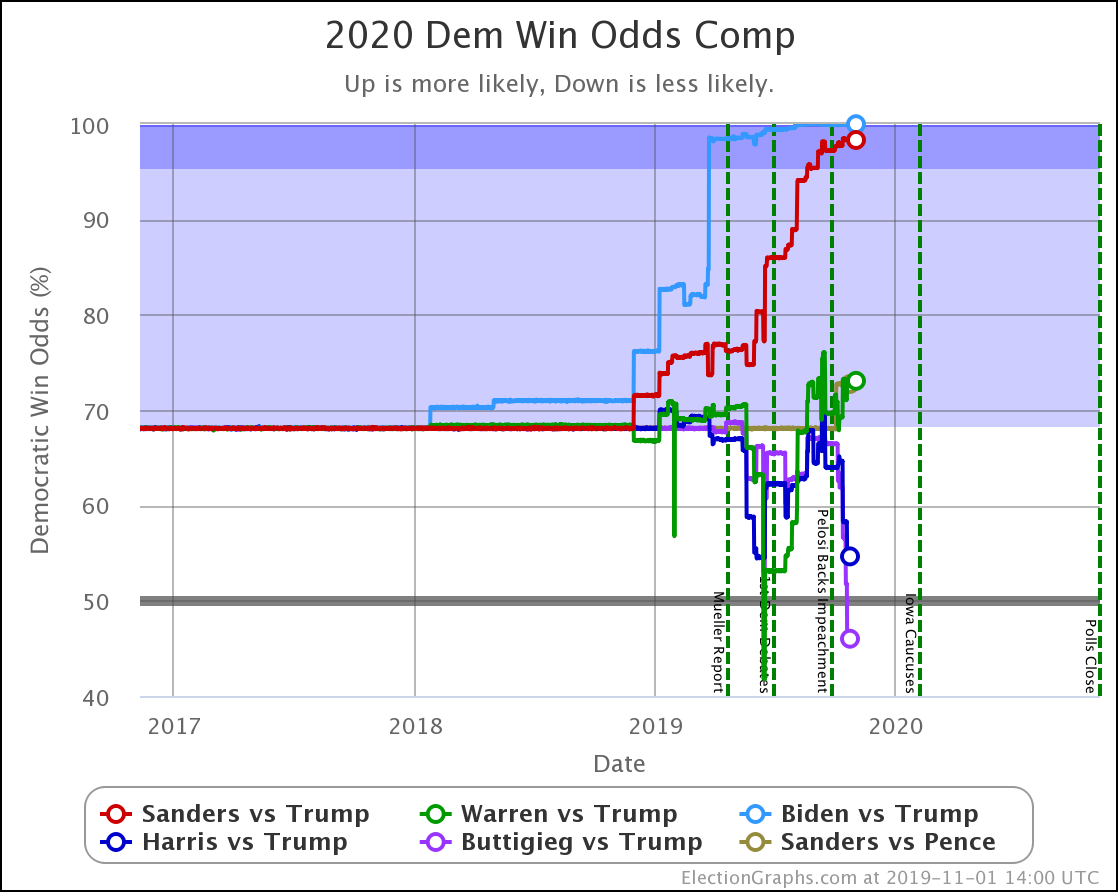
In terms of probability of winning though, Biden was better off much more recently, on May 19th.
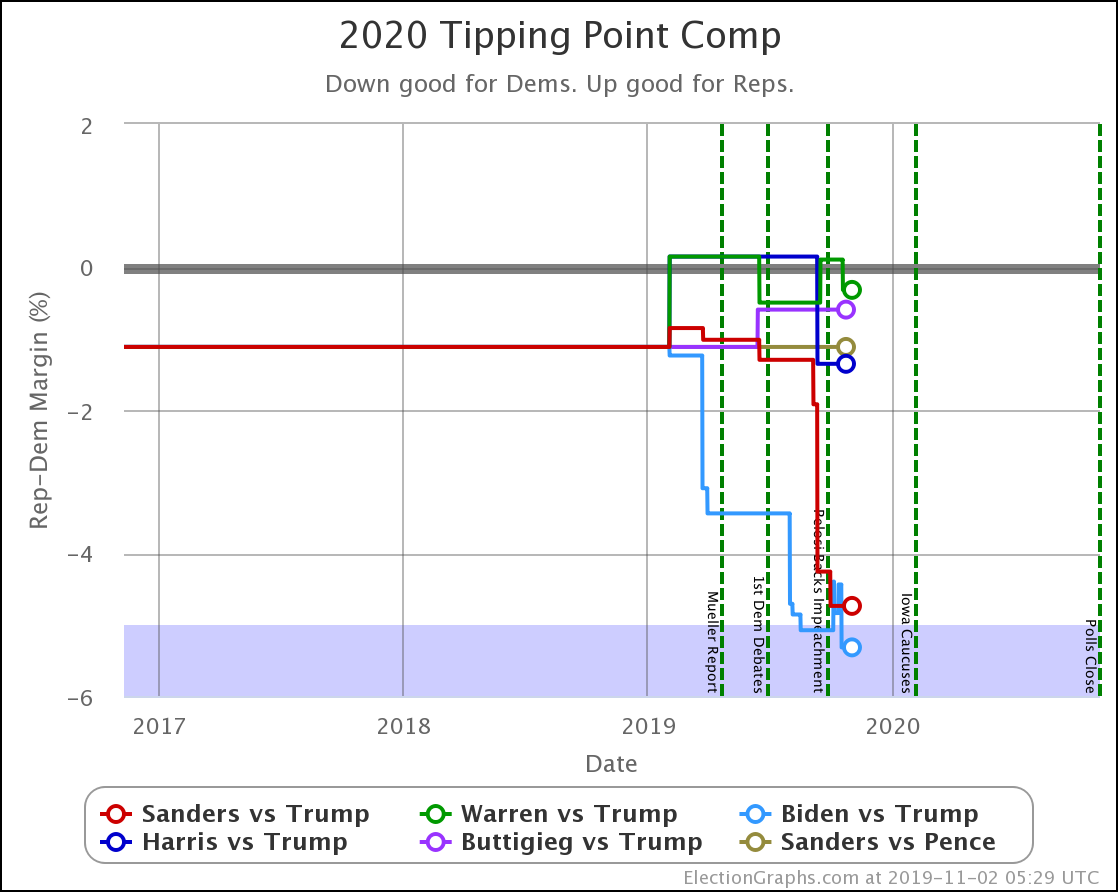
The tipping point is also moving back toward Biden again:
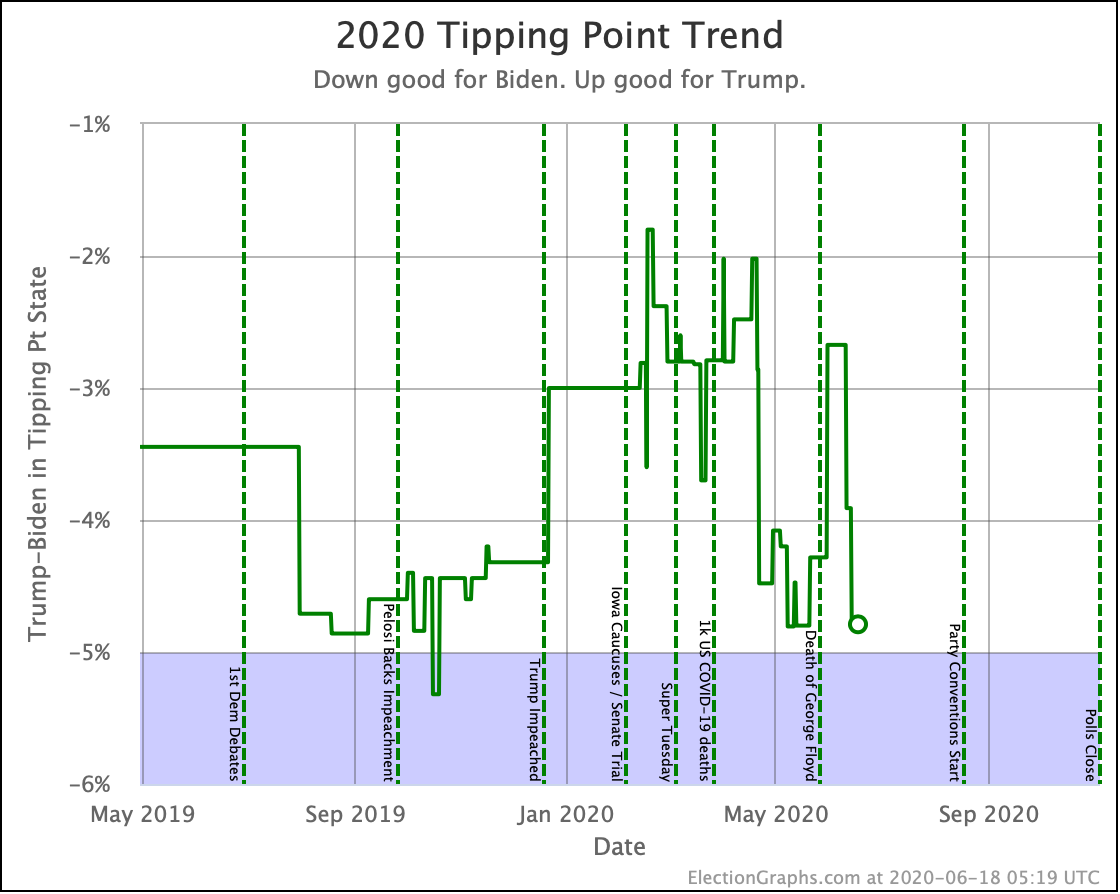
Biden is back where he was in May, but you have to go back all the way to October to find a time he was doing better.
All of this looks very strong for Biden. But remember how fast the tipping point can shift. In 2016 on at least a couple of occasions, it moved 5% or 6% within just a few weeks. And so far in 2020, we have seen rapid swings of nearly 3%. The bigger the movement, the bigger the news event that has to happen to drive the change. But given the last few years, who can doubt the potential for big news events that can change a campaign overnight?
Over the last few days, there have been tons of commentators talking about Biden's national polling being much stronger than Clinton was during the 2016 campaign. Some are saying he is doing better than she EVER did on that metric. That is probably true. But we don't elect people by popular vote.
How does this look in our views?
| <139 Days Out> | 2016 | 2020 |
|---|---|---|
| Expected Case | Clinton by 144 | Biden by 130 |
| Tipping Point | Clinton by 6.1% | Biden by 4.8% |
So yeah. Biden might well be doing better in terms of national popular vote polling than Clinton was at this stage. But Clinton was doing better when you factor in the state polls and the Electoral College.
Let's be very clear here. Biden is in a very strong position right now in terms of the Electoral College as well as the popular vote. Very strong.
But so was Clinton at the same point in the campaign. People were talking about landslides.
Then there was a bit of a roller coaster. Clinton was a lot weaker by the time we got to mid-September. Then she recovered and was strong again by mid-October. But then she collapsed again in the last few weeks. On election day, she was still favored, but it was clear Trump had a path to win and a Trump victory was very possible.
(That's looking at the Election Graphs analysis of course. Famously, lots of other sites didn't show things to be quite that close at the end. Election Graphs was one of only a handful that did.)
That kind of roller coaster may not happen this year. Biden may stay strong through the rest of the race. We shall see. But nobody should be getting overconfident at this stage.
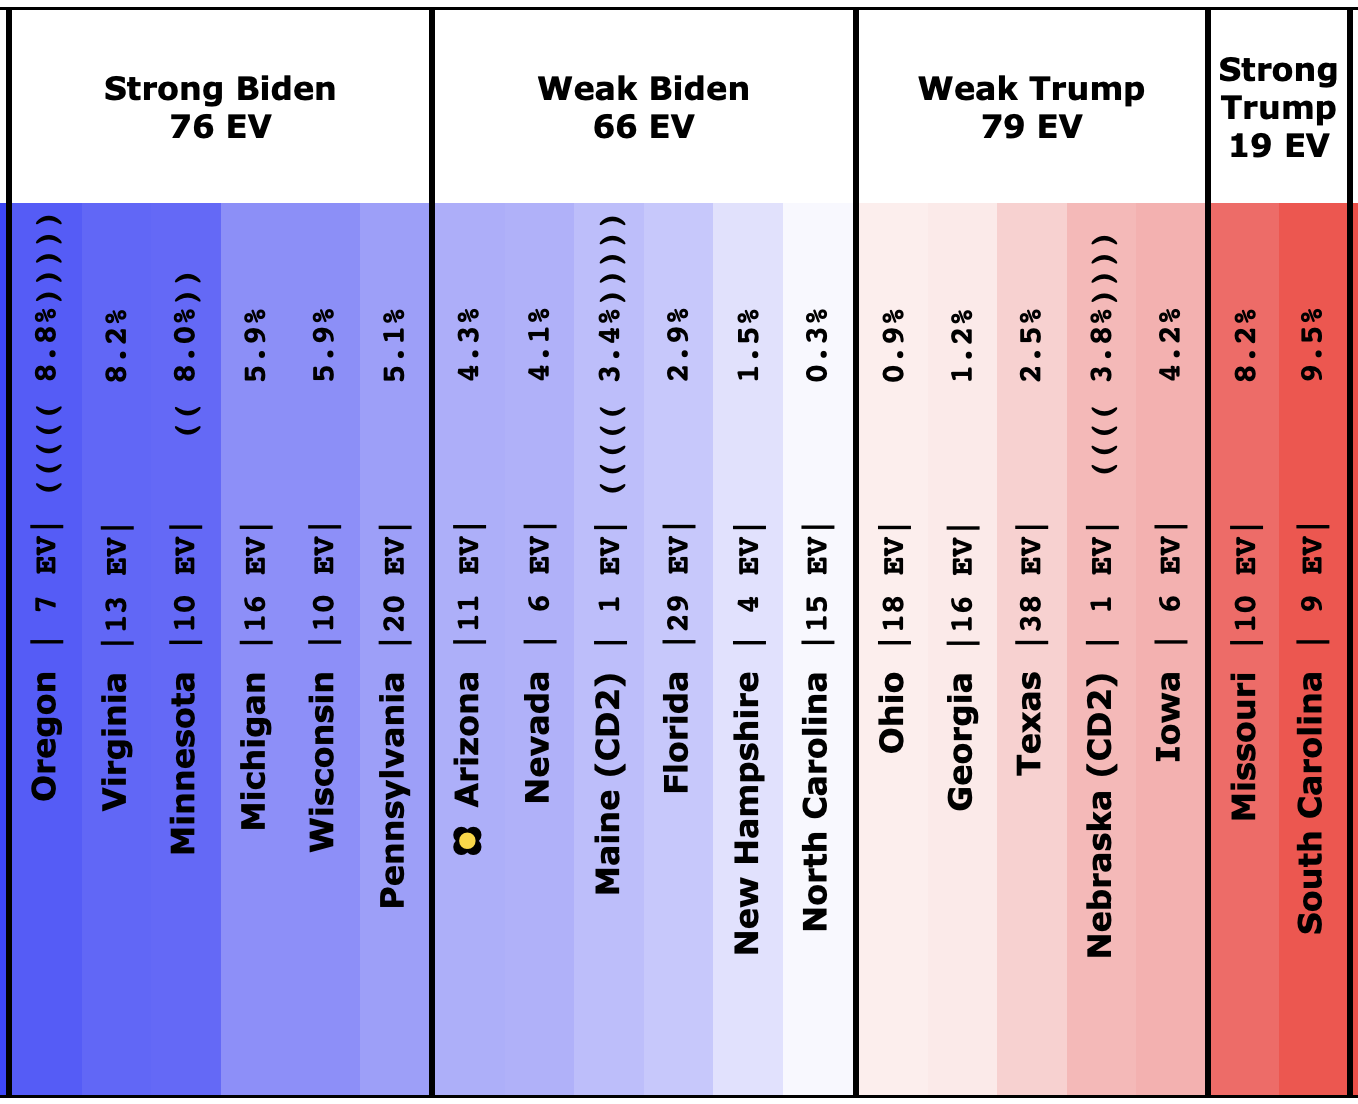
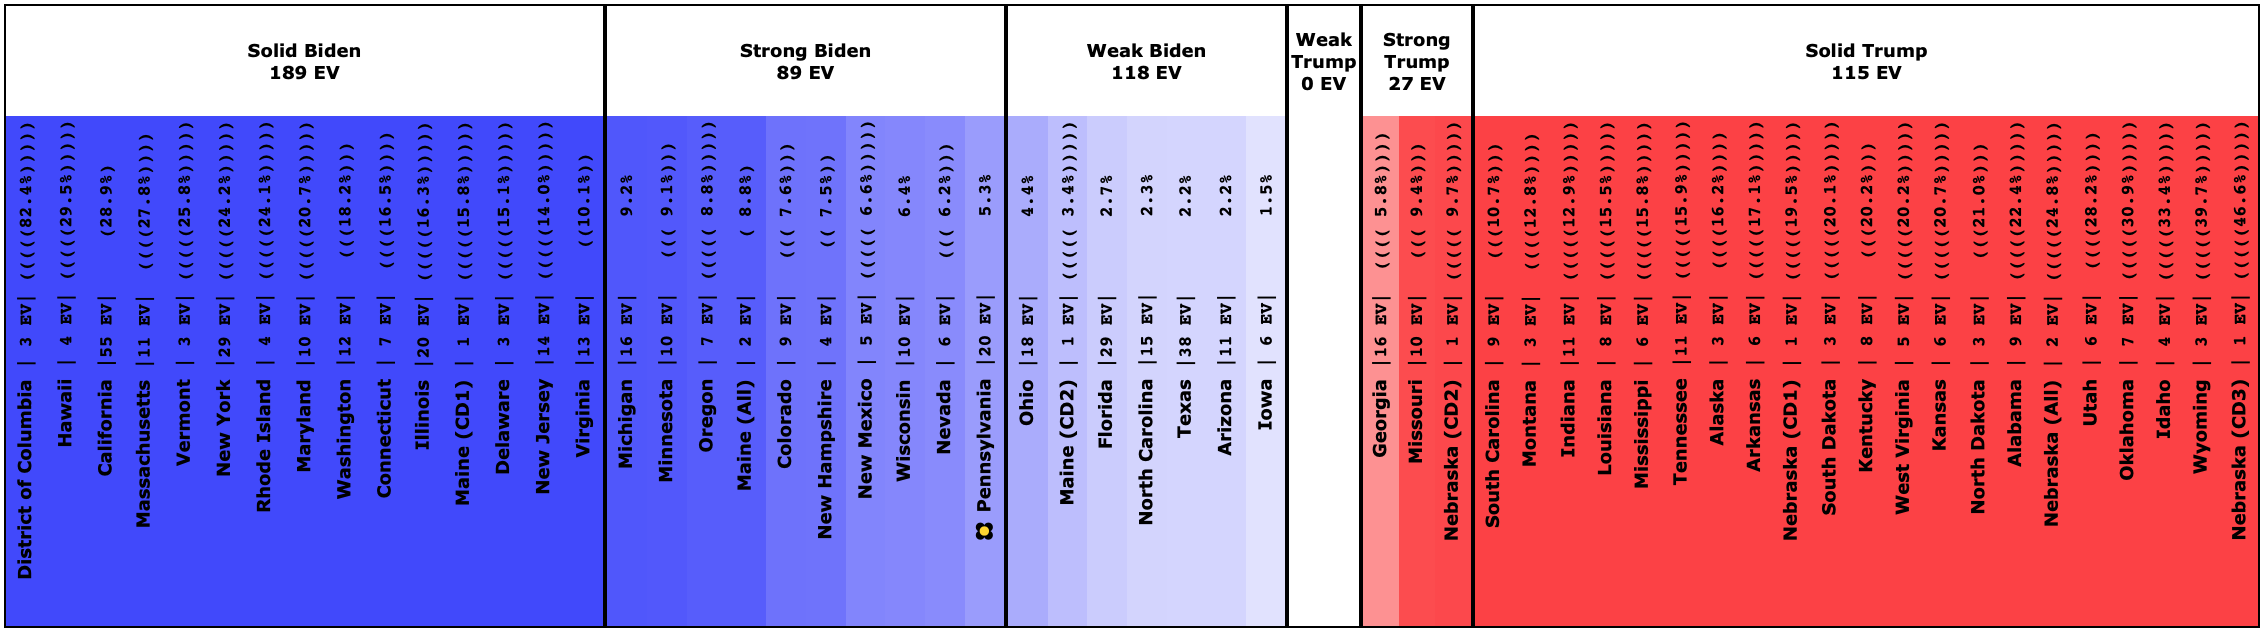
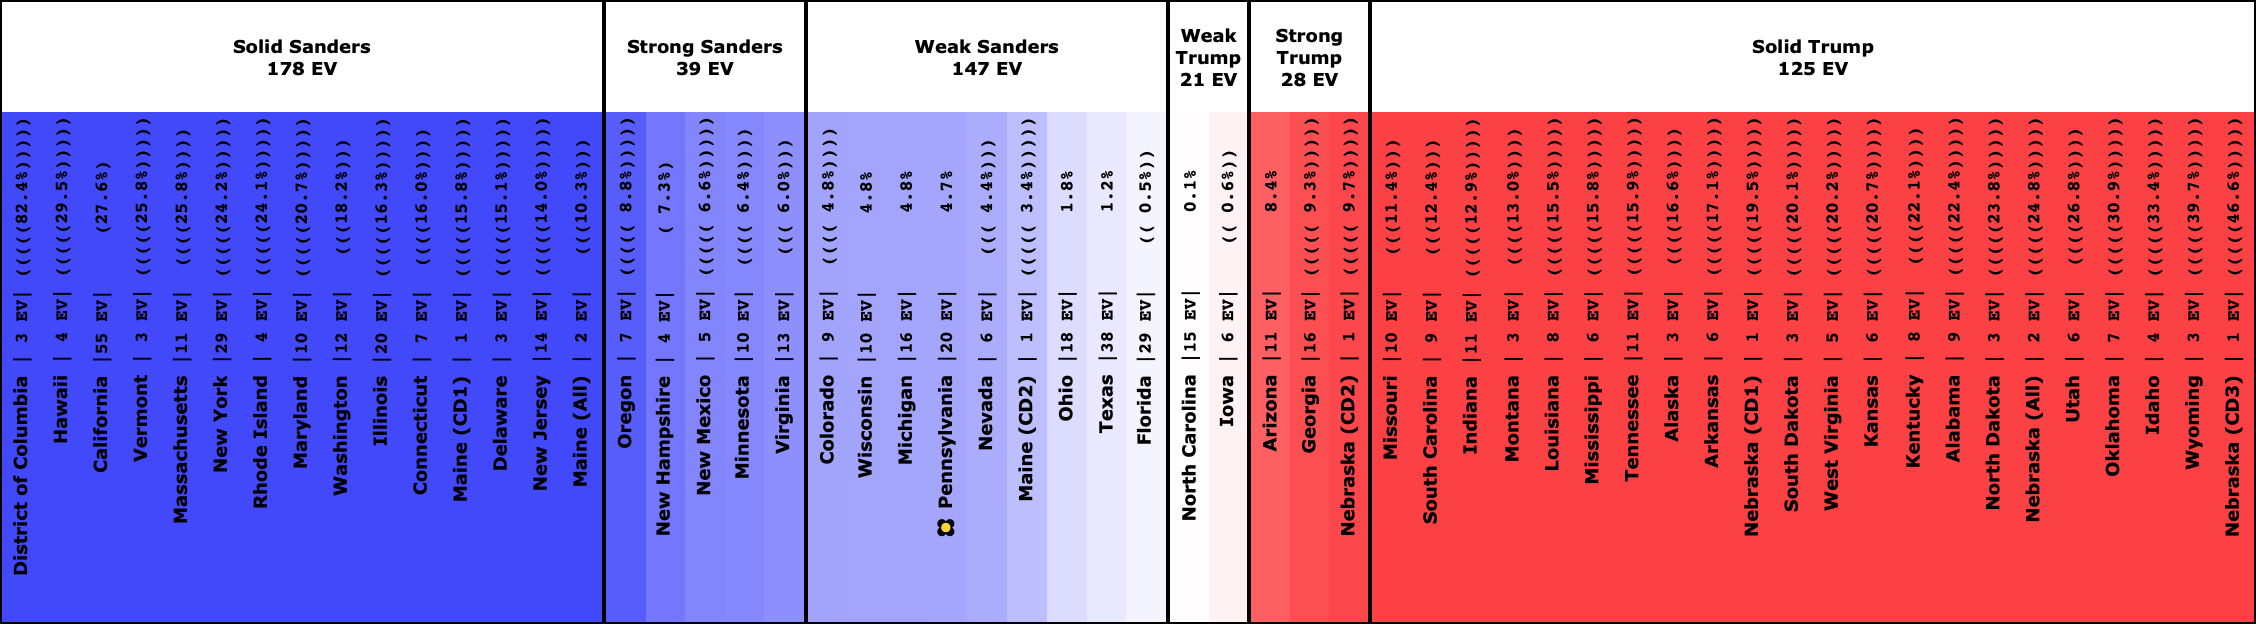
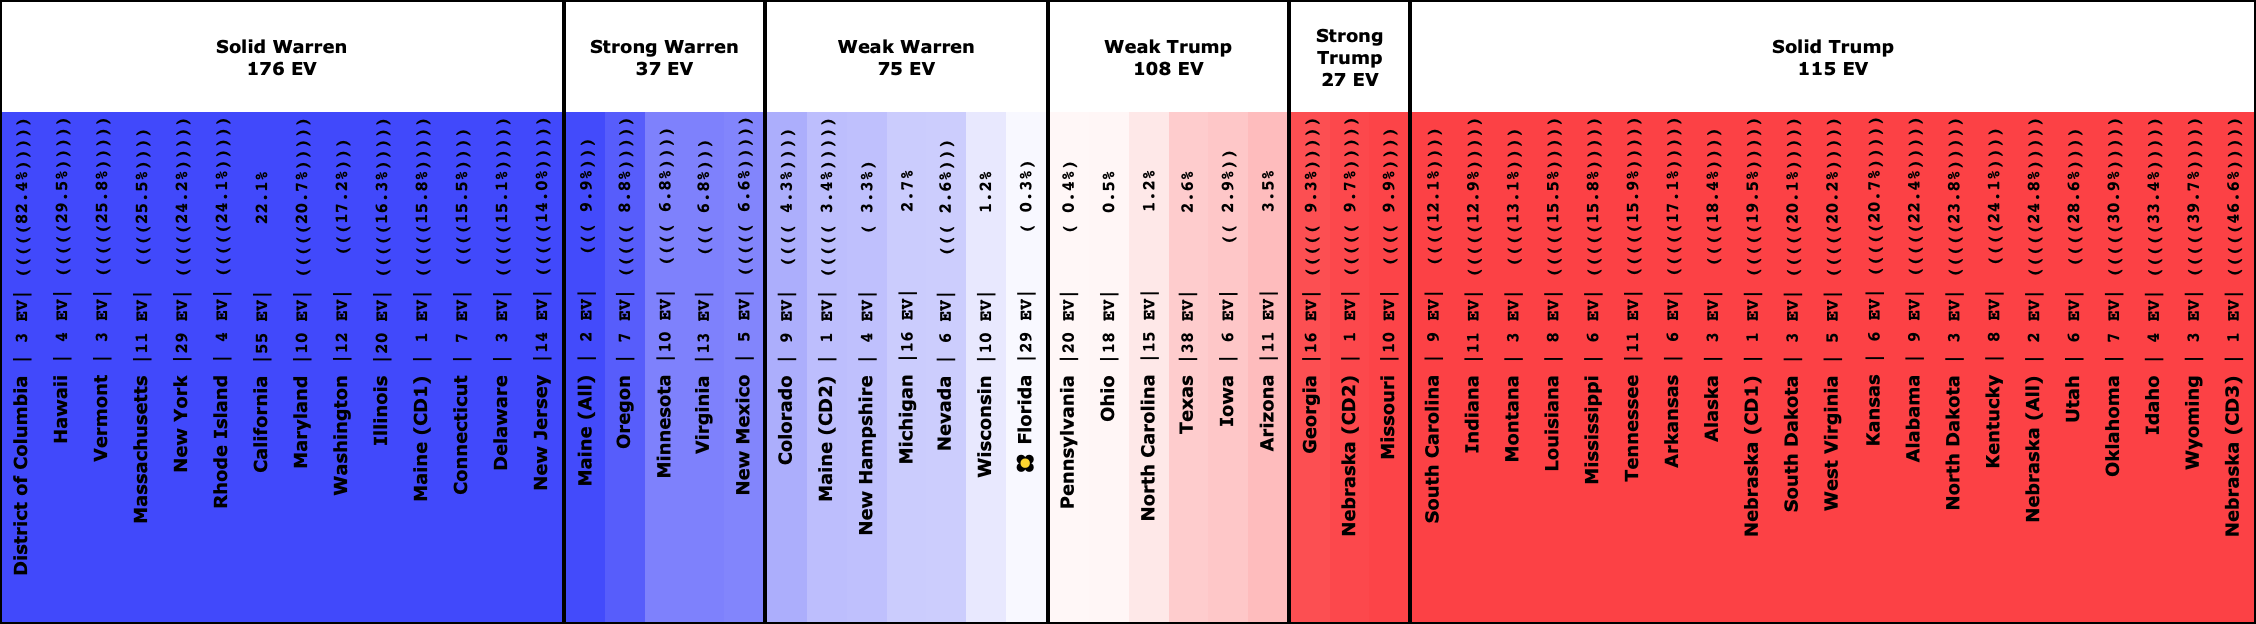
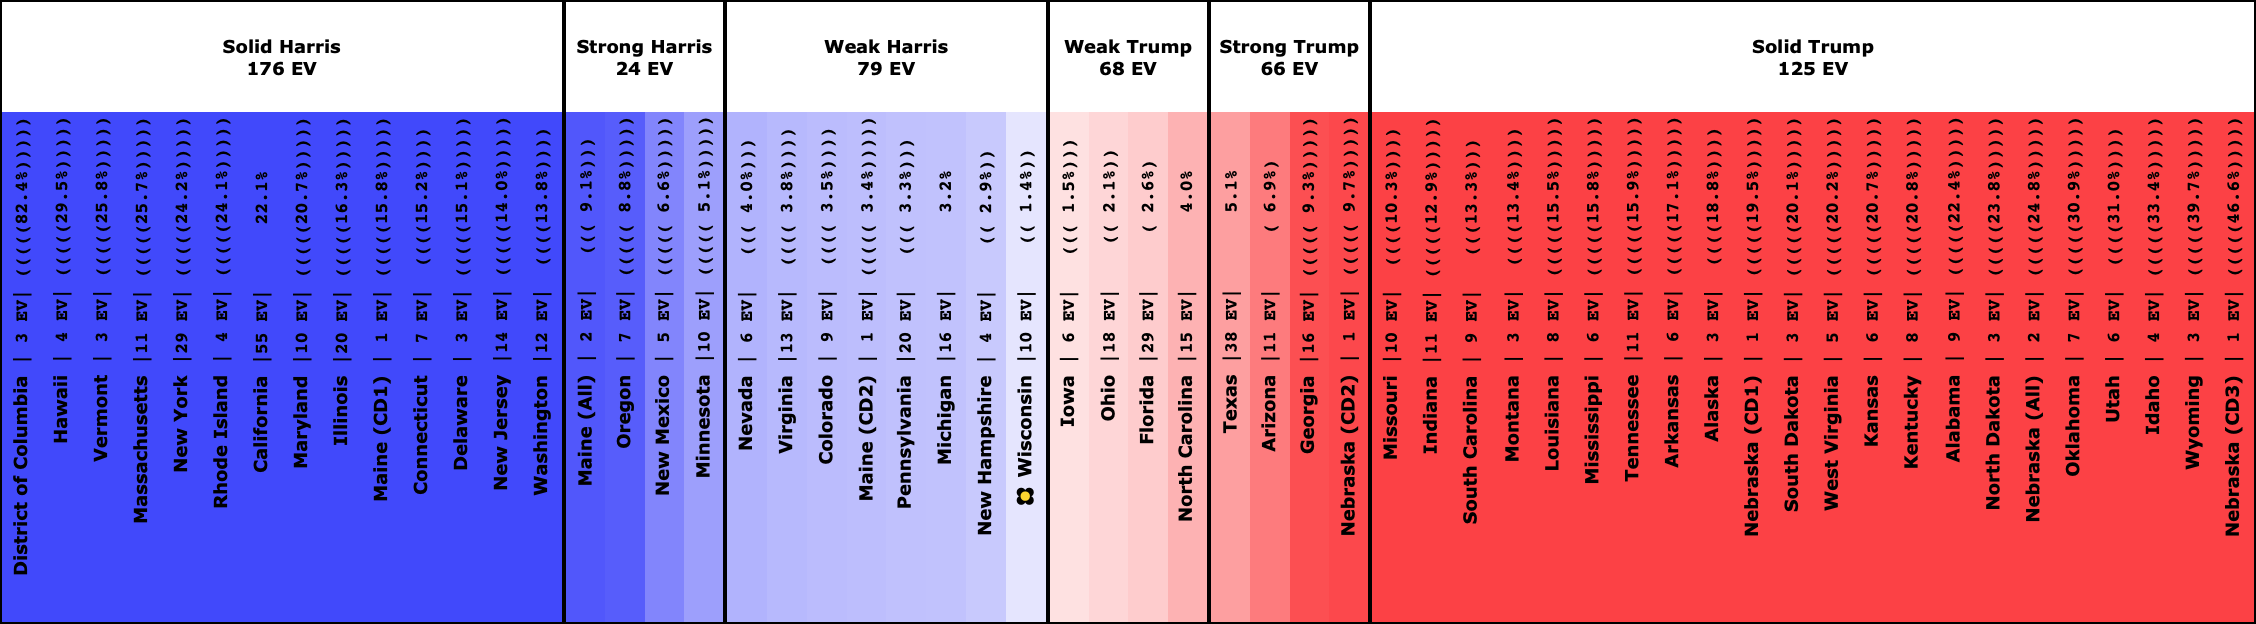
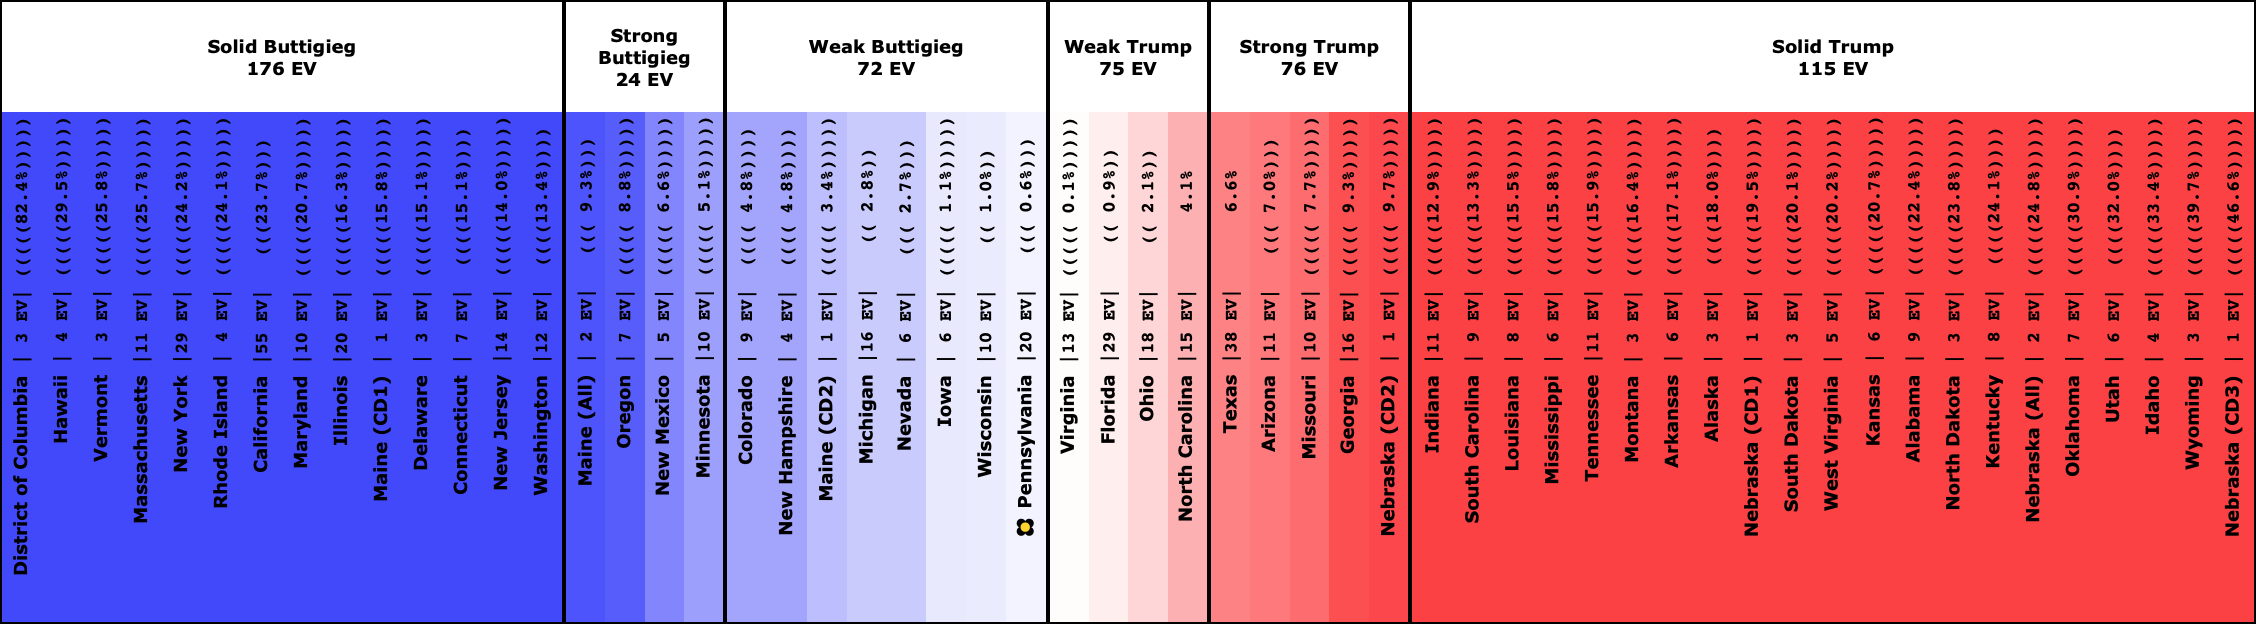
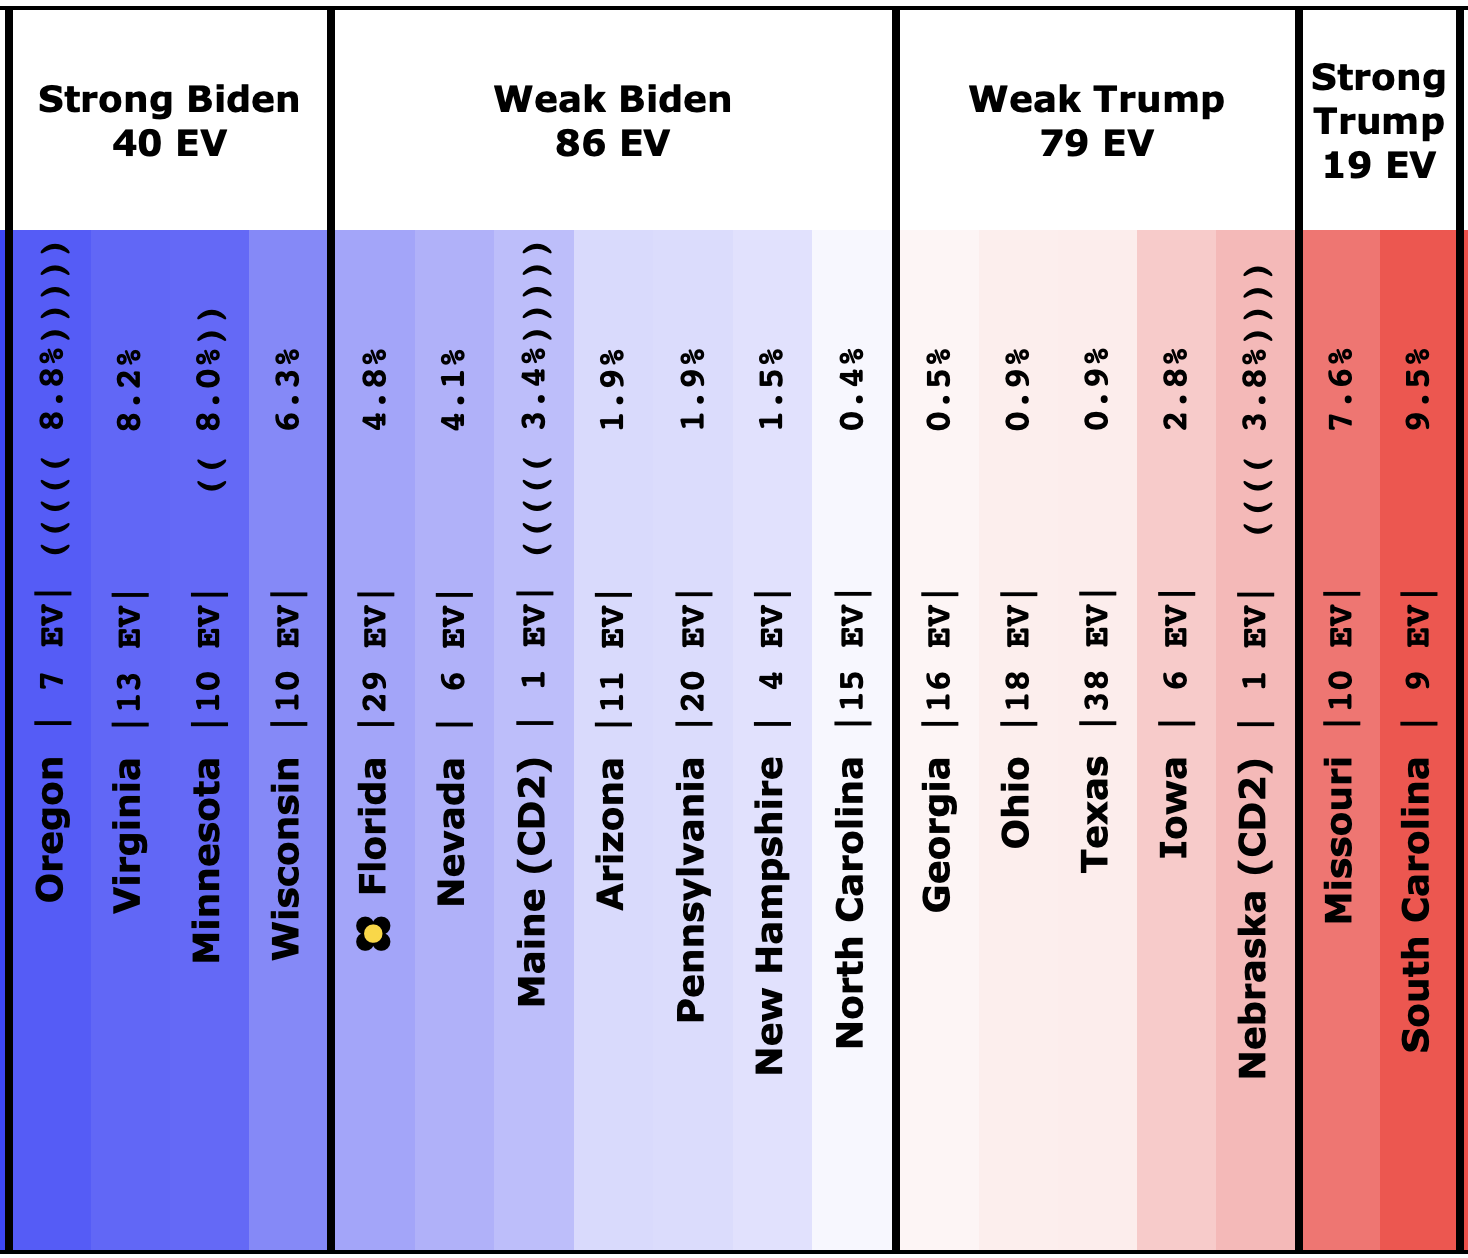
OK, so to round it out, here is the spectrum of the "weak" states that are actively in play, plus the "strong" states that might be brought into play with some big improvements by one side or the other:
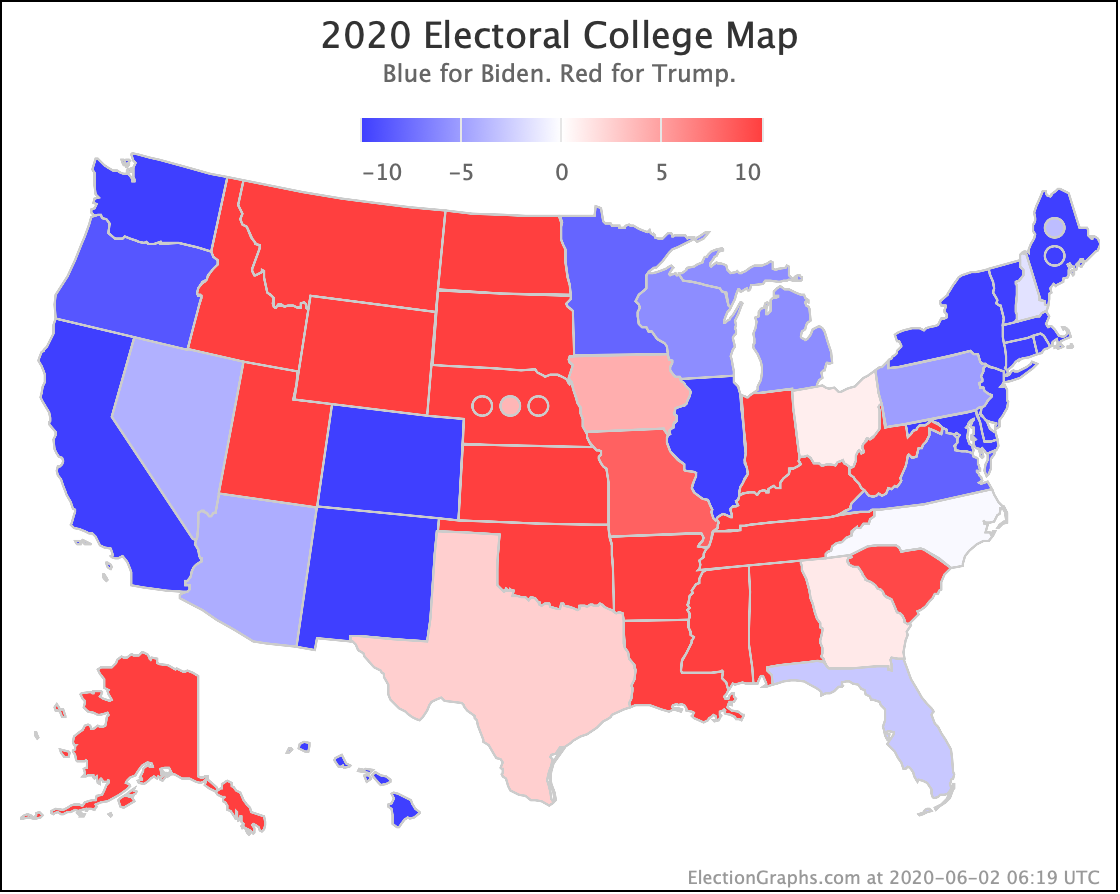
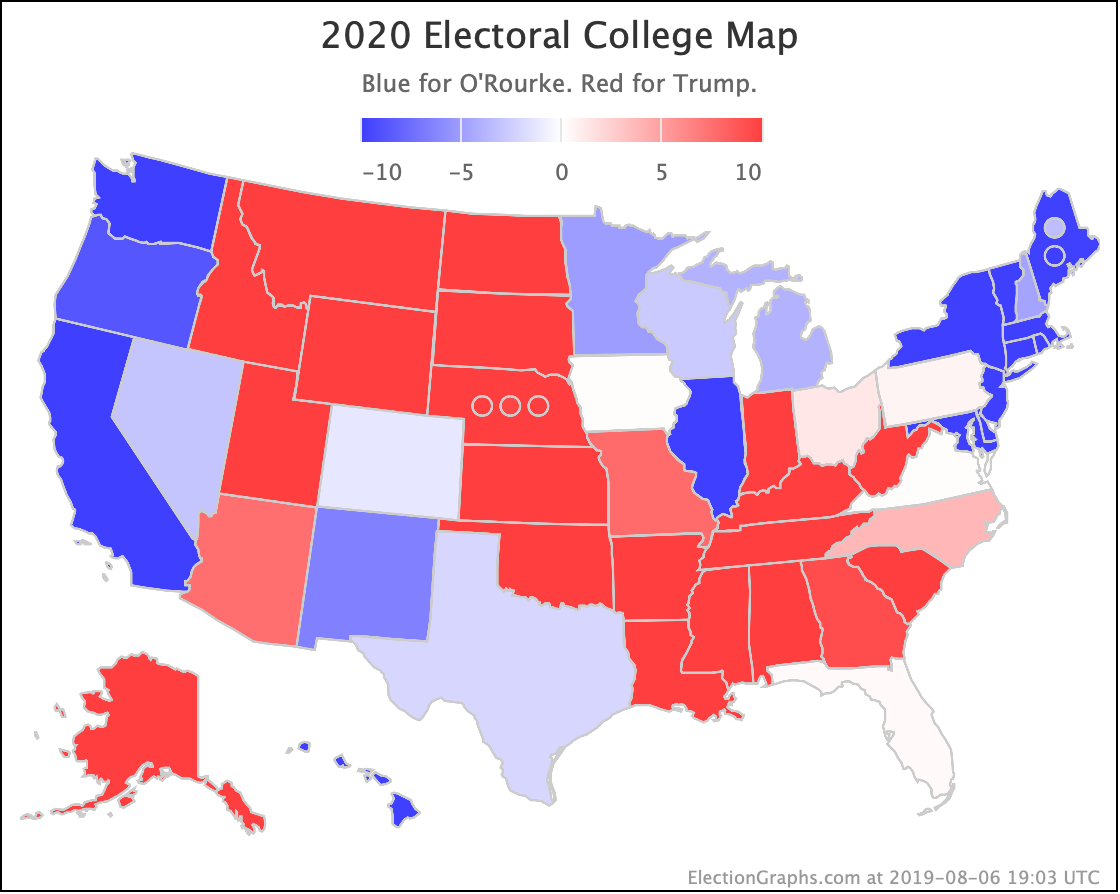
And of course the current map:
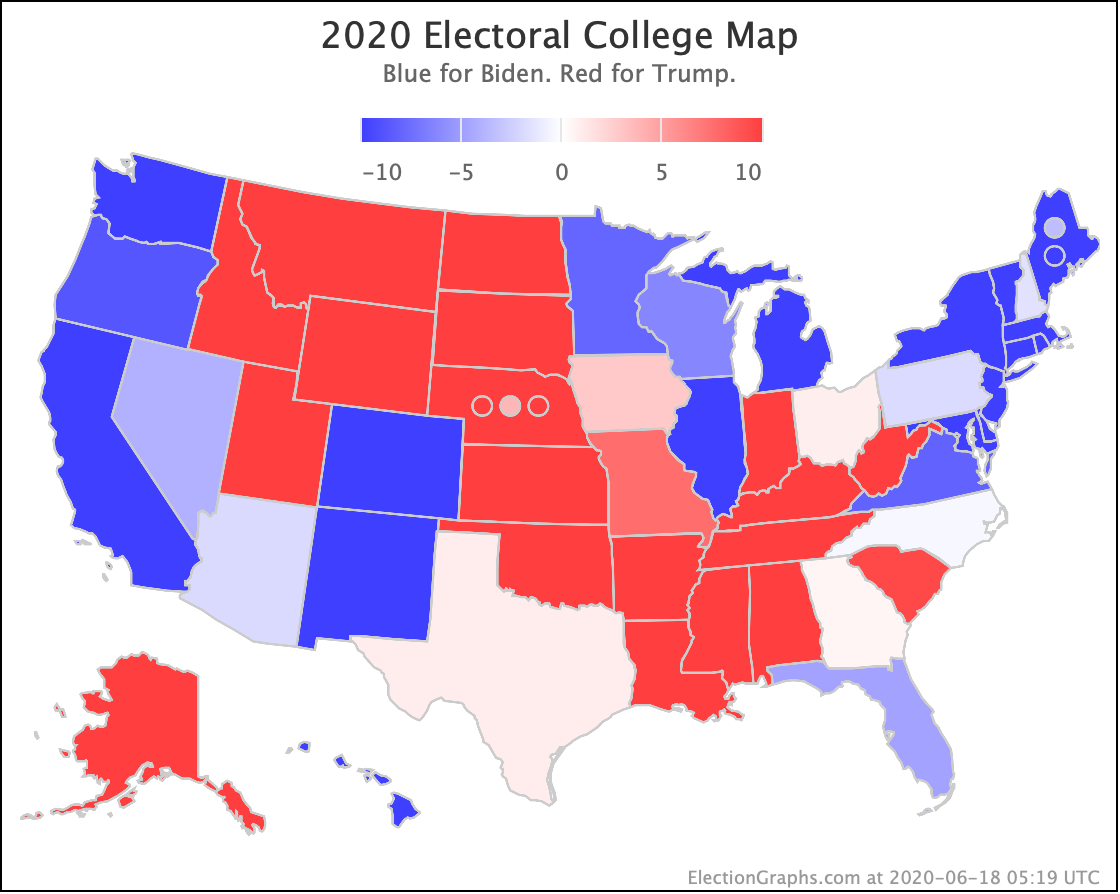
And that is where we are.
138.7 days until polls start to close.
For more information:
This post is an update based on the data on the Election Graphs Electoral College 2020 page. Election Graphs tracks a poll-based estimate of the Electoral College. The charts, graphs, and maps in the post above are all as of the time of this post. Click through on any image for current interactive versions of the chart, along with additional details.
Follow @ElectionGraphs on Twitter or Election Graphs on Facebook to see announcements of updates. For those interested in individual poll updates, follow @ElecCollPolls on Twitter for all the polls as I add them. If you find the information in these posts informative or useful, please consider visiting the donation page.