
Since the last update, there have been polls in North Carolina, New York, Michigan, Pennsylvania, Wisconsin, Florida, Texas, Virginia, Maine (All), Minnesota, Iowa, Ohio, and Georgia.
Now, most (but not all) of these are internal Trump campaign polls that were leaked and reported on by first ABC and then NBC. The full internal polling reportedly included 17 states and matchups against multiple Democrats, but the leaks so far only include Biden versus Trump results in 12 of them. Because this is a leak of internal polls and not "regular polls," I tweeted a series of notes on these polls, that I will repeat here:
- 1st: Some aggregators automatically exclude internal polling because of potential selective release bias, etc. I default to including as much as possible. So they are reflected on Election Graphs.
- 2nd: I’m going with ABC on the field dates, not NBC. ABC reports March 15th to March 28th, which is precisely two weeks. NBC reports March 13th to March 28th, which includes two extra days. These almost certainly are the same batch of polls though.
- 3rd: ABC and NBC differ slightly on their reports of the results in Pennsylvania, Wisconsin, and Florida. In these cases, I will include both, but weighted as half polls, just as I do when a pollster reports results in multiple ways (with & without 3rd parties, registered vs. likely voters, etc.)
- 4th: For some states this leak only includes margins. Election Graphs only uses margin in calculations, but it displays & reports candidate results too. For the instances where we only have leaked margins, I will log the polls such that Trump-Biden=Margin and Trump+Biden=100%.
- 5th: If a range of possible margins is reported rather than a specific margin, I will log these as the center of that range.
- 6th: If more detailed leaks become available, I will adjust how these polls are recorded to reflect any new information.
With those caveats, here are the status changes that occurred as a result of this batch of polls. After that, we'll start looking at the graphs.
All of these changes are for the Biden versus Trump matchup.
State Level:
- Florida (29 EV) has moved from Weak Trump to Weak Biden
- Virginia (13 EV) has moved from Weak Trump to Weak Biden
National Level:
- Expected case change: Biden 299 to Trump 239 -> Biden 341 to Trump 197
- Tipping point moves from Biden by 1.9% in NC to Biden by 3.4% in ME-CD2.
We'll look nationally first, then the states that changed categories, then a brief look at the locations that did not. Finally, I'll report on what all this does to the Monte Carlo simulation of the national race.
Keep in mind that all of the leaked internal polls were in the field back in March, so they are older data, and will change not just the end of the lines in the charts, but the shape of those lines over March, April, May, and June.
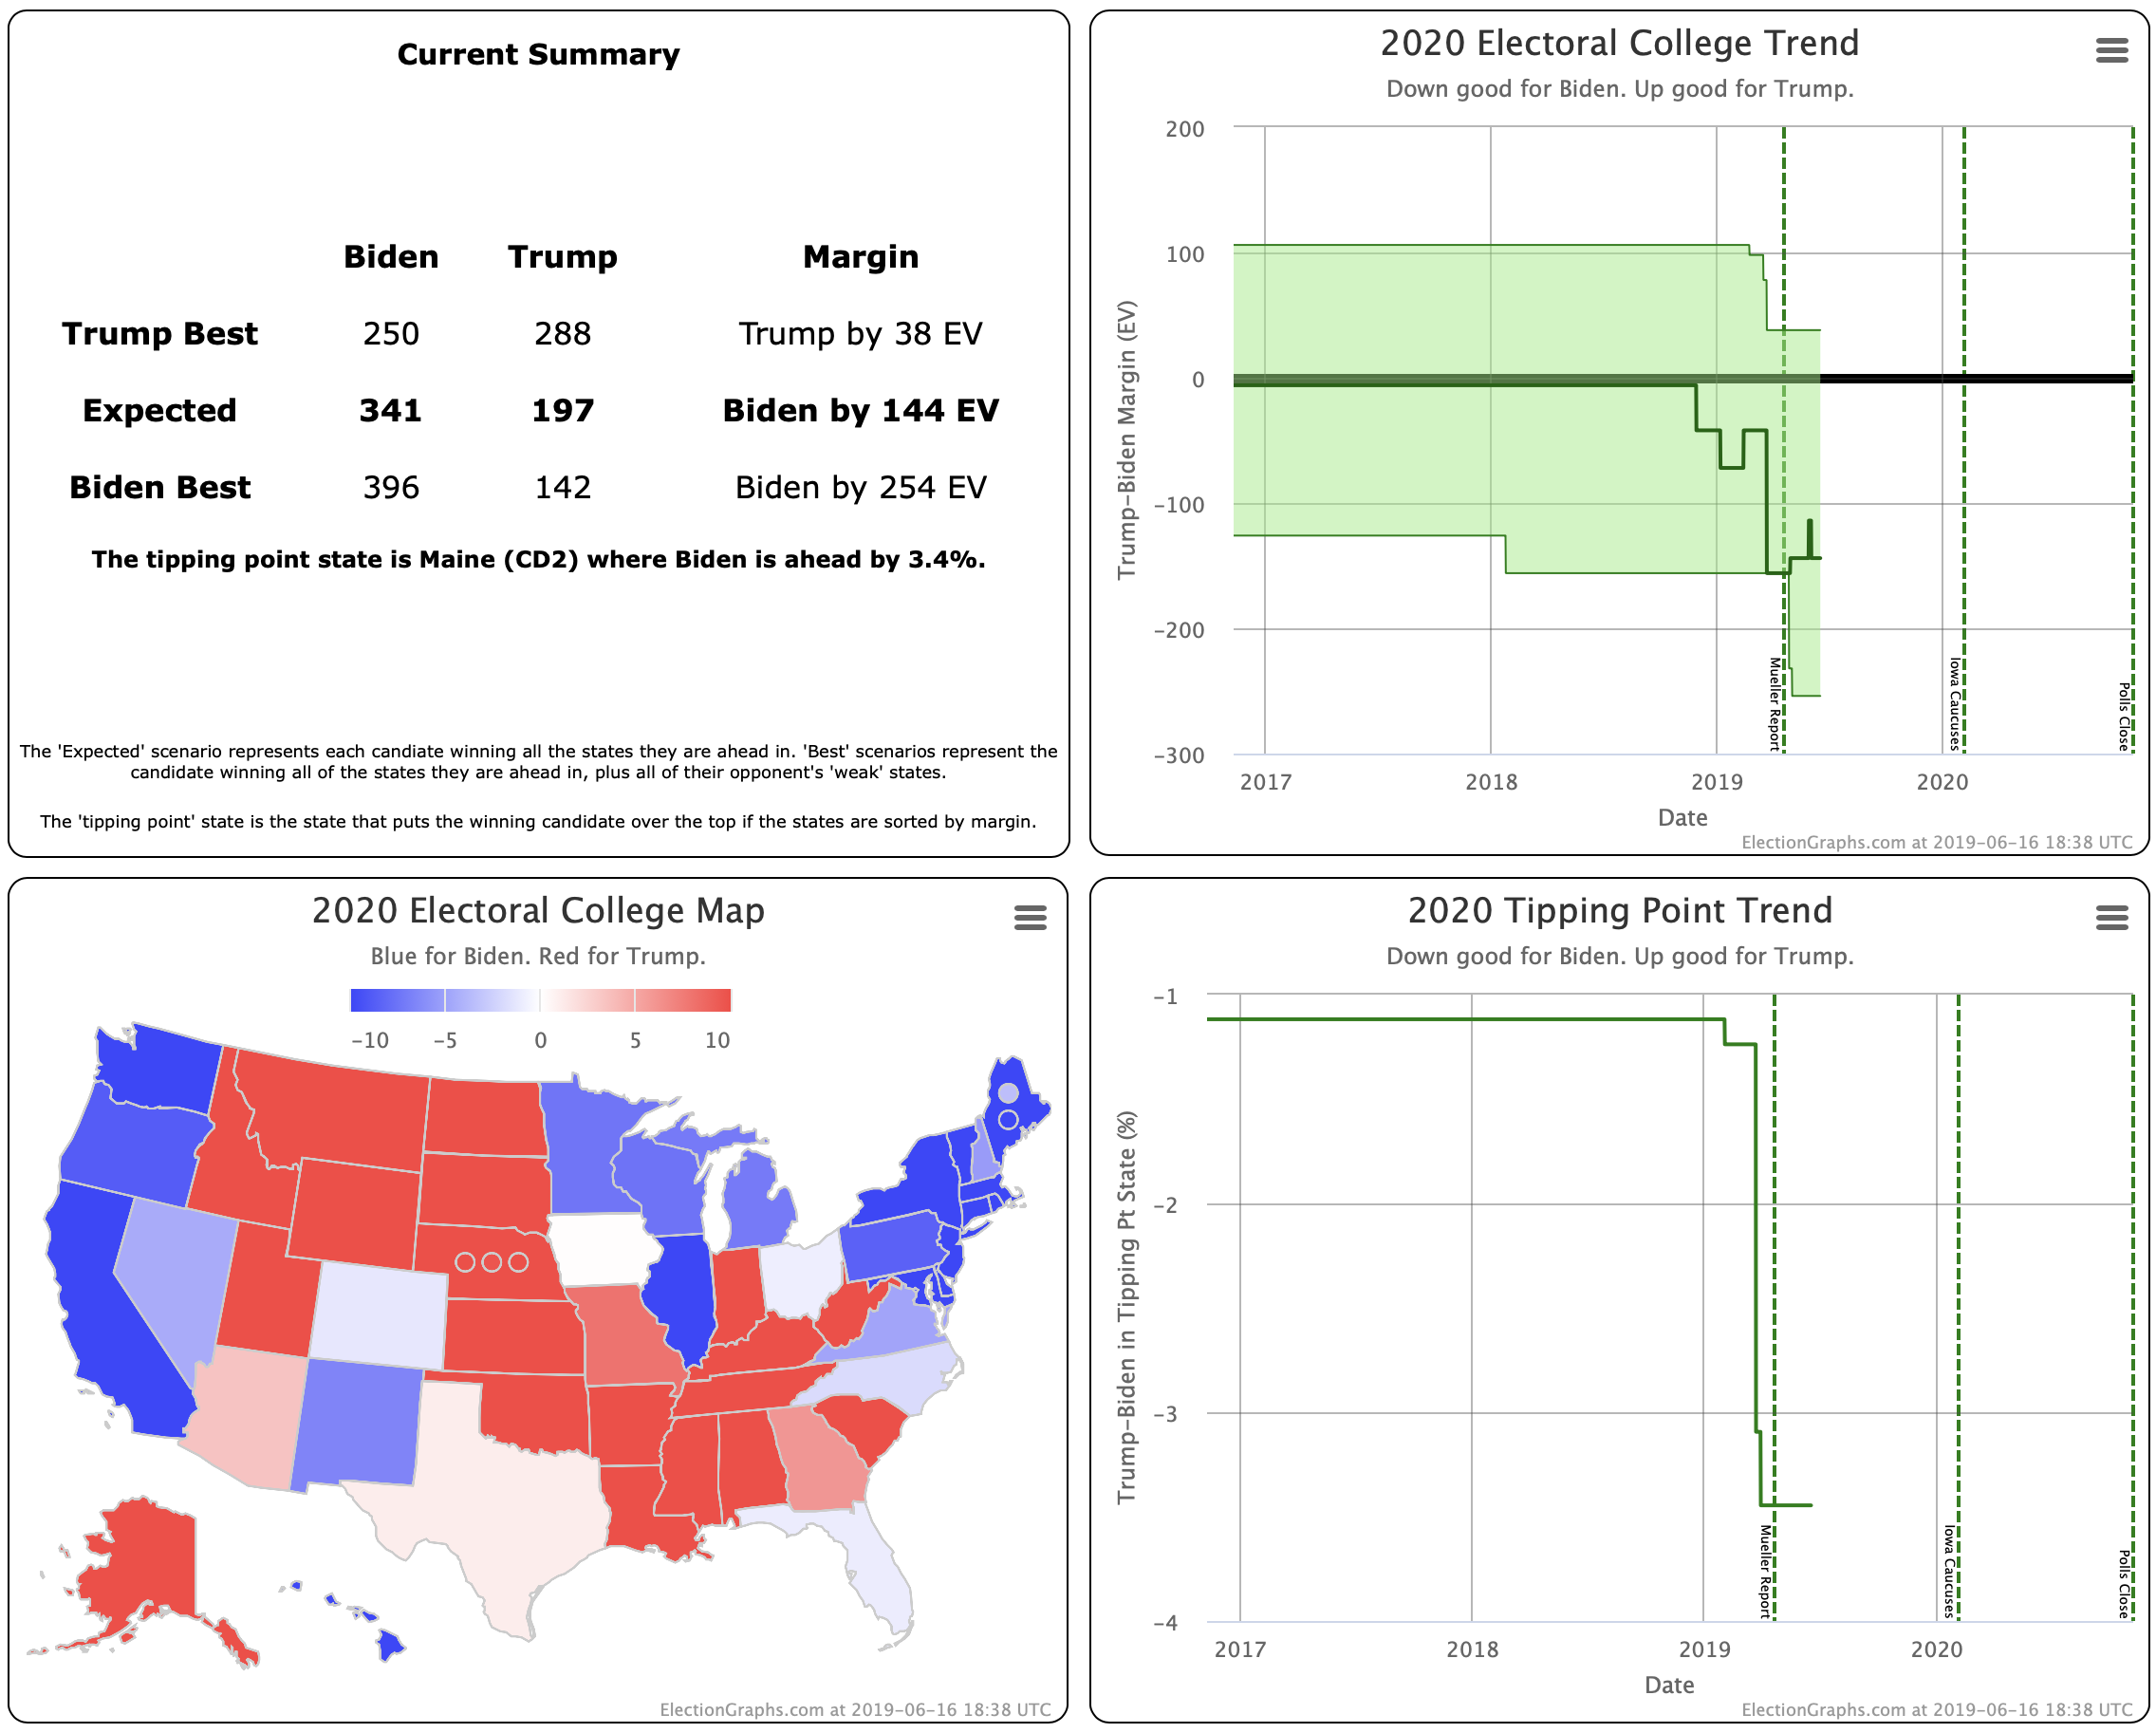
Rather than going graph by graph, here is the whole summary block from the Biden versus Trump page. The two charts on the right show a clear trend toward Biden.
Now, we are still at the stage where most states don't have five polls yet, so we are filling in data based on previous general election results when constructing state averages. So it is crucial to note that this "movement" is mostly not representing changes in public opinion yet, but rather is reflecting the increasing knowledge over time of what Biden vs. Trump looks like specifically, rather than a generic Democrat vs. Republican based on the average historical results from 2000 to 2016.
So the trend may not represent people flocking to Biden over the last few months, but instead, it shows that the more polls we get in more states, the stronger Trump looks against Trump.
Also important to note that while the "expected case" now has Biden winning by 144 electoral votes, a month before the 2016 election, the "expected case" was a 154 electoral vote win for Clinton. By election day that had slipped to only an eight electoral vote lead. And of course, Trump won by 77 electoral votes. The "expected case" can move very quickly, and does not give the whole picture anyway.
Similarly, the tipping point is now a 3.4% Biden lead, while less than two weeks before the election, Clinton had a 5.4% tipping point lead. That evaporated to 1.6% in the last two weeks, and the actual tipping point in the election was an 0.8% Trump margin.
So Biden looks formidable, but Clinton looked even stronger at times.
Also, things can move very quickly even in two weeks, let alone 506 days.
We have a long way to go.
OK, now the two states that changed categories in this update:
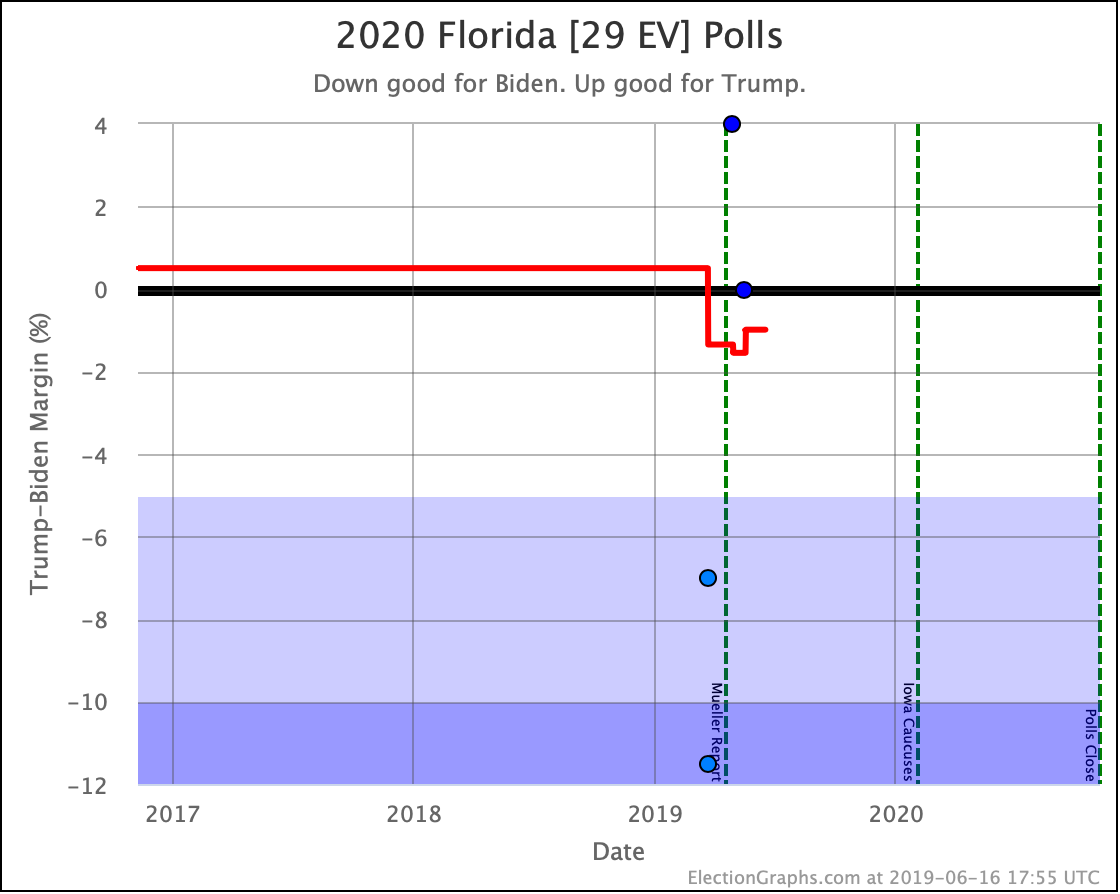
Including the two slightly different versions of the Trump internals leak as one averaged result, there have only been three Biden vs. Trump polls in Florida so far. And they cover a vast range. The average (including 2016 and 2008 to round things out) is a 1.0% Biden lead.
This lead translates into about a 55.6% chance of a Biden win, and a 44.4% chance of a Trump win.
As usual, Florida is a swing state.
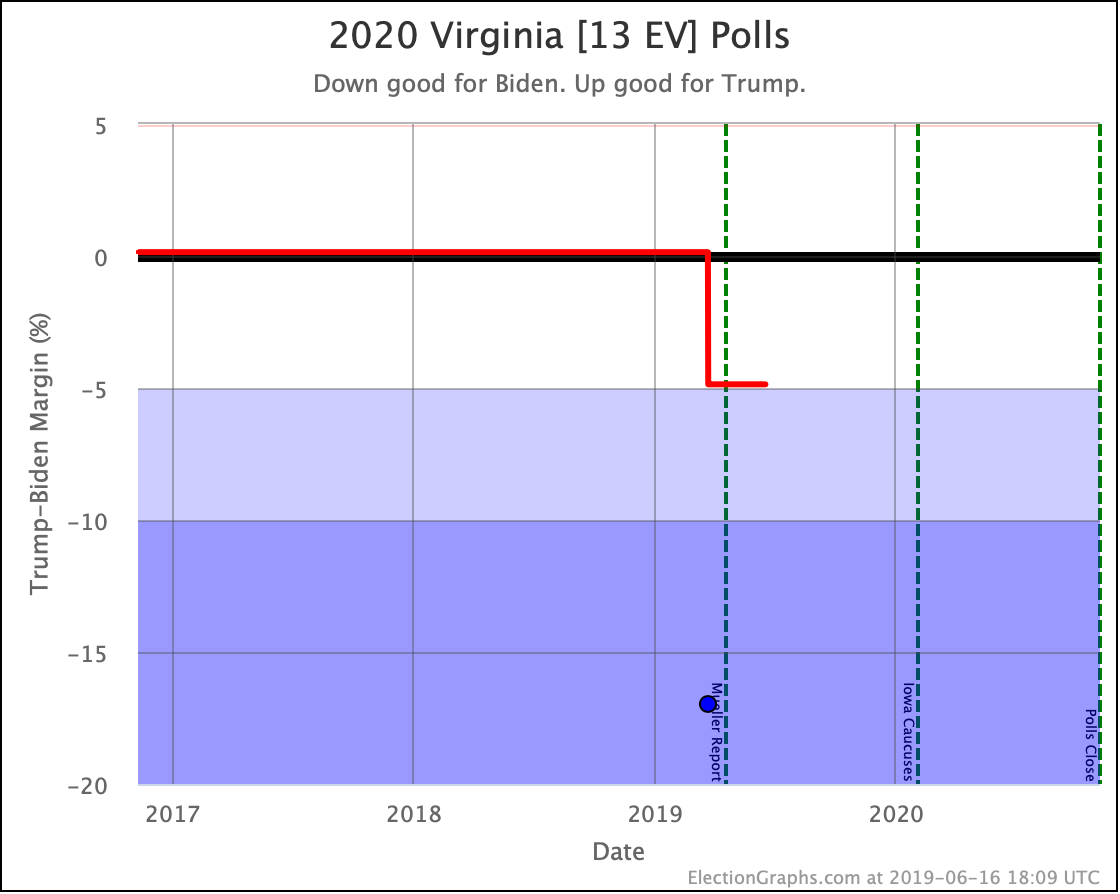
The Trump internals leak is the very first 2020 polling for Virginia. From 2000-2016, there had been 3 Democratic wins, and 2 Republican wins. The average had been a very narrow 0.1% Republican lean for Virginia.
With this new poll, the 8.0% margin Republican win from 2000 slips off the average and a 17.0% lead for Biden enters. That's quite a swing! As a result, the current poll average moves to a 4.9% Biden lead, which translates into a 90.9% chance of winning the state.
And now, quickly, the other states with Biden vs. Trump polls in this update that did not change category:
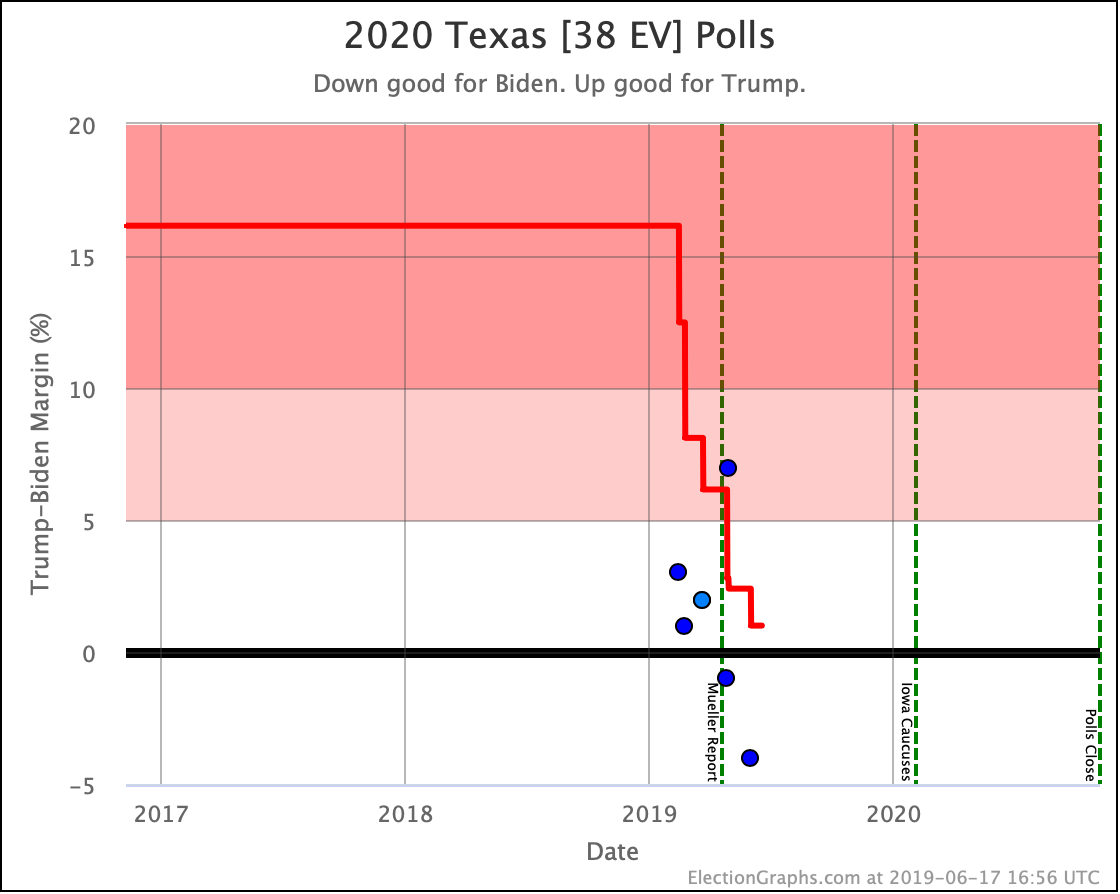
Trump leads in Texas by only 1.0%, which translates into a 66.4% chance of victory if the election was today. Trump is still a favorite in Texas, but that this is even a question is striking in and of itself.
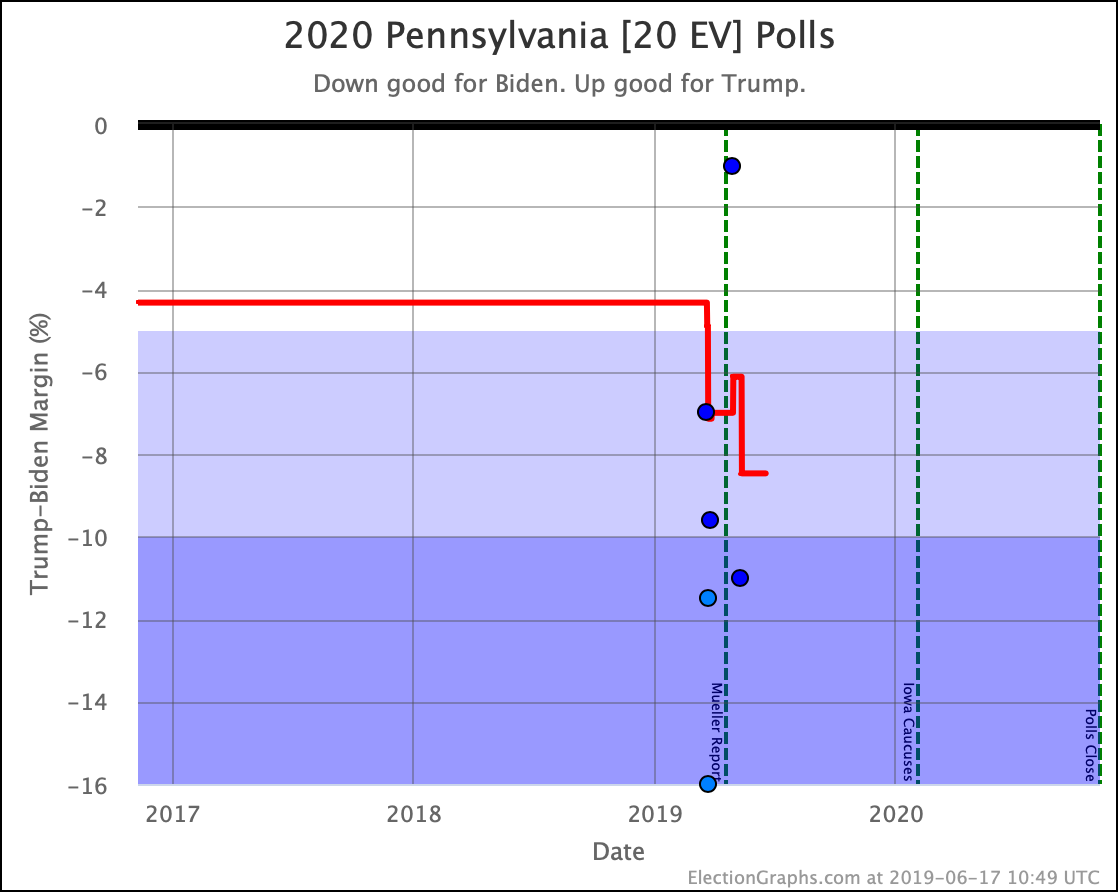
Biden leads by 8.5% in Pennsylvania. That would be a 99.1% chance of winning. (If the election was held today, which of course it is not.)
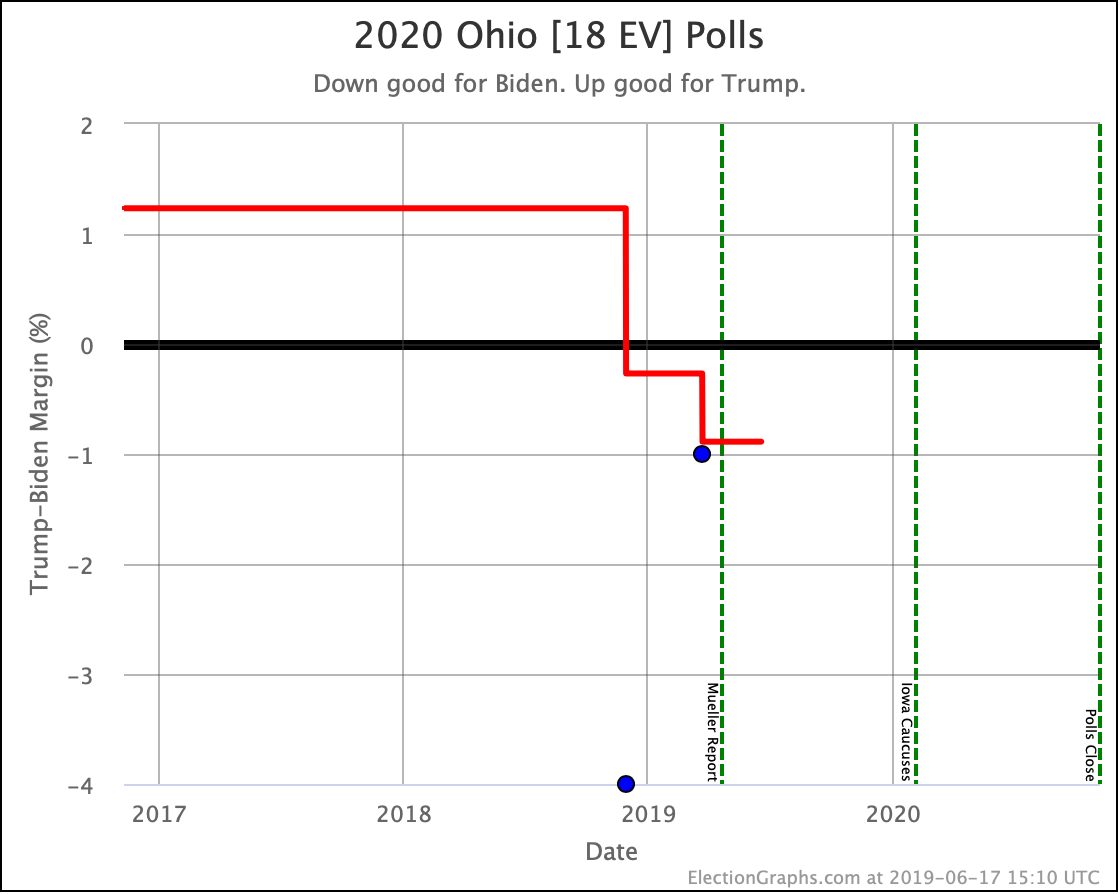
Biden leads by 0.9% in Ohio. 55.3% chance of winning the state.
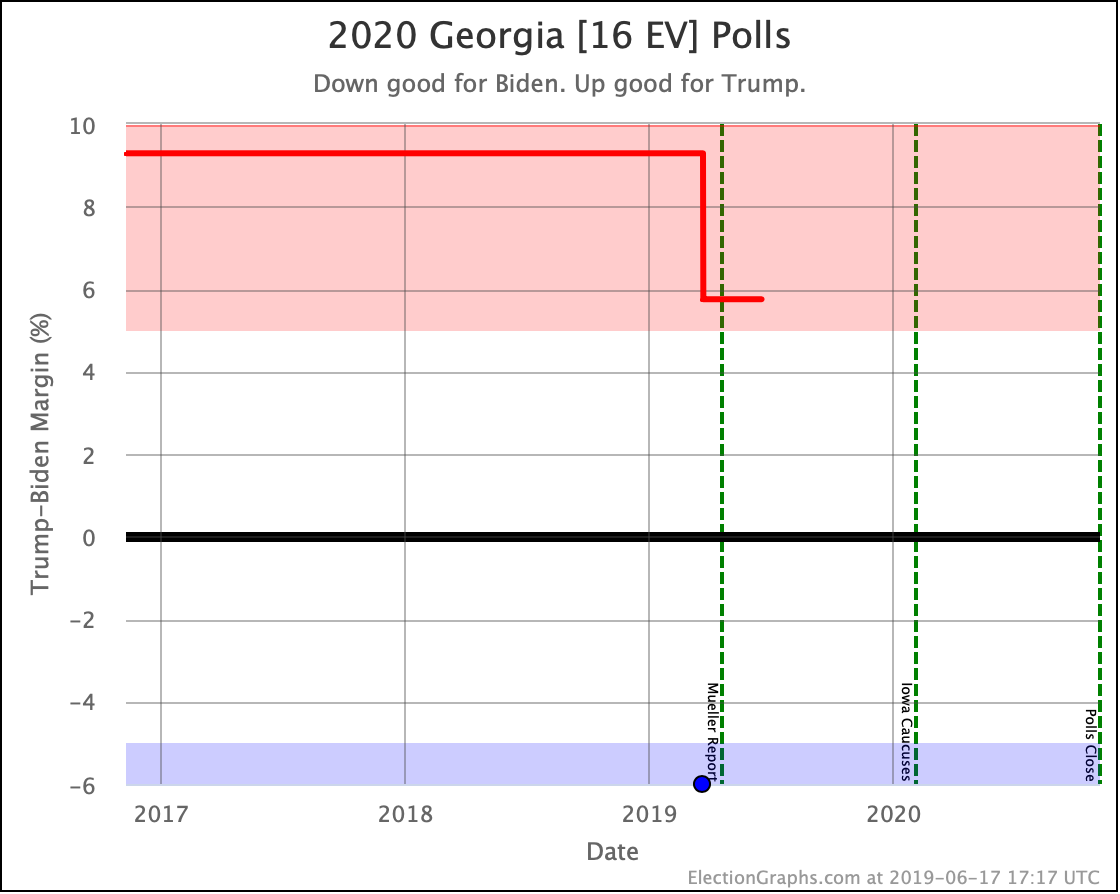
The Trump internal poll was the first Biden vs. Trump polling for Georgia. It shows Biden with a significant lead, but given the historical Republican wins in Georgia, it will take a few more polls showing a Biden lead before the average goes there. For now, the average sits at a 5.8% Trump lead, which is a 98.1% chance of a Trump victory.
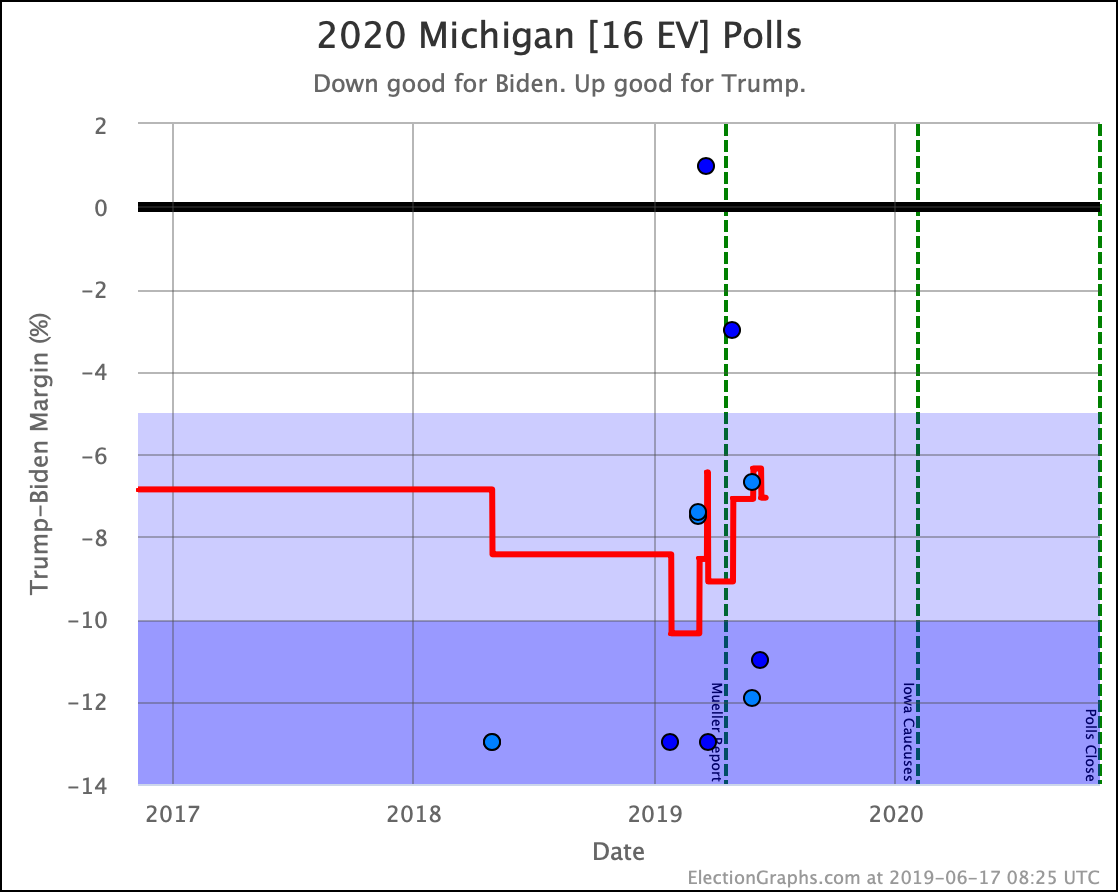
Biden leads by 7.1% in Michigan. 98.8% chance of winning.
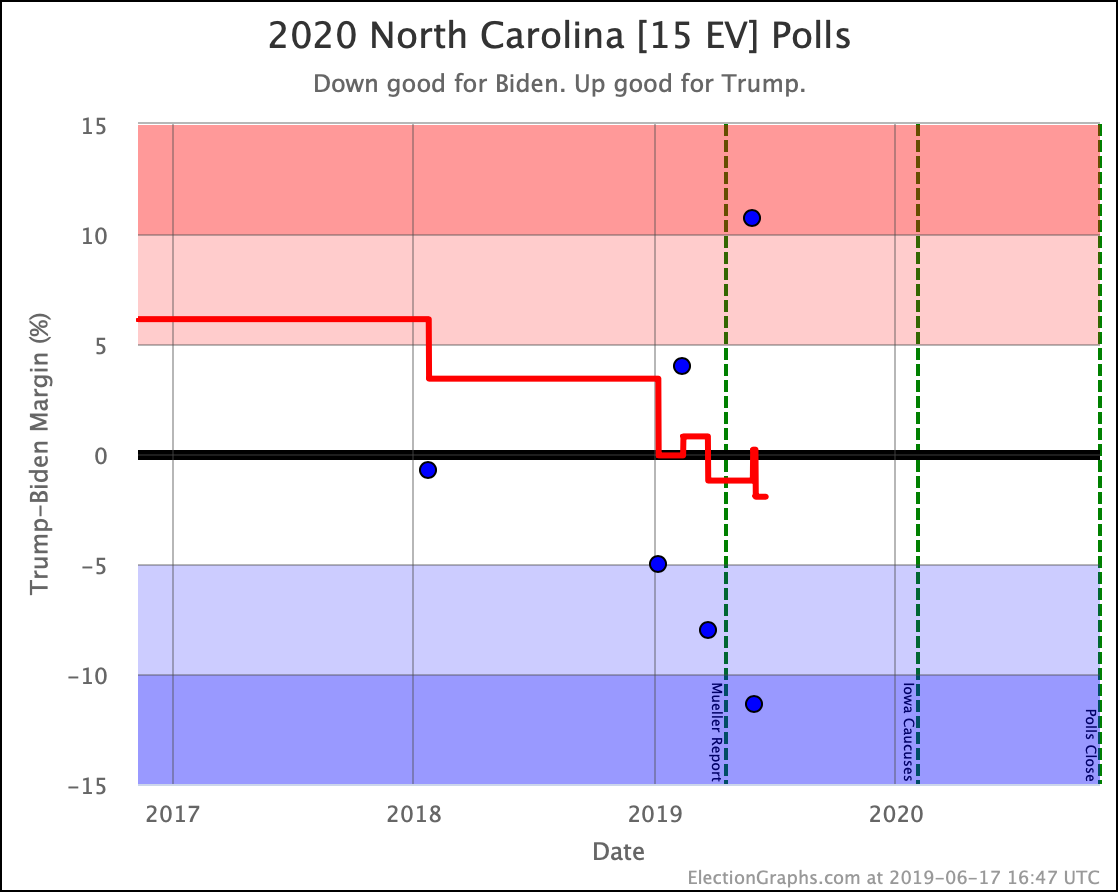
Biden leads by 1.9% in North Carolina. 67.0% chance of winning.
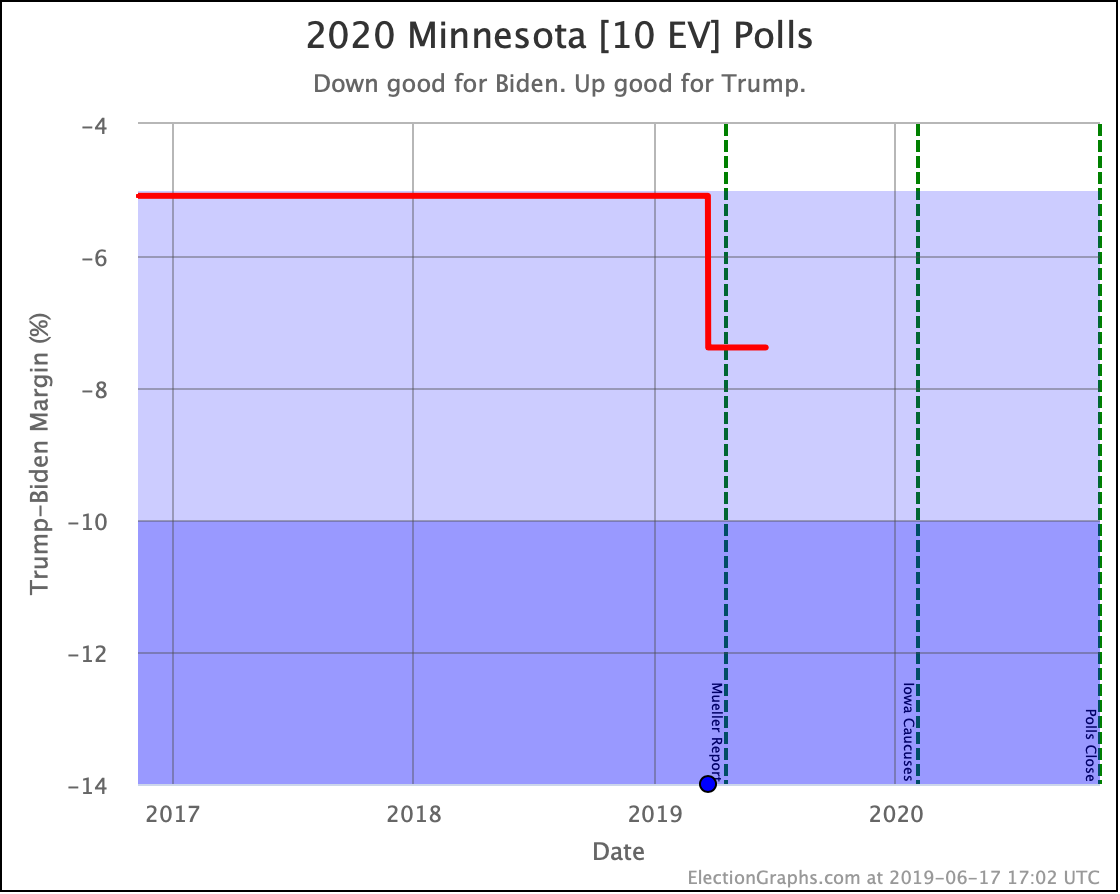
The internal Trump poll is the first Biden vs. Trump polling in Minnesota. Biden is now leading by 7.4%, which would be a 99.1% chance of winning.
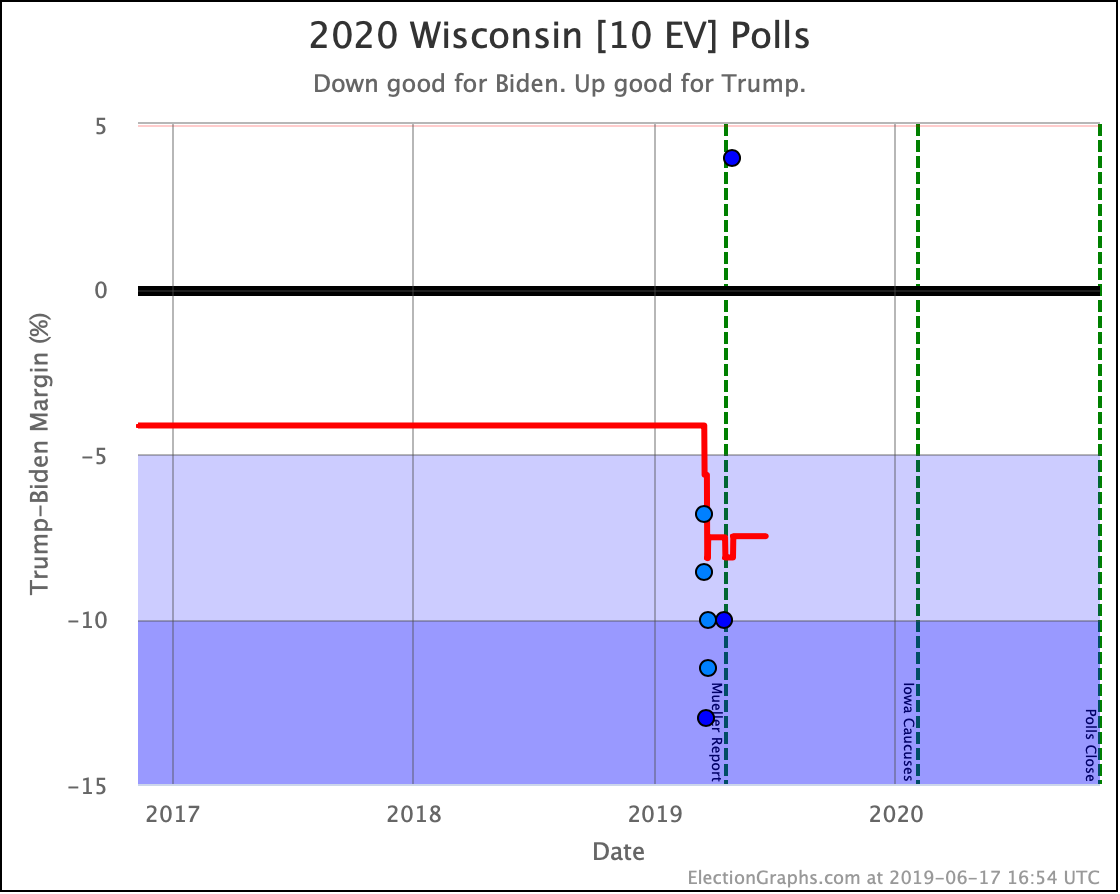
Biden leads by 7.5% in Wisconsin. 98.3% chance of winning.
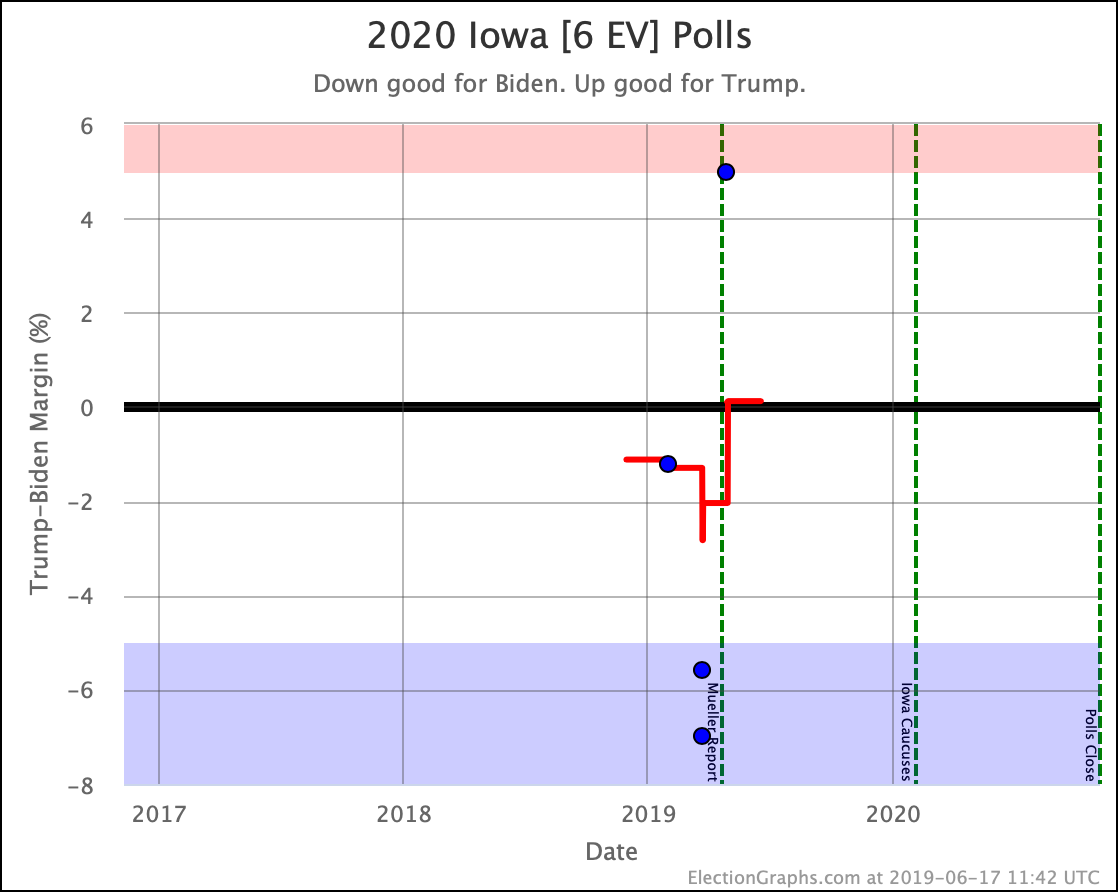
Iowa is currently the closest state in the Biden vs. Trump spectrum of Election Graphs averages, with Trump squeaking out an 0.1% lead, which translates into a 55.1% chance of a Trump win.
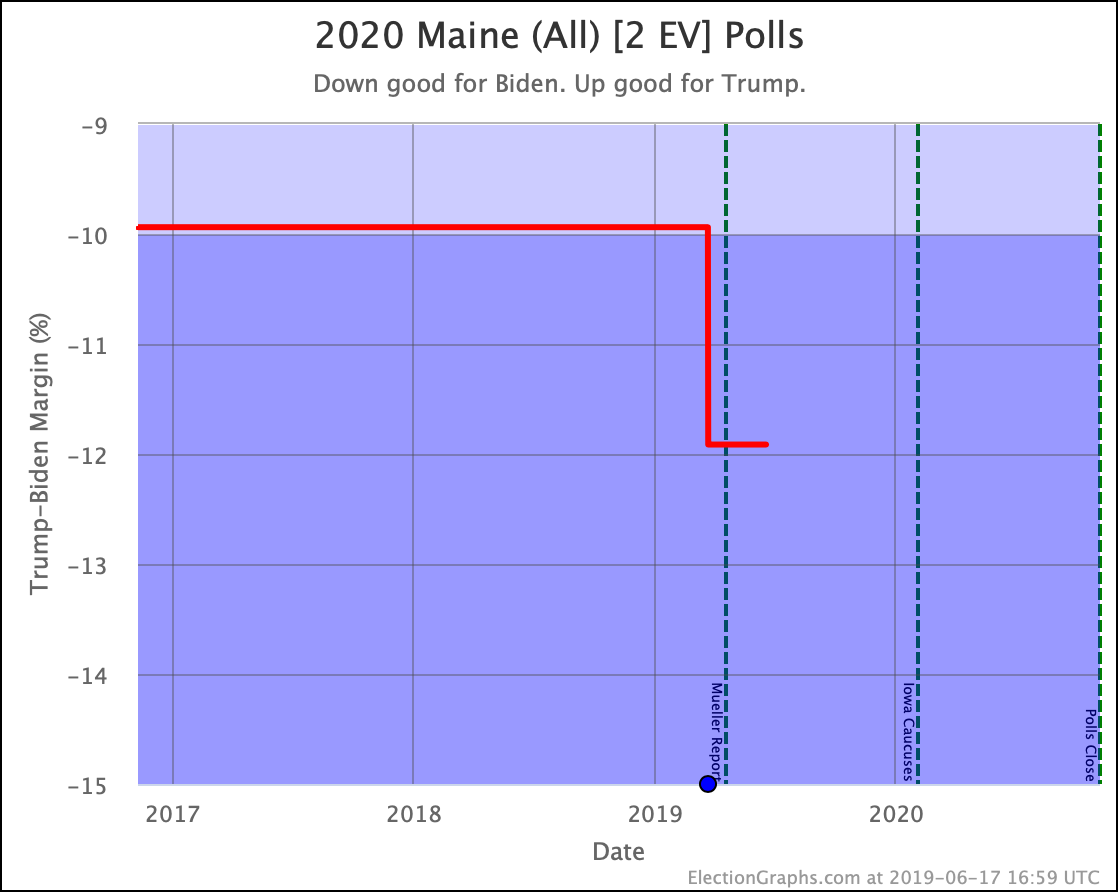
The Trump internal polling was the very first polling on Maine. Biden is looking stronger than the historical average for Maine general elections. Biden is leading by 11.9%, which translates into a 100.0% chance of winning the state.
There were also polling results in New York (from Spry, not Trump's internal polling), but only for Gillibrand and de Blasio, who aren't in our "top five matchups against Trump" list that I discuss here on the blog. It was also heavily blue New York, and the results were unsurprising.
So finally, an updated look at how where the Monte Carlo simulation puts the Trump vs. Biden race after this update. As usual:
- This simulation is "if the election was held today," which it is not.
- The model uses the past accuracy of the final Election Graphs averages in the 2008-2016 elections to estimate poll-average reliability in 2020. It is always possible that polling accuracy in 2020 will differ in important ways from previous election cycles.
- We still have very sparse polling, and many states have averages that are based in whole or in part on election results from 2000 to 2016 rather than actual 2020 polls.
OK. With that out of the way, a Monte Carlo simulation with 1,000,001 trial election runs:
- Median result: Biden by 110
- 1𝜎 (68.3%) range: Biden by 168 to Biden by 56
- 2𝜎 (95.4%) range: Biden by 220 to Biden by 12
- 3𝜎 (99.7%) range: Biden by 254 to Trump by 24
Expressing the results as win odds instead:
- Biden win: 99.1%
- Trump win: 0.7%
- 269-269 tie: 0.2%
Ouch, this last set of polls, mostly the Trump internal points, really hurt for Trump. That 0.7% chance of a Trump win is down significantly from the 6.2% in the last update.
Should I repeat the caveats? The results above may look good for Biden, but it is still a long time until the election, and things will change.
Actually, they already have.
Because I had other things to do, it took me a couple of days to get this blog post done, and in the meantime, there have been new polls in five states. I'll be updating the site with the new data shortly, and will be back with another blog post if there are notable changes to mention.
503.9 days until polls start to close.
For more information:
This post is an update based on the data on the Election Graphs Electoral College 2020 page. Election Graphs tracks a poll-based estimate of the Electoral College. The charts, graphs, and maps in the post above are all as of the time of this post. Click through on any image to go to a page with the current interactive versions of that chart, along with additional details.
Follow @ElectionGraphs on Twitter or Election Graphs on Facebook to see announcements of updates. For those interested in individual poll updates, follow @ElecCollPolls on Twitter for all the polls as I add them. If you find the information in these posts informative or useful, please consider visiting the donation page.
One thought on “Trump Internal Polls All Good News For Biden”