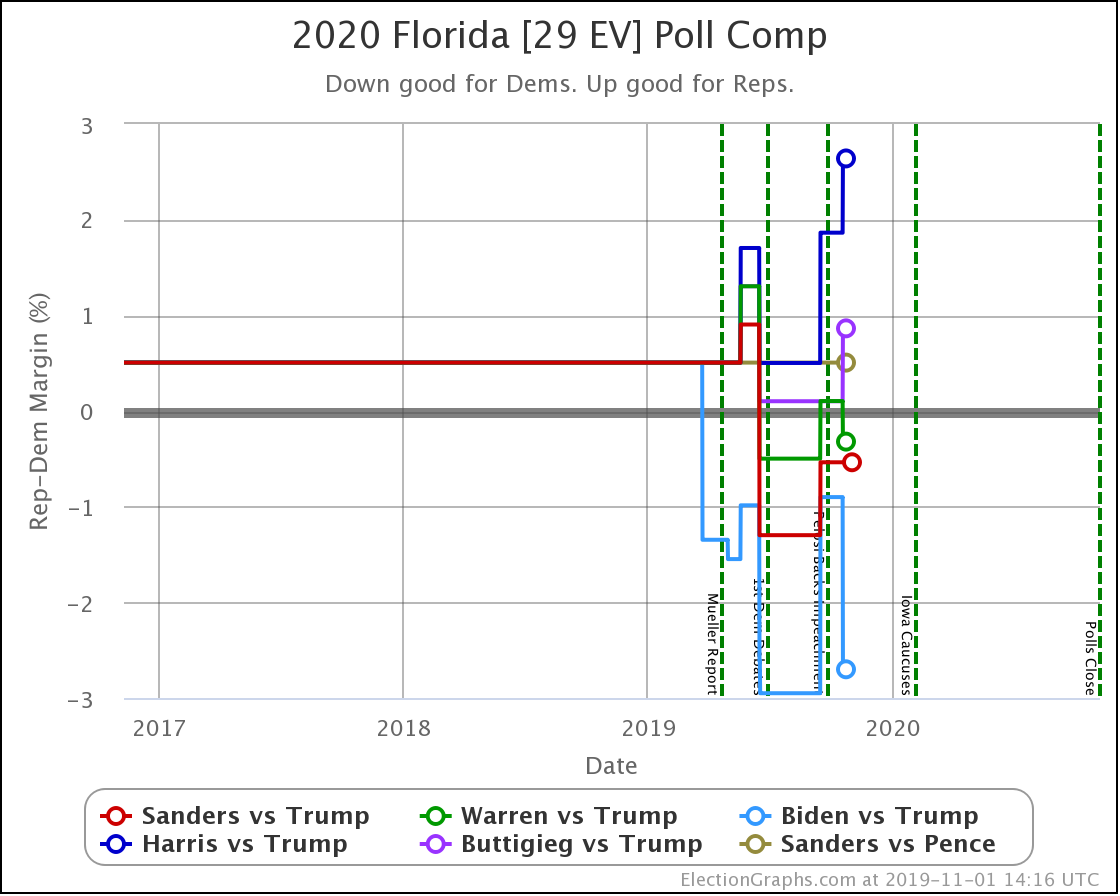
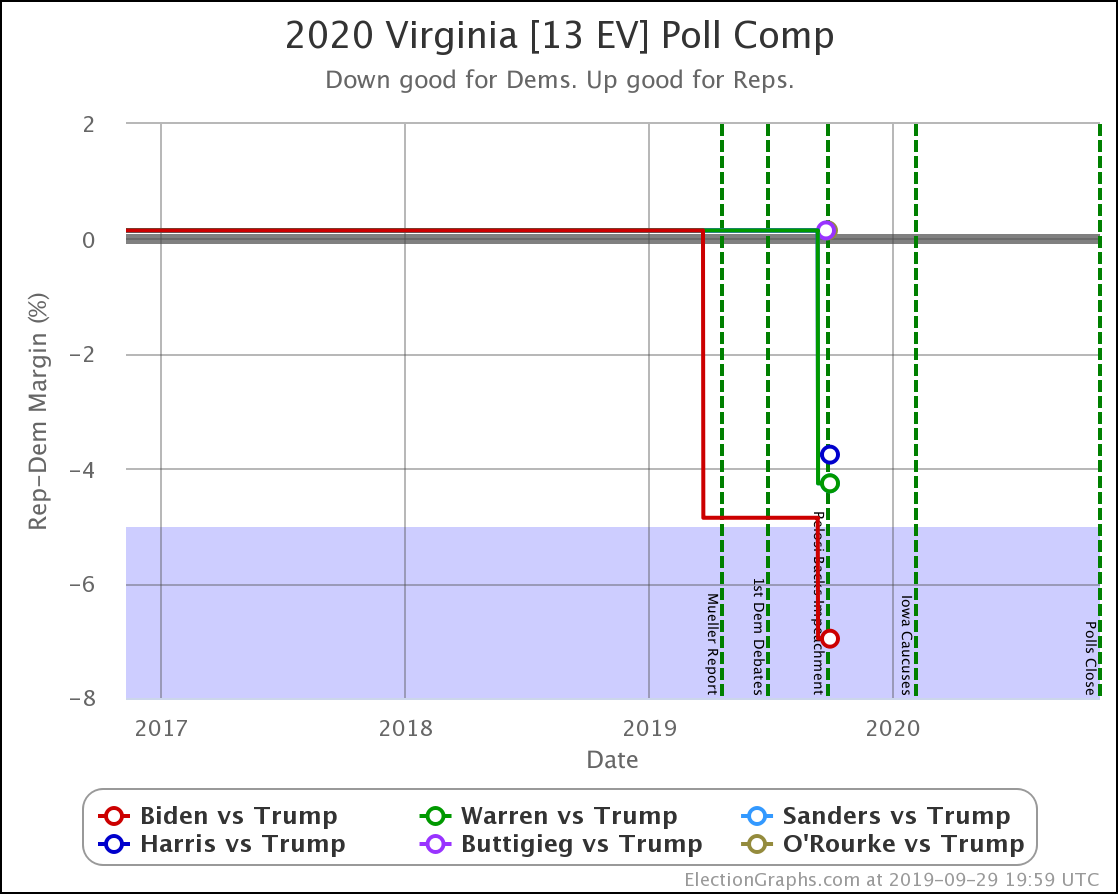
Since the last blog post on December 22nd, there have been two new state-level polls released: one Mason-Dixon poll in Florida and one Mason-Dixon poll in Virginia. Each of these pitted Sanders, Biden, Warren, and Buttigieg against Trump.
From the categorization view, we had the following changes:
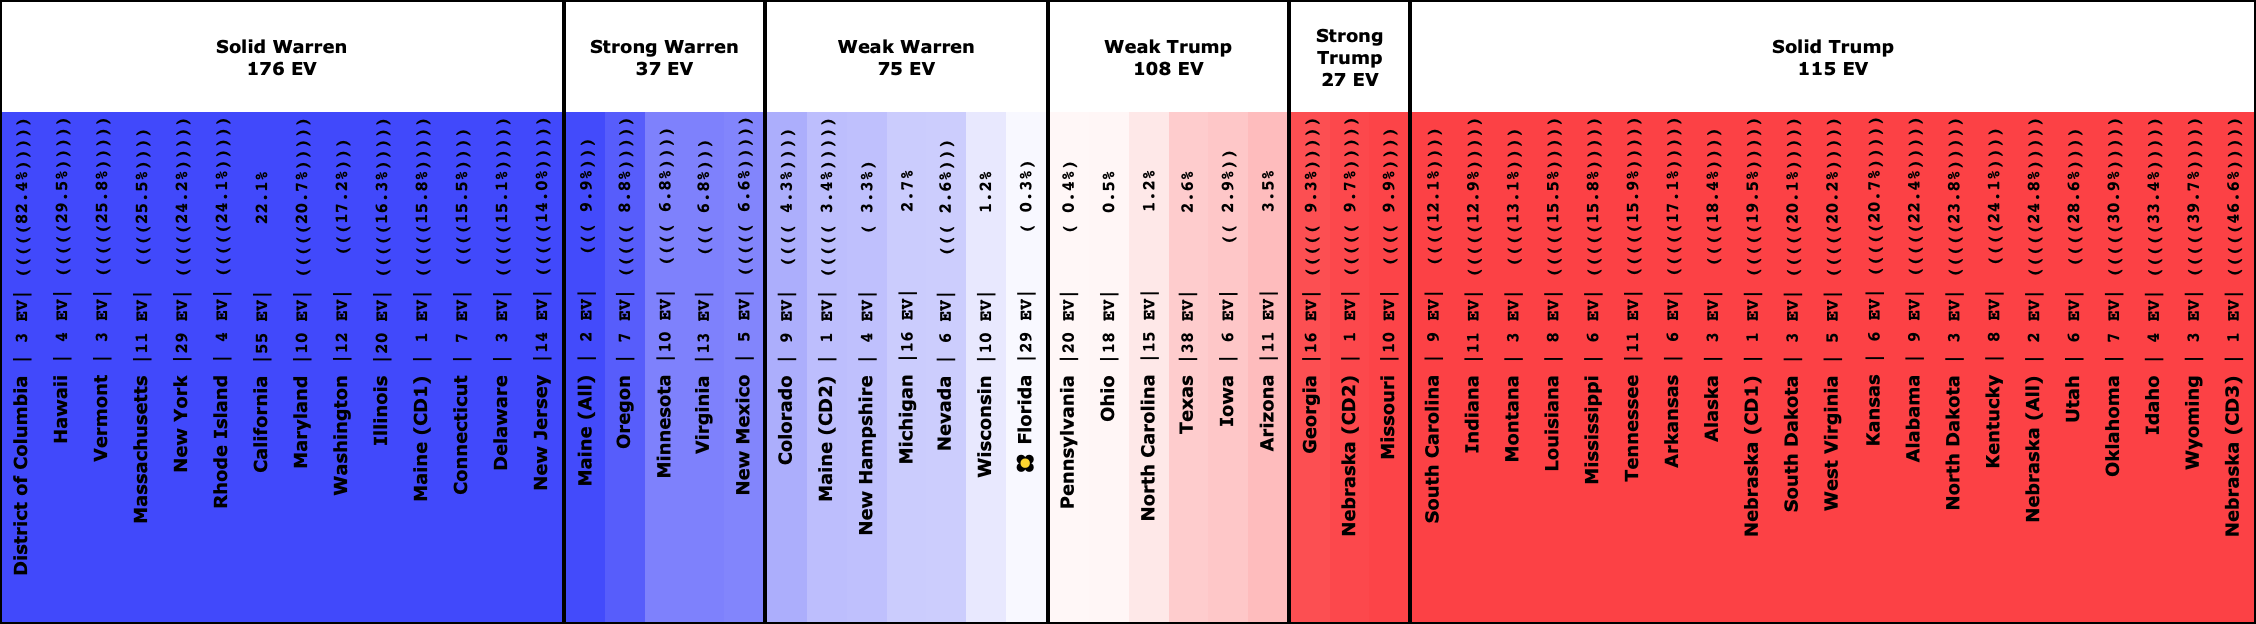
Warren vs Trump:
- State category change: FL has moved from Weak Warren to Weak Trump
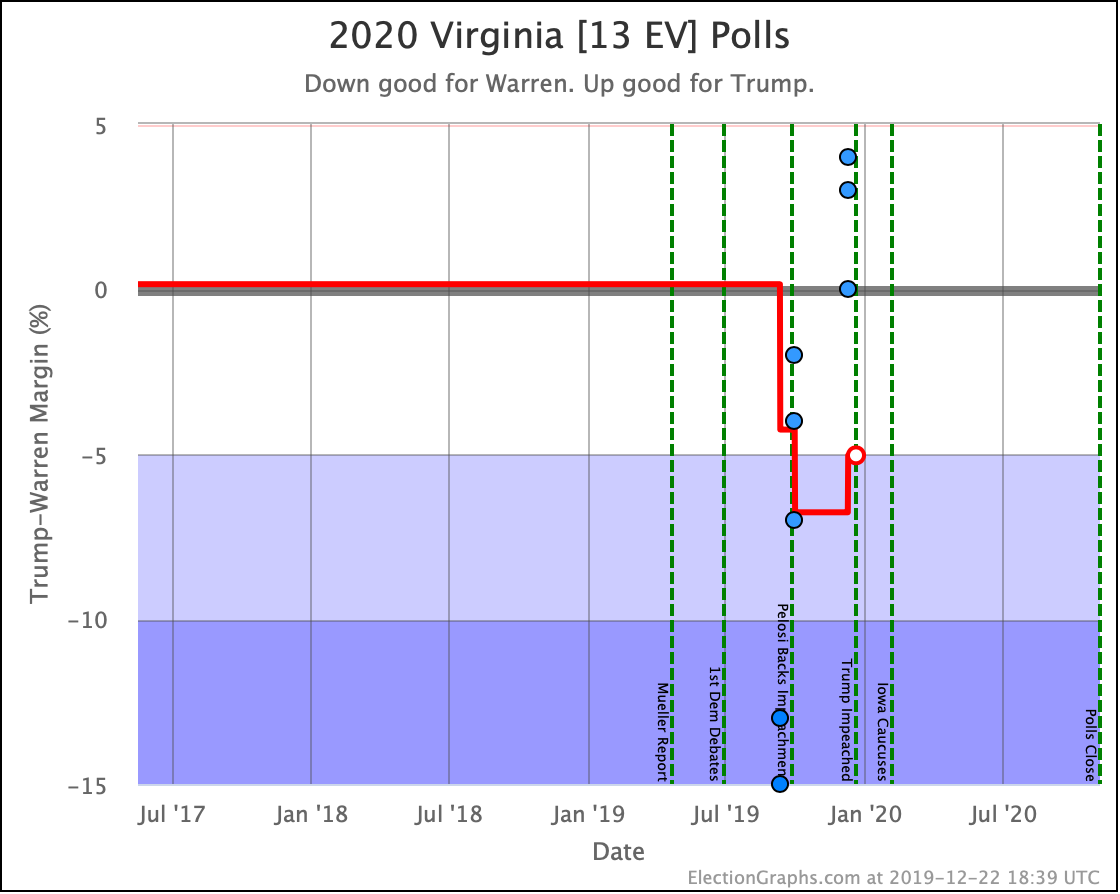
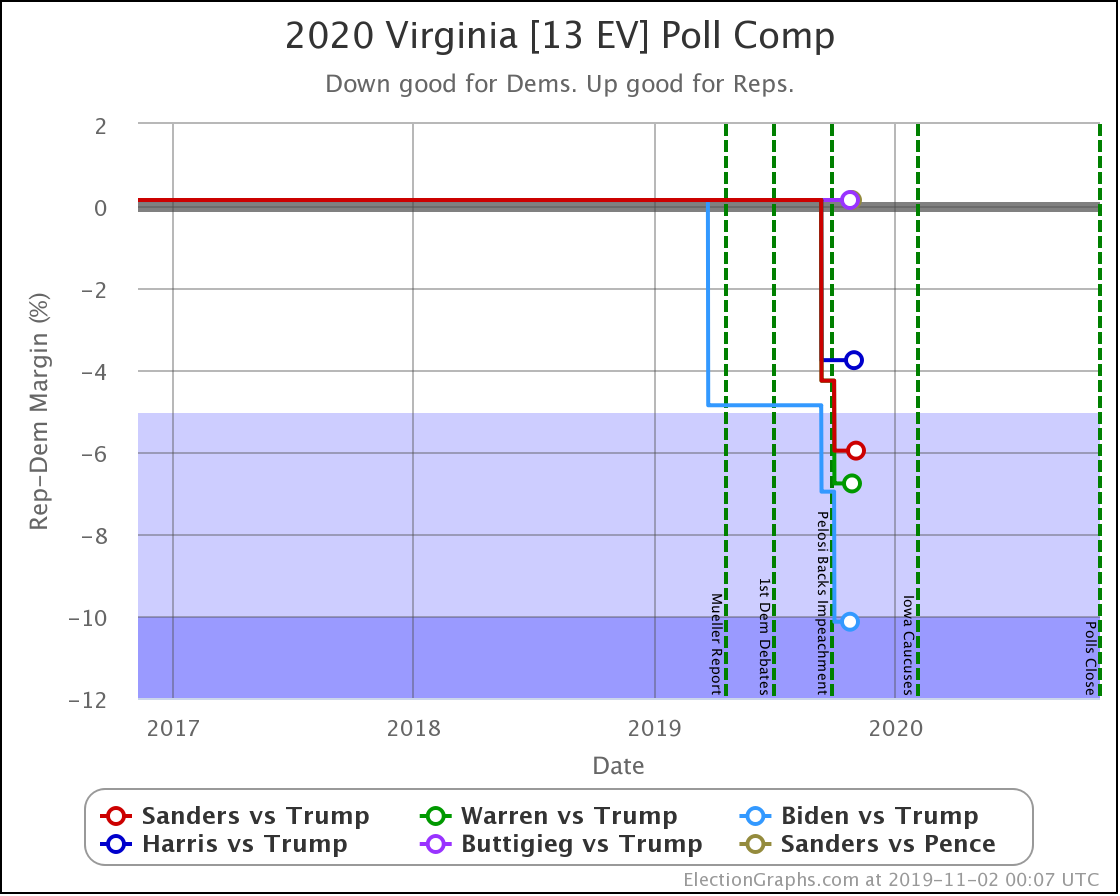
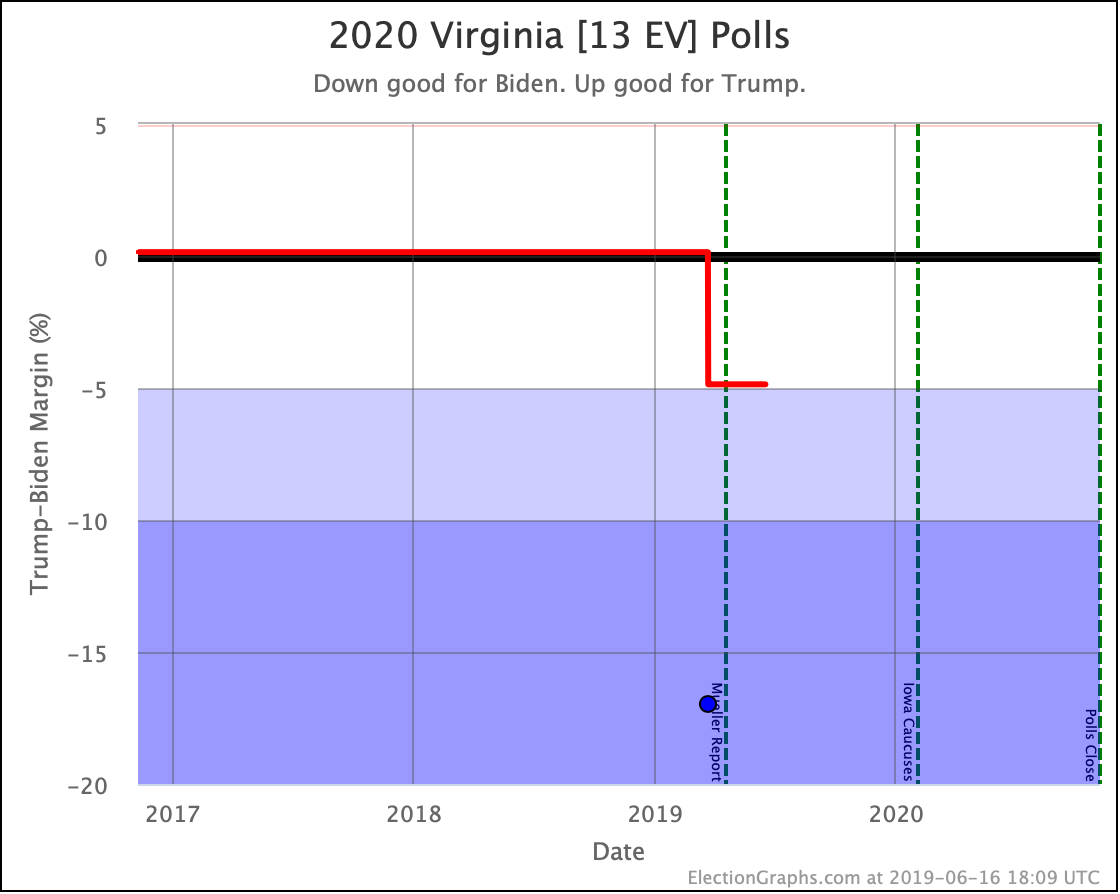
- State category change: VA has moved from Strong Warren to Weak Warren
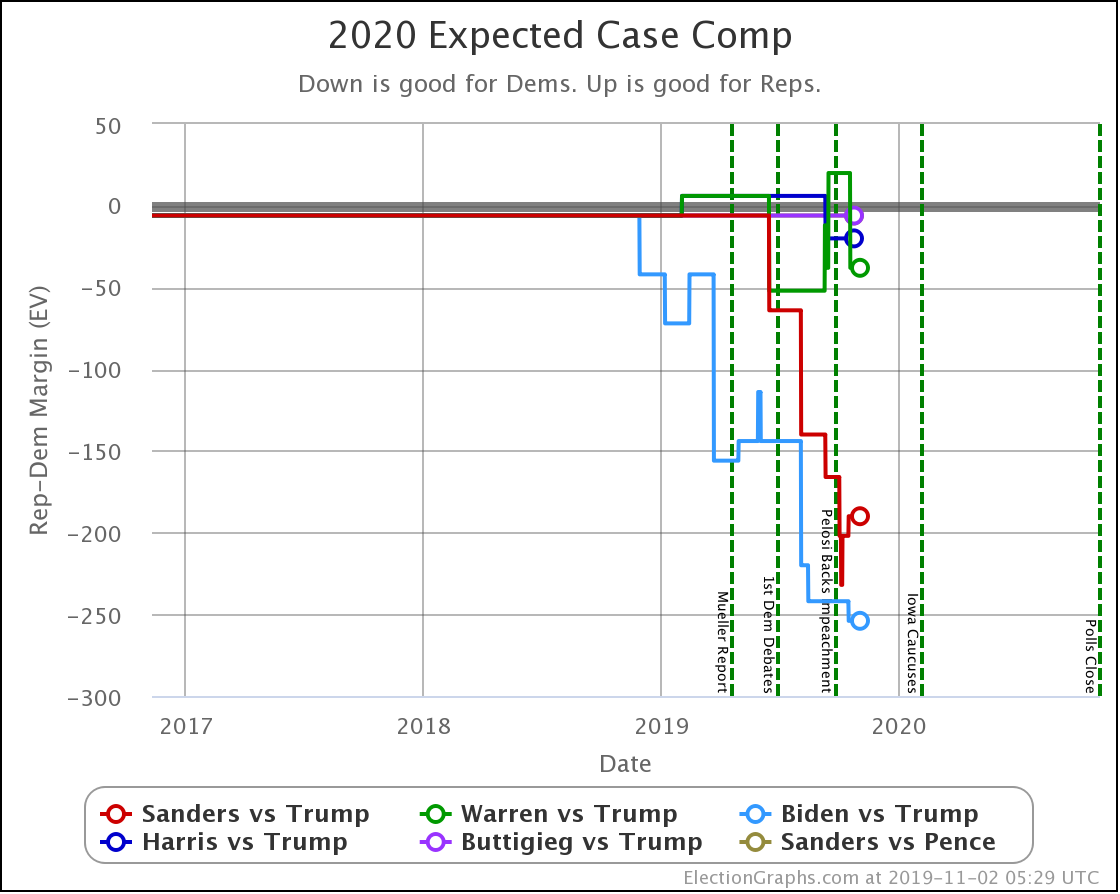
- Expected case change: Warren 276 to Trump 262 -> Warren 247 to Trump 291
- Trump best case vs. Warren has changed: Warren 213 to Trump 325 -> Warren 200 to Trump 338
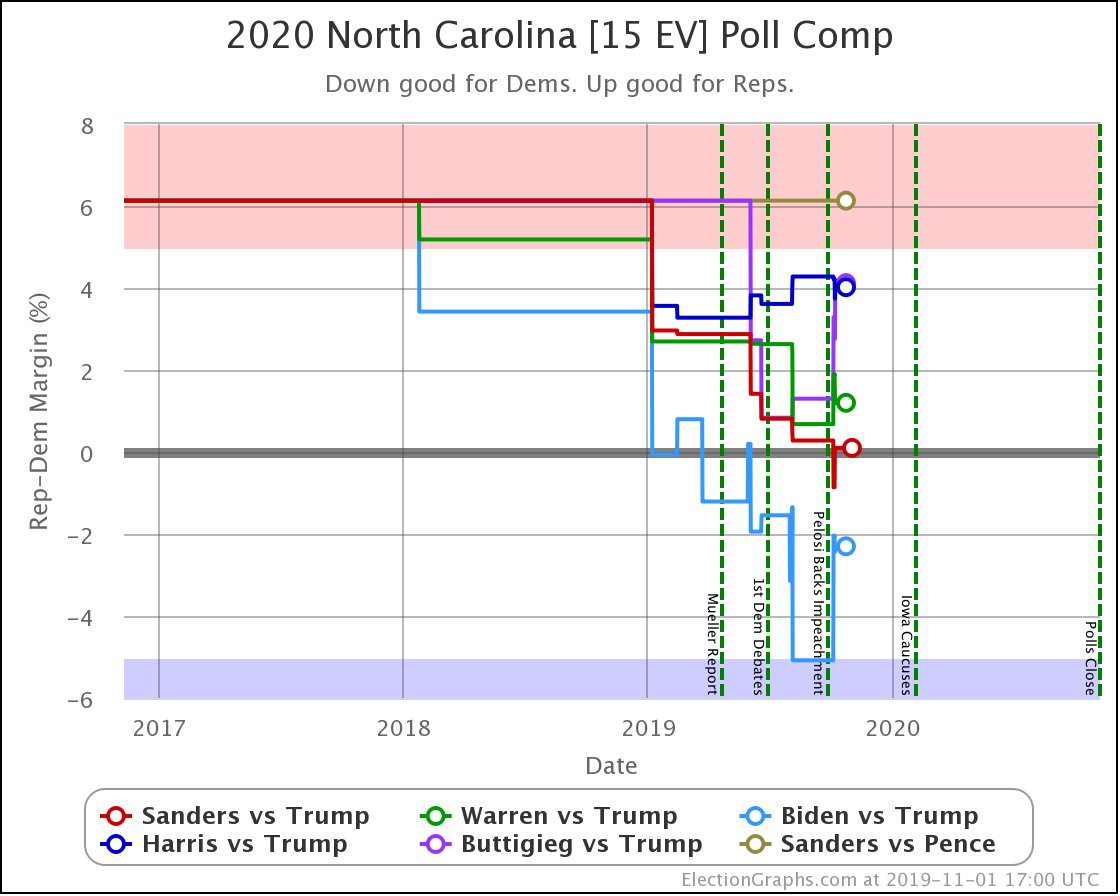
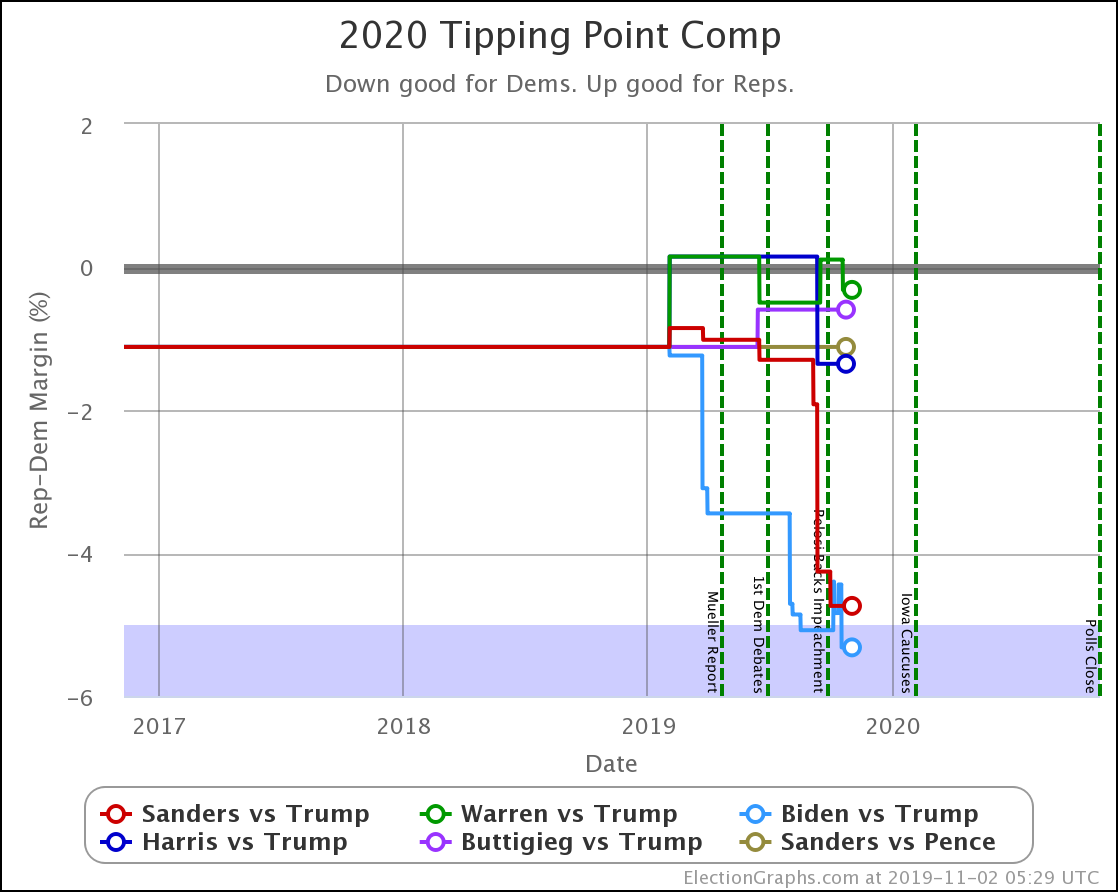
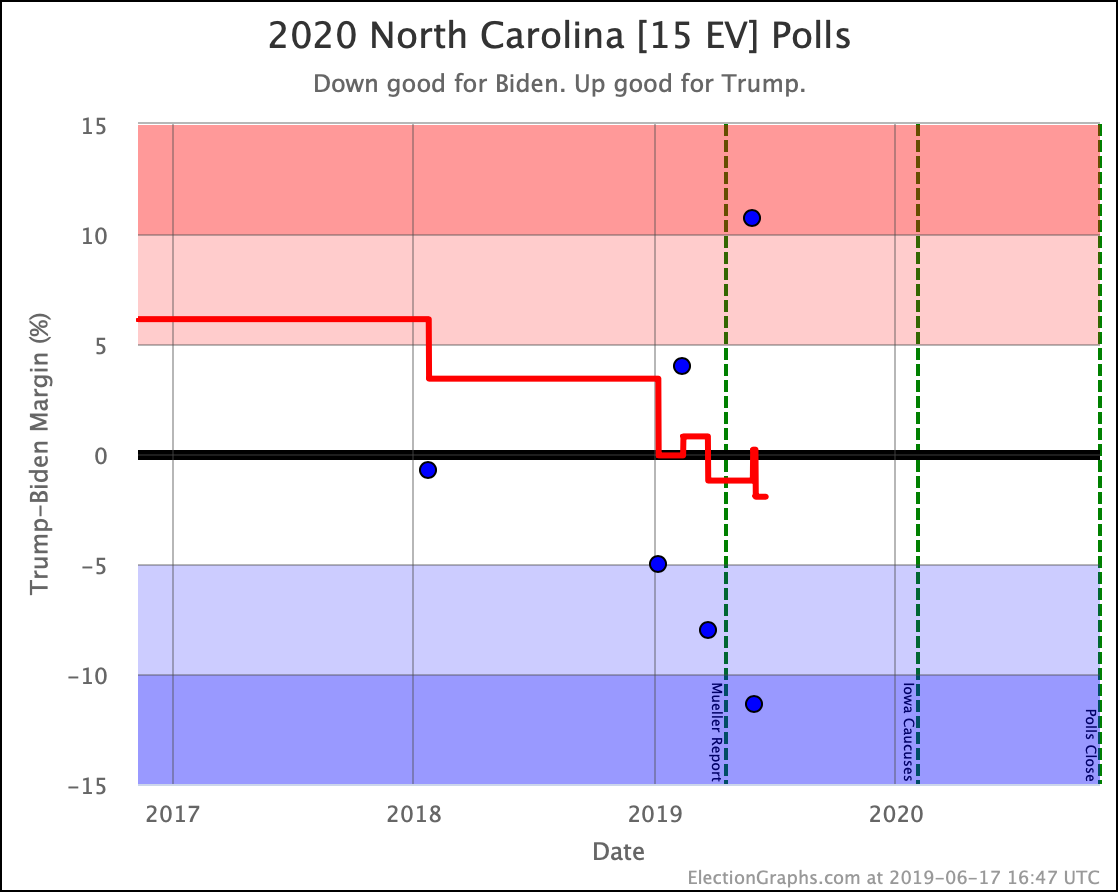
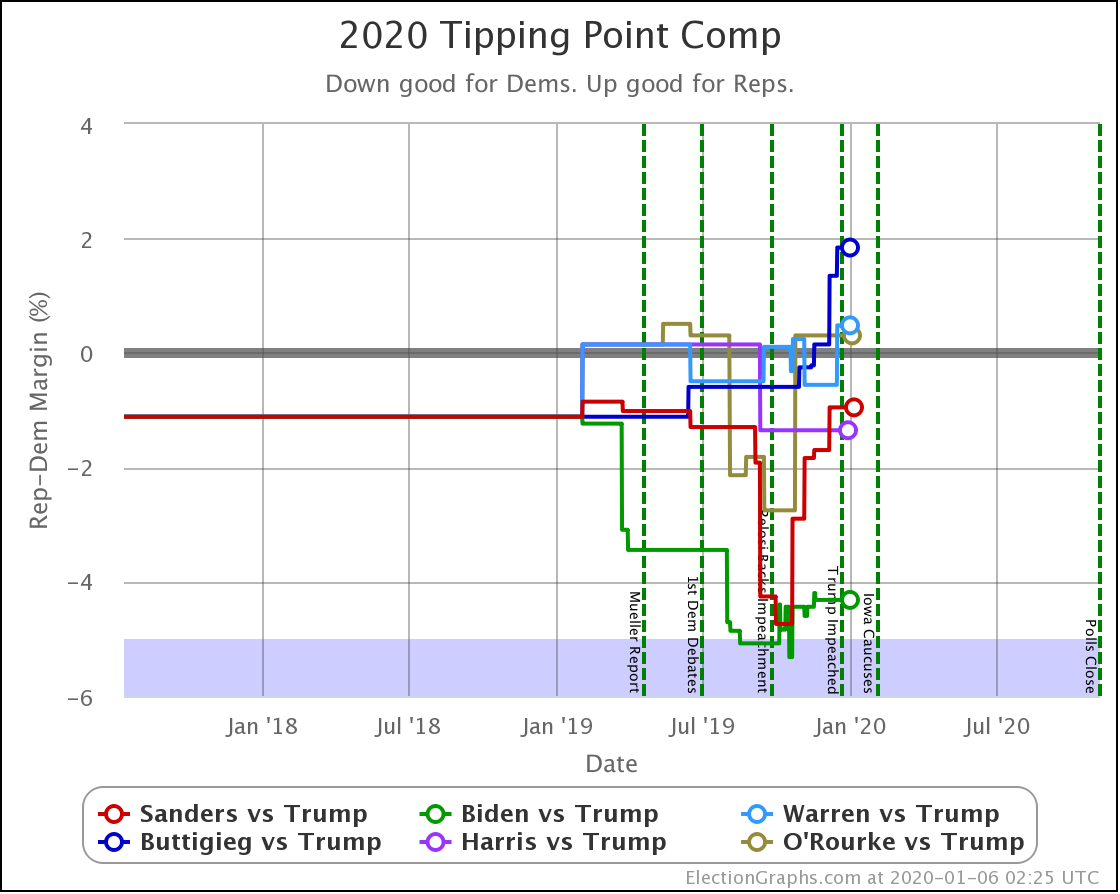
- Tipping point change: Warren by 0.6% in FL -> Trump by 0.5% in NC
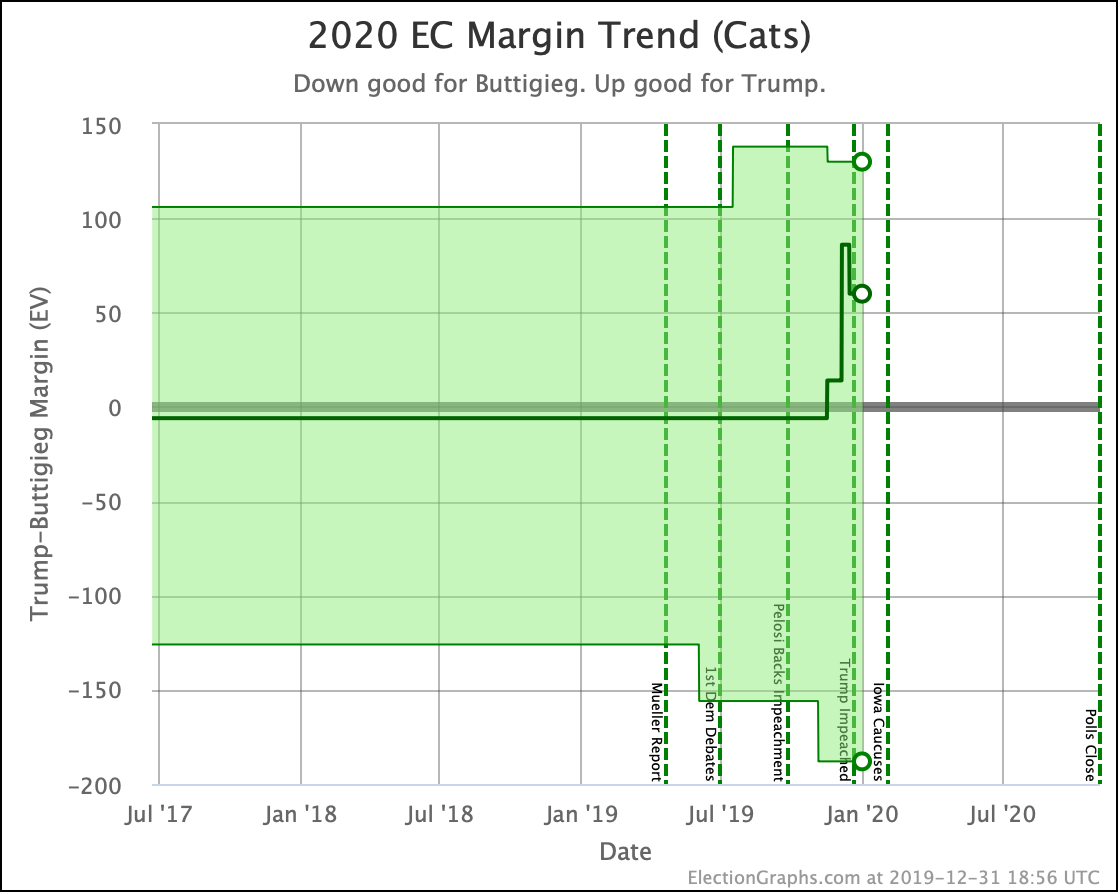
With this, the "envelope" for Warren vs Trump looks like this:
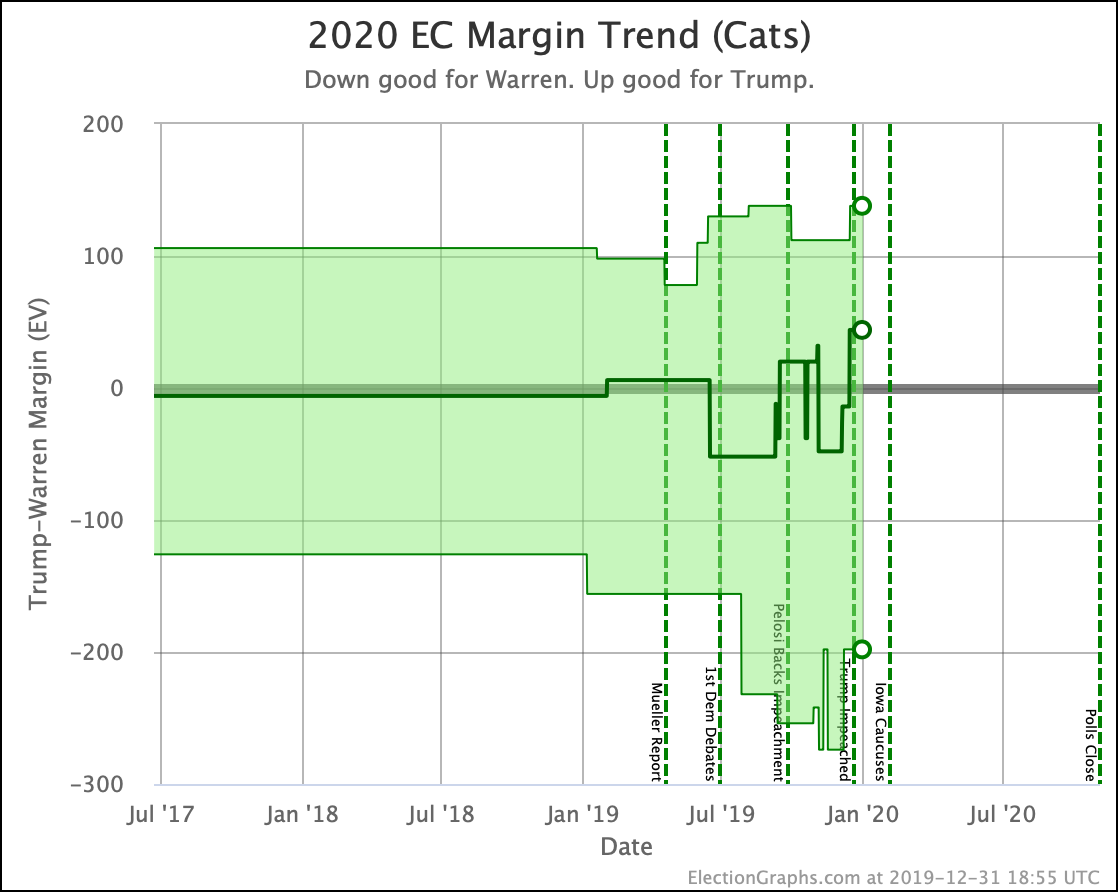
This shows the full swing between all the states with margins under 5% going one way, and all of them going the other way. With Florida flipping back to a 2.0% Trump lead, Warren once again loses the Electoral College if every state is won by the current poll average leader.
The tipping point moves similarly:
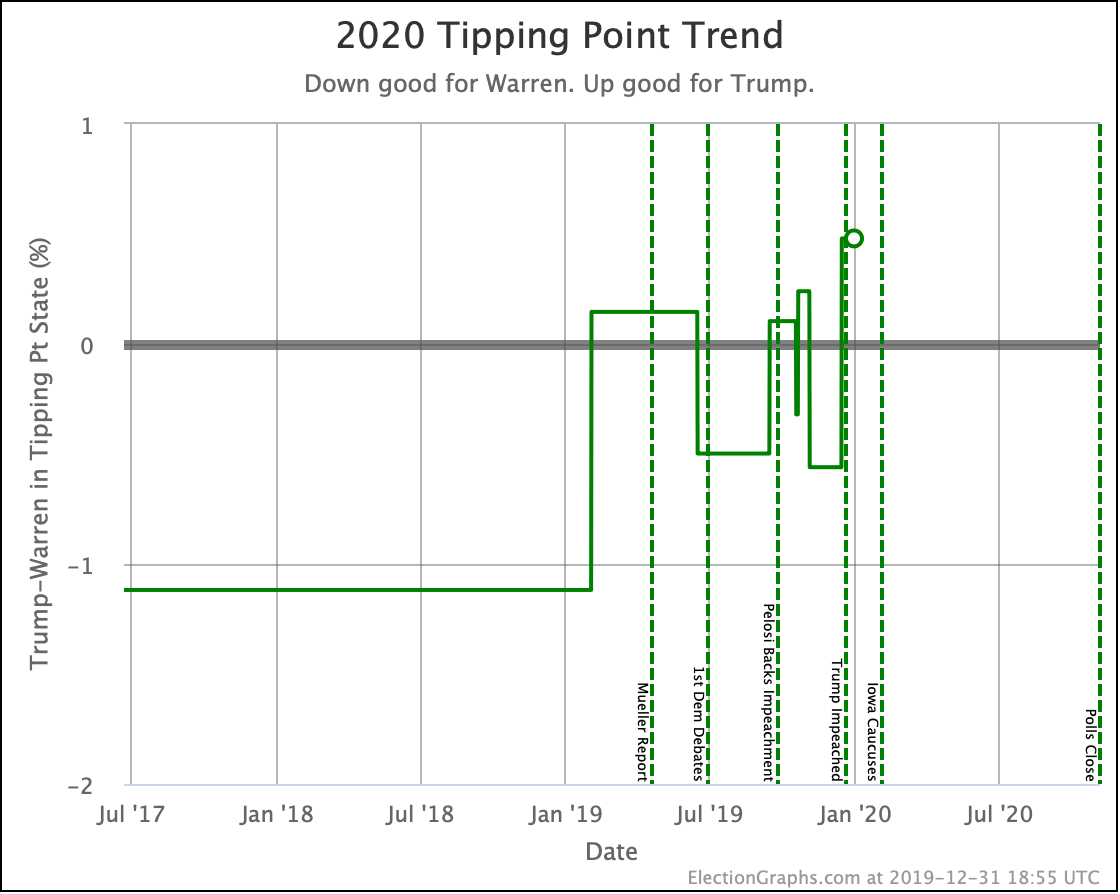
Both of these views show Warren struggling over the past few months to stay ahead of Trump.
When we determine who is winning the Electoral College simply by seeing who leads the poll averages in each state, Warren has sometimes been ahead but has also been behind. The tipping point has been less than 1% for almost a year… since we started getting polls really… so one way or another, Warren vs Trump looks like a close race.
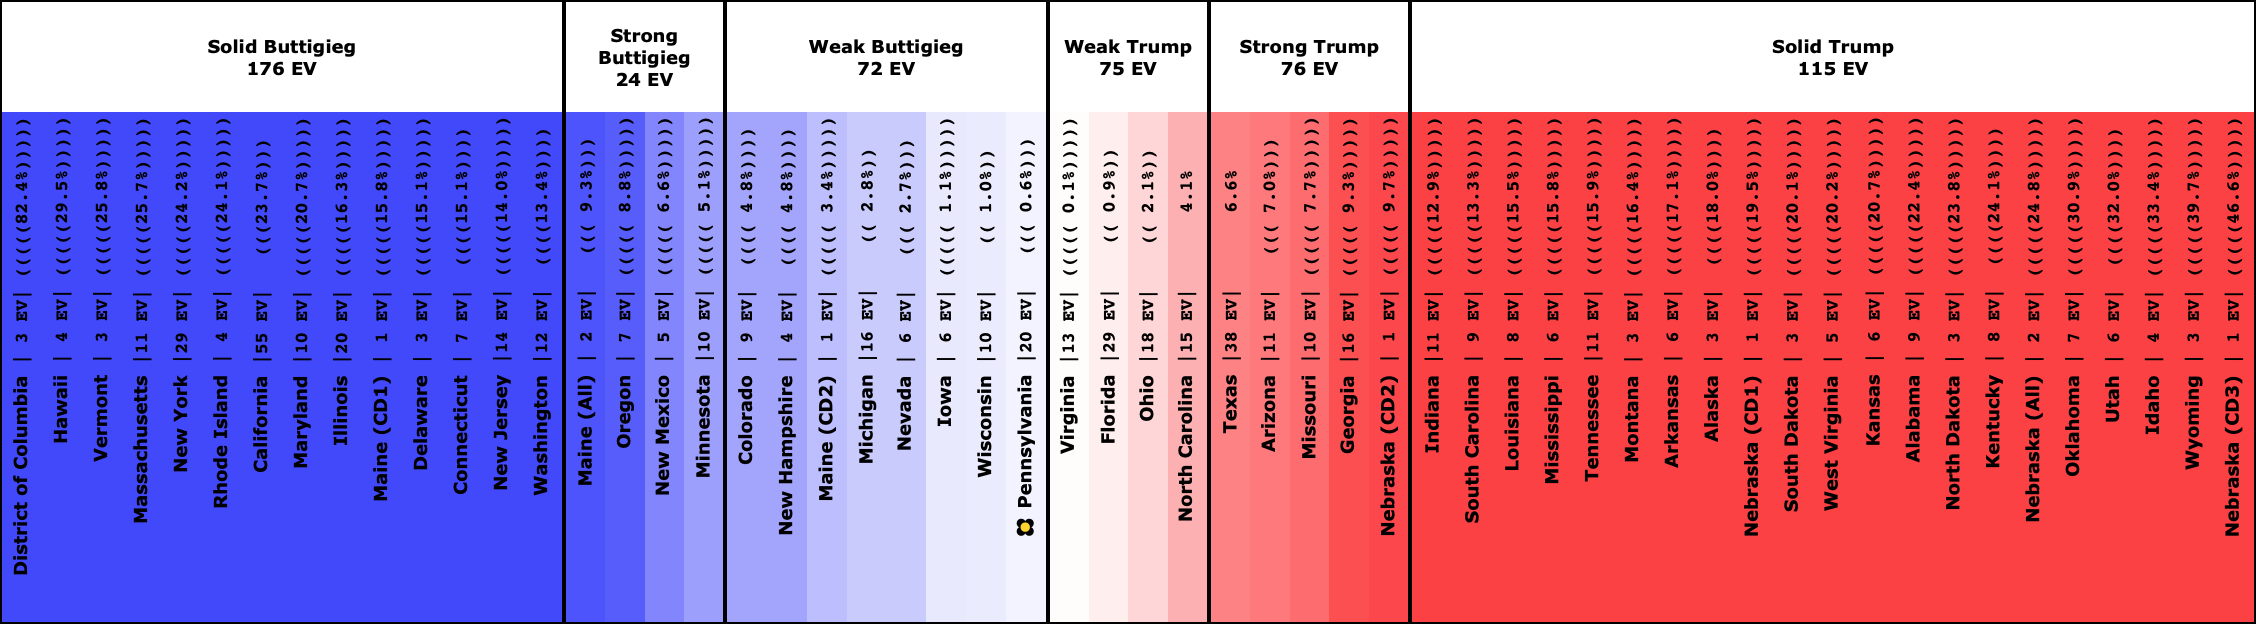
Buttigieg vs Trump:
- State category change: VA has moved from Weak Trump to Weak Buttigieg
- Expected case change: Buttigieg 226 to Trump 312 -> Buttigieg 239 to Trump 299
- Tipping point change: Trump by 1.3% in MI -> Trump by 1.8% in FL
There has been much less polling on Buttigieg vs Trump. This last polling actually moves Virginia in Buttigieg's direction, but that is only because this is the very first Buttigieg poll in Virginia, so it bumps the 8.0% Republican win in 2000 out of the average. The newest poll still had Trump ahead by 2.0%, but because it was less of lead than Bush's win in 2000, it moved the average toward Buttigieg,
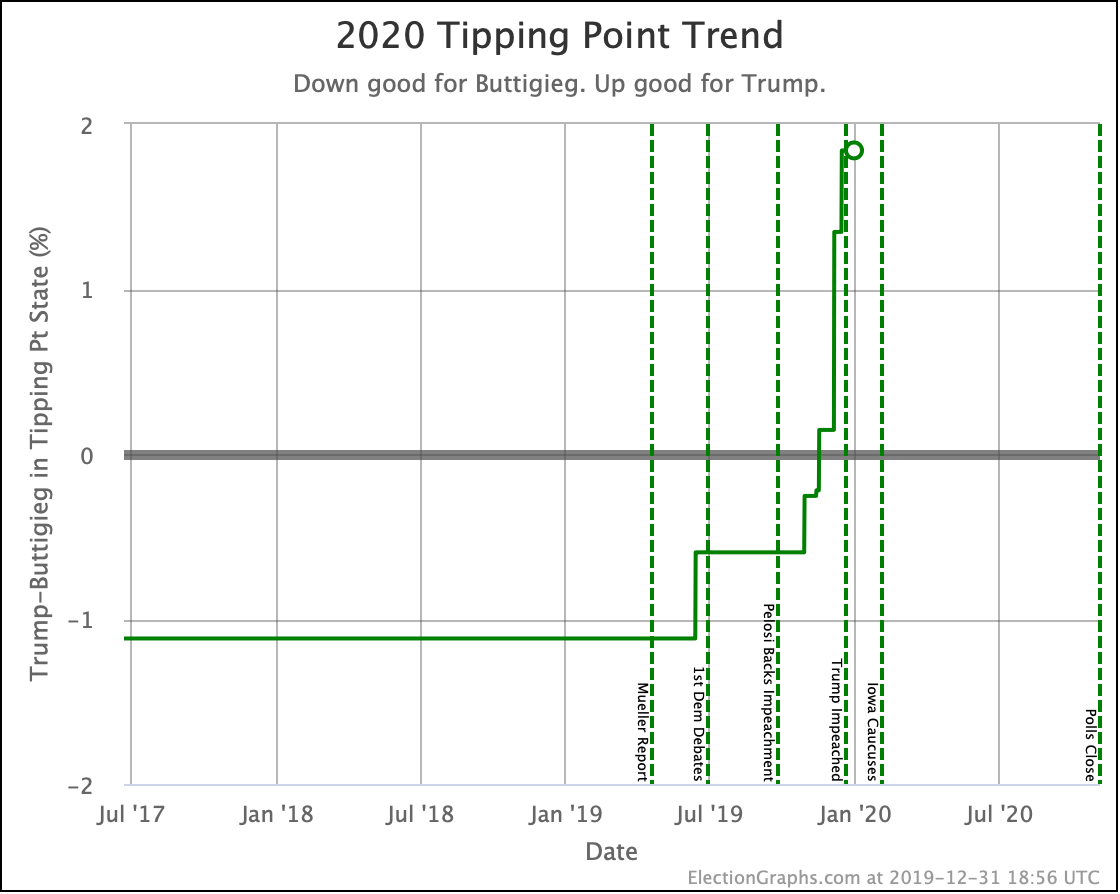
But the Florida poll moved the average in that state the other way and the tipping point moves further toward Trump.
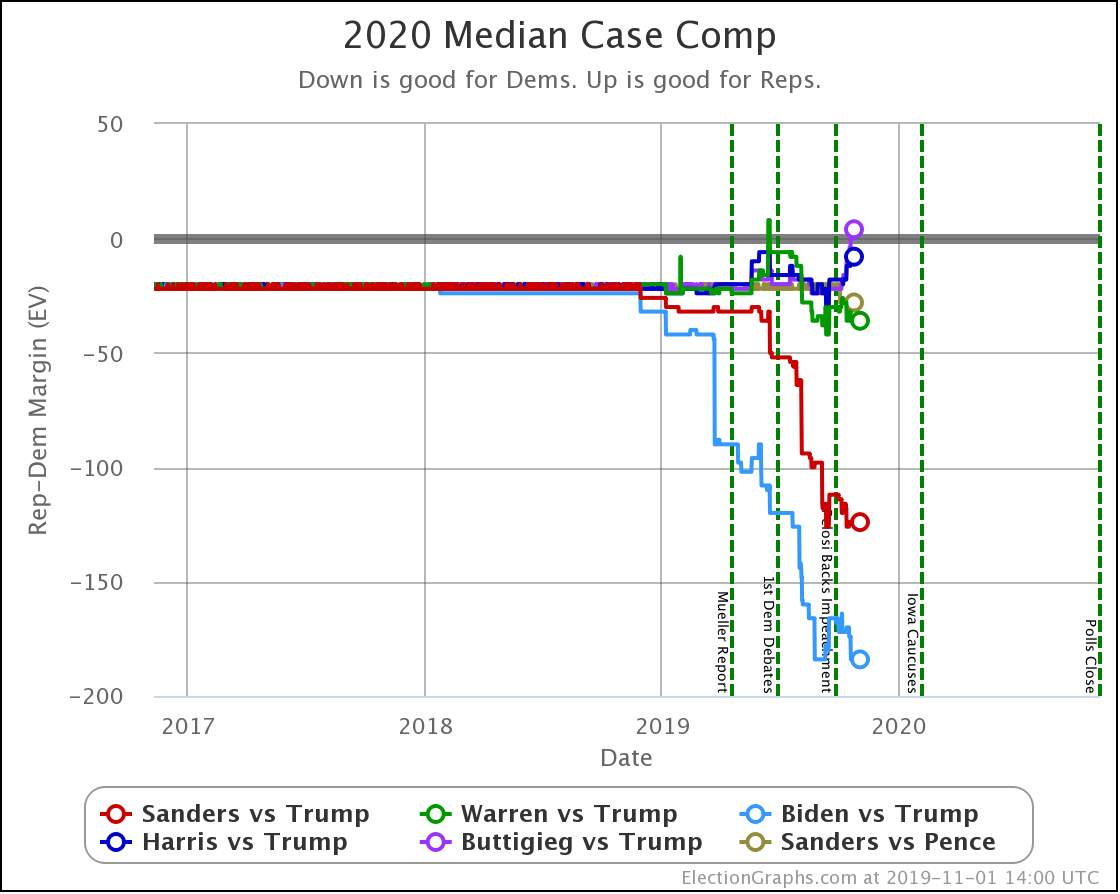
None of the categorization based metrics changed for the other candidates, but let's look where things stand right now with everybody before we move on to the probabilistic view.
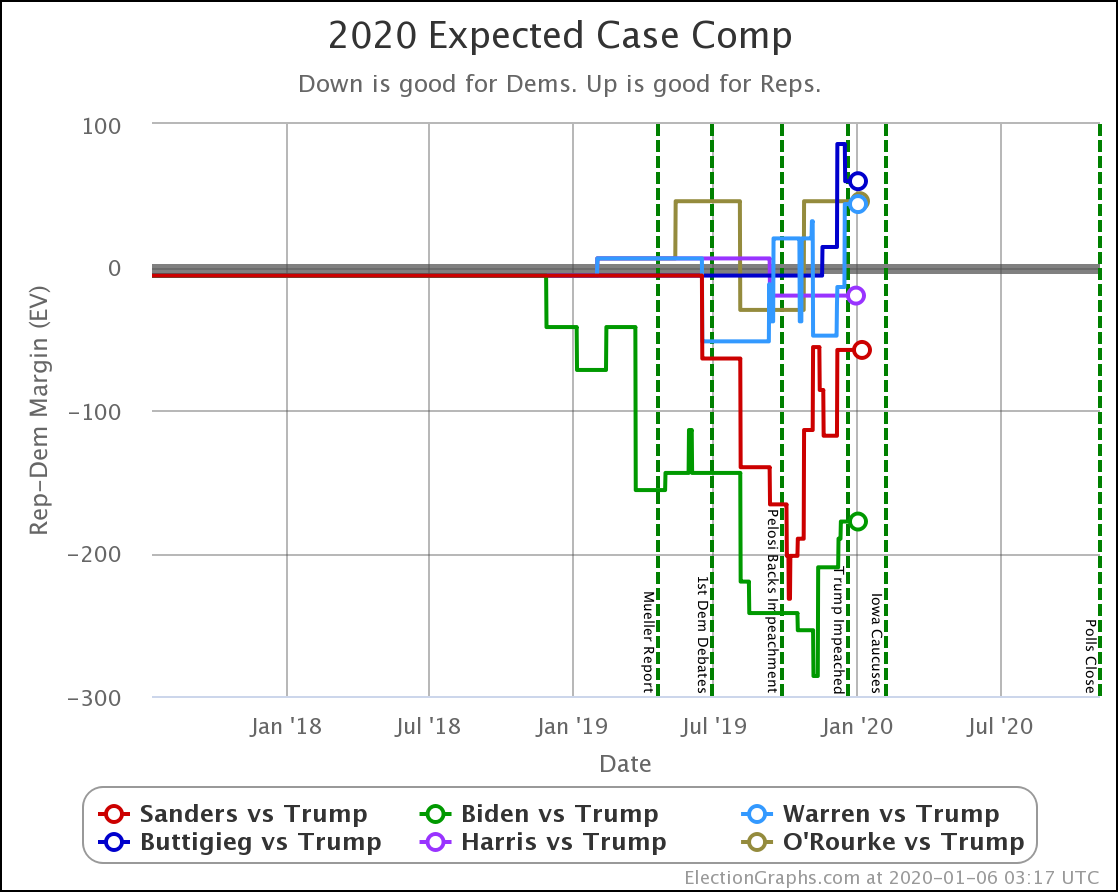
| Dem | 22 Dec | 6 Jan | 𝚫 |
| Biden | +178 | +178 | Flat |
| Sanders | +58 | +58 | Flat |
| Warren | +14 | -44 | -58 |
| Buttigieg | -86 | -60 | +26 |
So in the Expected Case, Biden still way ahead, Sanders ahead but not by as much, and we now have both Warren and Buttigieg losing.
| Dem | 22 Dec | 6 Jan | 𝚫 |
| Biden | +4.3% | +4.3% | Flat |
| Sanders | +1.0% | +1.0% | Flat |
| Warren | +0.6% | -0.5% | -1.1% |
| Buttigieg | -1.3% | -1.8% | -0.5% |
In the tipping point view, you can see a bit more clearly how much better Biden is doing than the rest.
However, to be clear, this is still not a secure lead. One month before the 2016 election, Clinton had a 6.0% tipping point lead. Over the course of the last month, this kept slipping, and the actual tipping point in the final election results was Trump by 0.8%. So with the right set of events, the tipping point can move 7% in a month.
We have a long way to go.
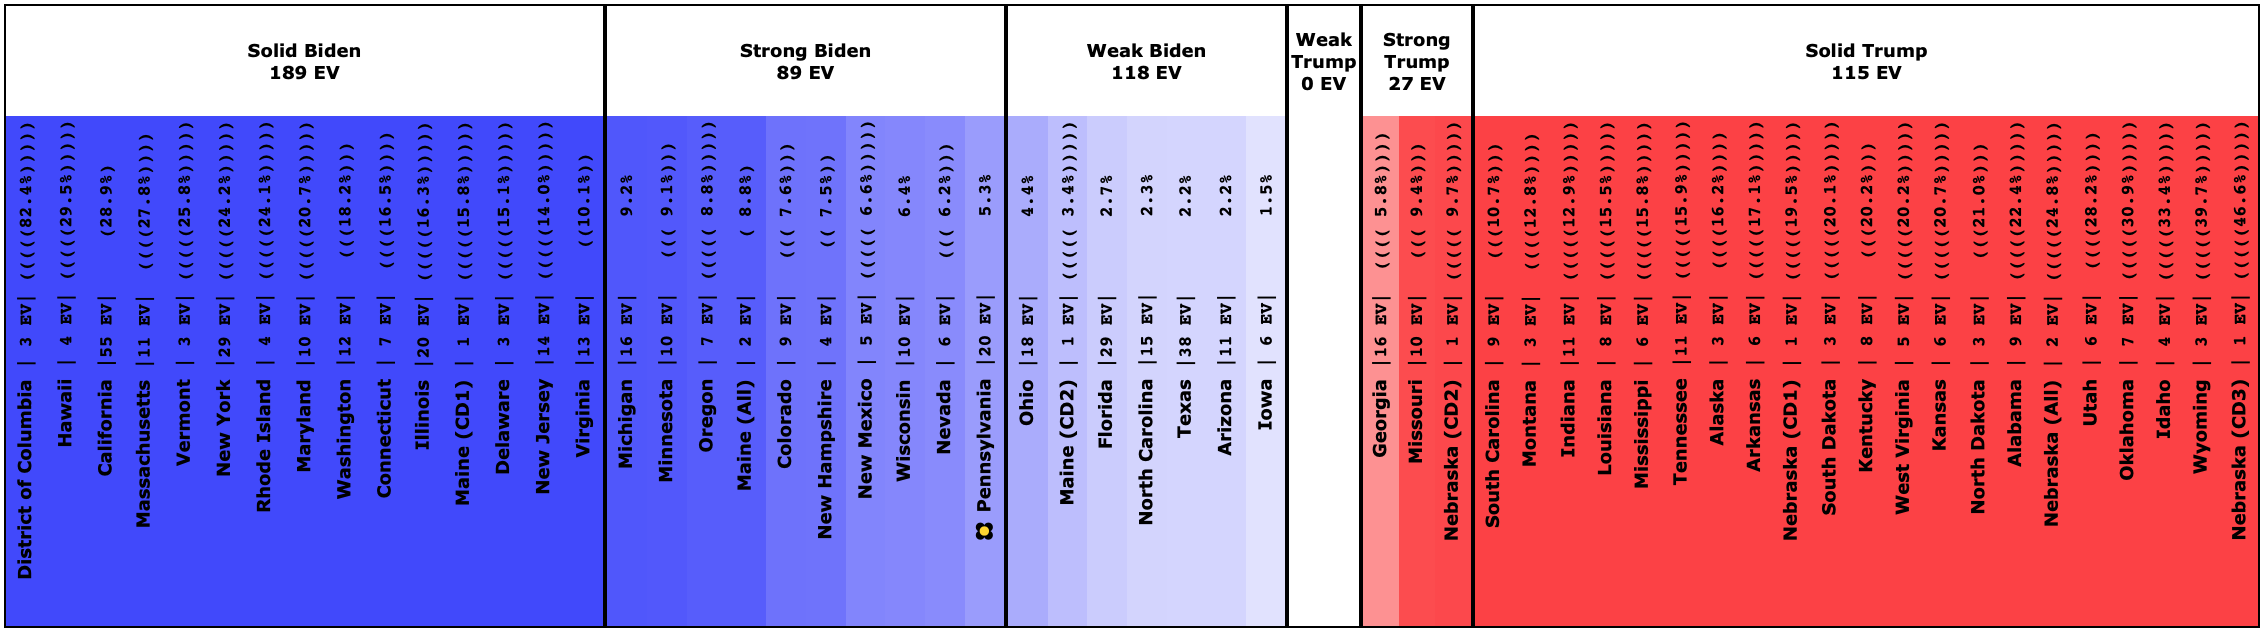
Having said that, the categorization view does simplify things. While the poll averages for Biden and Sanders did not change categories, they did move. So let's look at the state averages, and then the probabilistic views:
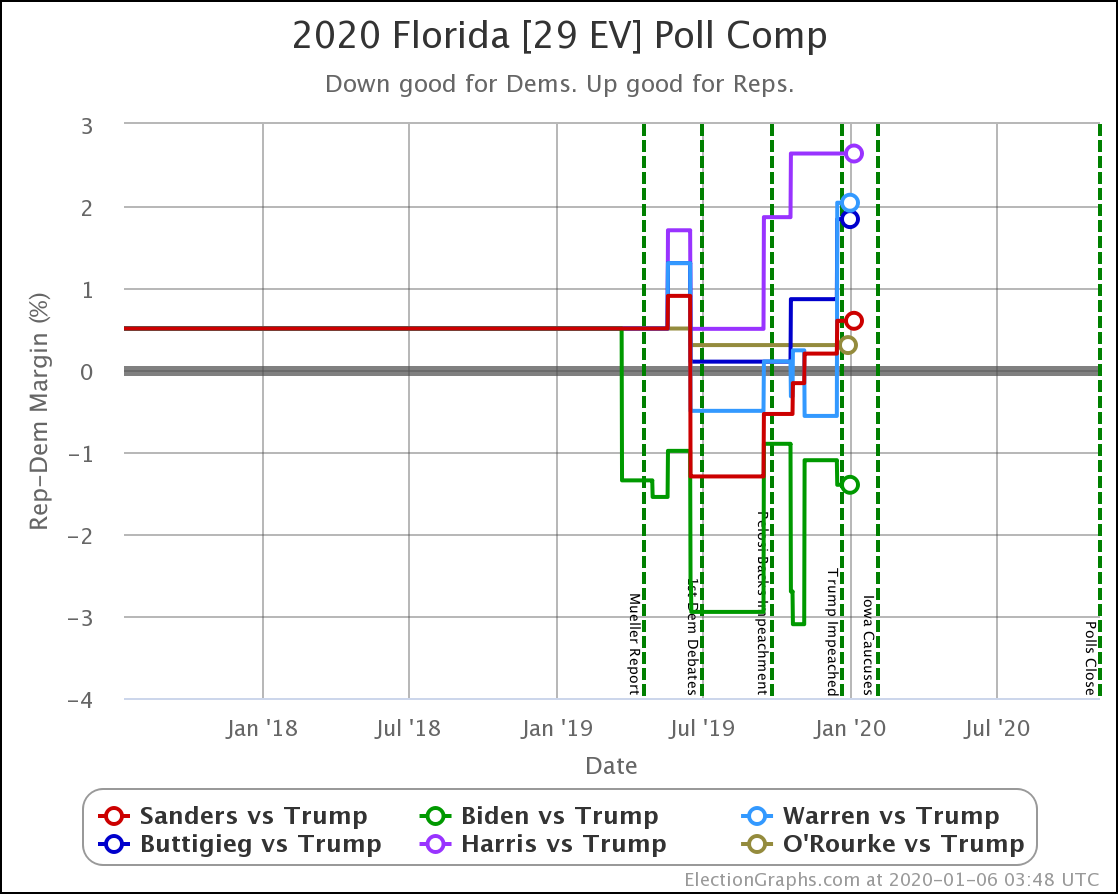
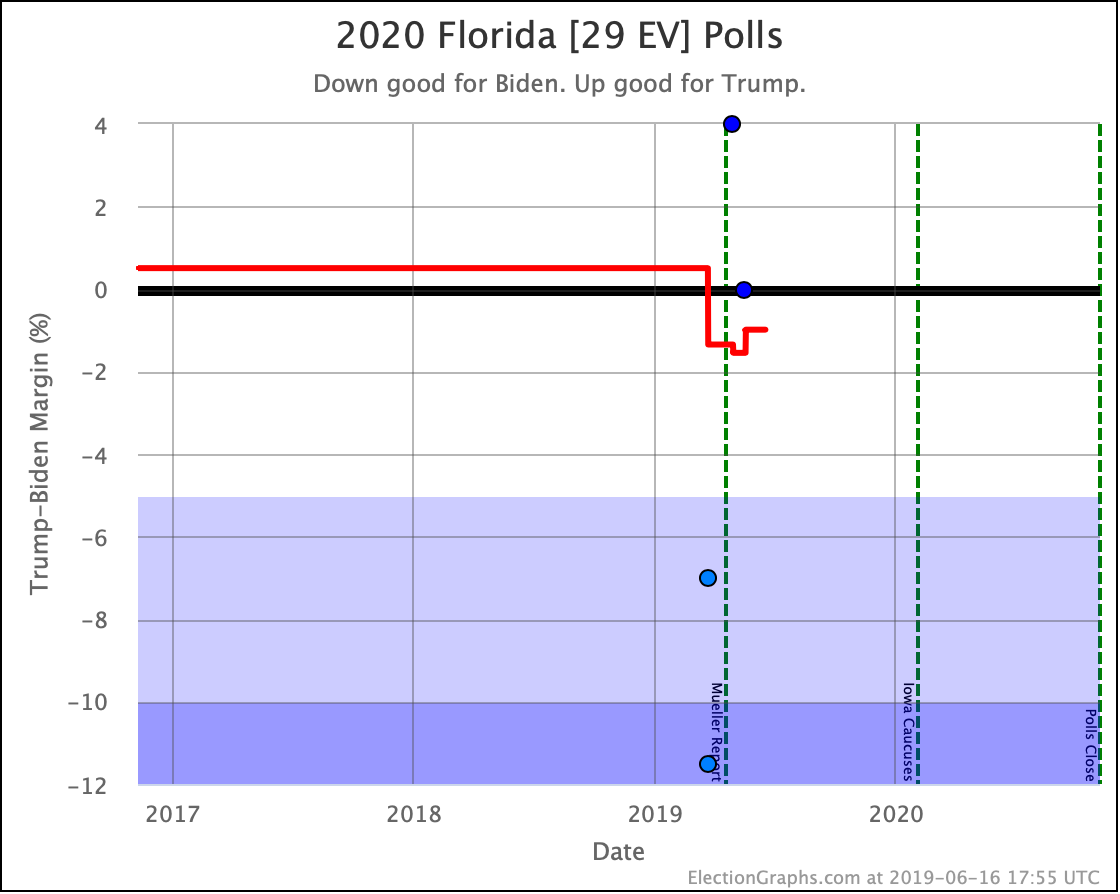
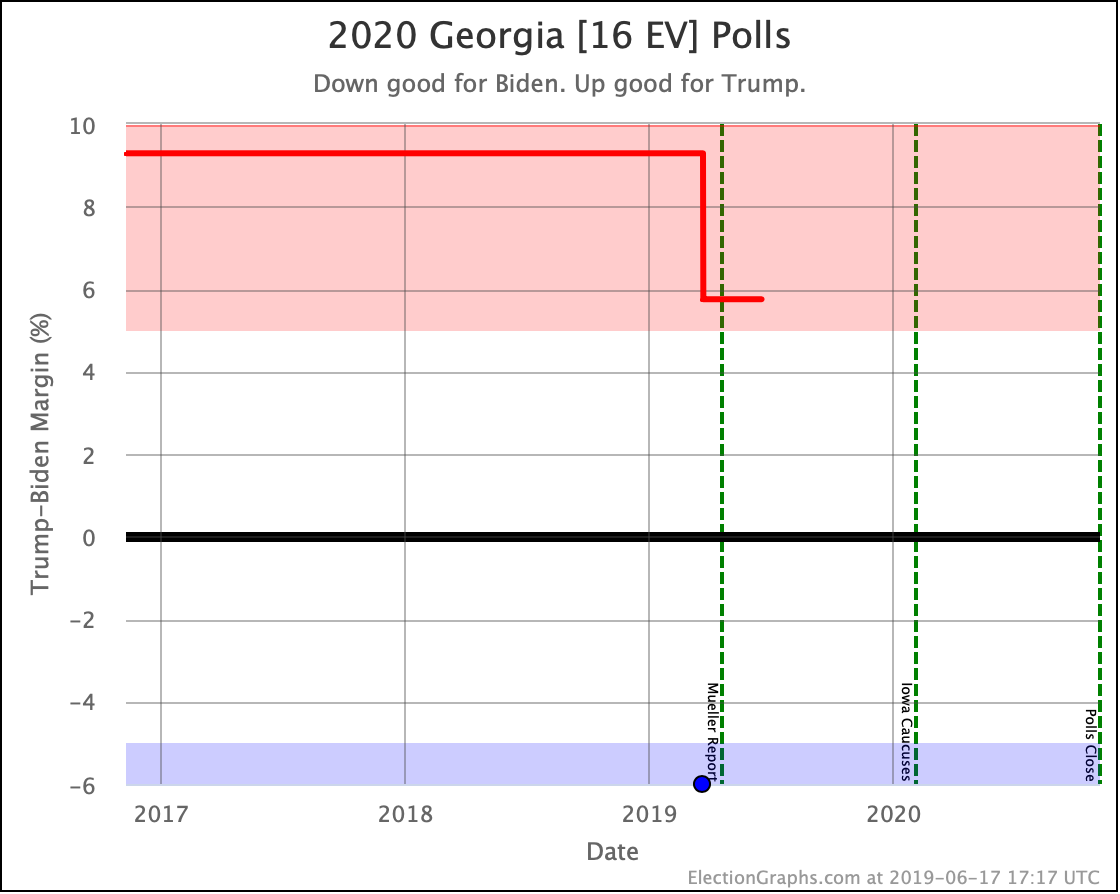
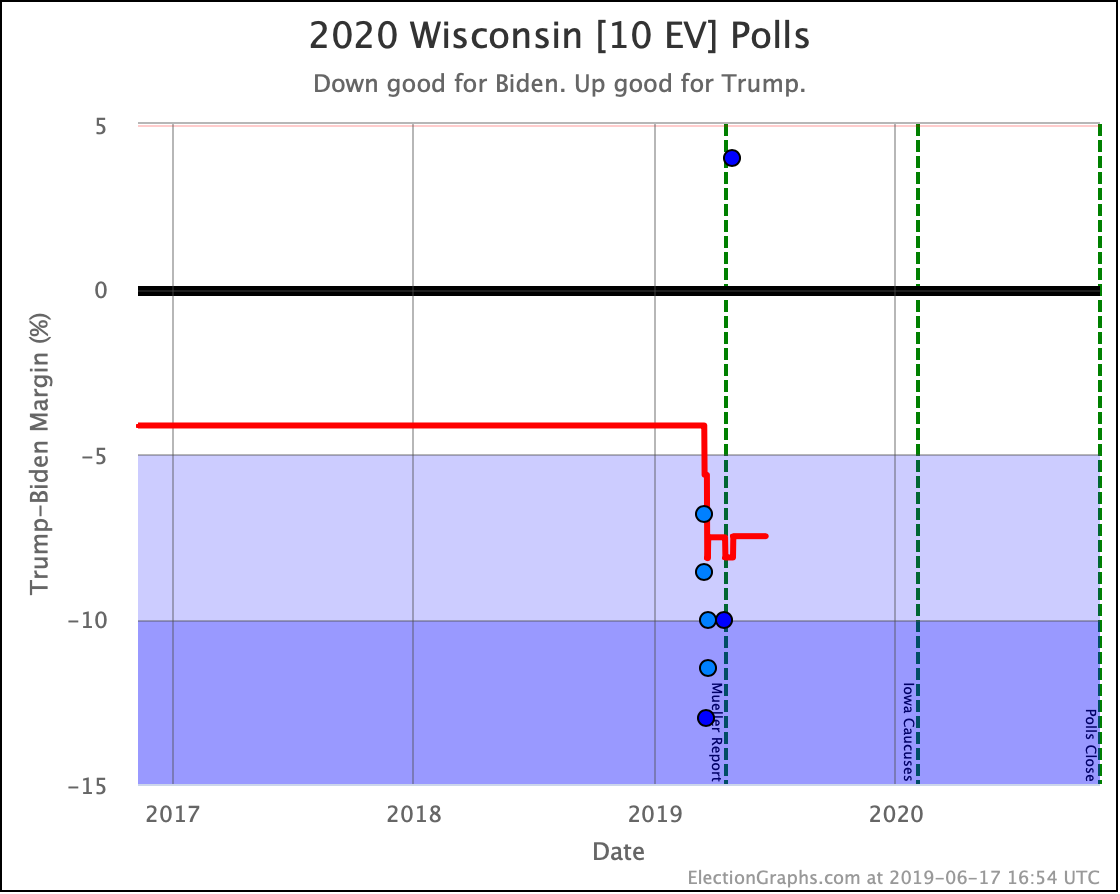
Biden is now the only Democrat who still has a lead in the Florida poll average. But the bottom line is that whatever Democrat you look at, Florida is close. The range for the four Democrats still in the race goes from a 1.4% lead for Biden to a 2.0% deficit for Warren. Florida is simply too close to call no matter how you slice it.
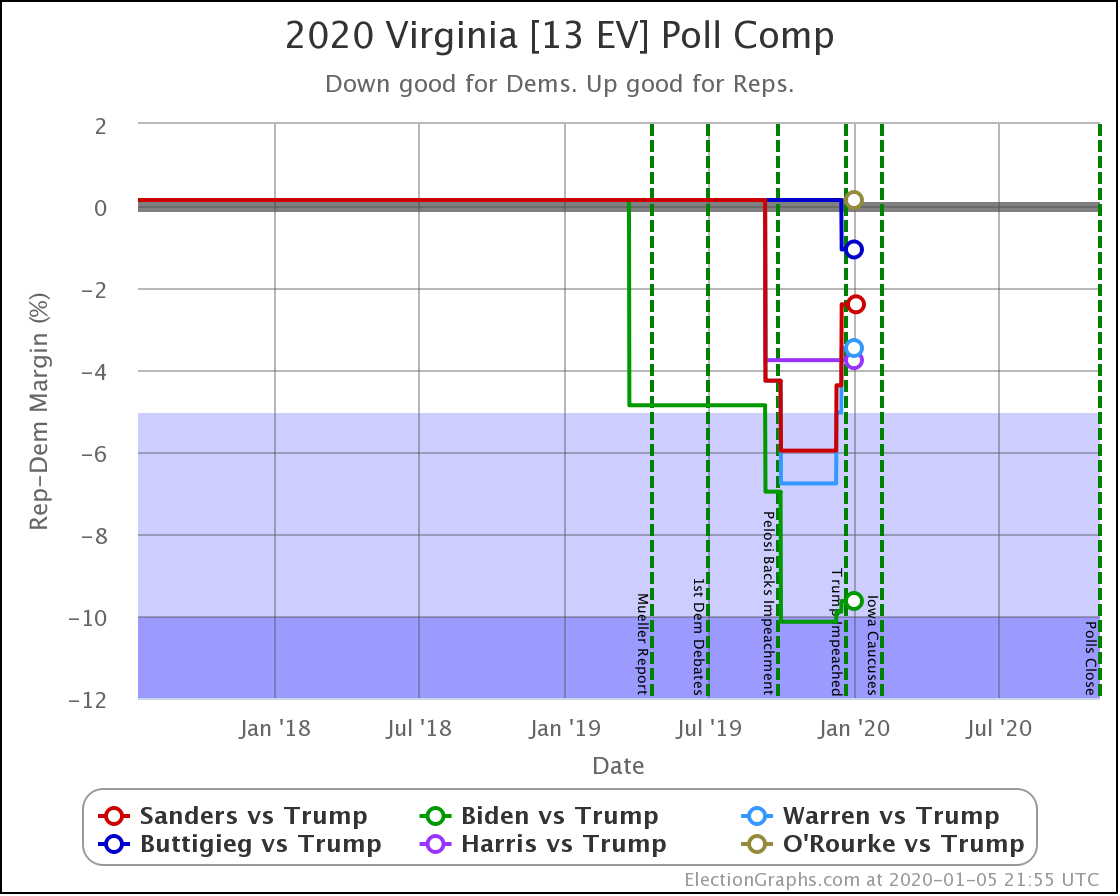
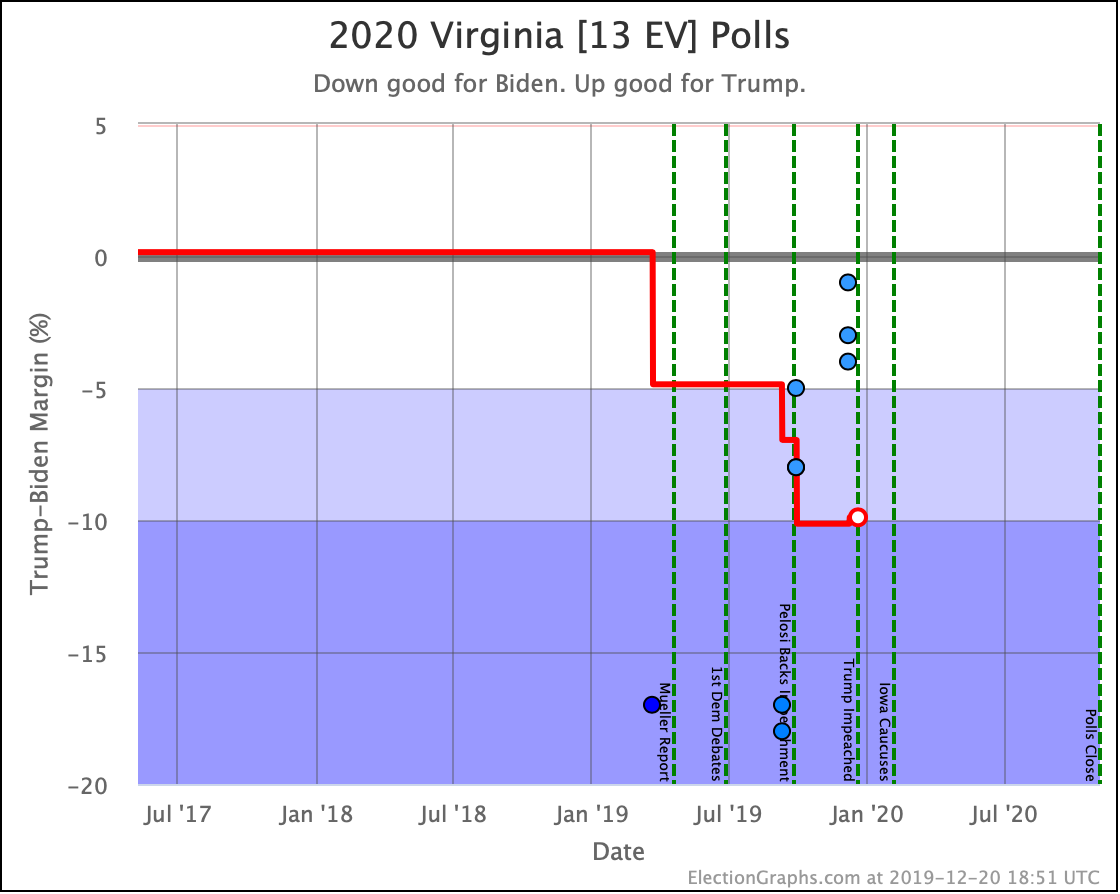
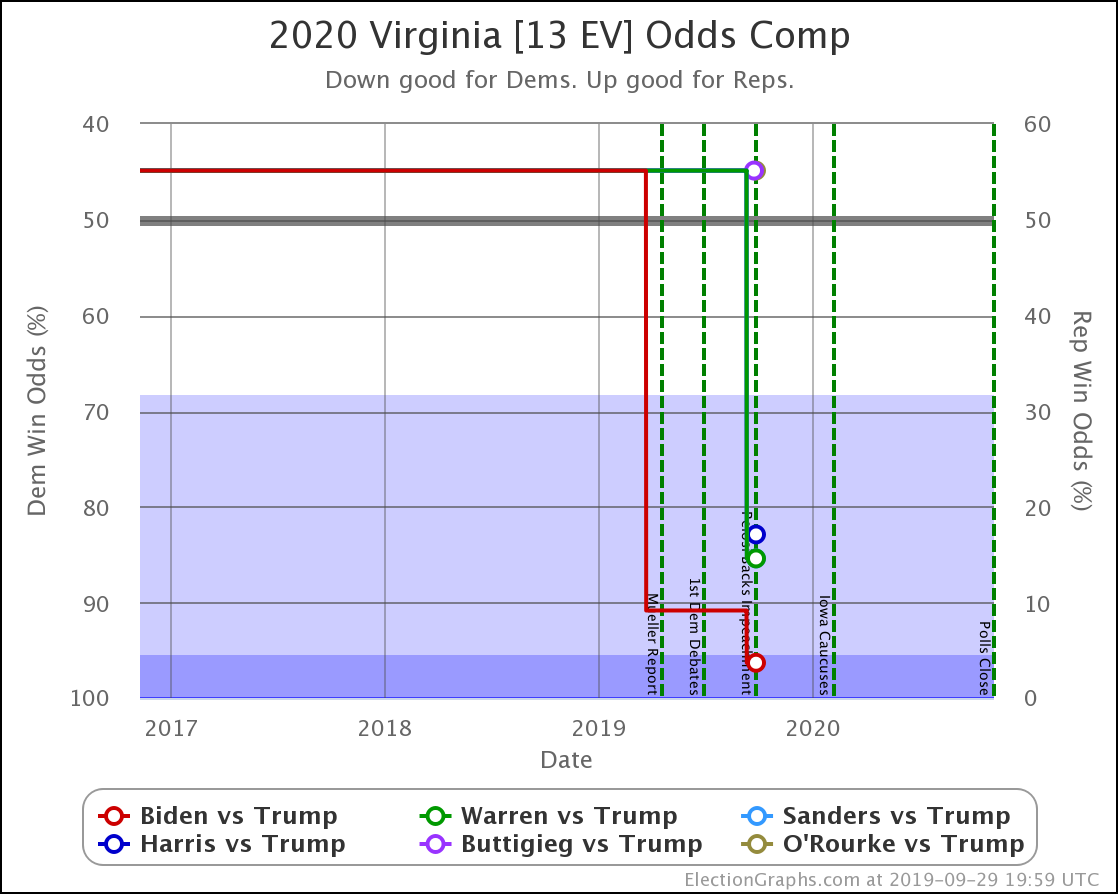
Once again, in Virginia Biden is doing much better than the other Democrats against Trump. In Virginia Biden is ahead by 9.6%. The other three Democrats who are still in the race all lead, but none by more than 4%.
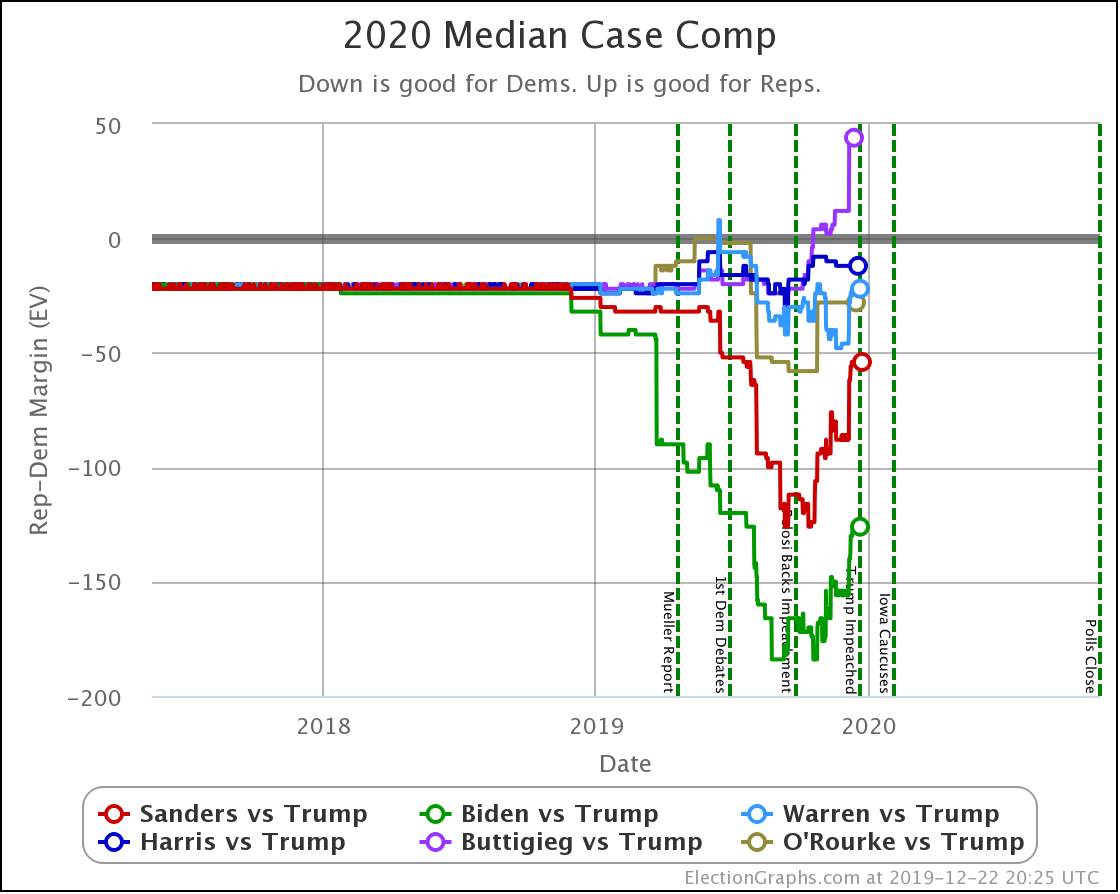
OK, now for the results of the national probabilistic simulations:
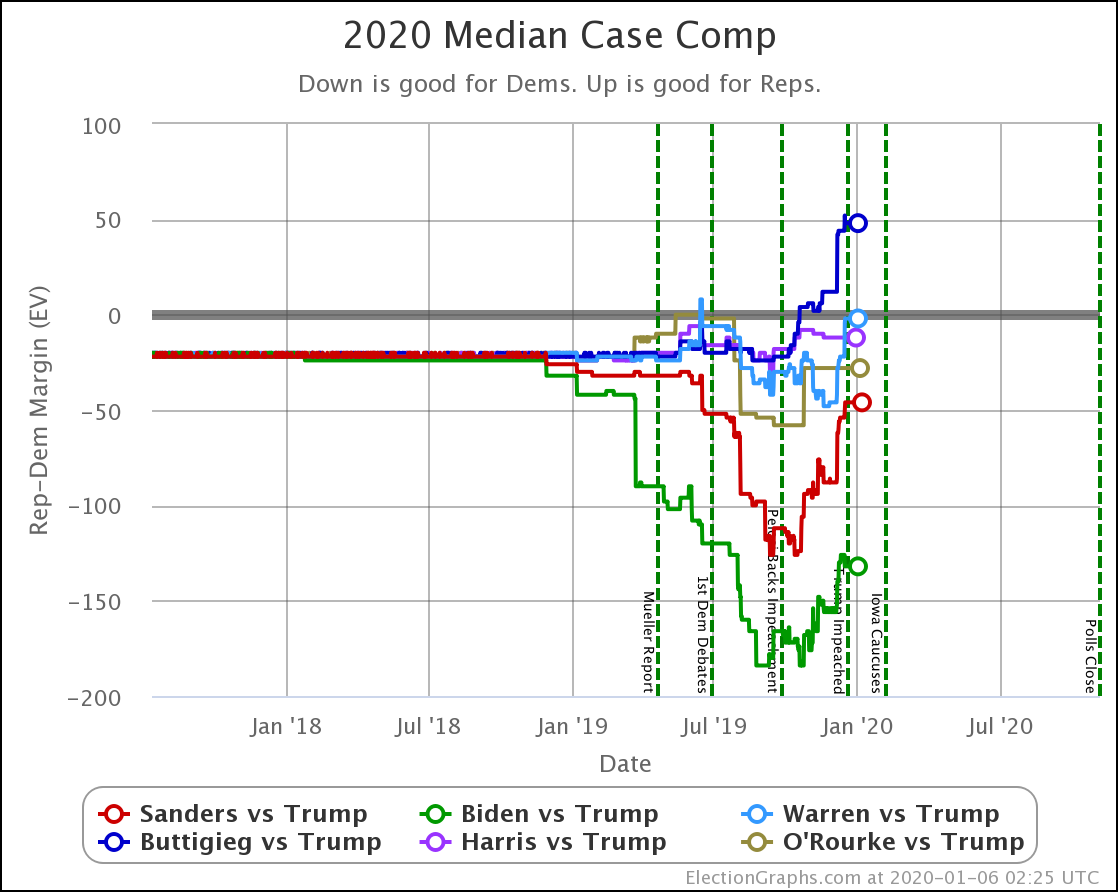
| Dem | 22 Dec | 6 Jan | 𝚫 |
| Biden | +126 | +132 | +6 |
| Sanders | +54 | +46 | -8 |
| Warren | +22 | +2 | -20 |
| Buttigieg | -44 | -48 | -4 |
The median case only improves for Biden. For every other Democrat, the situation deteriorates, with Warren taking the biggest hit.
One thing to point out is that while Warren loses by 44 electoral votes in the categorization view, looking at the probabilistic simulation, the median case has Warren eking out a 2 electoral vote win.
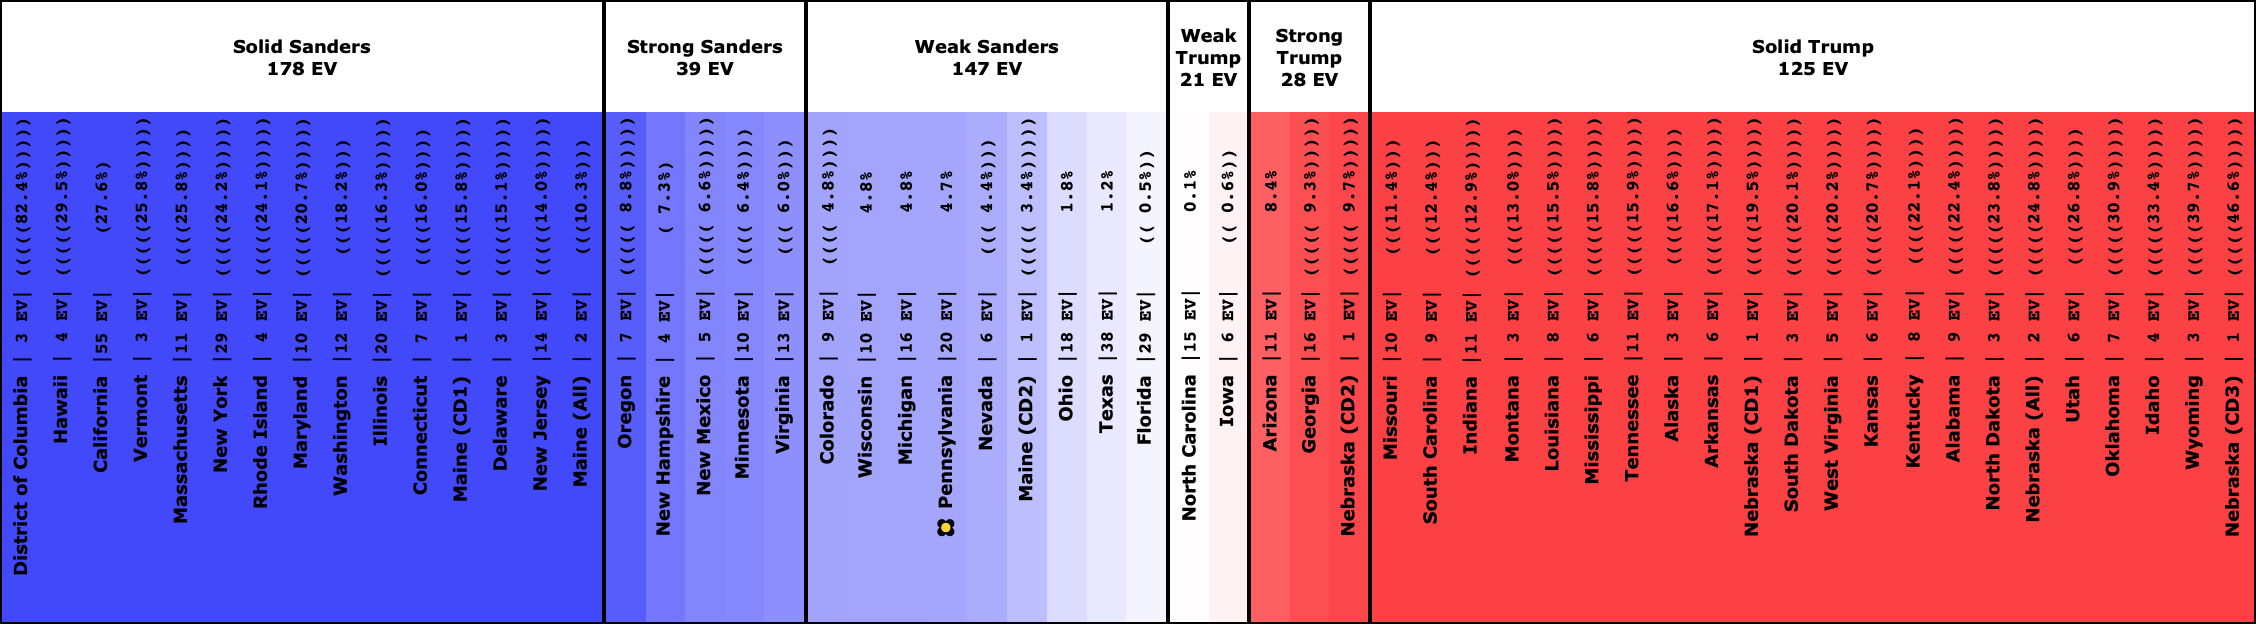
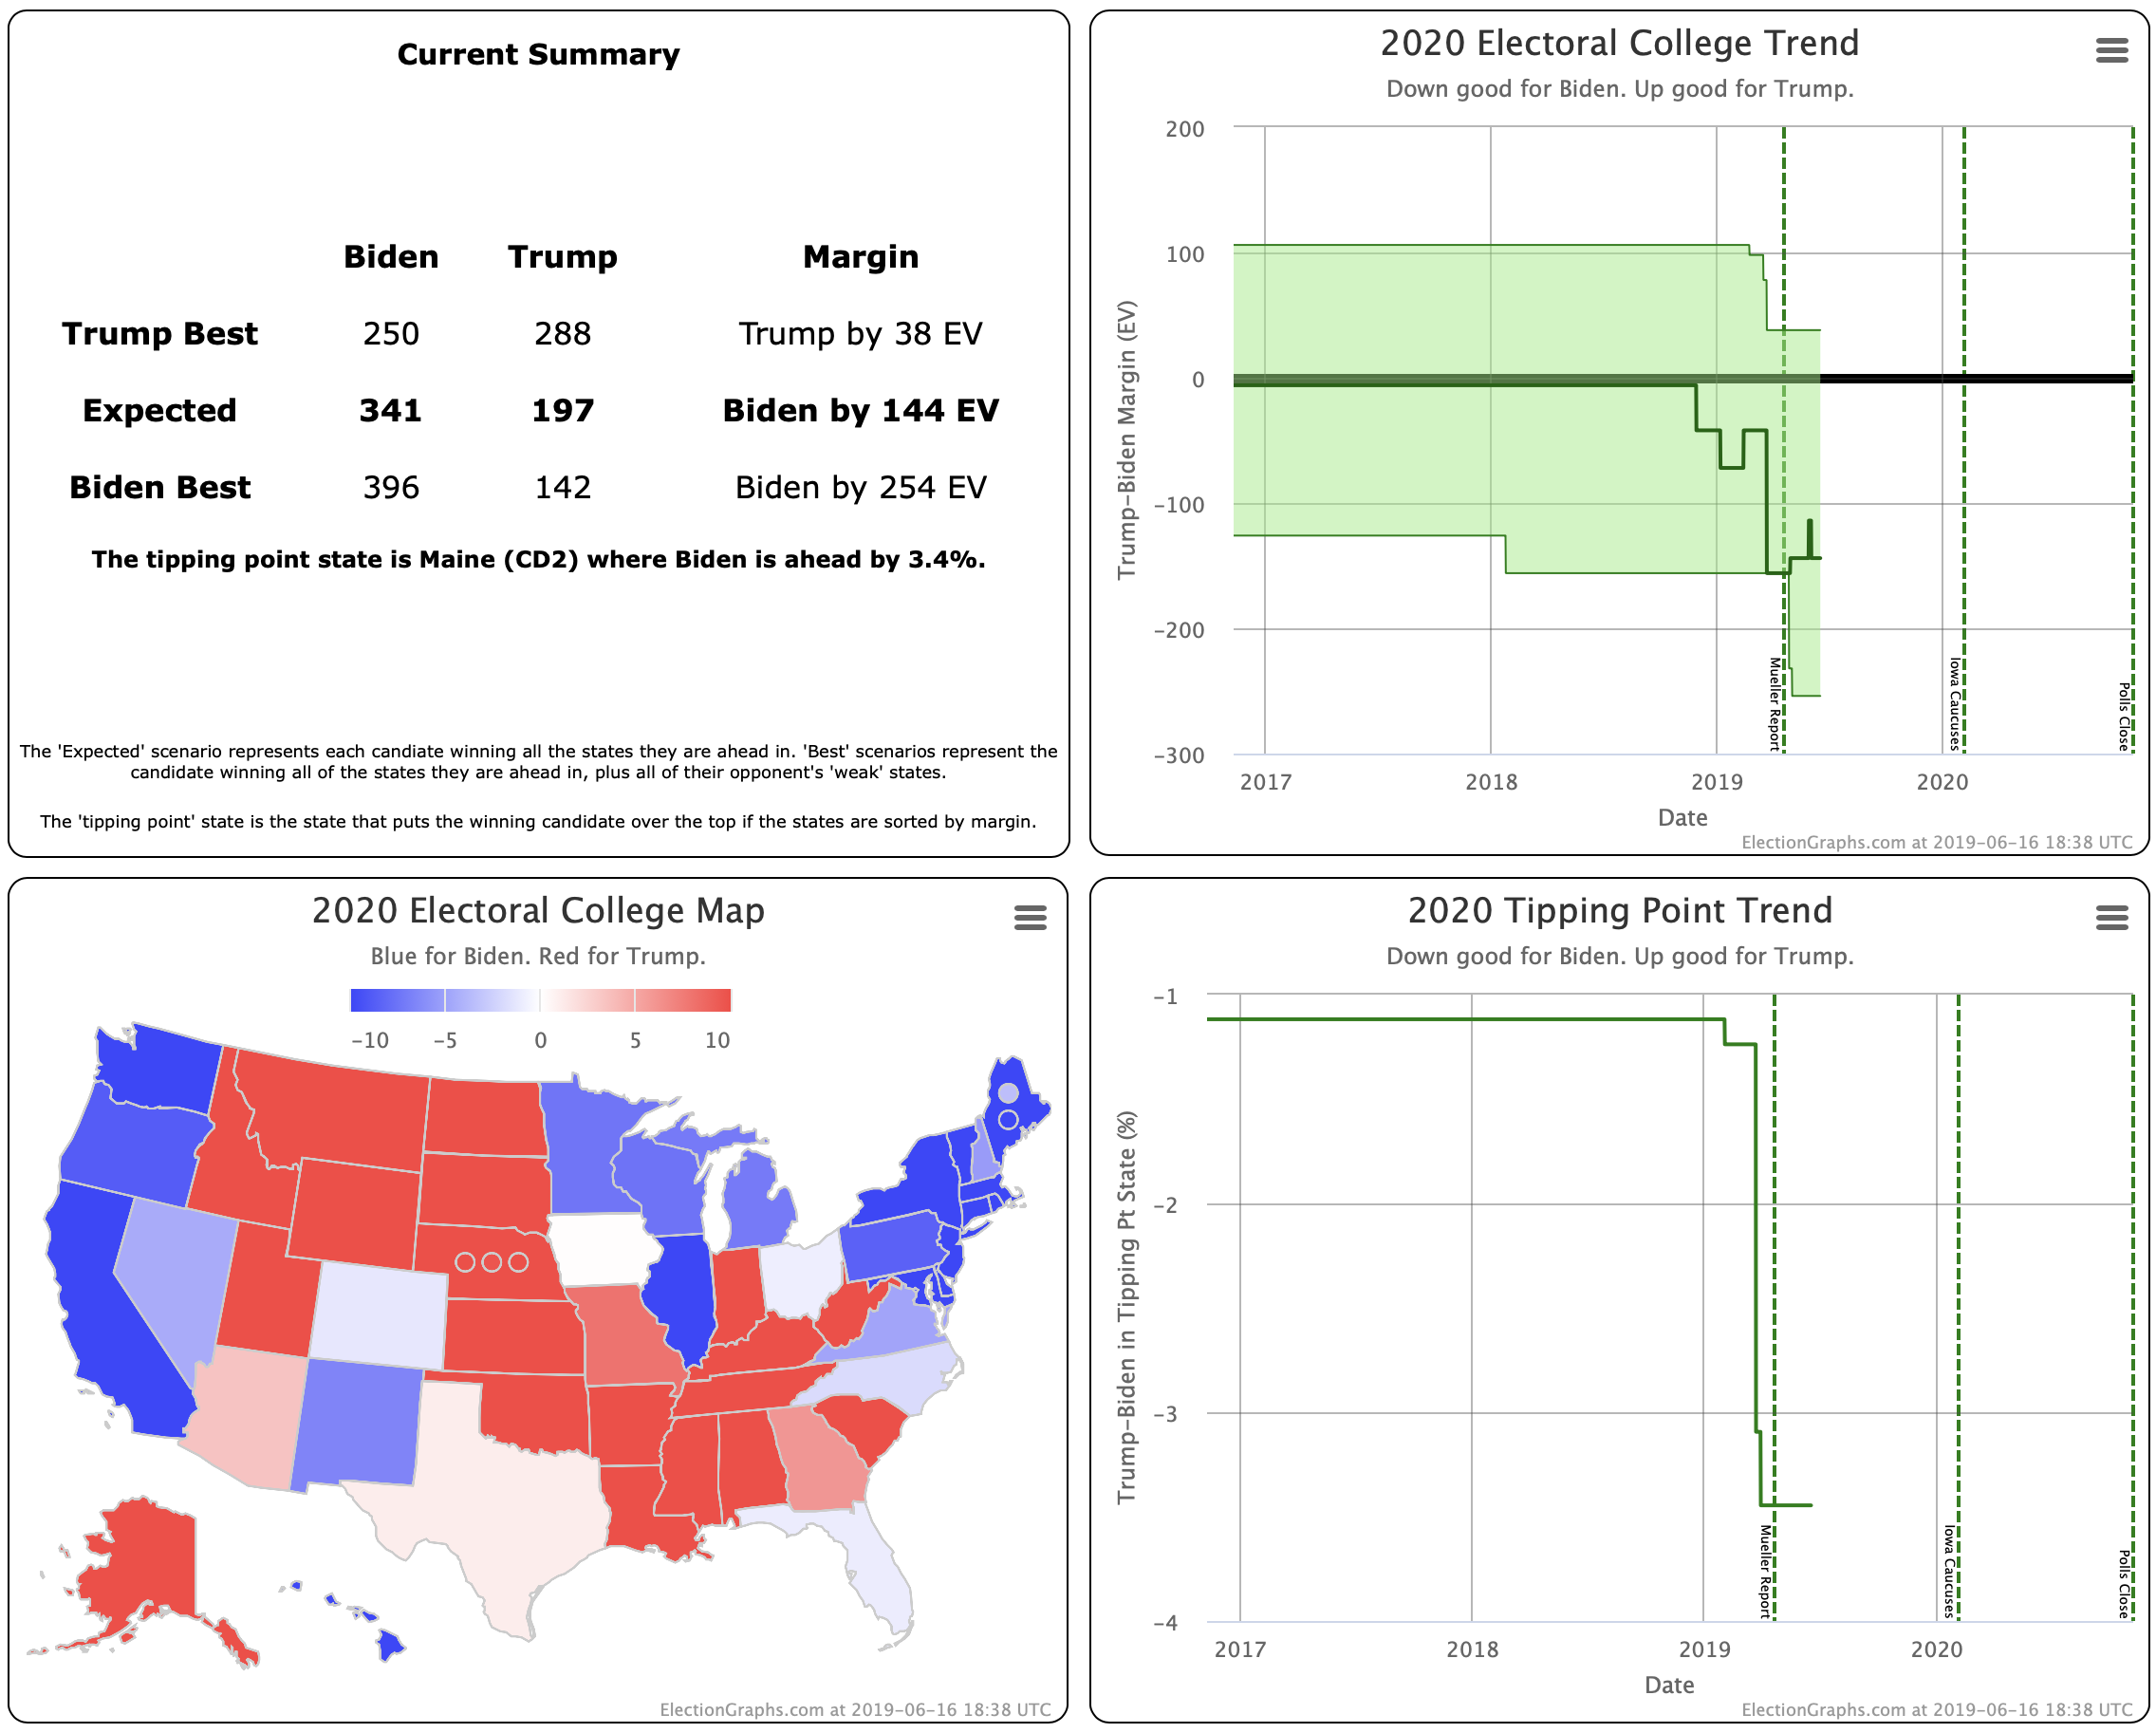
Why the difference? Because Warren's spectrum of states looks like this:
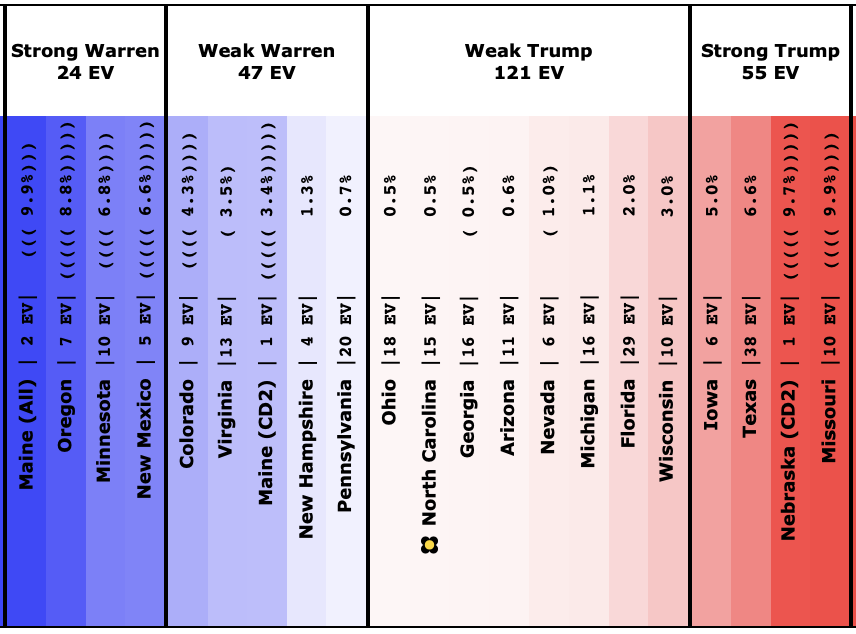
If everybody wins the states they lead, Warren loses by 44. So she needs to flip 22 electoral votes for a 269-269 tie, and any more than that gets her a win.
There are 121 electoral votes worth of states where Trump leads by 3% or less. Meanwhile, there are only 24 electoral votes worth of states where Warren leads by less than 3%.
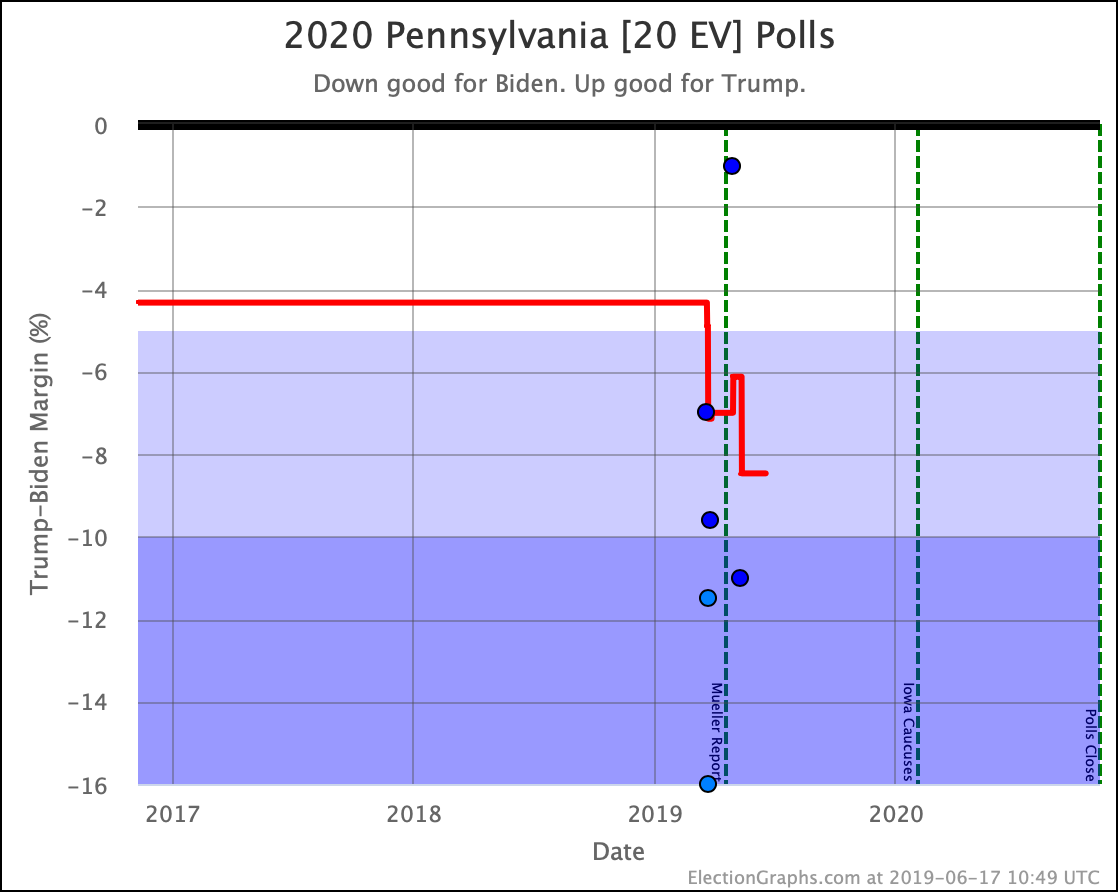
To pull off a win, Warren needs to hold Pennsylvania and New Hampshire, but then out of the eight states where Trump has a narrow lead, she only has to get lucky in Florida, or any number of combinations of two states, in order to pull things back over to her side. Given how many states are very close, and how few are close on the other side, it is actually still pretty likely that one of those things would happen.
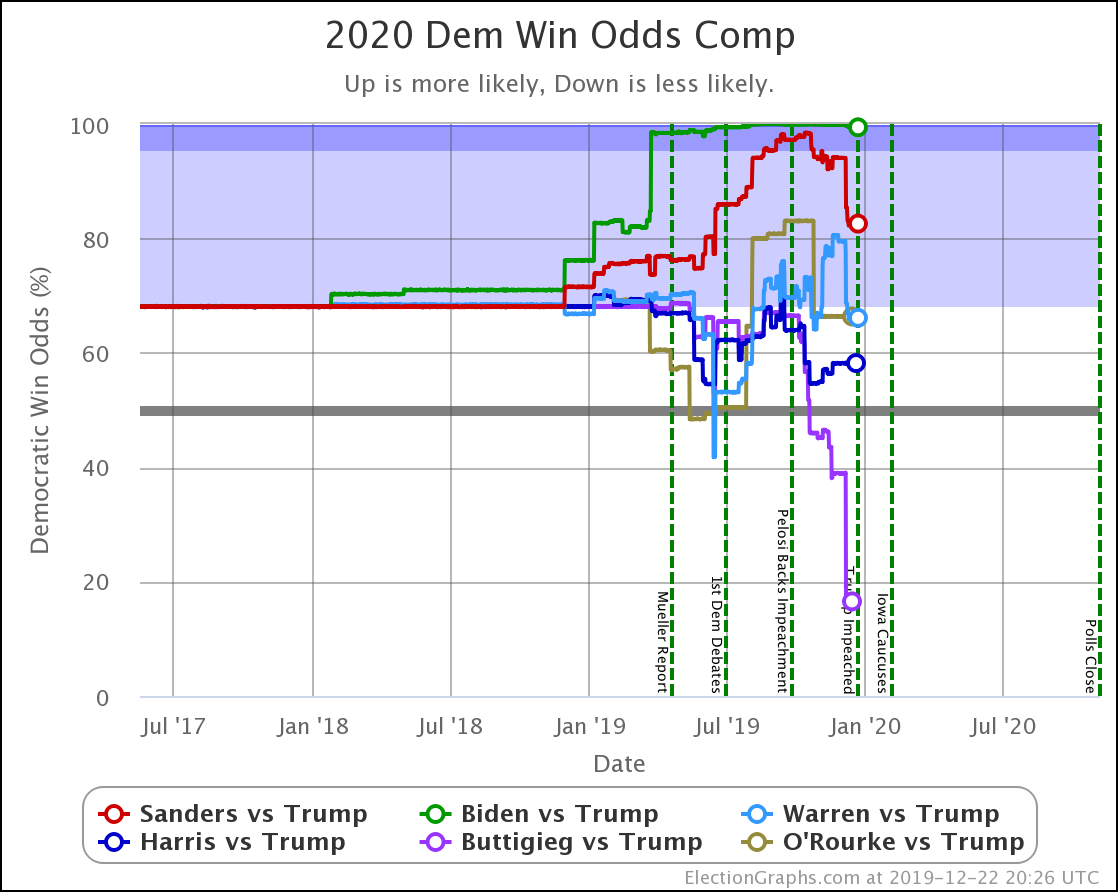
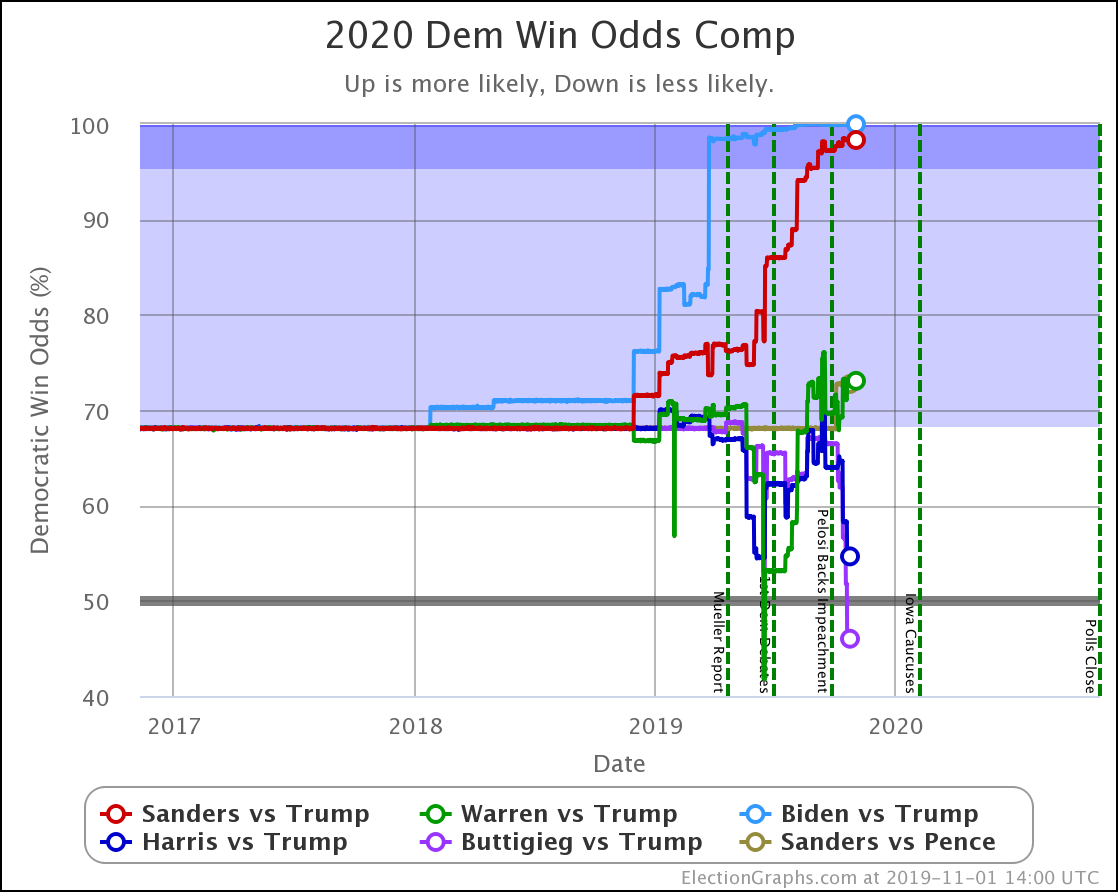
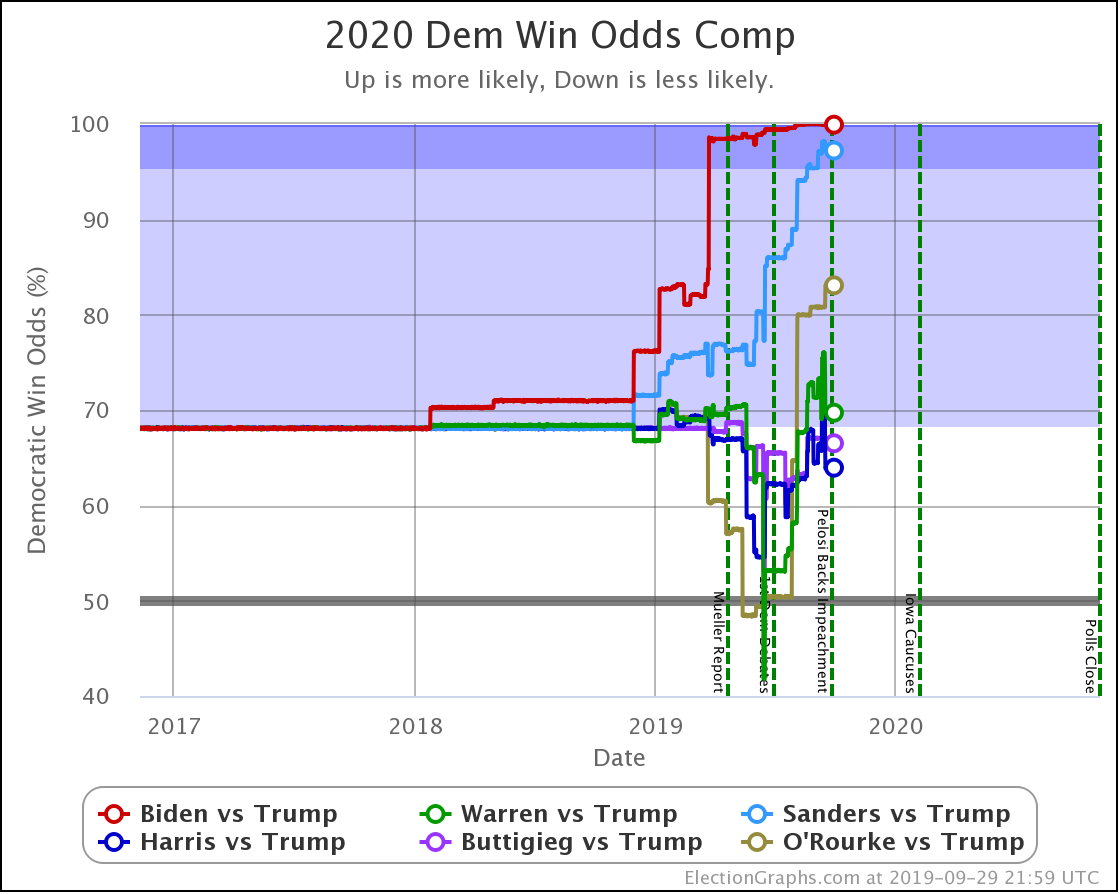
So how likely?
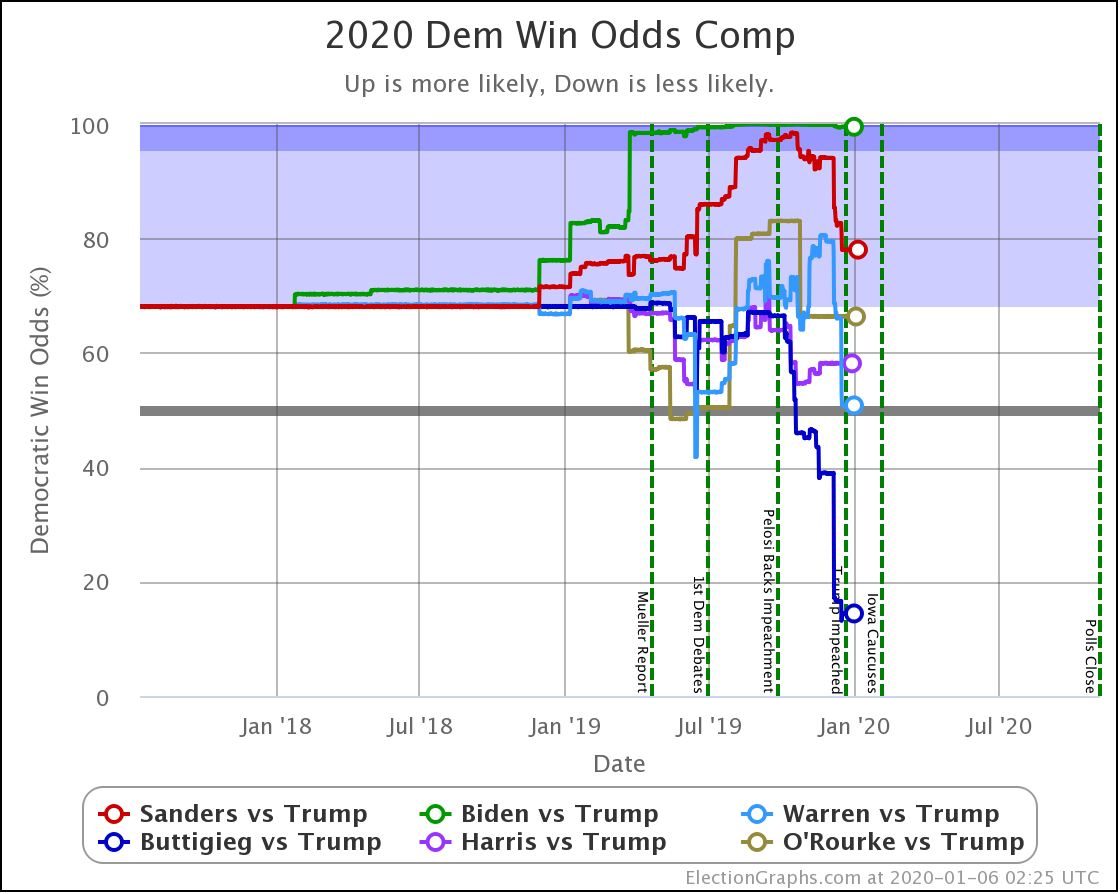
| Dem | 22 Dec | 6 Jan | 𝚫 |
| Biden | 99.4% | 99.5% | +0.1% |
| Sanders | 82.6% | 78.0% | -4.6% |
| Warren | 66.1% | 50.8% | -15.3% |
| Buttigieg | 16.5% | 14.4% | -2.1% |
Warren's odds of winning with that distribution of states is 50.8%. Warren vs. Trump is sitting about as close to a coin toss as we could expect to see.
The odds of a 269-269 tie are also at 1.7%, which is higher than for any of the other three active Democrats here.
Looking at the others, Biden remains at 99%+ with Sanders a bit behind that around 80%, and Buttigieg very very far behind, with only about a 14% chance of pulling out a win.
Of course, that is about the same odds folks gave Trump in 2016.
So that is where we are.
302.1 days until polls start to close.
For more information:
This post is an update based on the data on the Election Graphs Electoral College 2020 page. Election Graphs tracks a poll-based estimate of the Electoral College. The charts, graphs, and maps in the post above are all as of the time of this post. Click through on any image to go to a page with the current interactive versions of that chart, along with additional details.
Follow @ElectionGraphs on Twitter or Election Graphs on Facebook to see announcements of updates. For those interested in individual poll updates, follow @ElecCollPolls on Twitter for all the polls as I add them. If you find the information in these posts informative or useful, please consider visiting the donation page.