Well, it has only been 22 days since my last post, but everything has changed.
That post was after the Biden vs Trump debate, but too soon for there to be a real signal in the state level polls reflecting any reaction to that. Then you had the assassination attempt on Trump. Then the Republican National Convention. Then Biden dropped out. Then it almost instantly it became clear that Harris would become the new Democratic nominee.
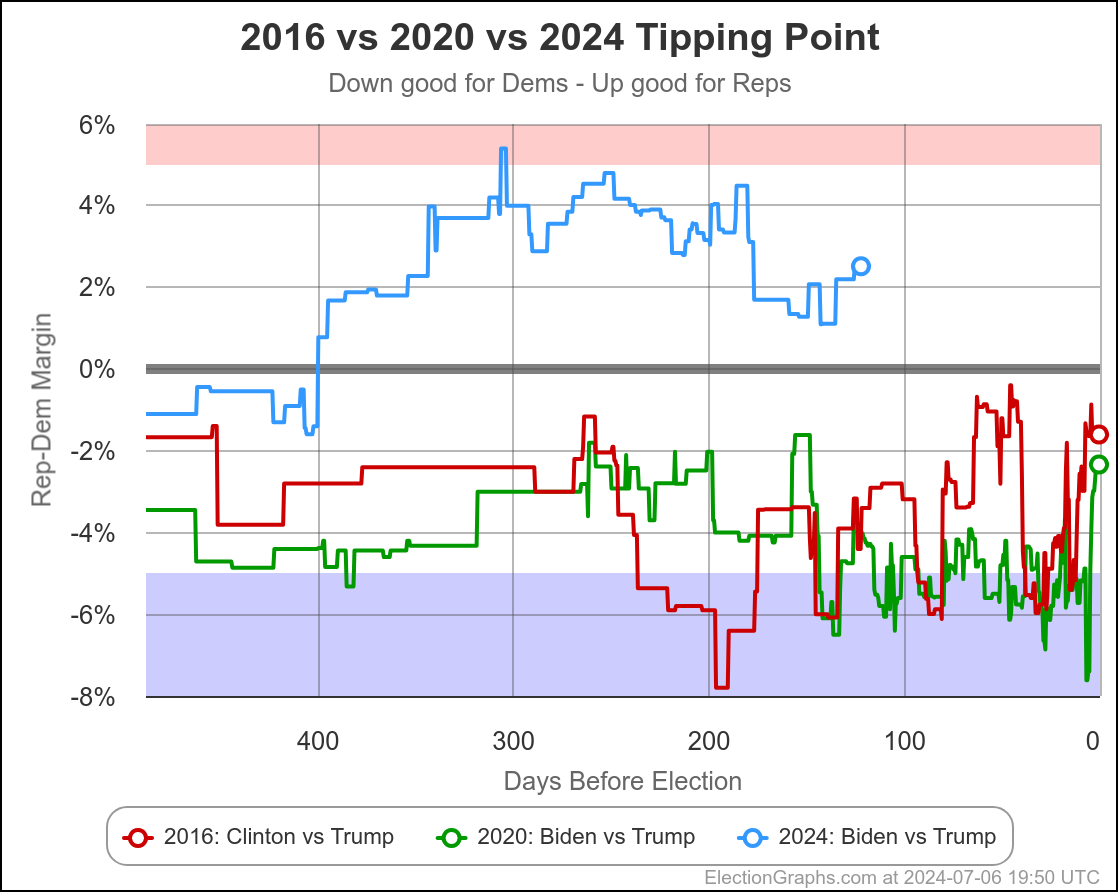
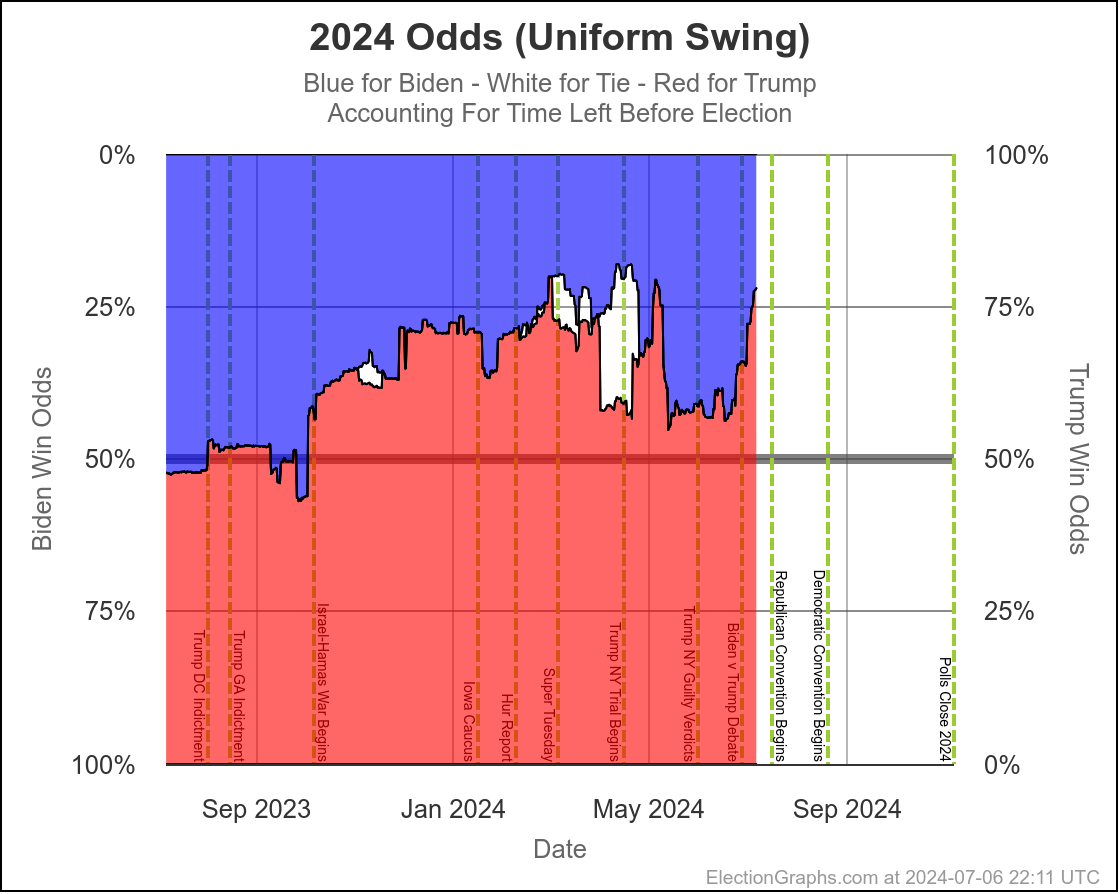
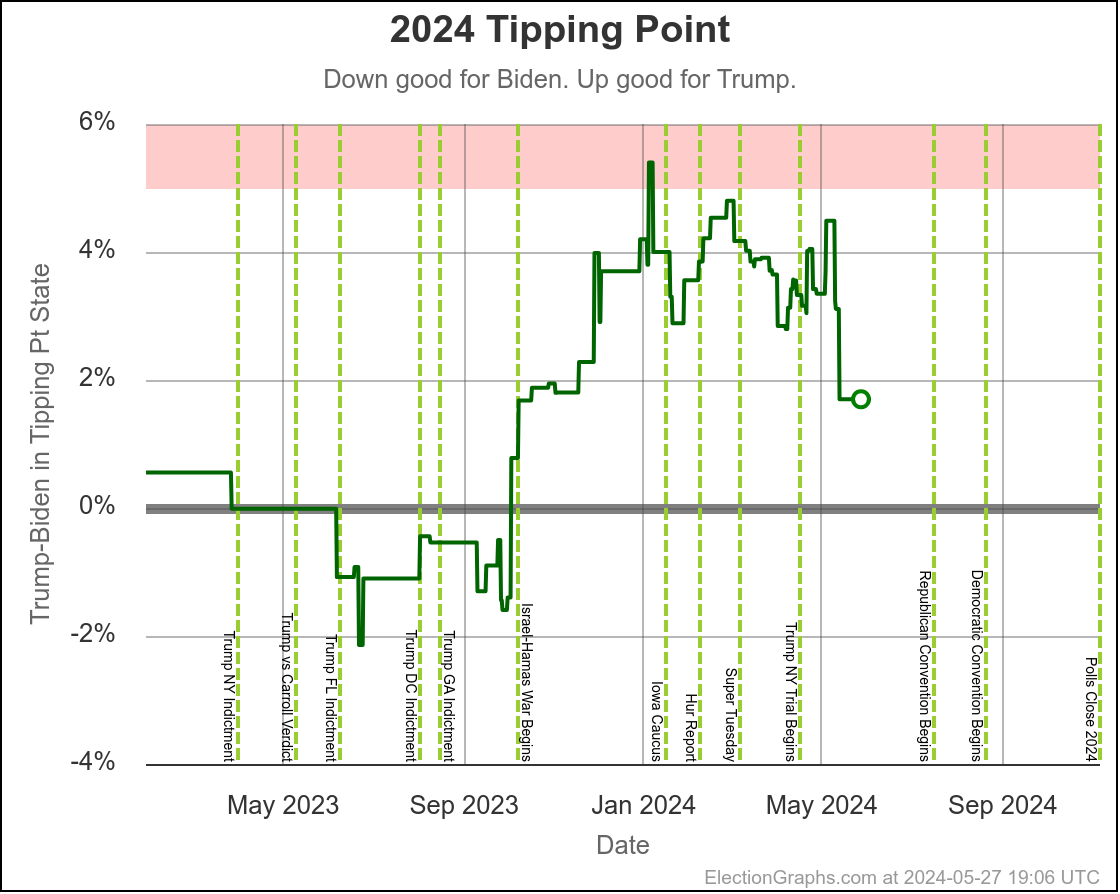
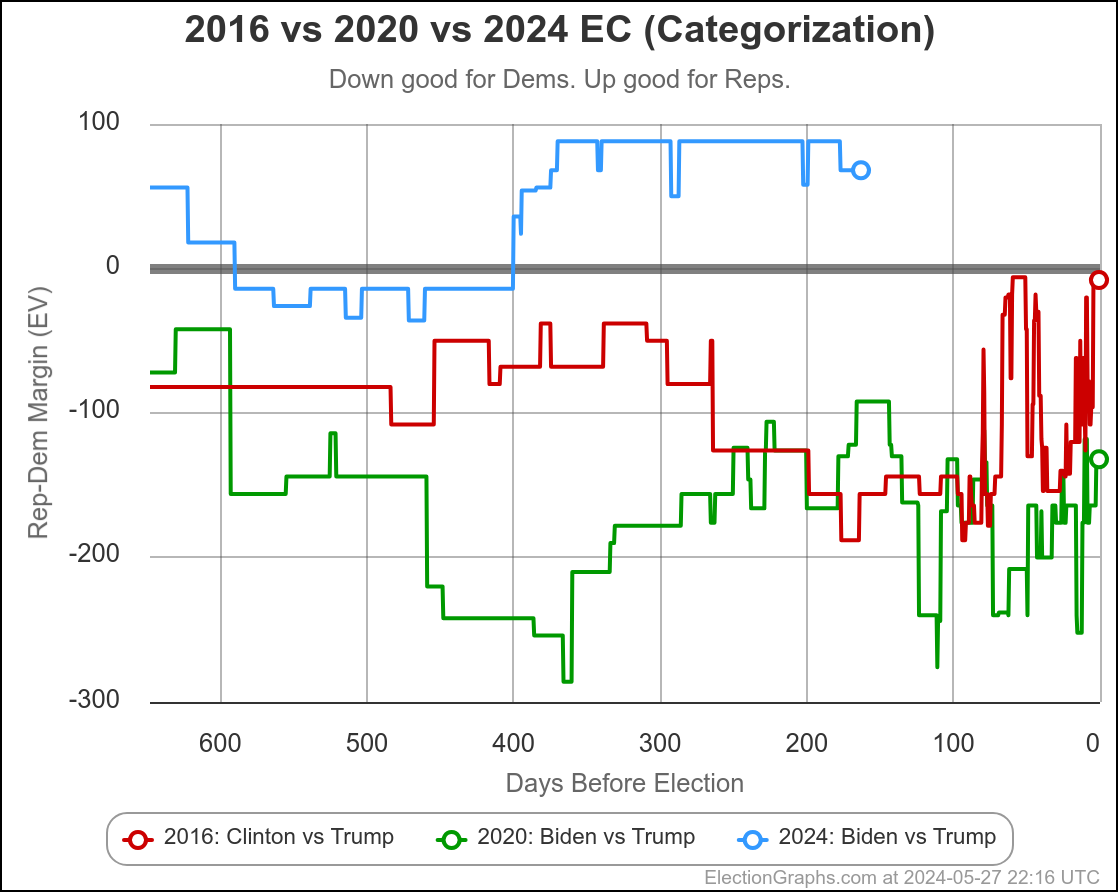
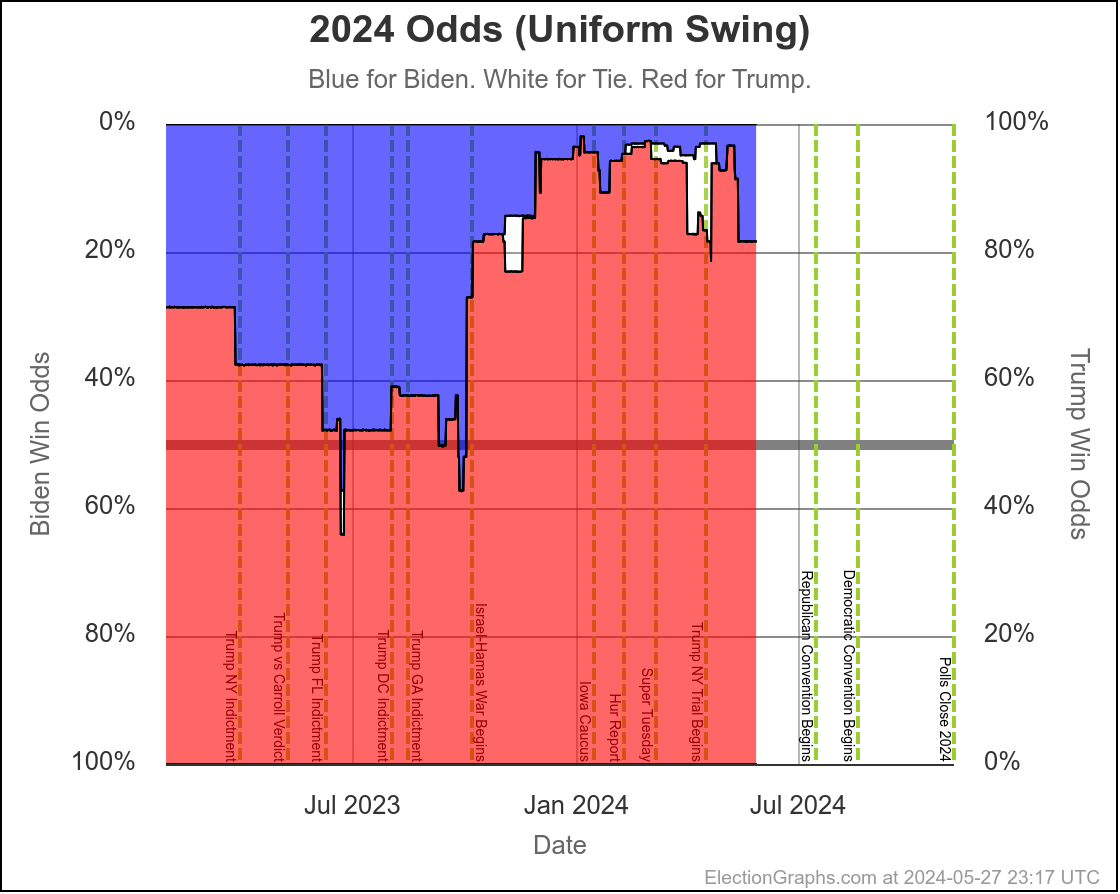
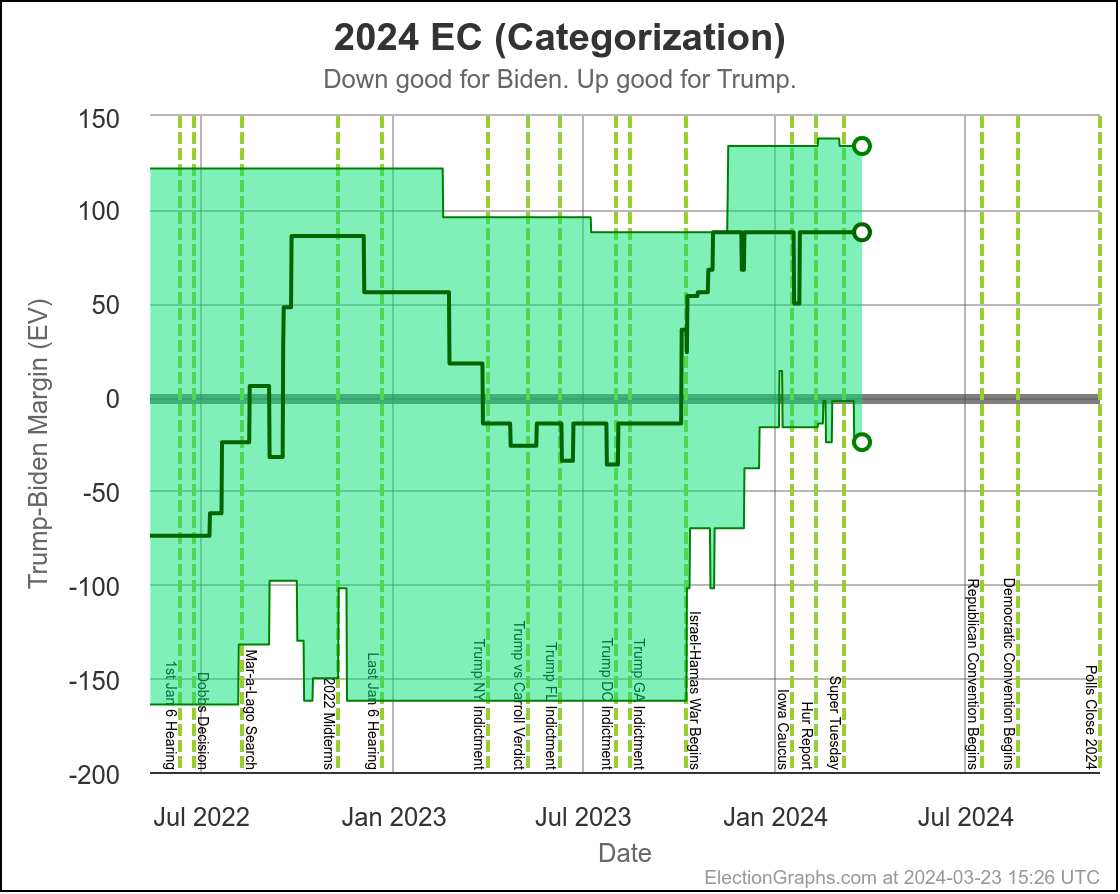
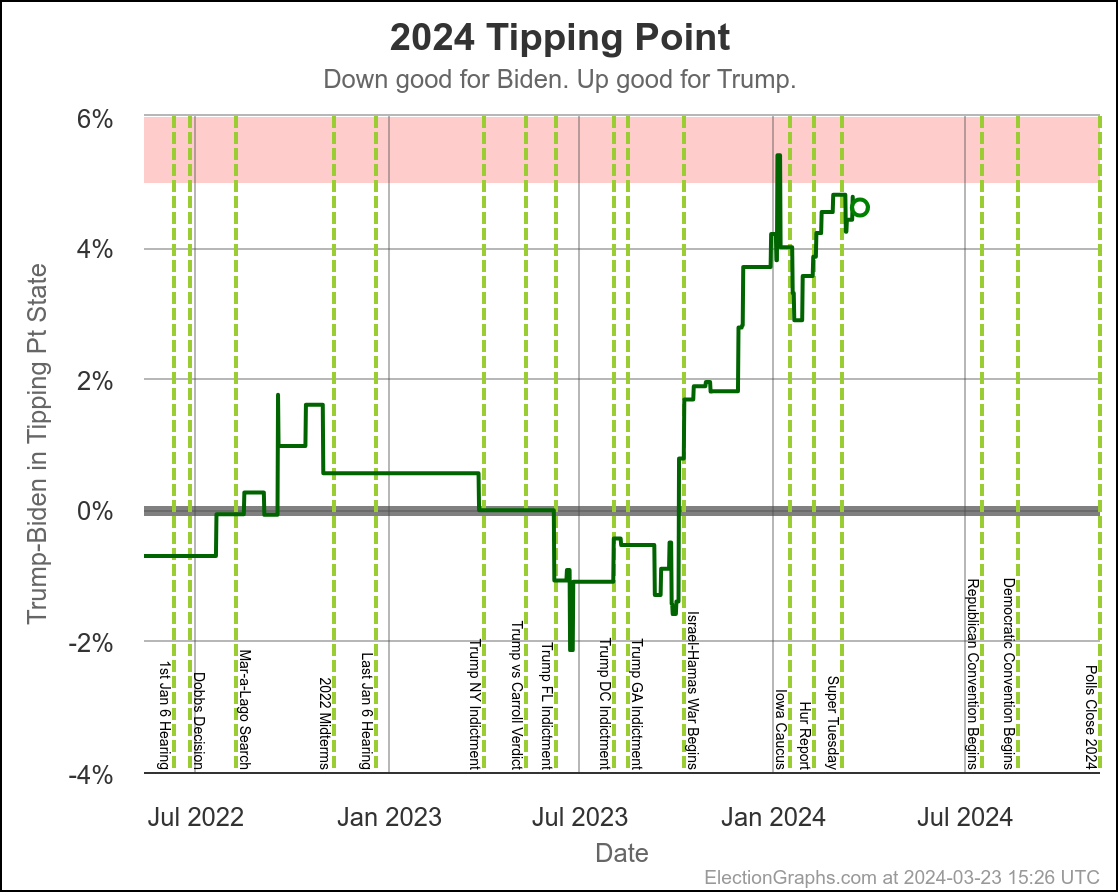
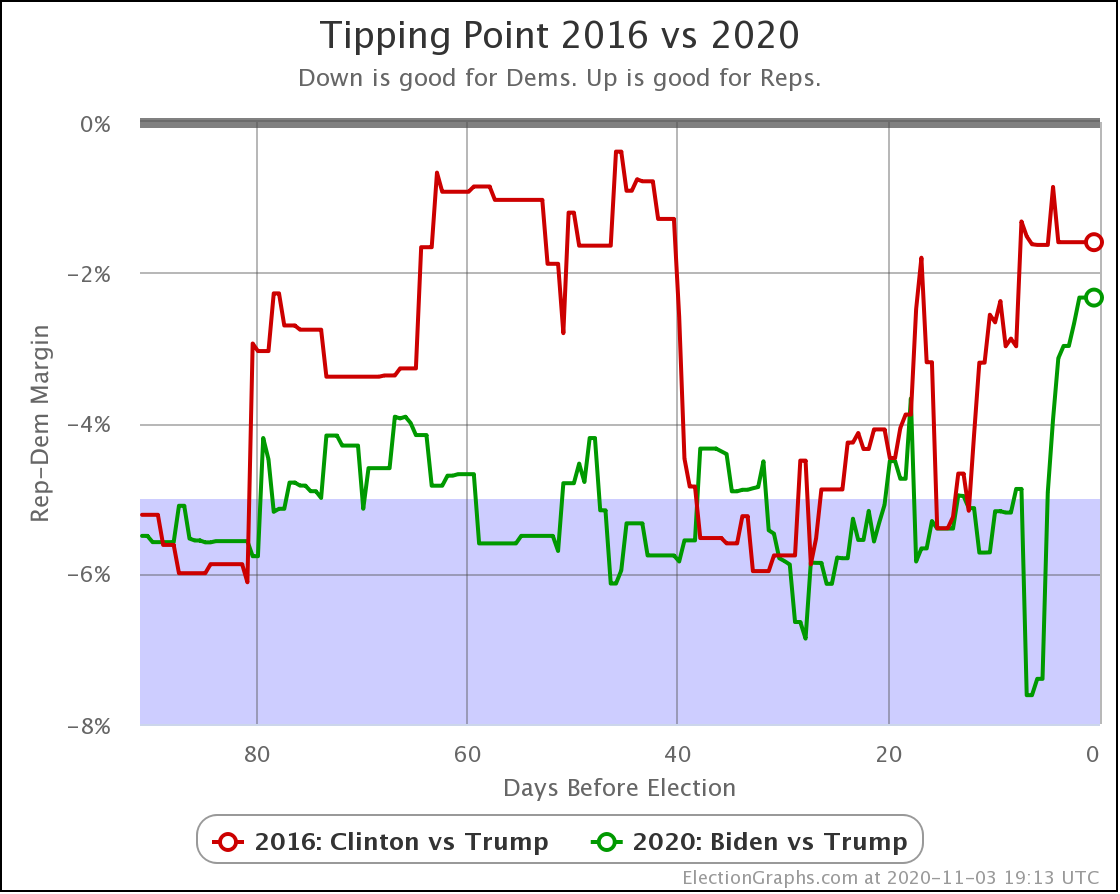
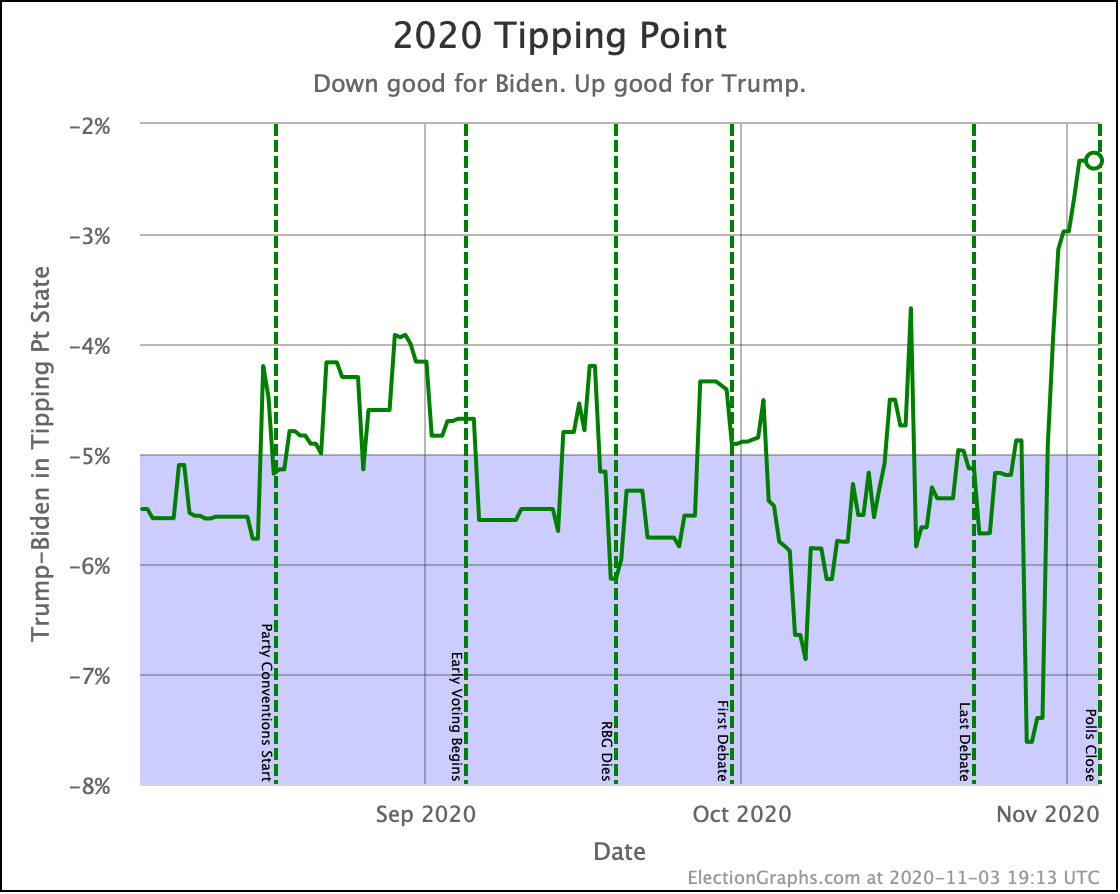
We'll dive into what things initially look like for Harris in just a minute, but first, a quick look at how Biden vs Trump went in the time until he dropped out, using the tipping point as our main proxy metric:
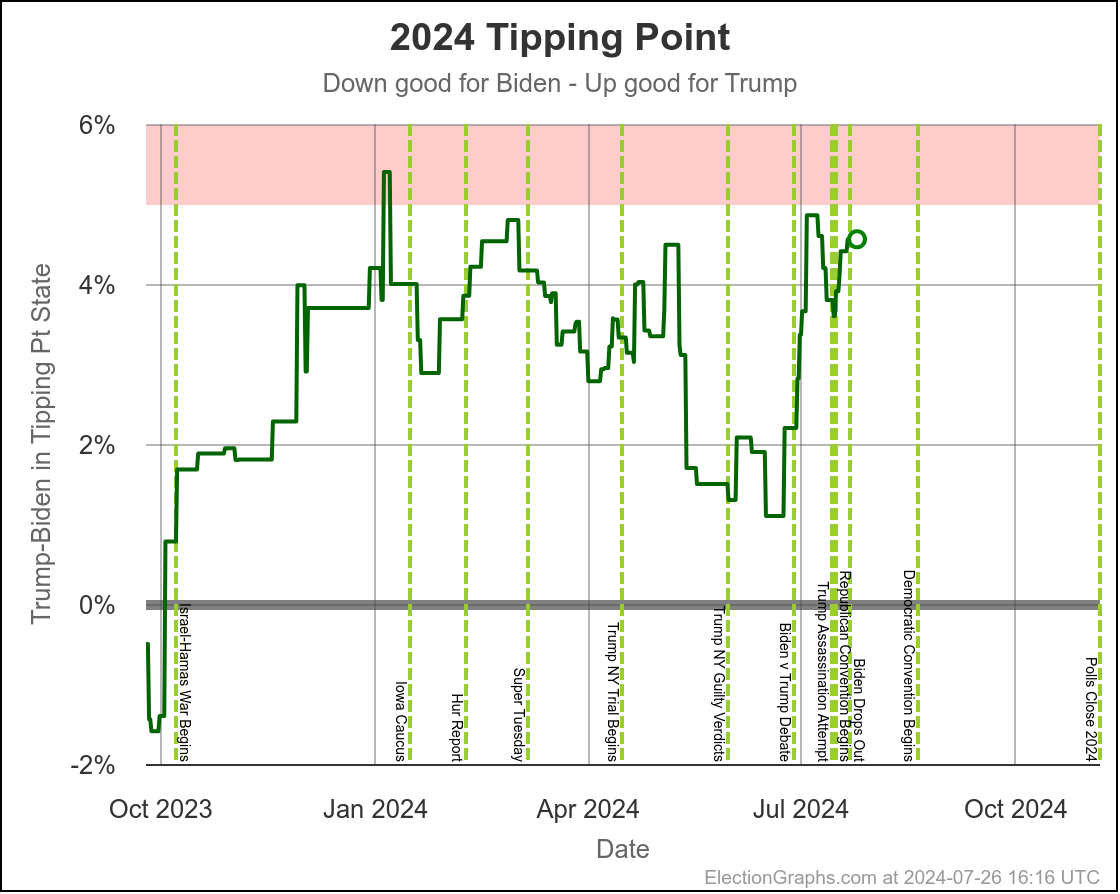
You can see the vertical "event lines" for the debate, the assassination attempt, the start of the Republican Convention, and Biden dropping out. These events are all smushed pretty closely together in time, but you can see some pretty clear directional changes.
Just a week or so before the debate, Biden had been in his best position since early October. That had started to slip a little before the debate, but then after the debate, Biden immediately collapsed to the second worst spot he has ever been in, second only to a very brief time in January.
Over the first half of the year he had been slowly whittling away at Trump's lead. National polls once again had the race as a dead heat. Progress was being made in the swing states.
Following the debate, that was all erased practically overnight.
After about a week though, Biden started reclaiming some of that lost ground. He had a long way to go to get back to where he had been prior to the debate, but things were going in the right direction for him again.
Then the assassination attempt on Trump happened, followed by the Republican National Convention in close succession, and Biden's numbers started to fall again.
And that is when he dropped out.
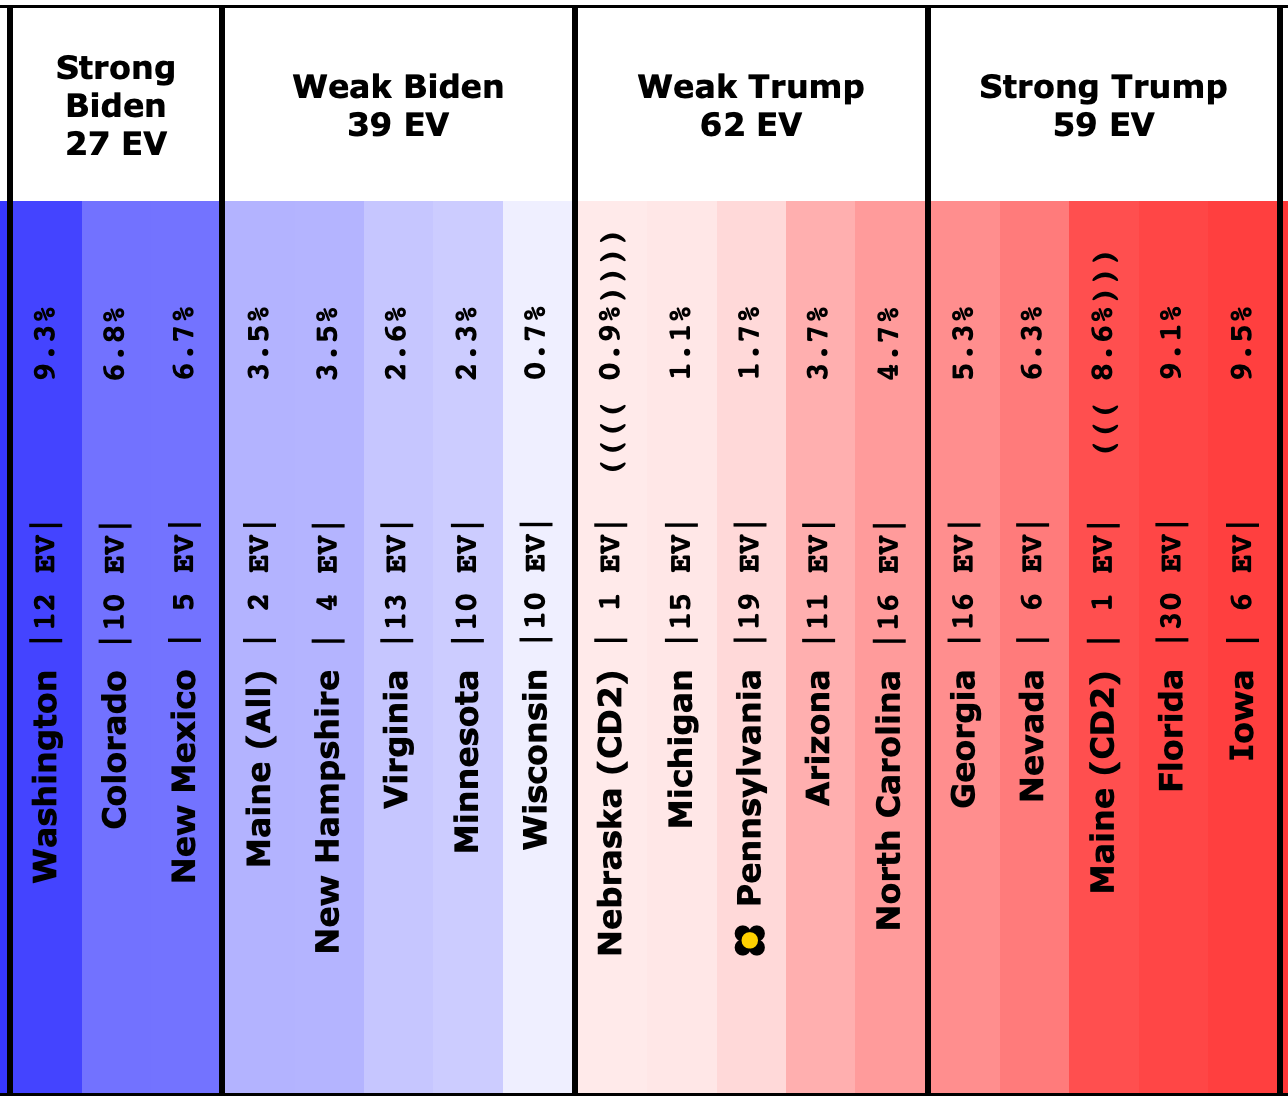
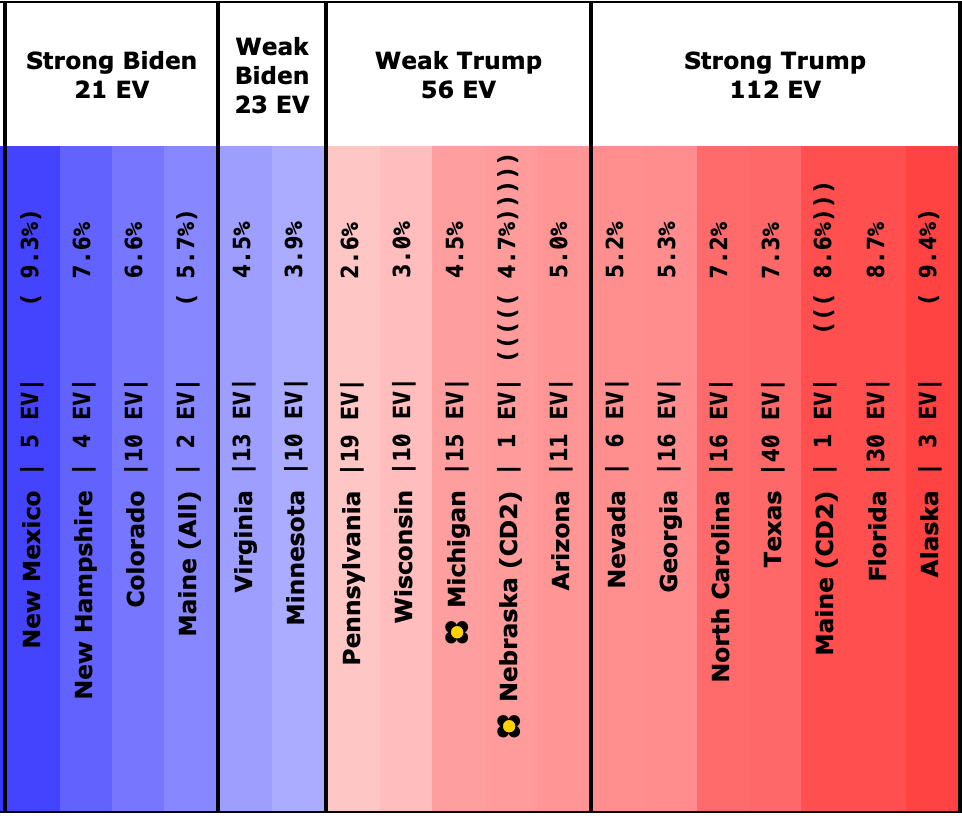
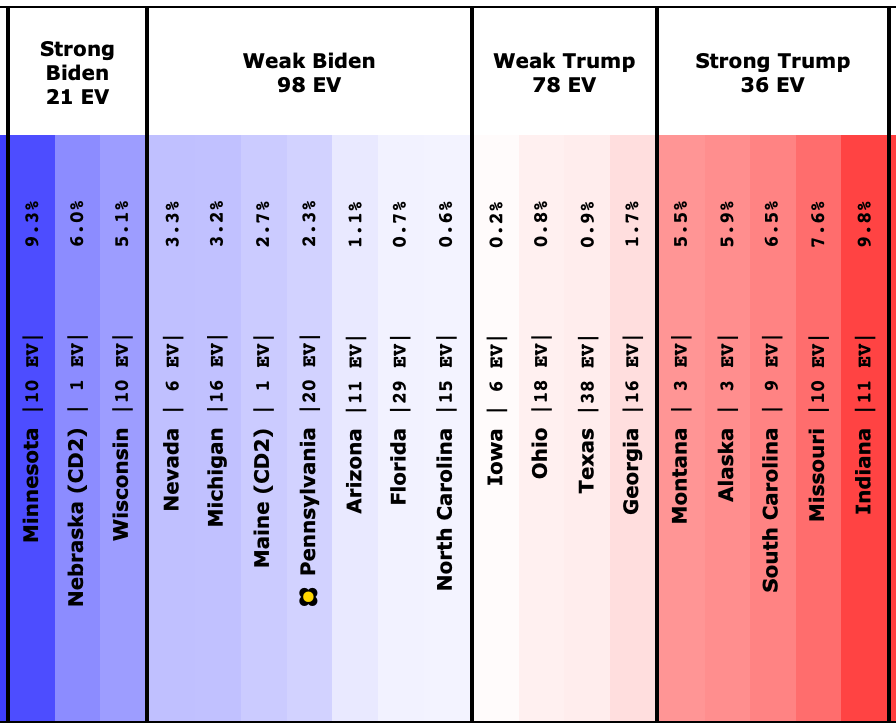
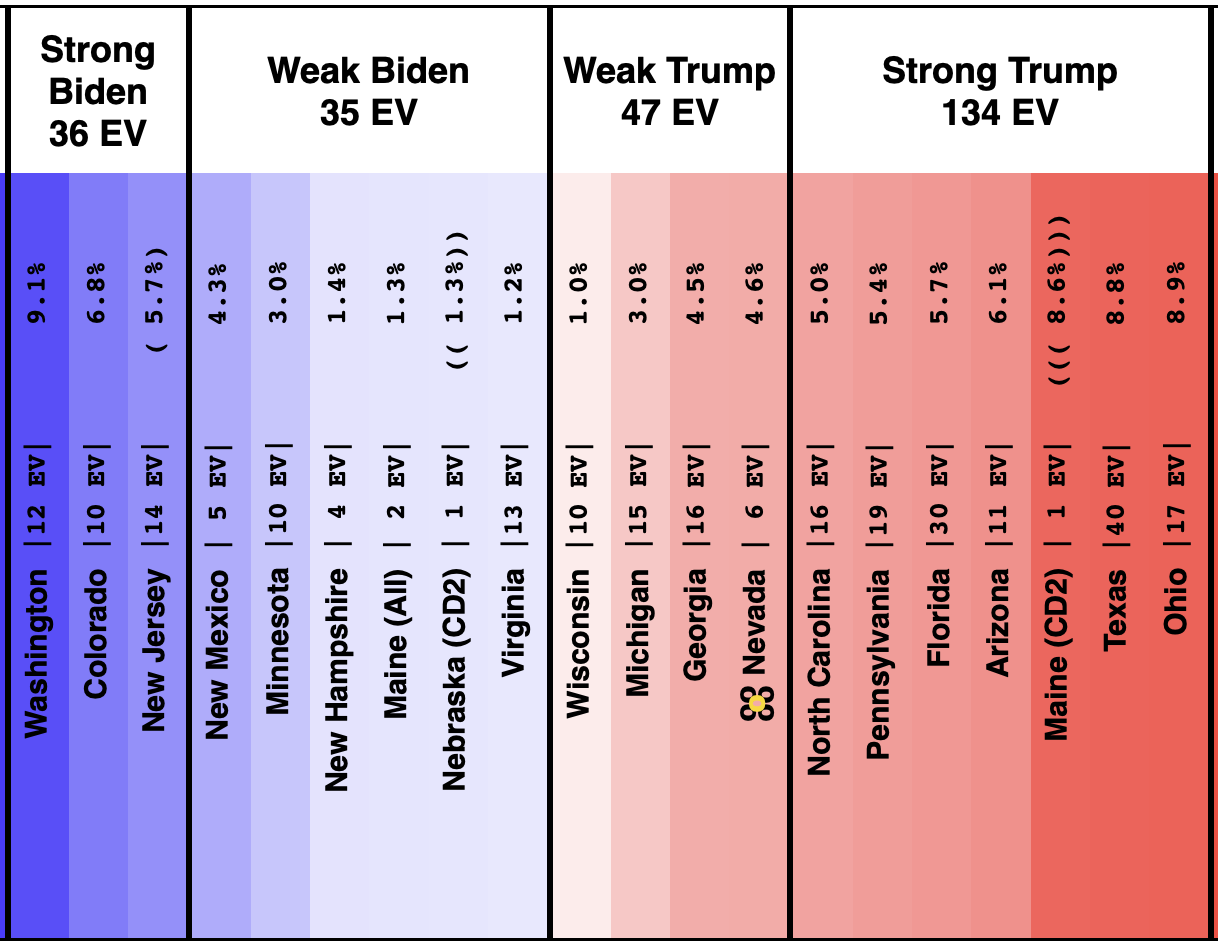
Here is where his spectrum of the even remotely close states stands as of July 28th, after the last set of polls that were in the field before he dropped out:
So what about Harris?
Well, first of all, before the debate there hadn't been a Harris vs Trump state level poll since May. And there hadn't been that many. After the debate some new ones started trickling in. And of course after Biden dropped out and Harris became the presumptive nominee there have been quite a few.
But still not really enough yet.
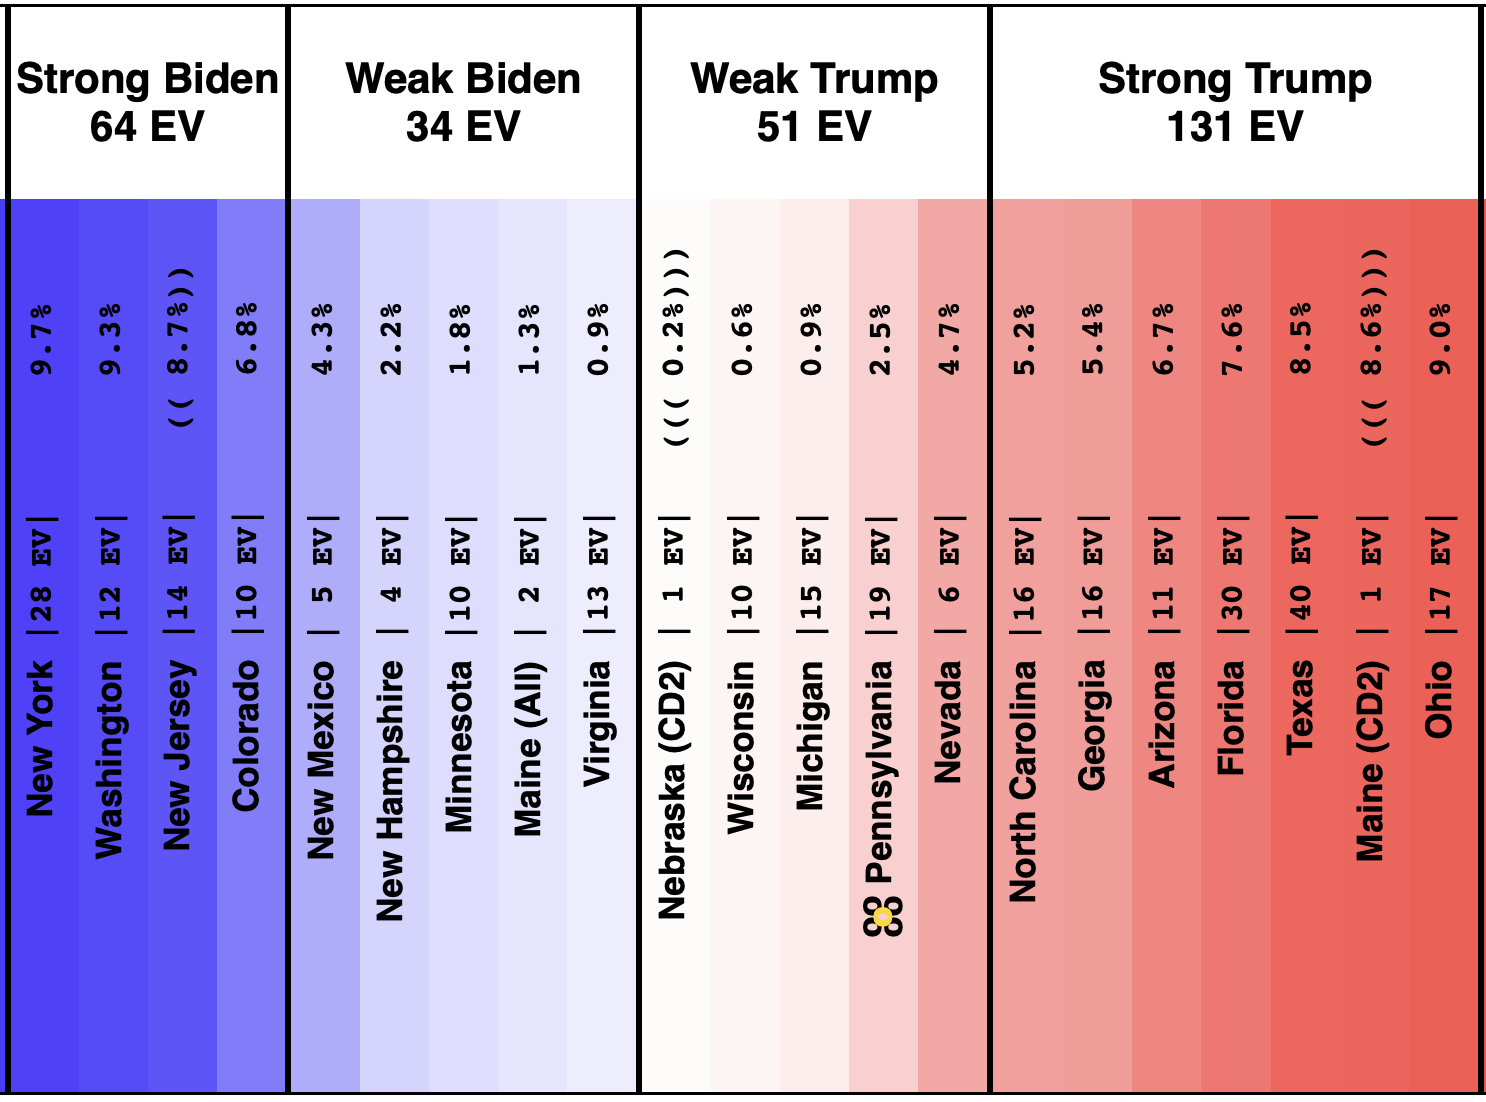
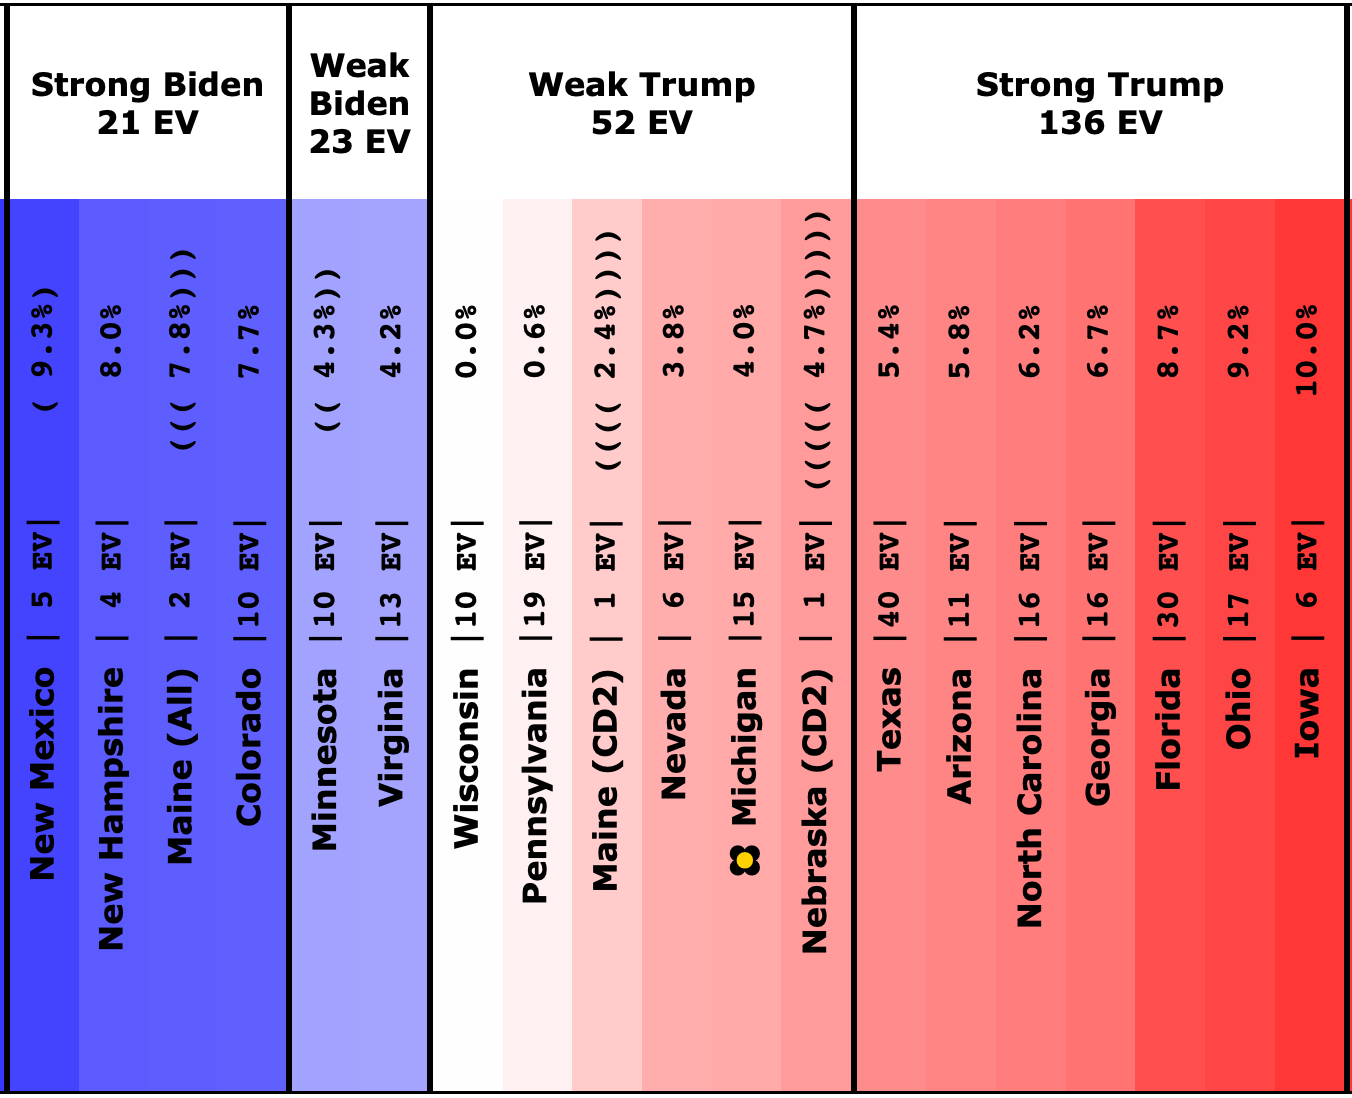
Here is the spectrum of the even remotely close states as of July 28th:
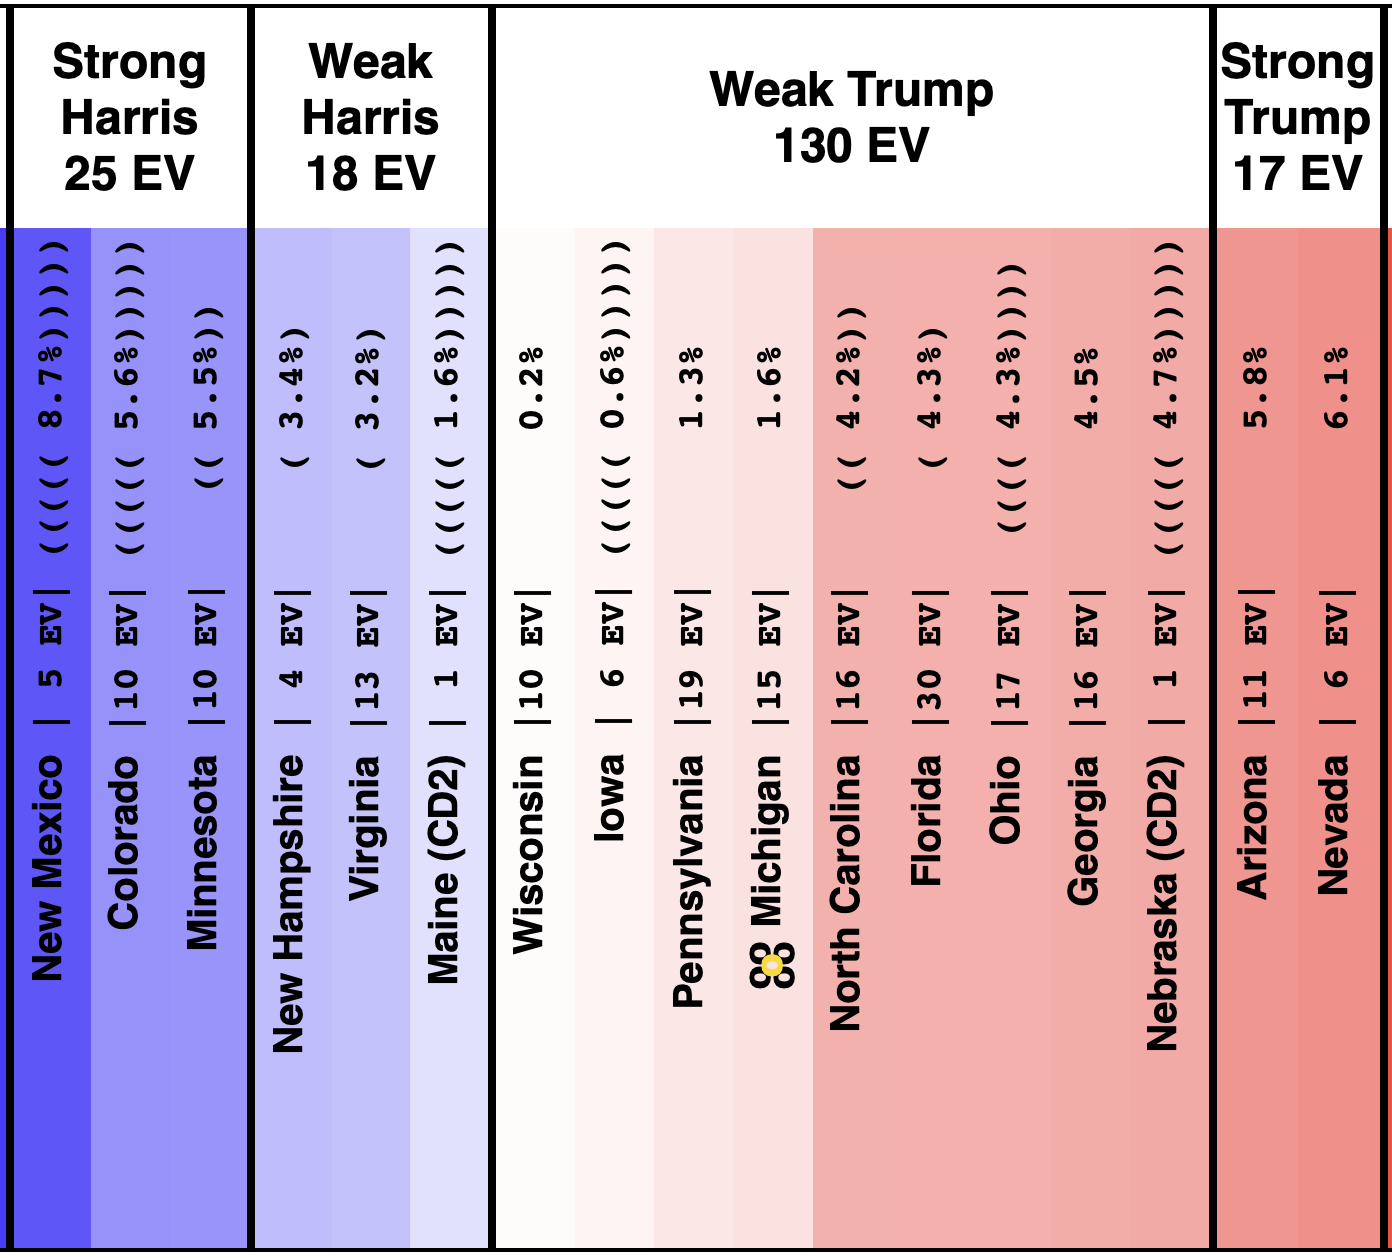
See all those parentheses around the averages? That is how I annotate cases where we don't actually have five 2024 Harris vs Trump polls yet, so I am backfilling with actual election results from previous elections.
So for instance, if there are two pairs of parentheses it means that there are three actual 2024 polls, but I also included the 2020 and 2016 election results in that state to fill out the average.
This is because before you have actual polls, you have to start somewhere to judge where the state is, and I use the last five presidential elections.
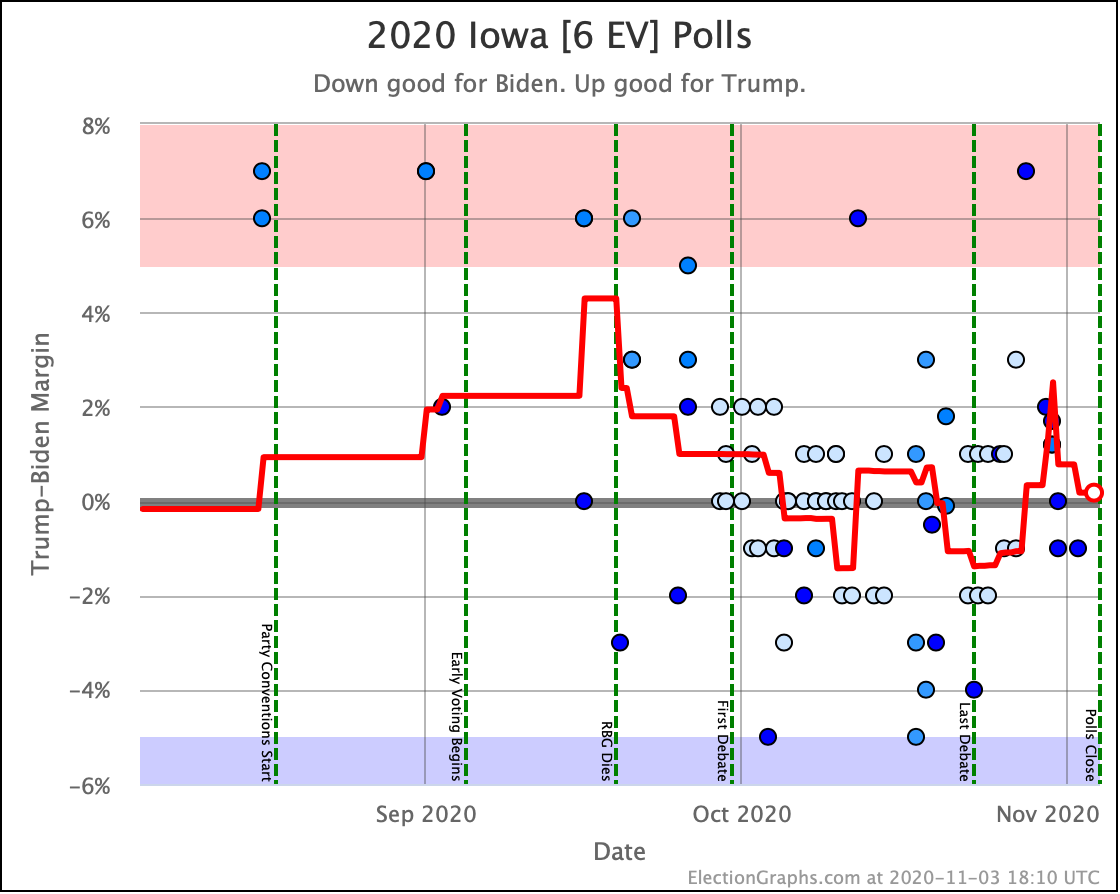
Sometimes where states have changed rapidly over those years that can be a bit misleading until you get real polls. For instance, you can see above that there have been no Harris vs Trump polls at all yet in Iowa.
Over the last five elections, Iowa went Democratic twice (2008 and 2012) and Republican three times (2004, 2016, and 2020). Averaged out you get a 0.6% Republican lead in Iowa. But 2016 and 2020 were Republican wins by over 8%. And the polling average for Biden vs Trump had stood at an 11.2% Biden lead.
We clearly need actual Harris vs Trump polling in Iowa, because it is not reasonable to expect that Iowa is actually as close as it looks based on the "last five elections" starting point. It most likely is more Trumpy than that. Probably not that far off from the Biden vs Trump number.
At the moment only Wisconsin, Pennsylvania, Michigan, Georgia, Arizona, and Nevada have an average based only on 2024 data, and some of that data is from before Biden dropped out.
We have absolutely nothing on New Mexico, Colorado, Maine's 2nd, Iowa, or Nebraska's 2nd. (Or for almost all of the "not remotely close" states either, but they don't really matter much.)
The rest of the close states are in between.
This is rapidly filling in though. At the time Biden dropped out we only had Wisconsin, Pennsylvania, and Georgia with full five poll averages. In the last week three additional states achieved that milestone.
OK. With all of that said, given the data we do have, what can we say about where Harris vs Trump stands?
First up, looking ONLY at the states where the average is based completely on Harris vs Trump polls instead of pulling in old elections, lets see how Harris is doing compared to Biden based on the two snapshots above.
Harris improves on Biden in these states:
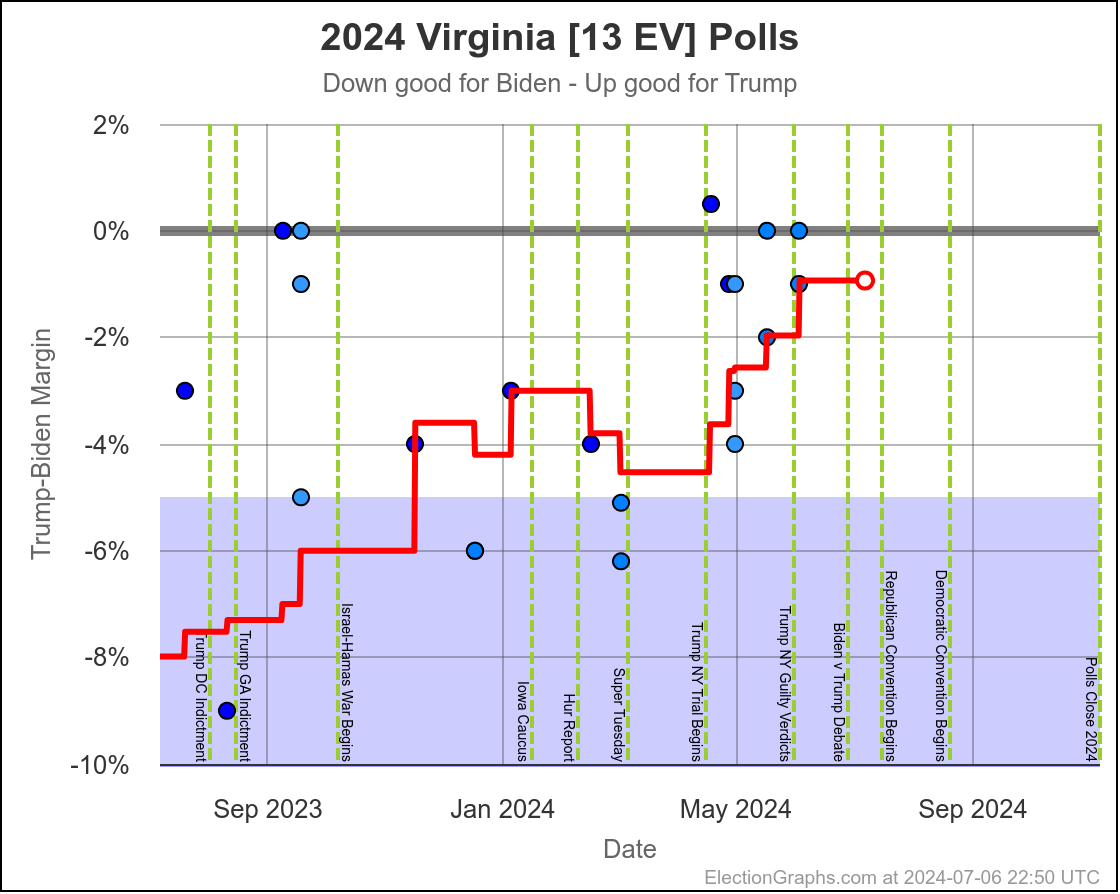
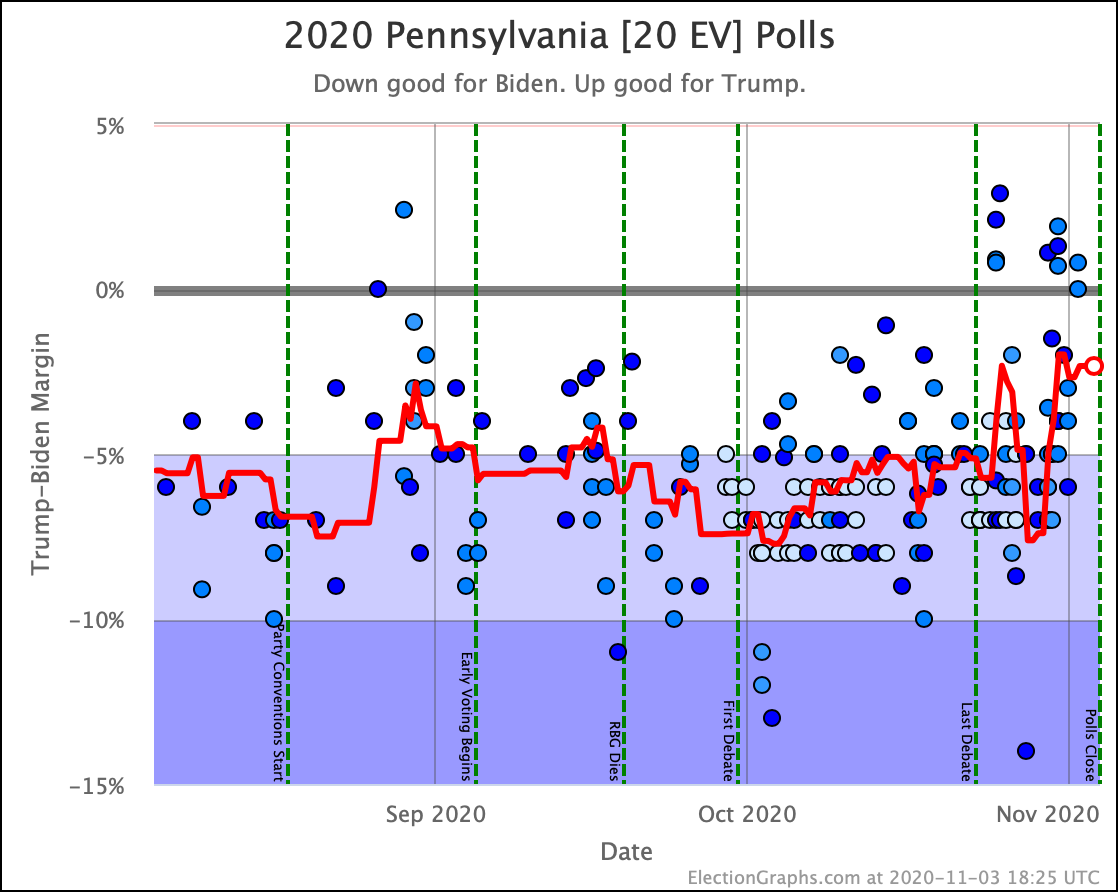
- Pennsylvania:
- Trump led Biden by 5.4%
- Trump leads Harris by 1.3% (4.1% Harris gain)
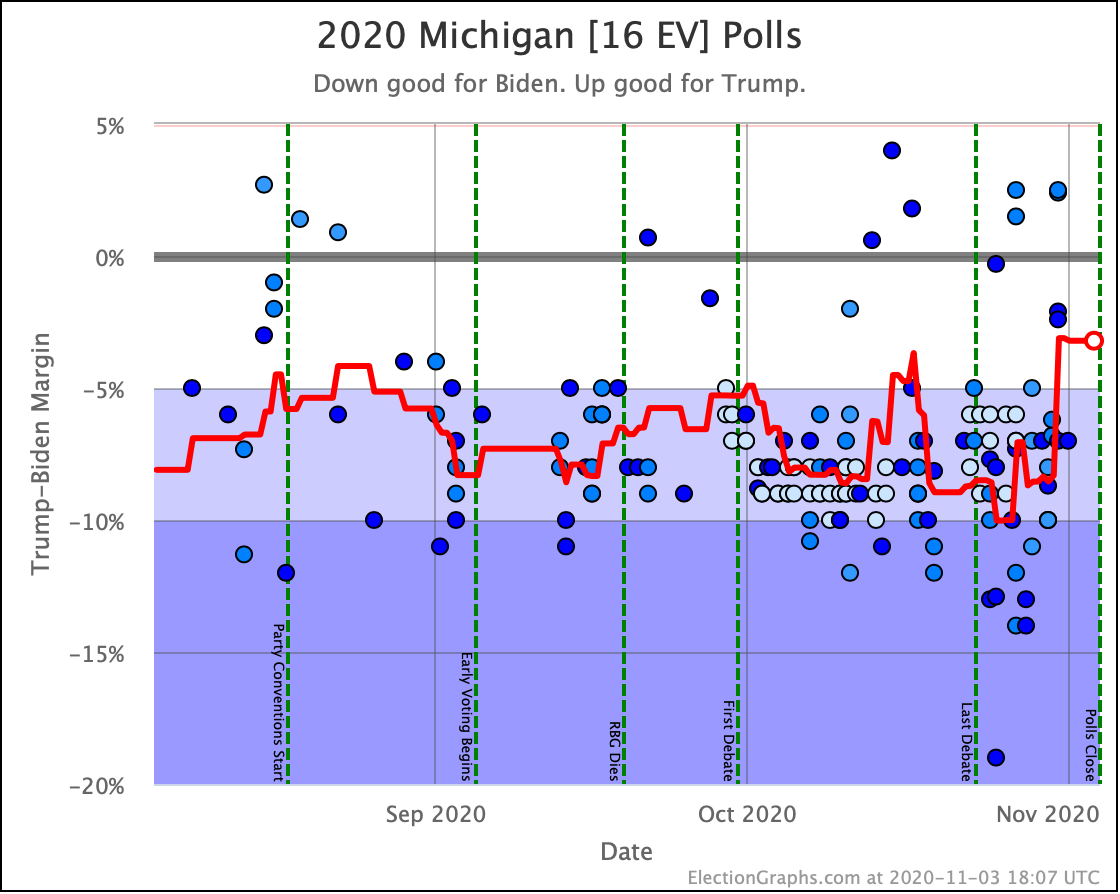
- Michigan:
- Trump led Biden by 3.0%
- Trump leads Harris by 1.6% (1.4% Harris gain)
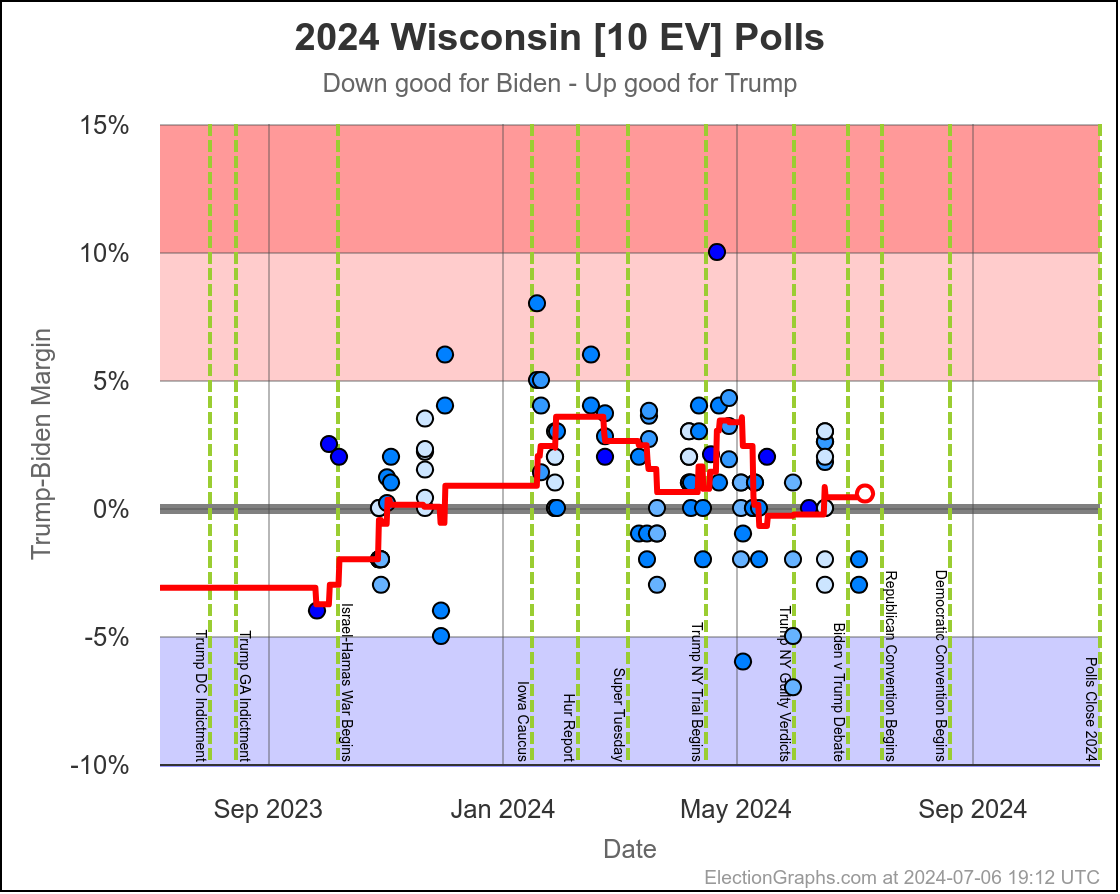
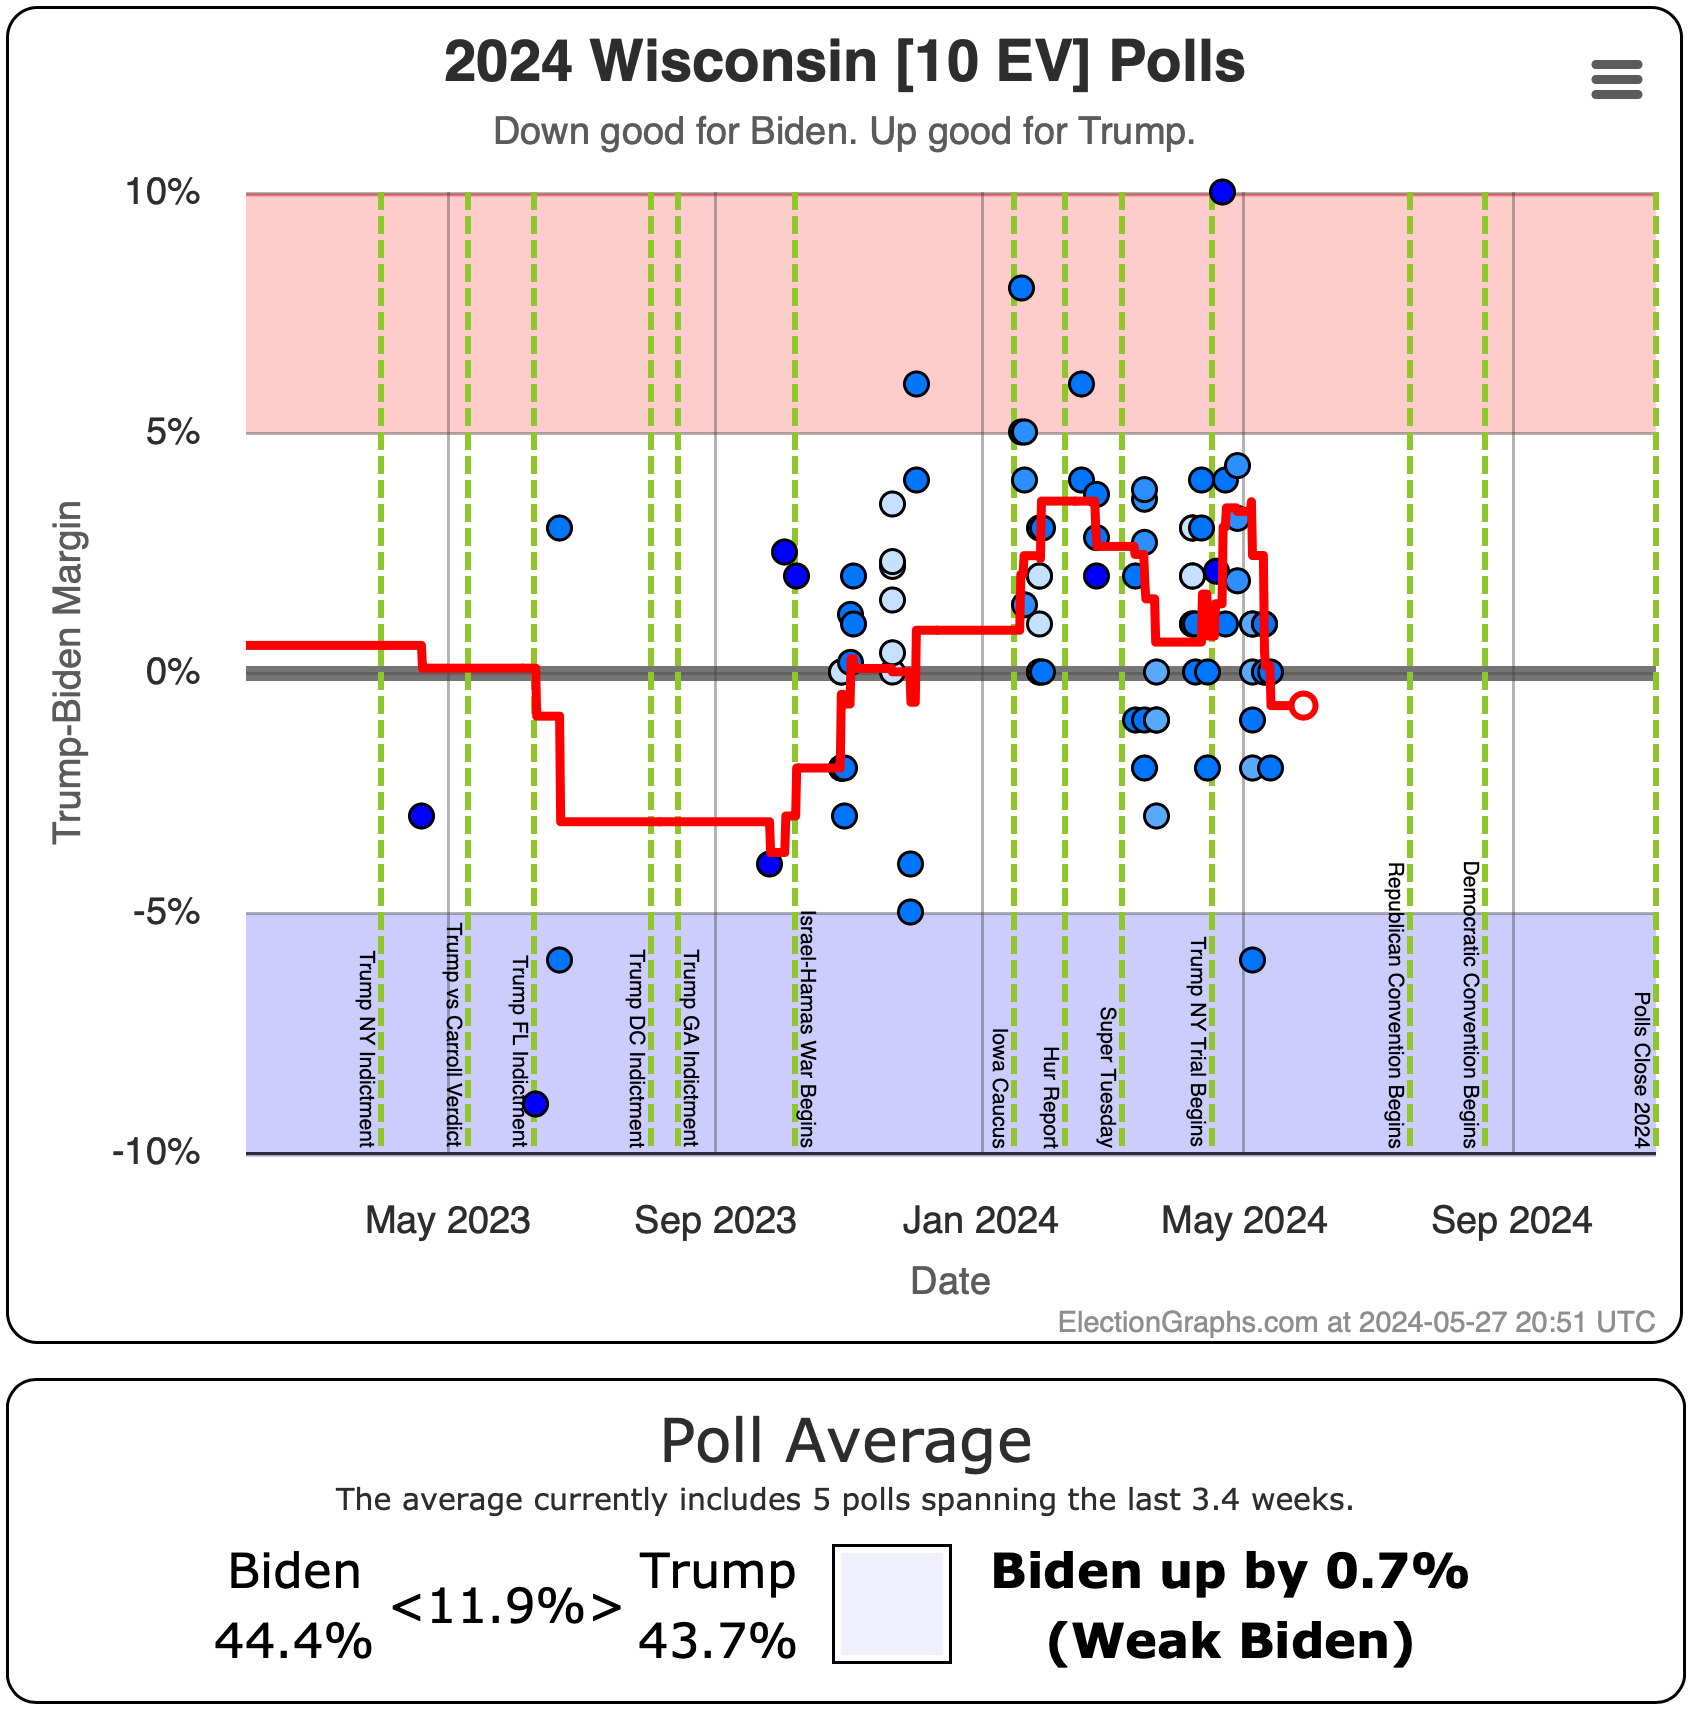
- Wisconsin:
- Trump led Biden by 1.0%
- Trump leads Harris by 0.2% (0.8% Harris gain)
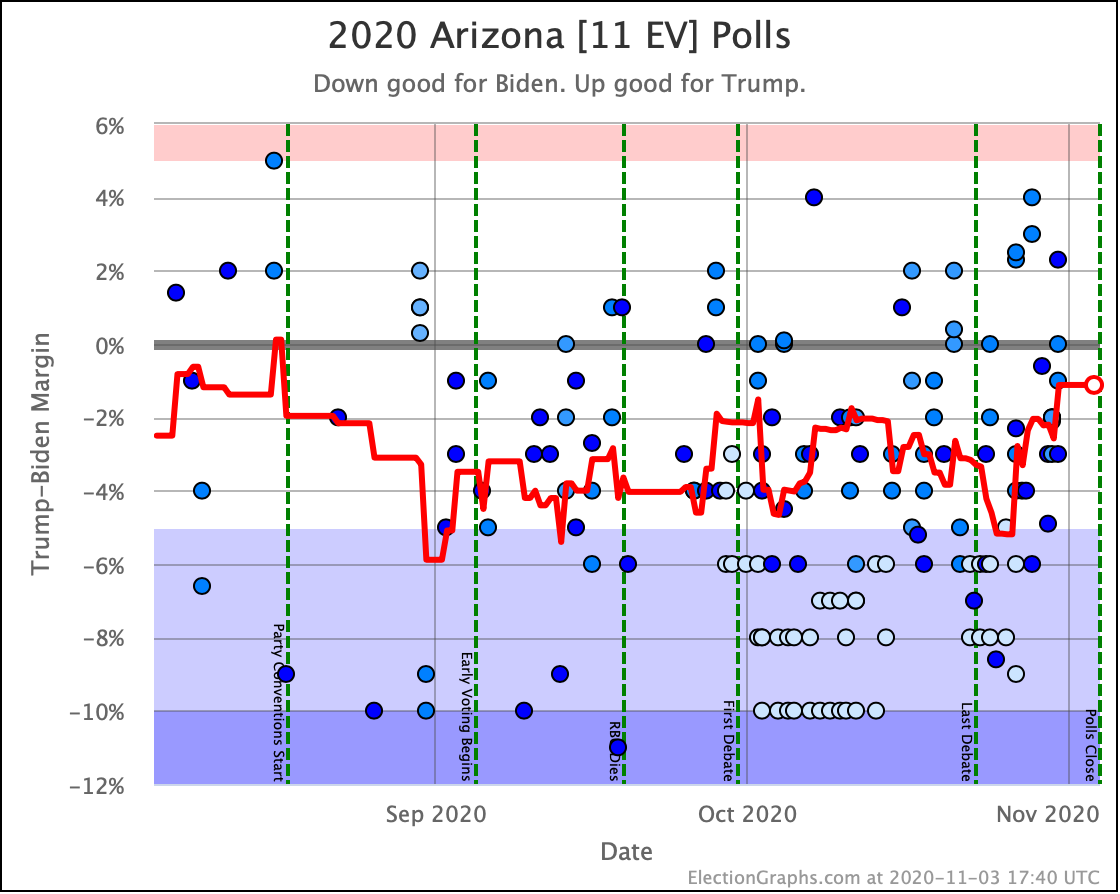
- Arizona:
- Trump led Biden by 6.1%
- Trump leads Harris by 5.8% (0.3% Harris gain)
No change in this state:
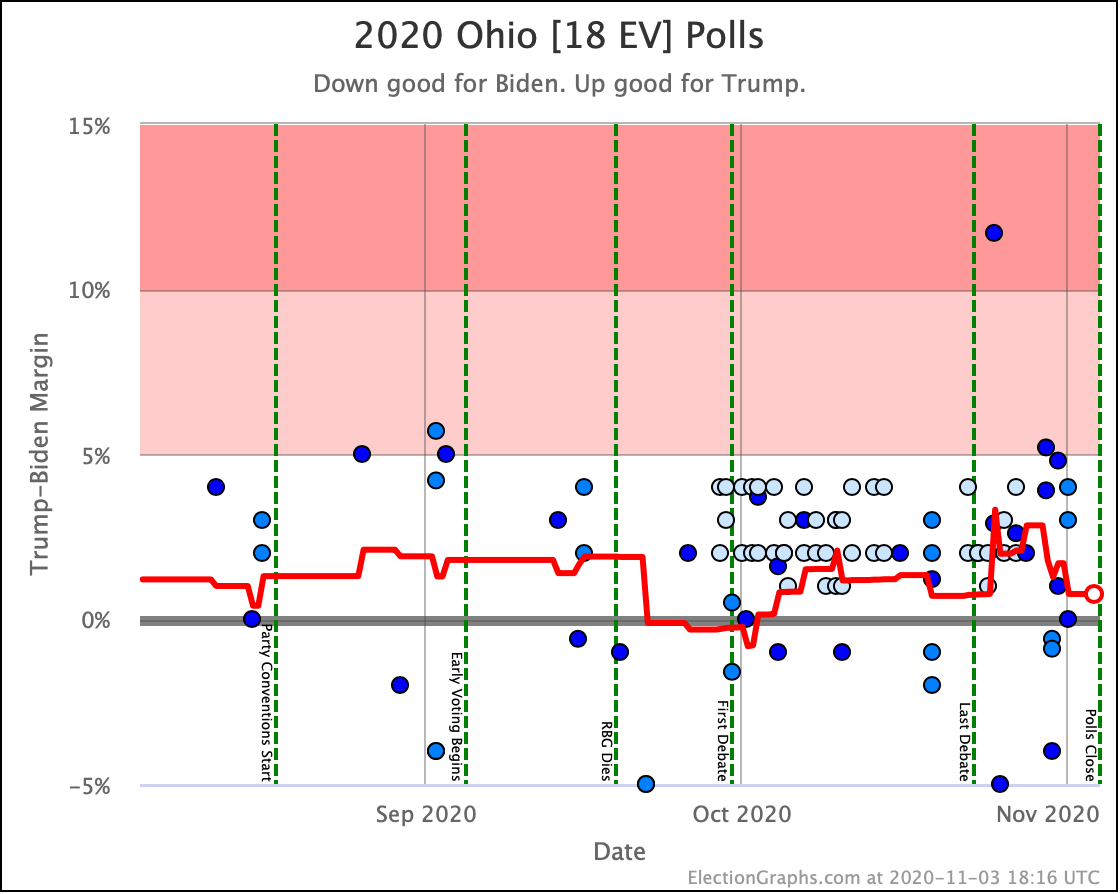
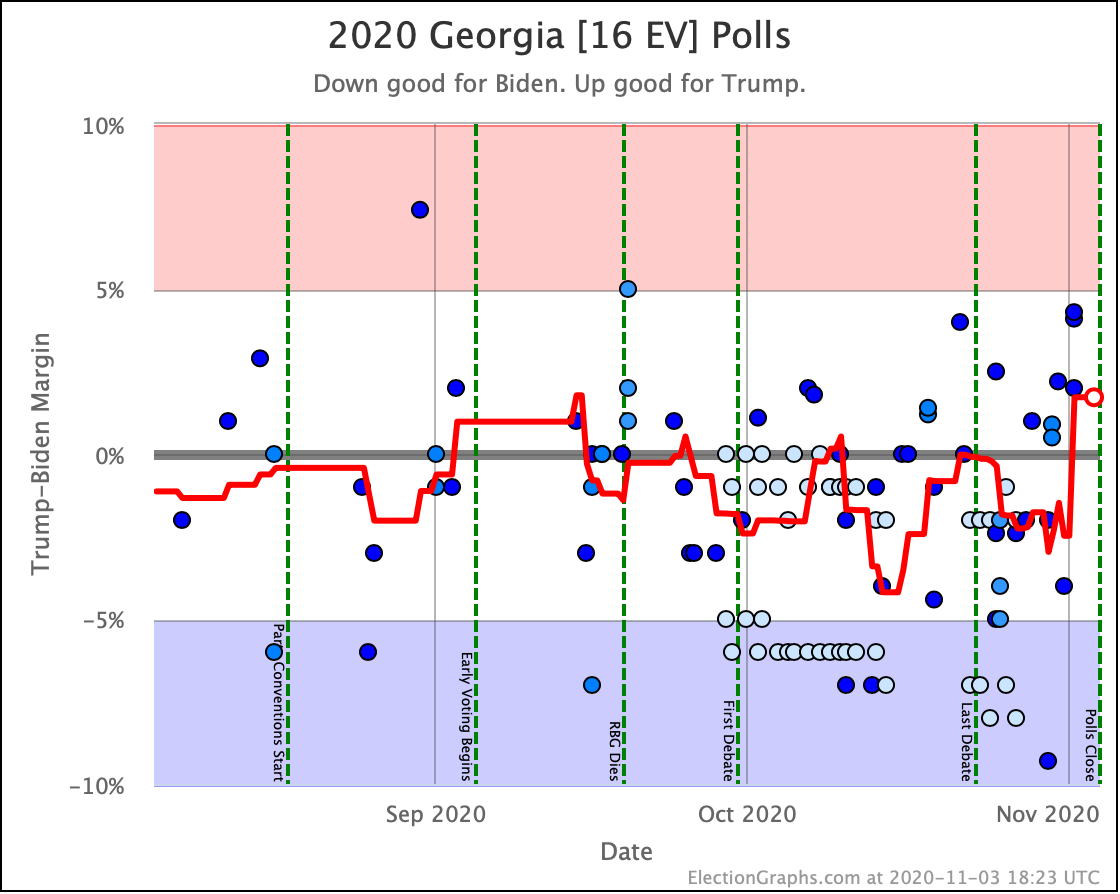
- Georgia:
- Trump led Biden by 4.5%
- Trump leads Harris by 4.5% (No change)
Biden was doing better than Harris in this state:
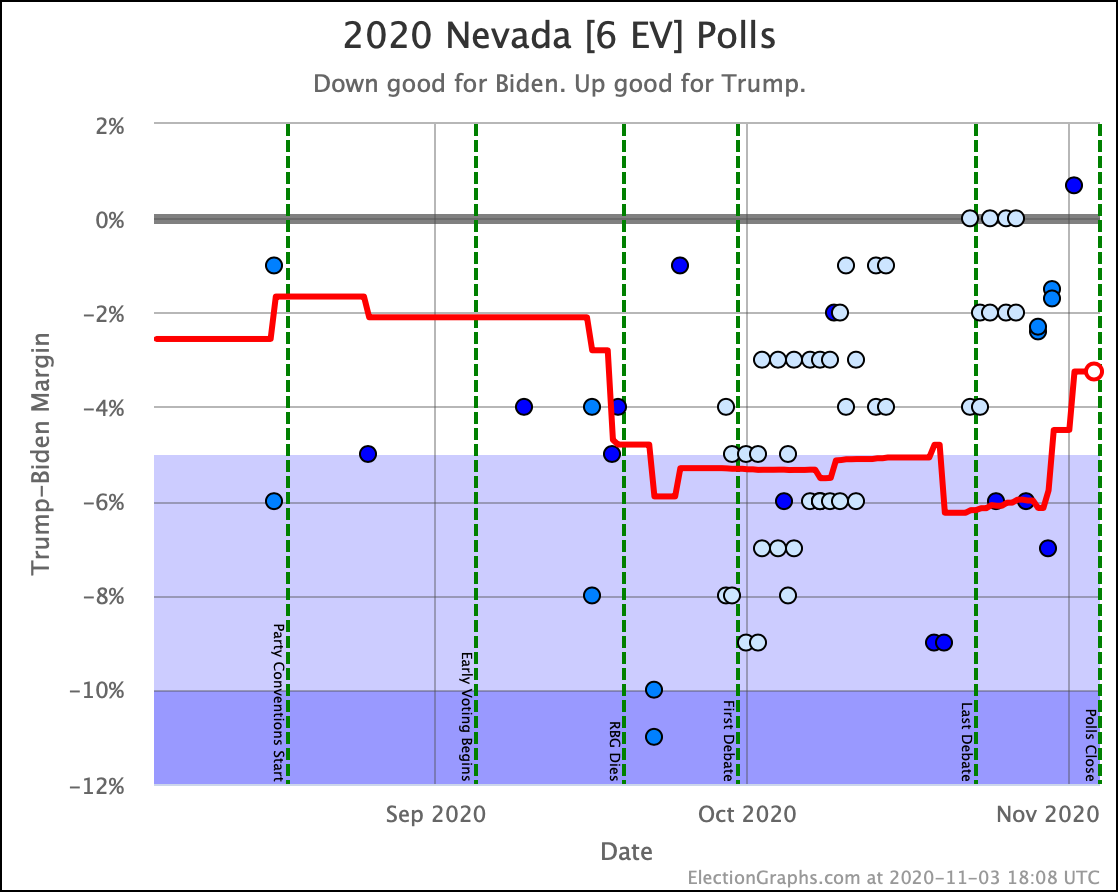
- Nevada:
- Trump led Biden by 4.6%
- Trump leads Harris by 6.1% (1.5% Harris deficit)
Based on these, it looks like so far swapping Harris for Biden has been good for Democratic prospects, at least in these states where we have good data.
Harris is still behind Trump, but there seems to be an enthusiasm that was not there before, and things have started moving toward Harris, at least for the moment.
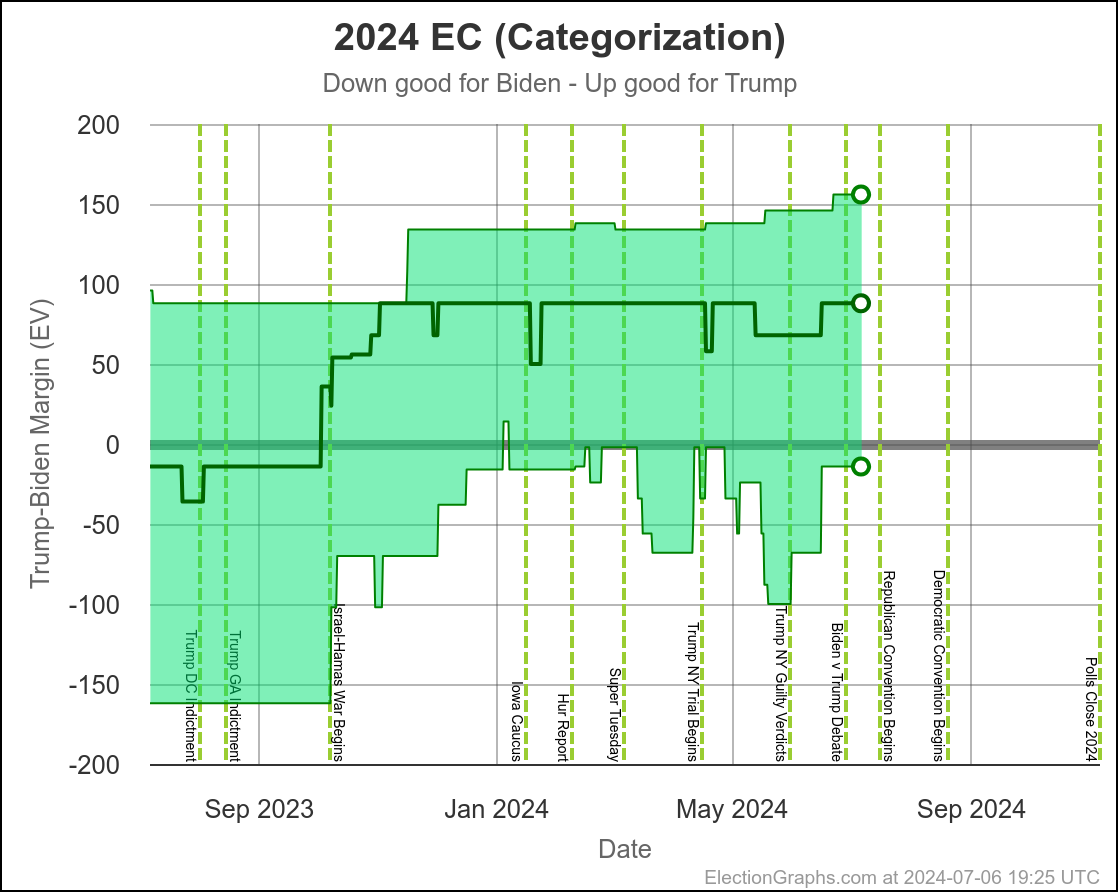
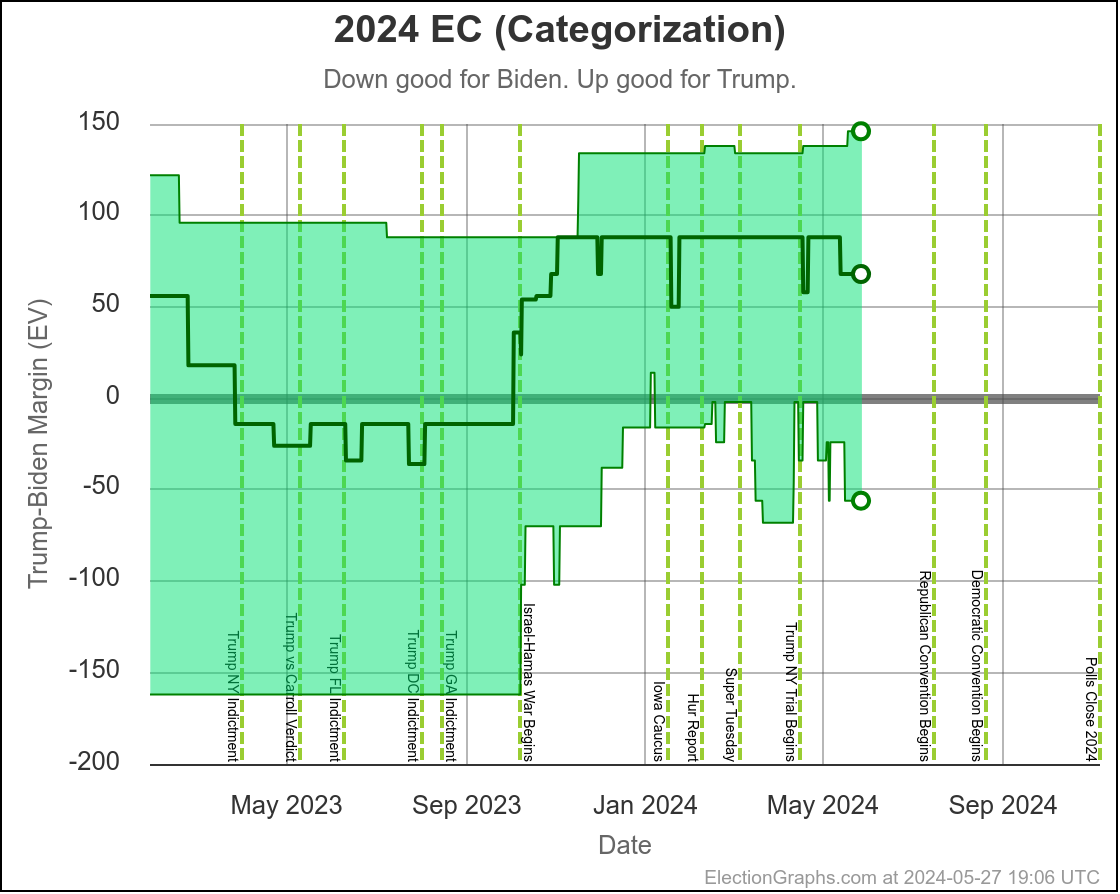
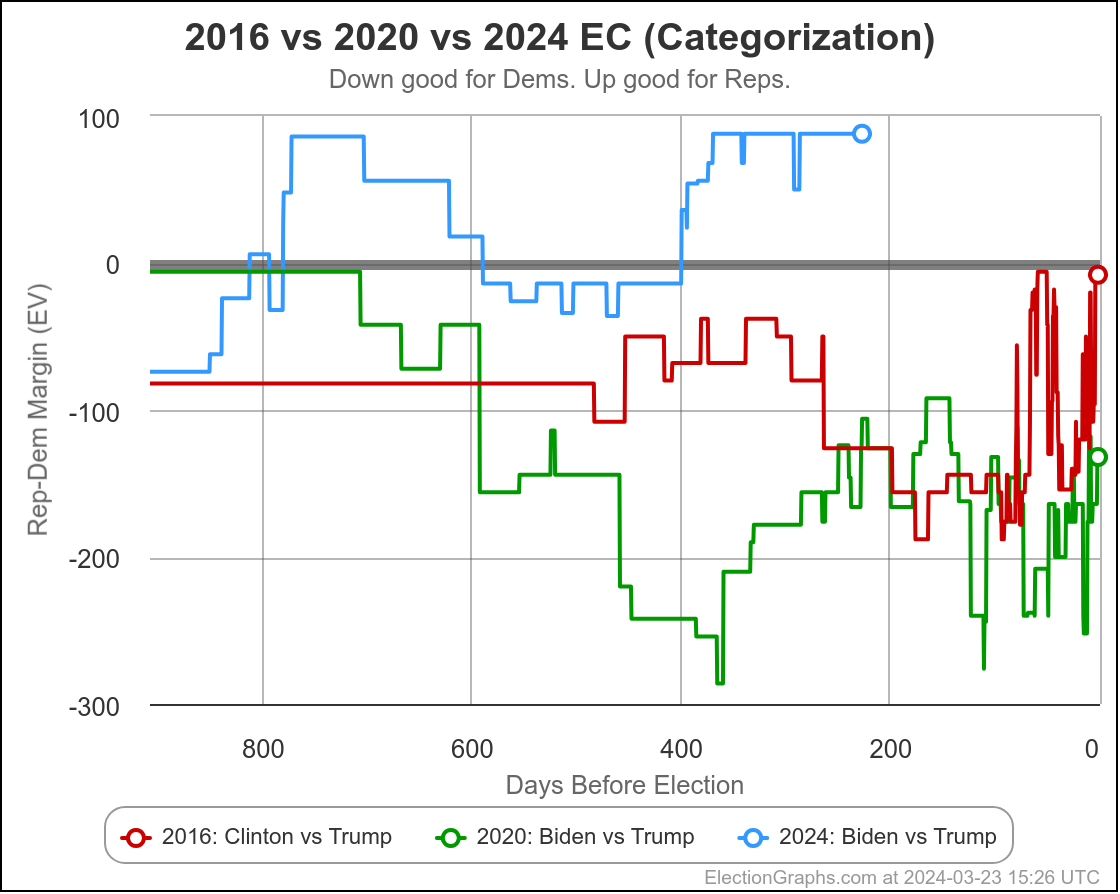
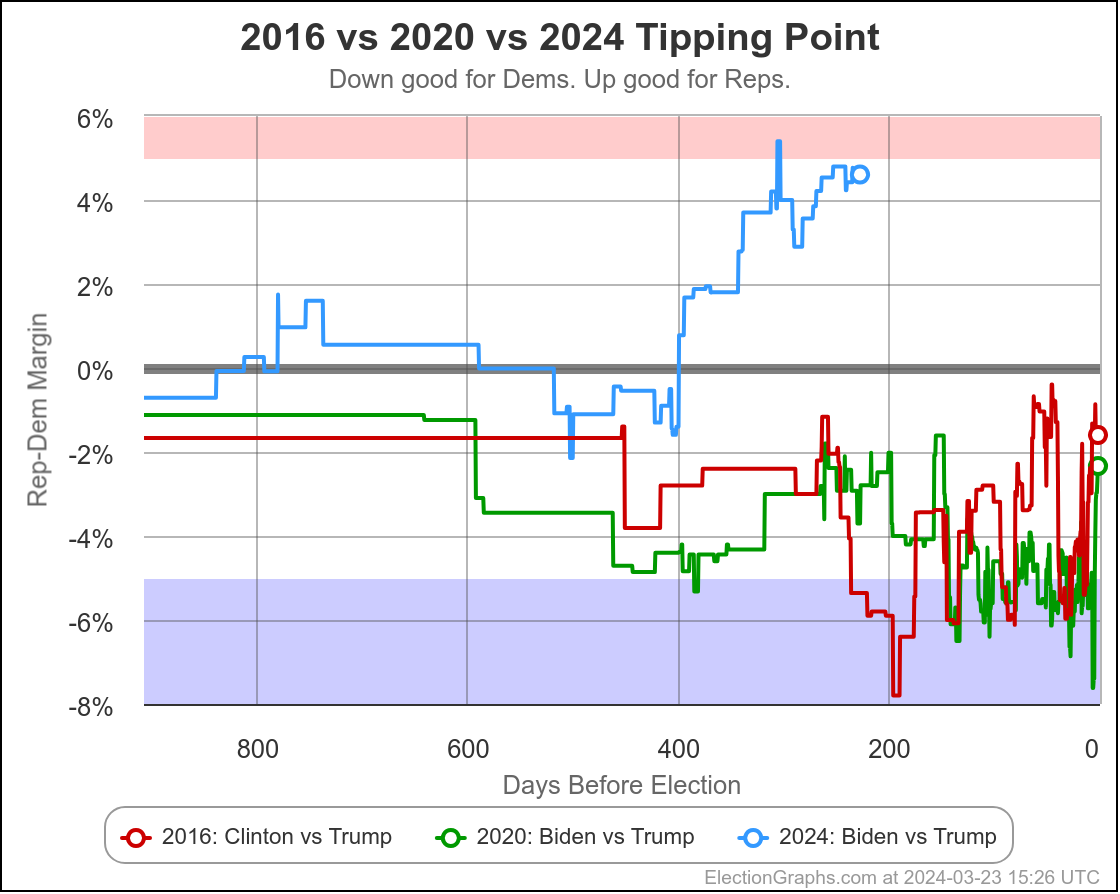
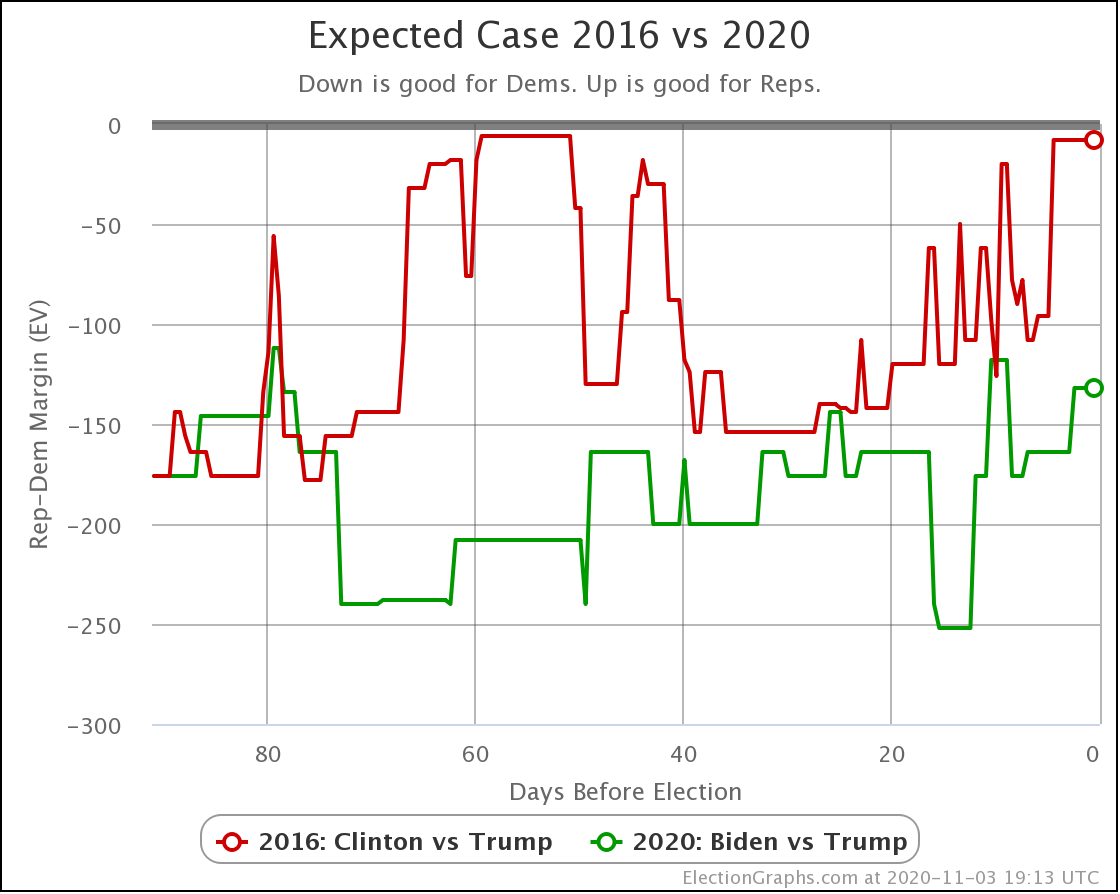
Lets look at some of the national trends over time:
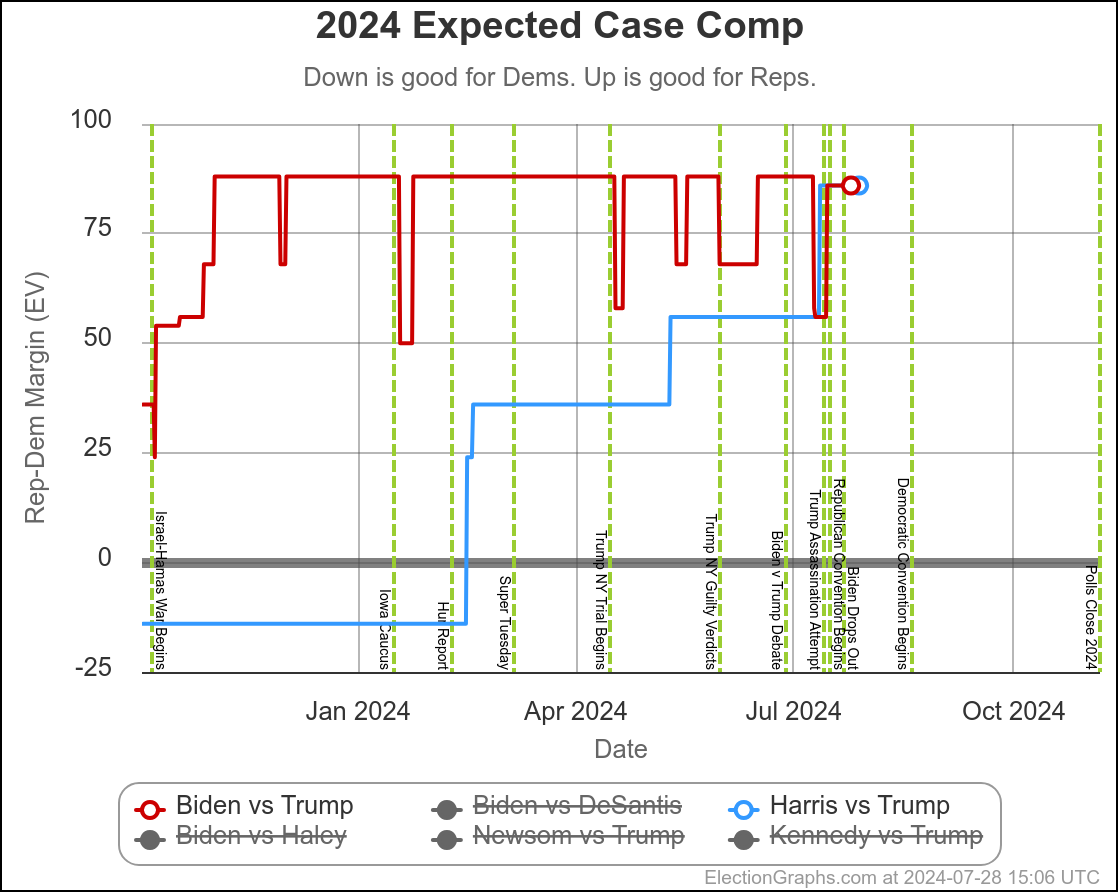
This is the "expected case" chart showing both Biden vs Trump and Harris vs Trump where you just give each candidate every state where they are leading in the poll average, regardless of how small that lead is.
Biden and Harris currently lose by exactly the same amount.
You get 312 electoral votes for Trump, 226 for Harris, giving Trump an 86 electoral vote margin.
The Biden line is much more jiggly because there were lots and lots of polls. The Harris line was more stable, simply because there were very few polls of that combination, and even less that impacted the tipping point state.
But what we do see is that up until the point Biden dropped out, new polling was slowly giving us a picture where the Harris situation looked more and more like the Biden situation.
This was most likely not real changes in public opinion, but rather polls slowly giving us the real situation rather than our baseline inferred from previous elections.
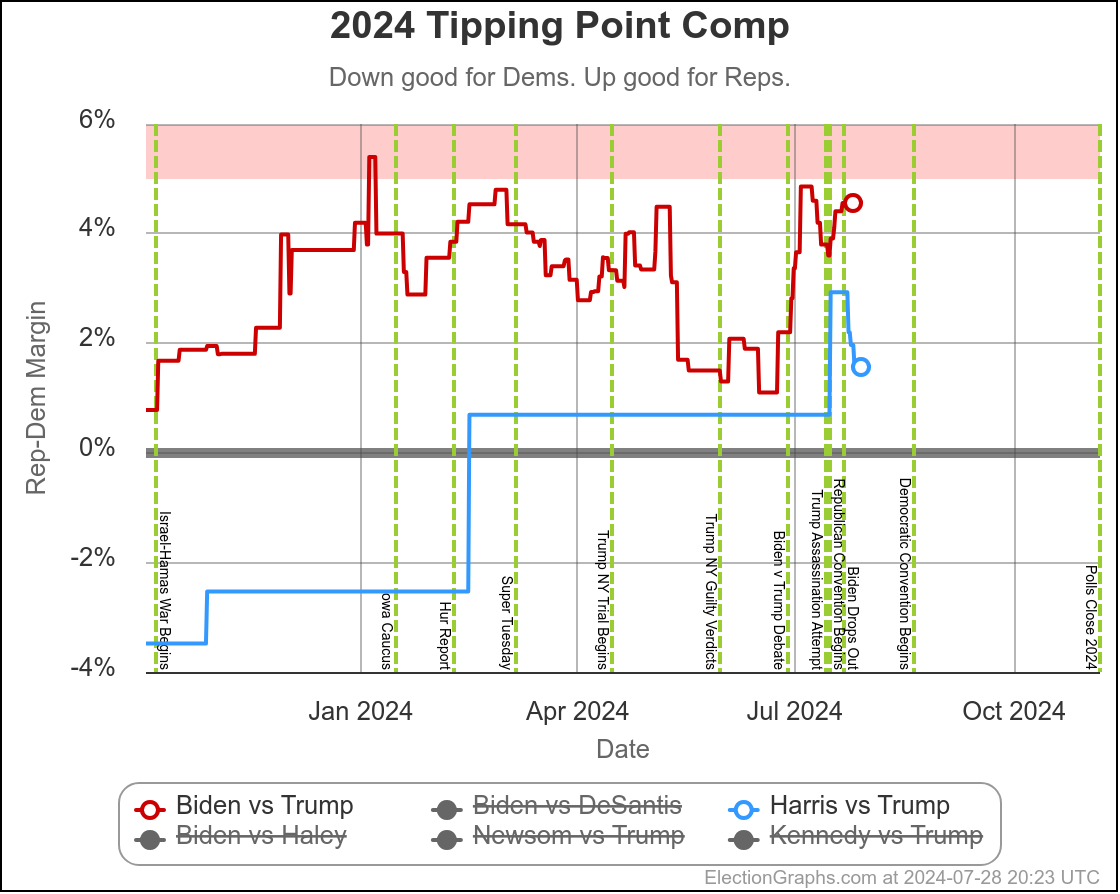
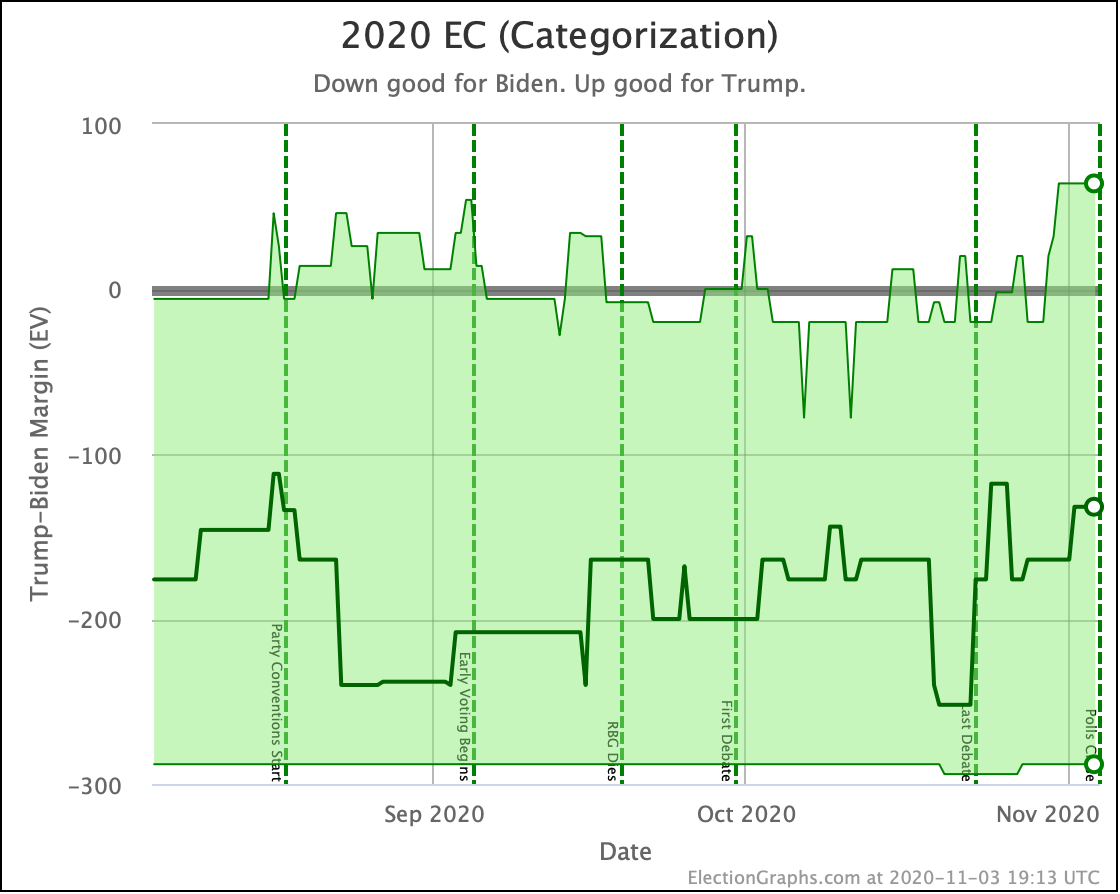
But switching views from the expected case to the tipping point, you can see that changed immediately once Harris was no longer a hypothetical, but instead was a real candidate.
Instead of the tipping point getting worse to converge with Biden's number, Harris's situation relative to Trump was improving with almost every new poll.
Harris is still behind, but seems to have some momentum.
We don't see that in the "expected case" at this point, because while Harris has improved over Biden's numbers, no states have crossed the center line yet.
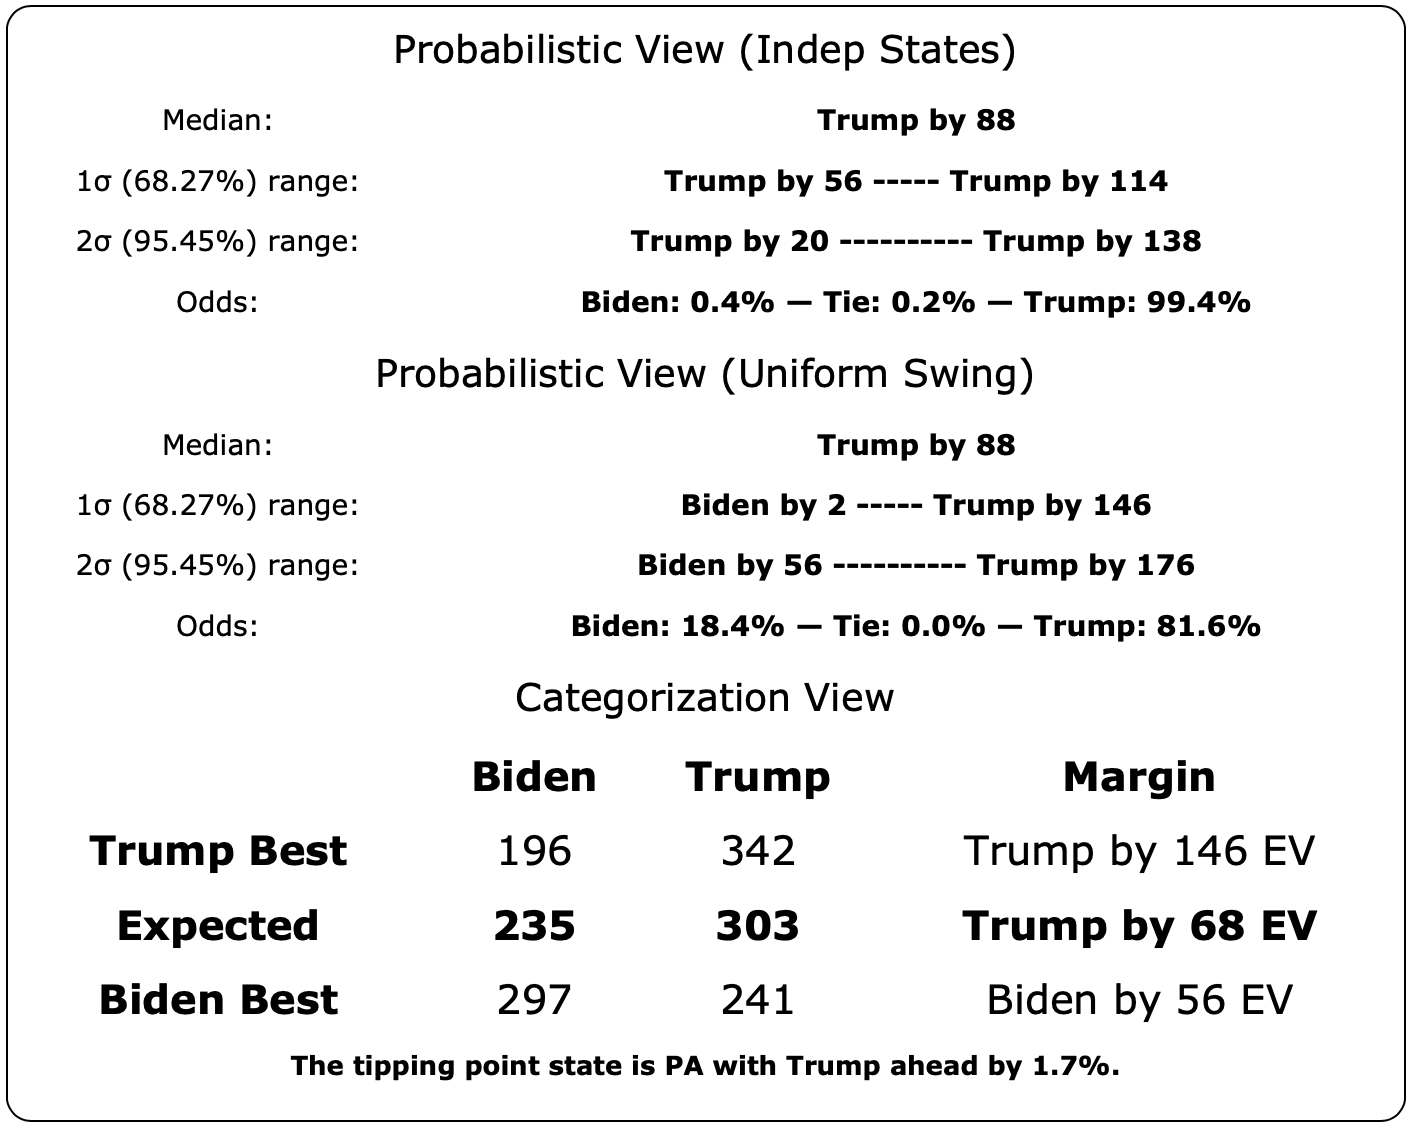
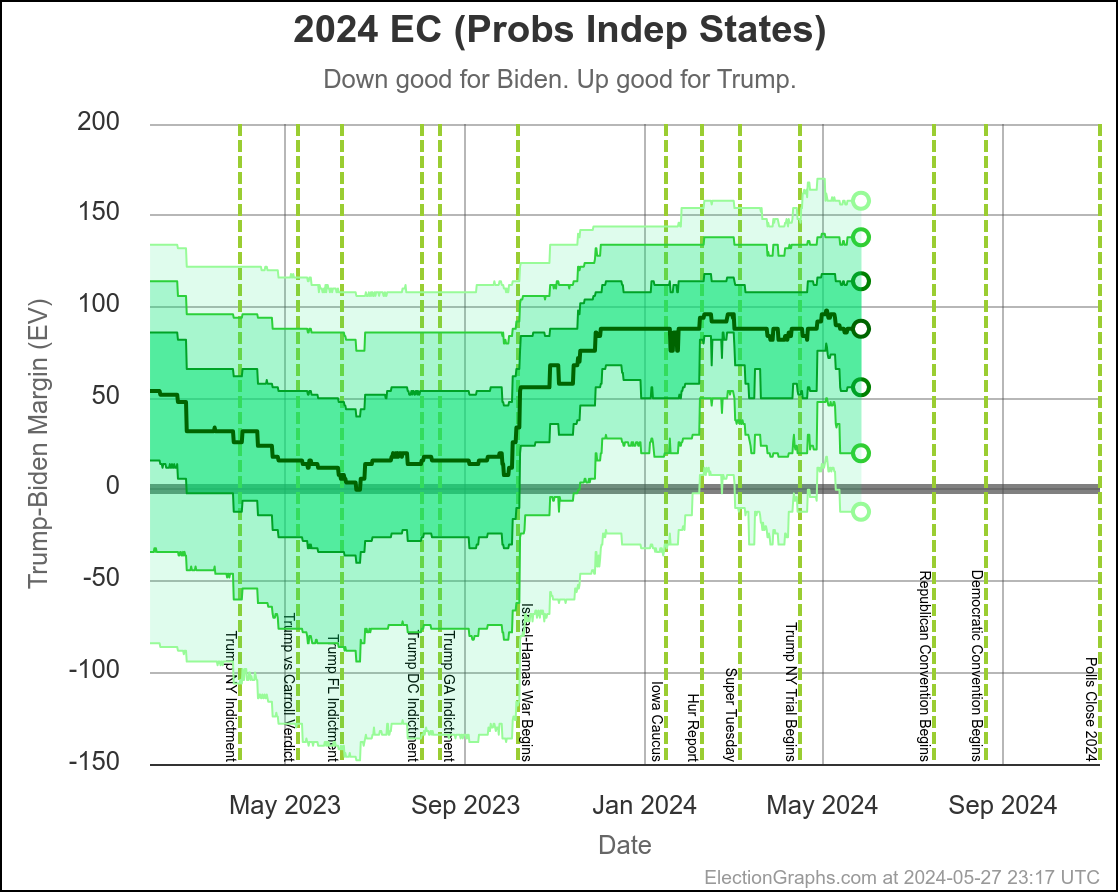
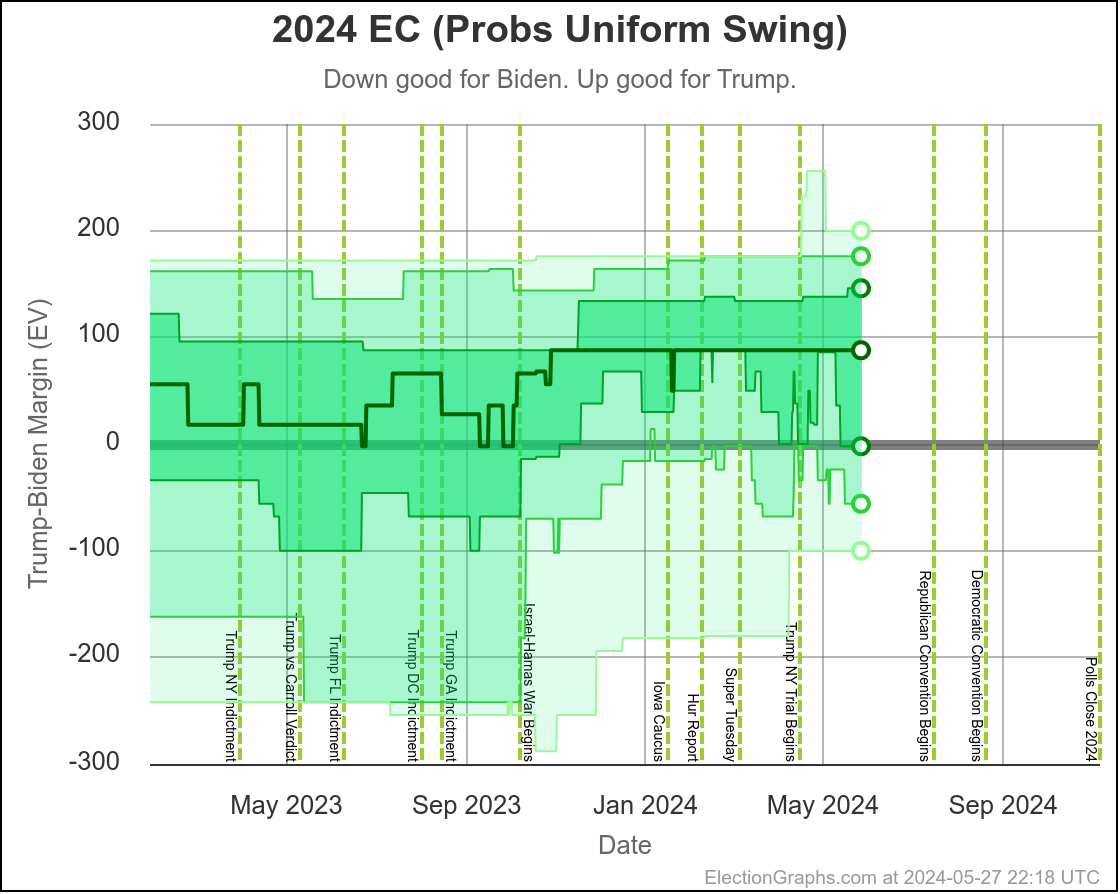
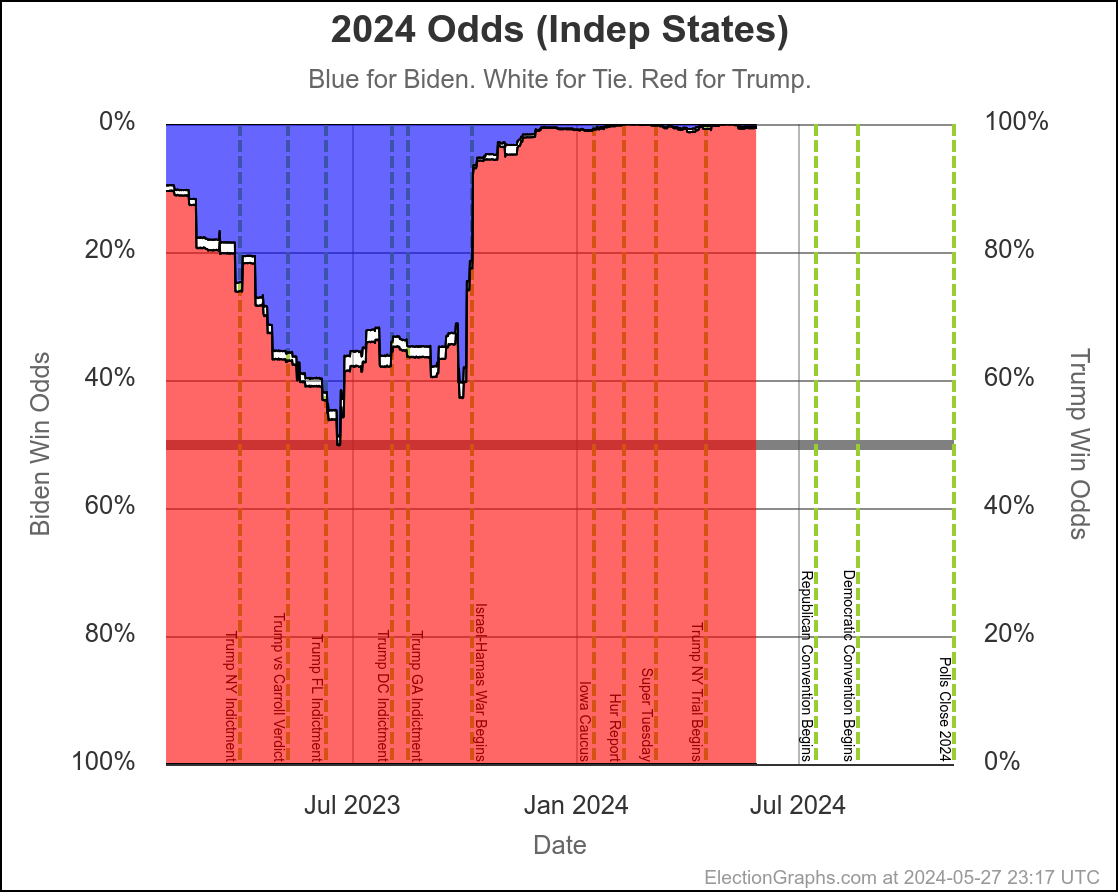
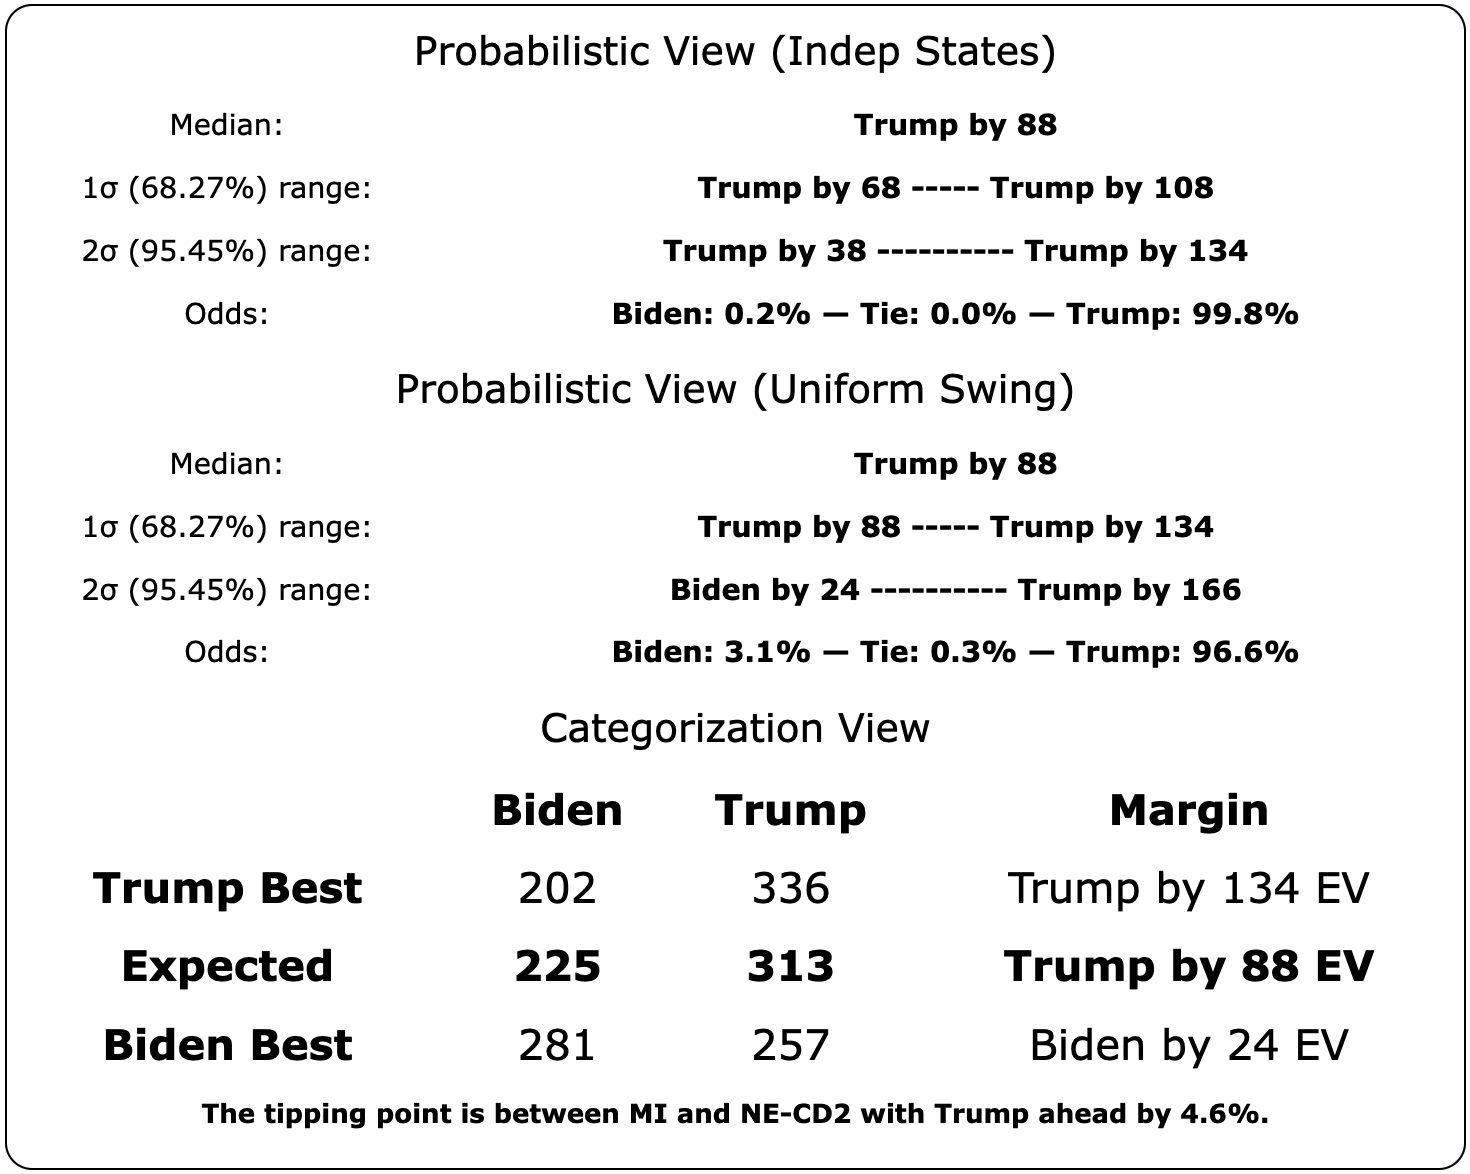
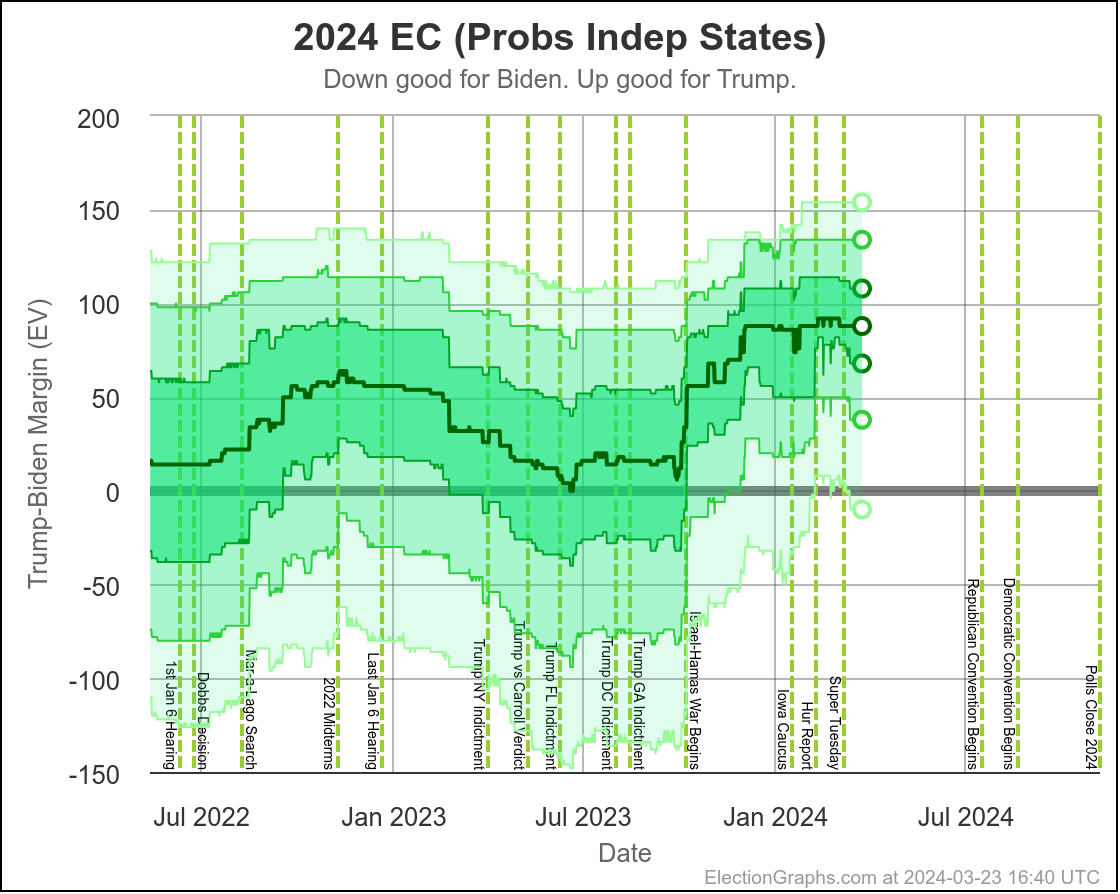
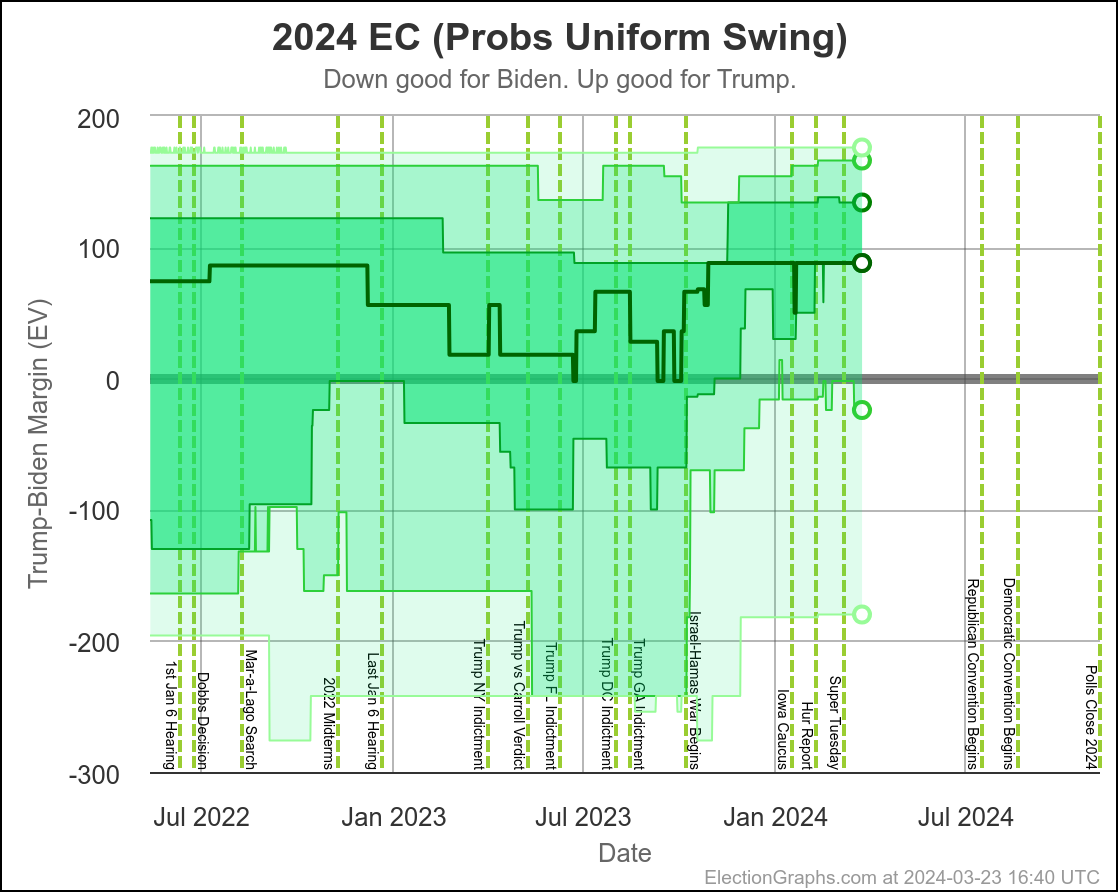
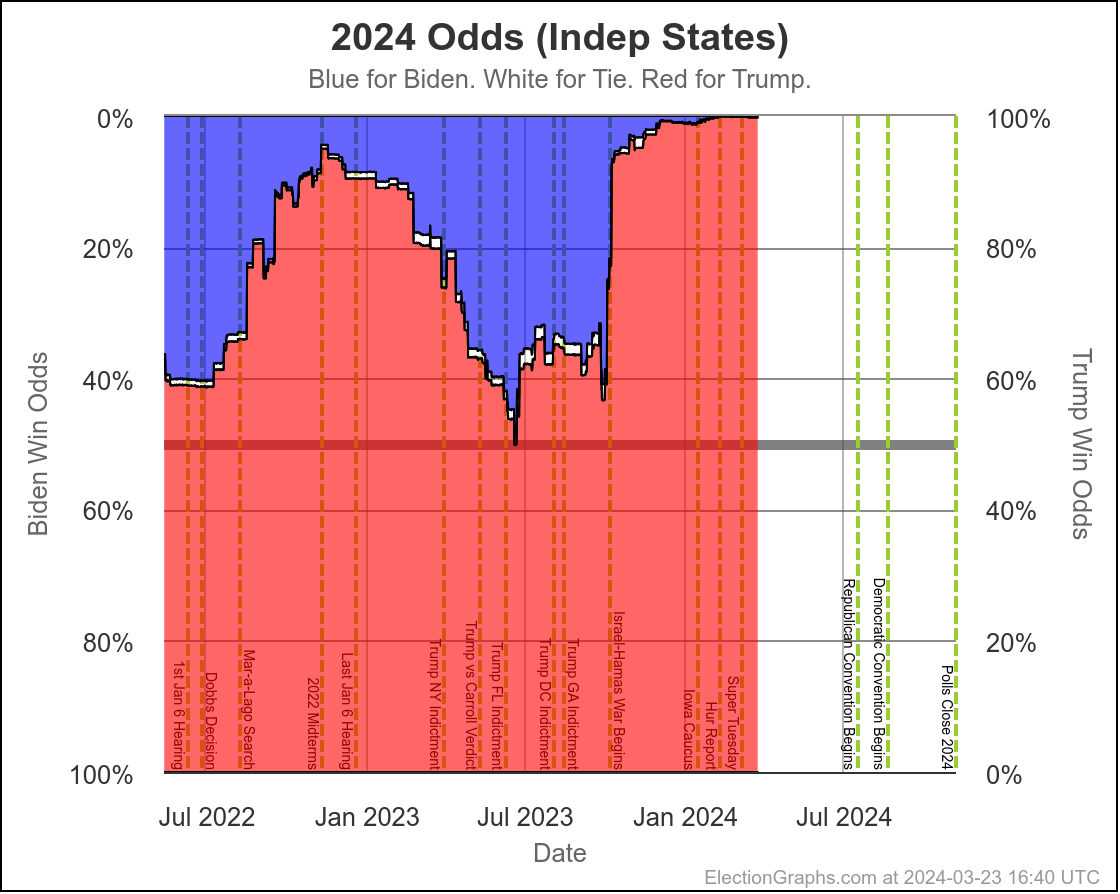
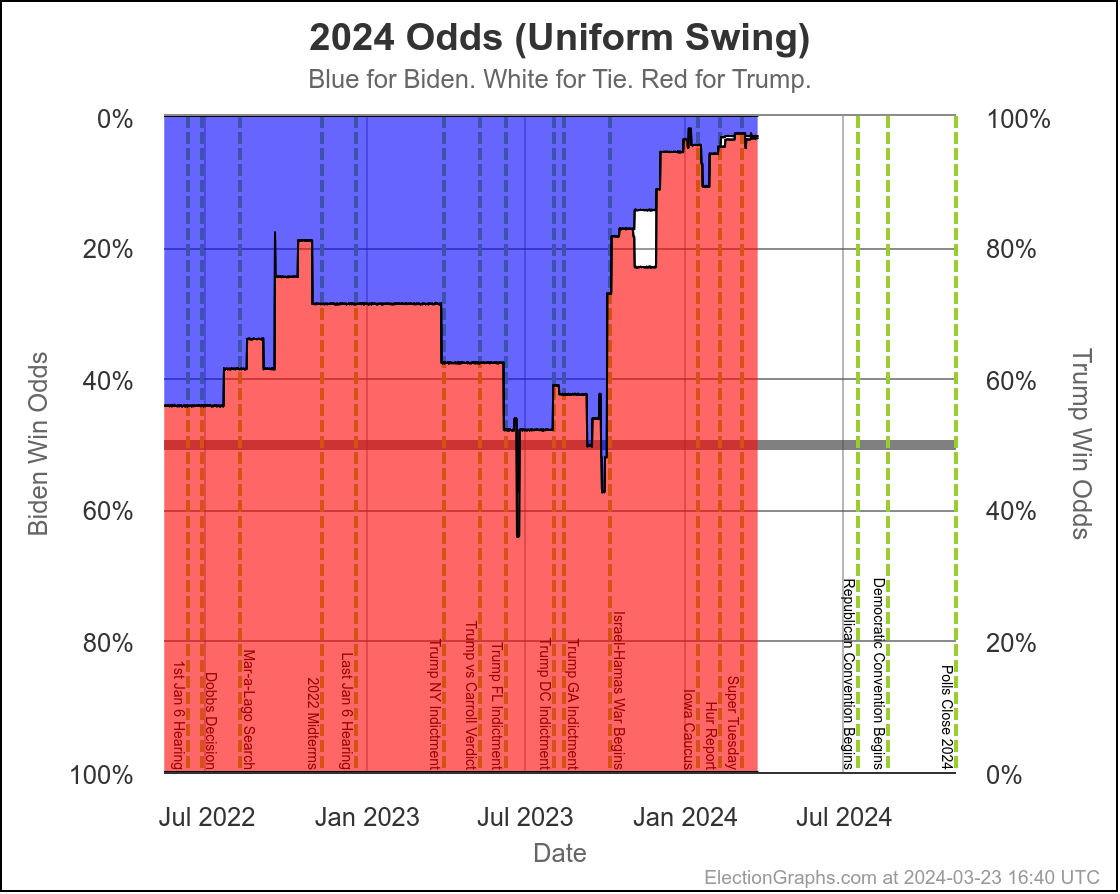
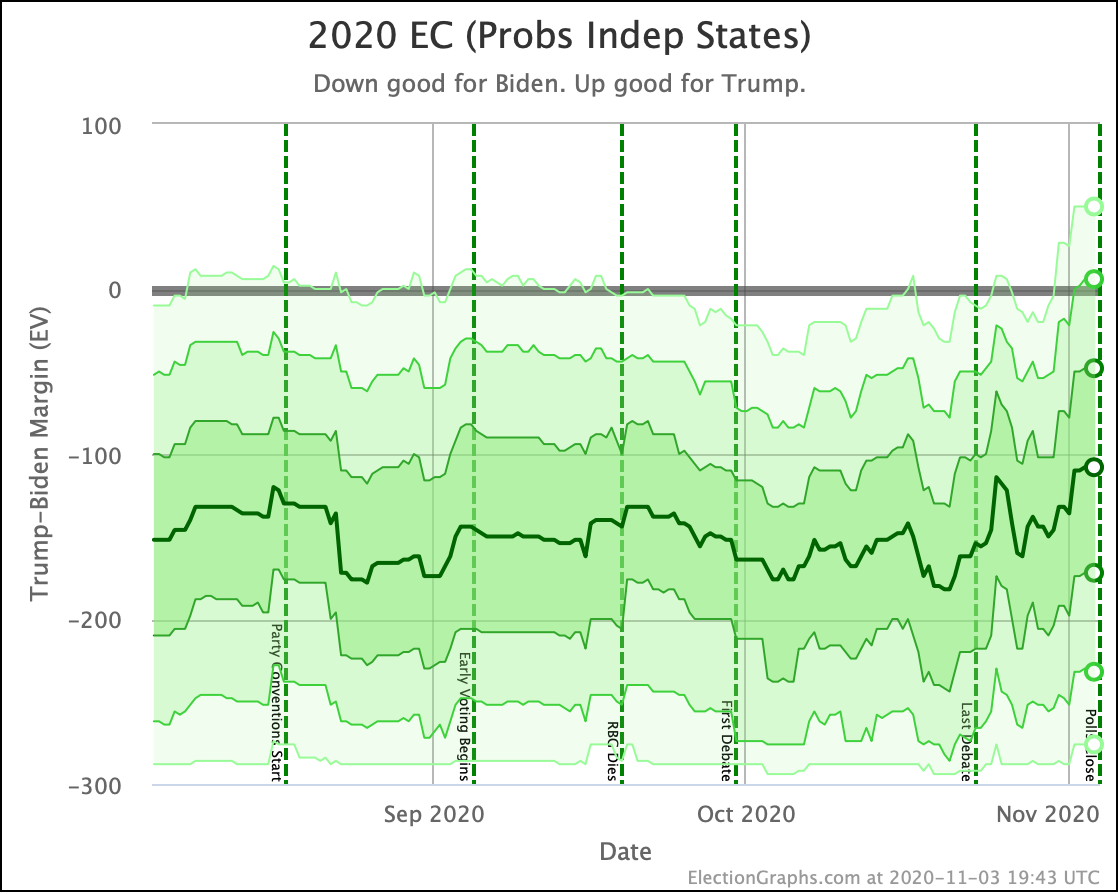
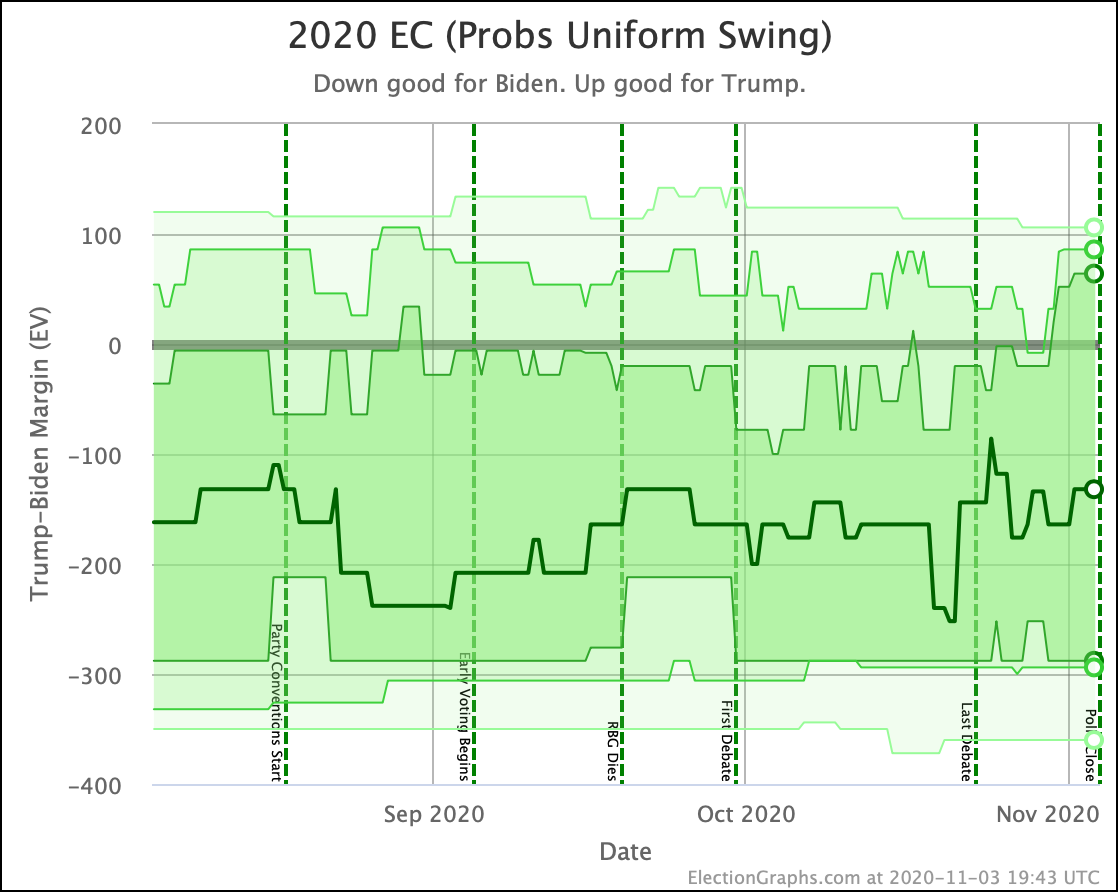
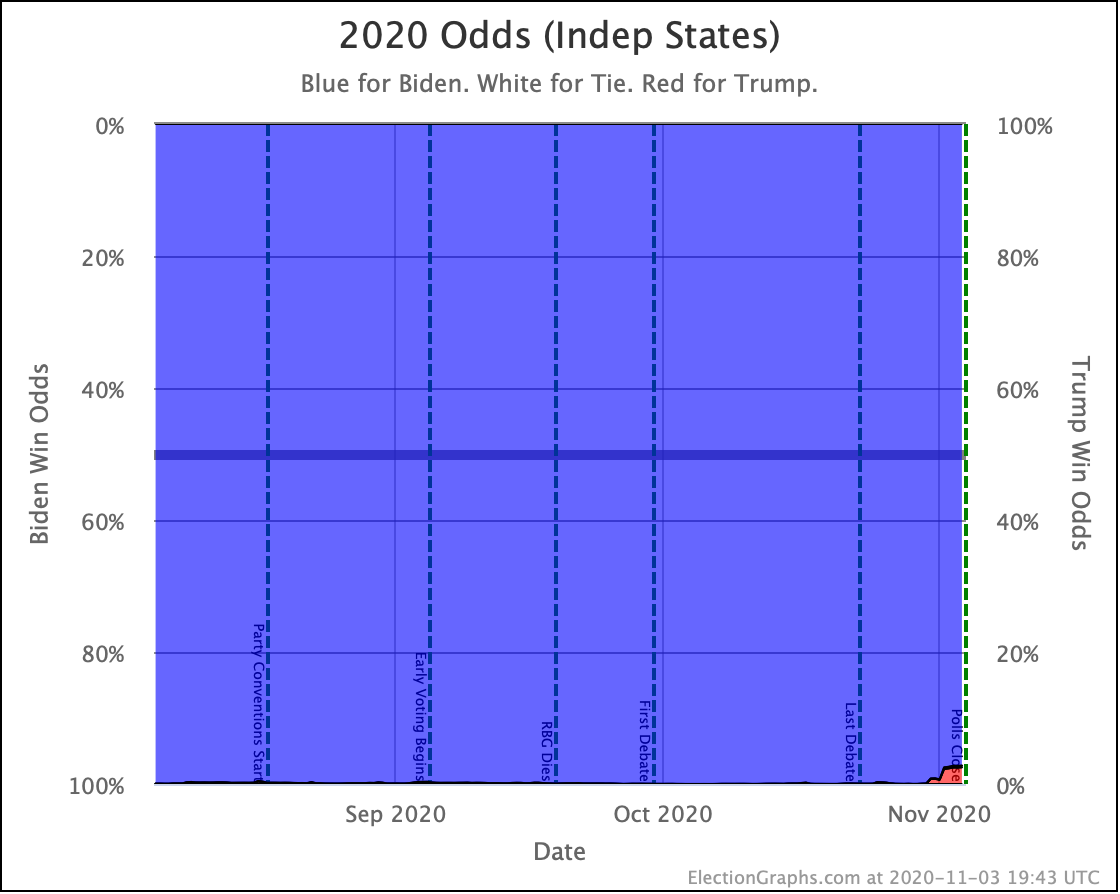
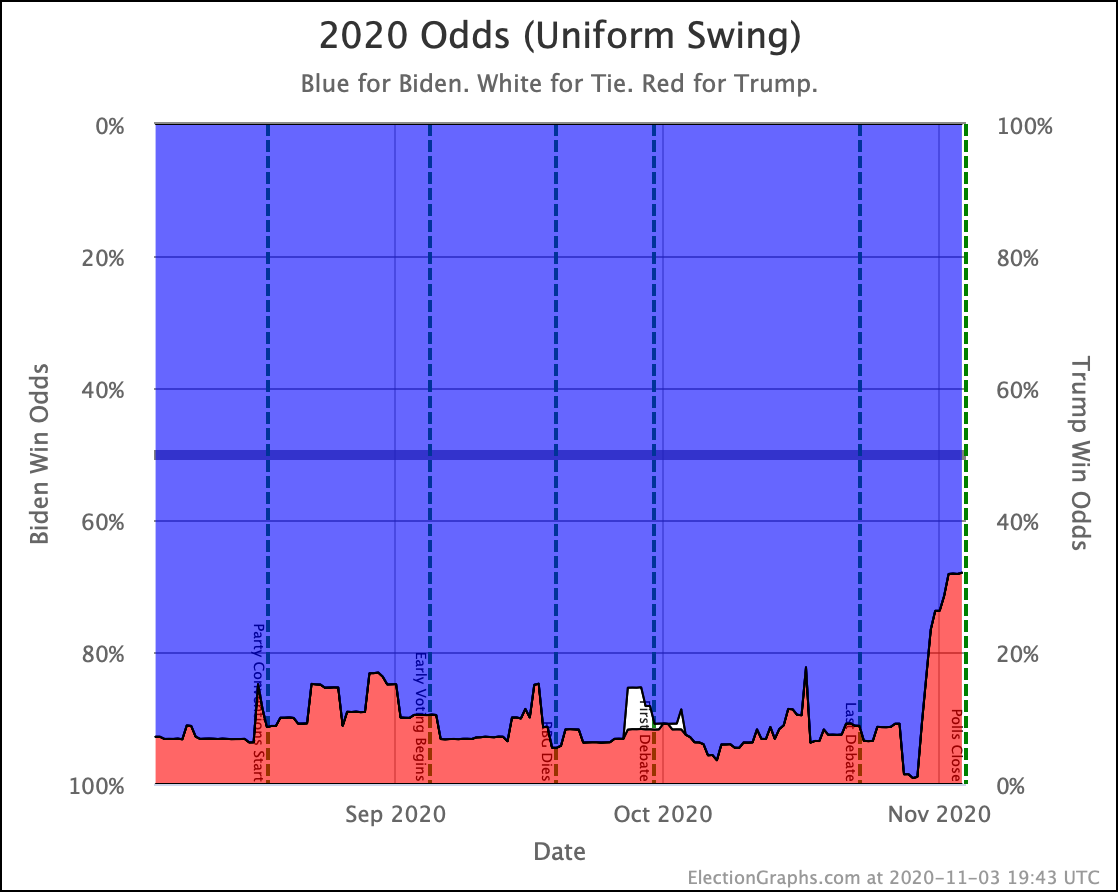
Looking at our two "odds taking into account the amount of time left" models, this looks like this:
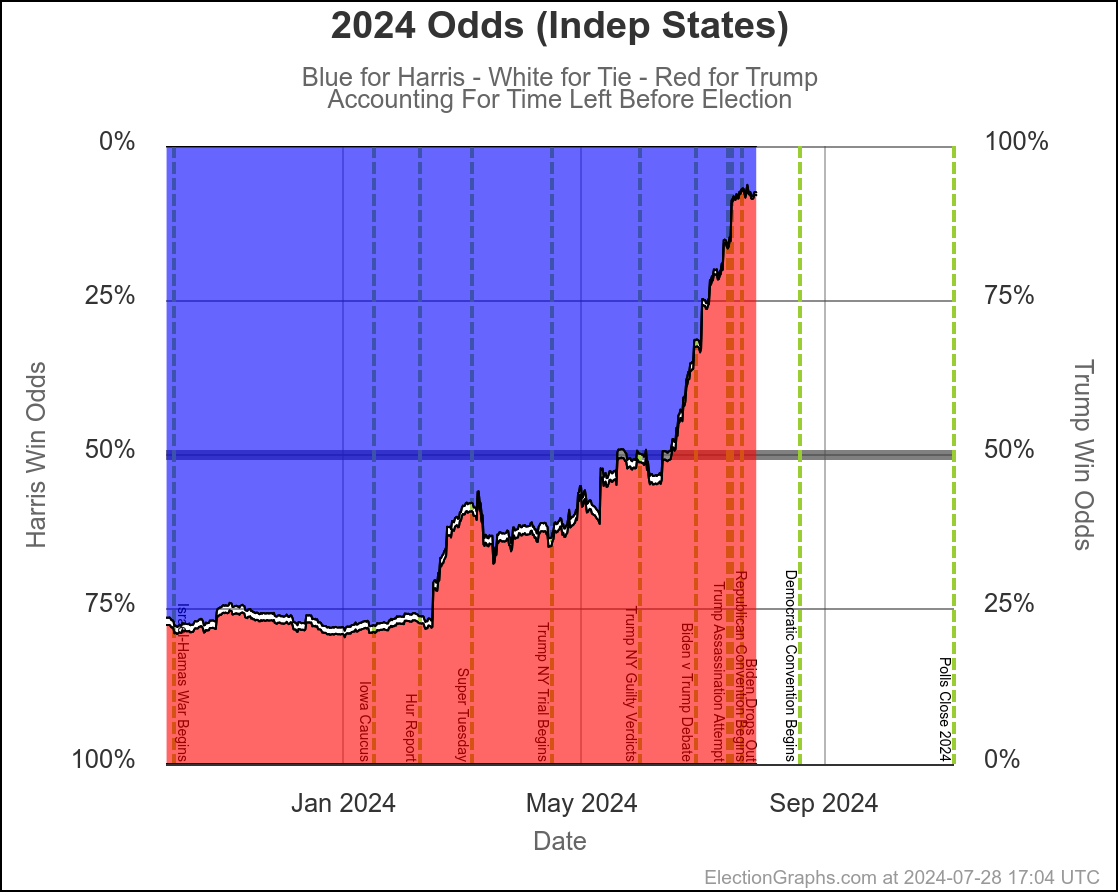
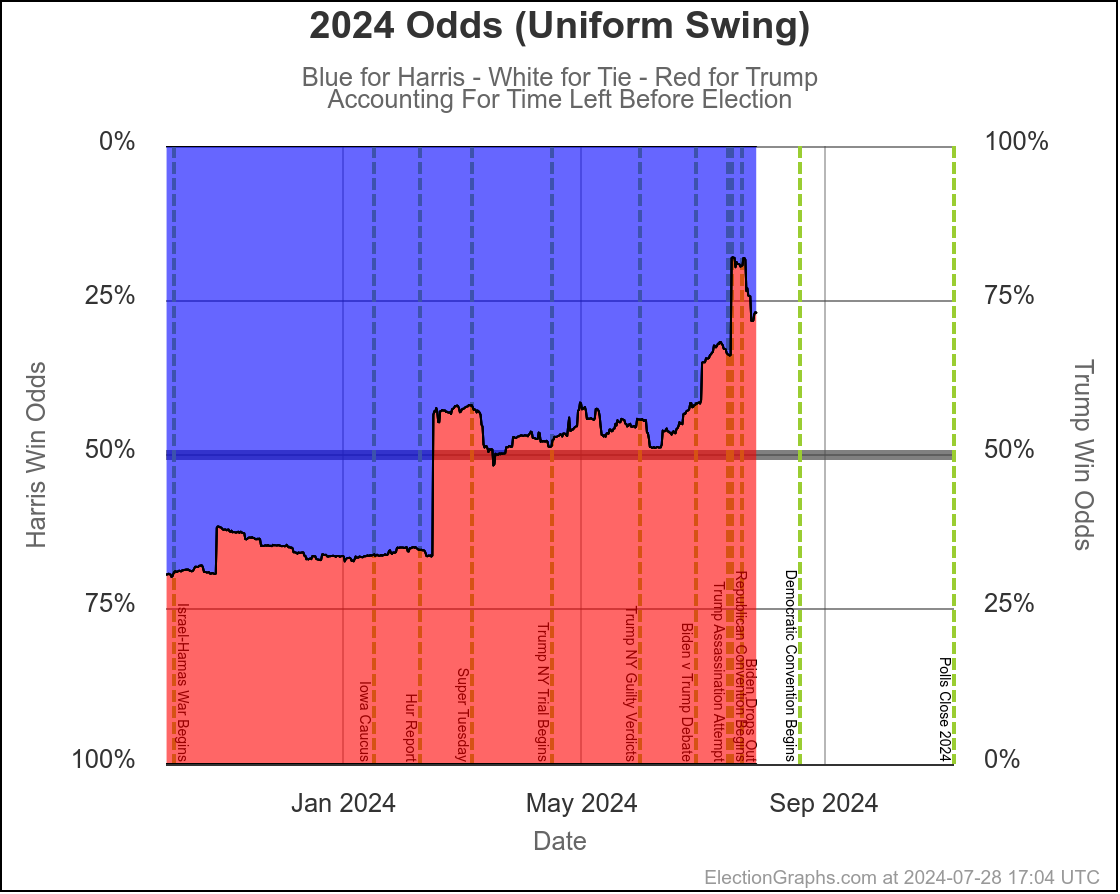
These two models vary from one extreme to another on how much the poll errors in one state are predictive of the poll errors in other states.
Right now assuming independent states, we give Harris a 7.5% chance of winning. If we assume a uniform swing instead, we get a 27.0% chance of a Harris win.
I don't try to model exactly where in that range things will end up, but my gut feel is the "truth" is closer to the uniform swing side than the independent states side, basically because for the most part the same big pollsters are covering all the swing states, and so if there is a systematic bias in their errors, it is likely to impact all the states that matter in roughly the same way.
On the uniform swing model, Harris went from about an 18% chance at the moment Biden dropped out, to 27% now. The post-dropout polling has been moving in her direction quickly.
So far anyway.
As I write this, we are only one week into the Harris campaign. The movement in her tipping point is only 1.3%, and there are still lots of states without good post-Biden polling. So this trend may be a short term pop. Or it may be the start of a long term trend.
It is quite simply too soon to tell.
Right now there is a lot of excitement about Harris, and the "mood" of the race seems to have changed dramatically on the Democratic side. From demoralized grim resignation to gut it out and try the best they could, to actual excitement, enthusiasm, and hope.
Does that translate into lasting changes in the polling situation?
As usual, we just have to wait and see.
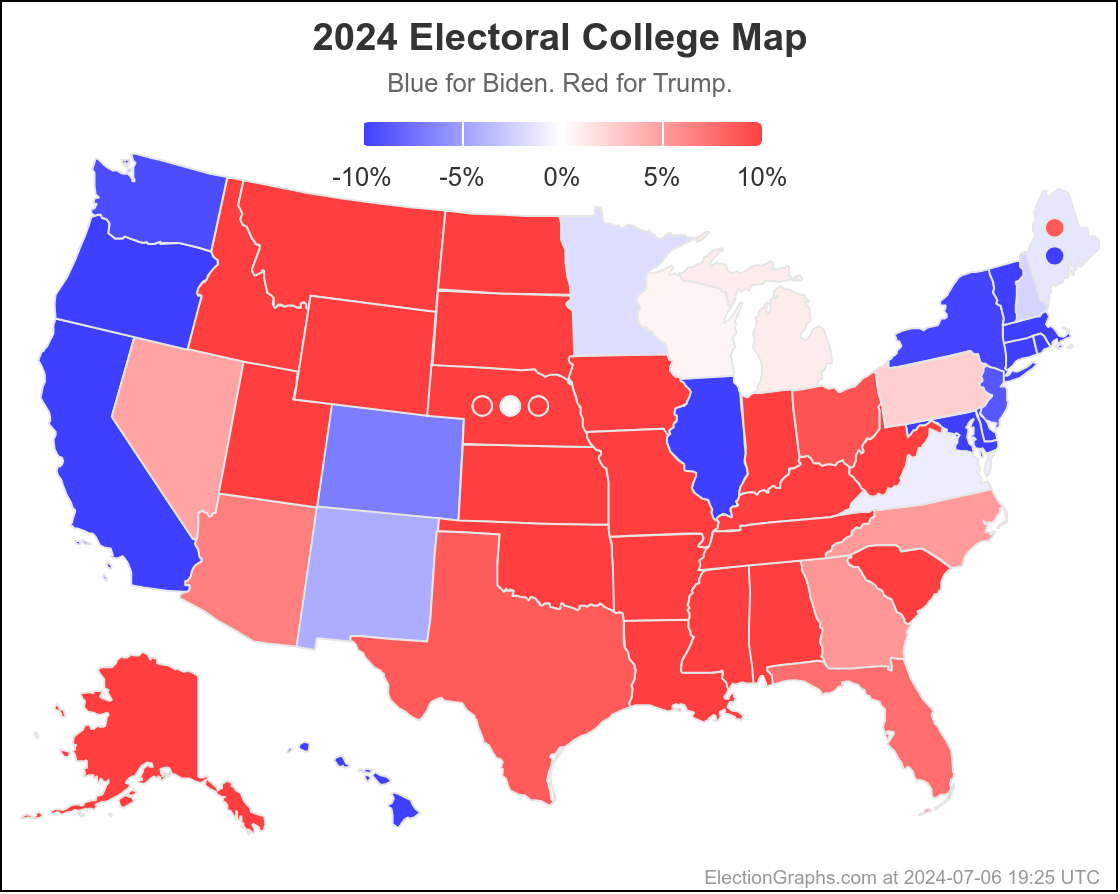
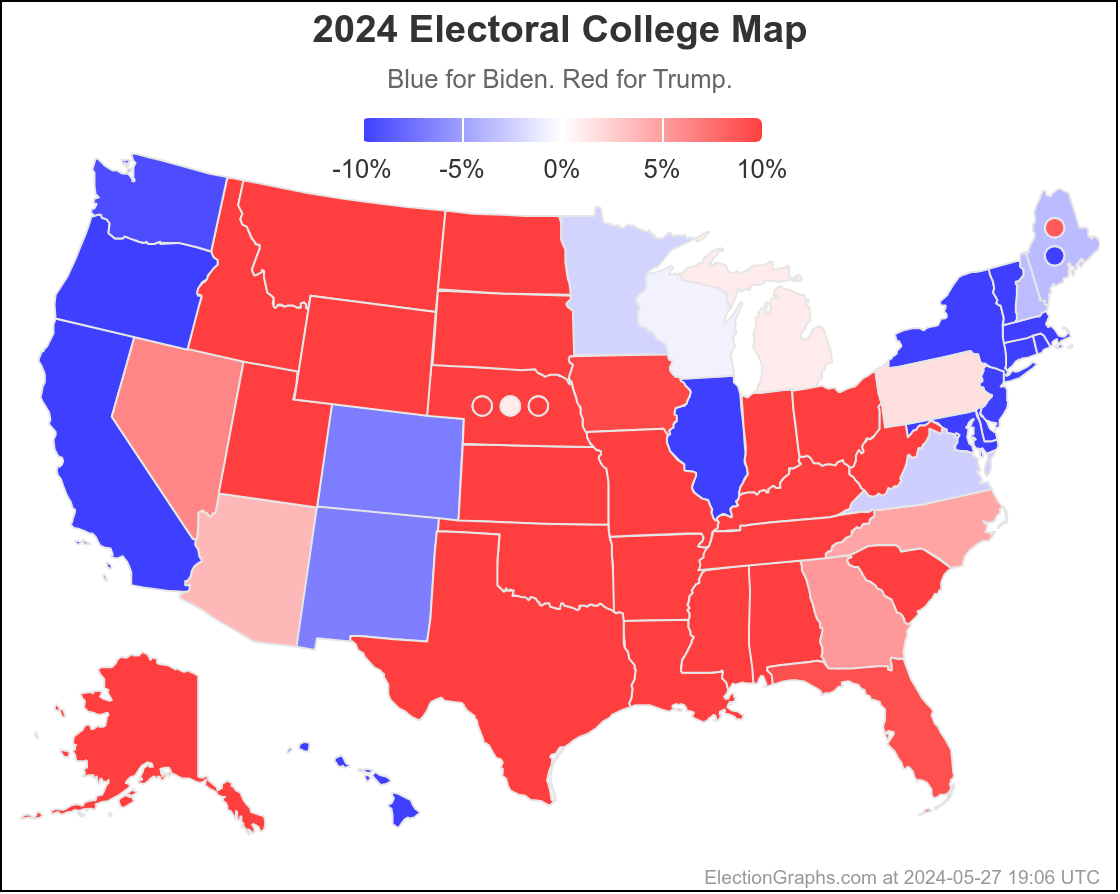
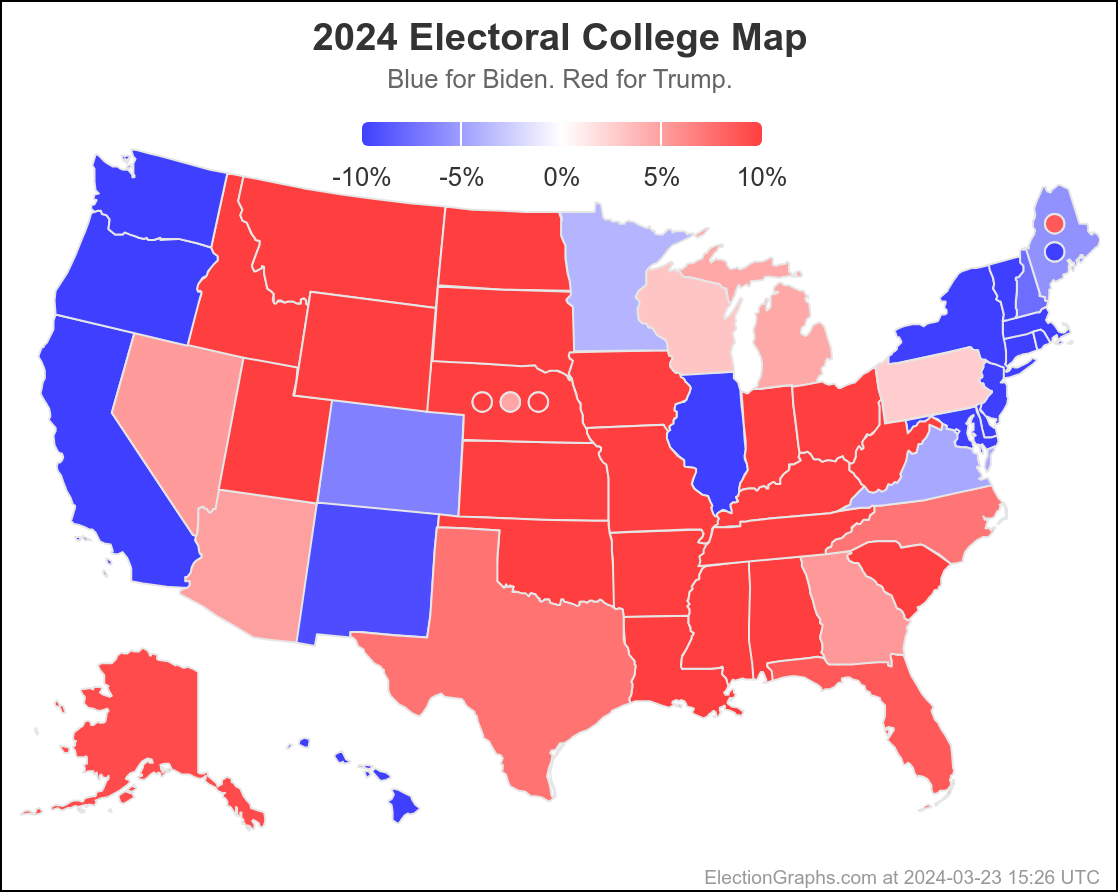
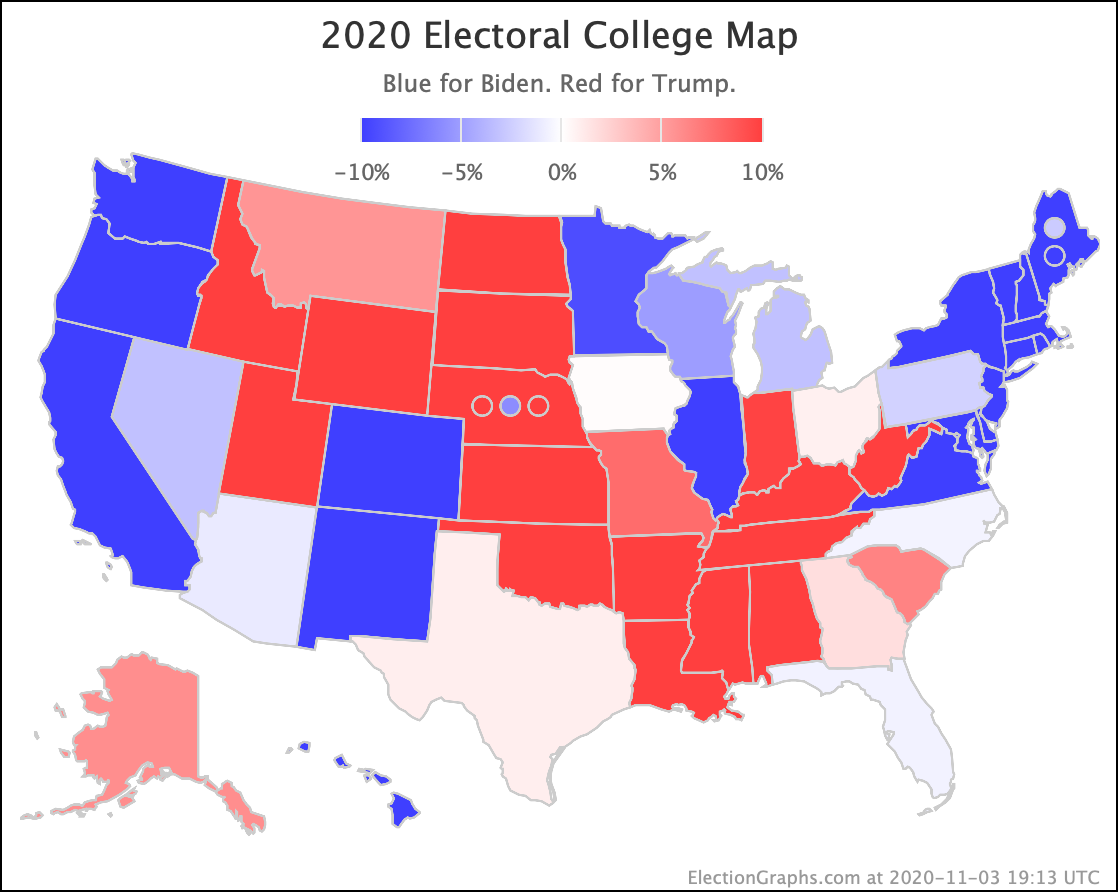
In the mean time, to close out, here is the new map as it looks at the moment:
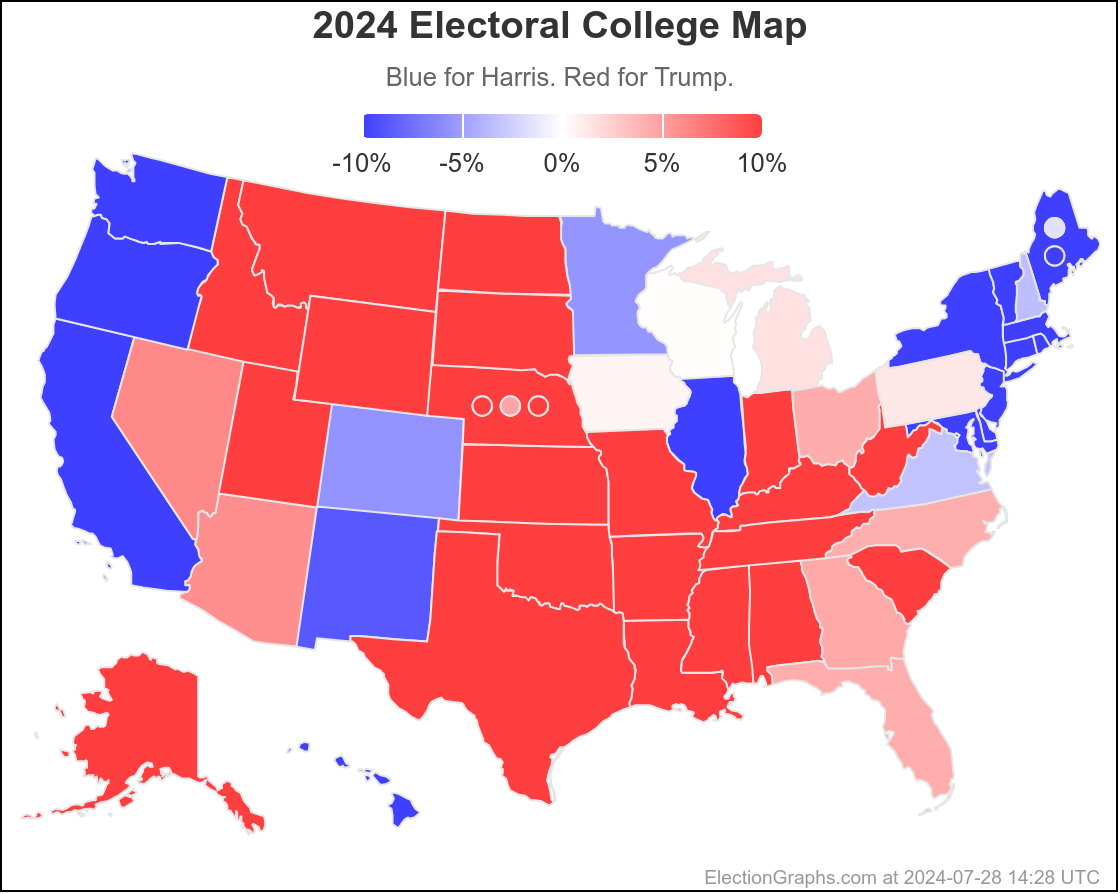
100.0 days until polls start to close on Election Day.
Hold on tight.
2024-07-30 01:27 UTC: Correction to the above. For Biden vs Trump Pennsylvania should have been a Trump 5.2% lead, not a Trump 5.4% lead. There was a data entry error that caused the discrepancy. Apologies. Does not change the analysis though.
2024-07-30 02:15 UTC: After this post was live, some additional polls for Biden were released covering July 1st to July 8th. This only changed the average in Nevada, which moved from Trump by 4.6% to Trump by 5.5%. Since Nevada was the tipping point state, this also moved the Tipping point from Trump by 4.6% in NV to Trump by 5.0% in NC. This also means that with these new numbers, if Biden won ALL the states where the margin was under 5%, he would still be losing 267 electoral votes to Trump's 271.