
As always, if you are impatient for one of these updates, the 2020 Electoral College pages on Election Graphs are updated multiple times every day as new polls come in. Or you can follow @ElecCollPolls on Twitter to see all the polls as I add them. While you are at it, follow @ElectionGraphs too.
The last blog update here was on October 31st. It is now November 2nd. We only have about a day and a half to go until we start getting actual results from Election 2020. I expect to do one more blog update before polls close on Election Day.
| Model | Metric | 31 Oct | 2 Nov | 𝚫 |
| Probabilities (Indep States) |
Trump 2σ Median Biden 2σ |
Biden +52 Biden +150 Biden +256 |
Biden +10 Biden +112 Biden +228 |
Trump +42 Trump +38 Trump +28 |
| Trump Win Tie Biden Win |
0.1% 0.0% 99.9% |
1.2% 0.1% 98.6% |
+1.1% +0.1% -1.3% |
|
| Probabilities (Uniform Swing) |
Trump 2σ Median Biden 2σ |
Trump +52 Biden +176 Biden +294 |
Trump +84 Biden +102 Biden +314 |
Trump +32 Trump +74 Biden +20 |
| Trump Win Tie Biden Win |
14.6% 0.0% 85.4% |
18.8% 0.0% 81.2% |
+4.2% FLAT -4.2% |
|
| Categories | Trump Best Expected Biden Best |
Trump +20 Biden +176 Biden +288 |
Trump +64 Biden +102 Biden +288 |
Trump +44 Trump +74 FLAT |
| Tipping Point | Biden +4.3% | Biden +3.5% | Trump +0.8% |
There have been dozens of new polls since the update on the 31st. While there were exceptions, the overwhelming theme was polls showing a better picture for Trump and a worse one for Biden than we had seen any time recently. So almost all of the metrics above move in Trump's direction.
As with a couple of the other recent spikes toward Trump in the last few weeks, you can look at the specific polls in the average, and start wondering if this is just a bunch of right-leaning pollsters flooding the zone with polls in the last few days. While there were plenty of results from large mainstream pollsters released in these last few days, there were quite a few partisan polls released too, and some of them definitely helped move the averages toward Trump. I talked about this phenomenon on October 20th, October 24th, and October 31st… so I won't delve into that in-depth again.
But there is one critical difference. Judging by what happened in the last couple of cycles, there might be a handful of straggler polls released Tuesday morning, but we really only have one full day left for polls to be released. And many of the major pollsters have already released their "final polls" for the critical states. That means that any outliers introduced in the last few days, or in the remaining time we have left, will very likely still be part of the final averages this site produces.
There is no longer much time for an outlier poll to be "washed out" by additional polling. We are nearly at the end.
So while there may be some changes tomorrow, let's take seriously what we have today, and not try to make excuses. Four years ago on this site, there was a similar move toward Trump in the final days, and I somewhat dismissed it by pointing out the influence of partisan pollsters and what looked like possible outliers in the late-breaking polls. And of course, in retrospect, that move was real.
Is this move real? We'll know once the actual votes get counted.
So what do we have today if we take our averages seriously?
So let's look at all the graphs.
First of all, the comparison with 2016:
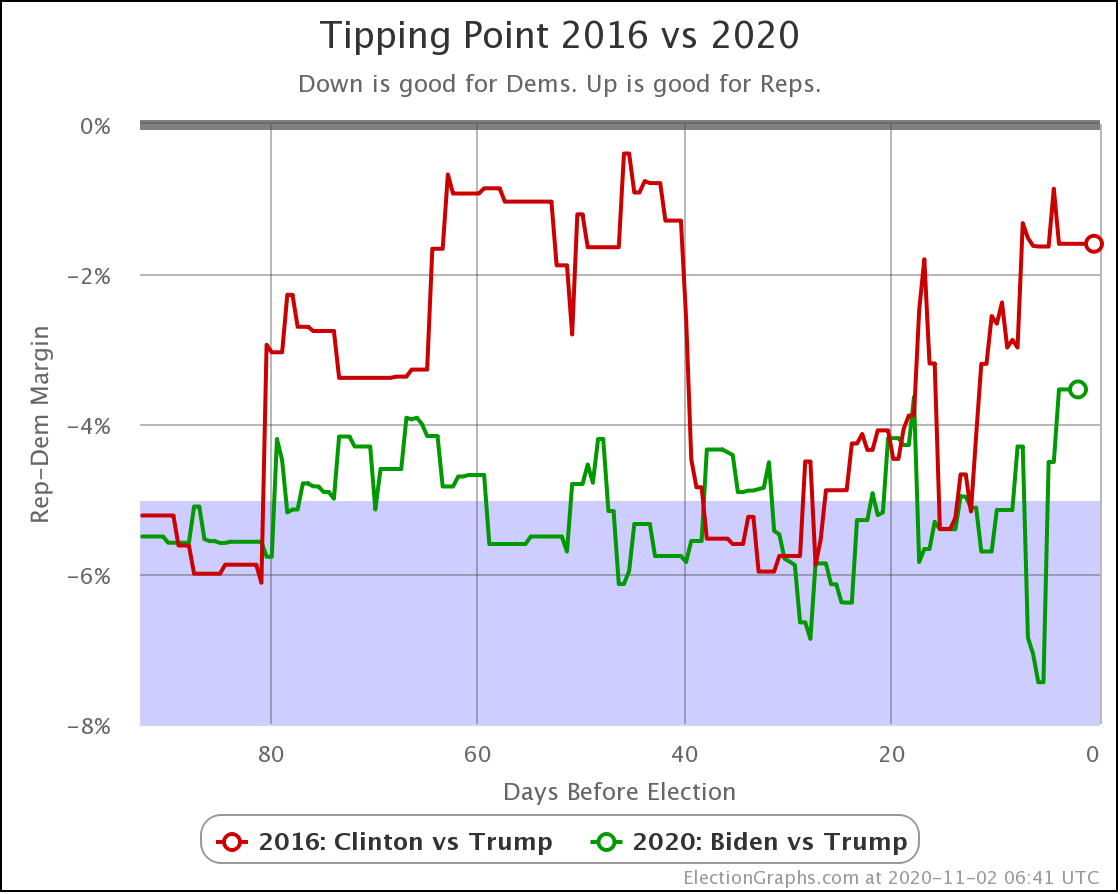
In the tipping point, which represents the degree polls need to be wrong and/or change before the end in order to flip the winner, Biden now holds a 3.5% lead. This is the worst level Biden has been at since mid-June, but it still beats the 1.6% Clinton was at four years ago by a significant amount.
Will this deteriorate further in the limited time left? Or bounce back? Or neither? If I had to guess, I'd say reversion to the mean. There have been no major news events in the last week that would seem likely to drive a tightening. So I expect this "tightening" is actually just an artifact. But that is just an educated guess. We will all know soon enough.
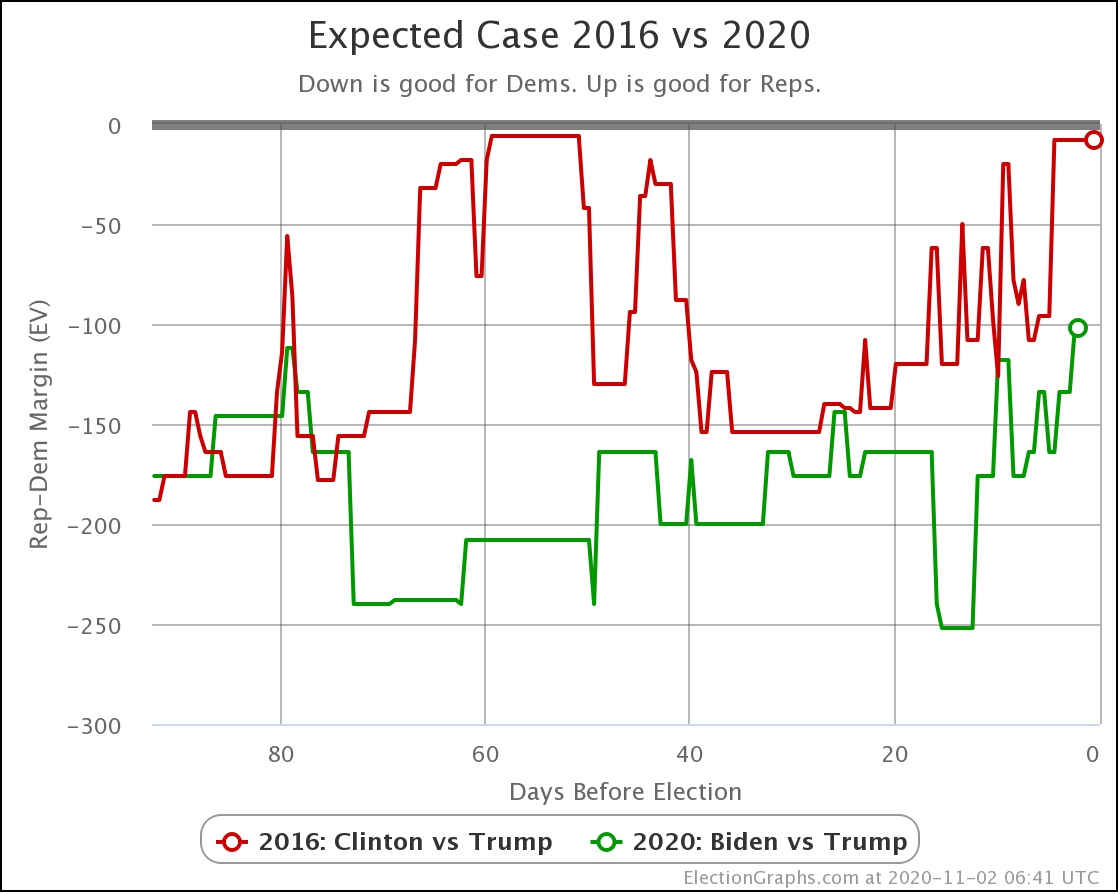
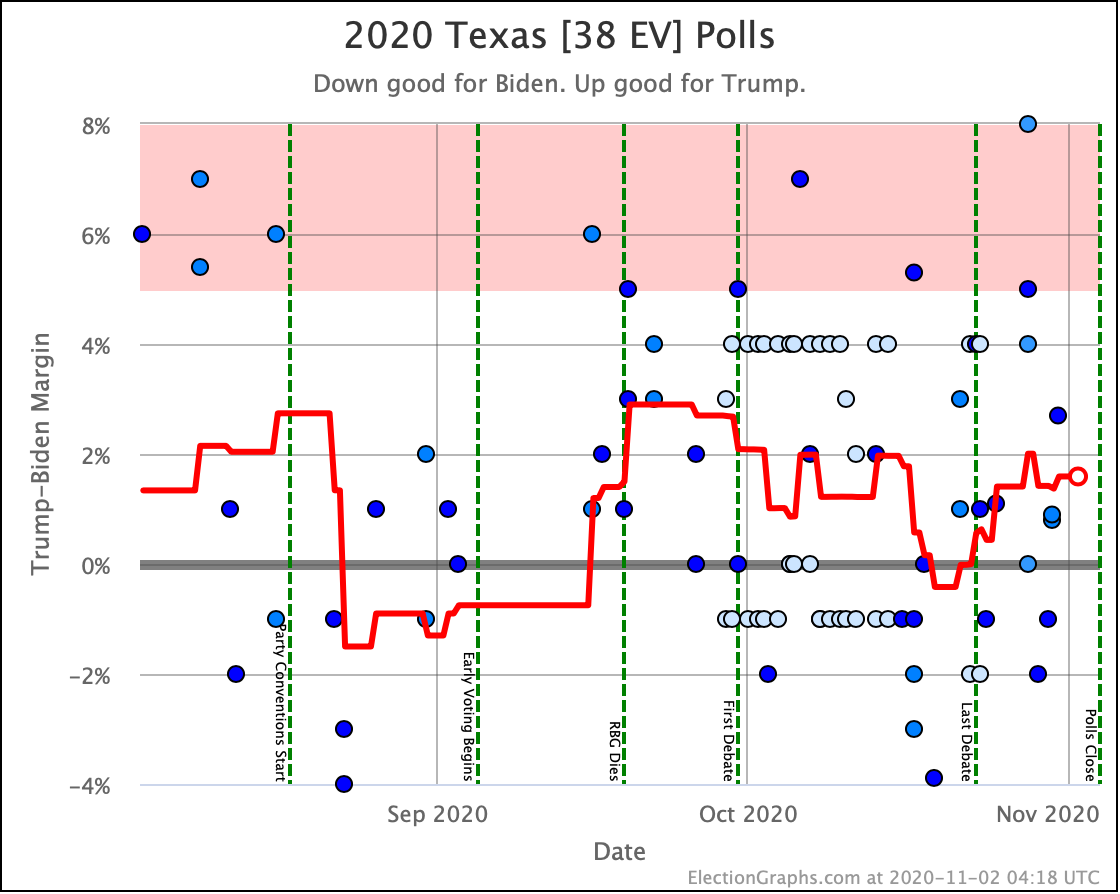
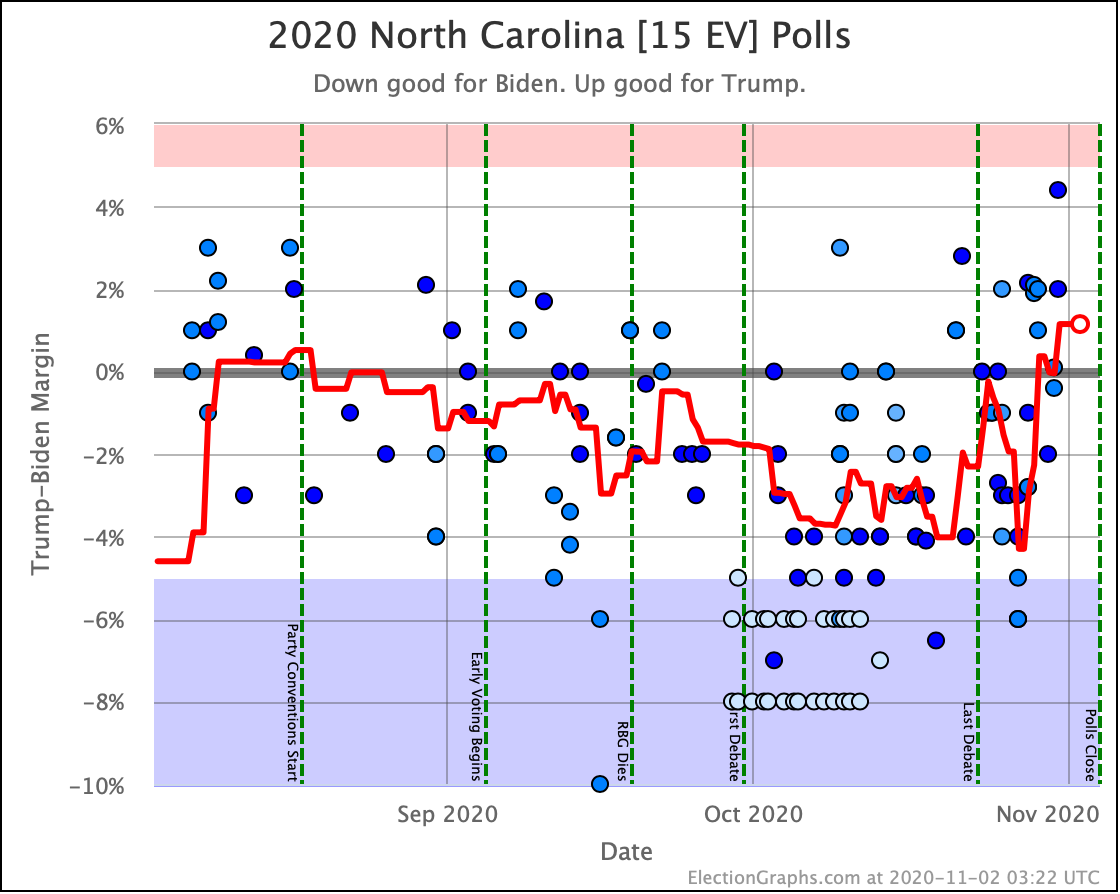
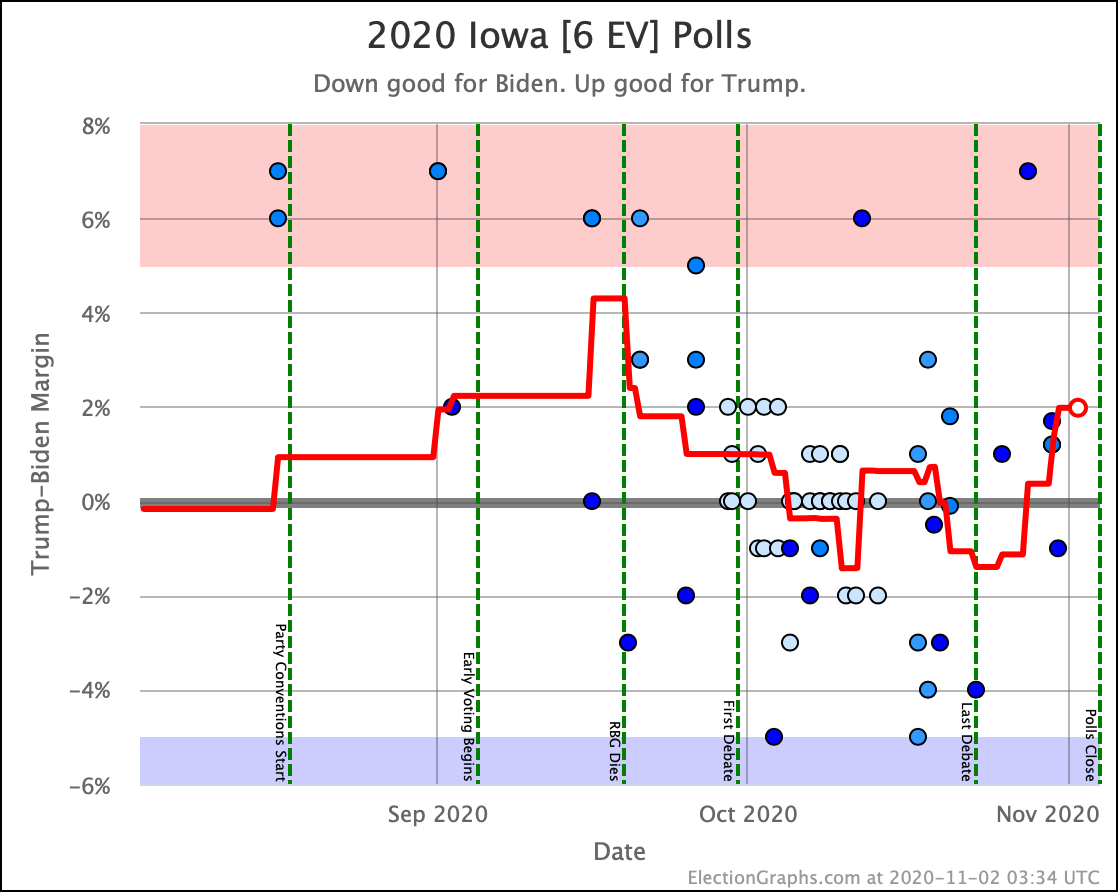
In terms of the expected case, where each candidate wins every state where they lead the Election Graphs average, Biden has a slightly lower margin than he has seen before in the last three months. Georgia, North Carolina, Texas, Ohio, and Iowa, all of which have spent time on the Biden side of the centerline, are all now in "Weak Trump" territory in the Election Graphs averages at the same time.
But Biden is still ahead by 102 electoral votes in this view. By this time four years ago, Clinton was hanging on with only an 8 electoral vote lead.
OK. Let's look at the range of margins predicted by our three models:
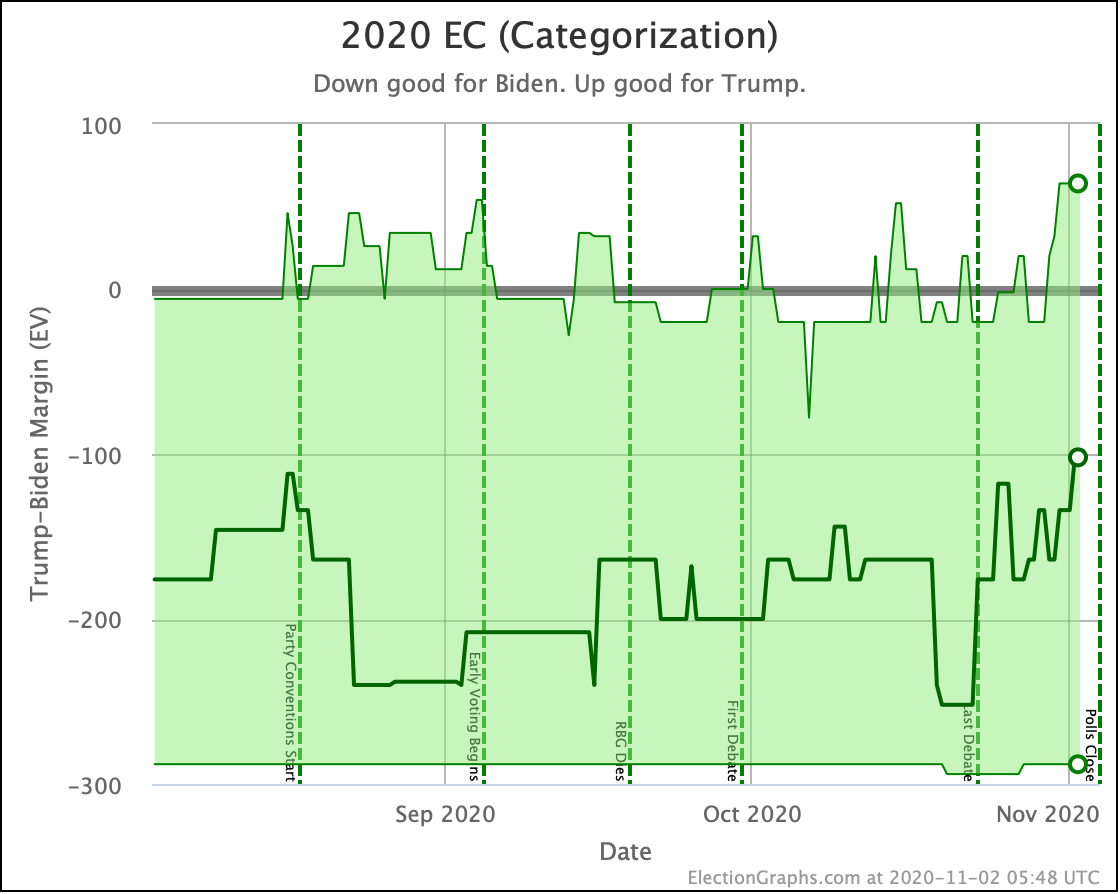
All three of these still have their centerlines with the narrowest Biden lead they have seen in the last three months. These levels were last seen in June. So not unprecedented, but still breaking out of the recent zone.
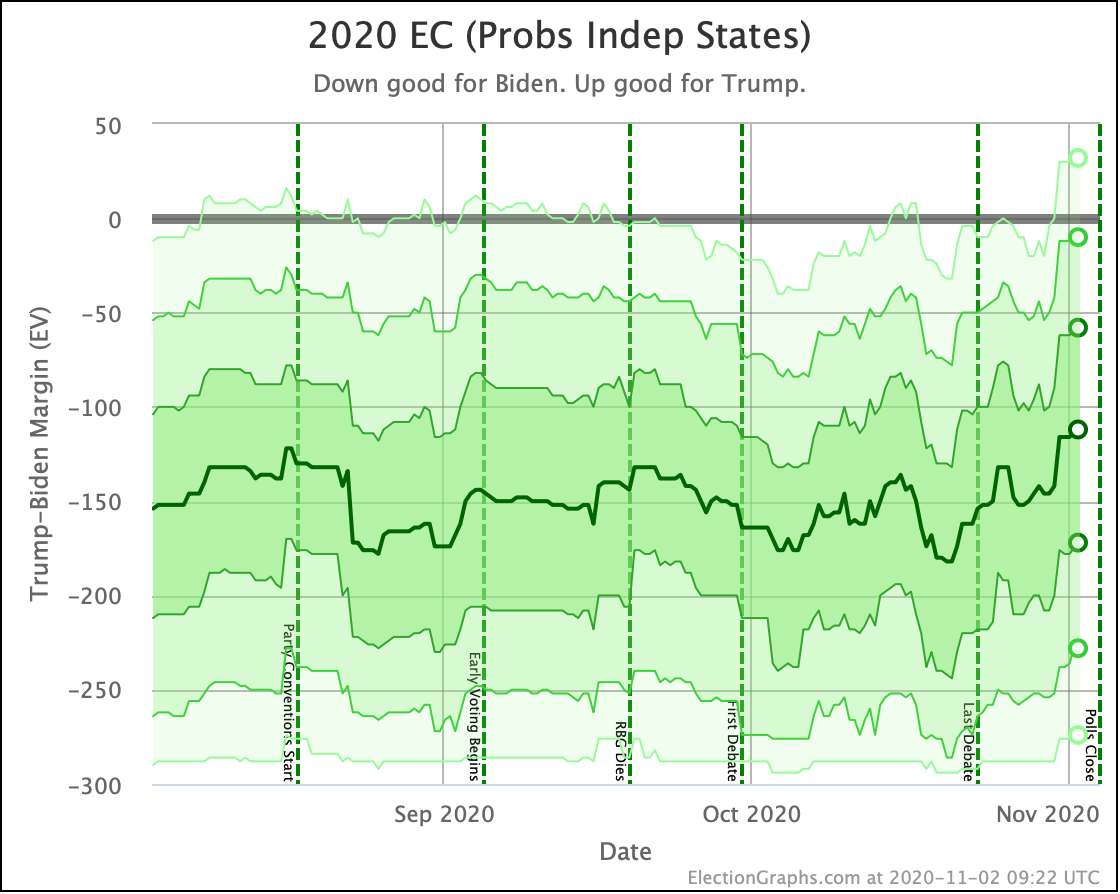
In terms of odds from the probabilistic views, the Independent States chart no longer just looks like a blue square. So here it is:
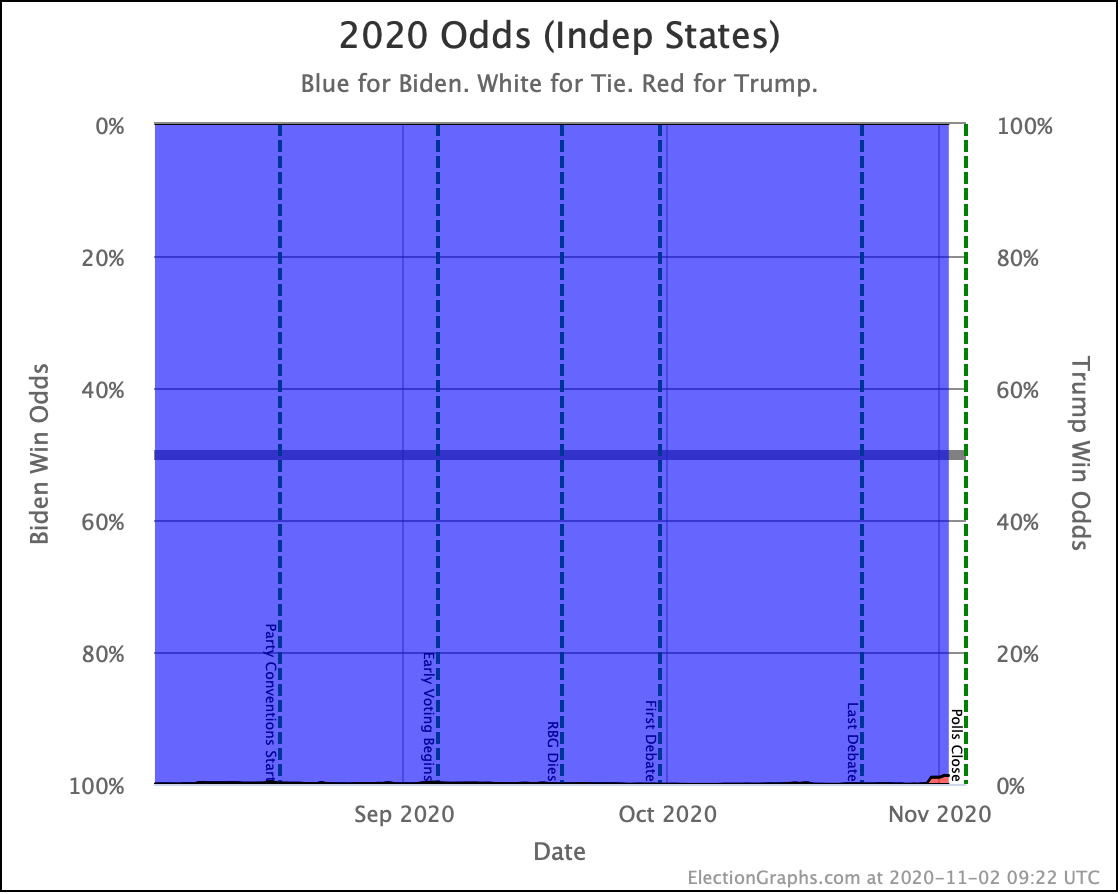
See that little bit of red at the bottom right? For the first time in a long time, Trump's chance of winning is visible in this view, as it rises to 1.2%. Prior to this bump, the highest this has been in the last three months was 0.2%.
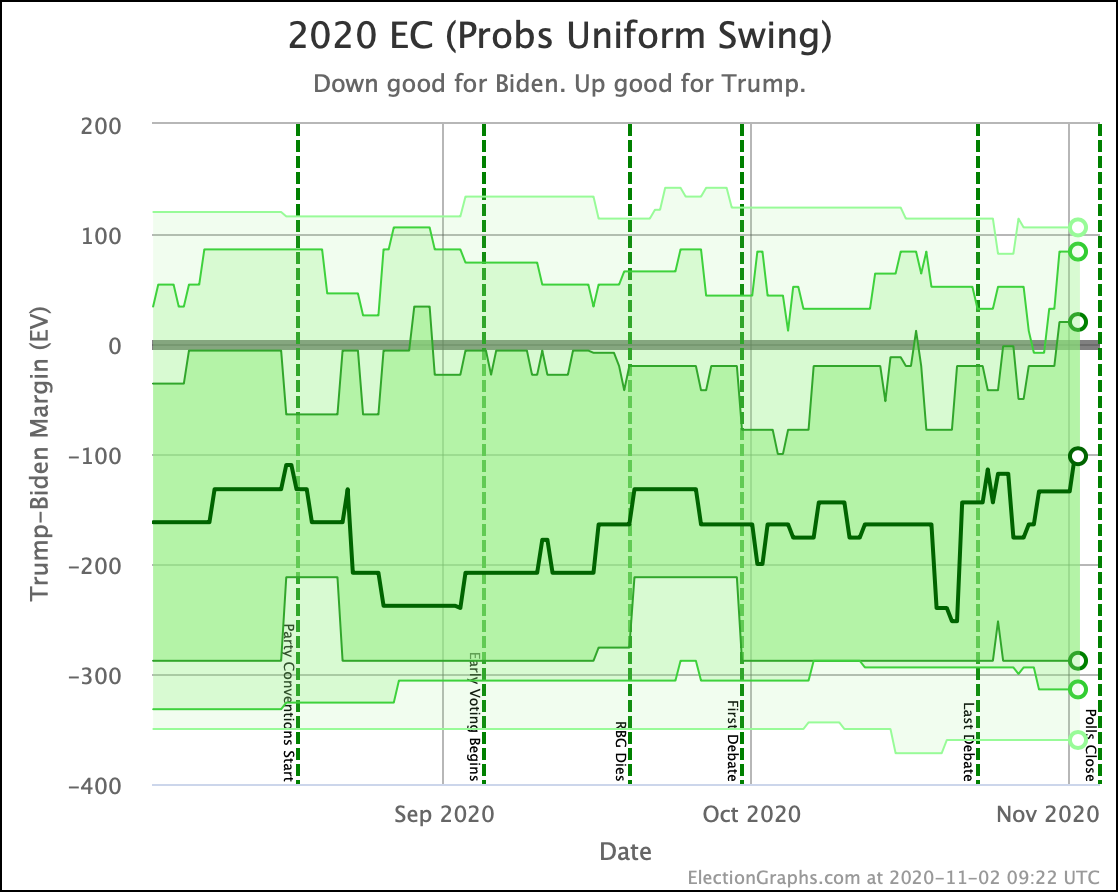
Those odds assume that there is no correlation between polling errors in different states though. So time to look at the other extreme.
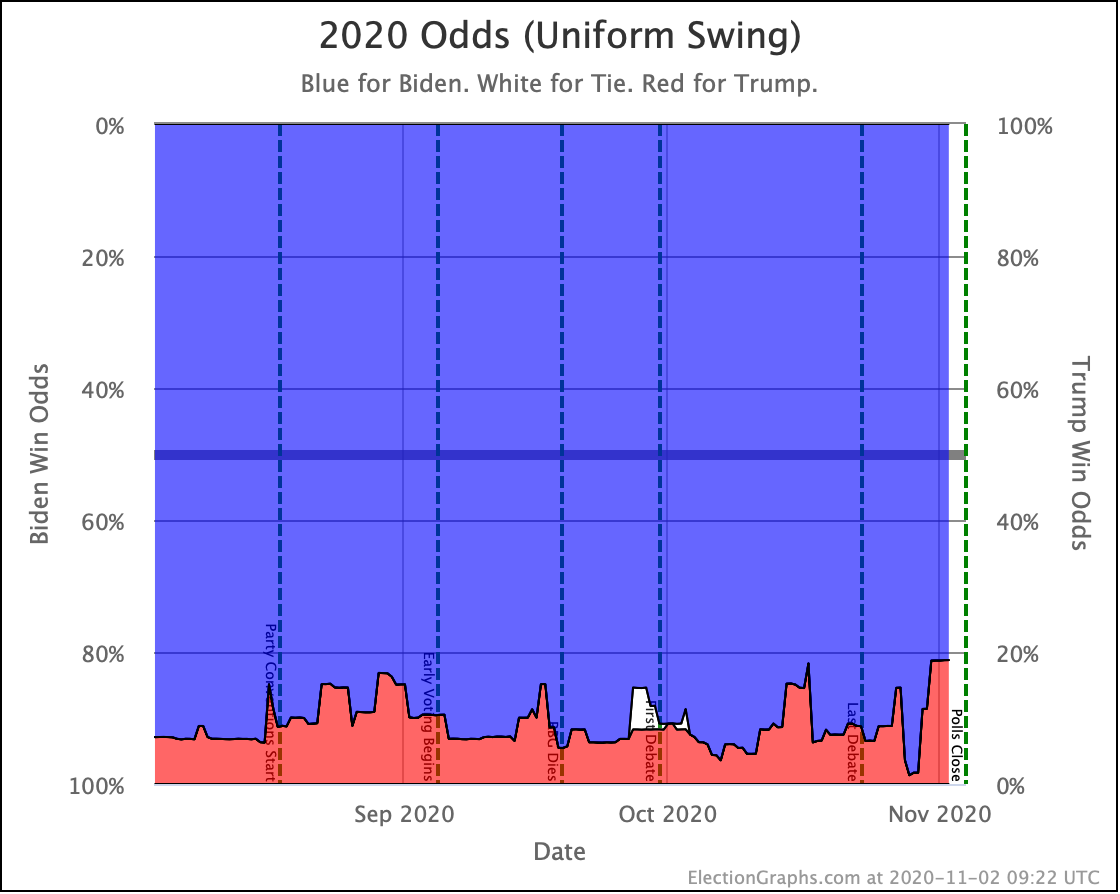
In this view, Trump is now at an 18.8% chance of winning.
As with all of the other views, this is the best Trump's numbers have been in the last three months.
Since both of these models are extremes, and the truth is somewhere in between, the official Election Graphs statement on Trump's chances at this point is "between 1.2% and 18.8%". The middle of that range is 10.1%.
While Election Graphs doesn't actually model where the right spot is within this range, the middle is as good a spot to look at as any. So I'll just call it a 10.1% chance of a Trump win at the moment. That is up from 7.4% when we looked at this two days ago.
As 2016 should have taught everyone, a 10% chance of winning is not the same thing as a 0% chance of winning. Things that happen 1 in 10 times happen many many times every day.
Having said that, Biden is still a heavy favorite. We're not in a coin toss scenario, and certainly not in a situation where Trump is favored.
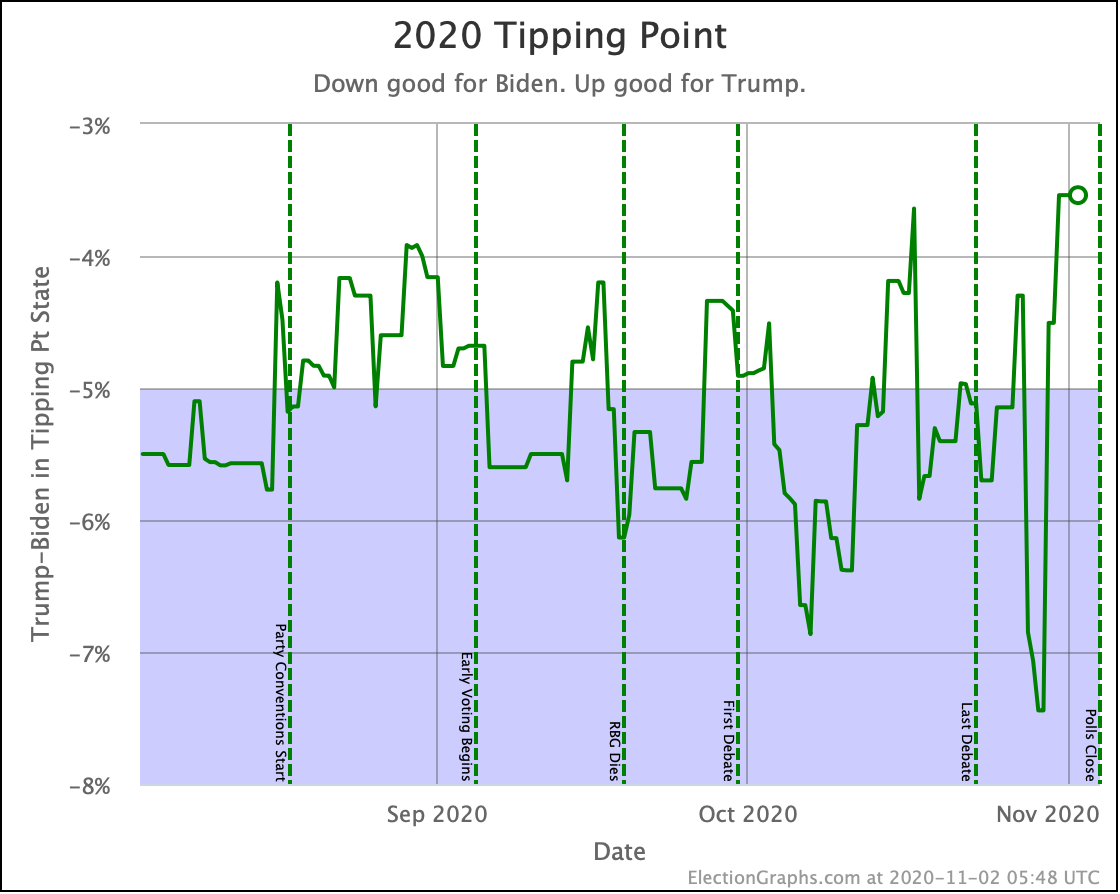
Looking at the tipping point without the 2016 comparison, there is one additional thing I would like to point out besides the fact that the tipping point is at a 3.5% Biden lead, which is outside of the range it has been in for the last three months.
Specifically, look a few days earlier. The many polls that came since the last update included a lot of polls that were very favorable to Biden that were in the field a few days earlier than the ones that drove the current numbers toward Trump. So I now show a peak on October 29th to a 7.4% tipping point lead for Biden based on that polling! That was also outside the normal range for the last three months. In fact, it was the best tipping point number Biden has EVER seen!
Because polls are coming in fast and furious, and Election Graphs is intentionally very sensitive to short term changes as polling velocity increases, we are seeing LOTS of volatility as outliers come and go from the averages.
Which is another reason to think that the "truth" here is probably a fairly stable Biden +5% tipping point lead, and the ups and downs here are just polling noise. Maybe in future cycles, I should consider making things a little LESS sensitive to short term changes. Maybe a 10 poll average instead of a 5 poll average. That would smooth things out a little bit.
For now though, when you see a noisy graph like this, it almost always means that the true "signal" is not actually an underlying reality rapidly moving up and down, but rather you are just seeing measurement artifacts, and you want to consider the overarching trend, not the transient jiggles.
OK. Time for the map and spectrum:
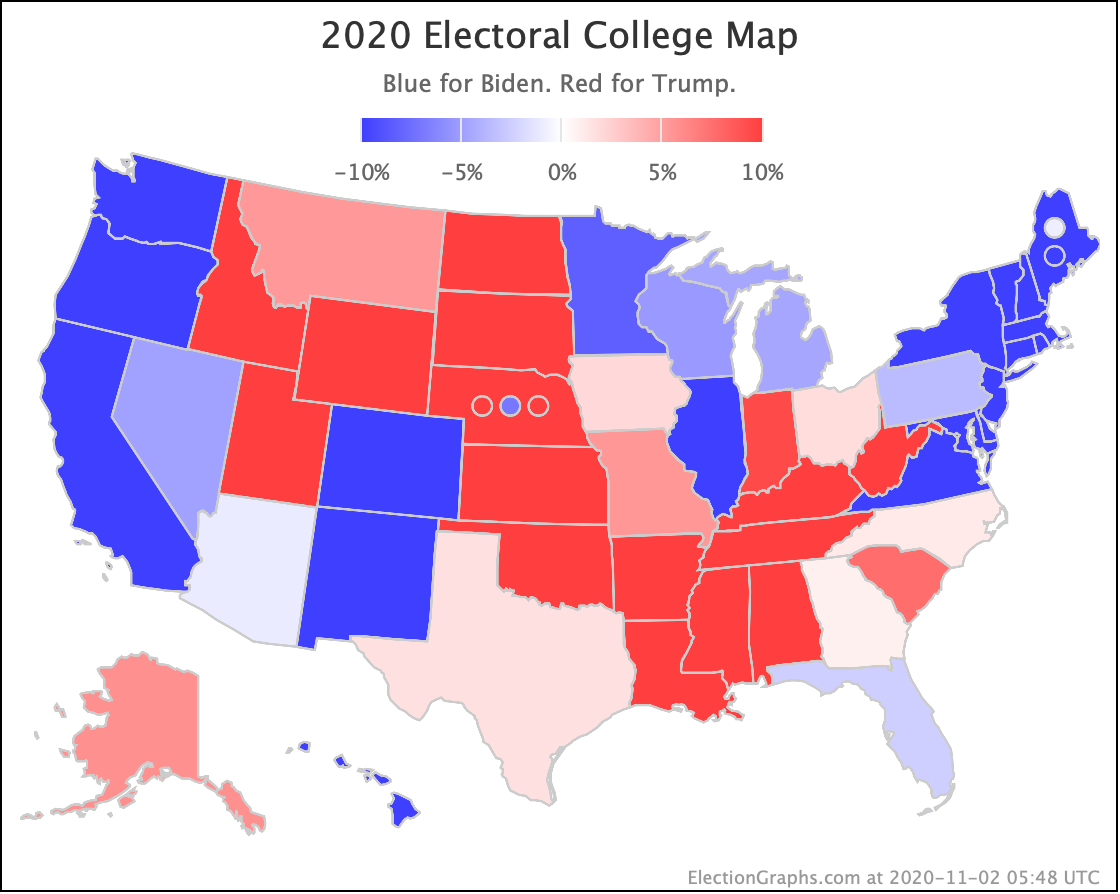
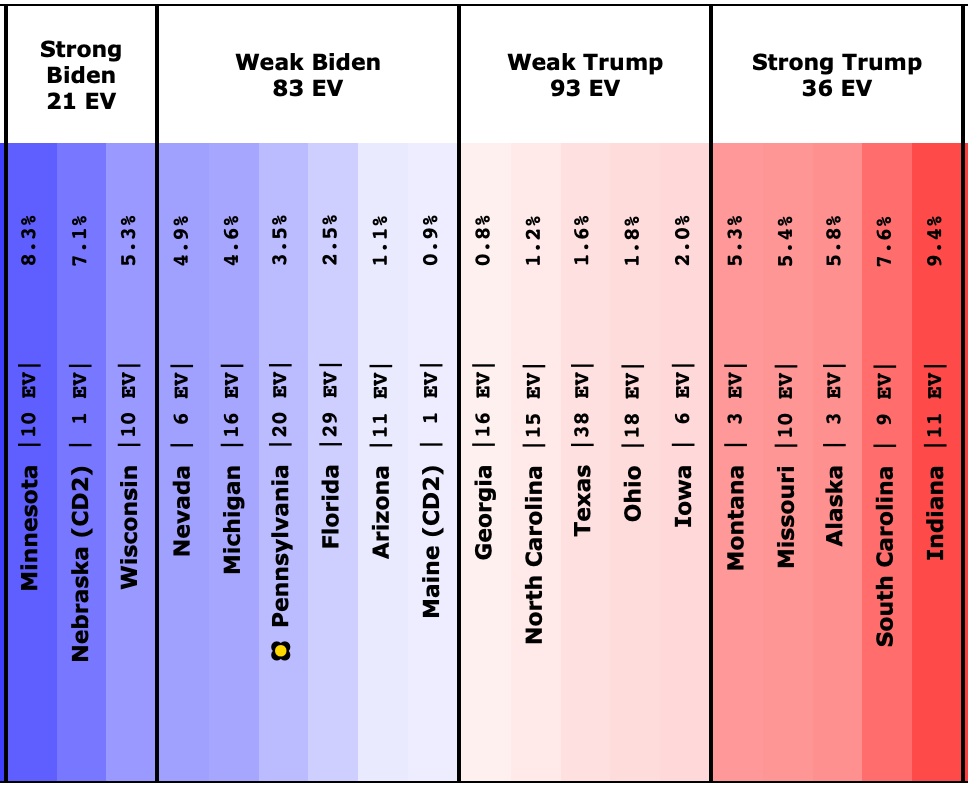
As with all the other views, we have shown, this spectrum shows a lot closer race than we have seen since June. There are more states on the Trump side of the centerline, and the "Weak Biden" states are weaker than they were.
Subject to any changes due to additional polls coming in over the next day or so, what does that mean in different polling error scenarios?
As we discussed last time, the Election Graphs tipping point was off by 0.89% in 2012, 2.36% in 2016, and 3.45% in 2008.
You need a larger error than any of those three election cycles to get a straight-up Trump victory.
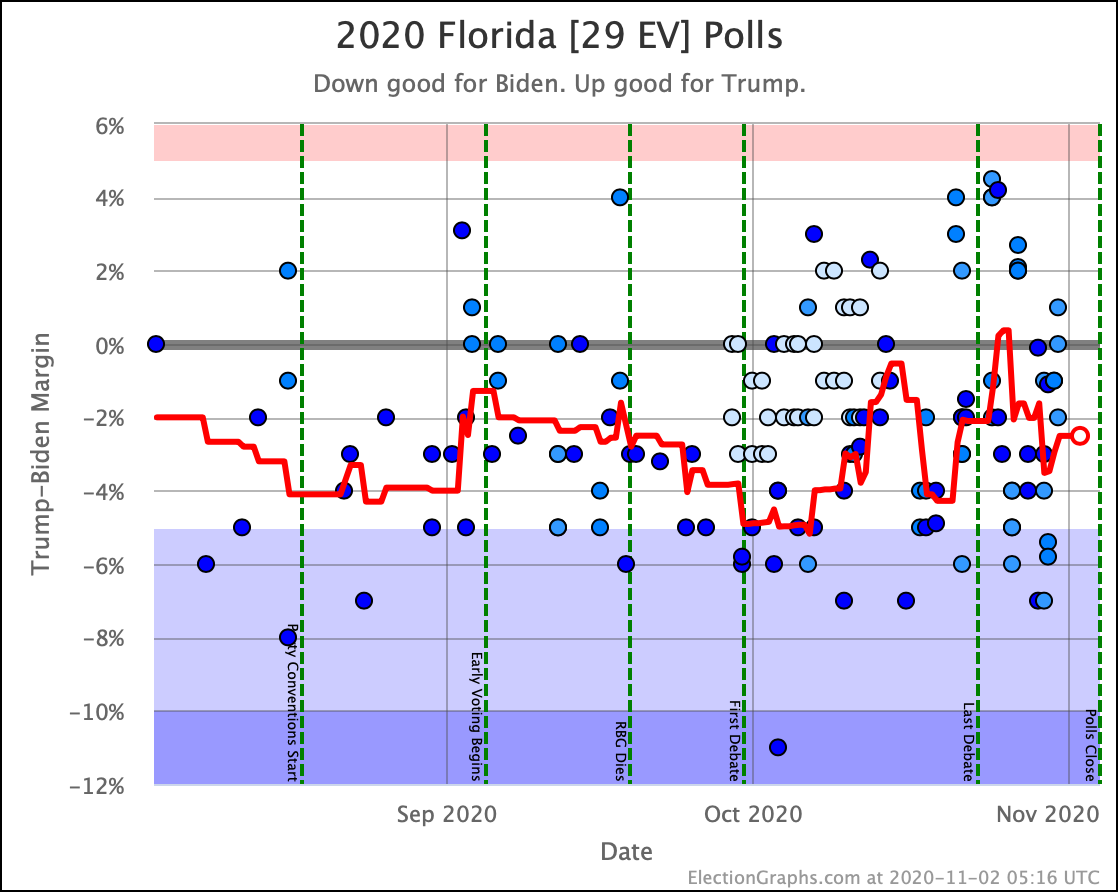
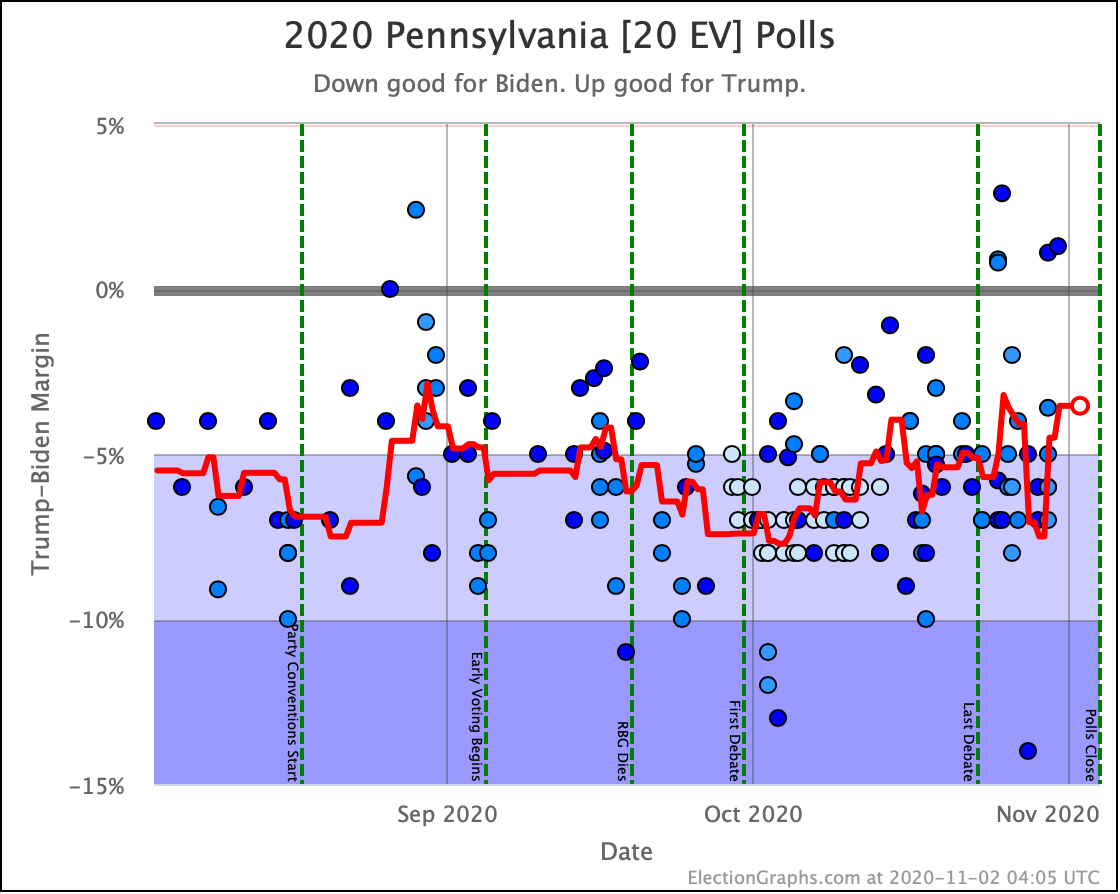
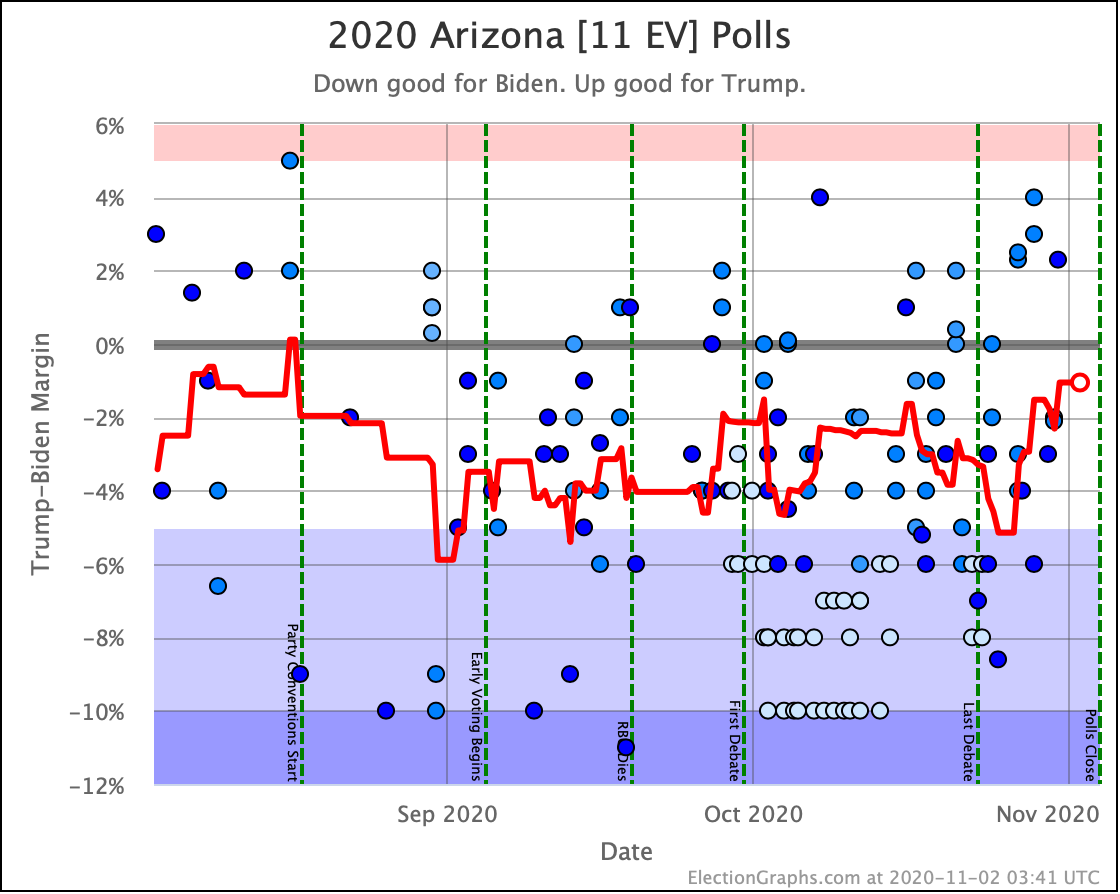
But a 2008 level error would have Trump winning Maine CD2, Arizona, and Florida in addition to the states he leads, and leave Biden's win dependant on a lead of less than 0.1% in Pennsylvania. With all of the talk of legal disputes over what ballots are counted, a 2008 level polling error in this direction would certainly put that scenario into play.
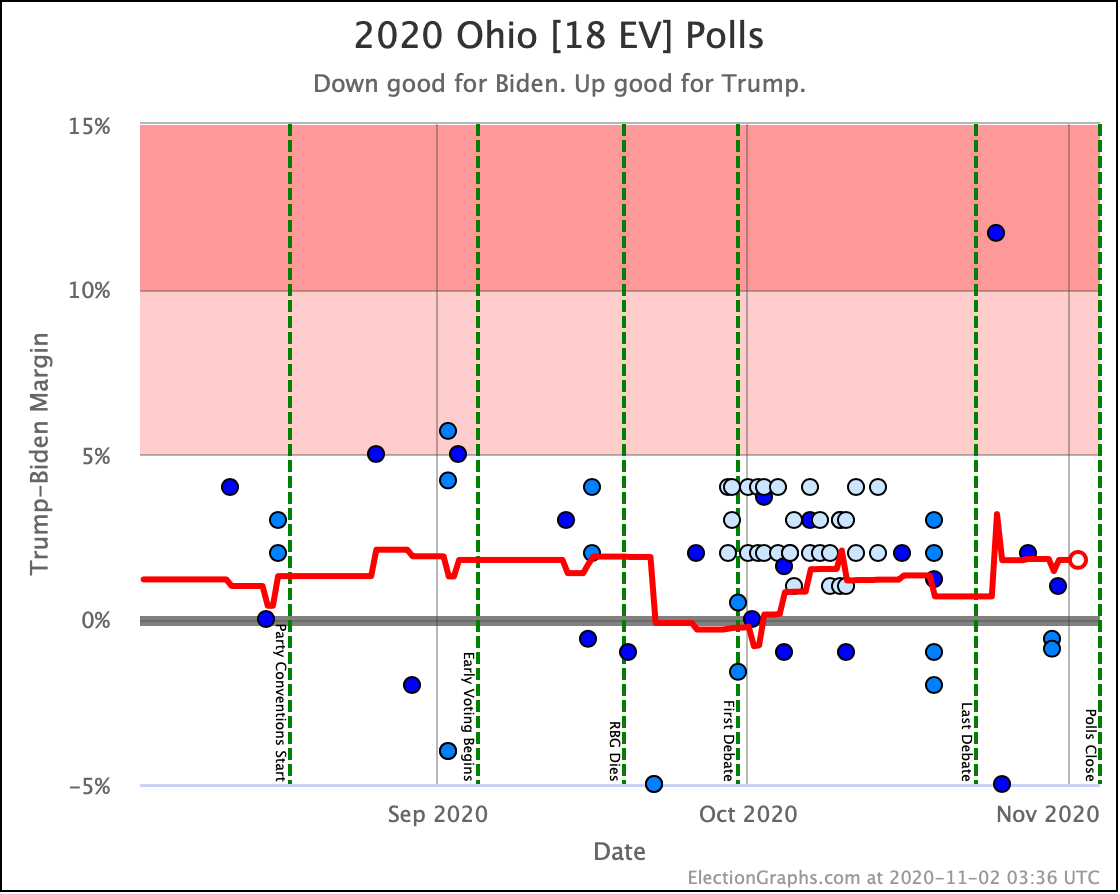
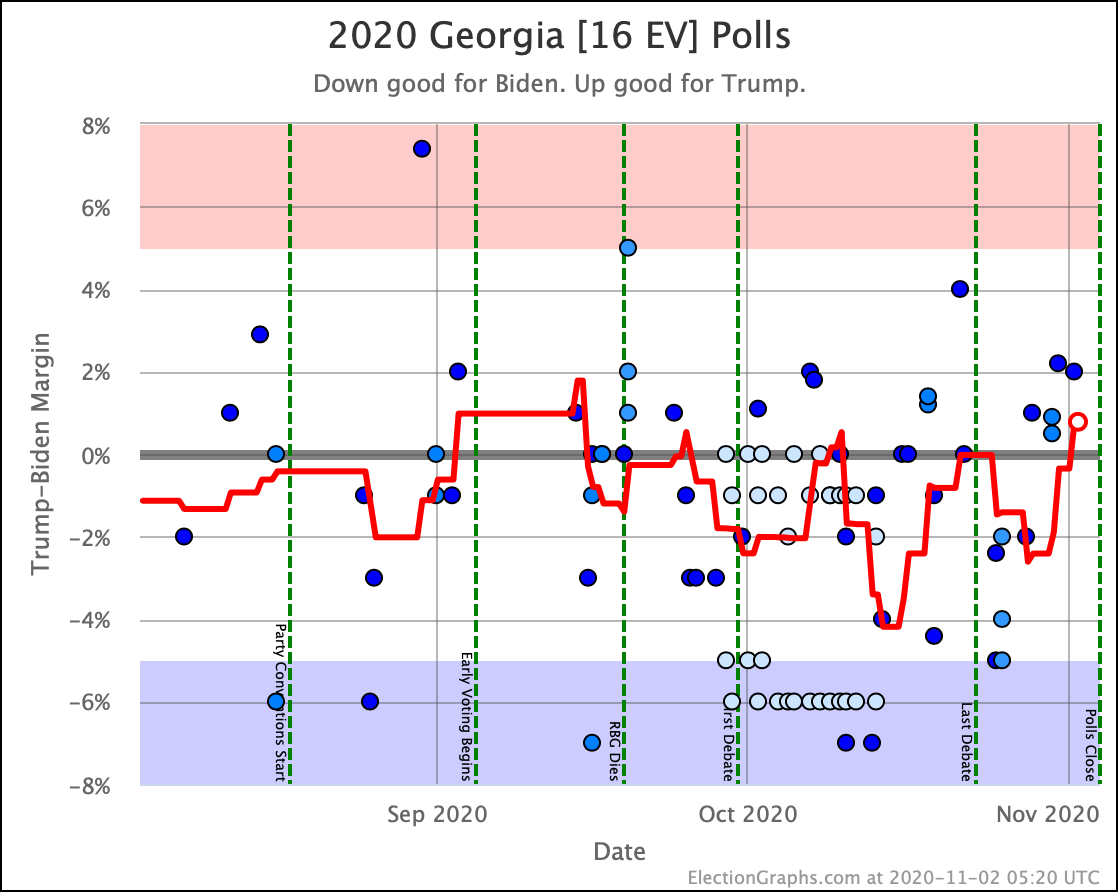
On the other hand, even a 2016 level polling error in the other direction would result in Biden winning Georgia, North Carolina, Texas, Ohio, and Iowa. That would be Biden 413, Trump 125 in the final count, or a 288 electoral vote margin, which would be the largest win since Bush beat Dukakis in 1988.
The most likely result is of course in between: A Biden win, but not by an overwhelming margin.
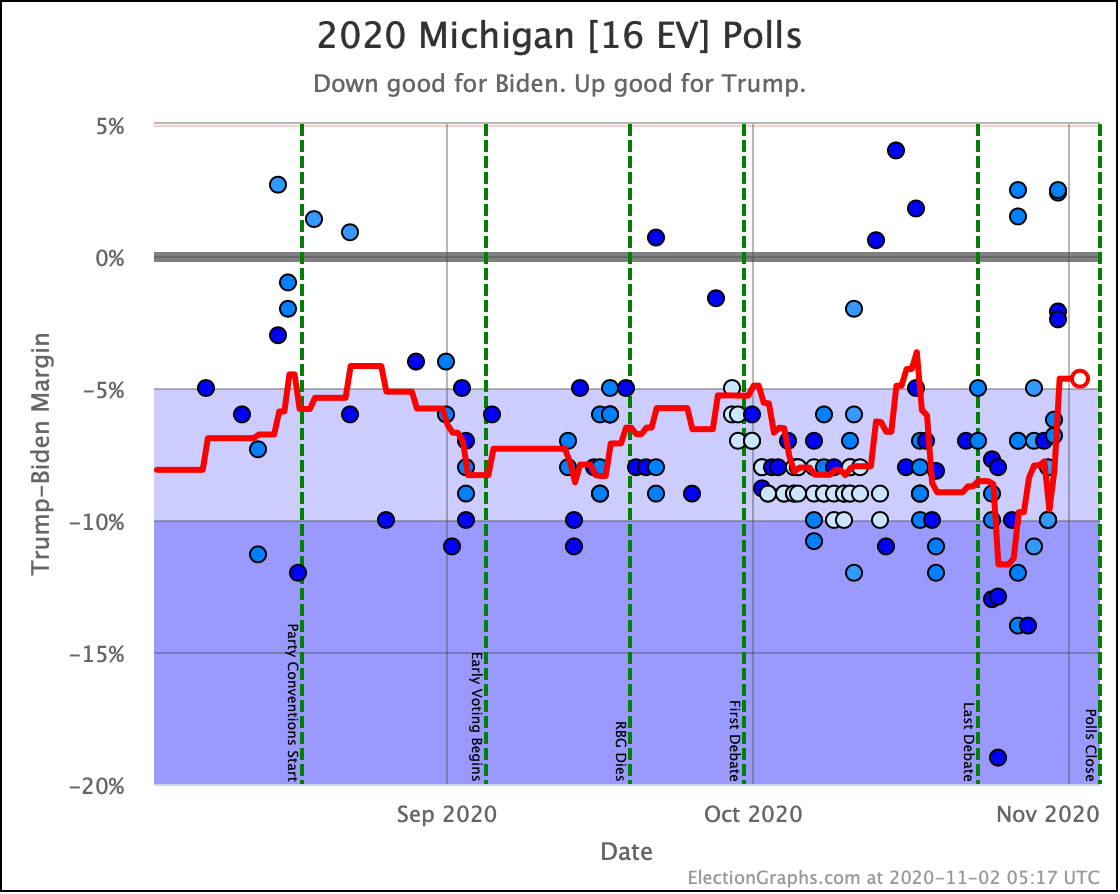
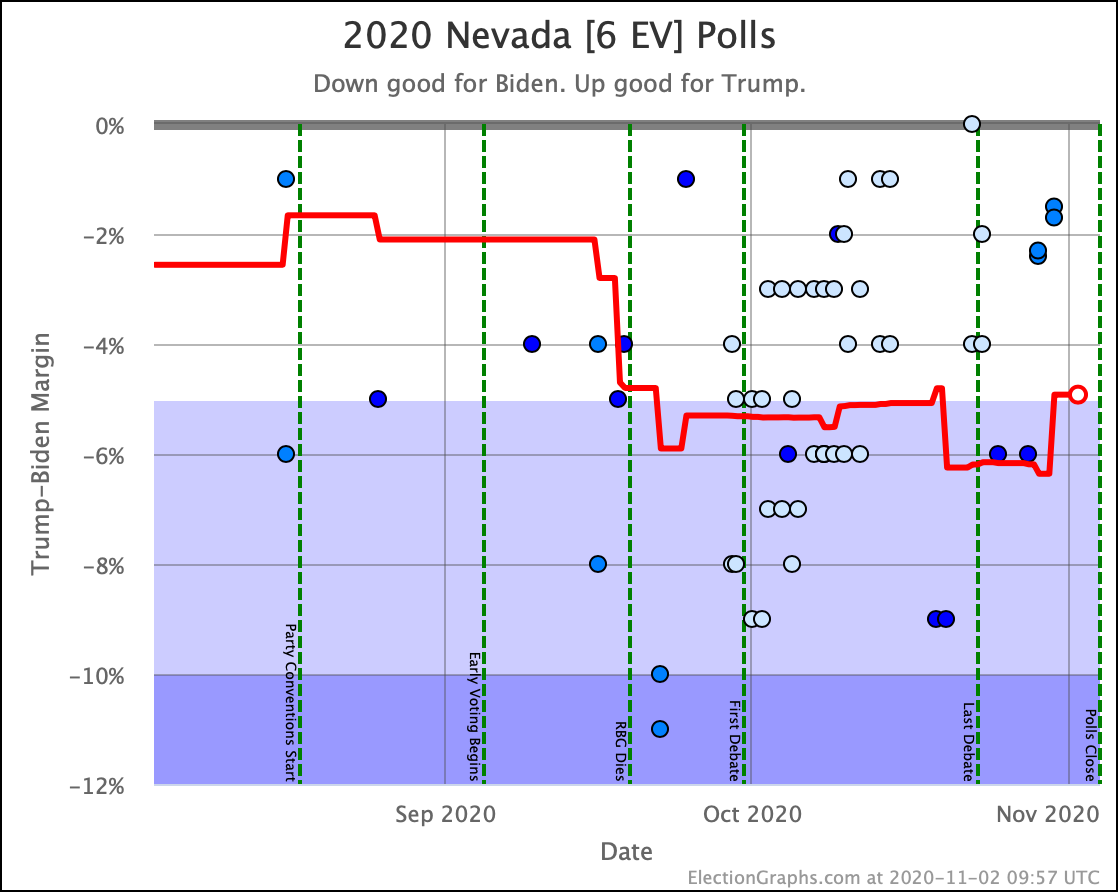
And now the trends in all the close states:
And that is that.
1.5 days until the first results start coming in on election night.
If you are eligible to vote in the US and have not yet done so, make your plan and get it done.
For more information:
This post is an update based on the data on the Election Graphs Electoral College 2020 page. Election Graphs tracks a poll-based estimate of the Electoral College. The charts, graphs, and maps in the post above are all as of the time of this post. Click through on any image for current interactive versions of the chart, along with additional details.
Follow @ElectionGraphs on Twitter or Election Graphs on Facebook to see announcements of updates. For those interested in individual poll updates, follow @ElecCollPolls on Twitter for all the polls as I add them. If you find the information in these posts informative or useful, please consider visiting the donation page.
One thought on “1.5 Days Out: Good Poll Cycle for Trump”