
As always, if you are impatient for one of these updates, the 2020 pages on Election Graphs are updated every day as new polls come in. Or you can follow @ElecCollPolls on Twitter to see all the polls as I add them. While you are at it, follow @ElectionGraphs too.
I'm trying to do these blog updates more often now that we are in the last two weeks. The last blog update here was on October 20th. Here are the high-level changes since that last post:
| Model | Metric | 20 Oct | 24 Oct | 𝚫 |
| Probabilities (Indep States) |
Trump 2σ Median Biden 2σ |
Biden +32 Biden +140 Biden +254 |
Biden +52 Biden +162 Biden +266 |
Biden +20 Biden +22 Biden +12 |
| Trump Win Tie Biden Win |
0.3% 0.0% 99.7% |
0.1% 0.0% 99.9% |
-0.2% FLAT +0.2% |
|
| Probabilities (Uniform Swing) |
Trump 2σ Median Biden 2σ |
Trump +52 Biden +164 Biden +294 |
Trump +52 Biden +144 Biden +294 |
FLAT Trump +20 FLAT |
| Trump Win Tie Biden Win |
23.3% 0.0% 76.7% |
9.1% 0.0% 90.9% |
-14.2% FLAT +14.2% |
|
| Categories | Trump Best Expected Biden Best |
Biden +40 Biden +164 Biden +294 |
Trump +12 Biden +220 Biden +294 |
Trump +52 Biden +56 FLAT |
| Tipping Point | Biden +3.1% | Biden +4.9% | Biden +1.8% |
Last time we talked a lot about how the big move in Trump's direction we saw then could very well just be a transient thing because there was a rush of Pennsylvania polls from small pollsters that were favorable to Trump, which might not be sustained once the bigger pollsters released new results for Pennsylvania.
That is exactly what happened. In the days since that blog post, there were quite a few additional polls released in Pennsylvania. Here is what Pennsylvania looks like now:
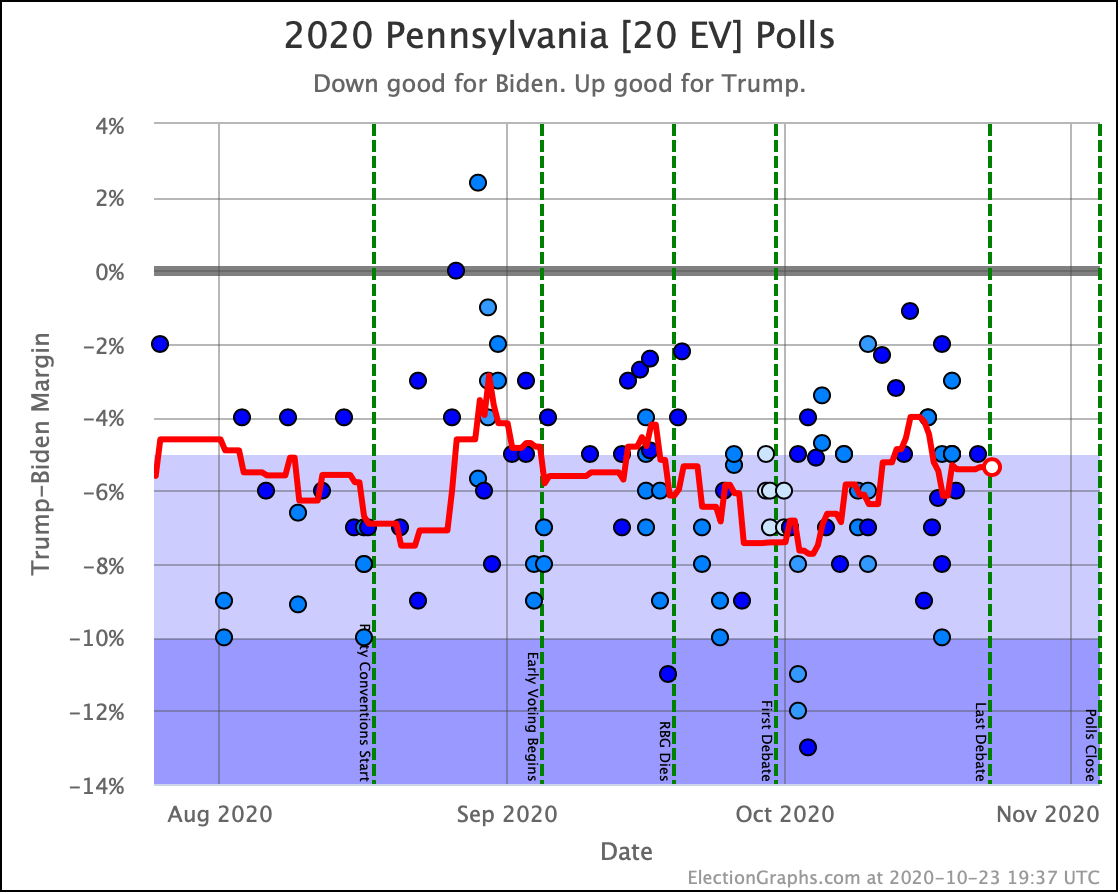
A brief foray into "Weak Biden", and then right back to "Strong Biden".
These results not only moved the tipping point back toward Biden, but they also knocked the top off the peak we saw last time, so instead of the tipping point getting down to a 3.1% Biden lead, now Biden's worst tipping point was only 3.6%.
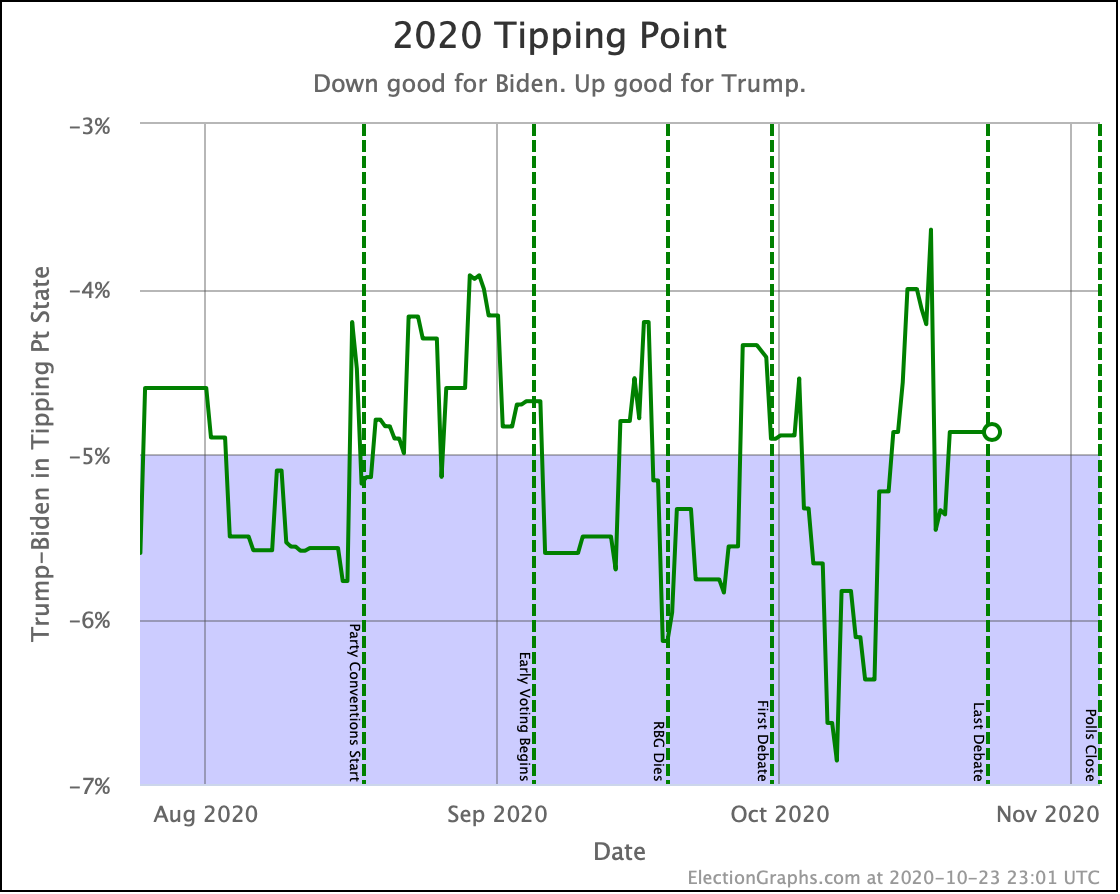
The tipping point is now at Biden by 4.9%, right smack in the middle of that 4% to 6% range it has normally been in ever since mid-June.
Not only that, but the same is true of almost all of the main metrics. They are all in their "normal ranges".
Let's take a quick look:
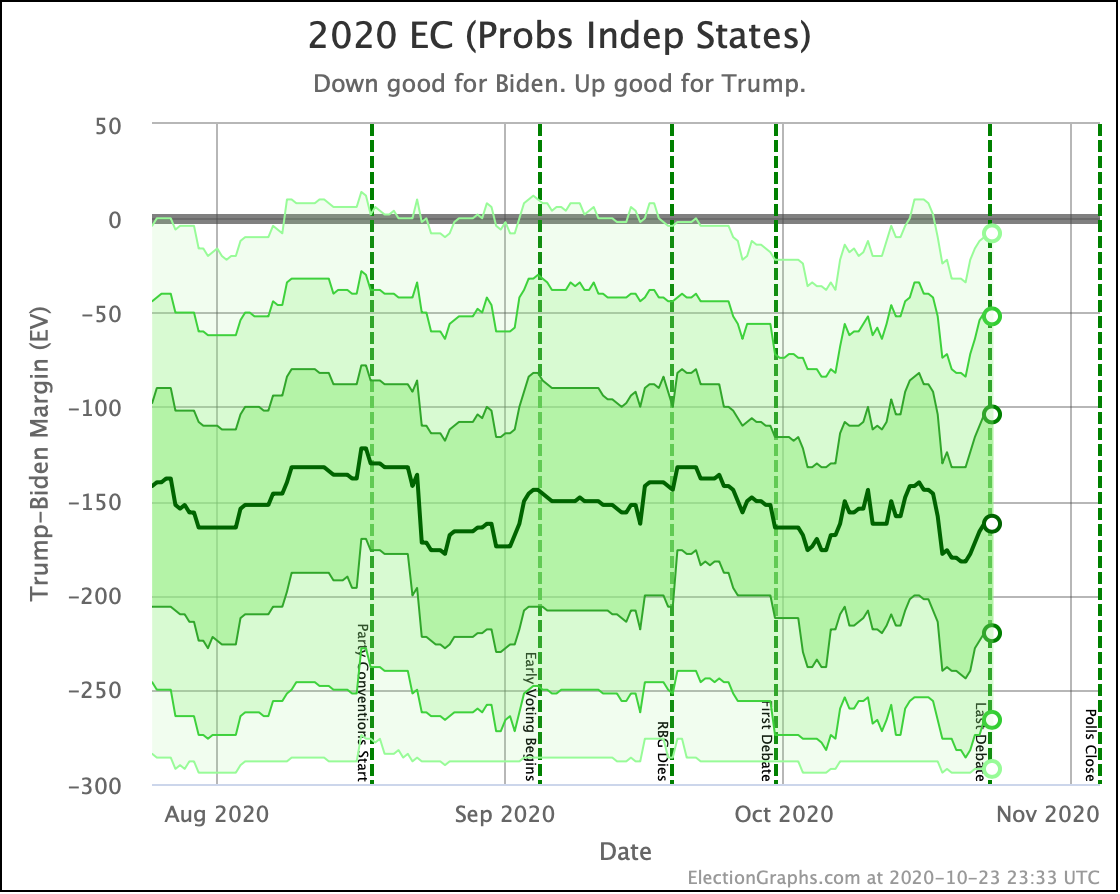
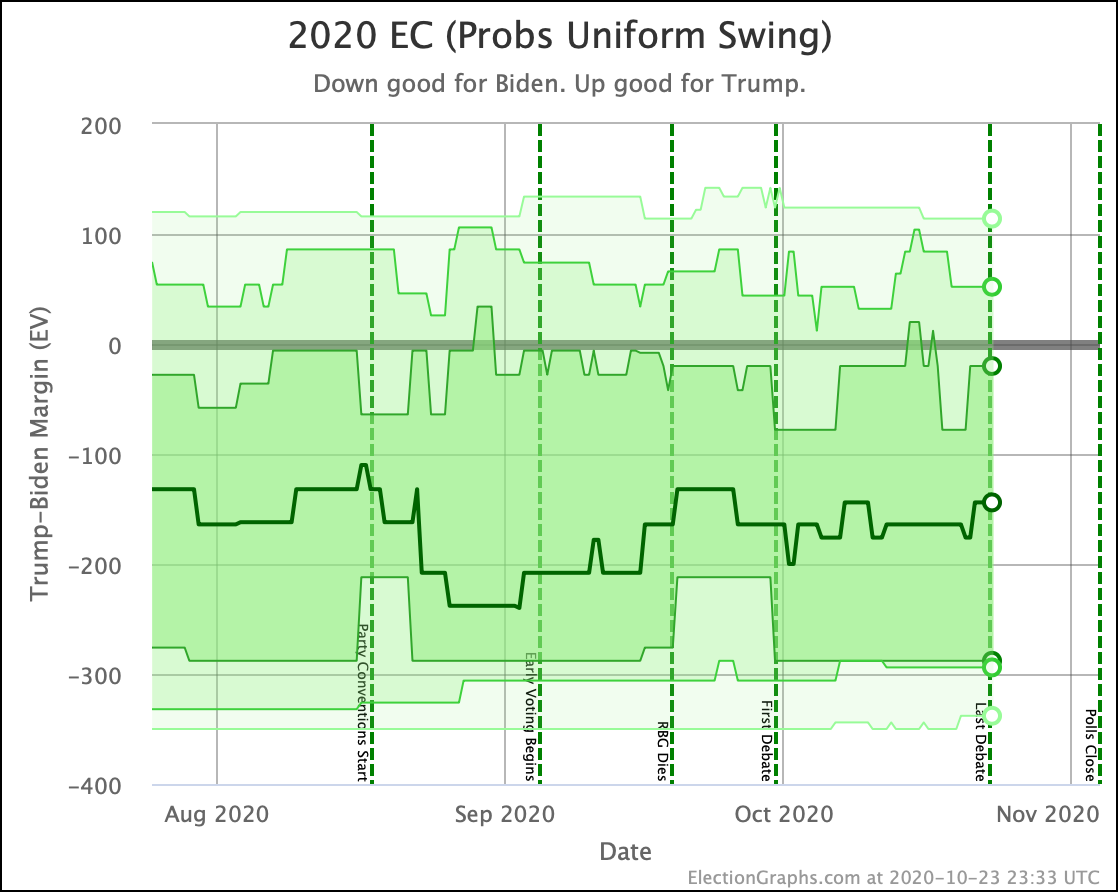
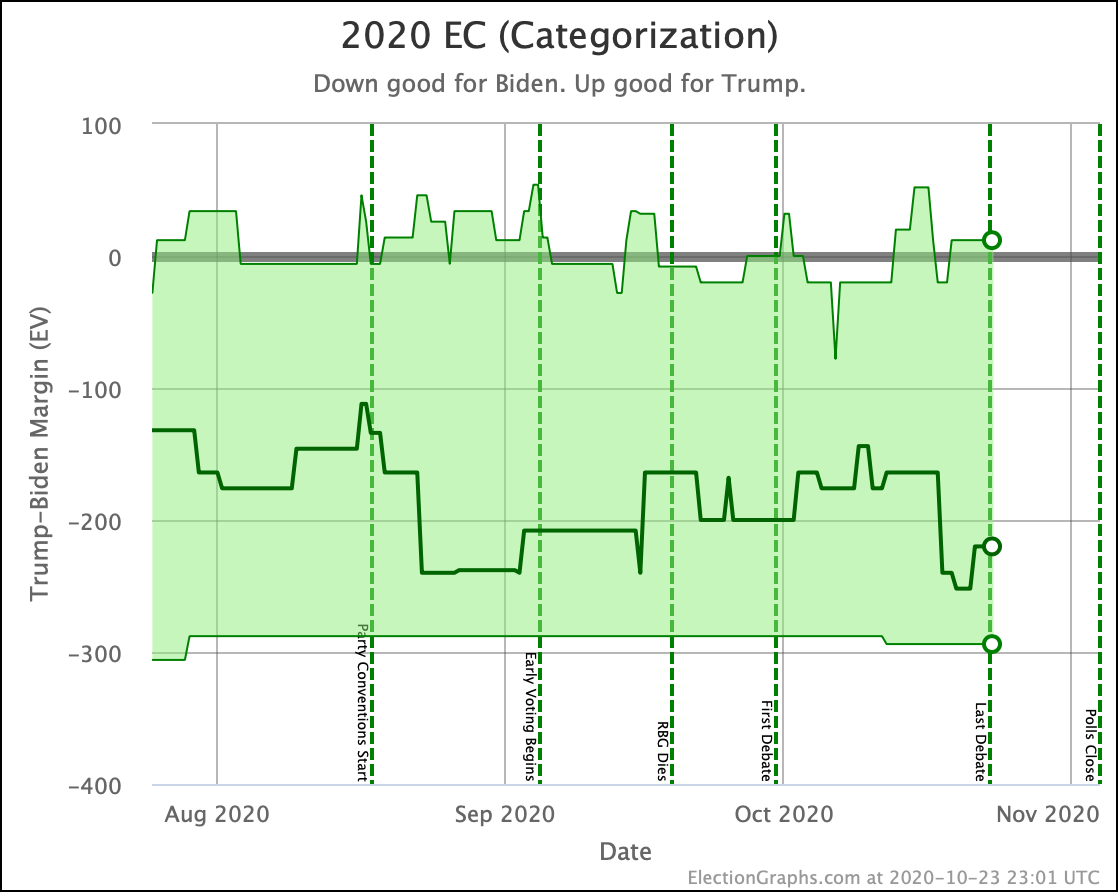
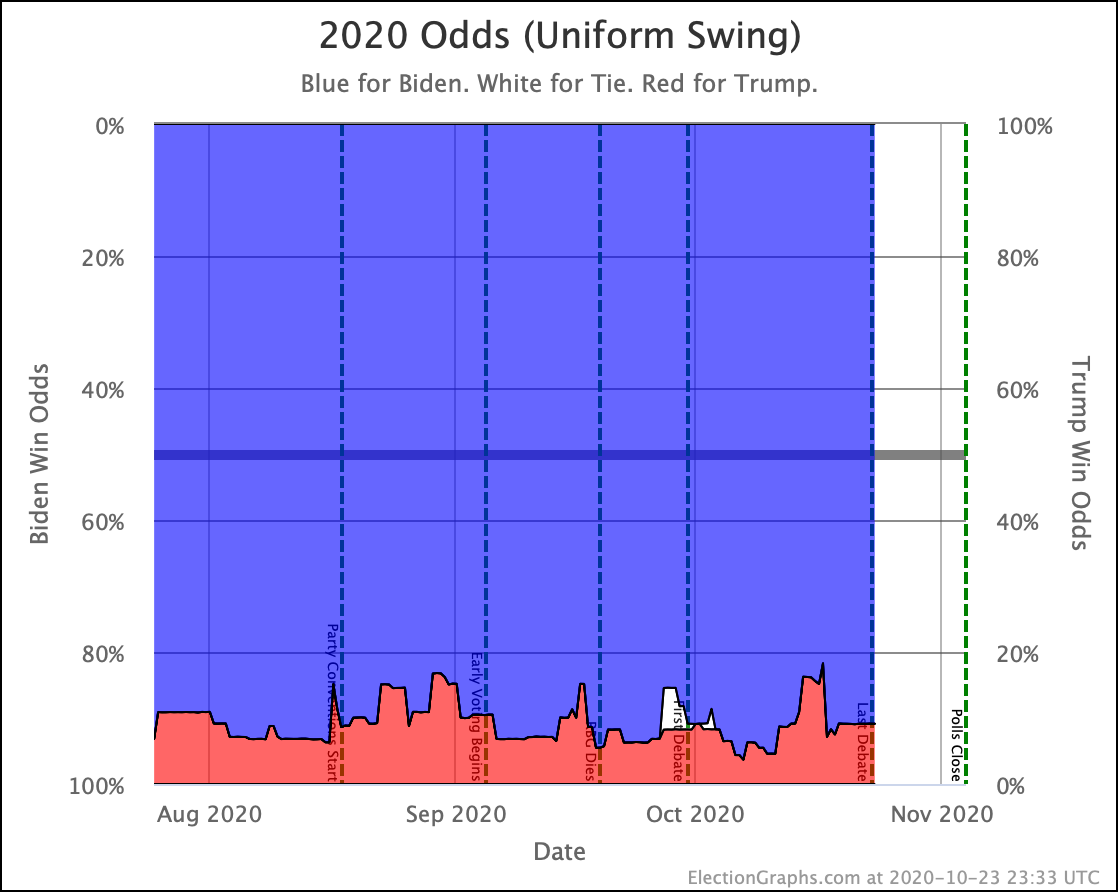
The Tipping Point, the Independent States View, the Uniform Swing View, the Categorization View, and the odds generated from the two probabilistic views all show the race back in the "normal zone". (I didn't bother with showing the second odds chart since it is just a blue rectangle.)
So bottom line, a few days of bad polls in Pennsylvania moved things in Trump's direction. But with more polling, it doesn't seem like a "real" move representing a fundamental change.
Instead, it once again looks like this race has basically been frozen since June. The moves up and down we see are mostly just random results of which pollsters released results recently, and normal sampling errors and such. Very little, if any, real movement.
Roughly speaking, ever since June, this has looked like a race where Biden leads by between 4% and 6% in the tipping-point state, with a potential winning margin somewhere between 100 and 200 electoral votes.
We still have 11 days left of course. There is still a little bit of time left for that to change.
And also, there is still the possibility of a systematic polling error. Between our two probabilistic models based on how far off Election Graphs state averages were in 2008, 2012, and 2016, the Election Graphs estimate for Trump's odds of winning if the election was today currently stand at "somewhere between 0.1% and 9.1%".
Where in that range depends on how closely linked the results in the different states are, which we don't estimate. But everyone needs to continue to remember that 10%, or 5%, or even 1% aren't the same as 0%, and there are still paths to a win for Trump. This isn't over yet.
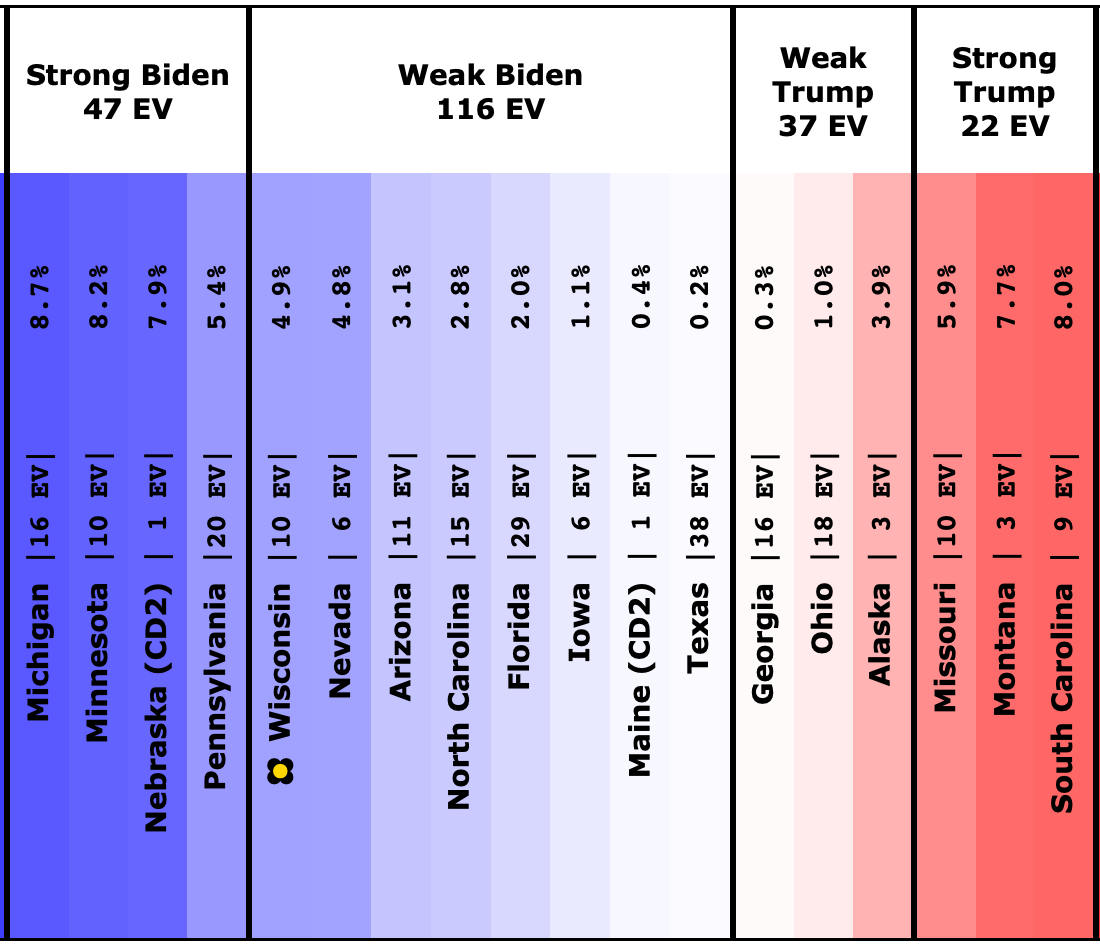
The map and the center of the spectrum of states look like this now:
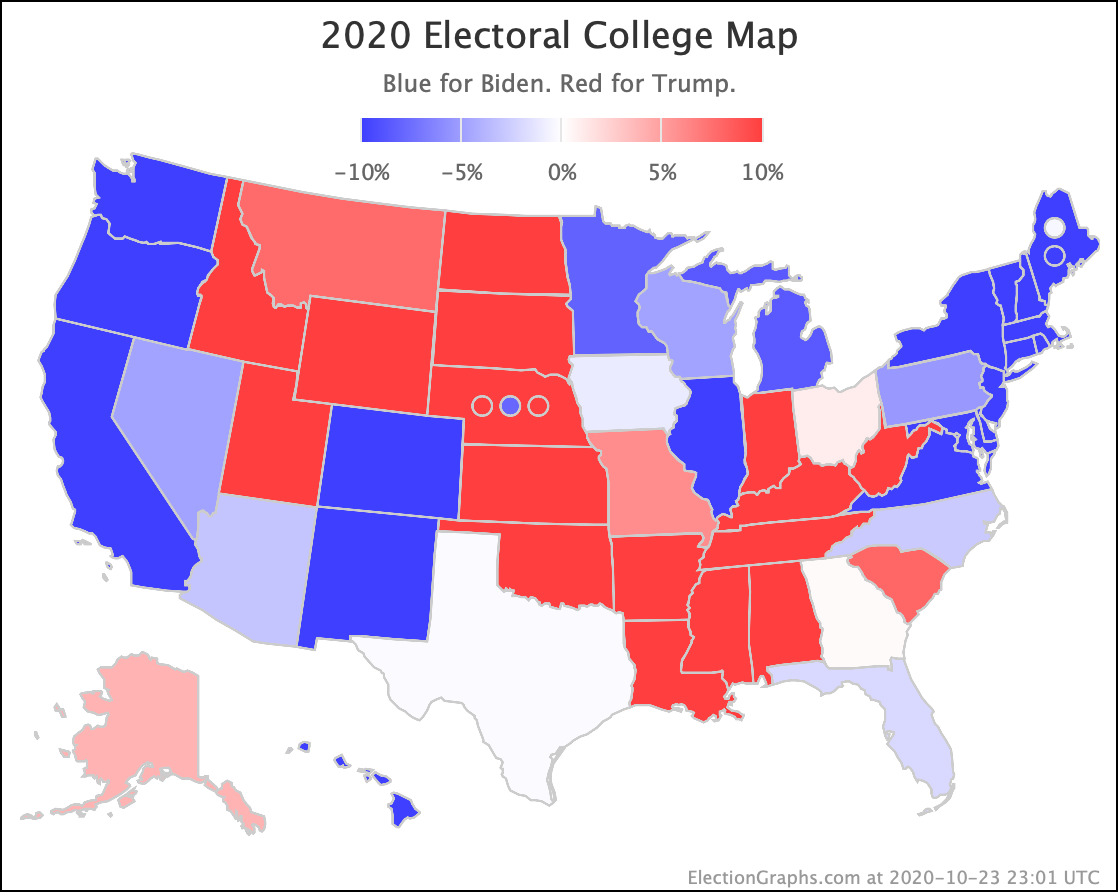
To win, Trump needs to run the table and win every single close state, or pull in some not so close states.
Let's do the comparison to 2016 now:
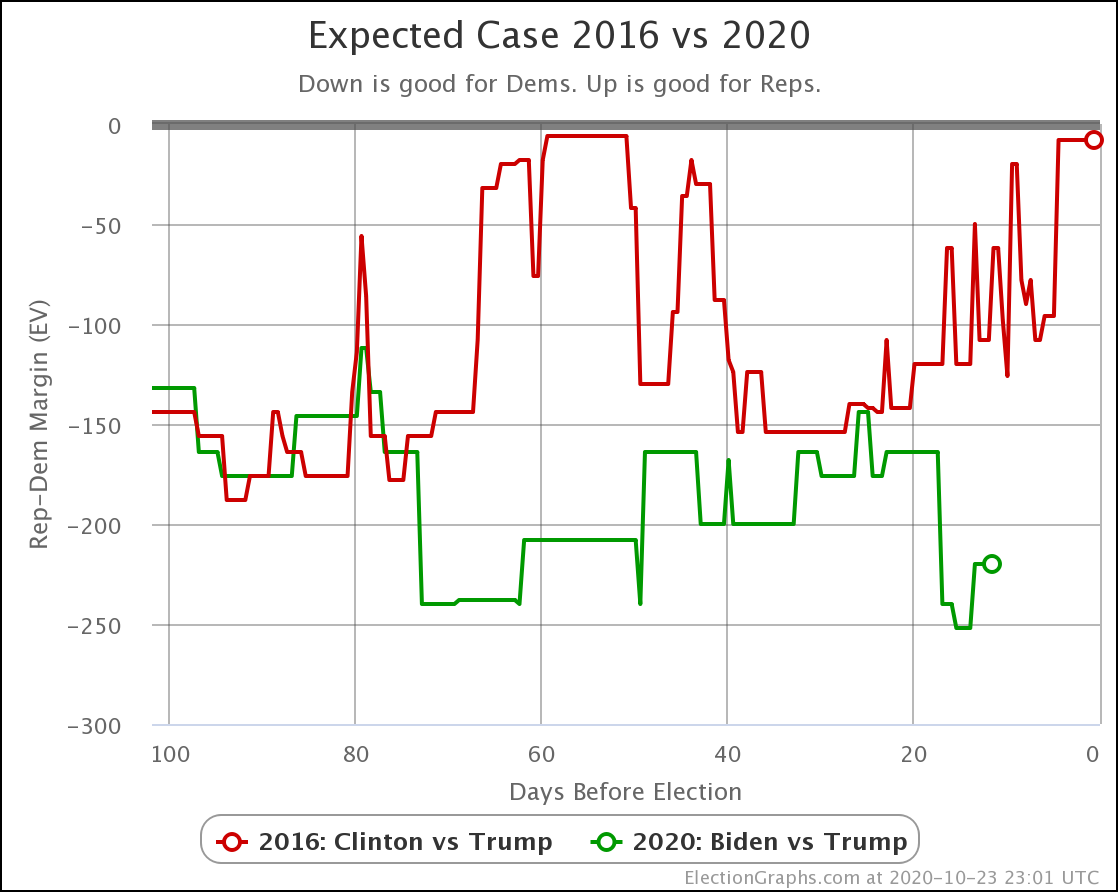
In terms of the Electoral College in the categorization view, Biden has been in a better spot than Clinton since we hit 76 days out, most of the time being more than just a little bit ahead of her pace.
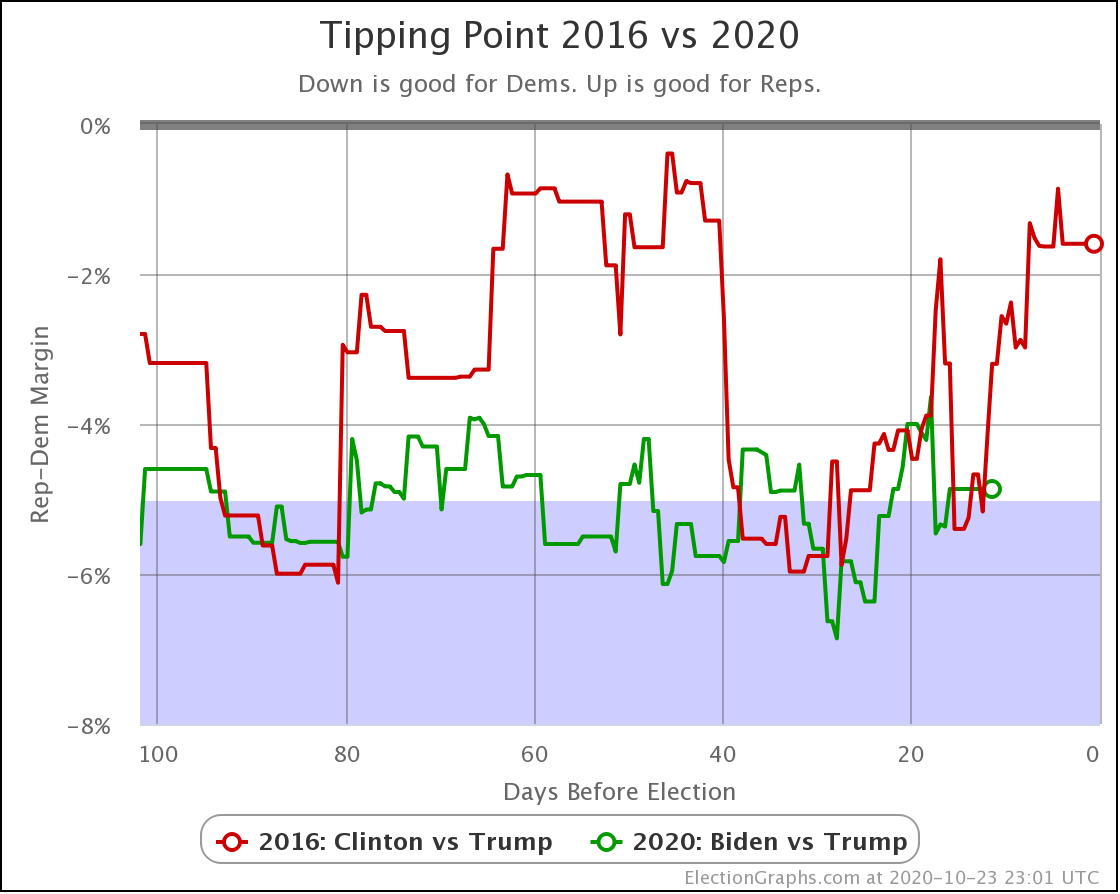
But Biden's tipping point has been comparable to where Clinton's was at the same point four years ago for the last few weeks. Biden has not been consistently ahead of Clinton on this metric.
As of this blog post, Biden is once again ahead of where Clinton was though. Eleven days out Biden is at 4.9%, Clinton was at 3.2%. And it was mostly downhill for Clinton after this point.
Clinton's final drop was precipitated by the Comey letter. So far nothing comparable has hit Biden, and as I write this, nearly 53 million votes have already been cast. So yes, something could still change, but time is running out fast.
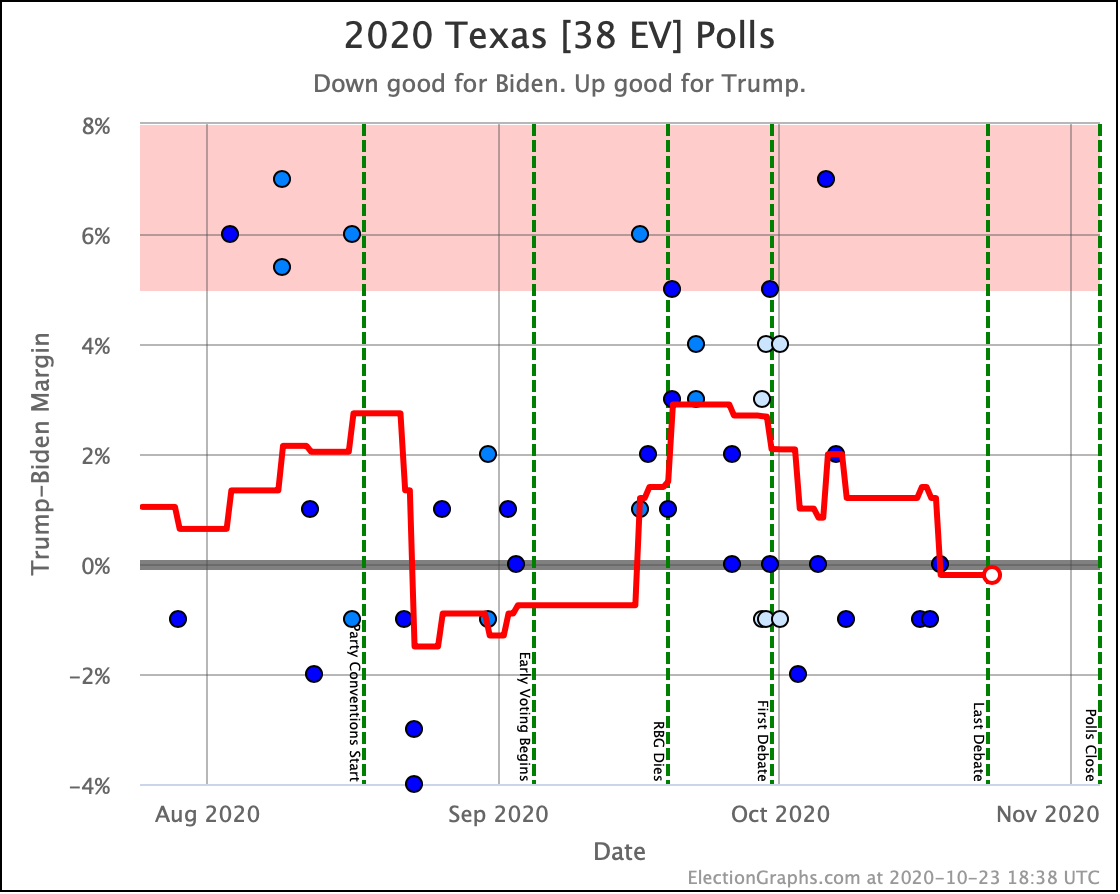
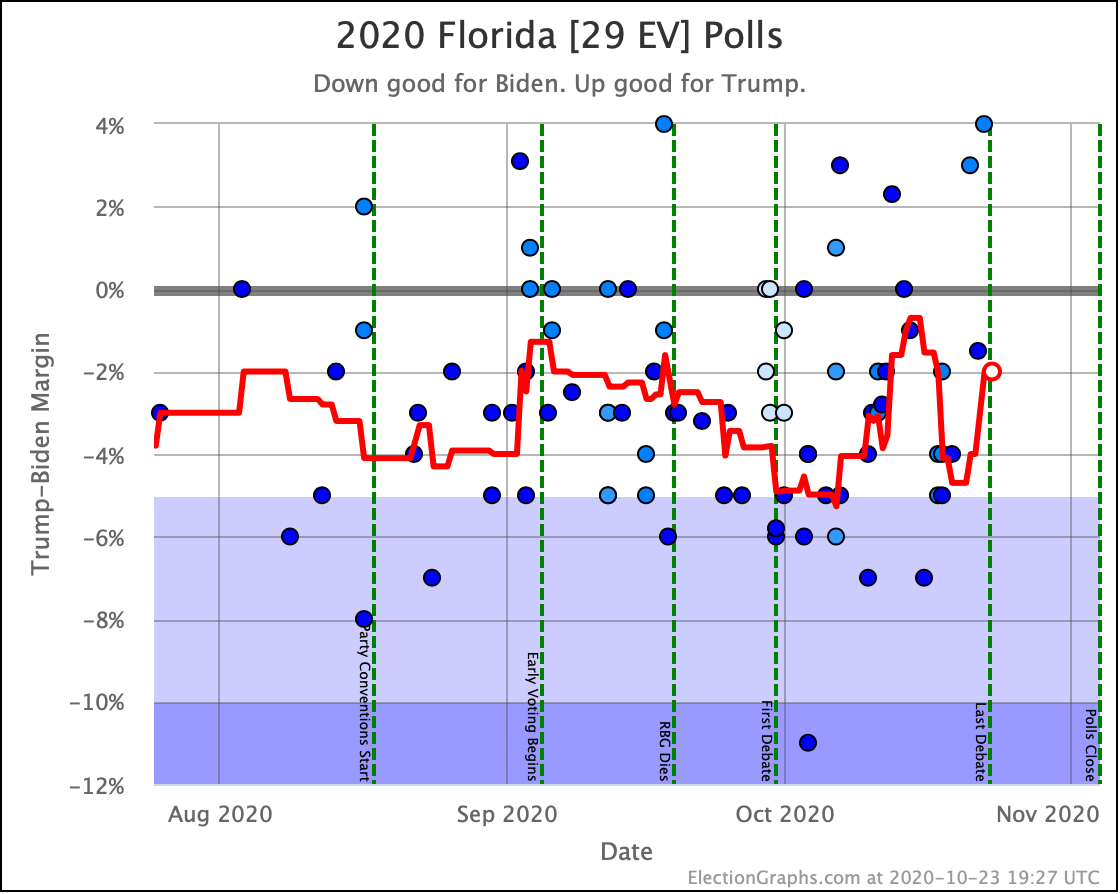
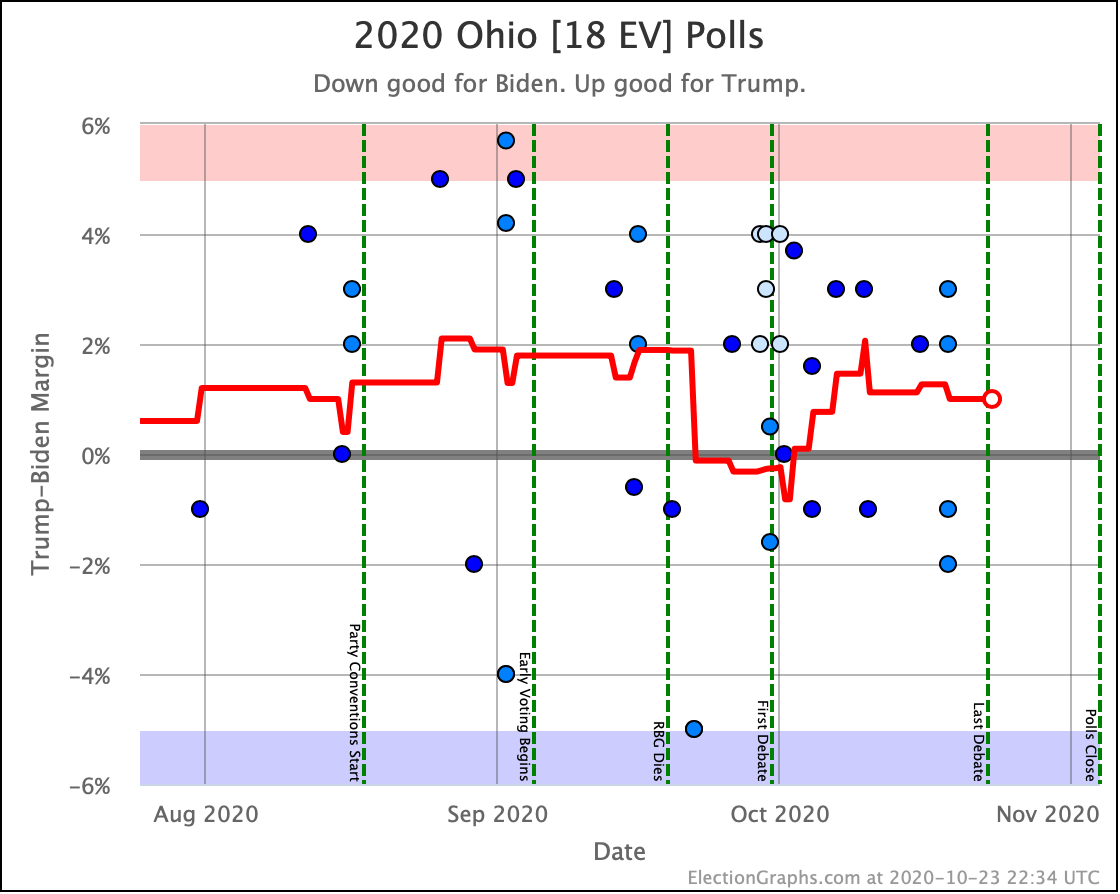
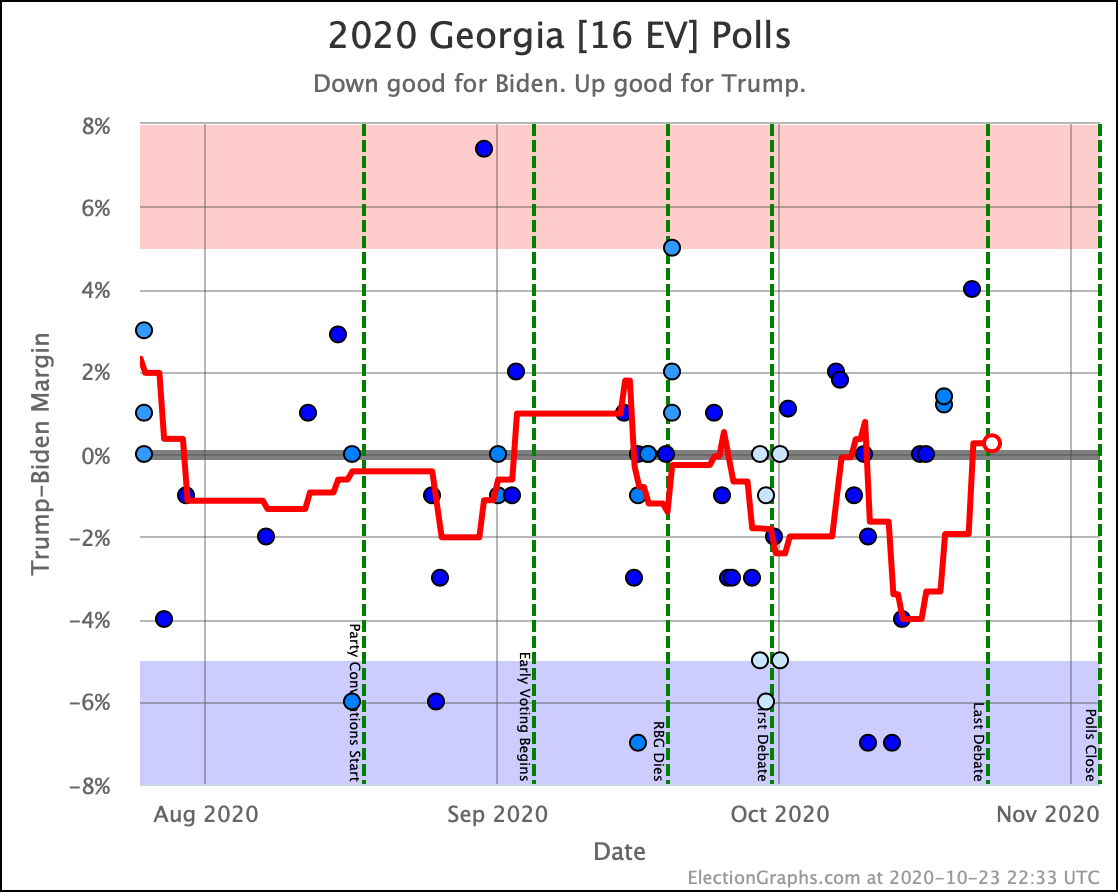
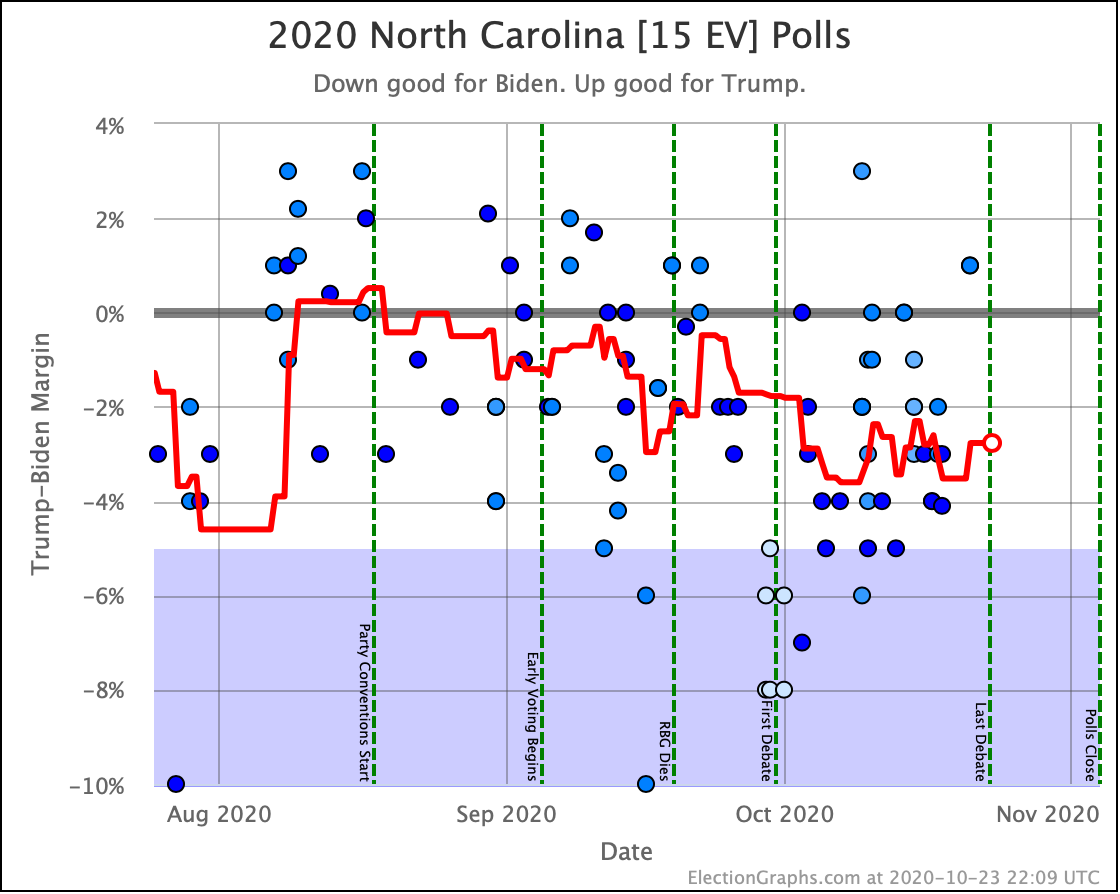
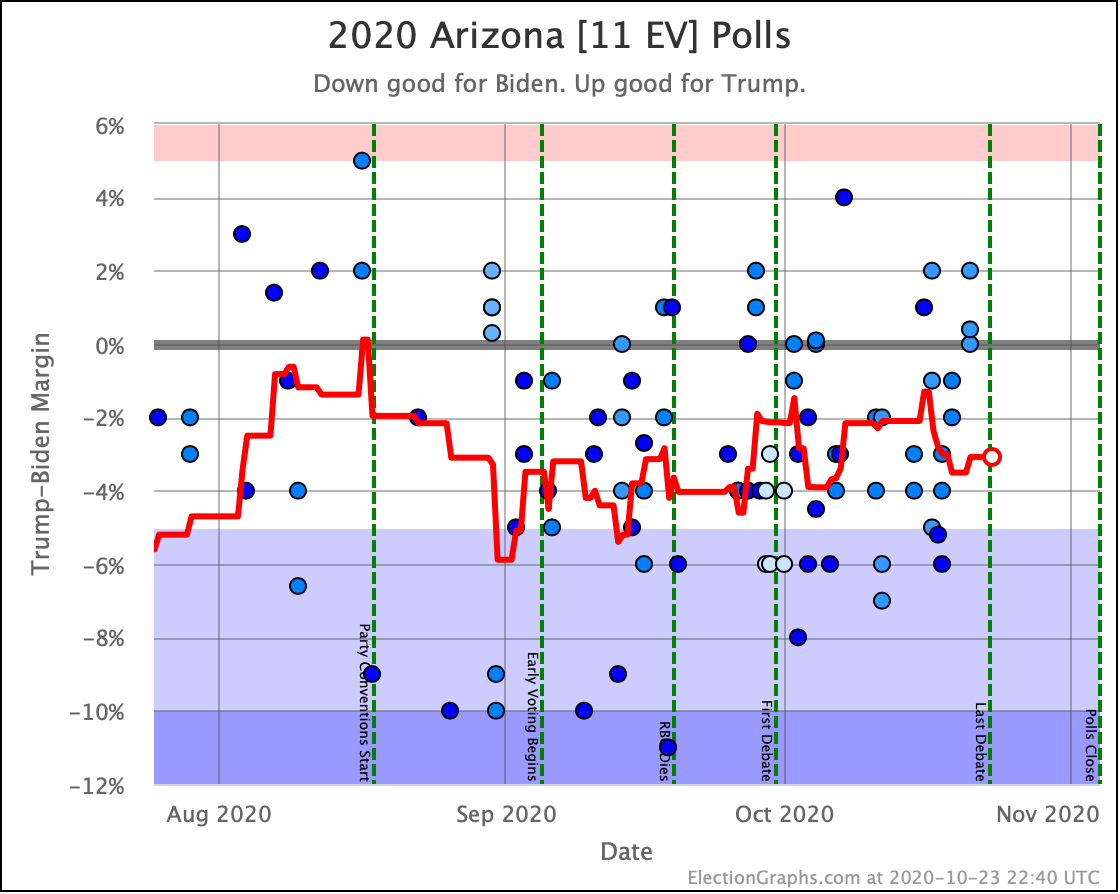
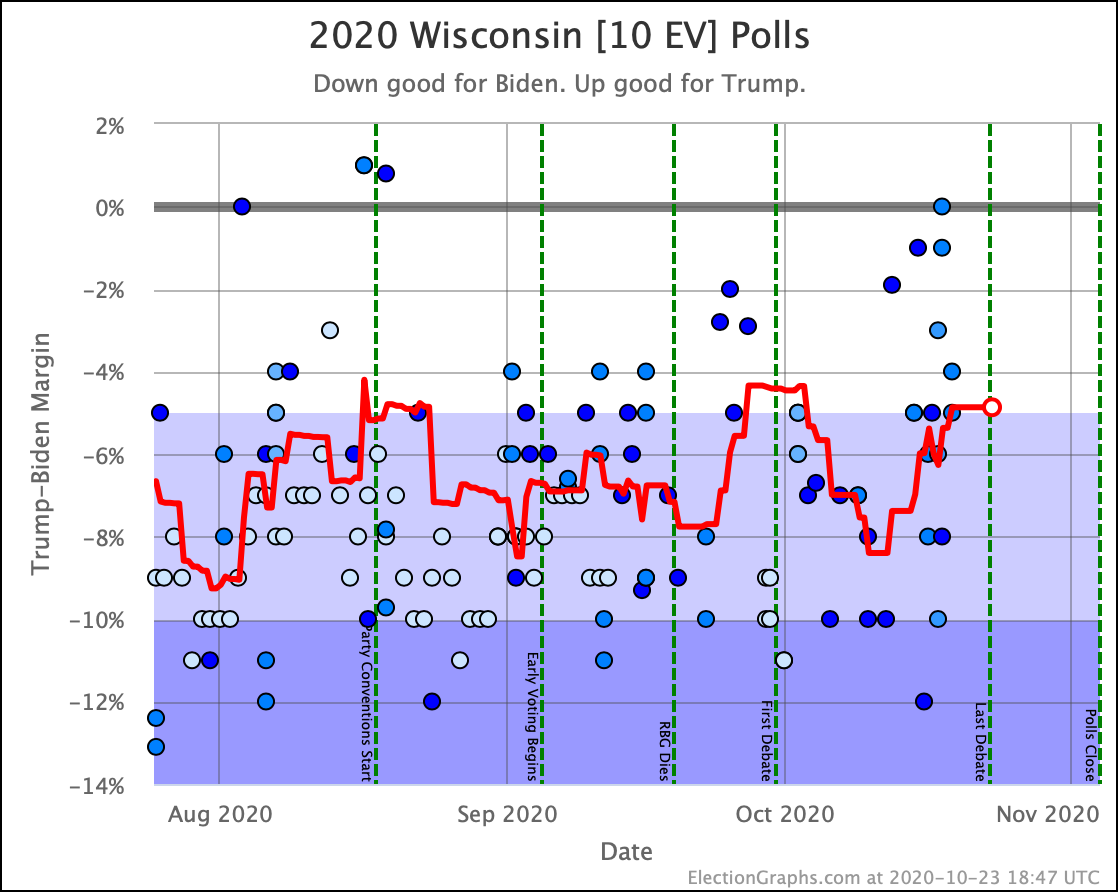
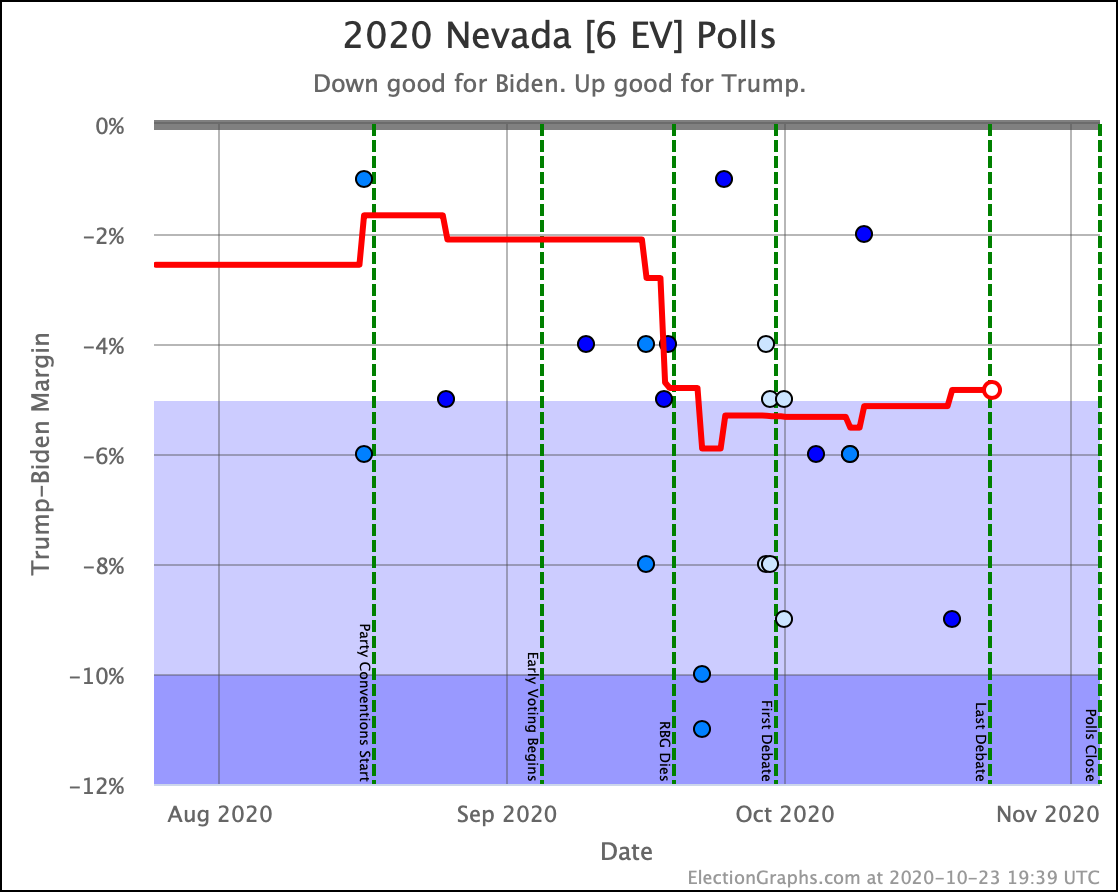
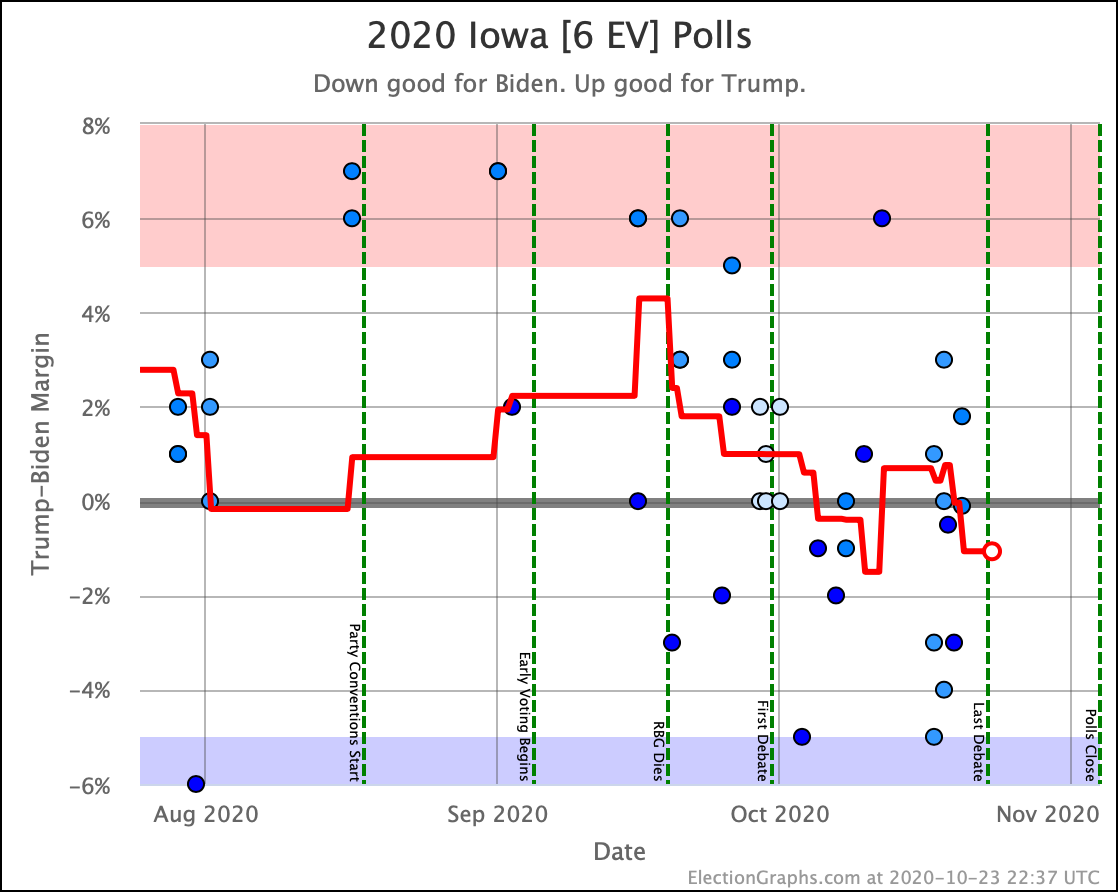
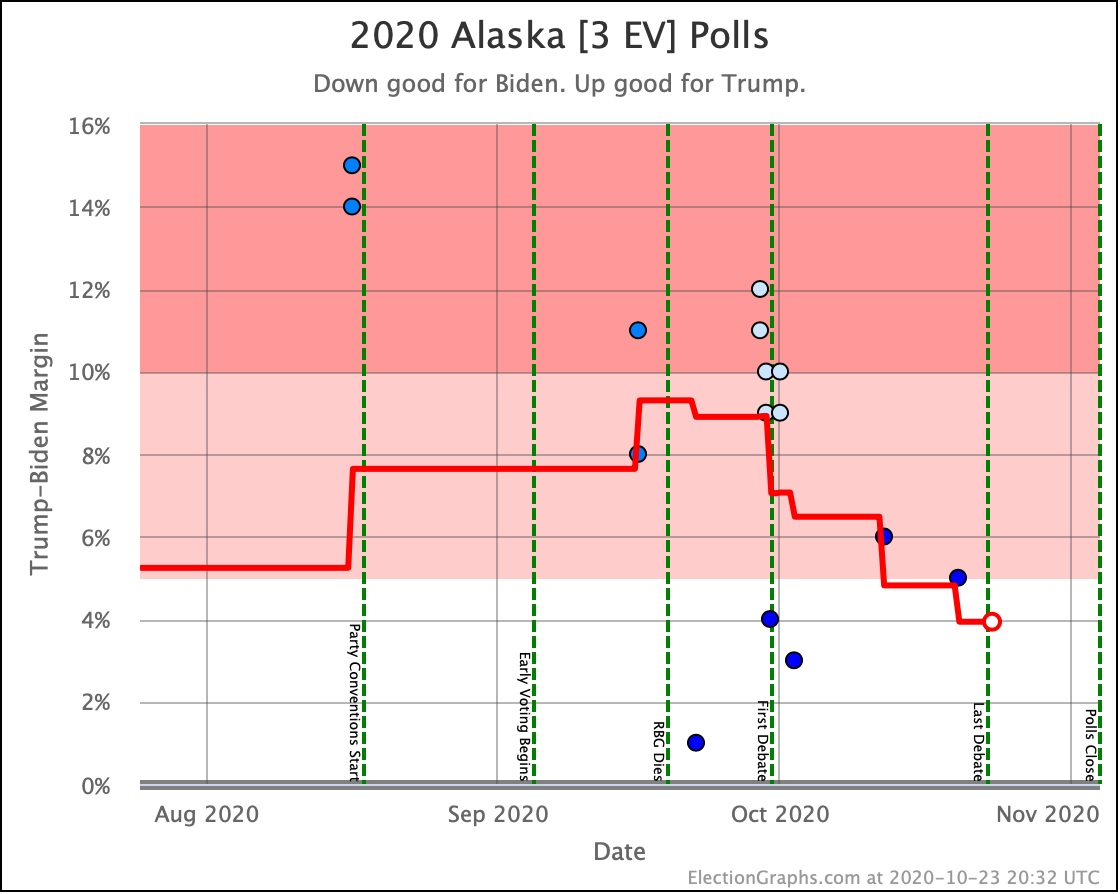
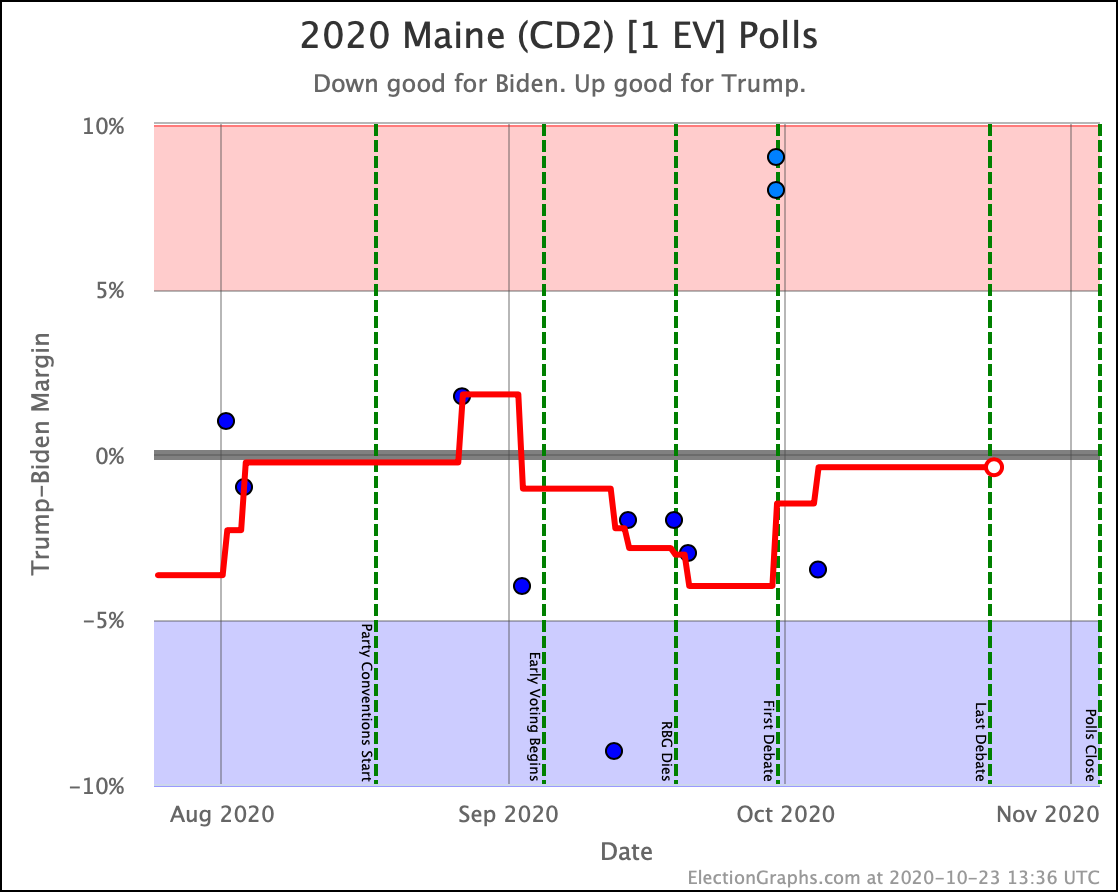
OK. We didn't do it earlier in the post, so here is a quick look at the current graphs for all of the states and CDs where the Election Graphs margin is currently under 5%. I won't comment on all of them individually. Some of them have switched categories in the last few days, some have not. But all of these should be considered as active possibilities for both candidates at this point.
And that is it for today. More soon.
10.9 days until the first results start coming in on election night.
We are almost at the end!
For more information:
This post is an update based on the data on the Election Graphs Electoral College 2020 page. Election Graphs tracks a poll-based estimate of the Electoral College. The charts, graphs, and maps in the post above are all as of the time of this post. Click through on any image for current interactive versions of the chart, along with additional details.
Follow @ElectionGraphs on Twitter or Election Graphs on Facebook to see announcements of updates. For those interested in individual poll updates, follow @ElecCollPolls on Twitter for all the polls as I add them. If you find the information in these posts informative or useful, please consider visiting the donation page.
One thought on “Back To The Normal Zone”