It is a few hours before the first Presidental debate, and I am overdue for another blog update.
As always, if you are impatient for one of these updates, the 2020 pages on Election Graphs are updated nearly every day as new polls come in. Or you can follow @ElecCollPolls on Twitter to see all the polls as I add them.
First of all, let me highlight that prompted by some questions about the site sent to me by reader Wim M., I realized that while I had produced one in previous election cycles, I had completely forgotten to create a Frequently Asked Questions page for 2020. That is now rectified.
Here is the new FAQ for this website. If you have questions that aren't included there, please contact me and let me know what you want to know, and I may add the question.
With that out of the way, the last update here was 12 days ago on September 17th. Here are the high-level changes since that last post:
| Model | Metric | 17 Sep | 29 Sep | 𝚫 |
| Probabilities (Indep States) |
Trump 2σ Median Biden 2σ |
Biden +44 Biden +152 Biden +256 |
Biden +46 Biden +144 Biden +256 |
Biden +2 Trump +8 FLAT |
| Trump Win Tie Biden Win |
0.1% 0.0% 99.9% |
0.1% 0.0% 99.9% |
FLAT FLAT FLAT |
|
| Probabilities (Uniform Swing) |
Trump 2σ Median Biden 2σ |
NEW NEW NEW |
Trump +84 Biden +168 Biden +312 |
NEW NEW NEW |
| Trump Win Tie Biden Win |
NEW NEW NEW |
7.5% 0.0% 92.5% |
NEW NEW NEW |
|
| Categories | Trump Best Expected Biden Best |
Biden +6 Biden +240 Biden +288 |
Biden +8 Biden +168 Biden +294 |
Biden +2 Trump +72 Biden +6 |
| Tipping Point | Biden +5.6% | Biden +5.4% | Trump +0.2% |
Hey! There is a whole new section. And it shows Trump with a much better chance of winning! Where did that come from? What is that?
After the last blog post, I had a question from reader Jason H. asking why our Biden win odds were so much higher than a lot of other sites showing odds for the election and if this was related to treating the results in states independently. I answered that for the moment, the biggest difference is that this site only does "if the election was held today", not an actual forecast that tries to how things may change in the remaining days before the election, but that indeed, our simulation did consider the states to be independent, and if there was still a big difference by the time we got to the election, that would be why.
But frankly, it is getting close enough to the election to know that a 99.9% chance of a Biden win is too high. Sure. He is a favorite. But 99.9%? Nah. That can't be right. Even if the election was today.
Around the same time, there was a blowup on "Election Twitter" around the same issue, roundly criticizing models that treated the states as if they were uncorrelated. I am too small to have been mentioned by name, but this criticism very much applied to this site too. So I needed to do something.
The new FAQ has some additional info, but the bottom line is that while I don't have a good way at the moment to predict the degree of correlation between states, I can put bookends around the possibilities.
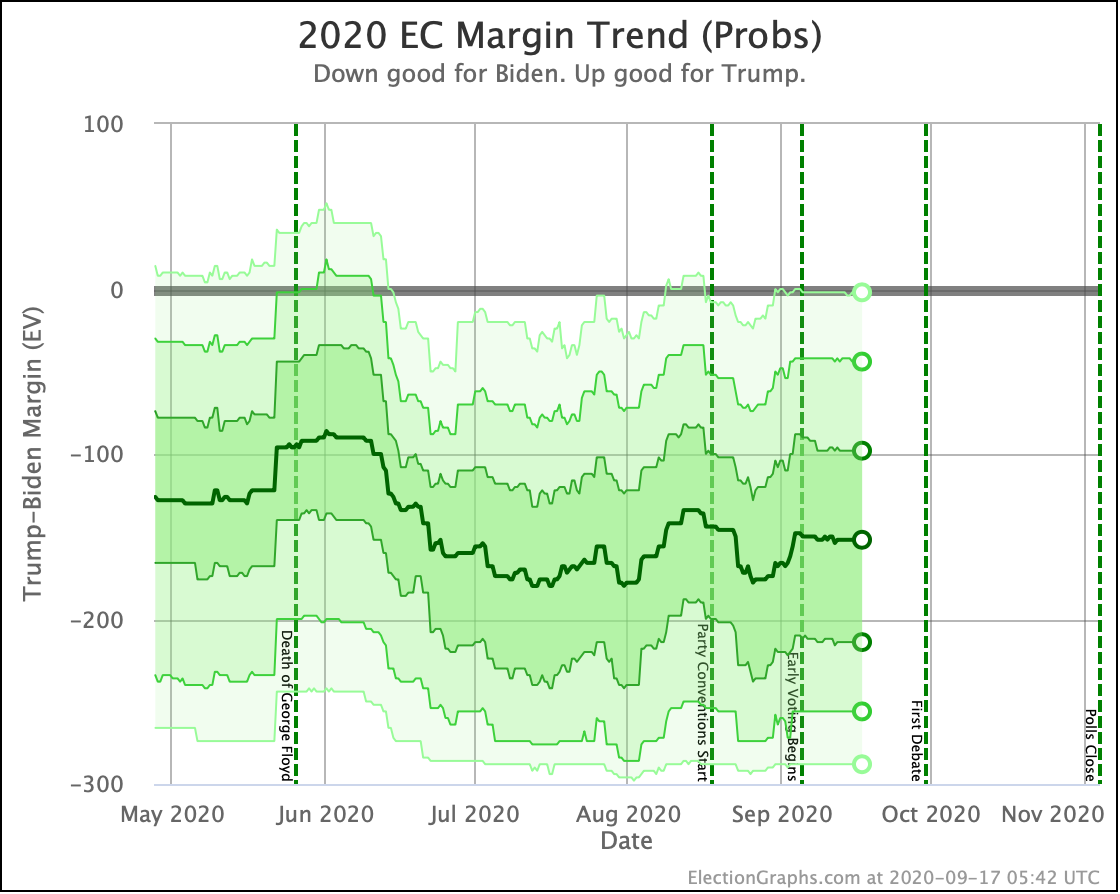
What I have shown in the past in the probabilistic model is the completely uncorrelated case. It assumes that what happens in one state has no predictive value toward the other states at all. Because an upset in one state can be compensated for by an upset in another, this results in a much tighter range of possibilities overall.
I have now added a "uniform swing" view that assumes essentially that all the states always move together. This is the other extreme. If you know how far off one state is from the poll average, you can figure out where all the other states will be. It results in a wider distribution, with larger chances for upsets (or landslides).
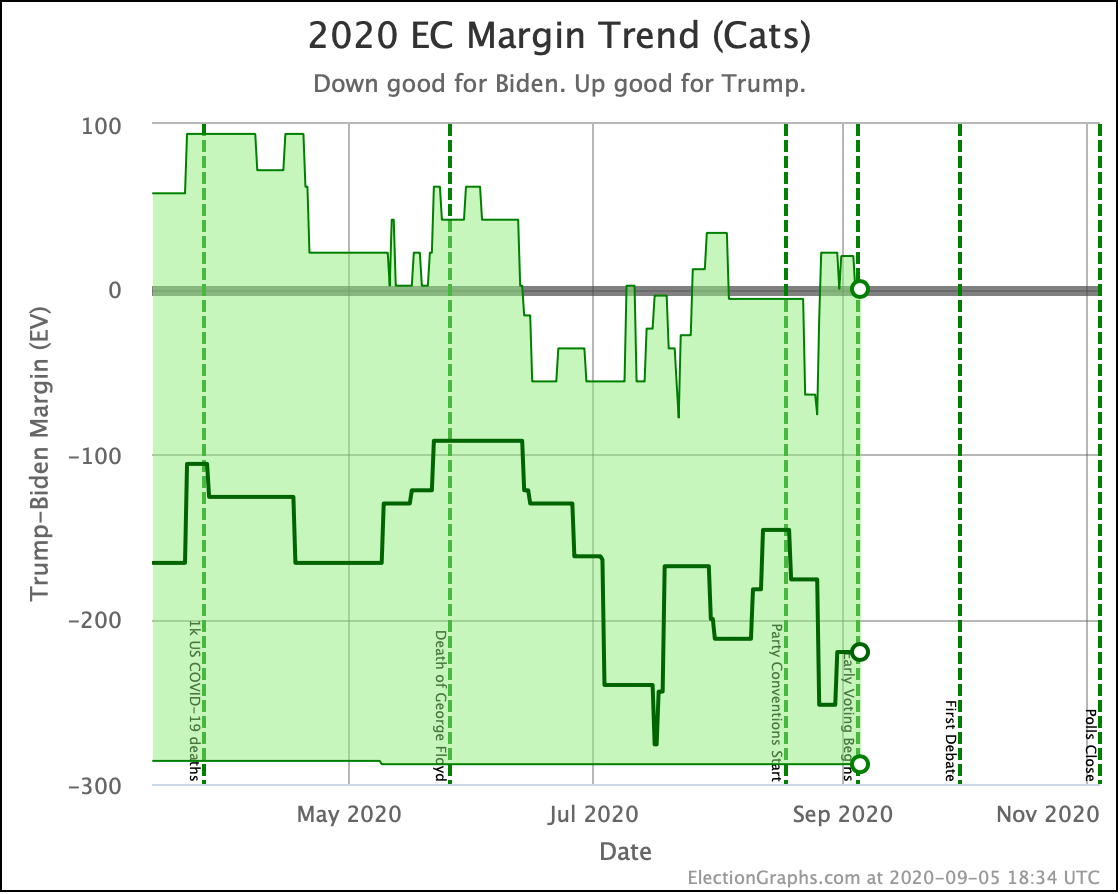
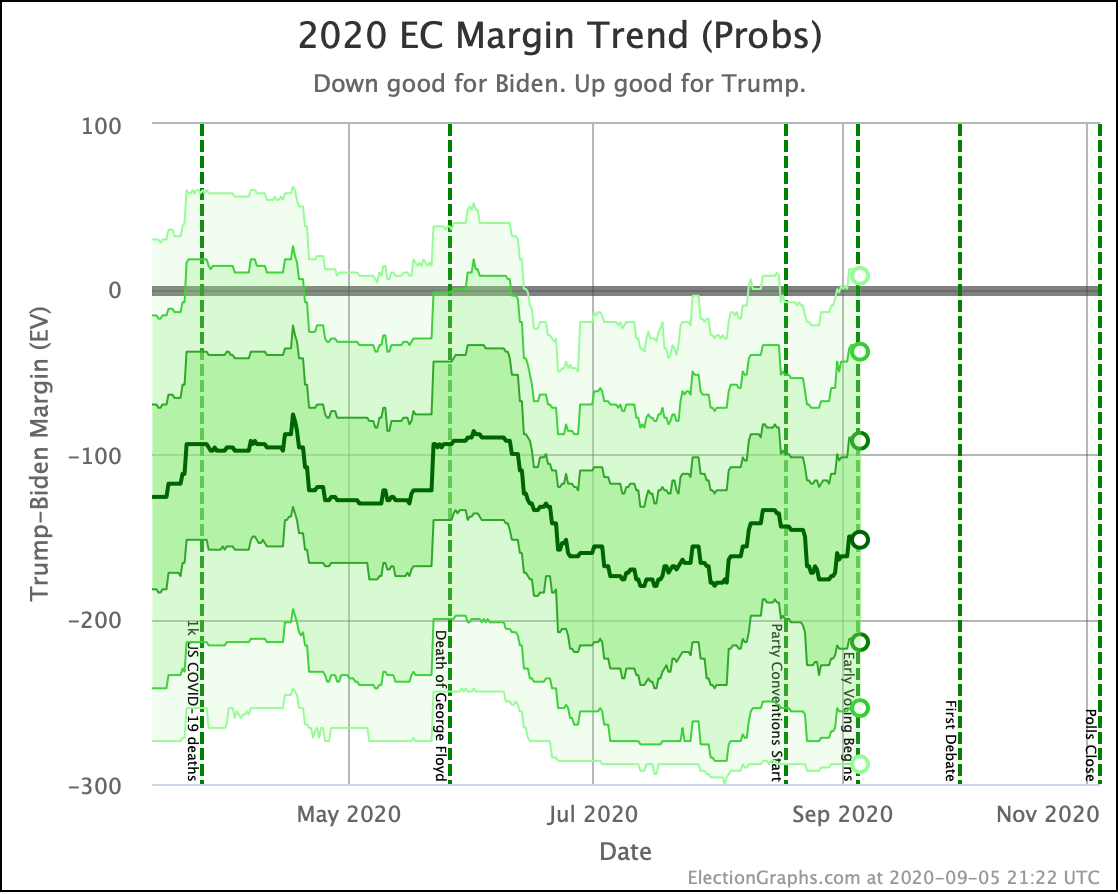
Looking at the historical "envelopes" I produce, the difference looks like this:
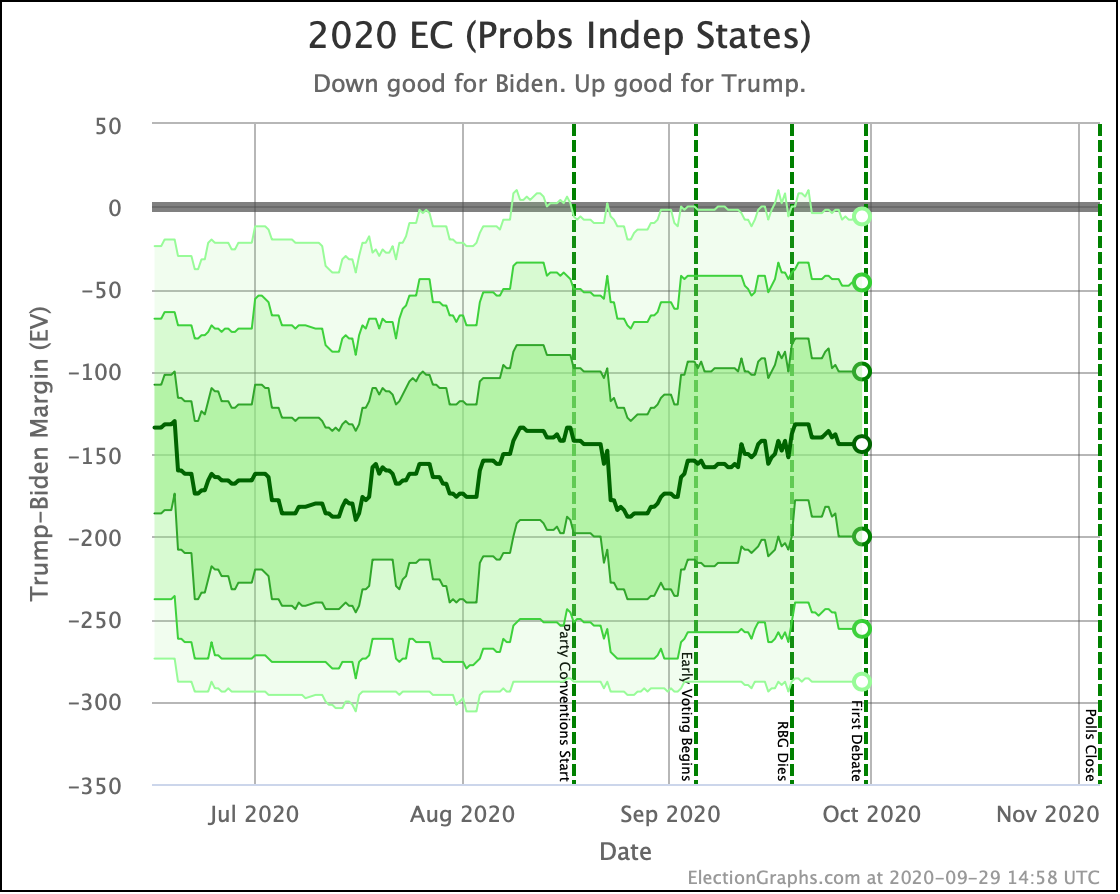
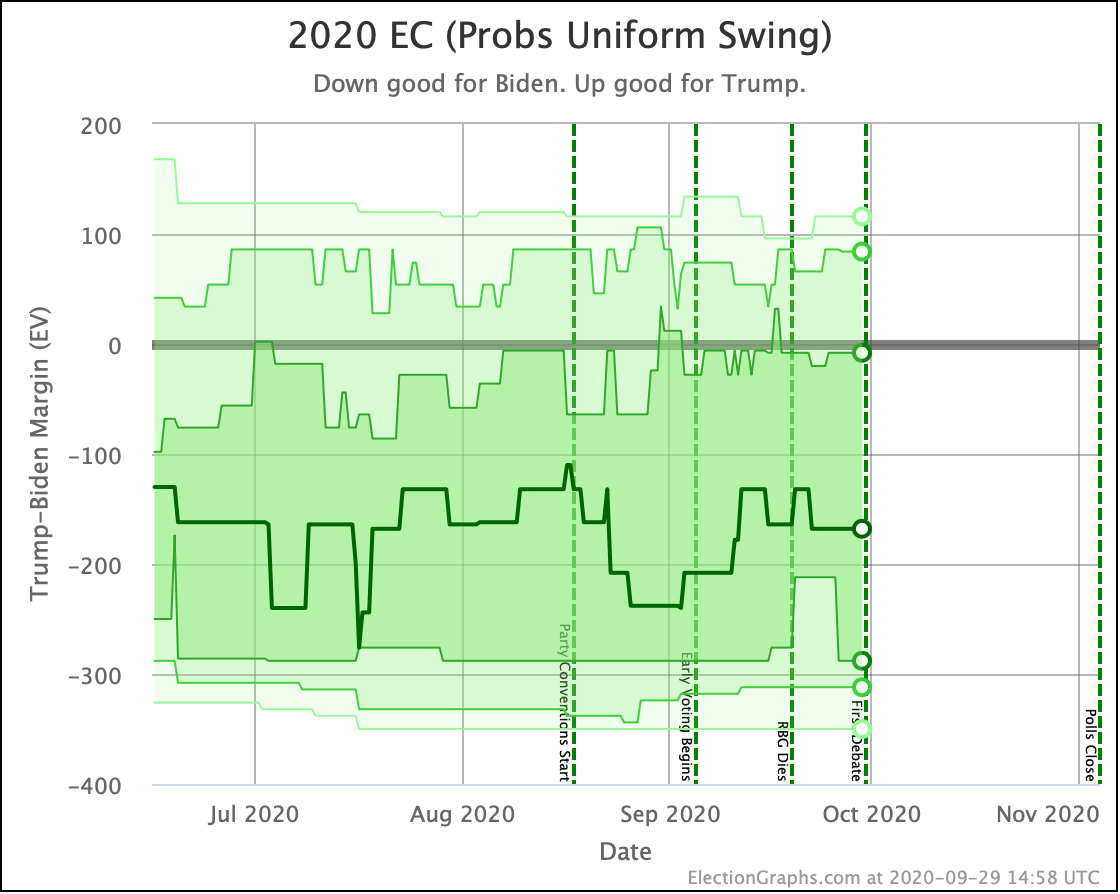
You can clearly see that Uniform Swing produces a much wider range of possibilities, even in the central 1σ (68.27%) band. Basically, forcing the states to move in lockstep results in a much more uncertain view of the race.
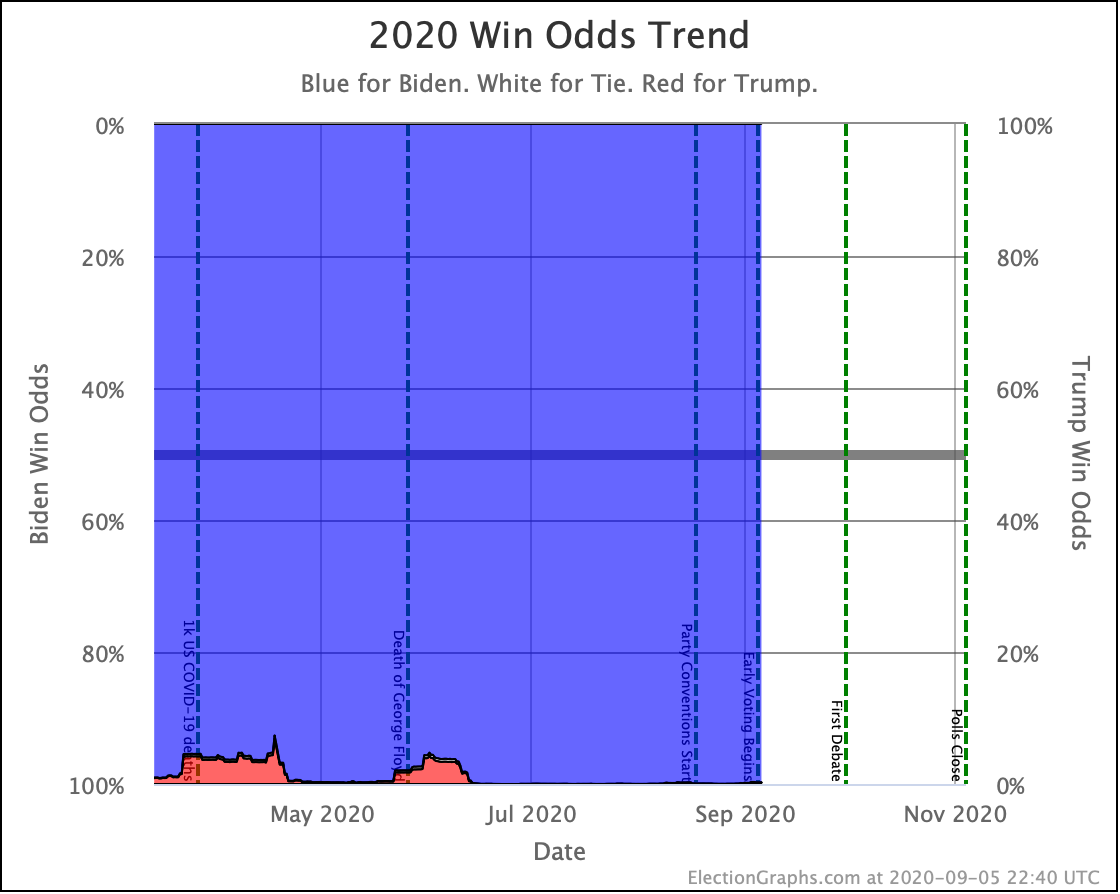
In terms of win odds, while the "Independent States" graph is now just a solid block of blue with Biden's win odds pinned near 100% since June, the Uniform Swing view looks like this:
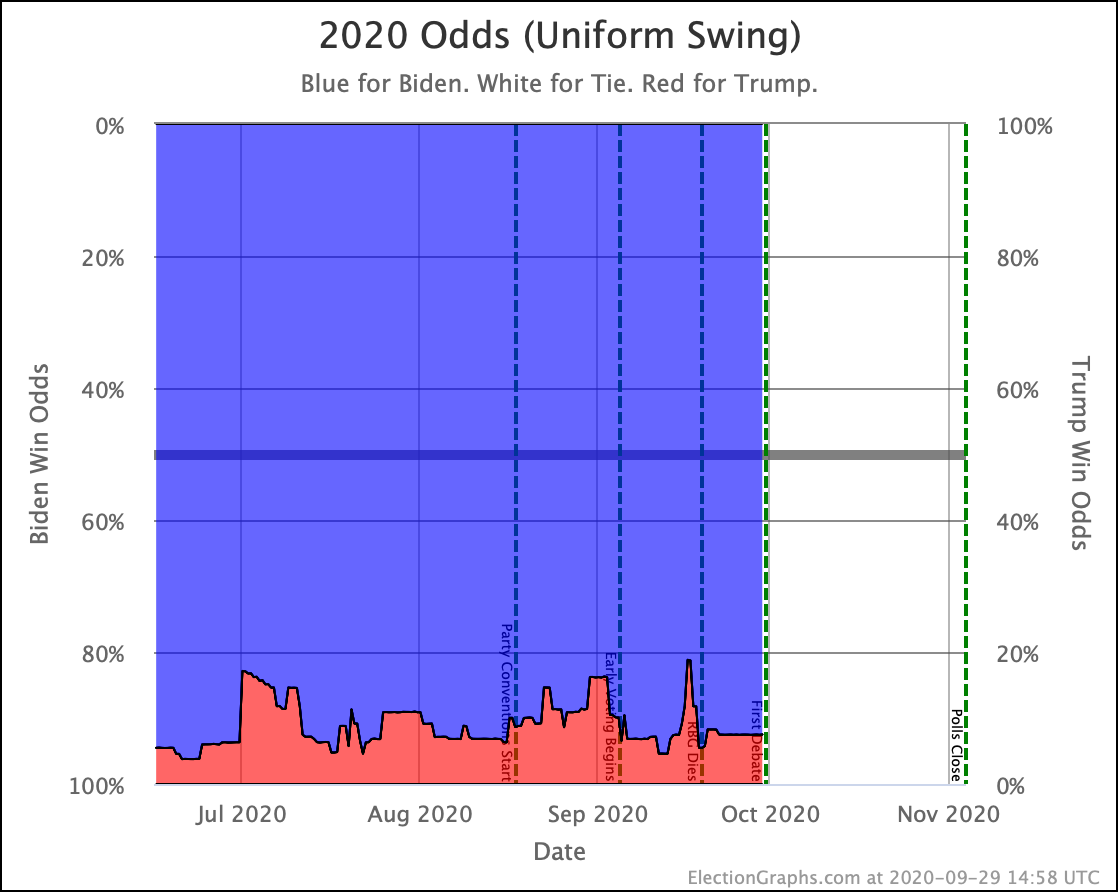
Biden is still heavily favored across this whole time period, but Trump has spiked as high as an 18.7% chance of winning. That is much much better than 0.1%.
These two views are the extremes given the polling averages I have, and the state margin to state win odds mapping I calculated using the historical 2008 to 2016 data on this site.
The truth is somewhere in between these two views, but my methods don't pinpoint an exact value for that "true" value.
So this means that Election Graphs right now thinks that Biden's chances of winning are somewhere between 92.5% and 99.9%, while Trump's chances of winning are between 0.1% and 7.5%.
This is still based ONLY on poll averages, it is not a model that factors in all kinds of other things like some other places do.
And critically, this is still "if the election was today". It doesn't become a prediction until we add the last polls right before the election. Because of this, you'll notice that we still have higher win odds for Biden than some other famous places. They are trying to factor in the chances that Biden's current lead disappears between now and the election. I still don't do that.
But this seems more intuitively reasonable than the near 100% Biden lock we have been showing.
The main 2020 Electoral College page has now been updated to include these new views along with everything that was shown there before. Sorry I didn't add all this earlier!
With all of that out of the way, time for all the things we usually highlight in these update posts:
This week's TL;DR: Biden is still significantly ahead. The race is mostly stable. A few states that were just barely on one side or the other of the centerline switched sides. But either way, they are really too close to call. So even though the "Expected Case" in the Categorization view moves a lot, the actual state of the race isn't much different.
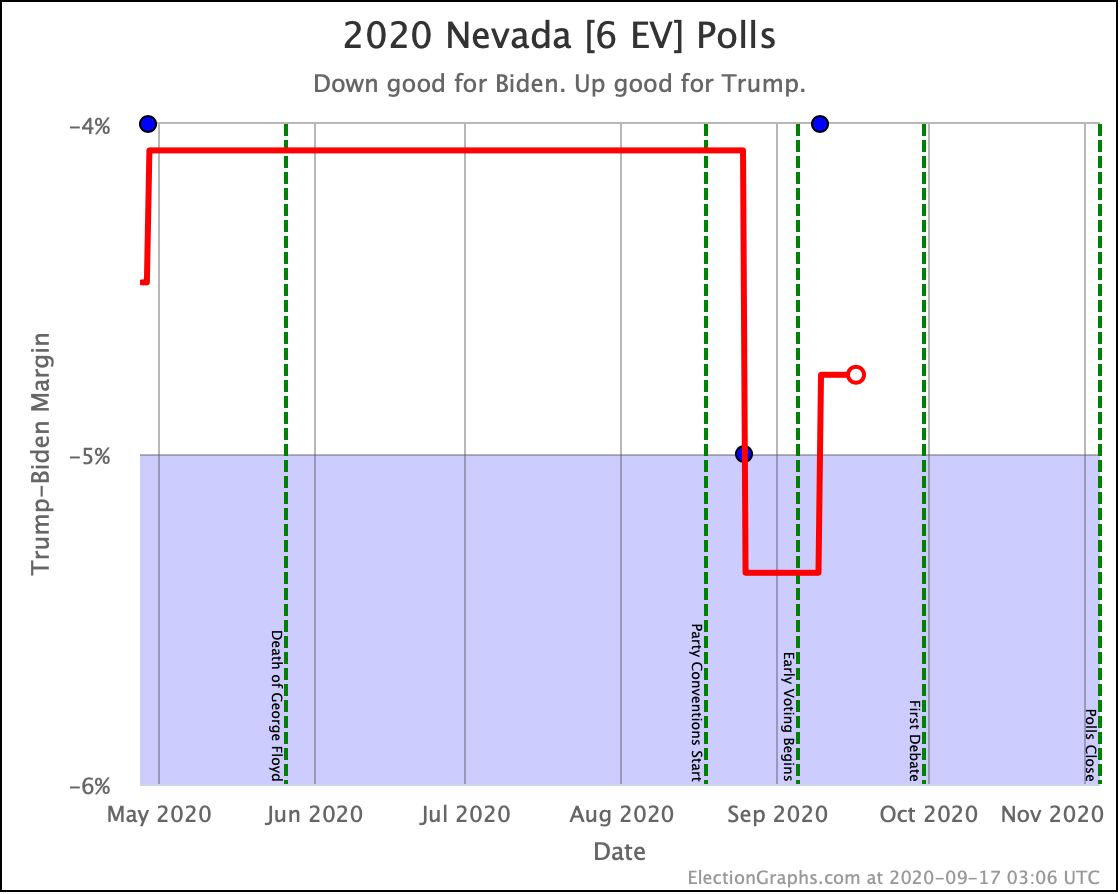
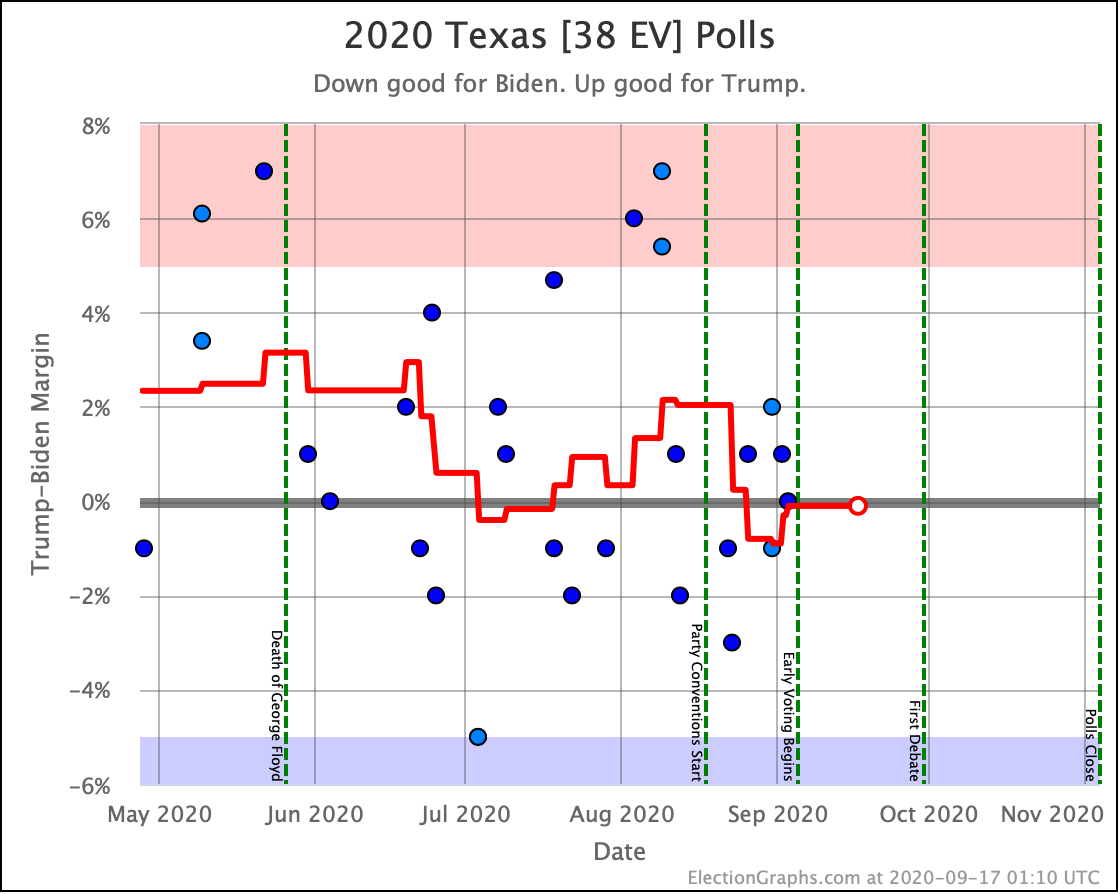
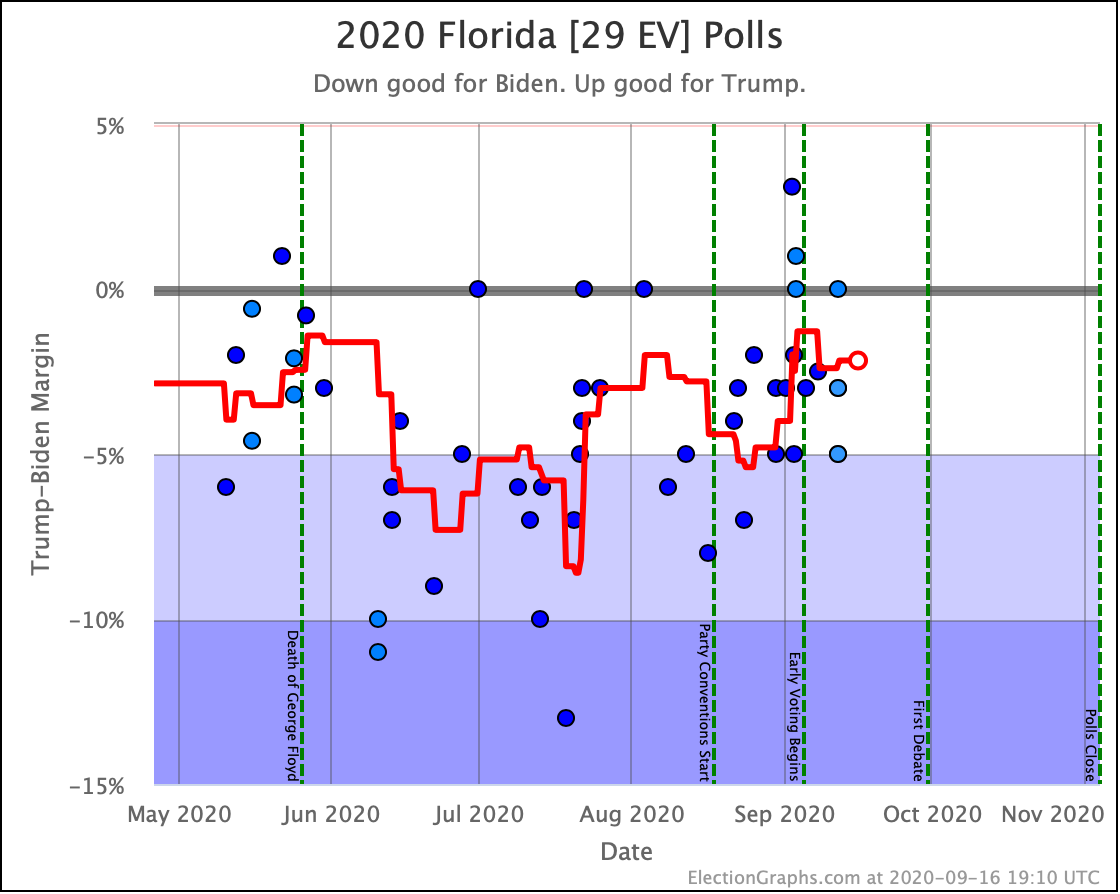
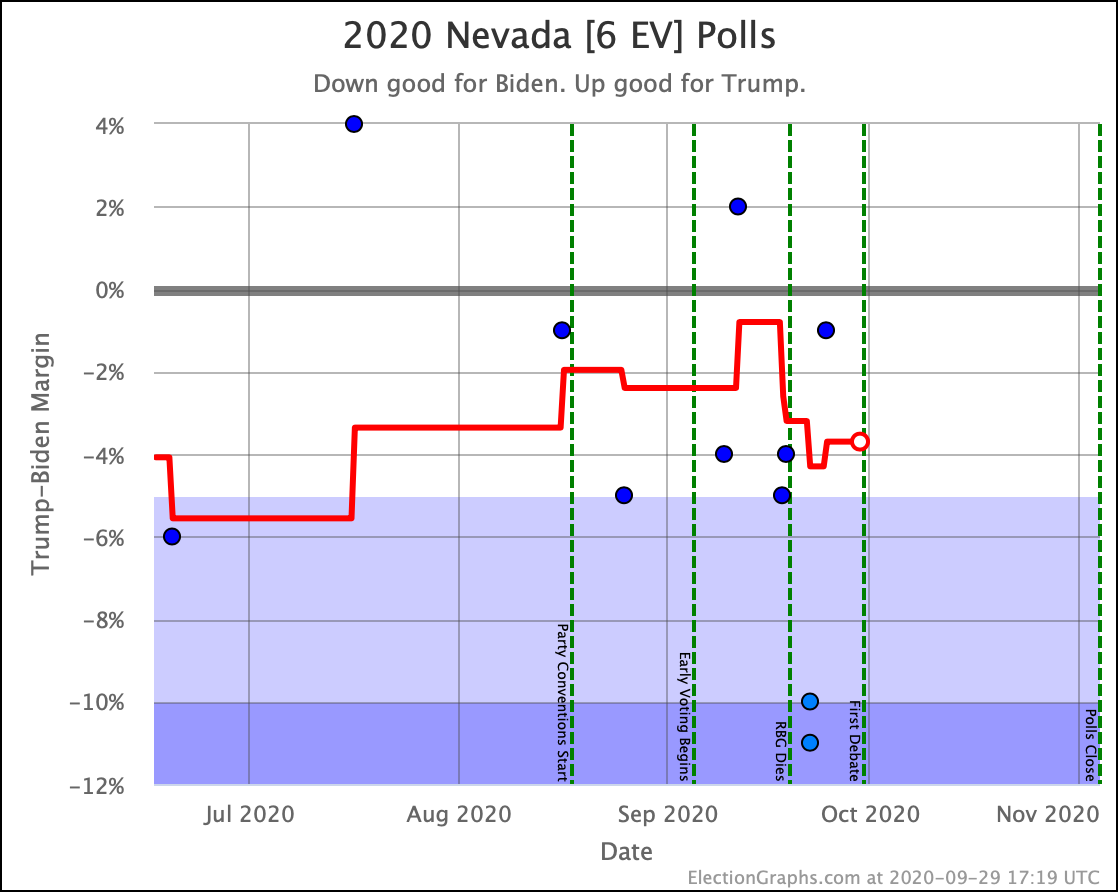
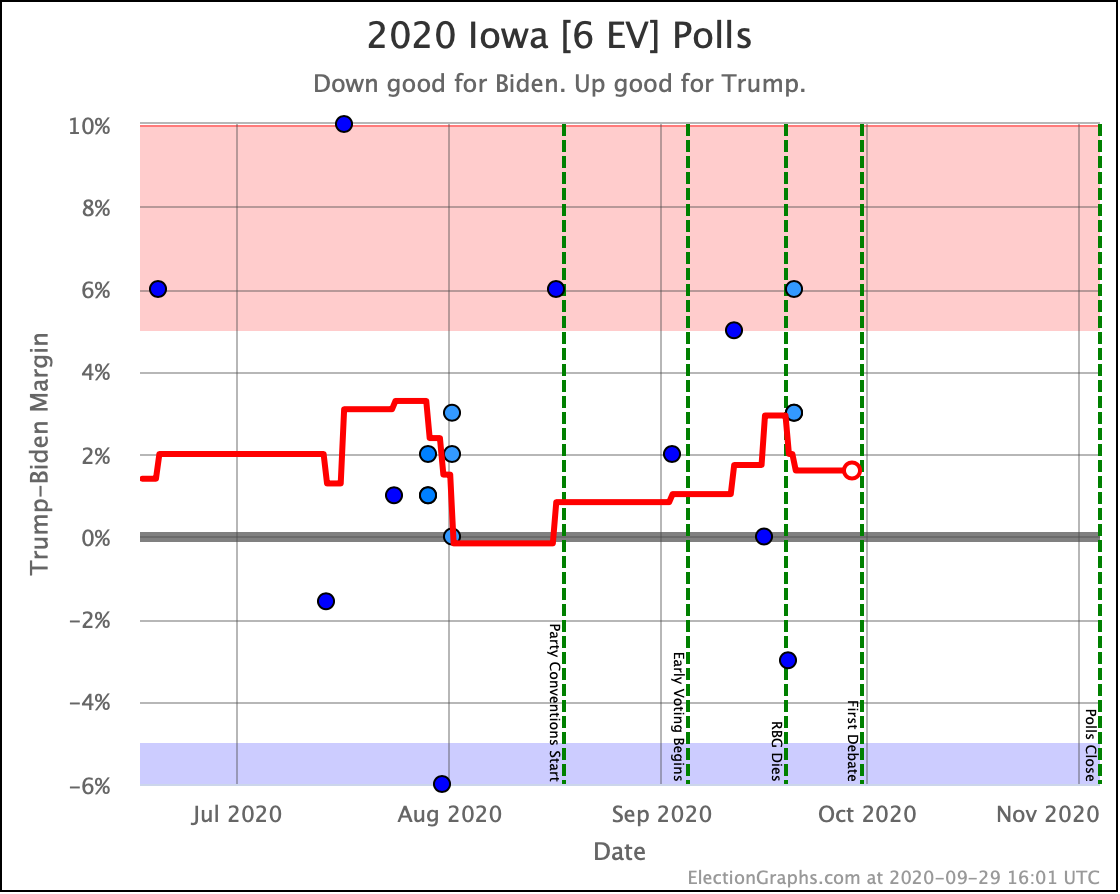
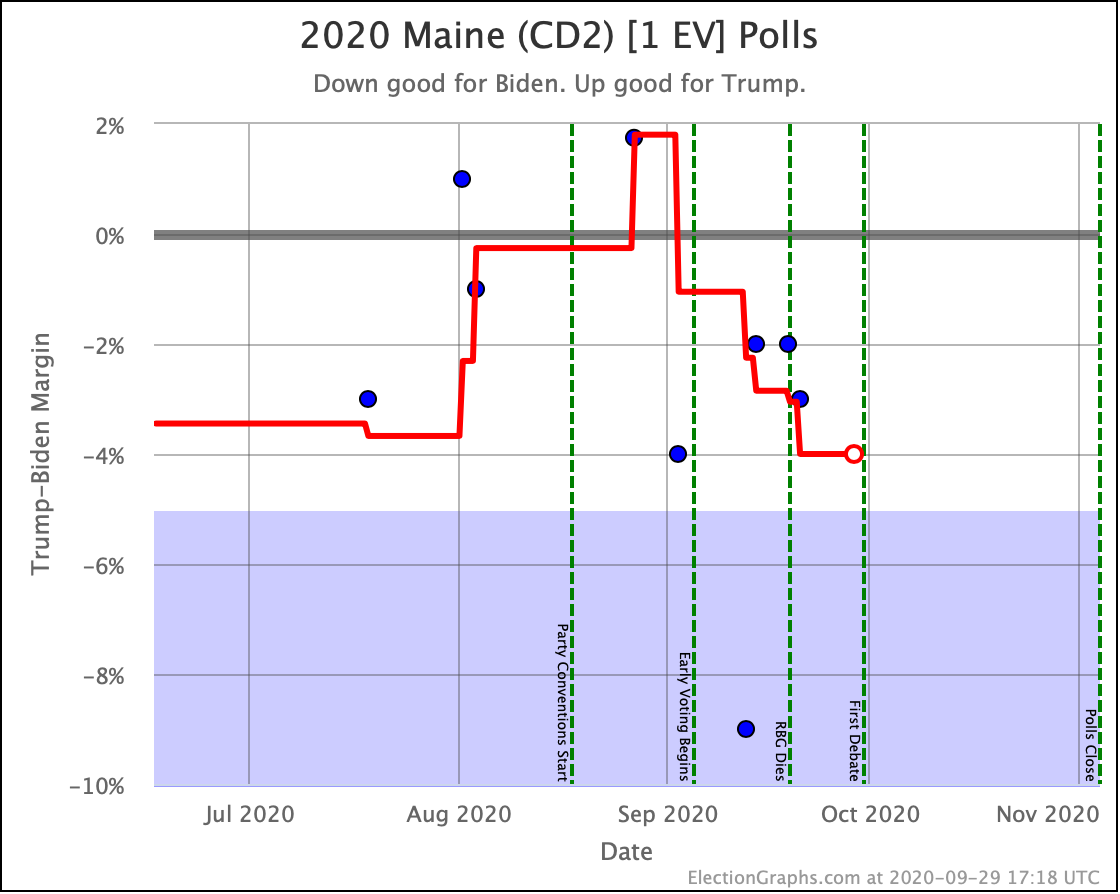
Let's look at all the places that shifted in or out of "Weak Biden" and "Weak Trump" since the last update.
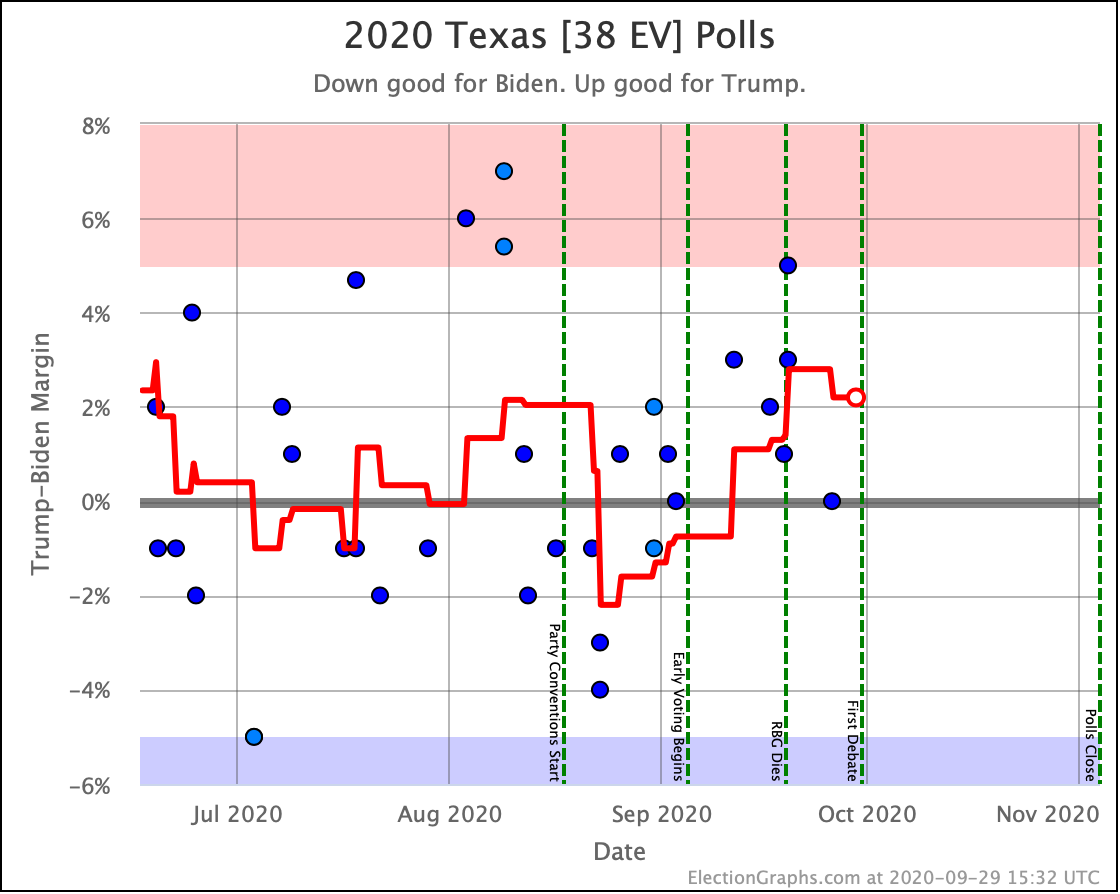
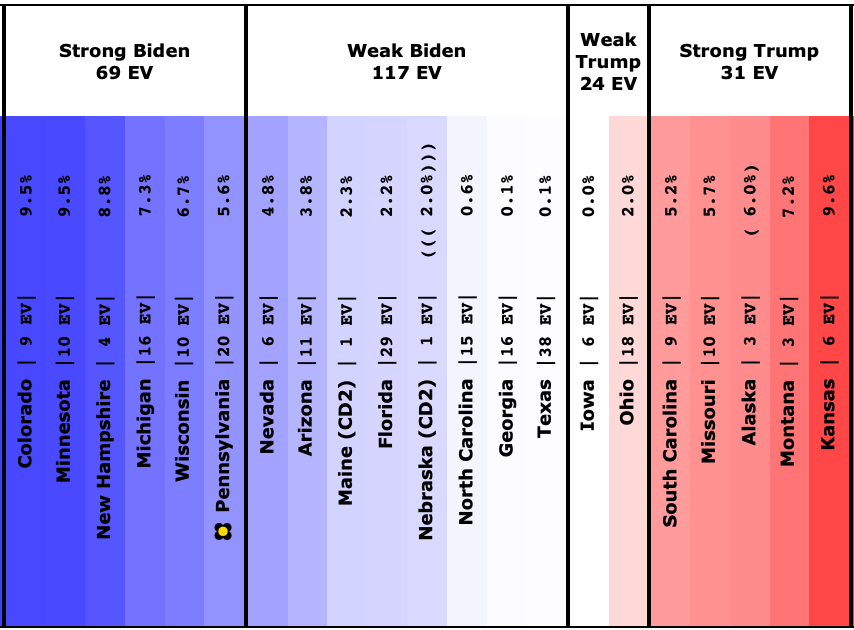
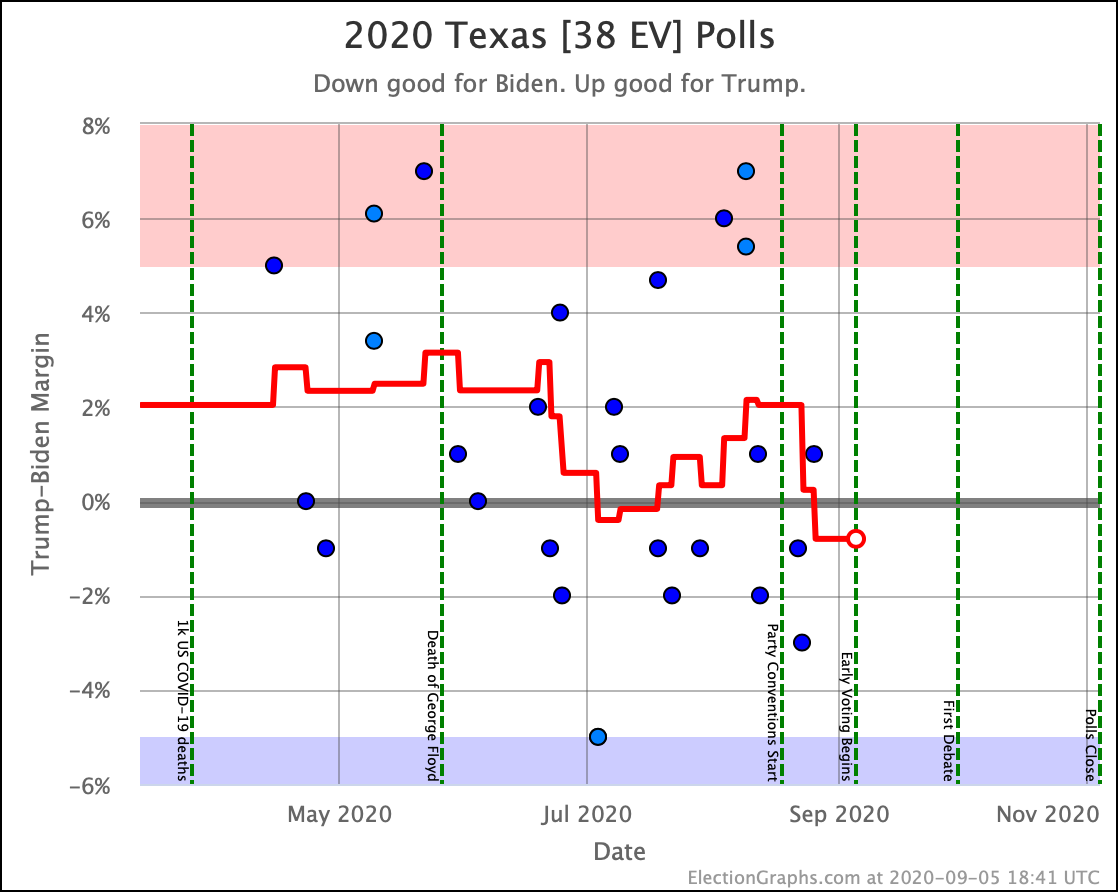
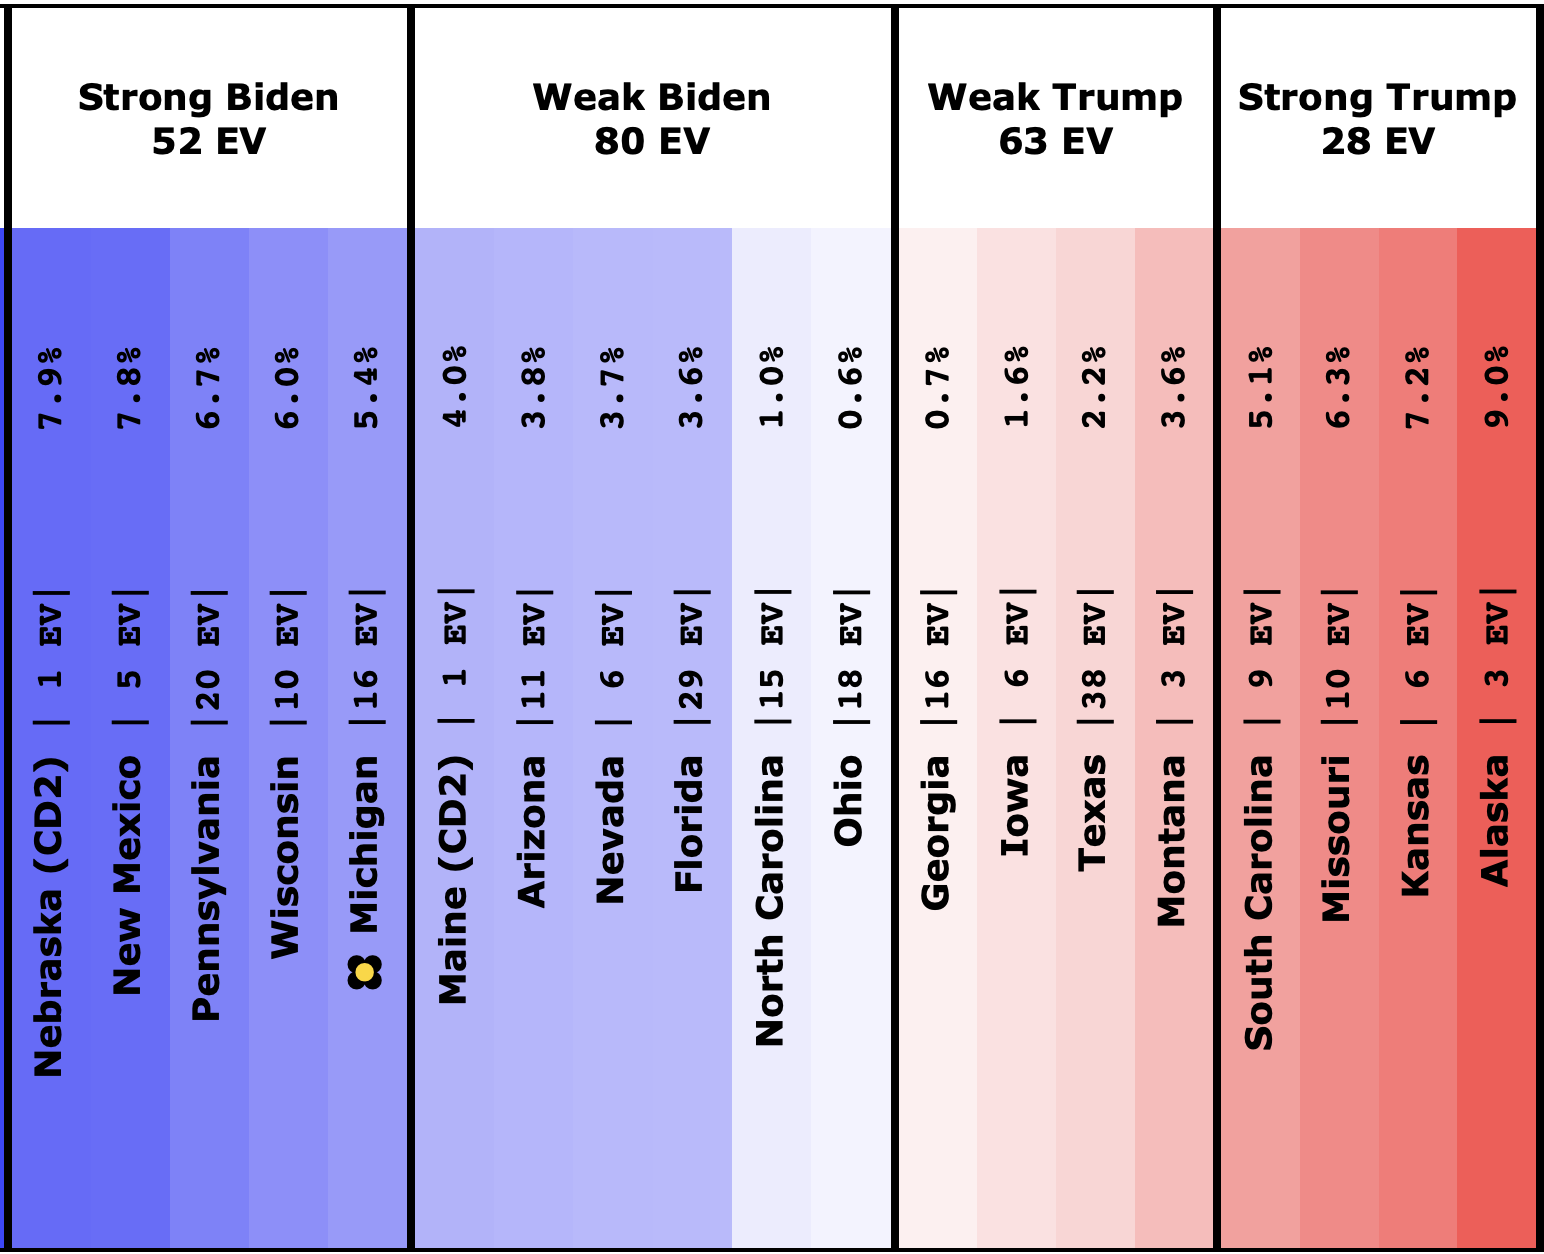
First up, Texas. Biden was up by a little bit for a while, but no longer. It is still a close race though, with Texas actively in play.
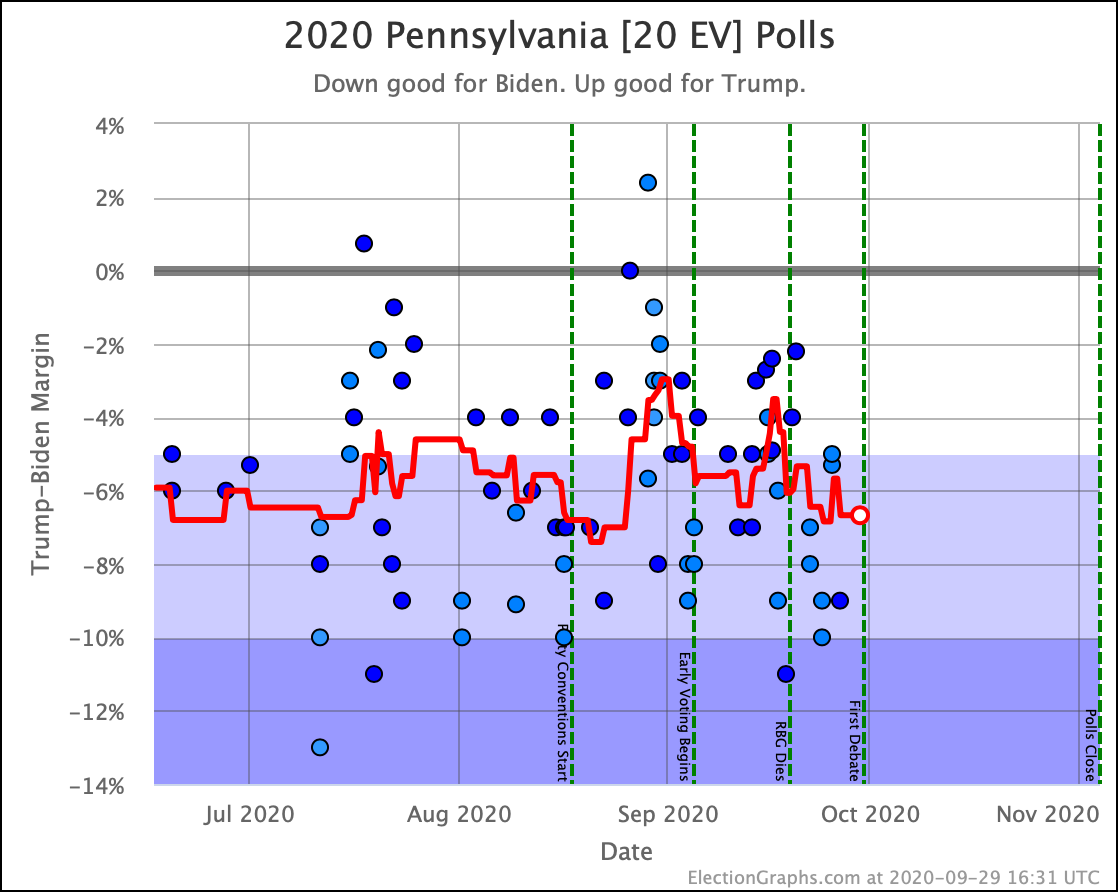
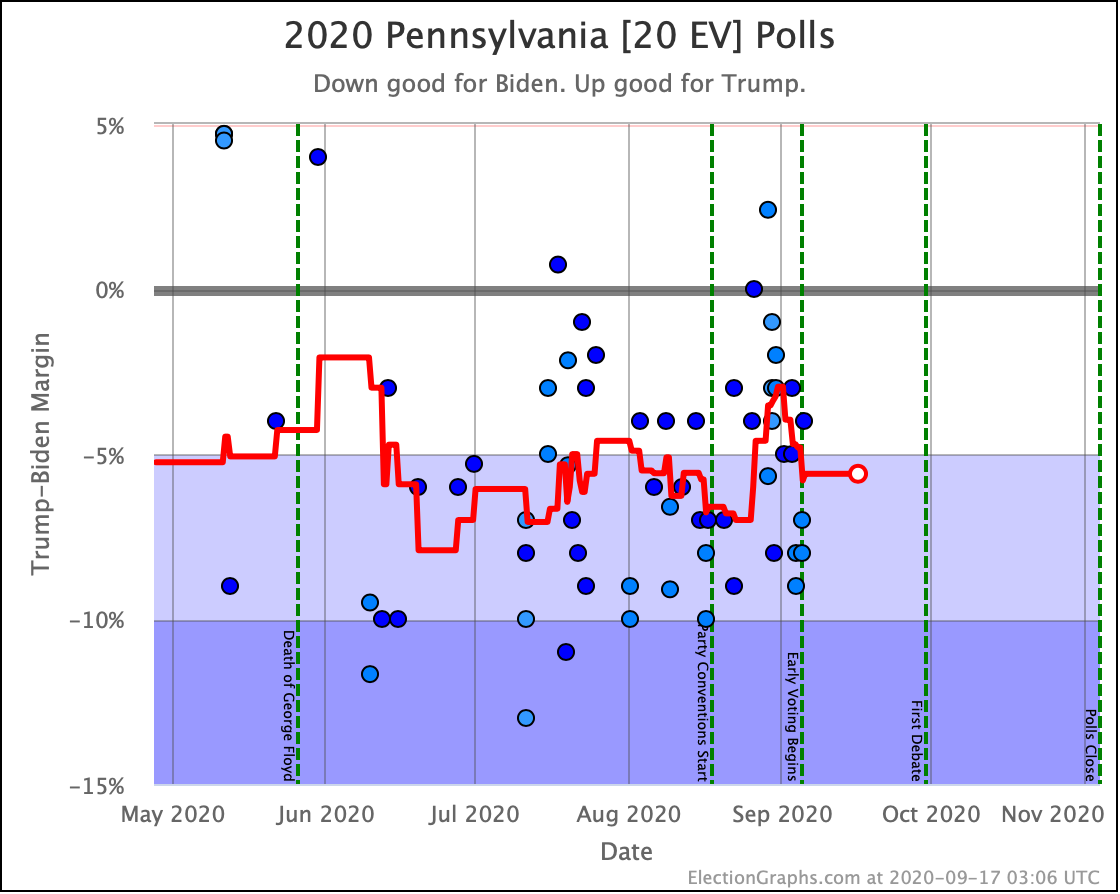
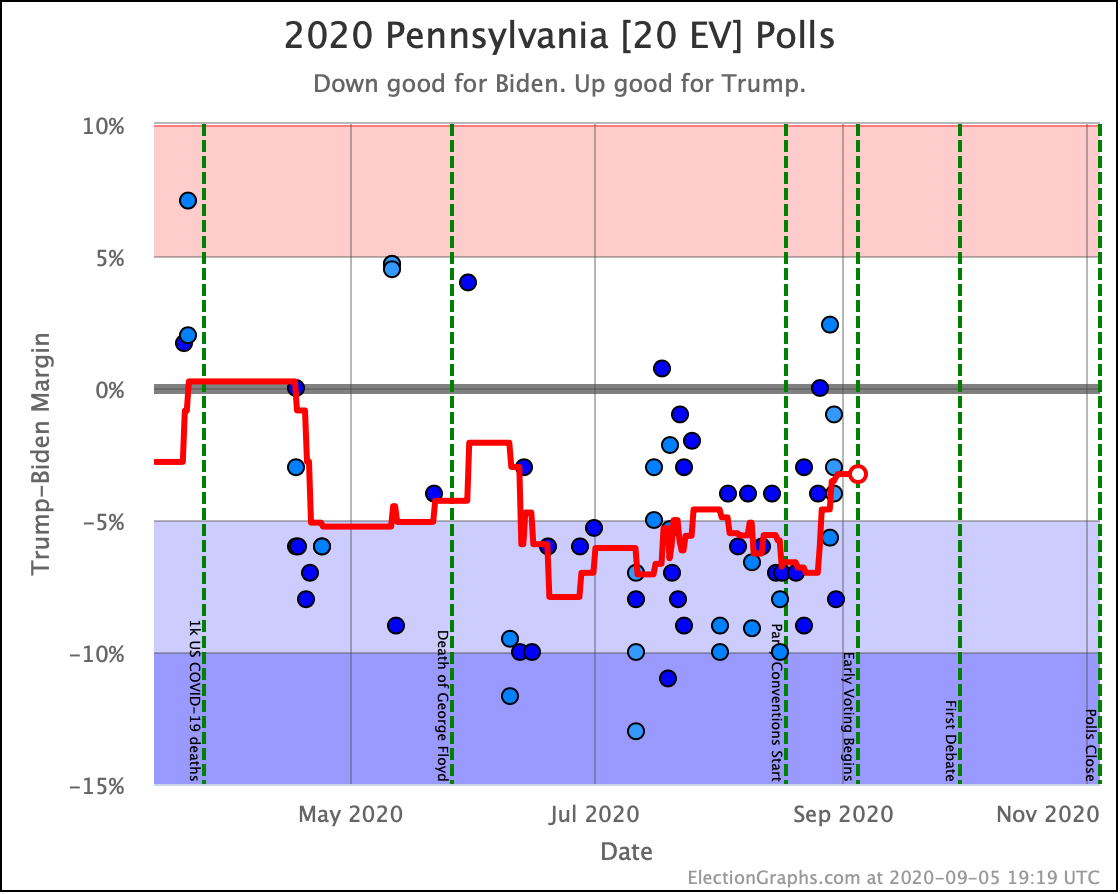
Pennsylvania has mostly been "Strong Biden", but for a brief time, Biden's lead slipped under 5%. Then Biden strengthened again, and it is back where it usually is… just out of Trump's reach.
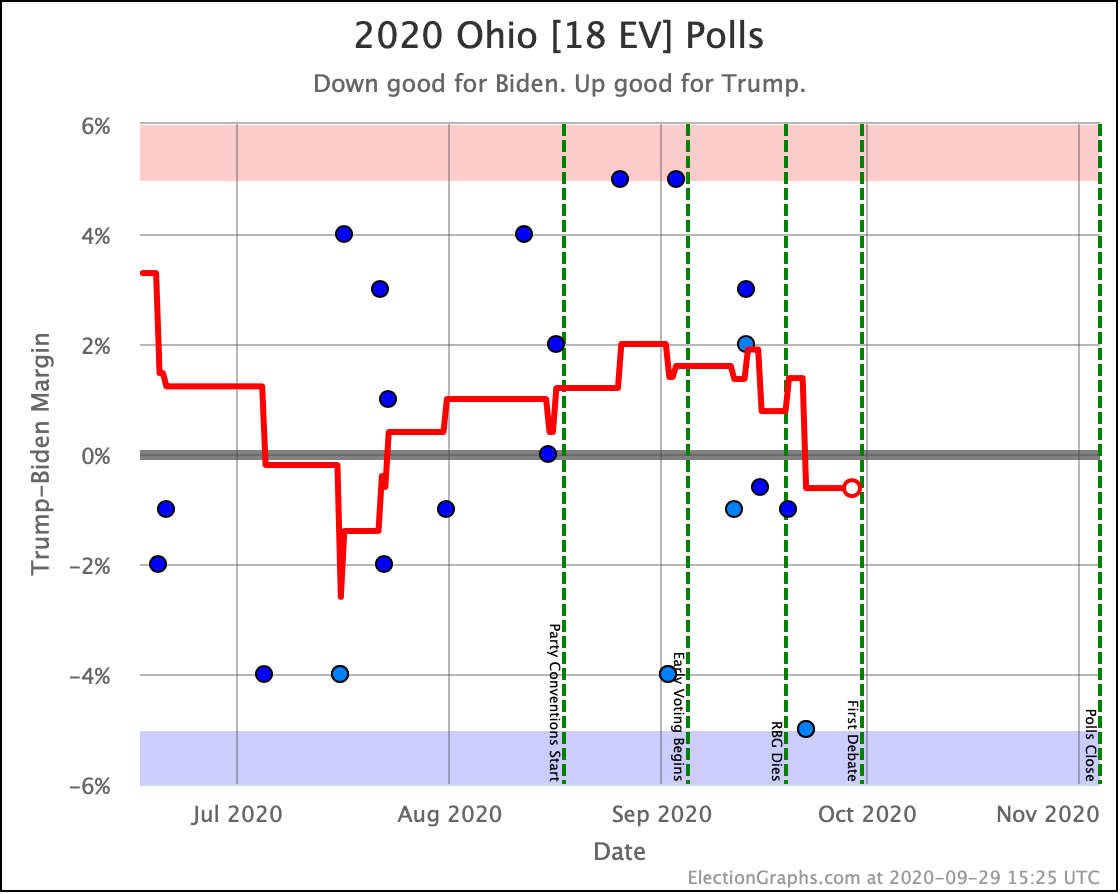
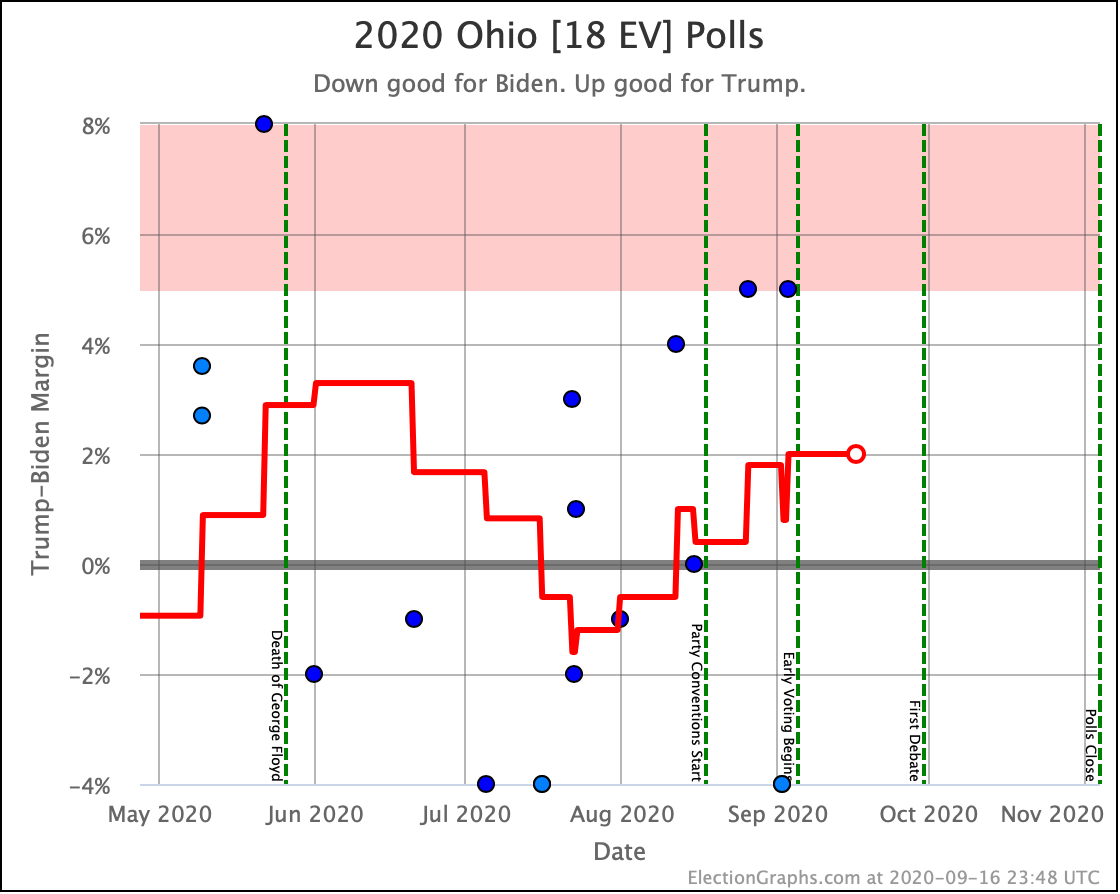
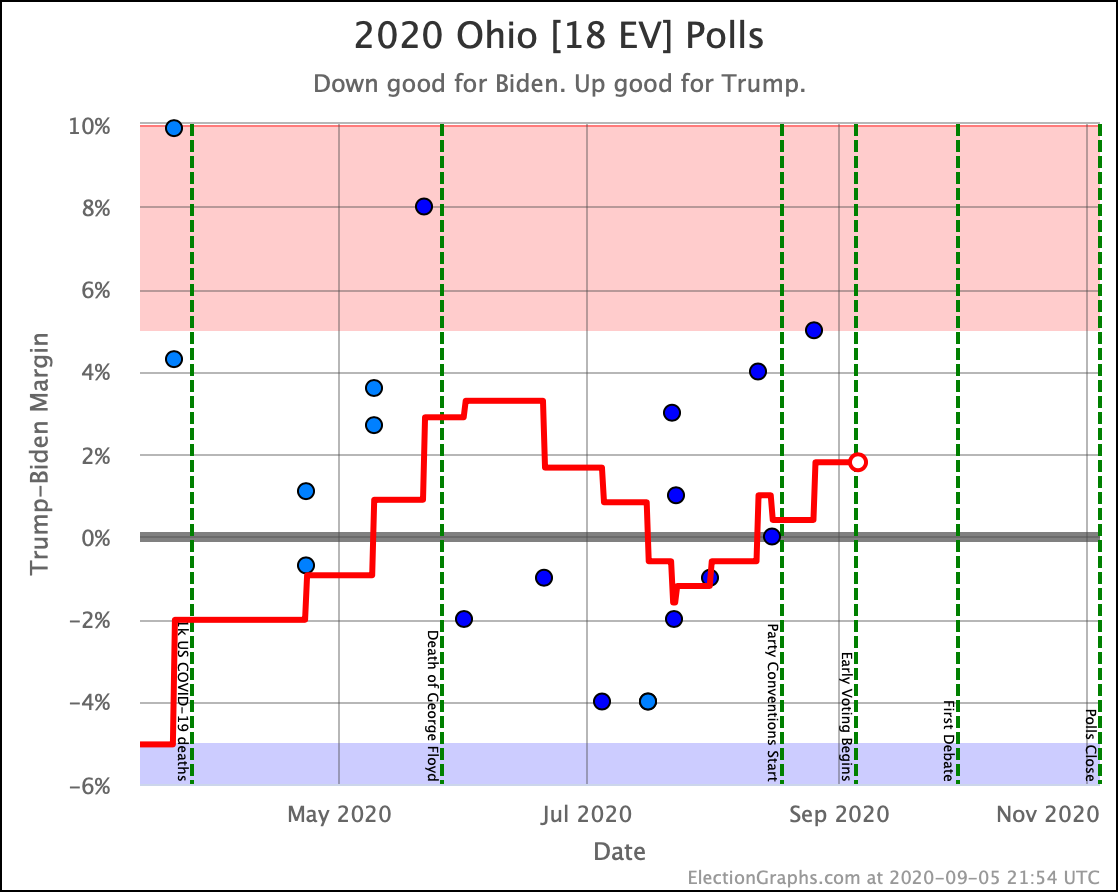
Ohio has been just barely Trump for awhile. The latest average moves it to just barely Biden. But the "just barely" part of that is more important than the candidate's name you put after that. Ohio is on the edge.
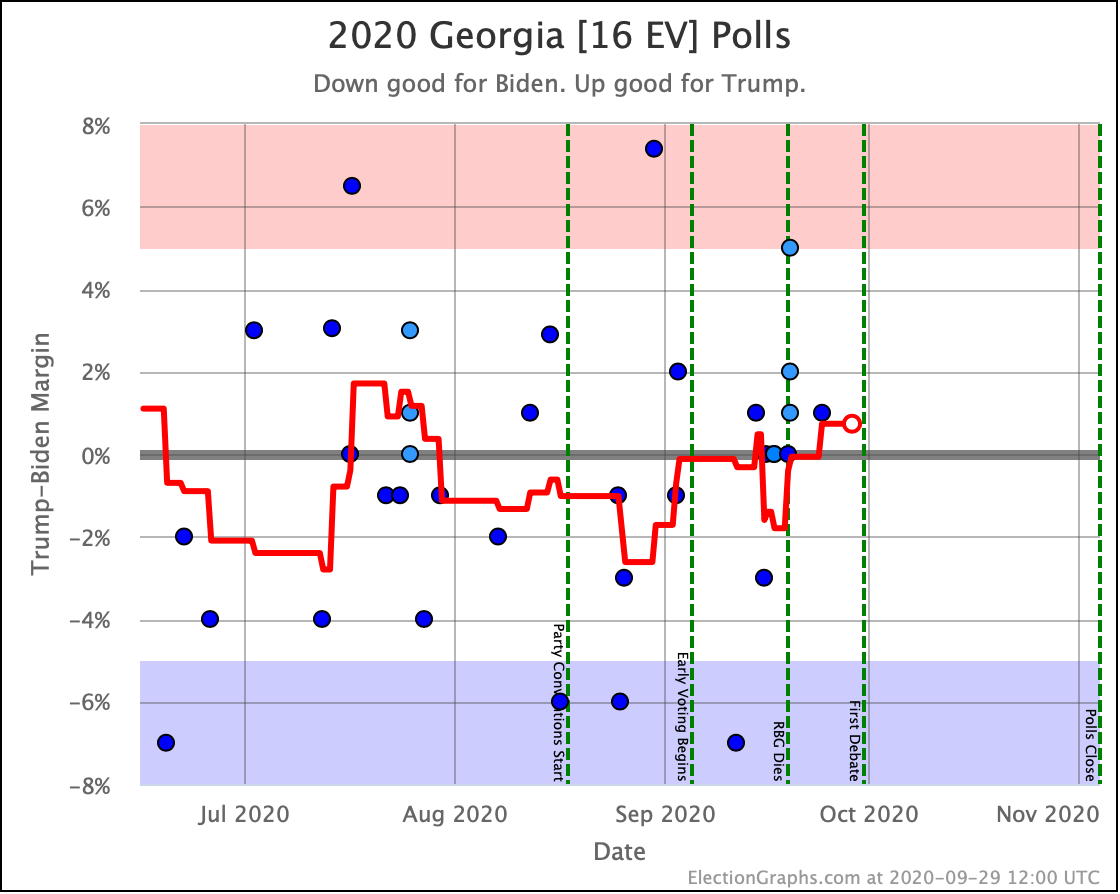
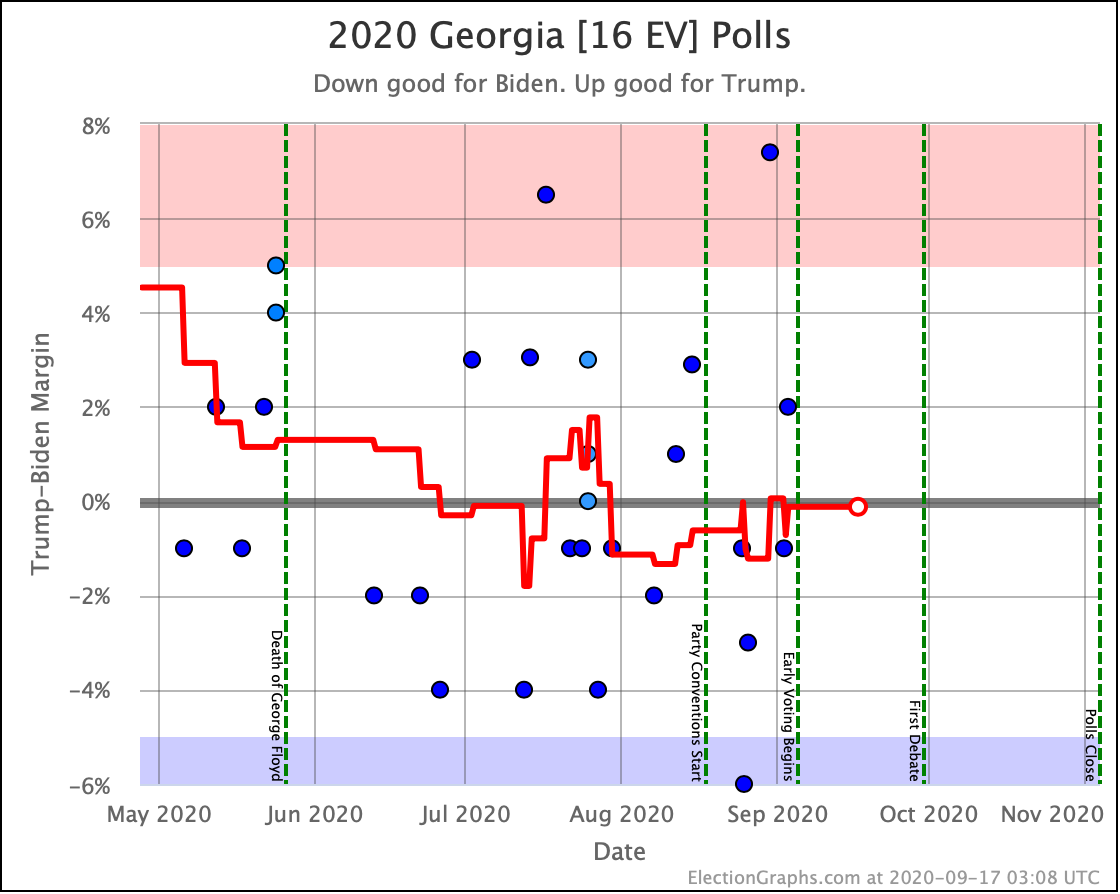
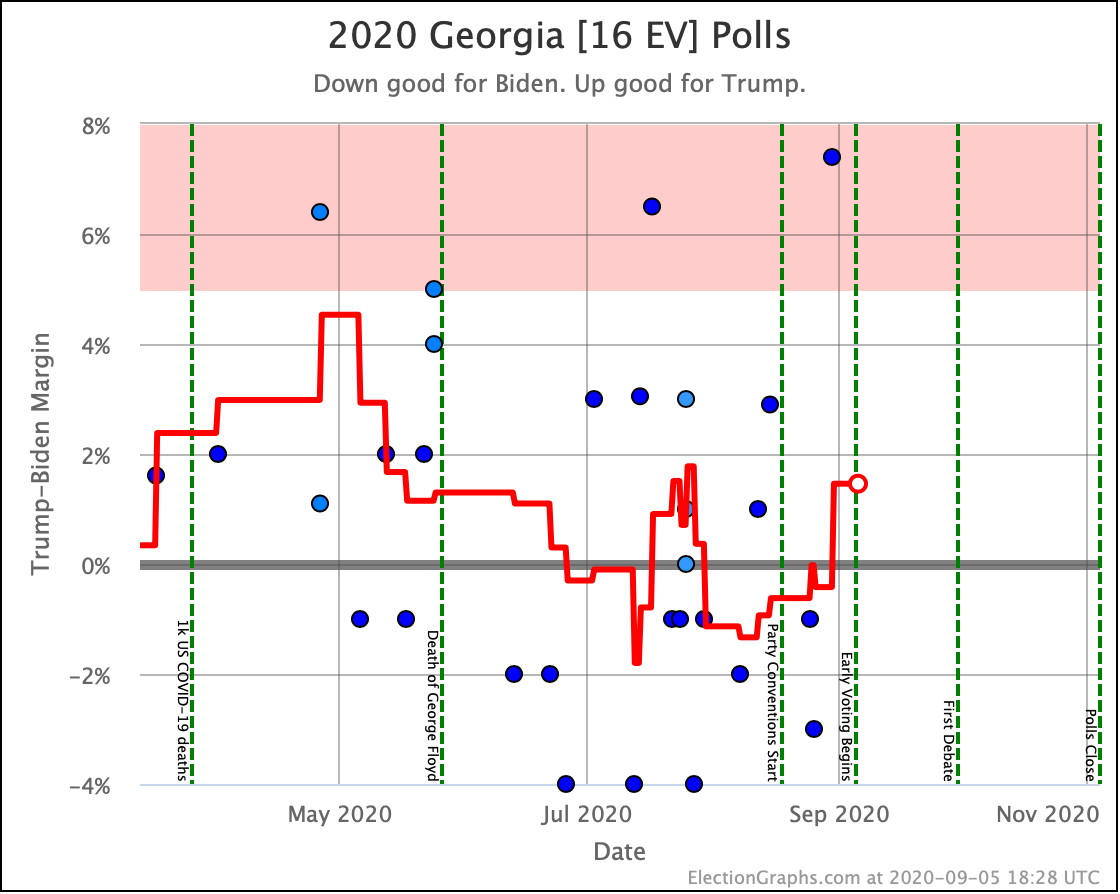
Georgia is also right on the edge, but because it has been polled more often, it appears more volatile. In the 12 days since the last update, Georgia flipped over the center line in my averages seven times. But it was Weak Biden 12 days ago, and it is Weak Trump now, so the net change is for Trump this time. But given the history, it would not be surprising for it to flip dozens of times before the election.
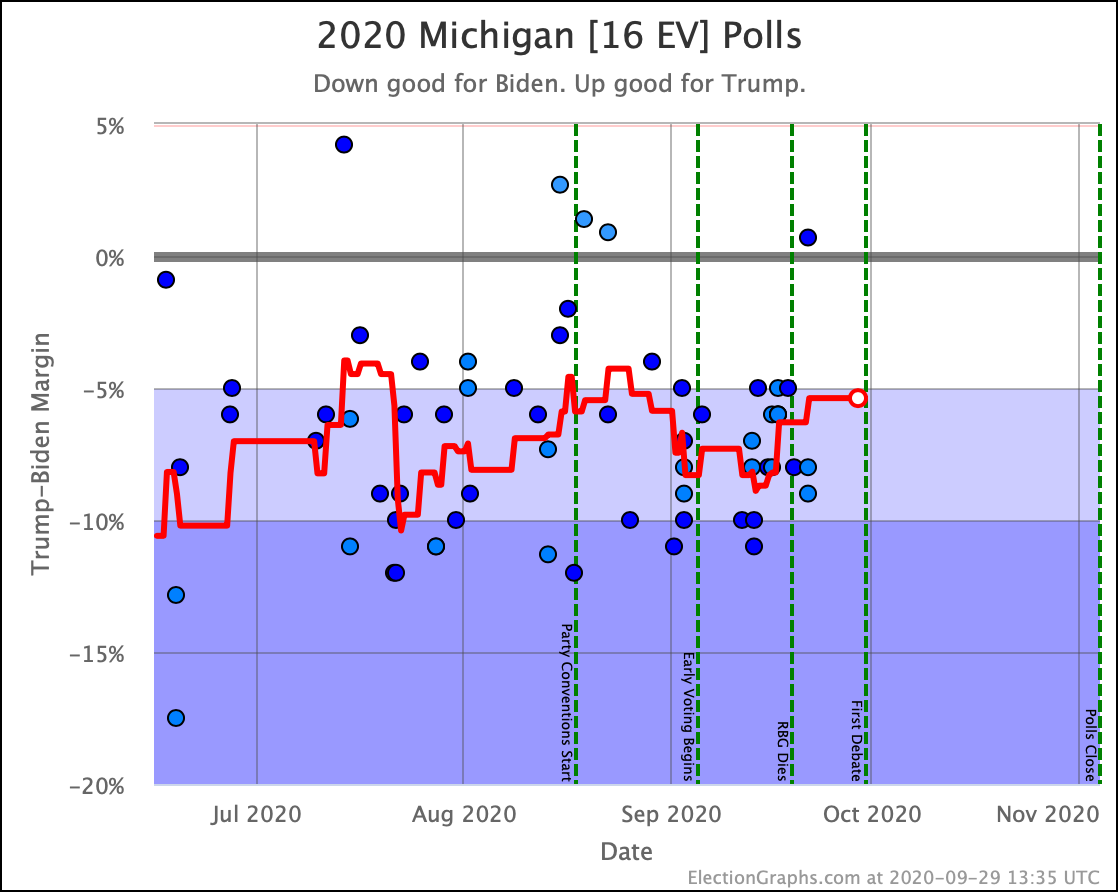
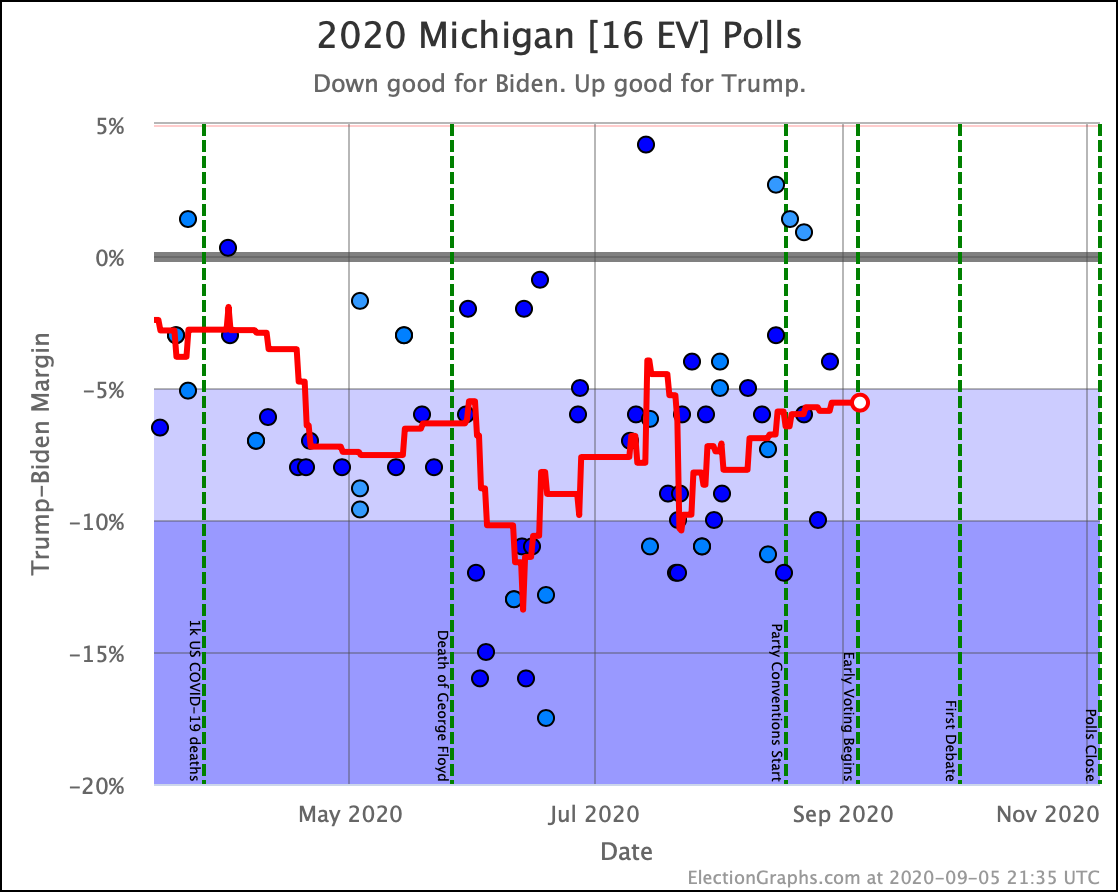
Like Pennsylvania, Biden's lead briefly dipped under 5% in Michigan. Unlike Pennsylvania, the timing of the polls was such that the brief foray into "Weak Biden" was actually erased from the graph once all the data was in.
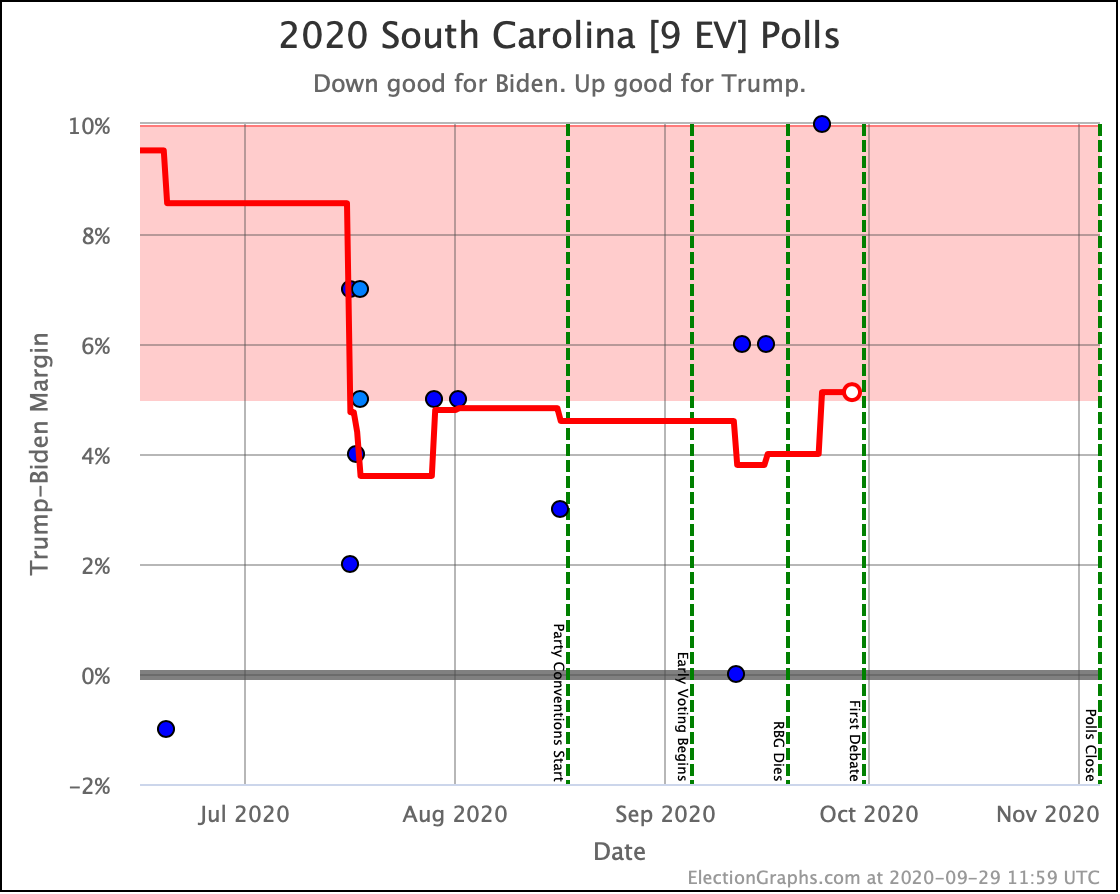
From the other direction, the addition of some older polls from June, July, and August actually pulled Trump's lead in South Carolina under 5% for much of the summer. That older poll data wasn't available when we posted 12 days ago, so it only reflected as a switch to "Weak Trump" when we added those polls a few days back. But then a few polls from September quickly pulled the state back into the "Strong Trump" zone.
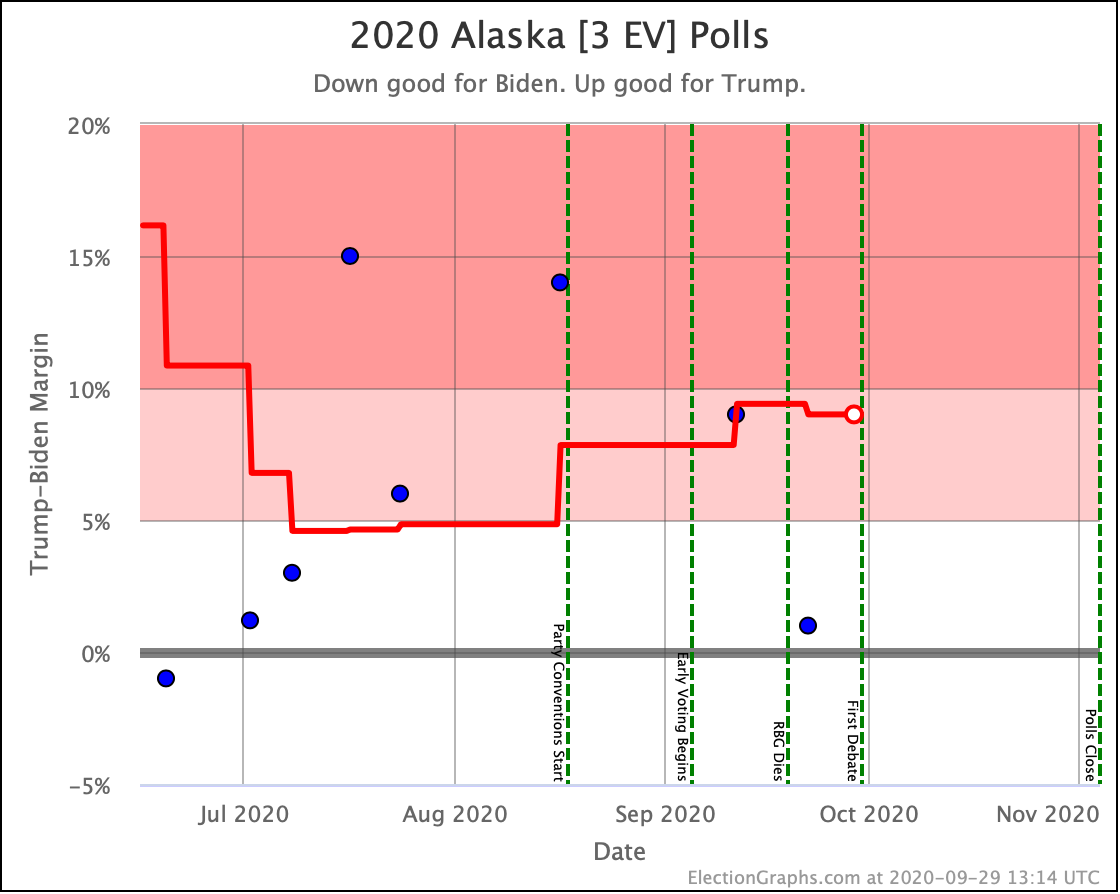
Exactly the same thing happened with Alaska. The addition of older data from June and July briefly pulled the average under 5%, but then it popped back up again.
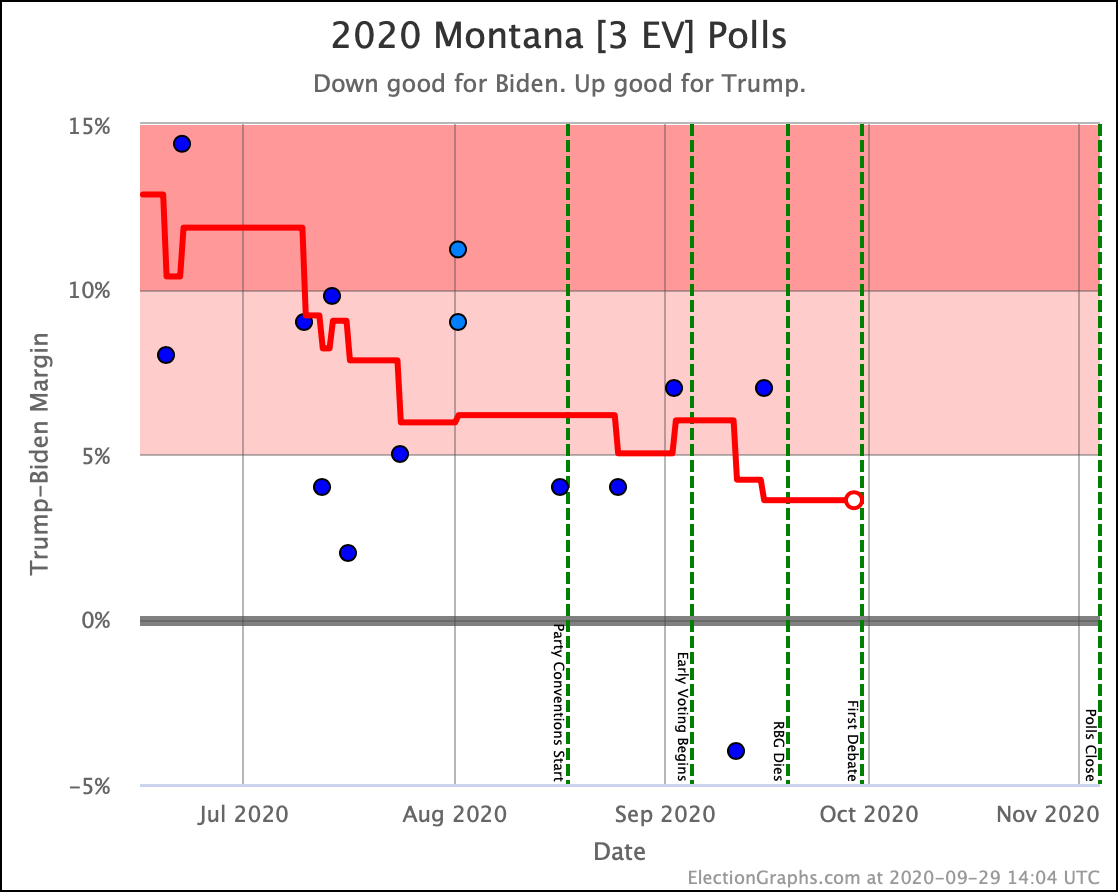
Montana on the other hand did actually move from "Stong Trump" to "Weak Trump. That one data point showing Biden actually leading Montana sure looks like an outlier though. So don't be surprised for this to jump back to "Strong Trump" when that poll rolls off the average. (Assuming there are at least 4 more Montana polls before the election, which there may or may not be.)
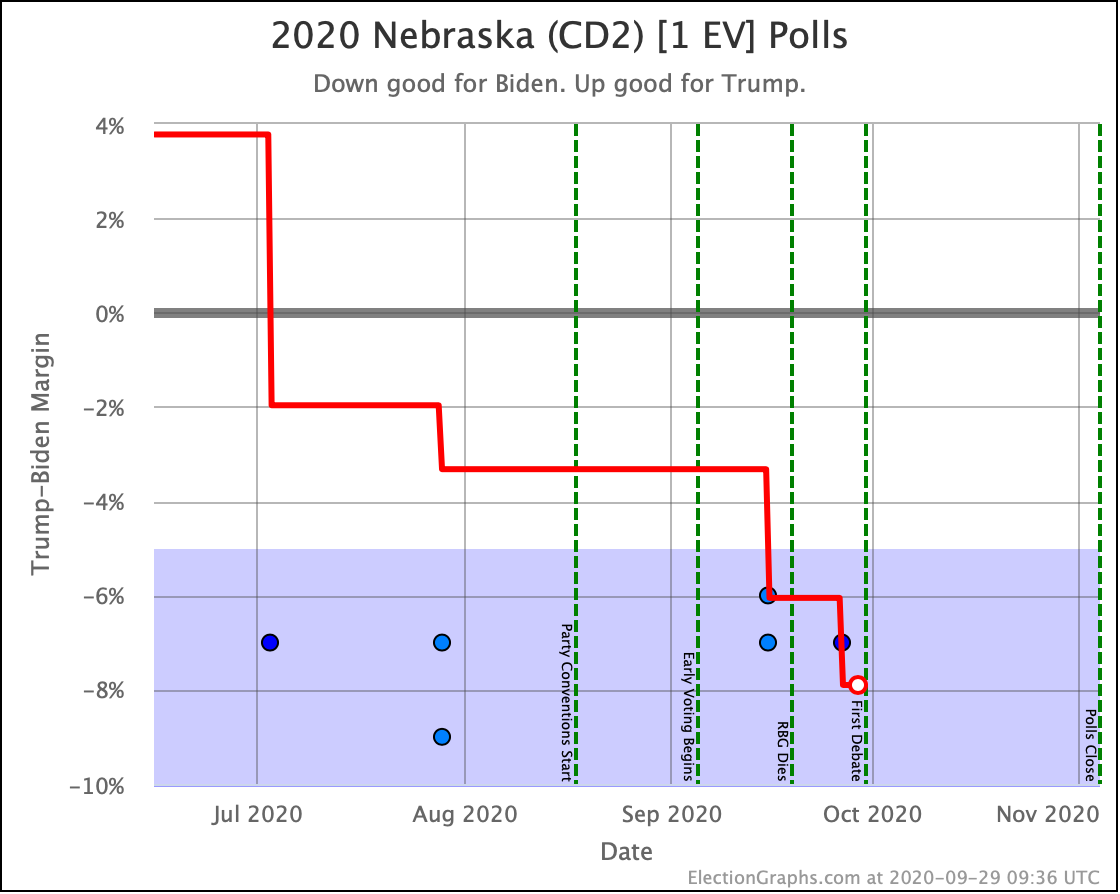
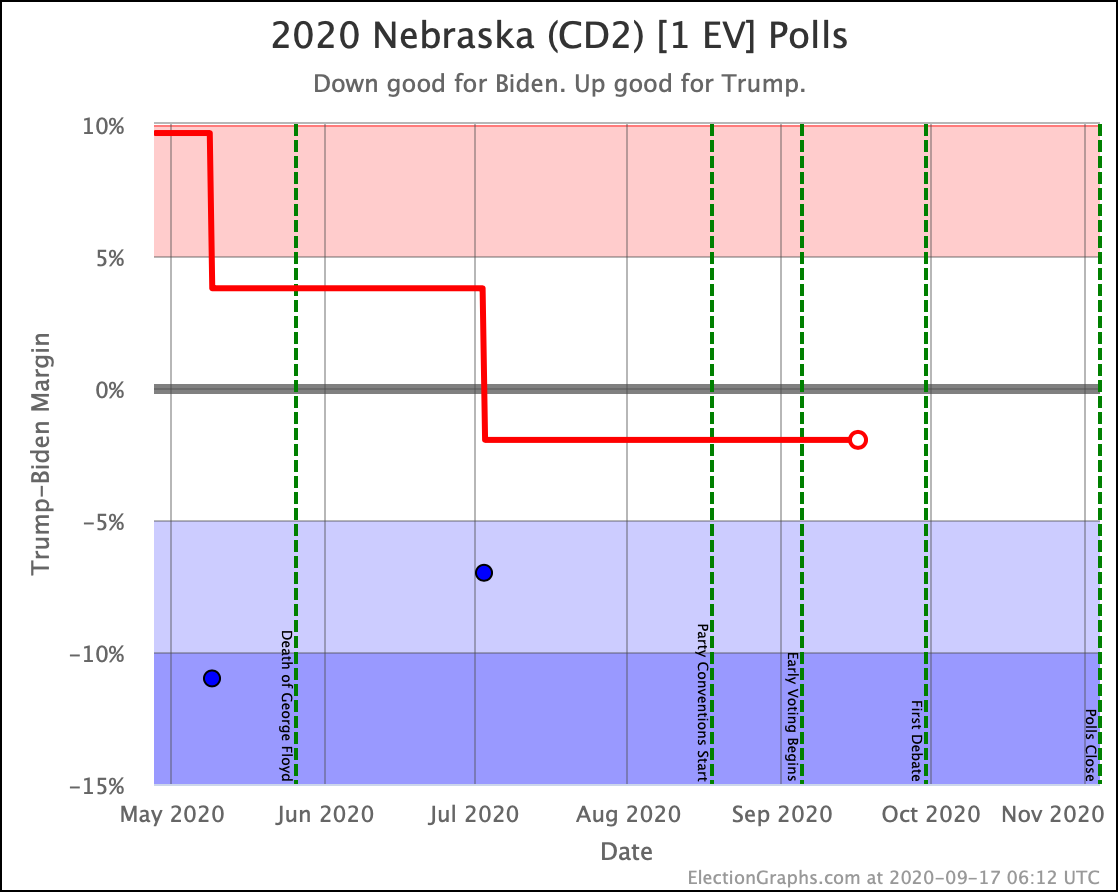
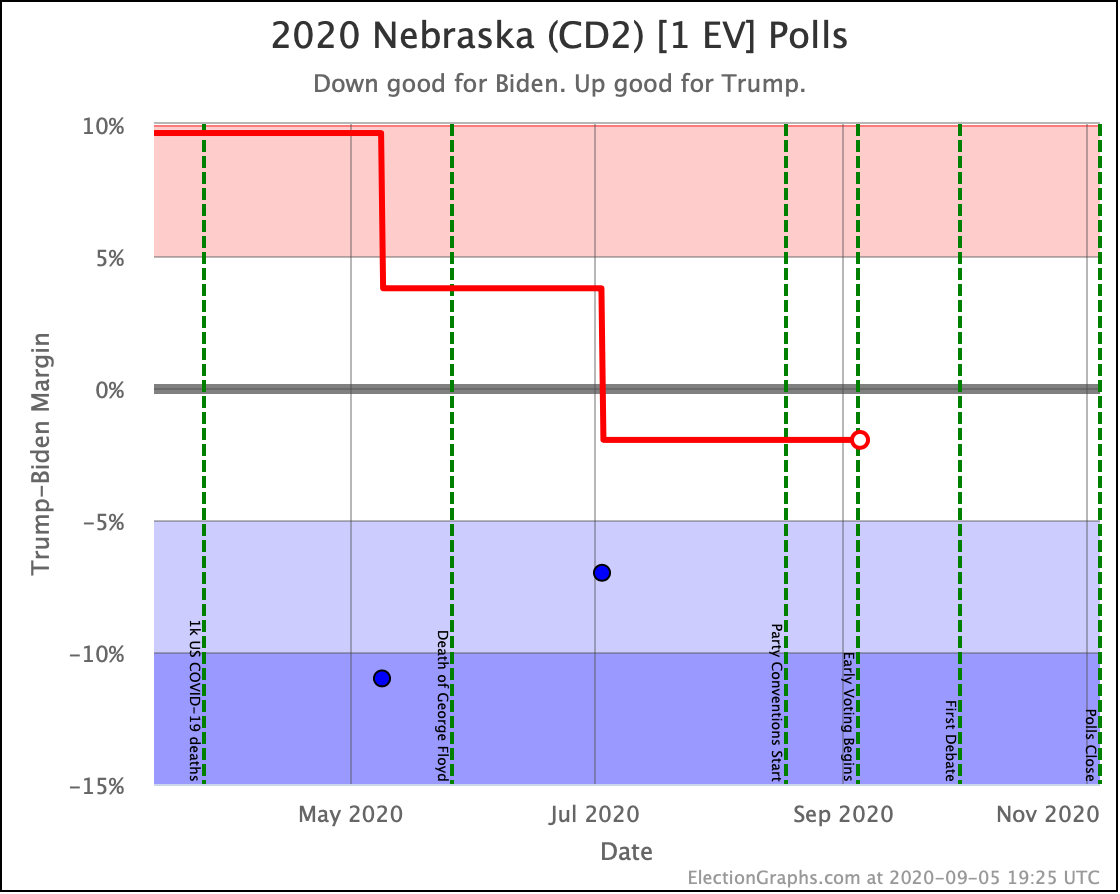
And Nebraska's second congressional district, where the average finally catches up with the individual polls, which have been showing 6%+ Biden leads since the spring.
And then the "Weak" states and CDs that did not switch categories this time, without commentary:
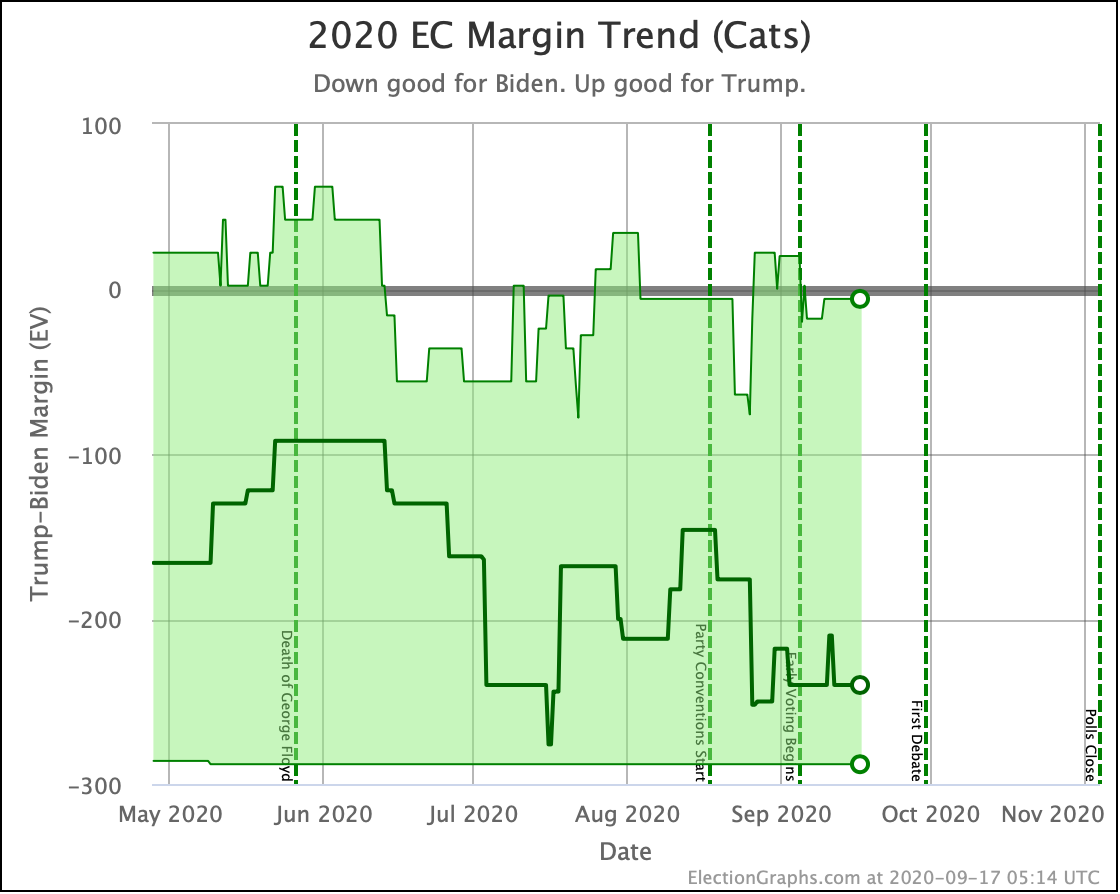
Add up all of these changes, the categorization view now looks like this:
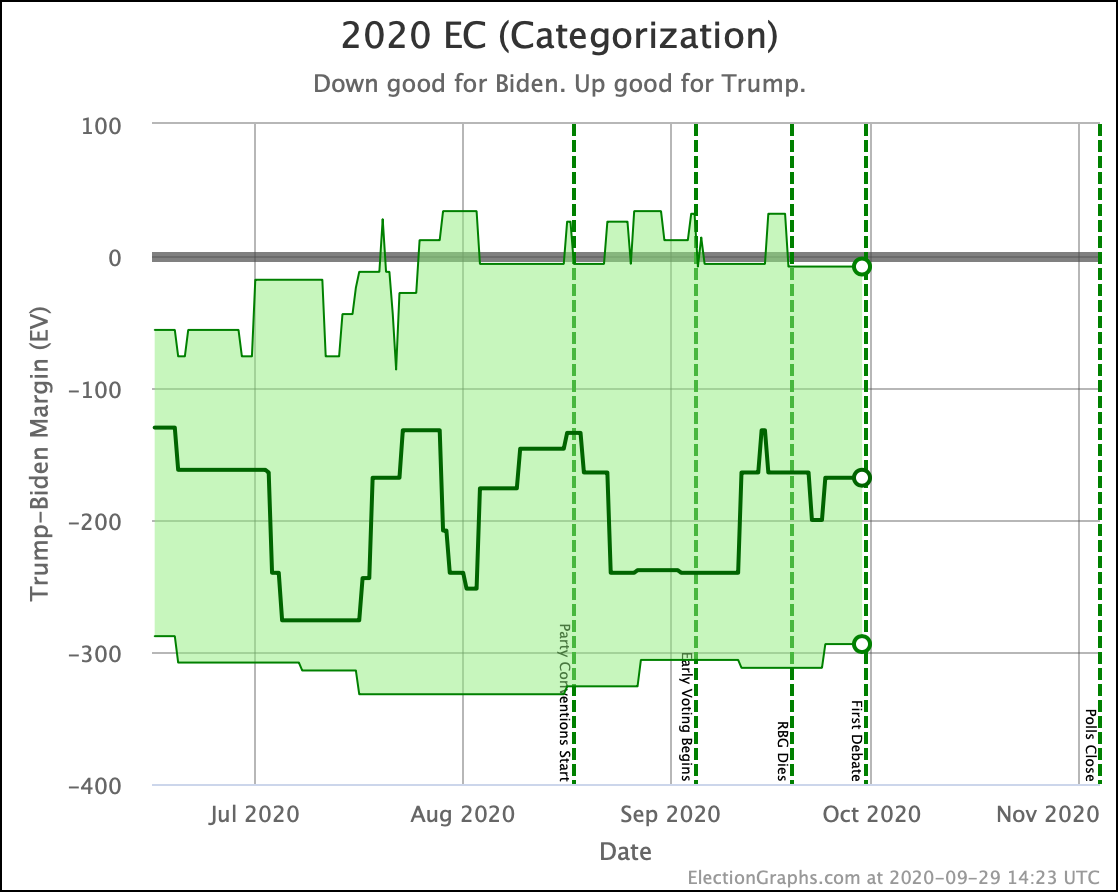
Note because we backfilled a lot of June, July, and August numbers that became available last week, some of the older part of the chart moved around a bit as well as just the newer weeks.
But the picture here is pretty static for August and September. The middle line bounces around a bit as the close states cross back and forth over the centerline. But basically, there isn't much consistent movement one way or another. Where we are now is very close to where we were two months ago.
Normally at this point, we'd show the probabilistic view and talk about it a bit, but that was covered at the beginning of the post this time with the addition of the Uniform Swing view. If you scroll back up and look at the probabilistic charts, you'll see they also show a pretty steady picture. Sure, there is some movement up and down as polls come in and out of the averages. But there is no clear directional movement. Neither candidate is breaking out of their "normal" range.
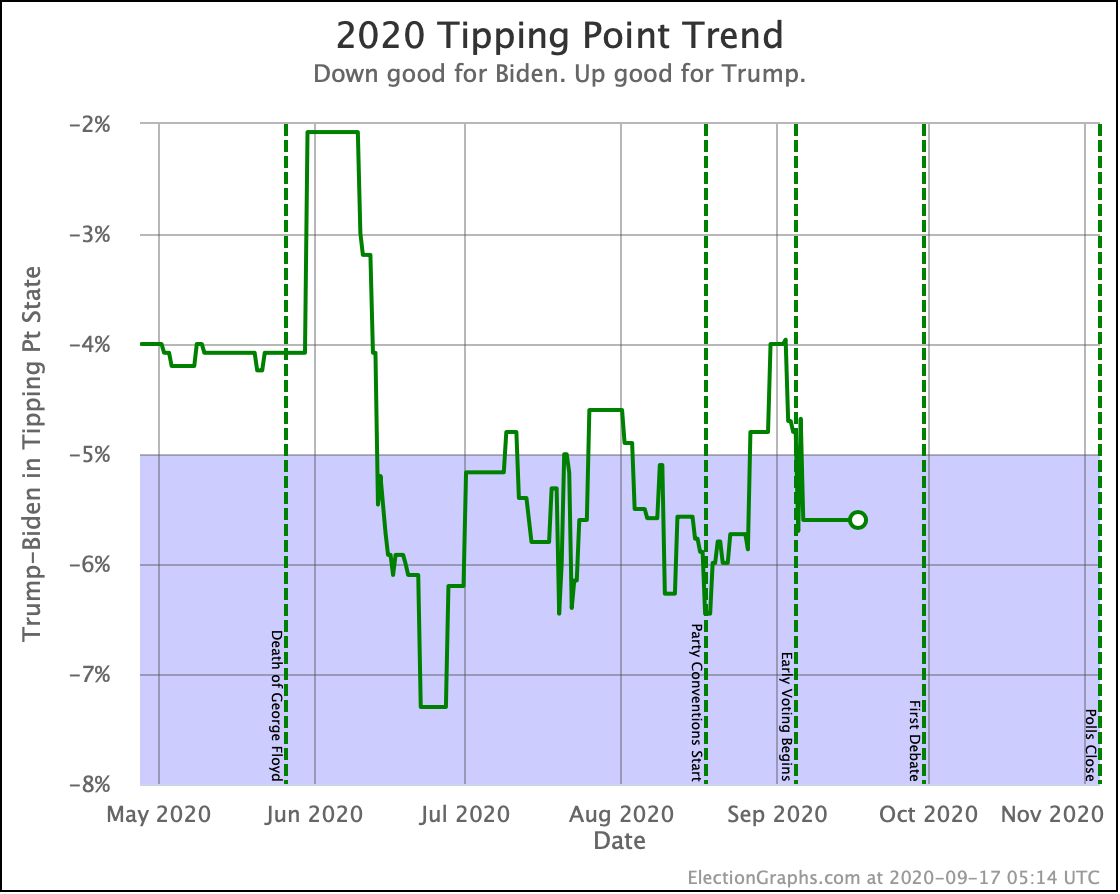
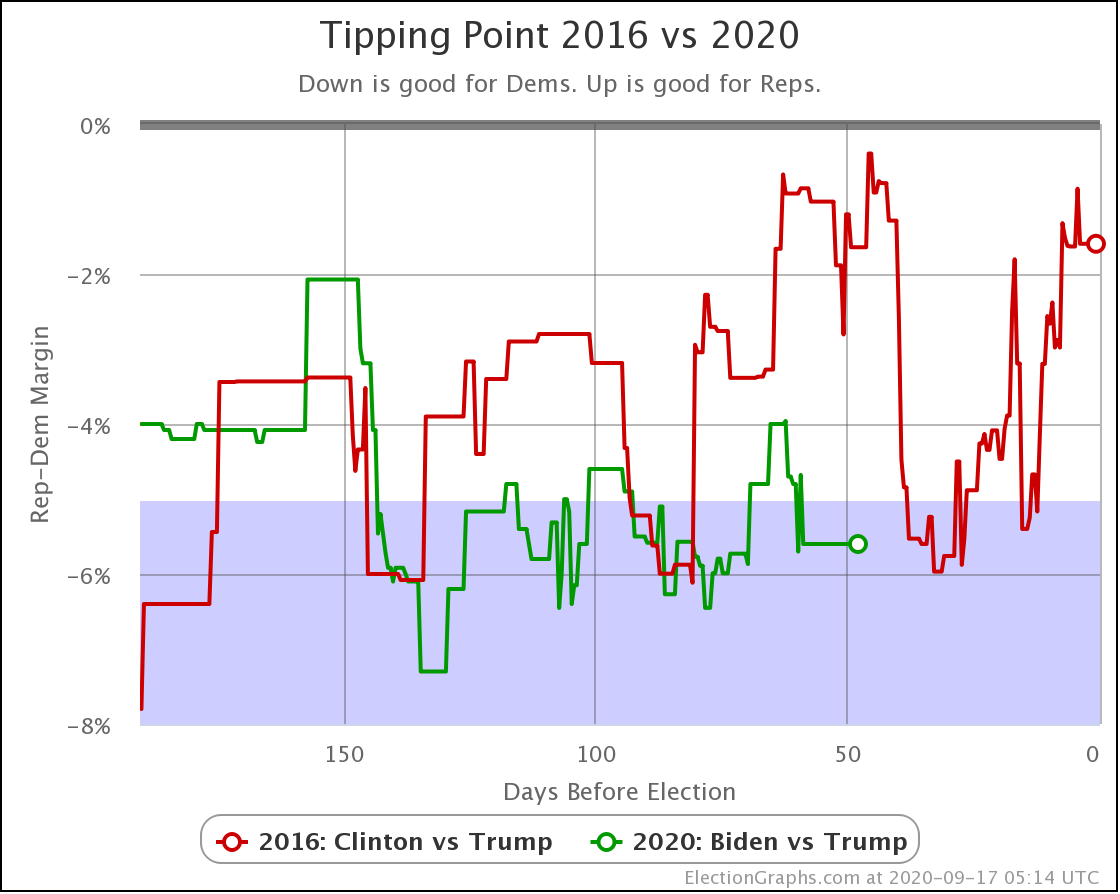
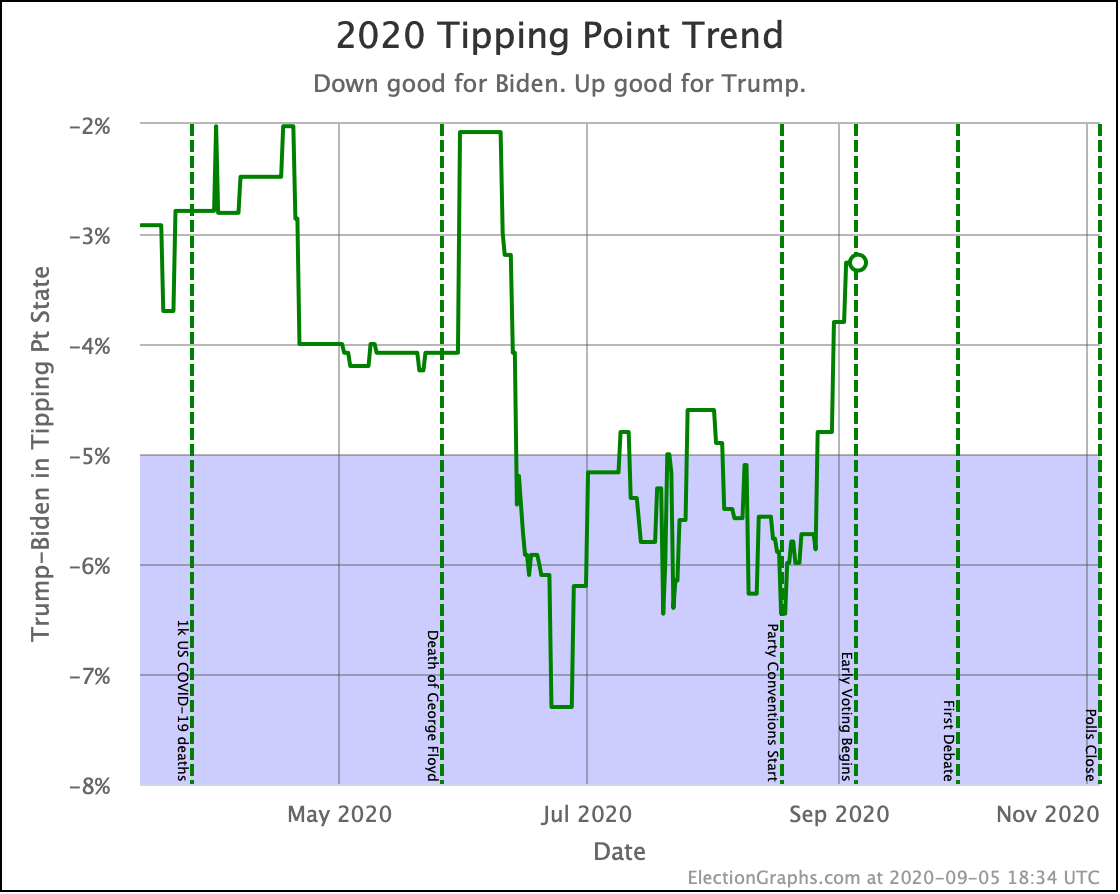
Is it any different for the tipping point?
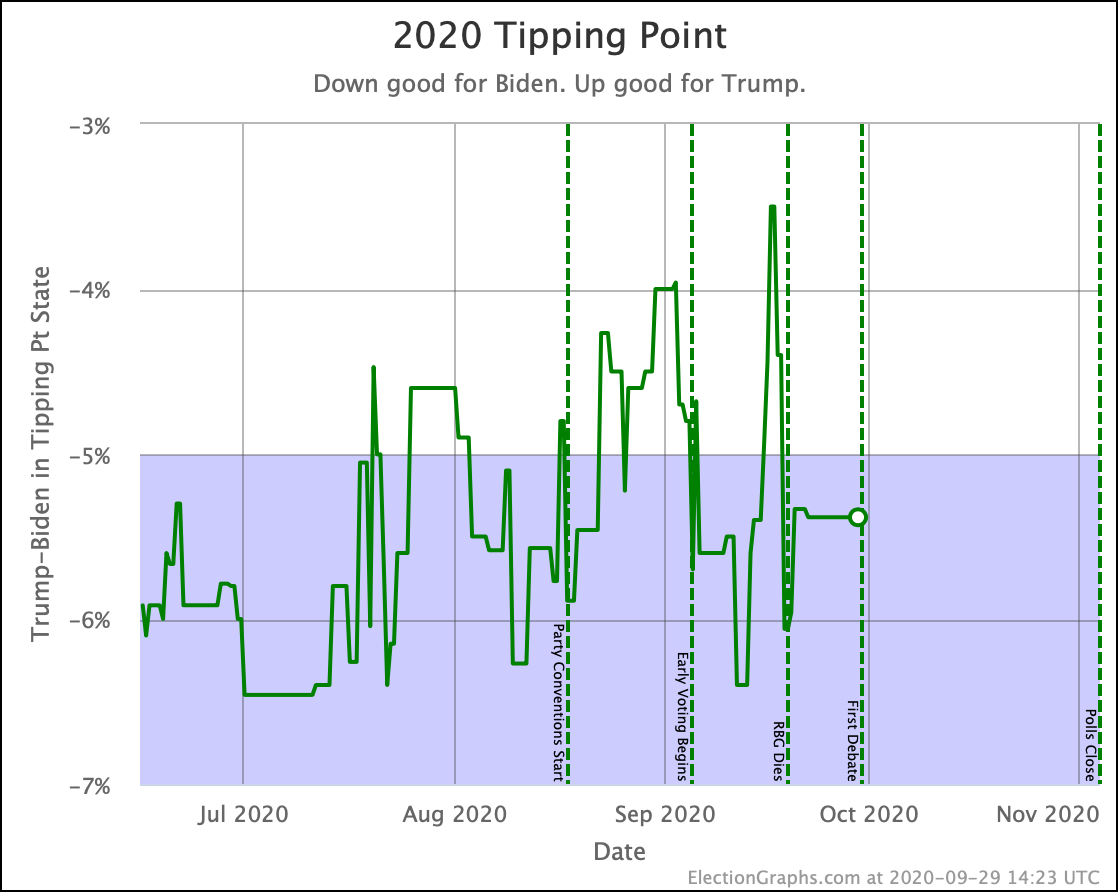
Aside from some very short-lived spikes, the tipping point has been between 4% and 6% Biden since mid-June. And most of that time has been between 5% and 6% Biden. While as always, there is noise, this also shows a very stable race.
As a reference, in the three elections I have tracked, the biggest difference between the tipping point based on the final averages here and the actual tipping point based on the election results was 3.45% in 2008. Biden's tipping point lead is currently 5.4%.
The RCP average of national polls currently shows a 6.1% Biden lead. Comparing to the 5.4% tipping point, this implies that the structure of the electoral college is currently giving Trump a 0.7% head start. This is up from 0.3% head start in the last update.
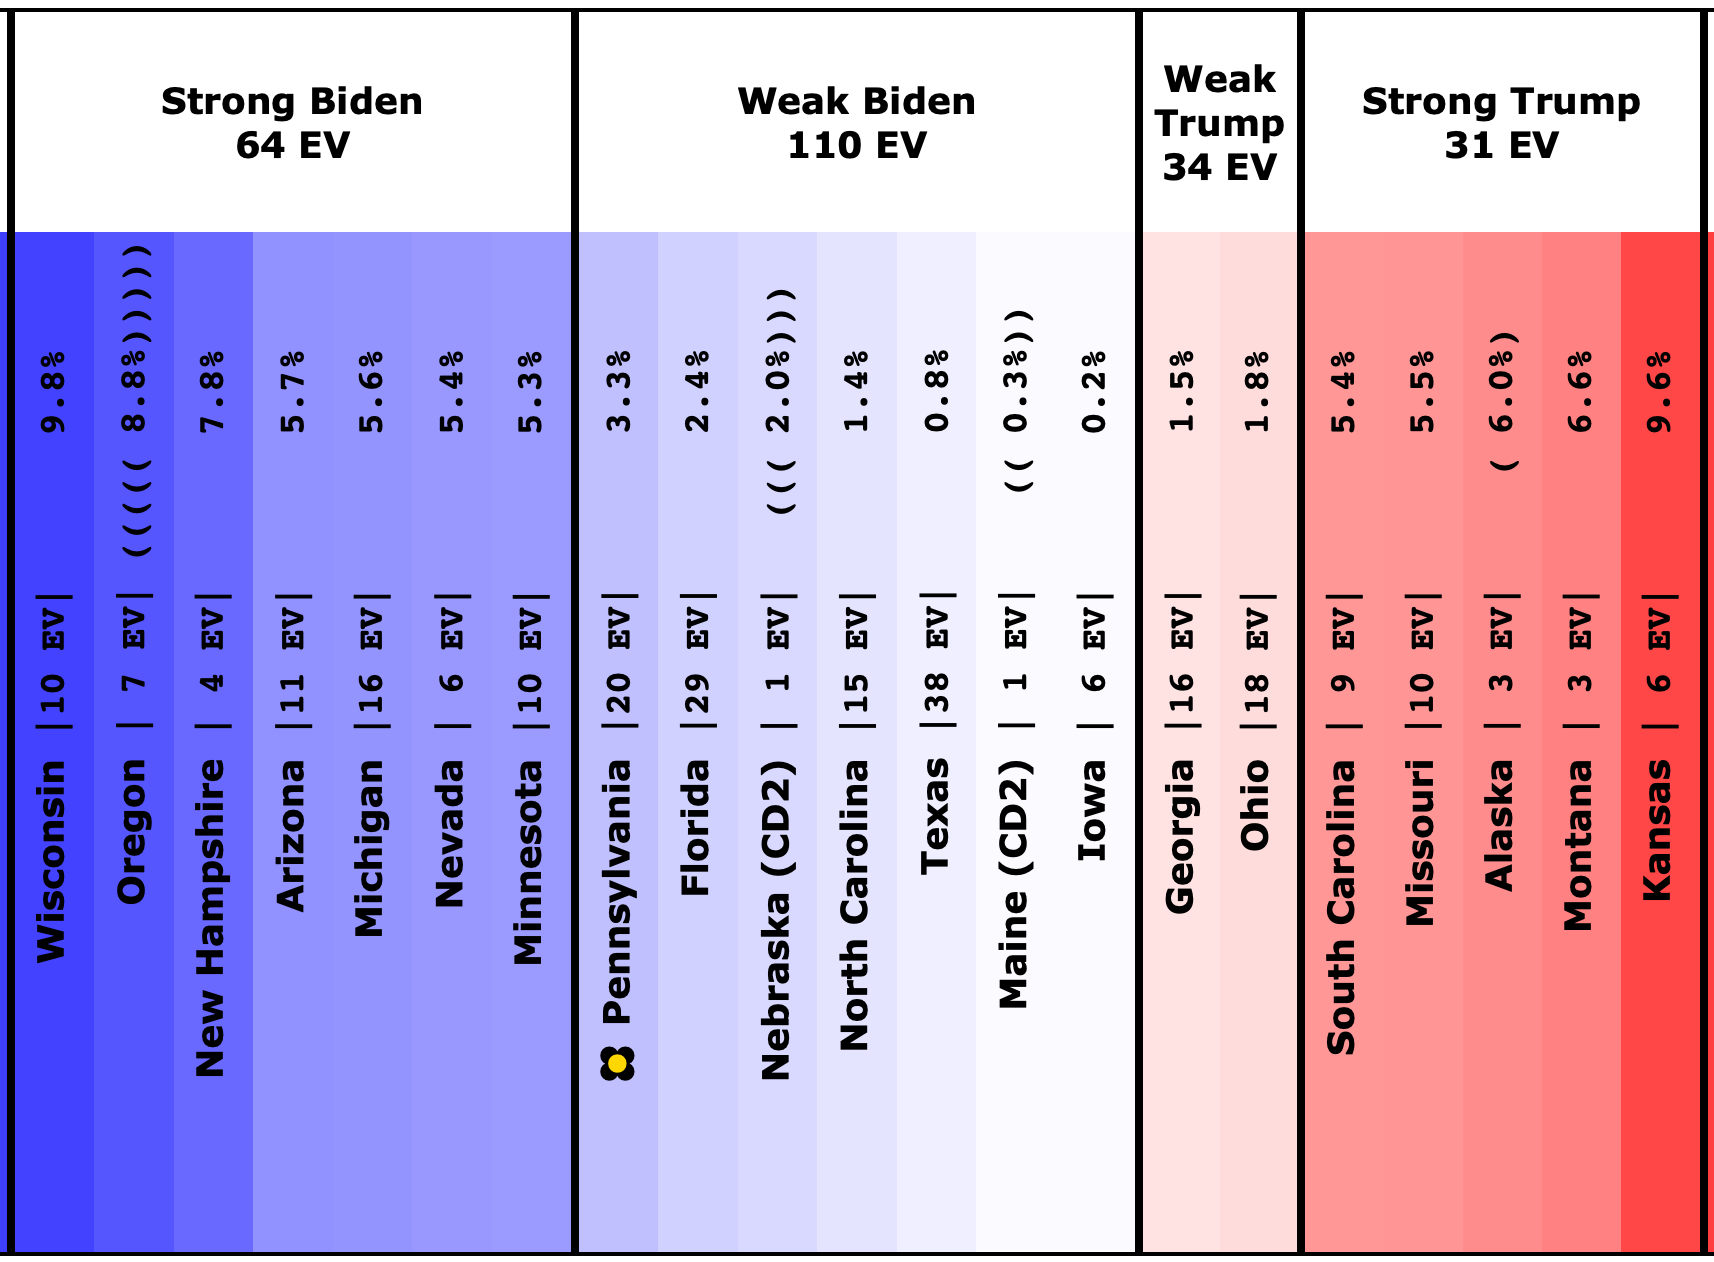
The spectrum of states where the margin is less than 10% now looks like this:
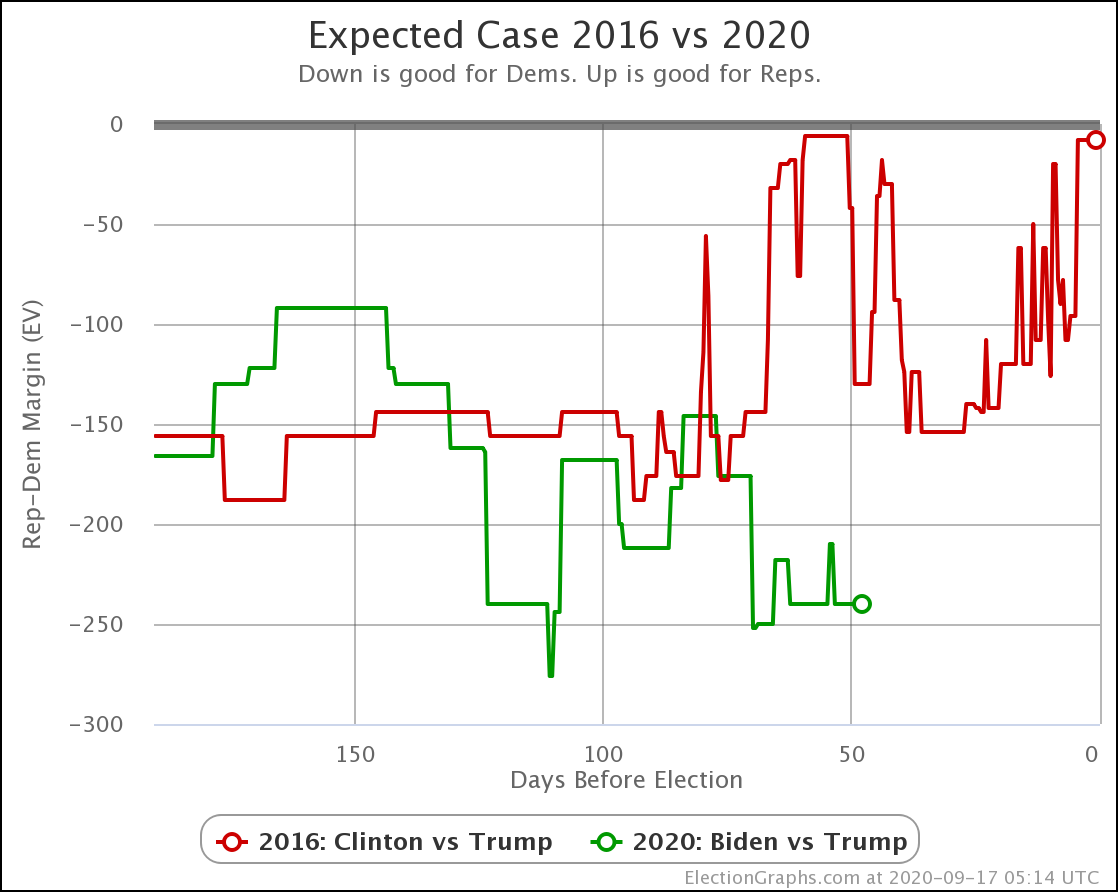
Now time to compare to 2016:
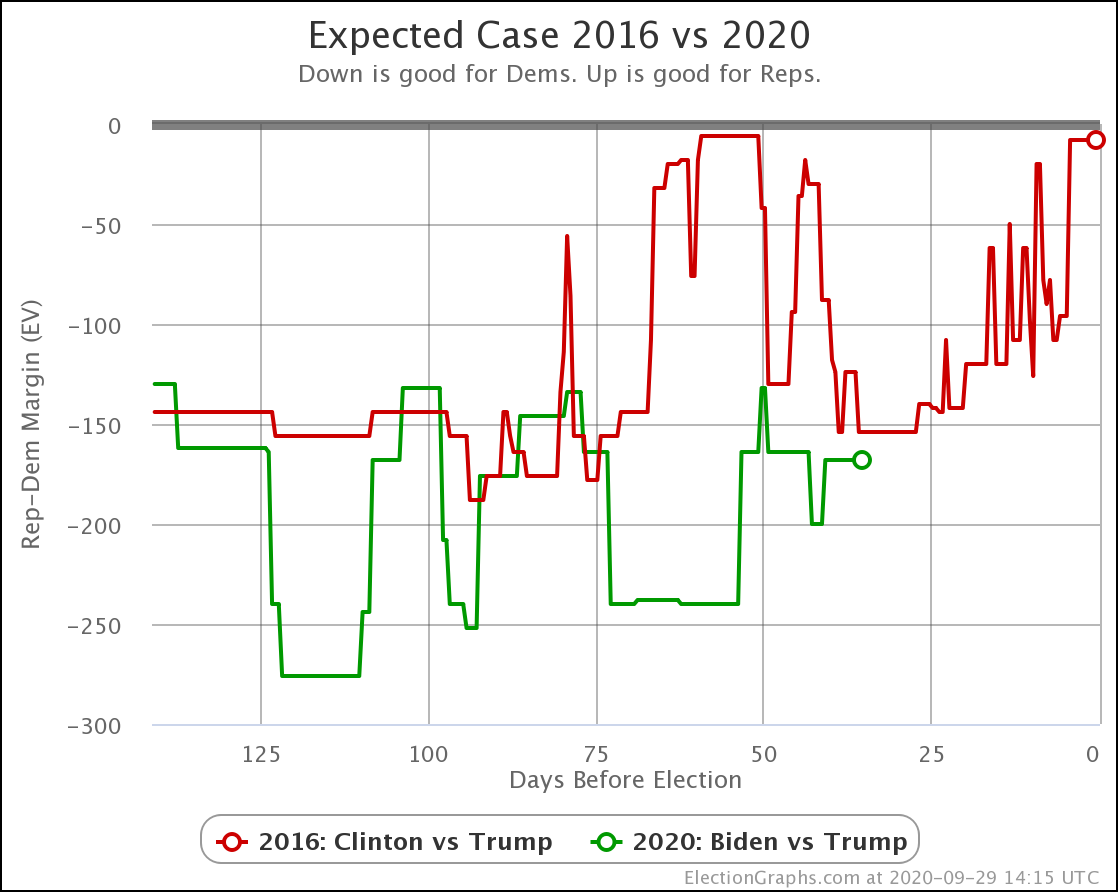
In the expected case, Biden is down from where he was, but he is still doing better than Clinton was at a comparable time. This time in 2016 was a peak for Clinton, but Biden still beats it. Barely. But this is the high end of Clintons range, while it is the low end of Biden's.
But let's look at the tipping point comparison:
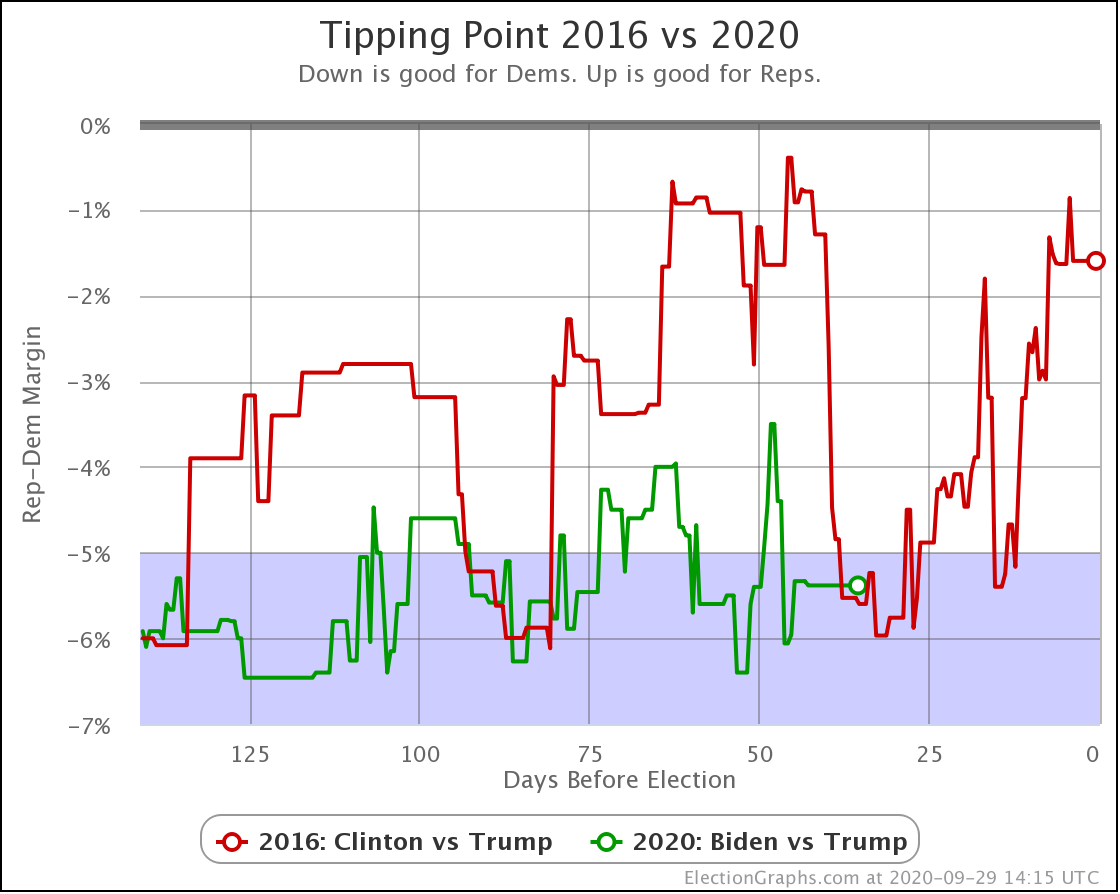
Clinton's early October peak was pretty substantial. While Biden's "expected case" is still better, in terms of the tipping point, he actually slightly lags where Clinton was at the same point. Biden is at 5.4%. Clinton was at 5.6%
So in terms of how much of a swing in nationwide polling would be needed to change the outcome, Biden is essentially exactly the same place Clinton was at this point in terms of the tipping point margin. And Clinton collapsed.
Quoting from the last post, since this hasn't changed?
What's different this time?
Aside from the big movement toward Biden in June, Biden's tipping point has been more stable than Clinton's. Clinton's line swung back and forth wildly. Biden is certainly jittering around a bit, but the magnitude of the movements is a lot smaller.
Election Graphs focuses on margins, but looking at the details of the polling and the actual absolute amount of support for each candidate, one big difference in 2020 vs 2016 is that we have a significantly smaller set of undecided voters now than in 2016. So the group who are available to "slosh around" and shift back and forth over time is a lot smaller.
Does that exclude the possibility of a Clinton style collapse?
No. It does not.
But it probably does mean you need a pretty huge news event to cause that kind of movement. It would not only have to make the undecideds break strongly toward Trump but also keep some current Biden supporters from voting for him, either by actually flipping or just by staying home.
Clinton's tipping point at this point in 2016 was one of the highest levels she ever hit on this metric. Biden is about where he usually has been. This does seem to make the kind of collapse Clinton saw less likely.
But we are about to enter October. Will we get "October Surprises" this October that match the impact of what happened in 2016?
We only have a few weeks left to find out.
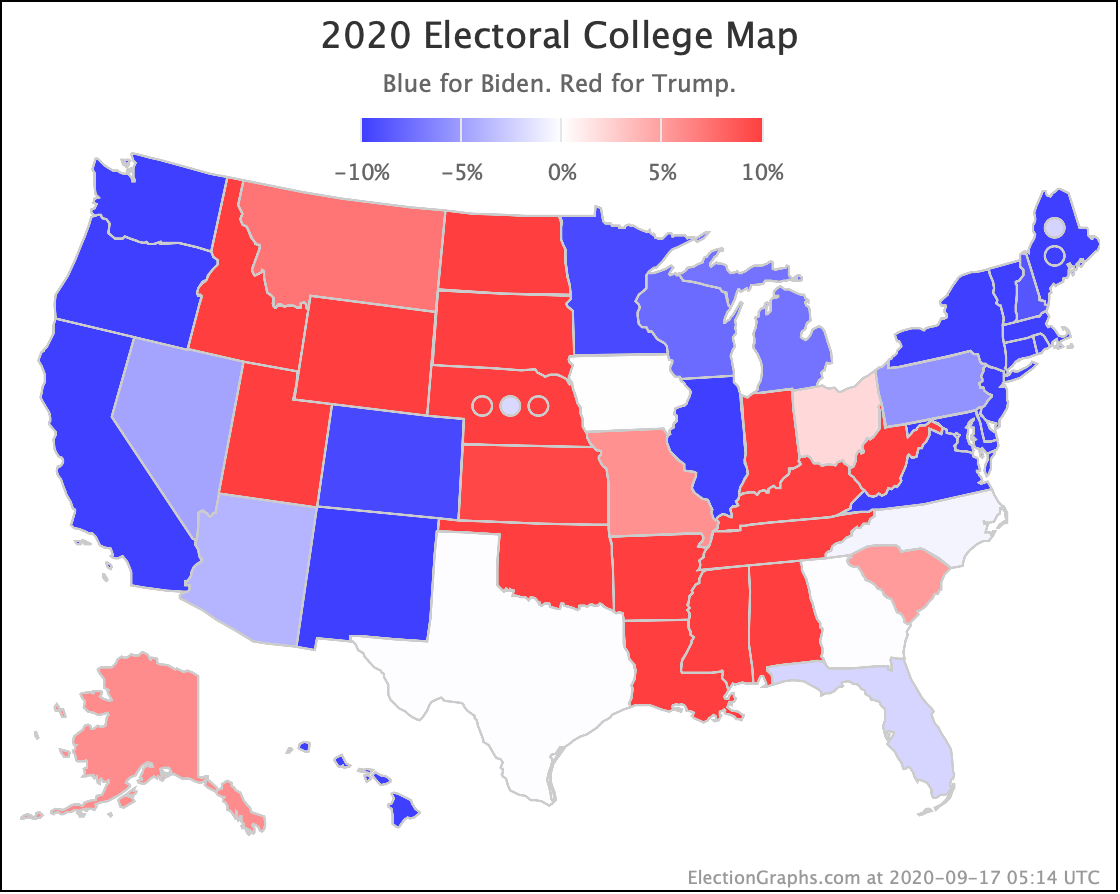
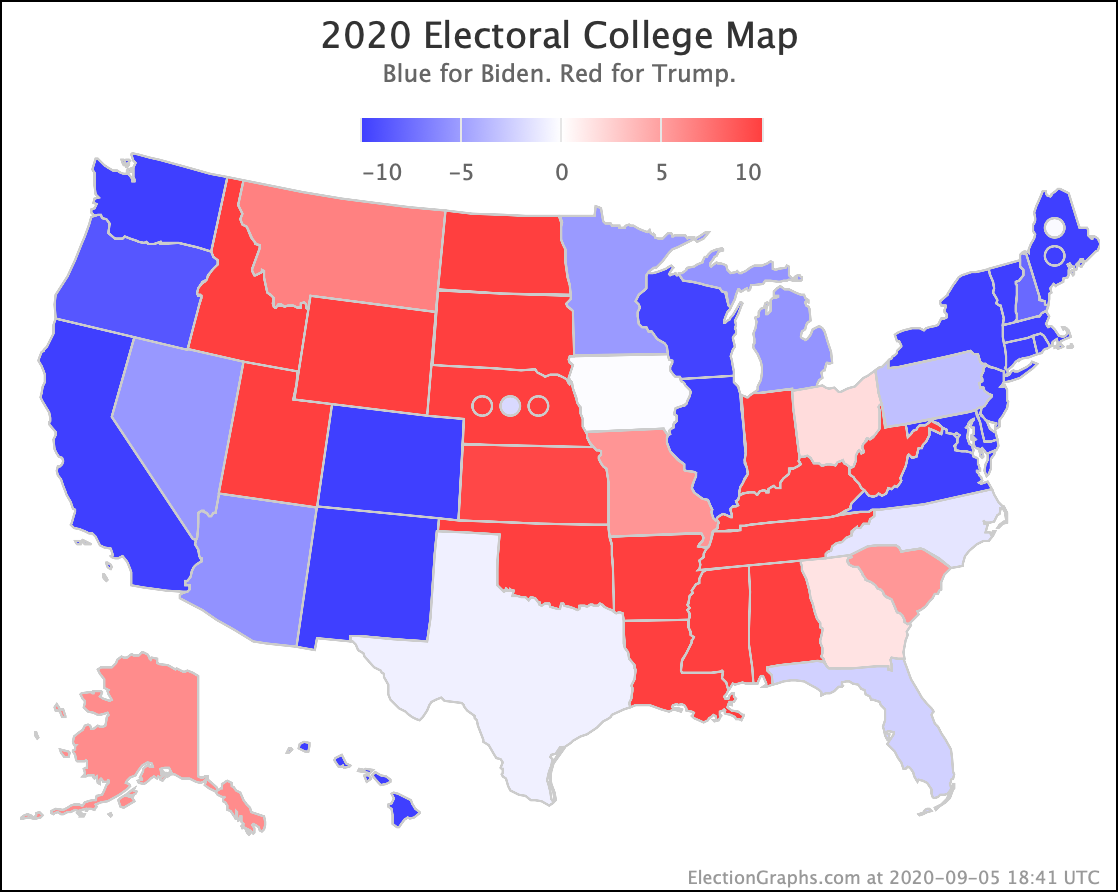
Finally, the current map:
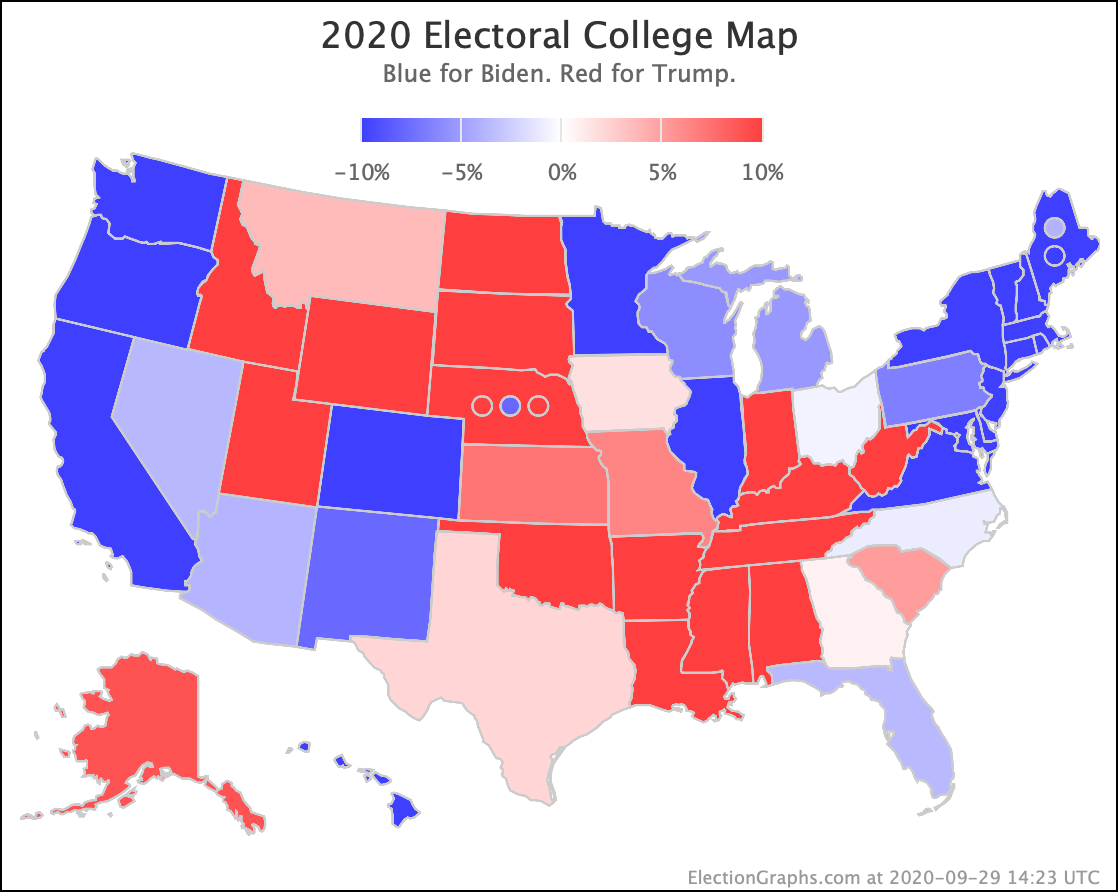
Like everything else in this post, the map shows where things stood when I started this blog post. But we have entered the part of the season where new polls are being released nearly constantly. There have been several during the time I have been writing this update. Time to go and start adding them in…
For now though, the usual closing with the countdown:
35.2 days until the first results start coming in for Election 2020.
Hold on tight.
For more information:
This post is an update based on the data on the Election Graphs Electoral College 2020 page. Election Graphs tracks a poll-based estimate of the Electoral College. The charts, graphs, and maps in the post above are all as of the time of this post. Click through on any image for current interactive versions of the chart, along with additional details.
Follow @ElectionGraphs on Twitter or Election Graphs on Facebook to see announcements of updates. For those interested in individual poll updates, follow @ElecCollPolls on Twitter for all the polls as I add them. If you find the information in these posts informative or useful, please consider visiting the donation page.