
Time for another blog update. As always, if you are impatient for one of these updates, the 2020 pages on Election Graphs are updated nearly every day as new polls come in. Or you can follow @ElecCollPolls on Twitter to see all the polls as I add them.
The last update here was 12 days ago on September 5th. Here are the high-level changes since that last post:
| Model | Metric | 5 Sep | 17 Sep | 𝚫 |
| Probabilities | Trump 2σ Median Biden 2σ |
Biden +38 Biden +152 Biden +254 |
Biden +44 Biden +152 Biden +256 |
Biden +6 FLAT Biden +2 |
| Trump Win Tie Biden Win |
0.2% 0.1% 99.7% |
0.1% 0.0% 99.9% |
-0.1% -0.1% +0.2% |
|
| Categories | Trump Best Expected Biden Best |
TIED Biden +220 Biden +288 |
Biden +6 Biden +240 Biden +288 |
Biden +6 Biden +20 FLAT |
| Tipping Point | Biden +3.3% | Biden +5.6% | Biden +2.3% |
This week's TL;DR: Biden is still significantly ahead. All metrics are equal to or better for Biden than when we did our last update. Most importantly, Biden's tipping point has moved from 3.3% up to 5.6%. This shows that it isn't just a bunch of states that are just barely Biden giving him his electoral college margin, but that instead, he has pretty substantial leads in all of the states he needs to win.
Five states had a net change in or out of "Weak Biden" and "Weak Trump" in these 10 days, so let's look at those first:
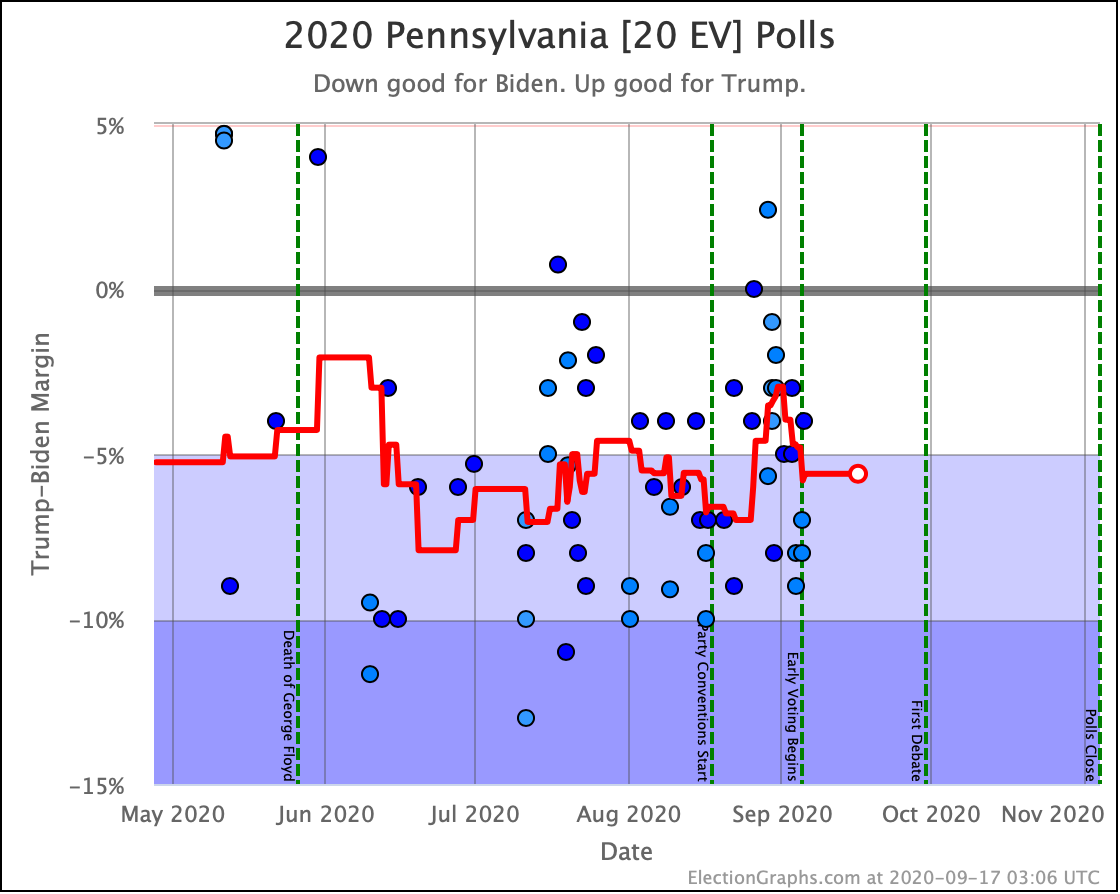
At our last update, Biden's lead in Pennsylvania had slipped below 5% into our "weak" category. It didn't last long. The next wave of polls was good for Biden, and his lead is now up to 5.6%, which translates into a 93.2% chance of winning the state.
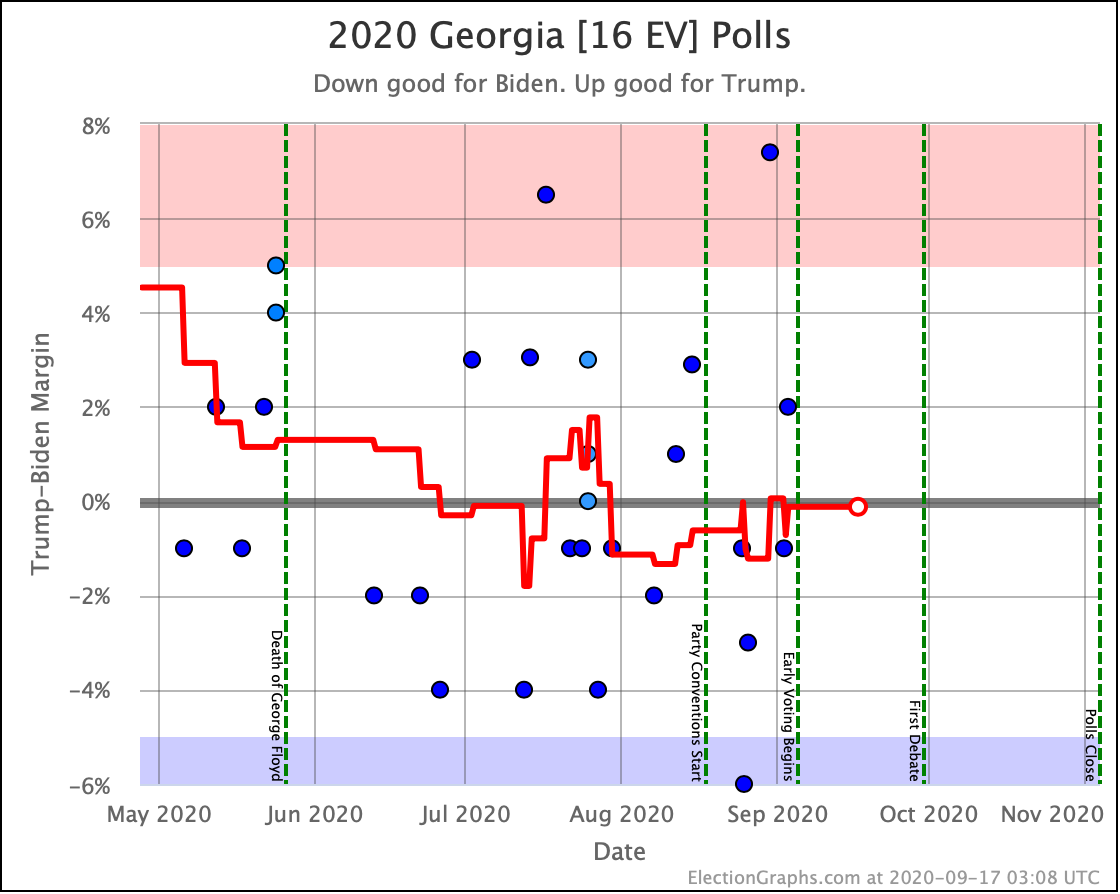
In our last update, Georgia had slipped just barely to the Trump side of the centerline. Now it is just barely on the Biden side. Right now our average has Biden with a 0.1% lead. But this is in the zone where based on our analysis of Election Graphs results from 2008 to 2016 we actually give Trump slightly better odds of winning the state anyway. At an 0.1% Democratic lead, we have Biden at 46.8% to win, compared to Trump at 53.2%.
But really, that is close enough to 50/50 to call it a coin toss at the moment.
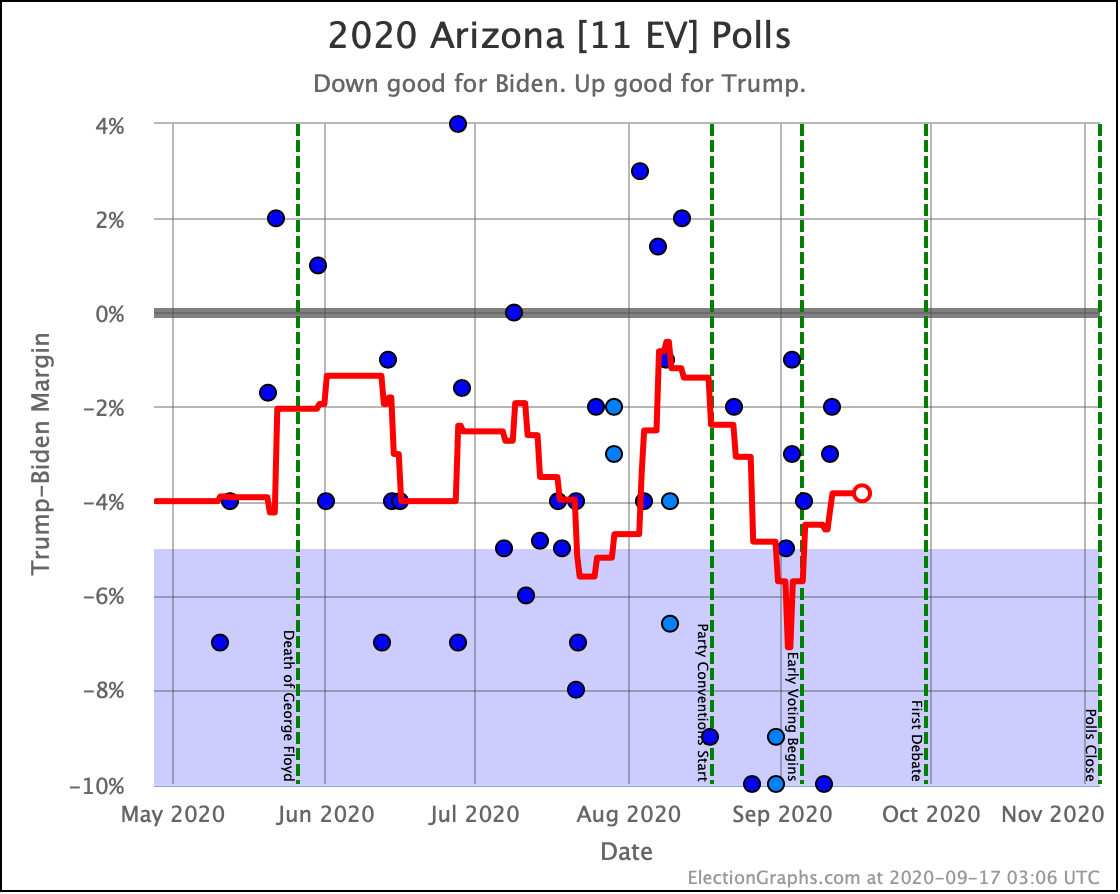
In our last update, Biden had gotten a bunch of really good Arizona polls, and he strengthened into our "Strong Biden" category. More recent polls revert to the more normal pattern, with Biden having a lead in Arizona, but a small one. That lead is currently 3.8%, which corresponds into a 82.9% chance of winning the state if the election was today.
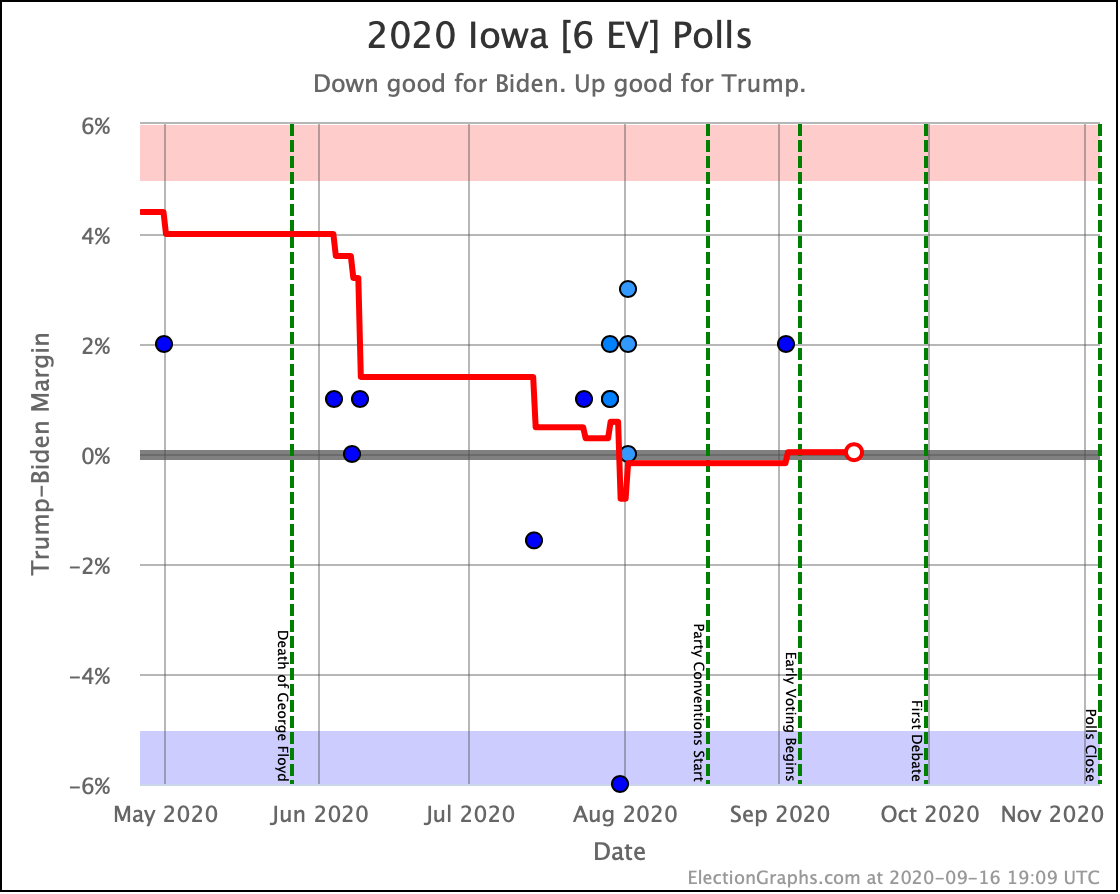
Could we please have some more Iowa polls? For such a close state, it is surprisingly lightly polled. The five poll average currently goes back 1.6 months. A lot happens in 1.6 months.
Anyway, the average at the moment is a dead tie. (Well, looking at the unrounded numbers, Trump leads by 0.033%, but really, that is a tie.) But again, the historical analysis of our poll averages show the polls slightly overestimating Democratic support, so that margin still means a 54.2% chance of a Trump win.
Like Georgia though, Iowa is a complete tossup at the moment. If I really had to guess though, I'd guess that the one poll showing Biden ahead by 6% is an outlier, and when it rolls off of our average, Iowa will be on the Trump side of the fence. (But still not by much.)
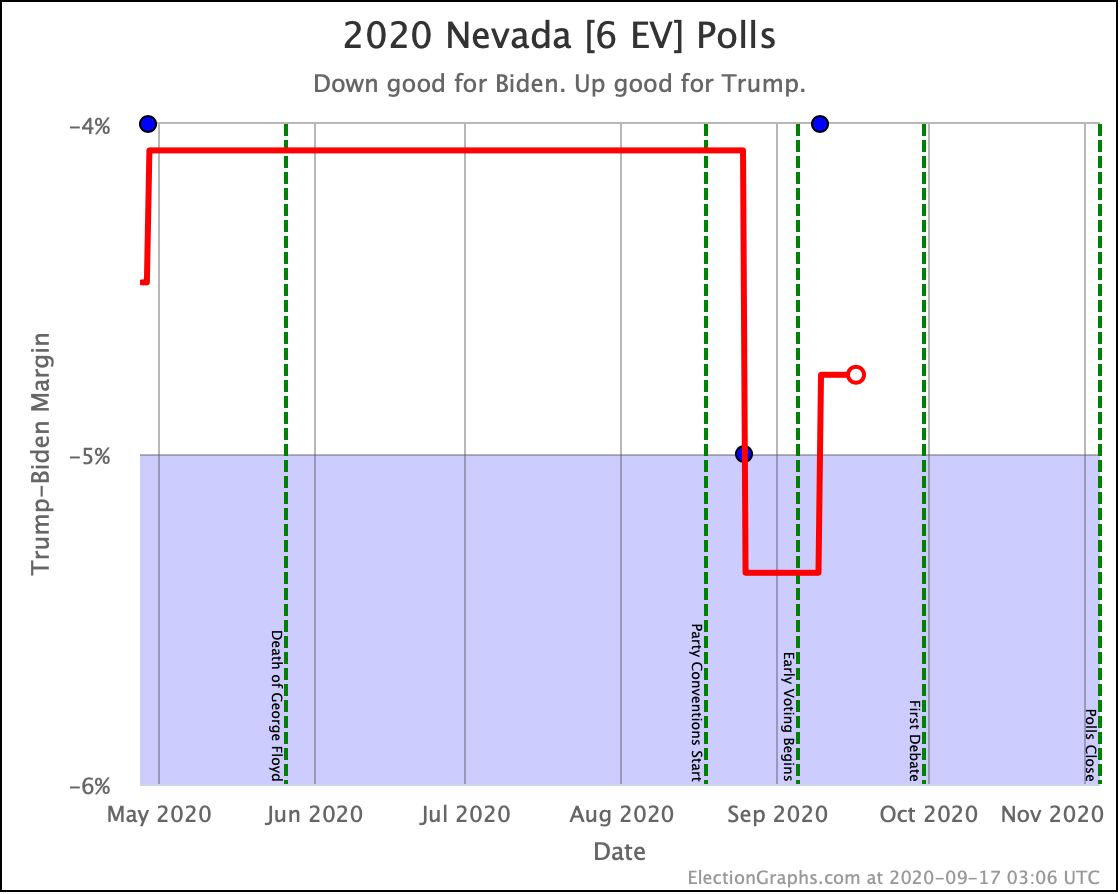
Nevada also has had criminally few polls. The average had moved over the 5% Biden lead line for a little bit but is now down to 4.8%. That's still a 90% chance of a Biden win.
Between these five states, you explain the 20 EV movement toward Biden in the expected case, and the 6 EV movement toward Biden in Trump's best case.
In our categorization view, this once again ends up putting Trump's best case as a narrow loss. In other words, he can win all of the states that he leads, plus all of the states where he is behind by less than 5%, and he still loses. To win, Trump needs to win all of those states… plus Pennsylvania, where he is currently down by 5.6%.
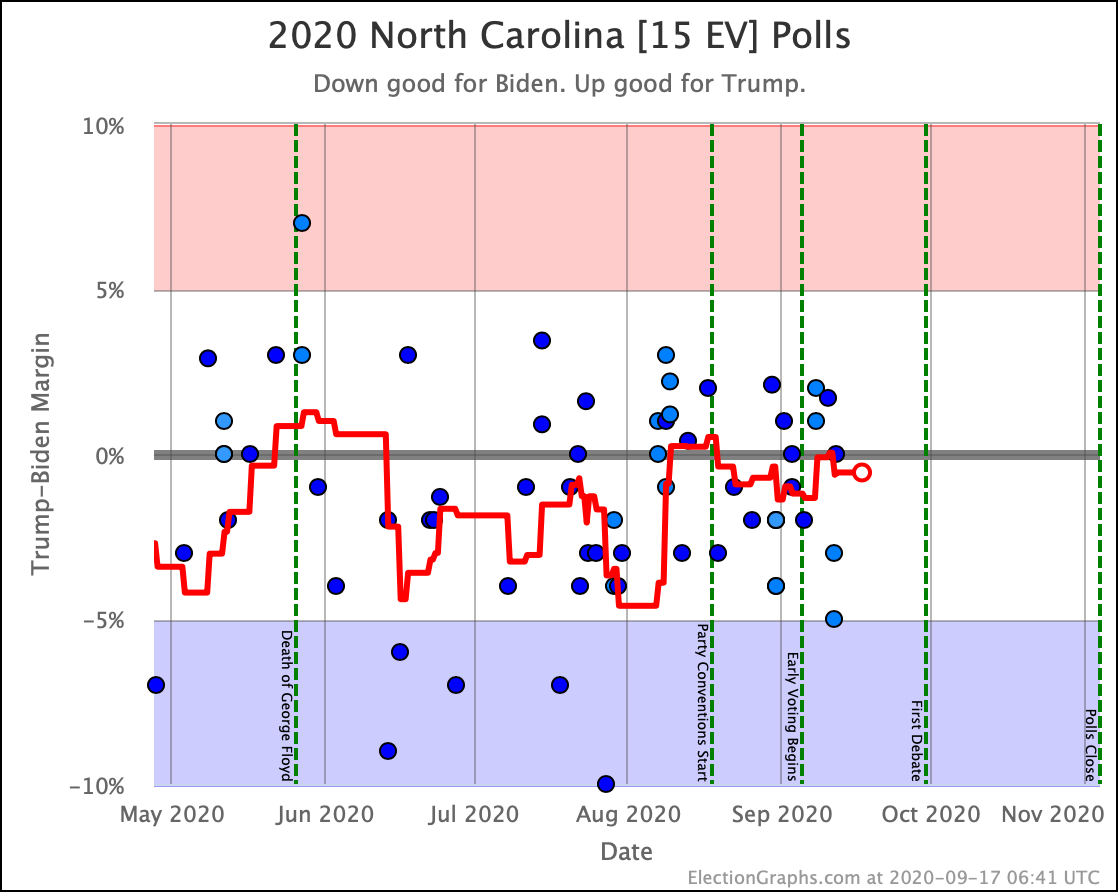
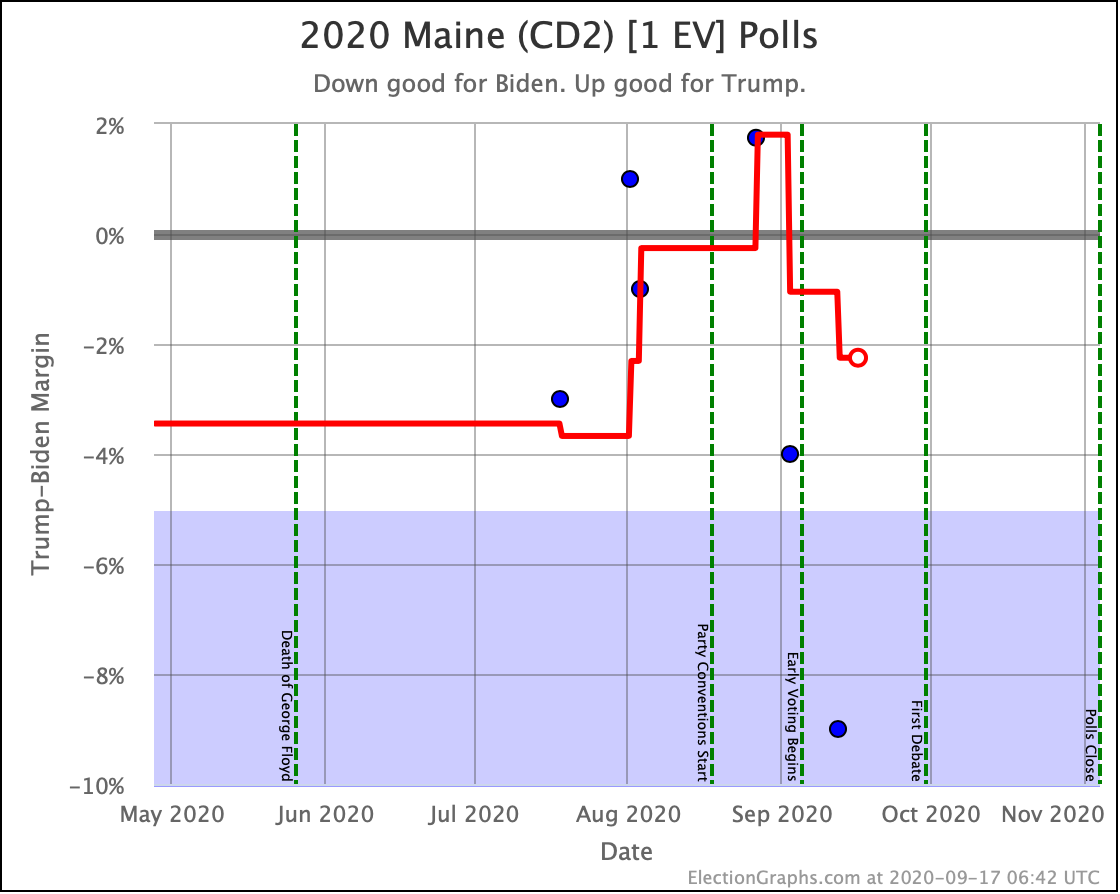
In addition to the states above, North Carolina, Minnesota, and Maine's 2nd congressional district also crossed lines between weak categories, but they crossed back again for no net change.
When we start looking at our probabilistic model, any changes in the numbers matter though, not just those that shift categories. So a quick look at the rest of the "close" electoral votes:
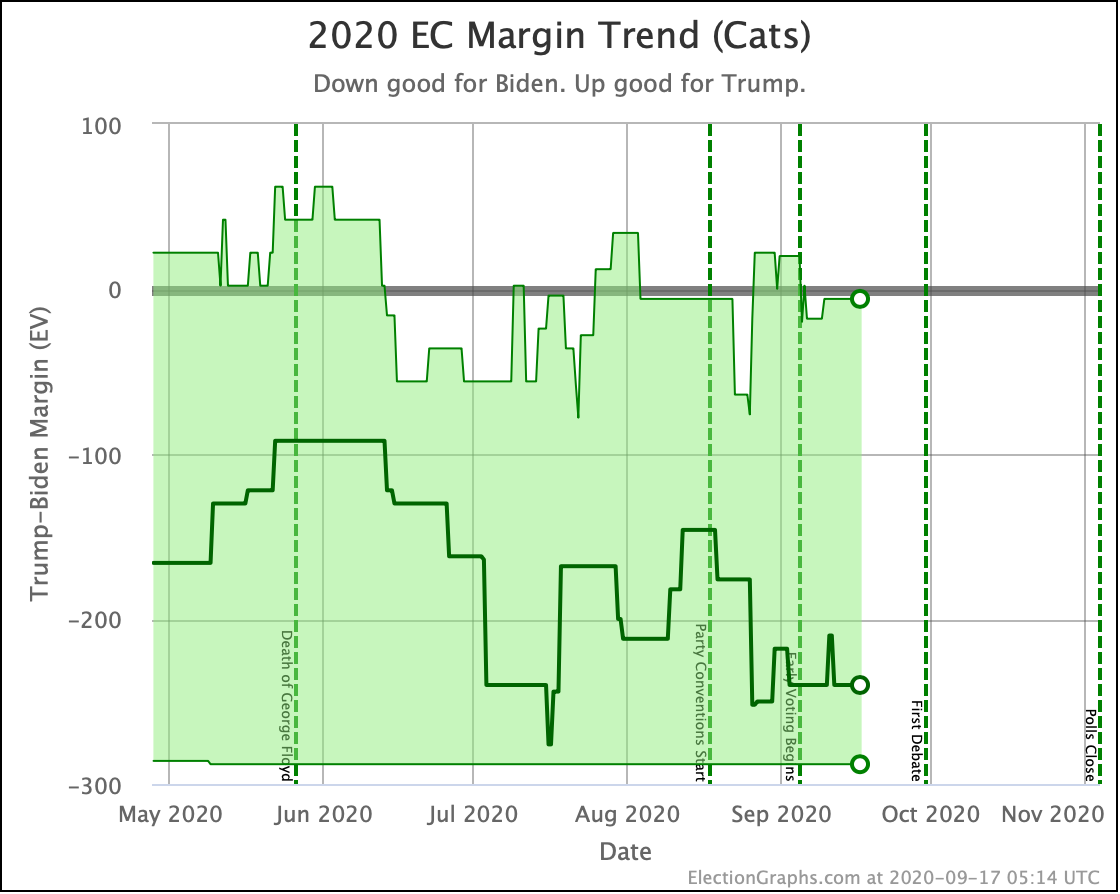
Putting all of this together into our probabilistic model, you get this trend:
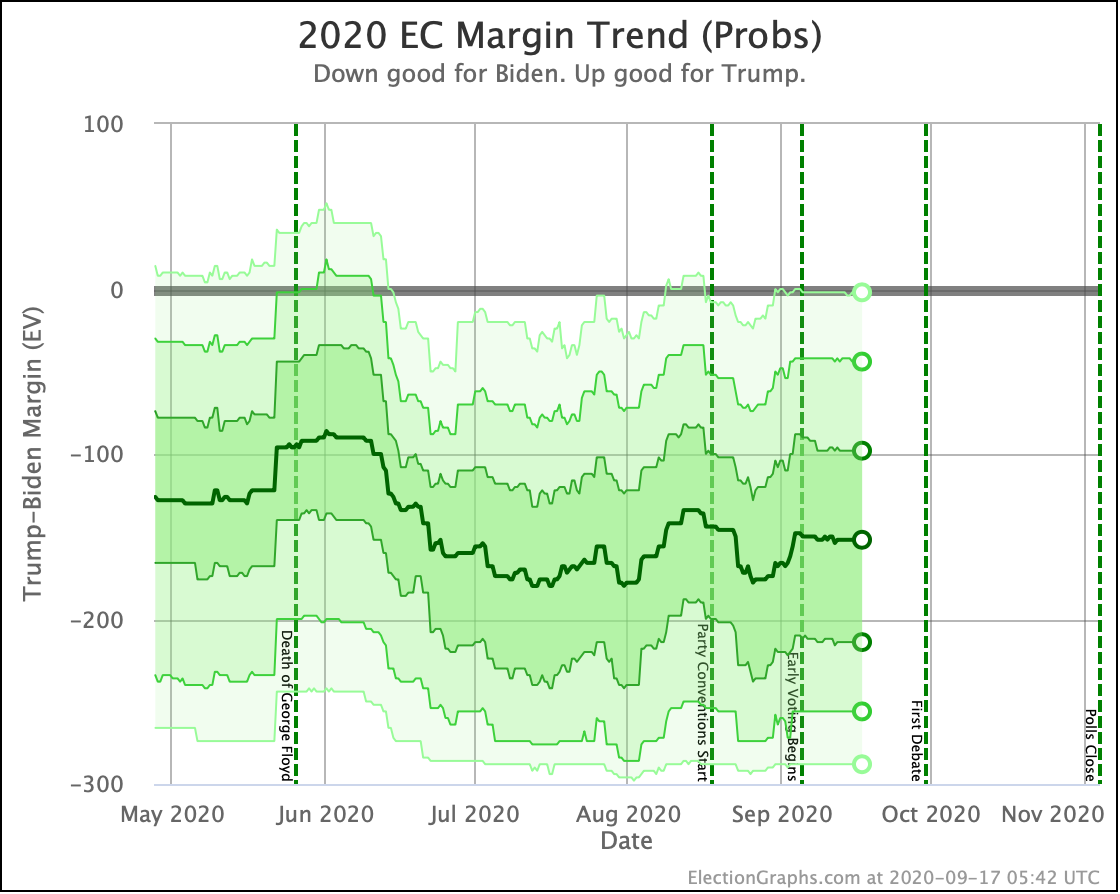
Our last update was right about the "Early Voting Begins" line. (Yes, people are already voting in Election 2020!) Our probabilistic envelopes show a very slight movement toward Biden, but things have been pretty stable. There are no big swings here.
In the categorization view, we have a few states that are bopping around near our category boundaries, and the all or nothing nature of that model means that the numbers can move a lot when a big state changes categories. But here the fact that Biden leading a state by 0.1% and Trump leading it by 0.1% really is not that much of a difference, so things are smoothed out a bit.
And we see… stasis. This view of the race has barely moved.
This view looks at the range of electoral college results we should expect though. Our tipping point by contrast essentially looks at how easily that could change.
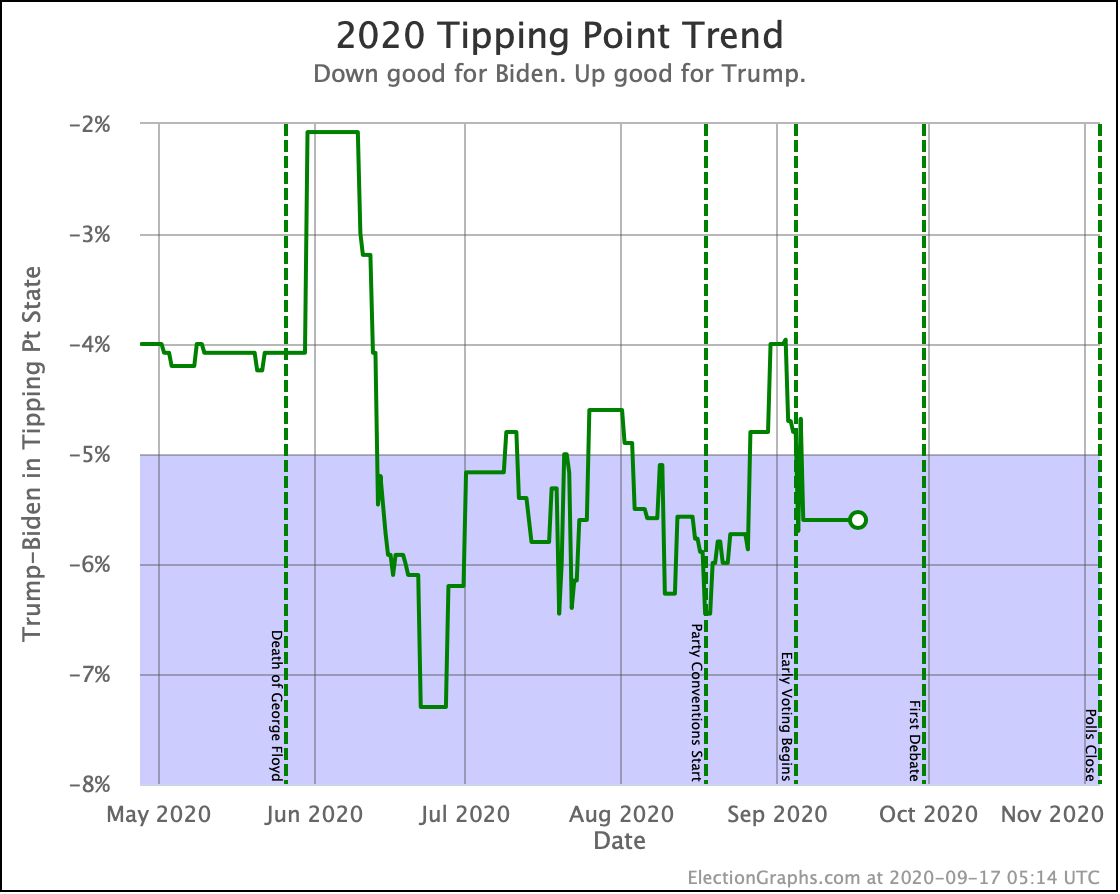
At our last update, we noted that Biden's tipping point had cratered, going from 6.5% on August 18th to only 3.3% on September 5th. As more polls came in, the 3.3% peak was actually erased. We now have Biden's low point at a 4.0% tipping point, after which he recovered to 5.6%.
3.3% is low enough you are within range of a big news event or systematic polling error erasing that lead. At 5.6%, things are a lot more secure.
But still not completely so. You only have to look at the two week period in June when Biden went from 2.1% to 7.3%. If you had a reversal of the same magnitude, Biden's tipping point lead would only be an extremely narrow 0.4%. But still, things look a lot more solid at 5.6%.
The RCP average of national polls currently shows a 5.9% Biden lead. Comparing to the 5.6% tipping point, this implies that the structure of the electoral college is currently giving Trump only a 0.3% head start, way down from 3.7% in the last update.
The spectrum of states where the margin is less than 10% now looks like this:
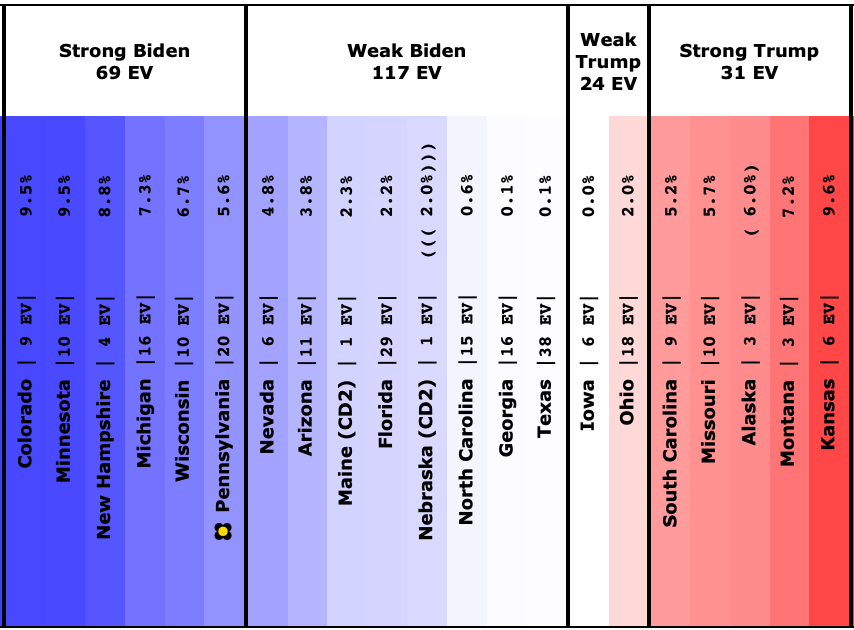
There are still LOTS of close states.
The last few updates, I've done a 2016 to 2020 comparison that looks like this:
| <48 Days Out> | 2016 | 2020 |
|---|---|---|
| Expected Case | Clinton by 130 | Biden by 240 |
| Tipping Point | Clinton by 1.6% | Biden by 5.6% |
This time I can do better, with two new graphs that have been added to the main 2020 page:
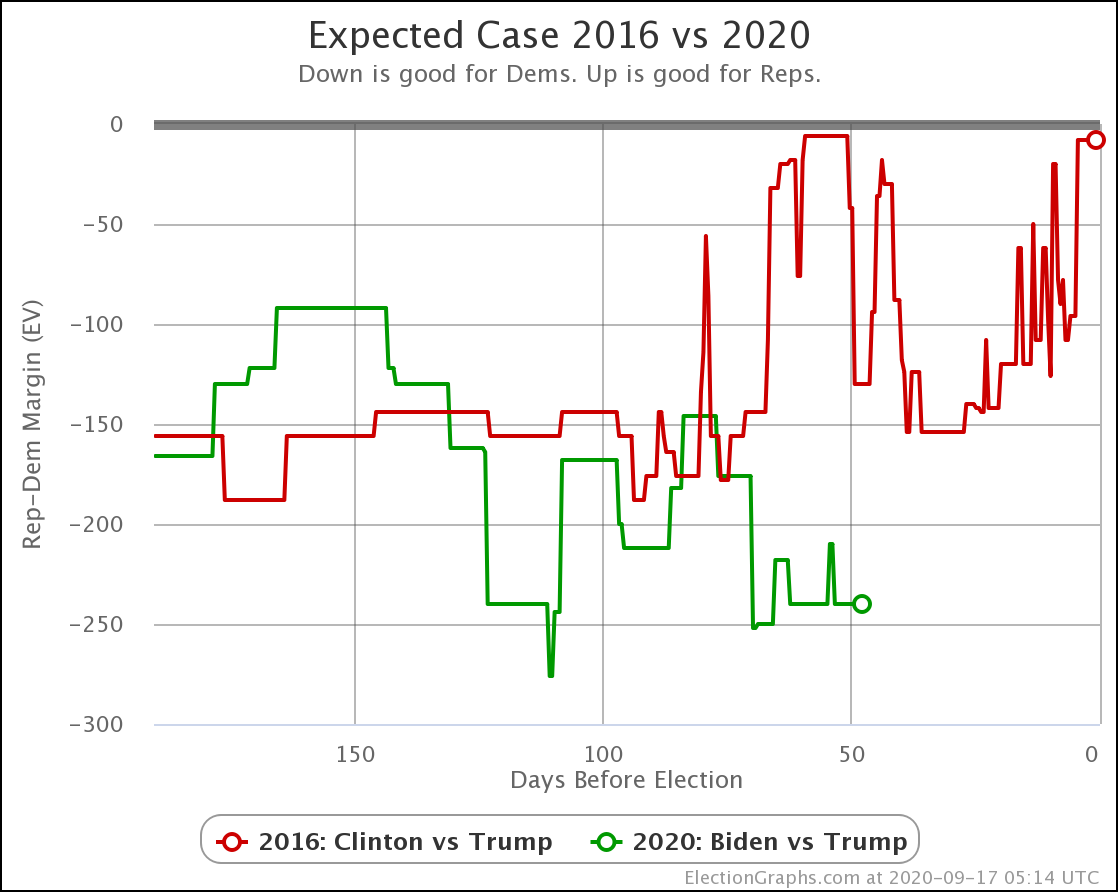
This directly compares the evolution of the expected case metric in 2020 vs 2016. Biden has not always been doing better than Clinton. It has gone back and forth.
But at the moment Biden's Expected Case is better than Clinton EVER was able to reach, not just in the time frame shown above, but looking at the entire history of 2016 polling. The best she ever achieved was a 188 electoral vote margin, which she hit twice on the graph above.
Biden is currently at 240. If that holds, it would be the biggest electoral college winning margin since Bush crushed Dukakis with a 315 electoral vote margin in 1988.
But let's look at the tipping point comparison:
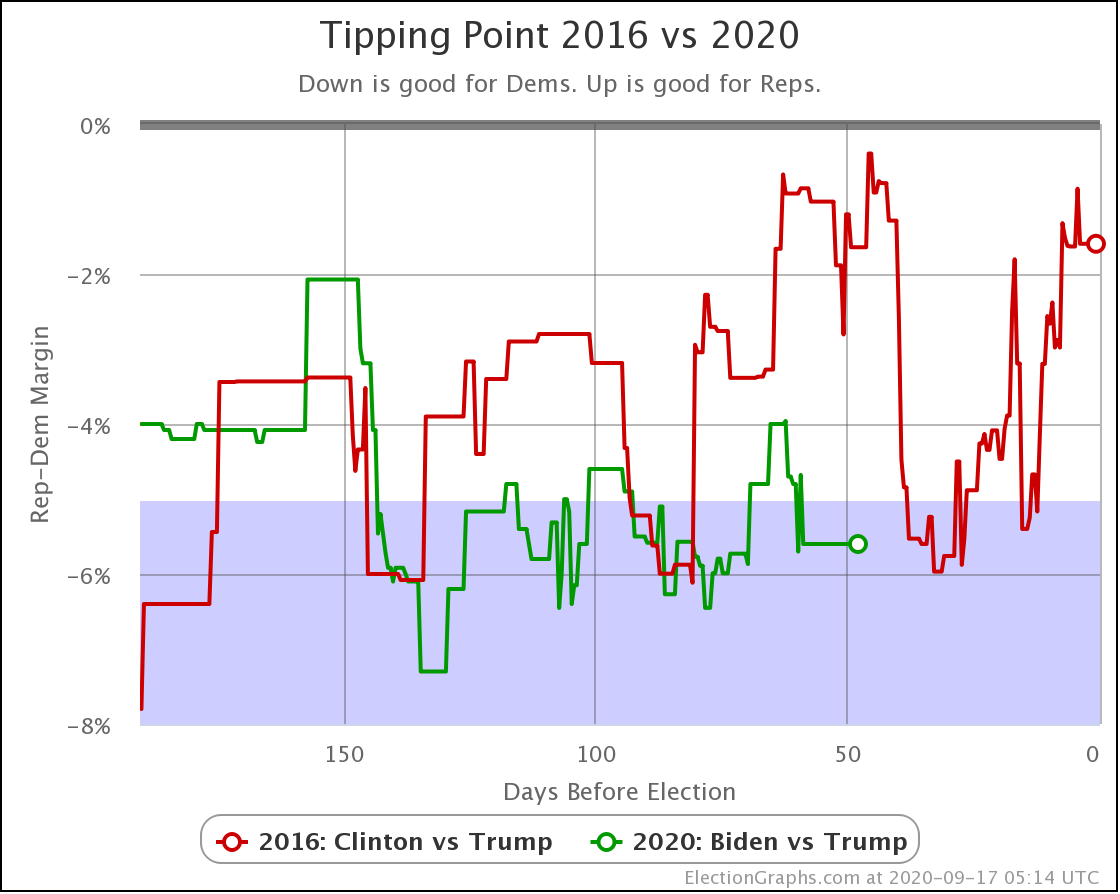
Biden is ahead of where Clinton was at this time in 2016. But this time in 2016 was one of Clinton's low points. She bounced back over the next couple of weeks. When we got to 31 days before the election her tipping point had rebounded all the way to 6.0%. That is a stronger lead than Biden has today.
But of course, over those last 30 days, you can clearly see Clinton's lead deteriorate. By the time you got to election day, it was 1.6%, which as we saw, was small enough that a little polling error in the states near the tipping point, plus some movement that happened too late for polls to capture, was enough for Trump to win.
What's different this time?
Aside from the big movement toward Biden in June, Biden's tipping point has been more stable than Clinton's. Clinton's line swung back and forth wildly. Biden is certainly jittering around a bit, but the magnitude of the movements is a lot smaller.
Election Graphs focuses on margins, but looking at the details of the polling and the actual absolute amount of support for each candidate, one big difference in 2020 vs 2016 is that we have a significantly smaller set of undecided voters now than in 2016. So the group who are available to "slosh around" and shift back and forth over time is a lot smaller.
Does that exclude the possibility of a Clinton style collapse?
No. It does not.
But it probably does mean you need a pretty huge news event to cause that kind of movement. It would not only have to make the undecideds break strongly toward Trump but also keep some current Biden supporters from voting for him, either by actually flipping or just by staying home.
The closer we get to election day, the harder this is. Just because there is less time to change people's minds. Especially since early voting has already started, and will be in full swing for the entire last month.
There were "October Surprises" that made a difference in 2016. We will see soon enough if there are similarly large and impactful events in 2020.
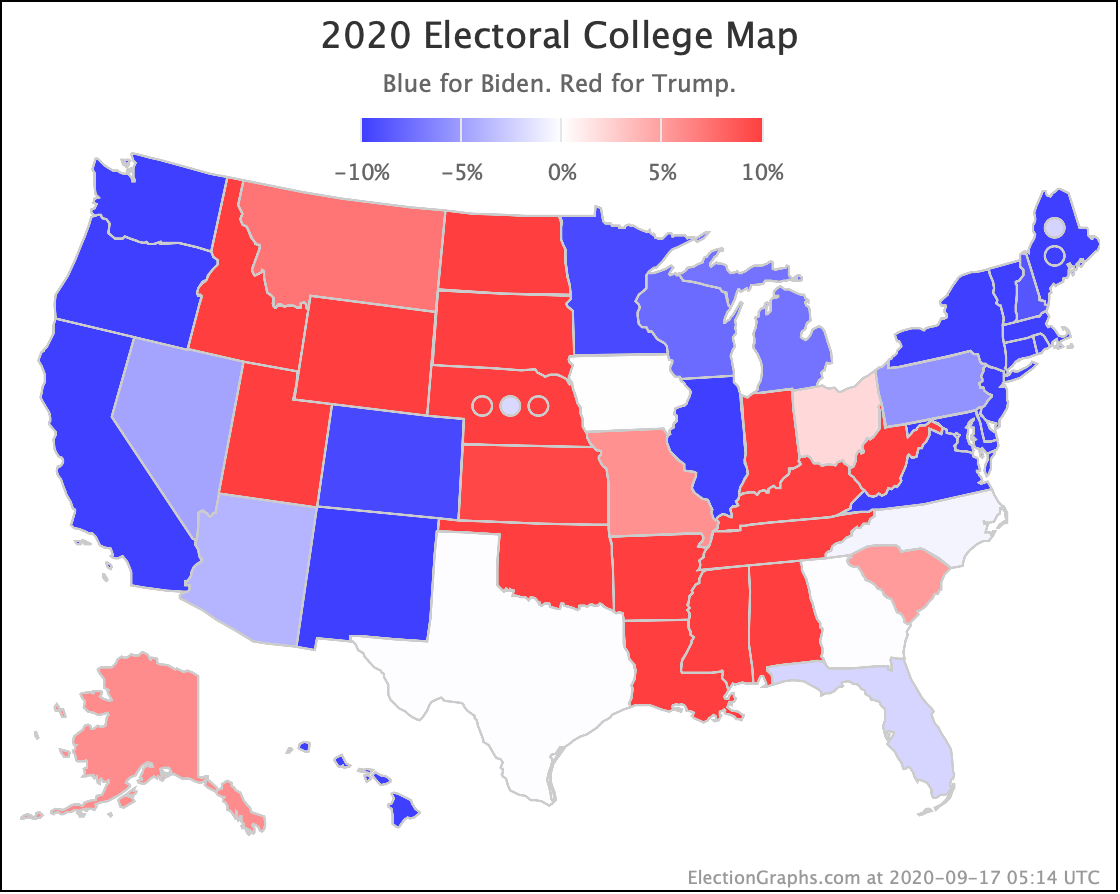
The map below is where things stand today. But it will surely change. Stay tuned!
47.6 days until the first results start coming in for Election 2020.
For more information:
This post is an update based on the data on the Election Graphs Electoral College 2020 page. Election Graphs tracks a poll-based estimate of the Electoral College. The charts, graphs, and maps in the post above are all as of the time of this post. Click through on any image for current interactive versions of the chart, along with additional details.
Follow @ElectionGraphs on Twitter or Election Graphs on Facebook to see announcements of updates. For those interested in individual poll updates, follow @ElecCollPolls on Twitter for all the polls as I add them. If you find the information in these posts informative or useful, please consider visiting the donation page.
One thought on “How Strong is Biden's Lead?”