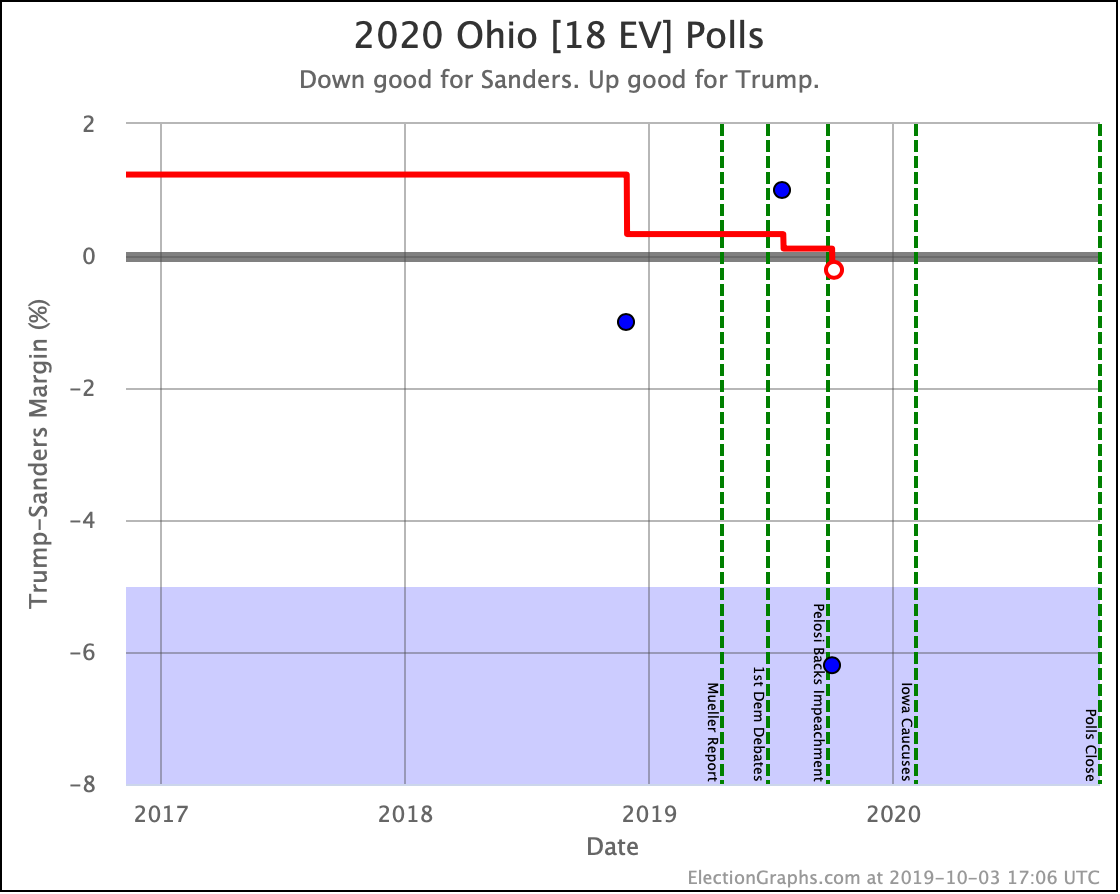
Since last week's update, there have been new polls in Montana, Connecticut, and North Carolina.
Warren vs. Trump is now the "best-polled candidate combination" based on the metric I use, so it is now the default when you go to the Election Graphs 2020 Electoral College page, displacing Biden vs. Trump.
Overall this week, Biden weakened a little bit versus Trump, but he is so far ahead at the moment it doesn't make much difference. All of the other Democrats tracked here get a little bit stronger against Trump with this week's polling.
Looking at the categorization model first, only North Carolina made a difference:
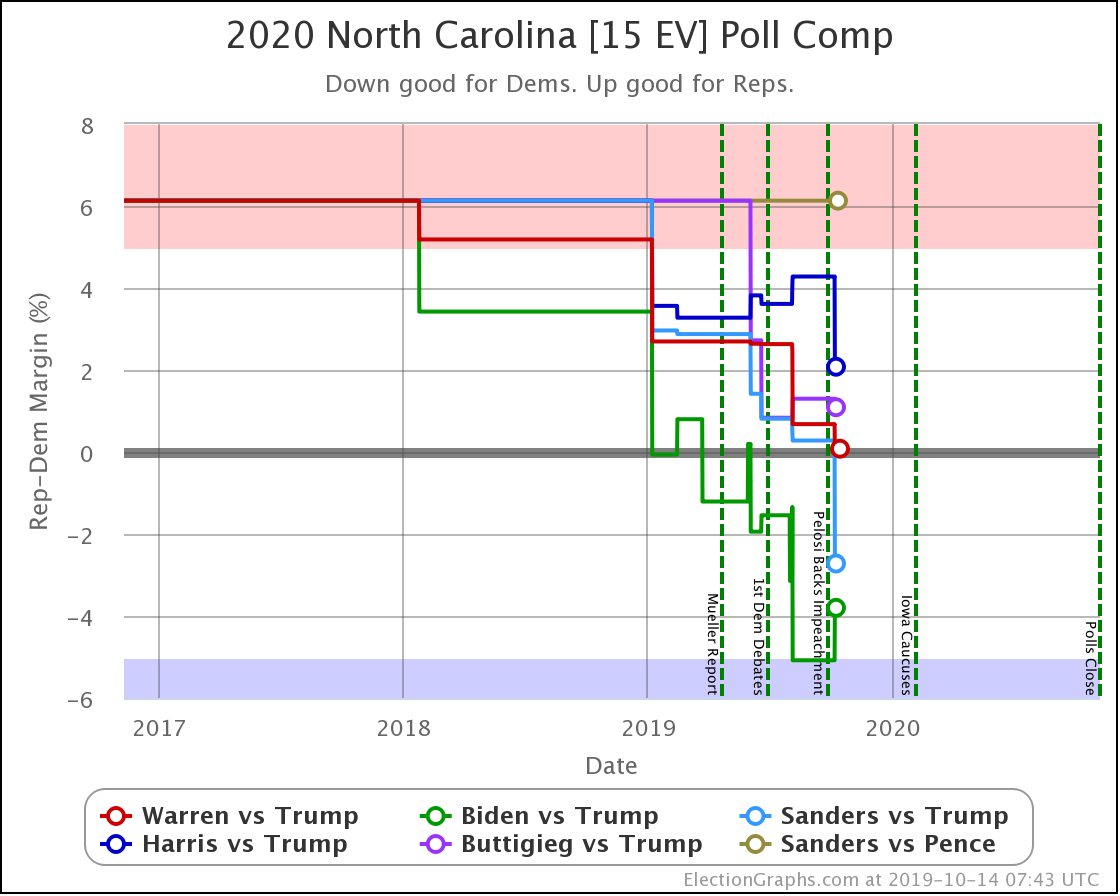
Biden's lead decreased a bit. Sanders and Harris improved a lot. Warren and Buttigieg got a little stronger.
So how did this impact the national picture?
Let's look at some graphs to illustrate the changes.
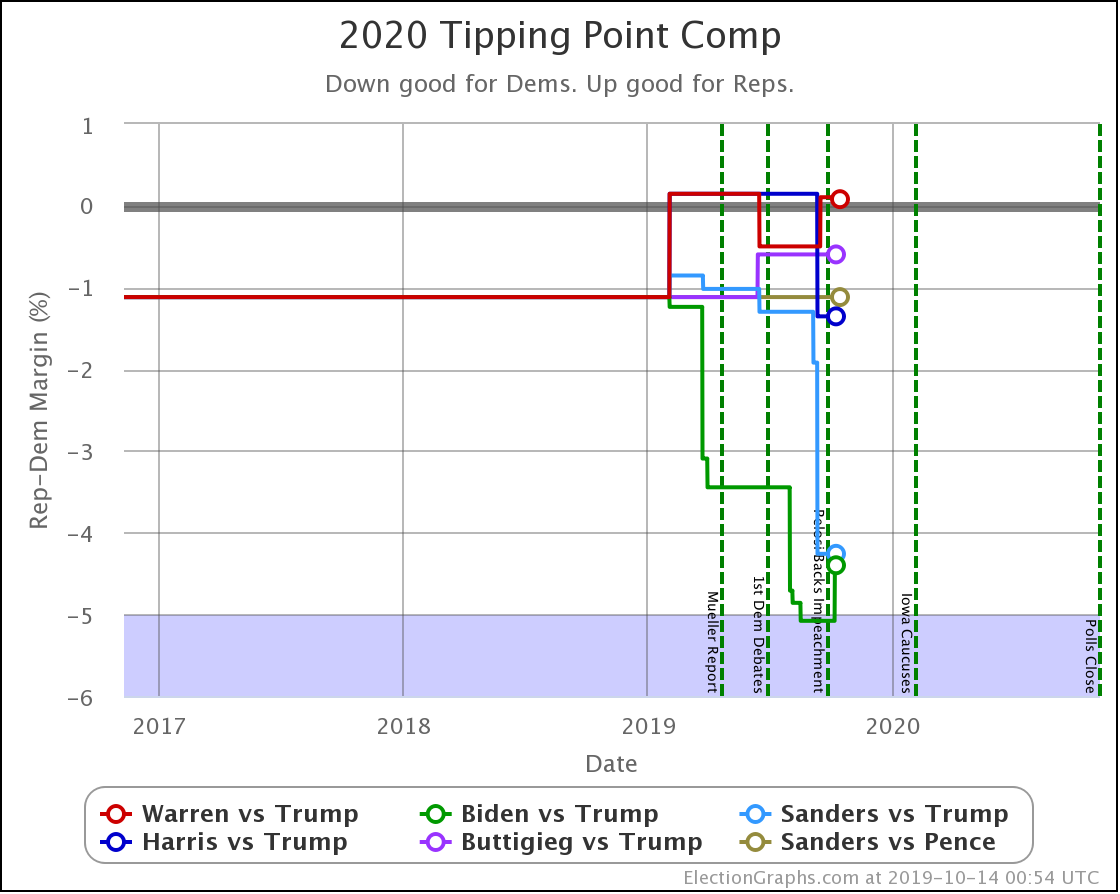
- Biden vs. Trump tipping point change: Biden by 5.1% in NC -> Biden by 4.4% in WI
- Warren vs. Trump tipping point change: Trump by 0.1% in FL -> Trump by 0.1% in NC
- Biden vs. Trump state category change: NC has moved from Strong Biden to Weak Biden
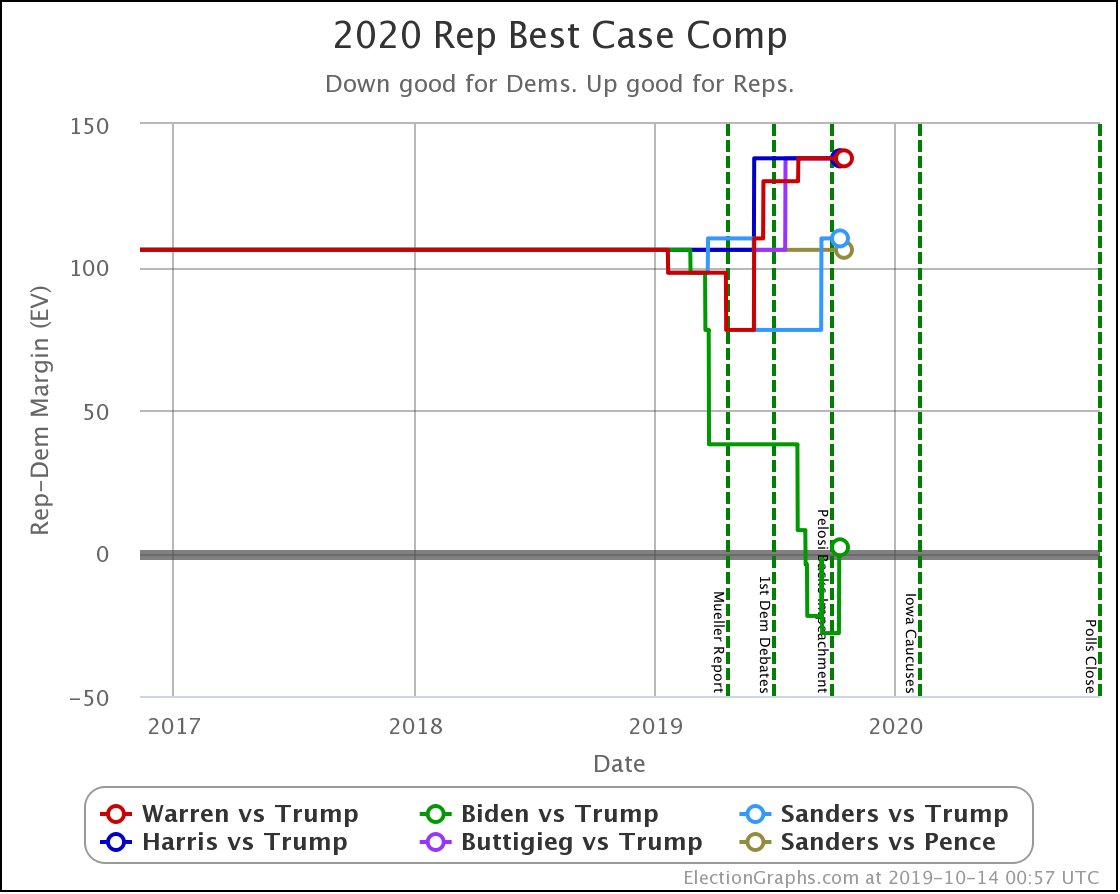
- Trump best case vs. Biden has changed: Biden 283 to Trump 255 -> Biden 268 to Trump 270
So the categorization model once again has the "best case" in Biden vs. Trump include a Trump win if he wins ALL of the swing states because Biden's lead in North Carolina slipped to below the 5% mark, bringing it back into play.
- Sanders vs. Trump state category change: NC has moved from Weak Trump to Weak Sanders
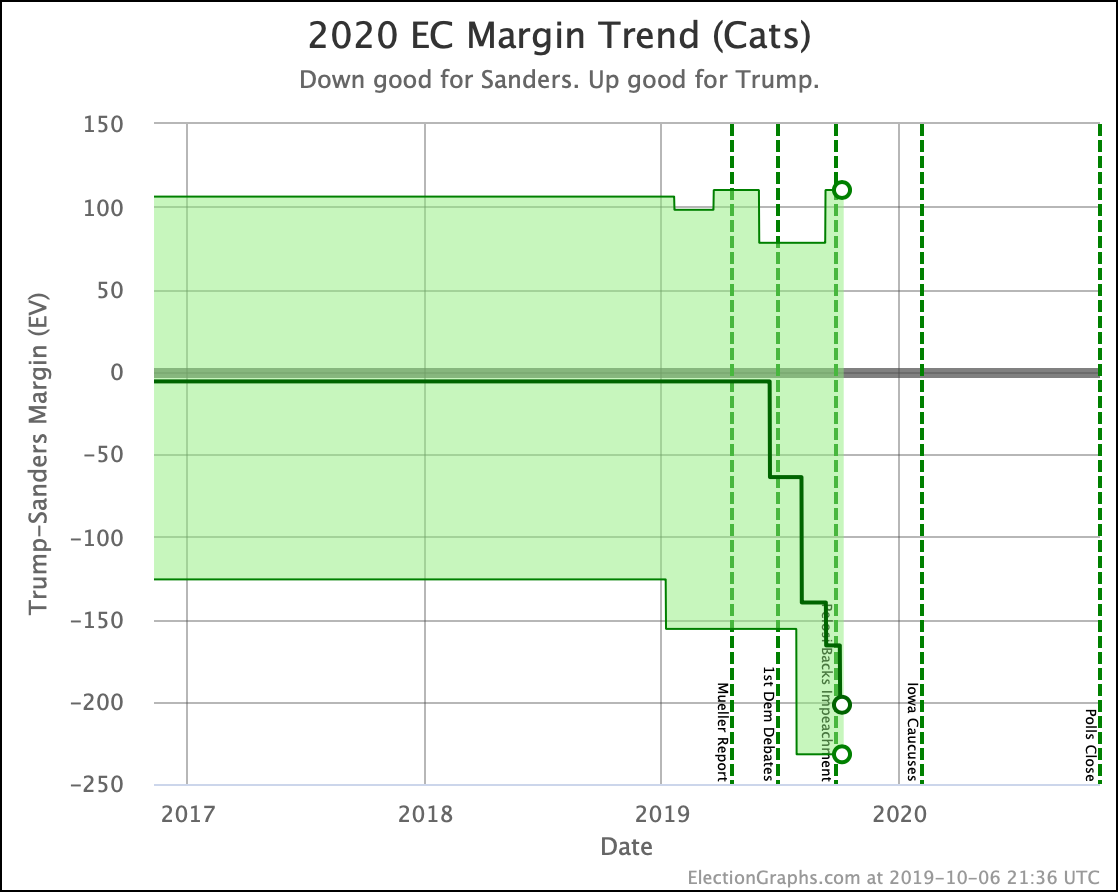
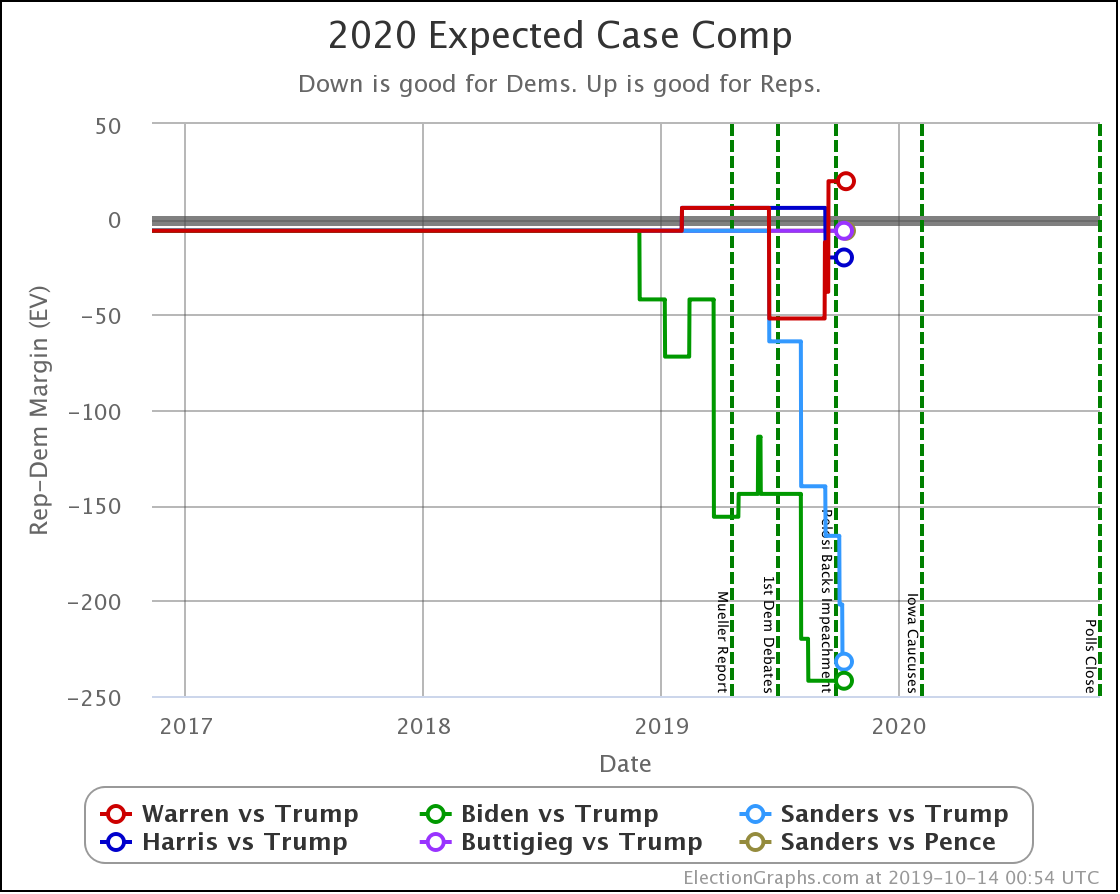
- Sanders vs. Trump expected case change: Sanders 370 to Trump 168 -> Sanders 385 to Trump 153
In terms of the expected case, where everybody wins every state where they lead the average, with Sanders now taking the lead in North Carolina, he would win by 232 electoral votes, nearly matching Biden's 242 electoral vote margin in this scenario.
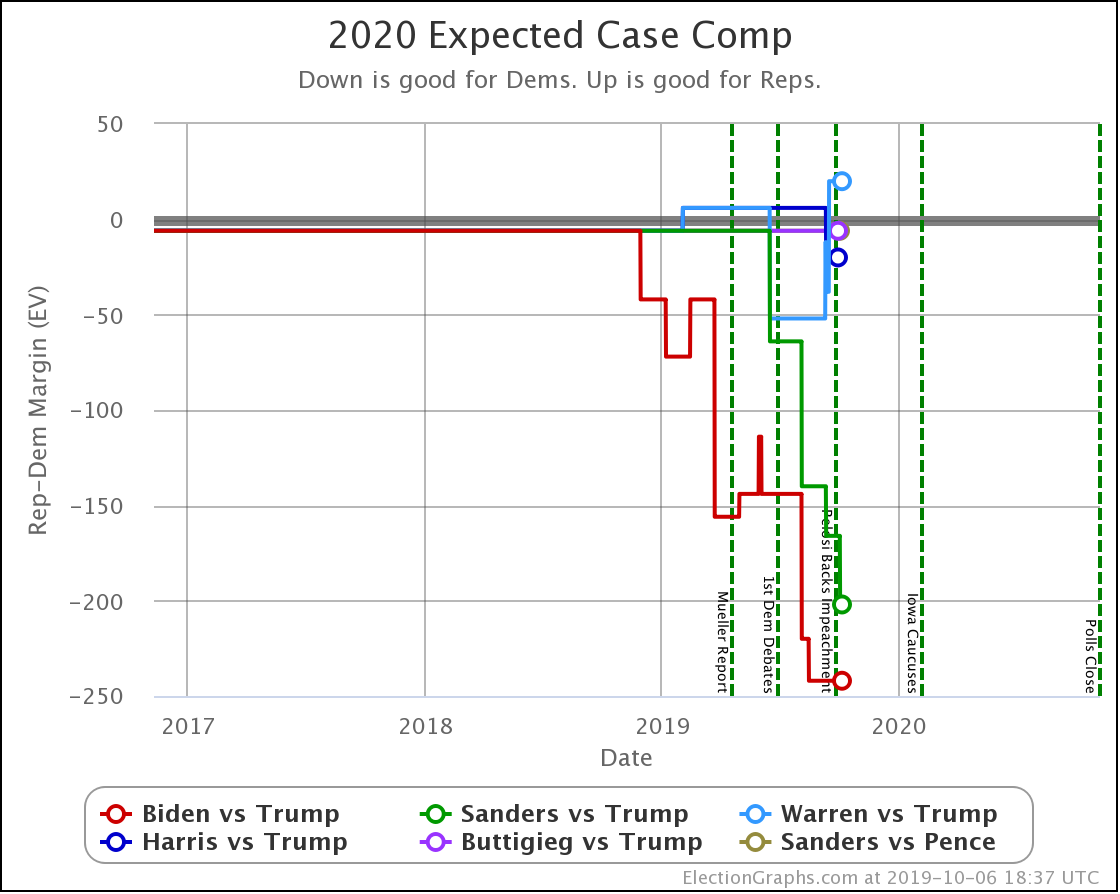
In this expected case, Biden and Sanders have substantial leads over Trump. Harris and Buttigieg have very narrow edges. (As does Sanders against Pence.) Warren loses to Trump.
The picture from the tipping point is very similar.
Time to flip to the probabilistic model. How do things look this week?
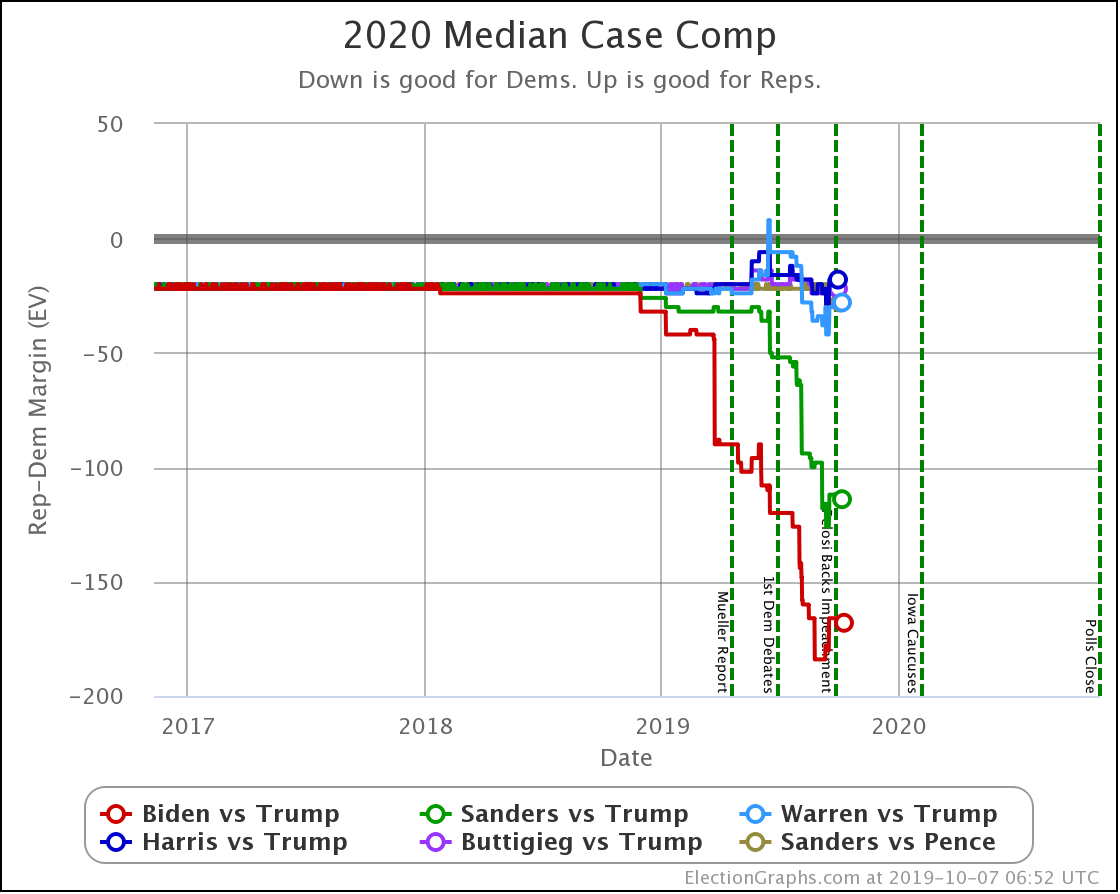
Since we were looking at the "expected case" in the categorization model, let's look at the median Monte Carlo result first:
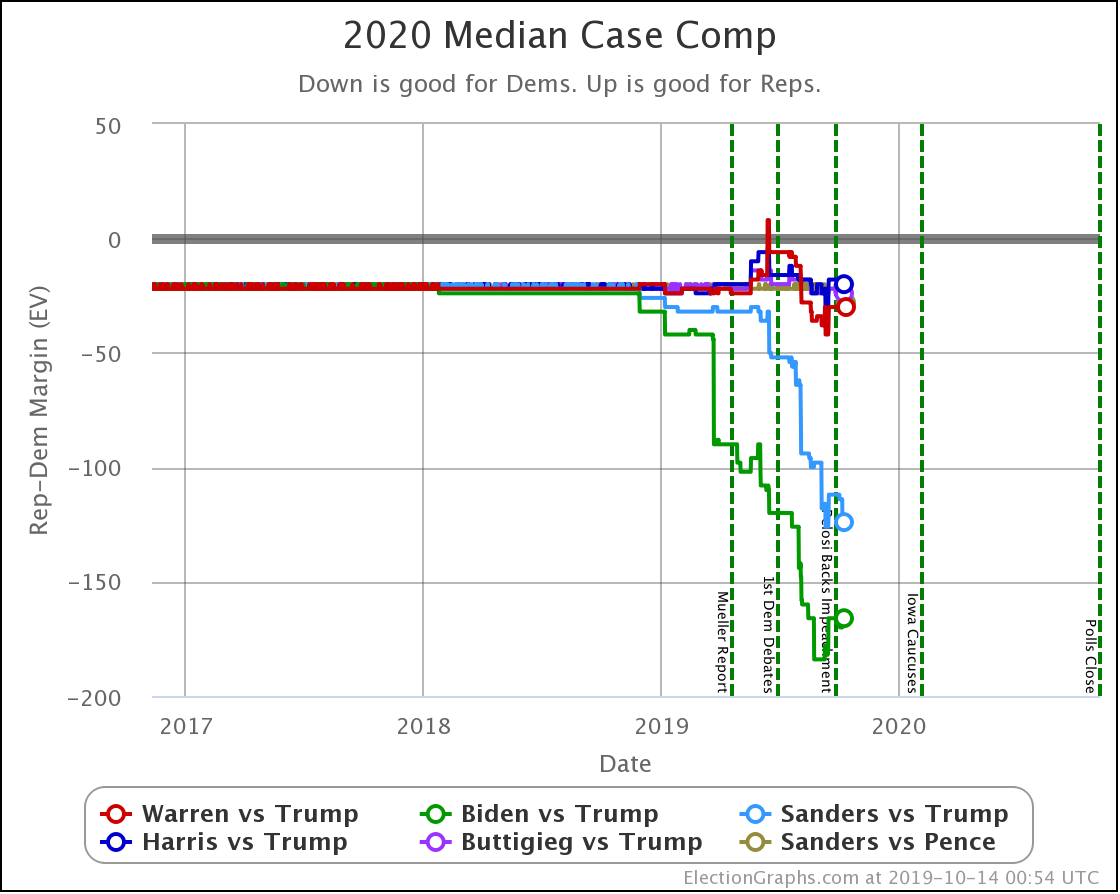
| Dem | 6 Oct | 13 Oct | 𝚫 |
| Biden | +170 | +166 | -4 |
| Sanders | +114 | +124 | +10 |
| Warren | +28 | +30 | +2 |
| Buttigieg | +22 | +24 | +2 |
| Harris | +18 | +20 | +2 |
All of the above vs. Trump. Sanders vs. Pence flat at +28.
Unlike the categorization view, all of the Democrats lead here, although we once again see a situation where Biden and Sanders have very substantial leads, while Warren, Buttigieg, and Harris have very narrow edges.
Biden slips just a little this week, while Sanders has the biggest gain in terms of the median electoral vote margin.
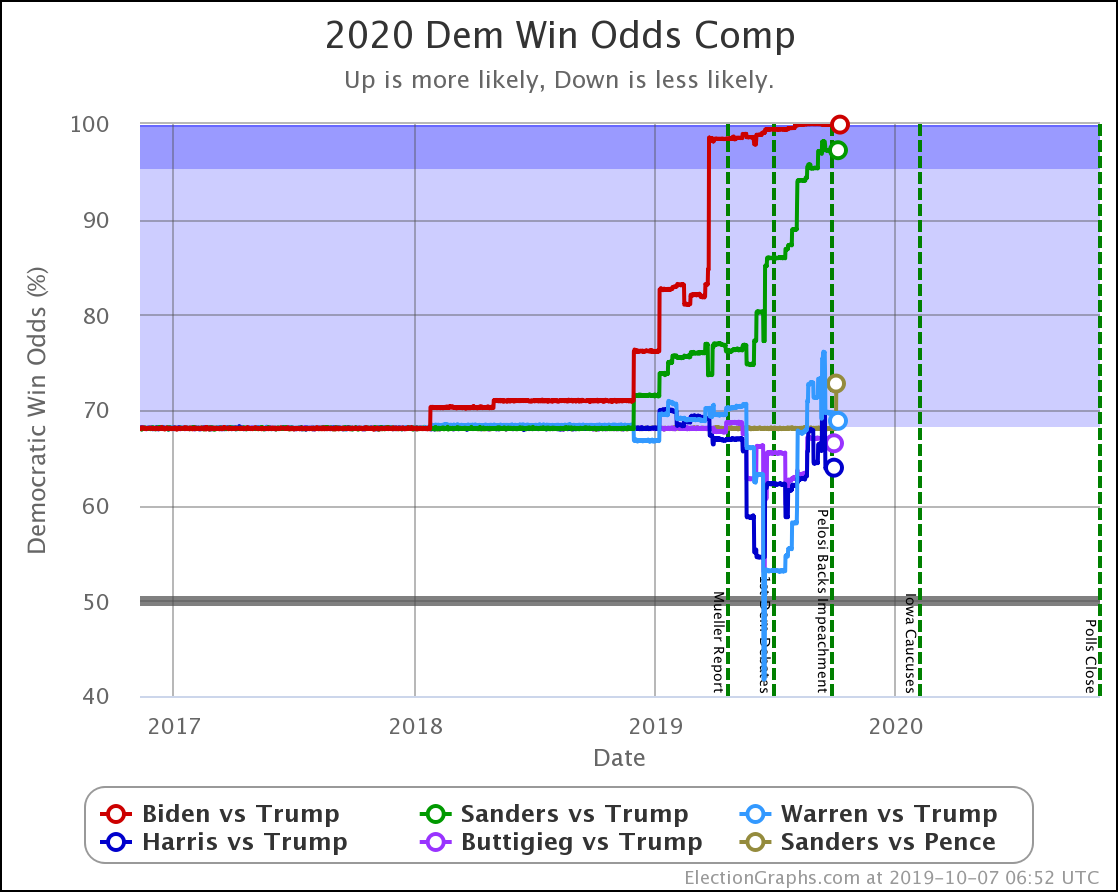
And now the odds:
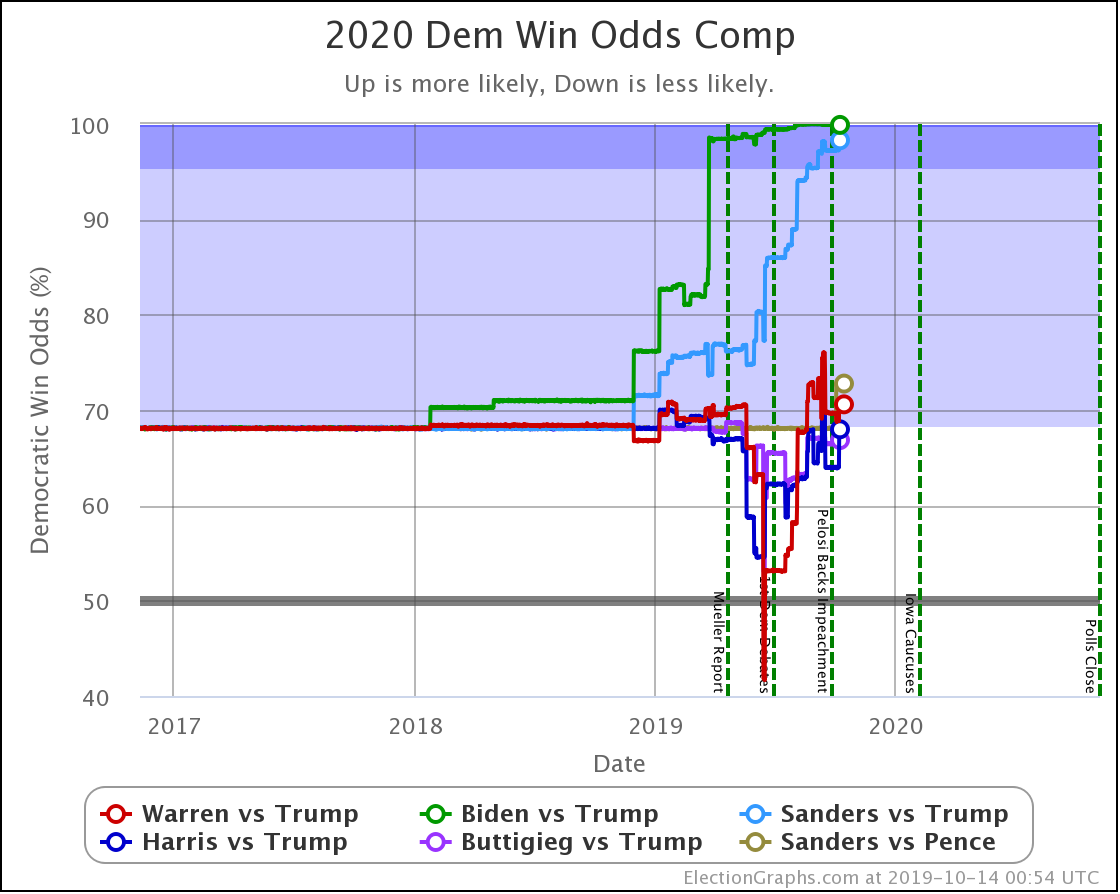
| Dem | 6 Oct | 13 Oct | 𝚫 |
| Biden | 99.9% | 99.9% | Flat |
| Sanders | 97.3% | 98.3% | +1.0% |
| Warren | 68.9% | 70.6% | +1.7% |
| Harris | 64.0% | 68.0% | +4.0% |
| Buttigieg | 66.5% | 66.8% | +0.3% |
All of the above vs. Trump. Sanders vs. Pence flat at 72.8%.
Biden has a substantial enough lead that the little change this week doesn't have a notable impact on his percentage chances.
As Sanders' position in the various state polls continues to improve, he is rapidly catching Biden in terms of how solid his lead over Trump looks.
Harris improves the most this week, but Warren, Harris, and Buttigieg remain stuck in the high 60's, low 70's. Certainly favored to win over Trump, but by no means sure things.
To date, the most common explanation for this division has been name recognition. People know Biden and Sanders. Aside from political junkies, like anybody who might be reading this, "normal" people still aren't paying attention yet, and when polled about these other names may not have a good idea who they are.
The further along we get though, the less likely that is to explain things thoroughly. Now, some national polls have started to show that the gap between Warren and Biden in their performance vs. Trump has been decreasing as Warren gains in the Democratic primary competition. If so, this has been a relatively recent change, and will still take a while before we can see this in the state-level polls we look at here at Election Graphs.
If these kinds of differences persist when we get to actual caucus and primary voting in February, however, then it might be time to acknowledge that there could be real differences in how well the various Democratic candidates could be expected to fare in a general election.
386.6 days until polls start to close on Election Day 2020.
For more information:
This post is an update based on the data on the Election Graphs Electoral College 2020 page. Election Graphs tracks a poll-based estimate of the Electoral College. The charts, graphs, and maps in the post above are all as of the time of this post. Click through on any image to go to a page with the current interactive versions of that chart, along with additional details.
Follow @ElectionGraphs on Twitter or Election Graphs on Facebook to see announcements of updates. For those interested in individual poll updates, follow @ElecCollPolls on Twitter for all the polls as I add them. If you find the information in these posts informative or useful, please consider visiting the donation page.