
Since the last update on April 22nd, there have been new state-level polls in Florida (x2), Michigan (x6), Pennsylvania (x6), Wisconsin (x3), New Jersey (x2), North Carolina (x5), New Mexico, Texas (x3), New York (x2), Ohio, Utah, Montana (x2), Kansas, Georgia (x2), New Hampshire, Iowa, Colorado (x2), Nevada, Connecticut, and Massachusetts (x2).
Whew. That is a lot. I should probably start adapting my posting schedule to do these blog posts a bit more often, as we are now less than six months from the election, and polls are coming out more and more frequently. As a reminder though, you can always go to the main 2020 Electoral College page to see the up to moment version of all the data.
Let's start with the table summarizing the changes since the last update, and then we'll get to the graphs:
| Model | Metric | 22 Apr | 9 May | 𝚫 |
| Categories | Trump Best Expected Biden Best |
Trump +72 Biden +126 Biden +286 |
TIED Biden+166 Biden +286 |
Biden +72 Biden +40 Flat |
| Tipping Point | Biden +2.0% | Biden +4.2% | Biden +2.2% | |
| Probabilities | Trump 2σ Median Biden 2σ |
Trump +26 Biden +80 Biden +204 |
Biden +36 Biden +130 Biden +240 |
Biden +62 Biden +50 Biden +36 |
| Trump Win Tie Biden Win |
6.5% 0.5% 93.0% |
0.2% 0.0% 99.8% |
-6.3% -0.5% +6.8% |
Looky there. Everything is moving toward Biden this time.
The current map looks like this:
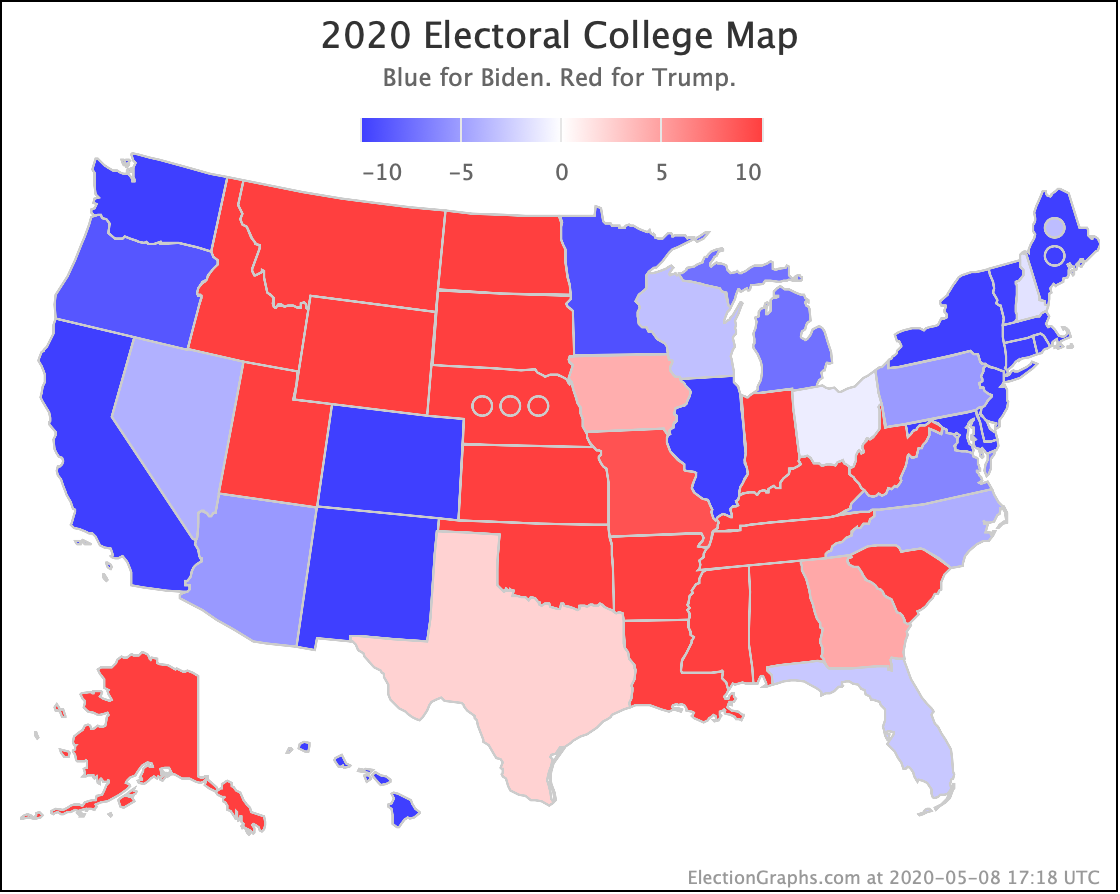
That is a pretty nice map for Biden.
Now it is graph time.
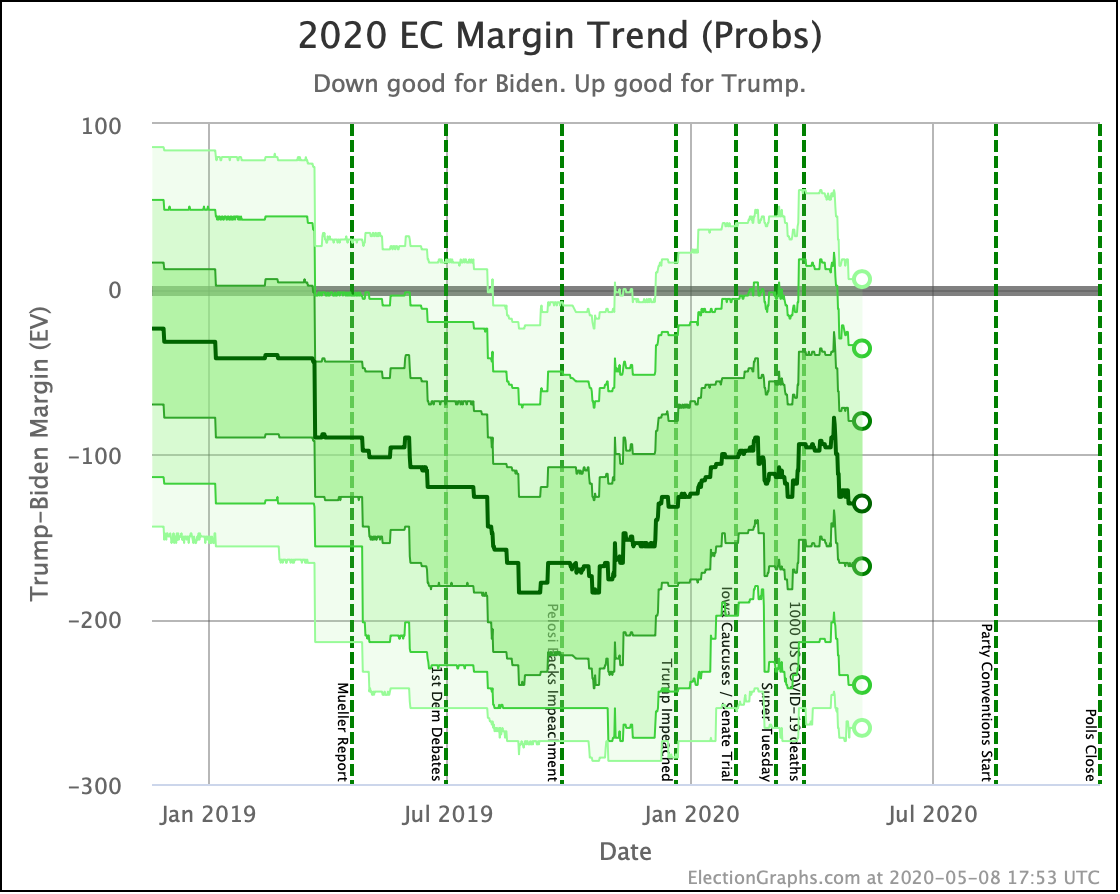
Right around the time COVID-19 became big news at the end of March, there was a wave of good polls for Trump. I speculated that this might have been a "crisis bump". There is no good way to tell for sure that was the reason for the move, but from March 15th to April 17th Trump gained 48 electoral votes in his median margin in our Monte Carlo simulation using state poll averages to look at the electoral college.
Almost the moment I posted that last update on April 22nd though, the tide turned, with almost every new poll strengthening his position in the state averages. Biden pulled back the 48 electoral votes of margin, plus 4 more.
In terms of the median margin in our simulations, Biden is now back where he was in mid-December. Still not as strong as he looked last fall, but certainly an improvement over a few weeks ago.
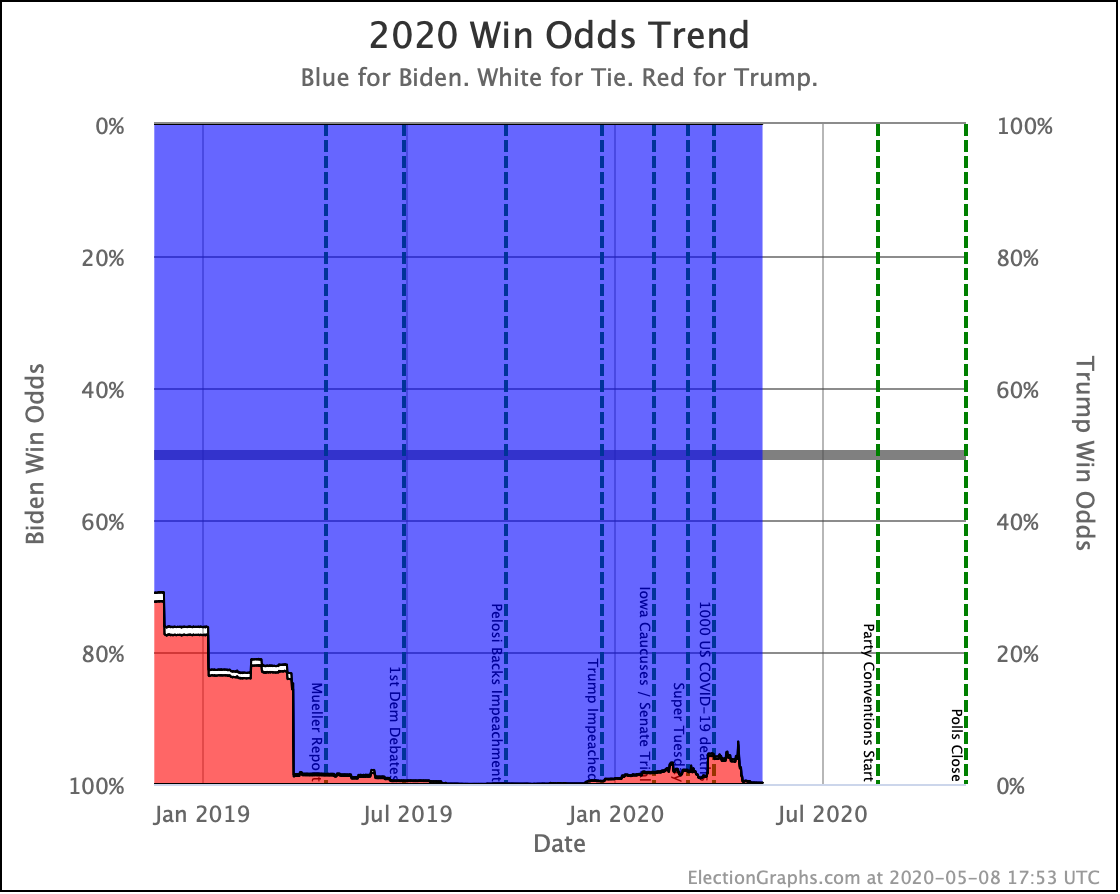
The odds of Biden winning if the election was today are once again at 99.8%, so close to 100% it is hard to distinguish on a chart like this. This chart is actually rather boring when it is like this.
But this is the part in the post when I emphasize that the election is NOT held today, and things can change rather rapidly.
The two charts above did not exist on Election Graphs four years ago, so time to look at the ones that did:
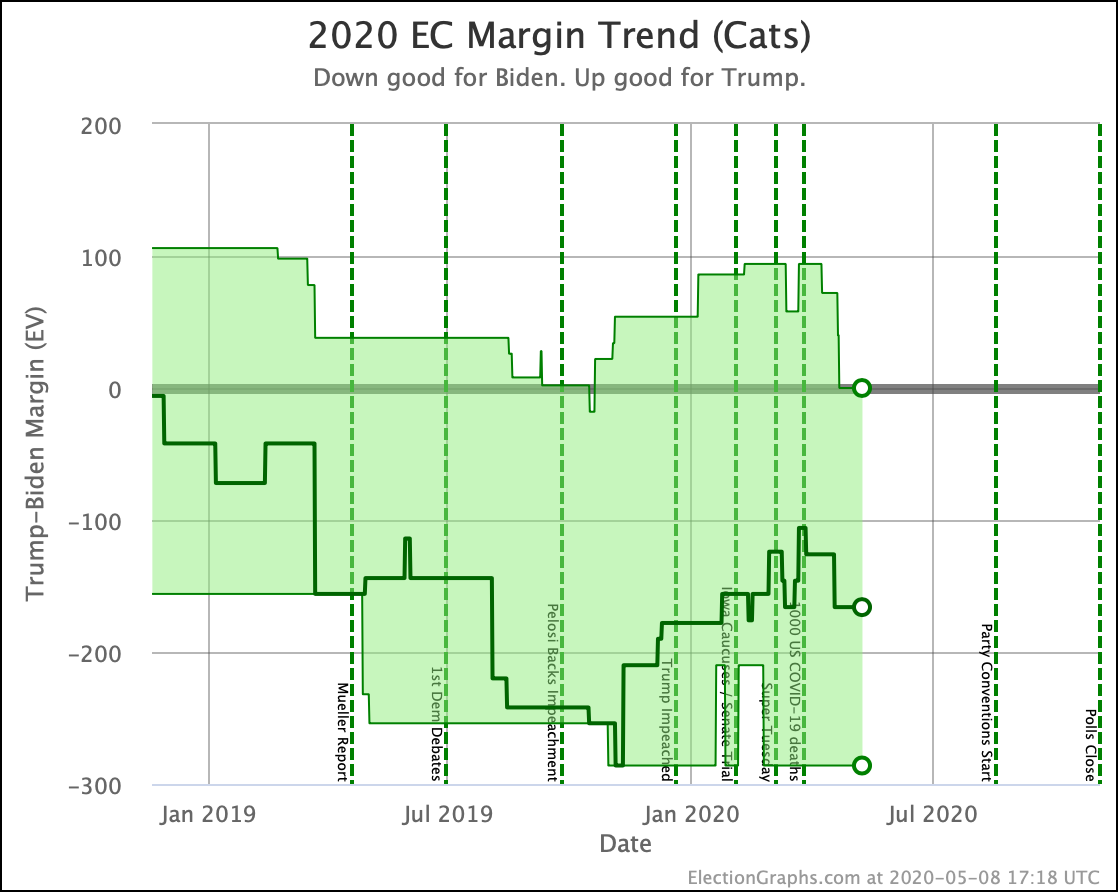
This is the categorization view. The centerline is where every candidate wins every state where they lead in the poll average. The upper and lower bounds are if all the close states go in one direction or the other. On this measure, Biden currently wins by 166 electoral votes.
We have 179 days left until election night.
So let's get in the time machine and look at the last 179 days of the 2016 election…
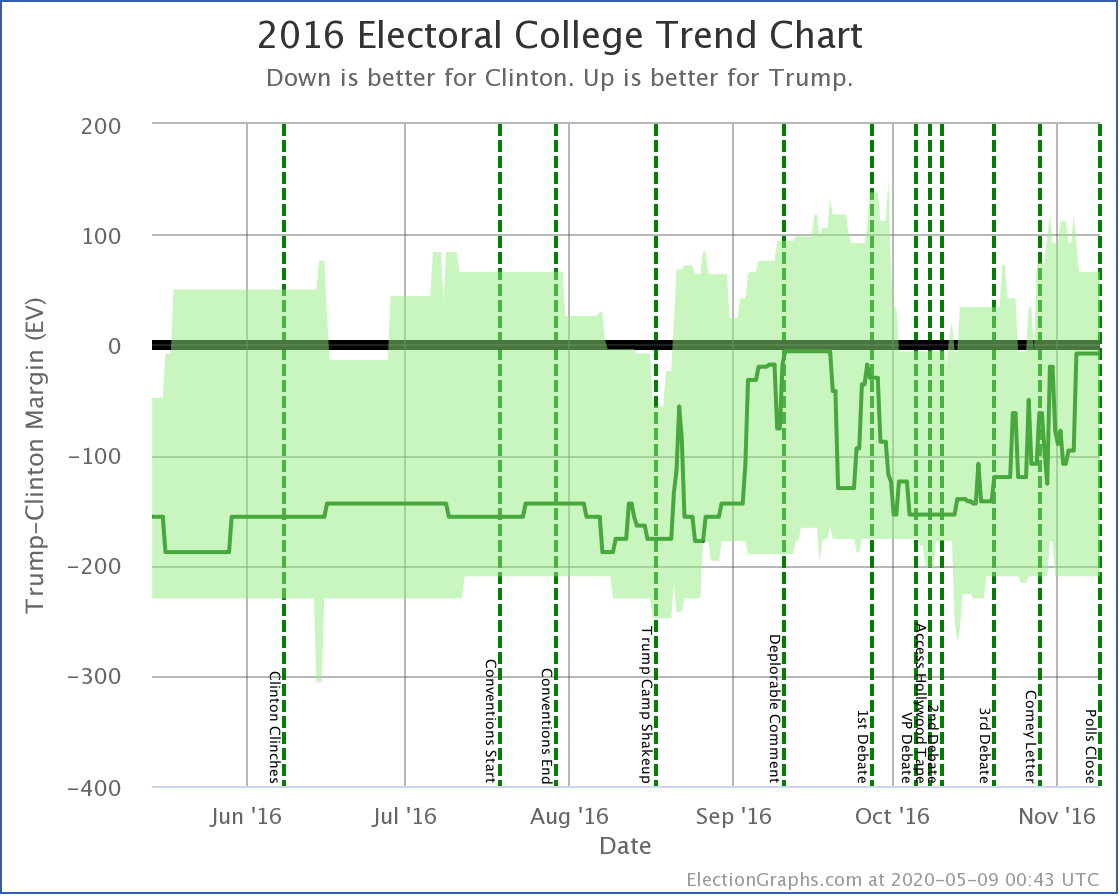
179 days out, on this same metric, Clinton led by 156 electoral votes. Not quite as good as Biden is right now. But close. She maintained this lead until the end of August, then lost almost all of it in the first half of September, only to rally back in late September and early October, followed by a collapse in the last month before the election. She ended up losing by a 77 electoral vote margin. (It would only have been 74 if not for faithless electors.)
When I say things can change a lot during the course of the campaign, this is the kind of volatility we can expect. Things change and change rapidly. We should expect this.
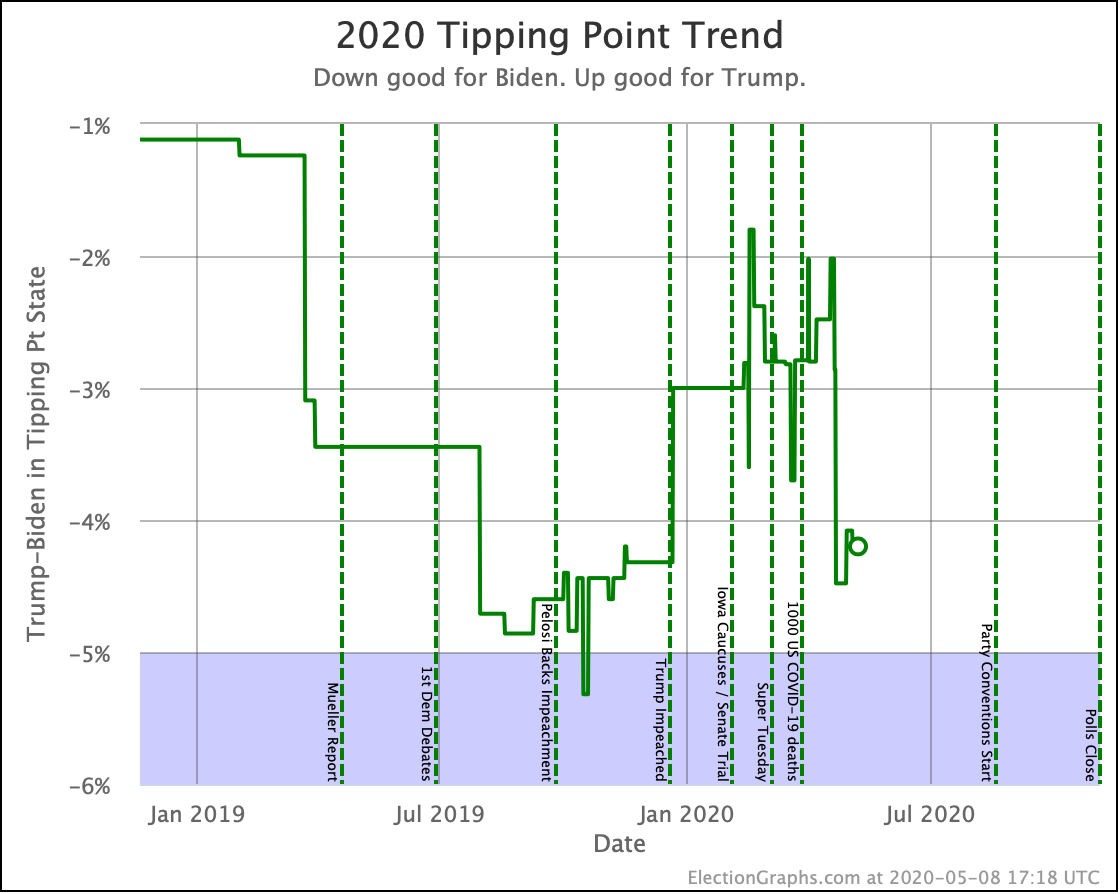
The tipping point is the metric I point to as a way to measure how precarious the current situation is, regardless of the 99.8% chance of winning if the election was today.
Biden now leads by 4.2% in the tipping point metric. Much better than he was when we did our last update, but once again, let's compare to 2016:
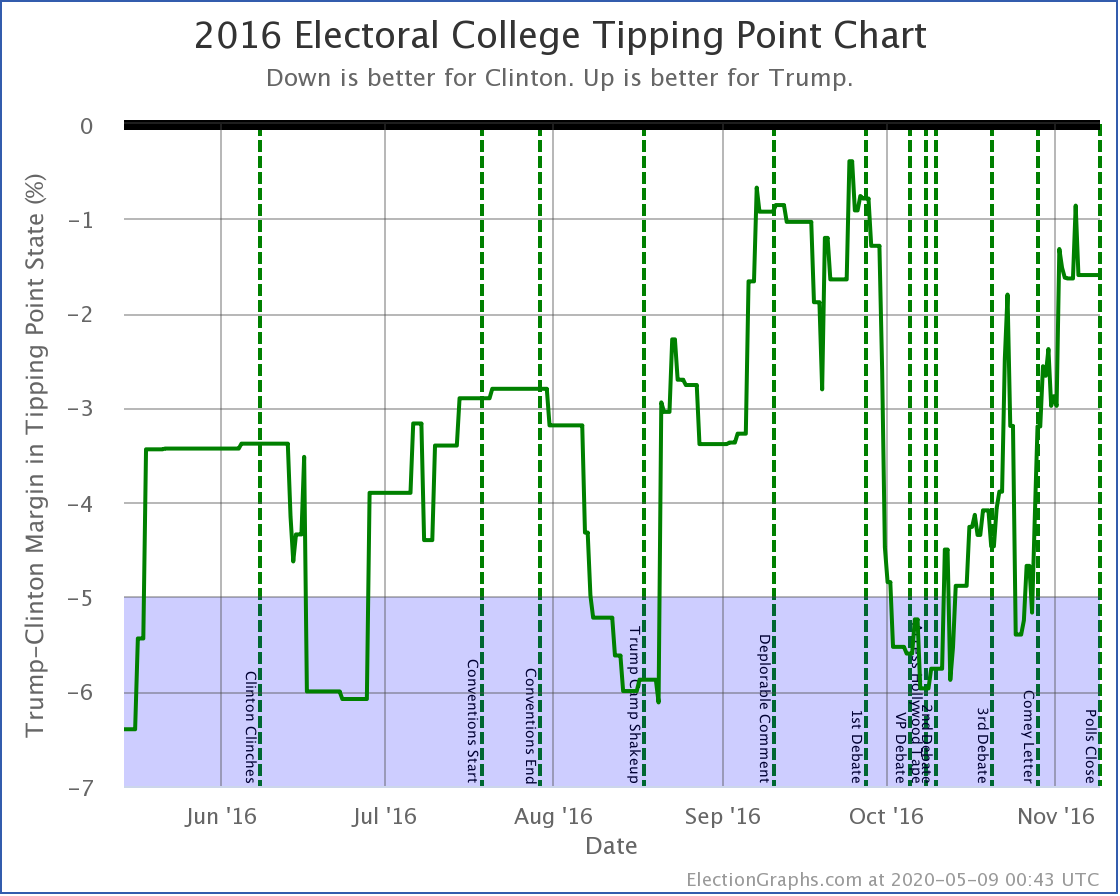
179 days before the 2016 election, Clinton had a 6.4% lead in her tipping point state. On this metric, she was much stronger at this point than Biden's 4.2%.
The tipping point metric is much more volatile than the "expected case". Clinton goes from leading by 6.4% to only leading by 0.4%, then rallies back to lead by 6.0%, only to have it all collapse again in the last month. The actual tipping point in the election results was an 0.8% Trump win.
That final collapse didn't start until the second week of October.
Everything changed in the last month.
We have a long way to go.
178.9 days until polls start to close.
For more information:
This post is an update based on the data on the Election Graphs Electoral College 2020 page. Election Graphs tracks a poll-based estimate of the Electoral College. The charts, graphs, and maps in the post above are all as of the time of this post. Click through on any image for current interactive versions of the chart, along with additional details.
Follow @ElectionGraphs on Twitter or Election Graphs on Facebook to see announcements of updates. For those interested in individual poll updates, follow @ElecCollPolls on Twitter for all the polls as I add them. If you find the information in these posts informative or useful, please consider visiting the donation page.