
Another four weeks or so has gone by since I posted so it seems like it is time for another update. Once we are hot and heavy in the depths of 2024, there will probably be more frequent updates. For now, every four weeks seems sufficent. It may even be too frequent. State level polling is still relatively sparse, and changes to the various metrics we track here come slowly.
In the last four weeks there have been 28 new data points added to Election Graphs. There were 13 polls for Biden vs DeSantis (GAx2, NVx2, AZ, VA, CO, NM, MN, PA, TN, TX, WI), 12 polls for Biden vs Trump (GAx2, NVx2, AZ, VA, CO, NM, MN, TN, TX, WI), 2 polls for Biden vs Pence (AZ, GA), and 1 poll for Kennedy vs DeSantis (PA).
If you want updates on each and every poll as it comes out, as well as daily summaries of the status for the best polled matchup (currently Biden vs Trump), follow Election Graphs on Mastodon.
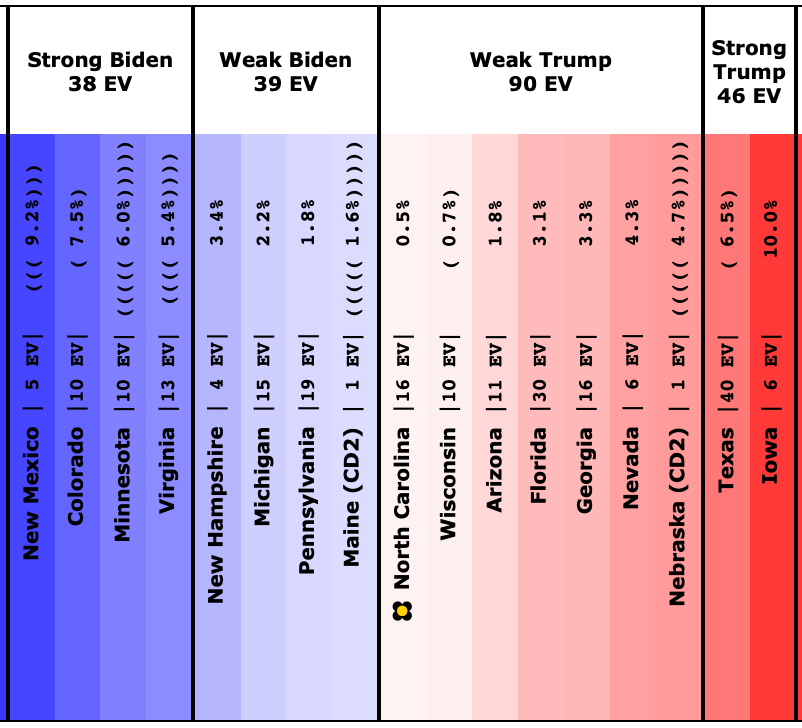
Let's start again with the "spectrum of close states" for Biden vs Trump.
Last time on 2023-04-24 it looked like this:
And now on 2023-05-21:
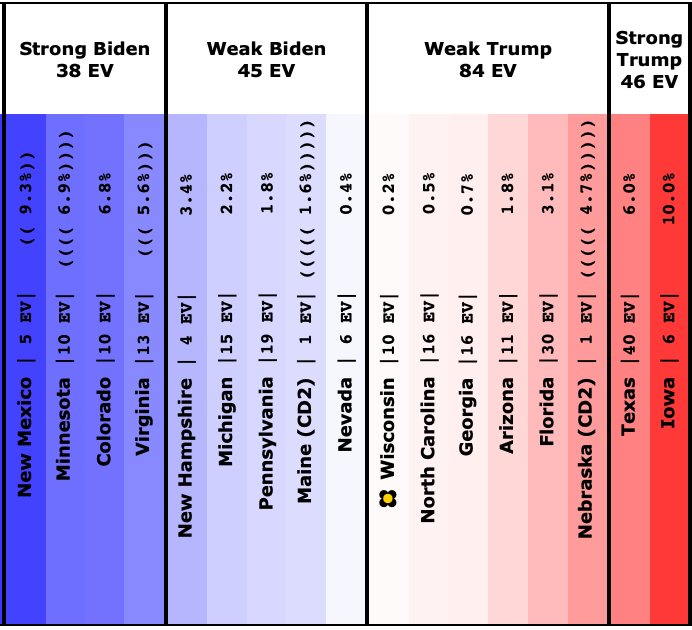
So here are the changes:
- Colorado: Biden by 7.5% -> Biden by 6.8% (Trump +0.7%)
- Virginia: Biden 5.4% -> Biden by 5.6% (Biden +0.2%)
- Texas: Trump by 6.5% -> Trump by 6.0% (Biden +0.5%)
- Wisconsin: Trump by 0.7% -> Trump by 0.2% (Biden +0.5%)
- Minnesota: Biden by 6.0% -> Biden by 6.9% (Biden +0.9%)
- Georgia: Trump by 3.3% -> Trump by 0.7% (Biden +2.6%)
- Nevada: Trump by 4.3% -> Biden by 0.4% (Biden +4.7%)
6 out of 7 of the close states with changes moved toward Biden.
Now out of these, only one jumped categories in our categorization view: Nevada.
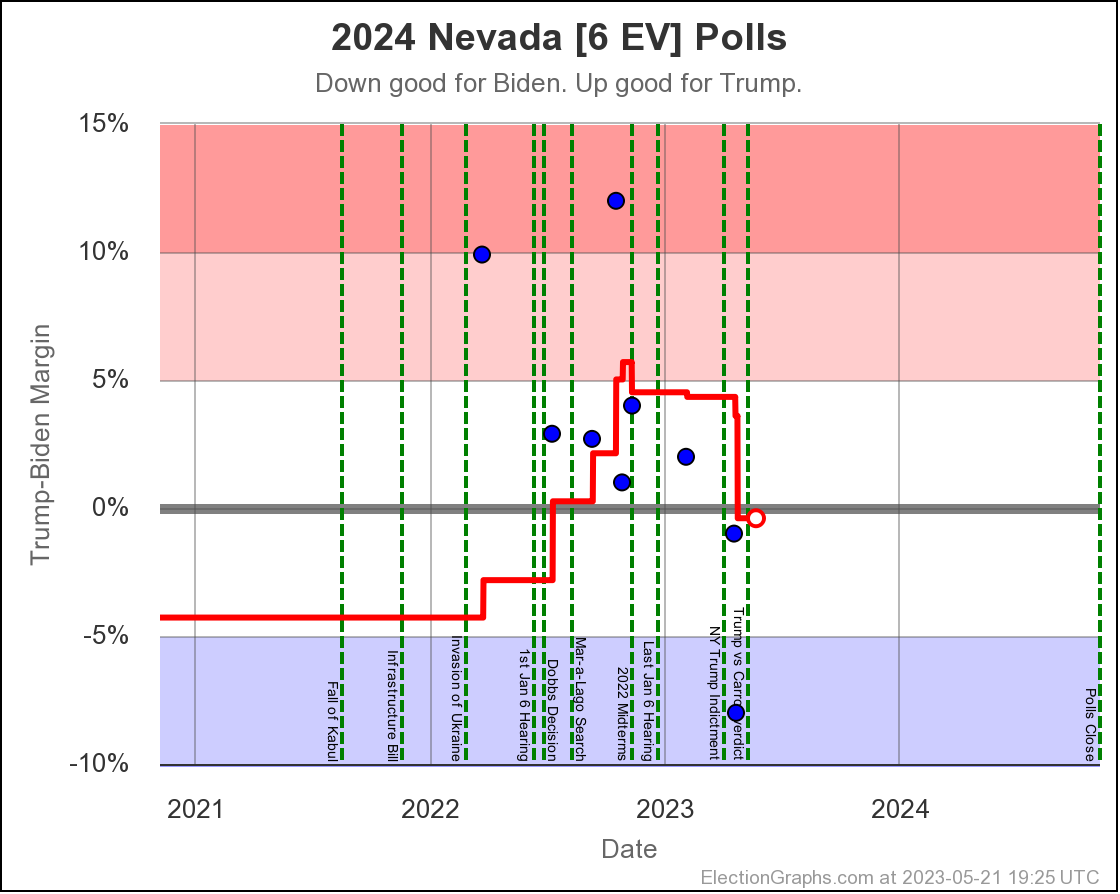
Here on Election Graphs, we usually use a five poll average (to understand when there are exceptions, read the FAQ). You can see that what happened here is that what looks like an outlier leaning toward Trump was replaced in the "last five polls" by an outlier that leans toward Biden, thus moving the average significantly toward Biden. But this leaves us JUST BARELY on the Biden side of the fence. The next poll in Nevada could easily flip the state back to the red side. Or it could show that this was no outlier, but a harbinger of a new trend. Too soon to tell.
Also relevant, based on the historical performance of Election Graphs averages since 2008, the 0.4% Democratic lead here still only translates into a 41.1% chance of a Biden win in the state. More often than not since 2008, when Democrats have led a state with this small an Election Graphs average, the Republican has actually ended up winning.
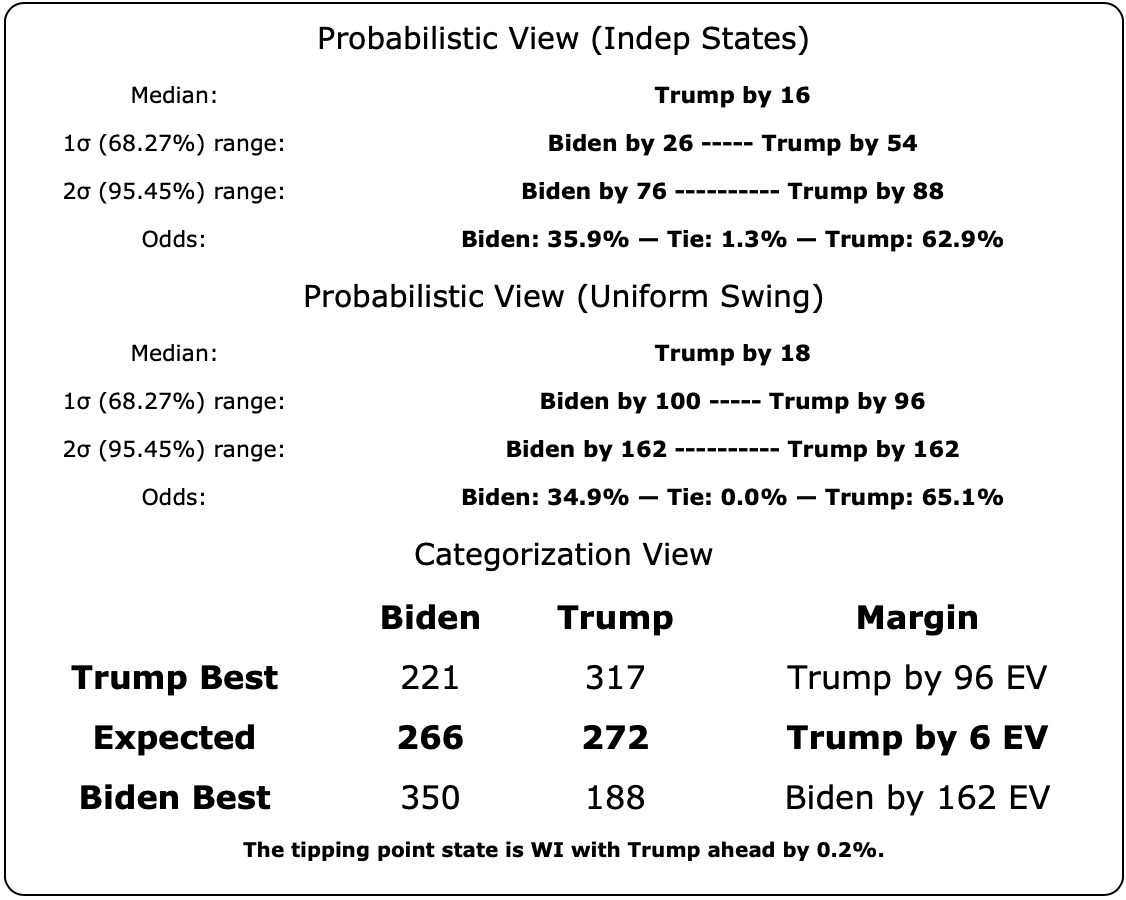
But this does still flip Nevada to Biden's side on the Categorization view, and this plus the movement on all the other states improve Biden's odds on the two probabilistic views. Here are the overall summaries as of now:
Lets look at some comparisons with last time:
Biden Win Odds:
- 2023-03-25: Between 17.8% and 25.8%
- 2023-04-24: Between 24.9% and 32.3%
- 2023-05-21: Between 34.9% and 35.9%
Here are the two odds charts representing the extremes of how correlated the states might be:
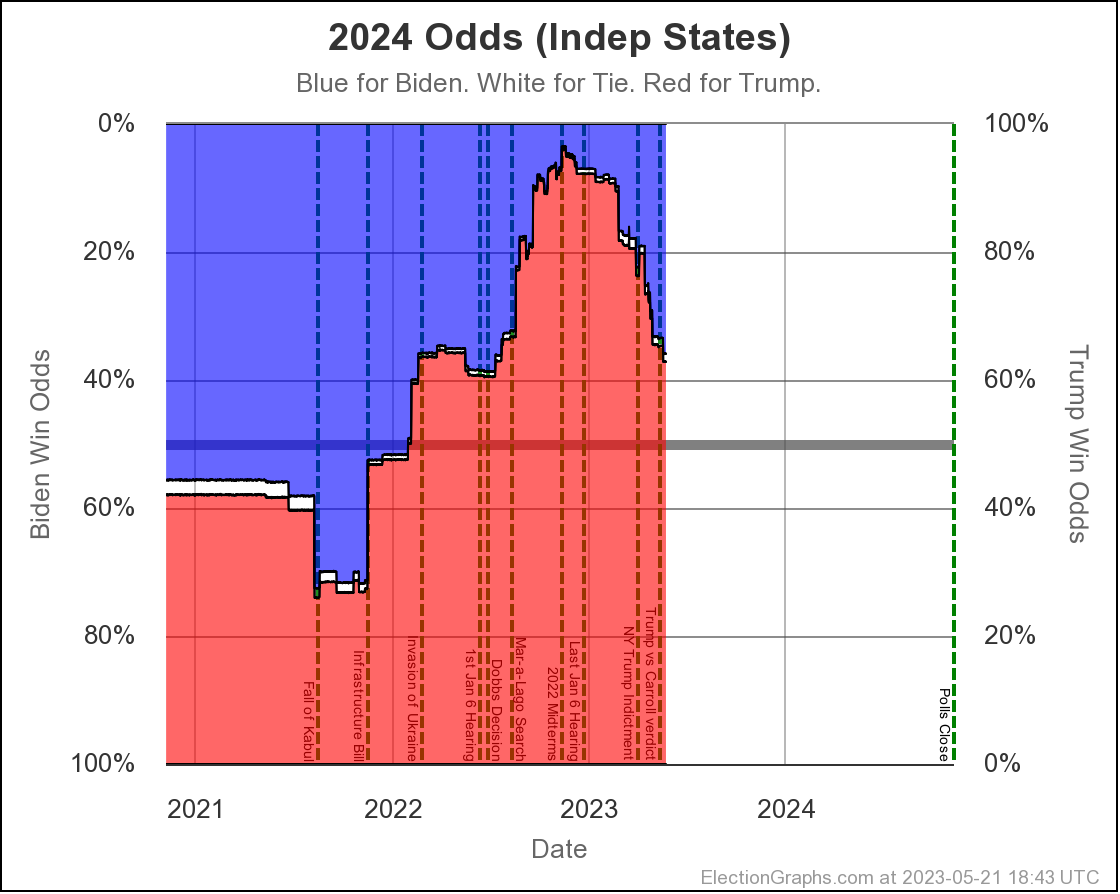
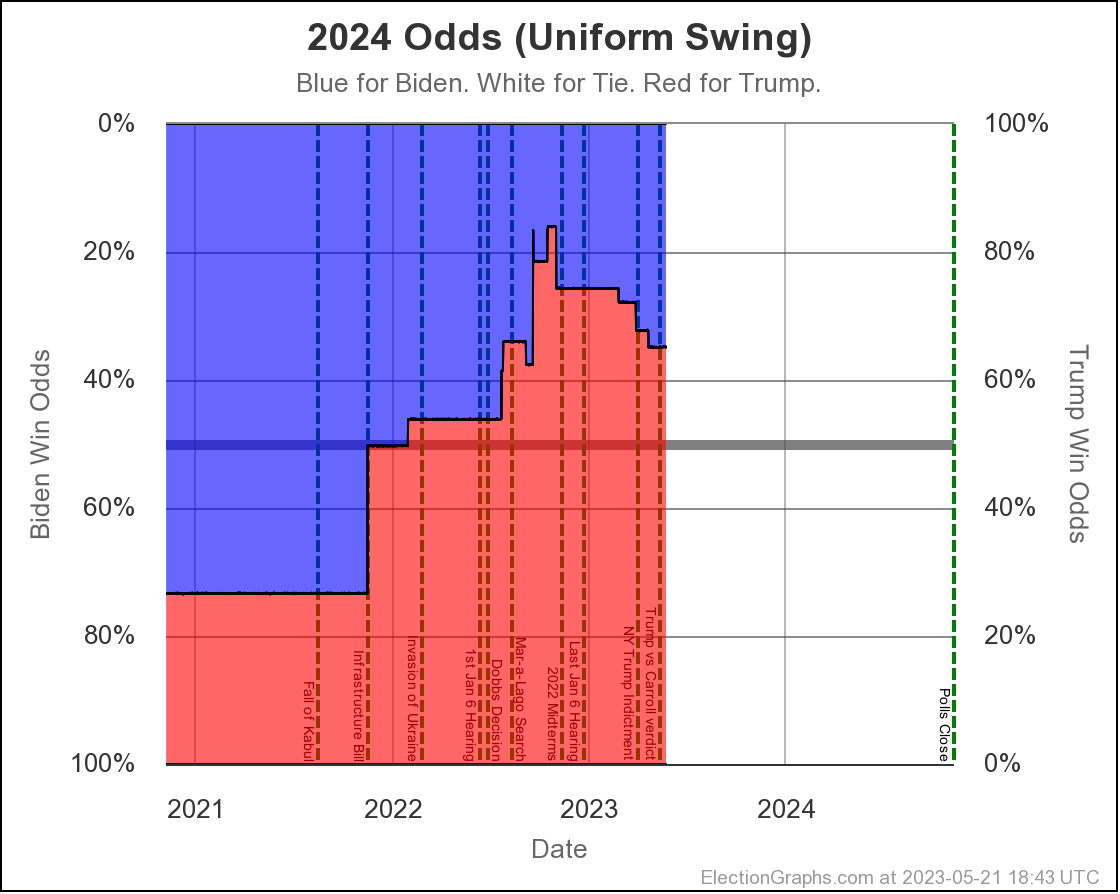
The win odds show Trump continues to have an advantage. But it has been slipping away since November, and while Trump having approximately a 2/3rds chance of winning is decently better than a coin toss, it is very much still in the range where either side has a reasonable shot, and anything could happen.
Categorization Trump Best / Expected / Biden Best:
- 2023-03-25: Trump+96 / Trump+18 / Biden+162
- 2023-04-24: Trump+96 / Trump+18 / Biden+162
- 2023-05-21: Trump+96 / Trump+6 / Biden+162
Here is the trend chart for the categorization view:
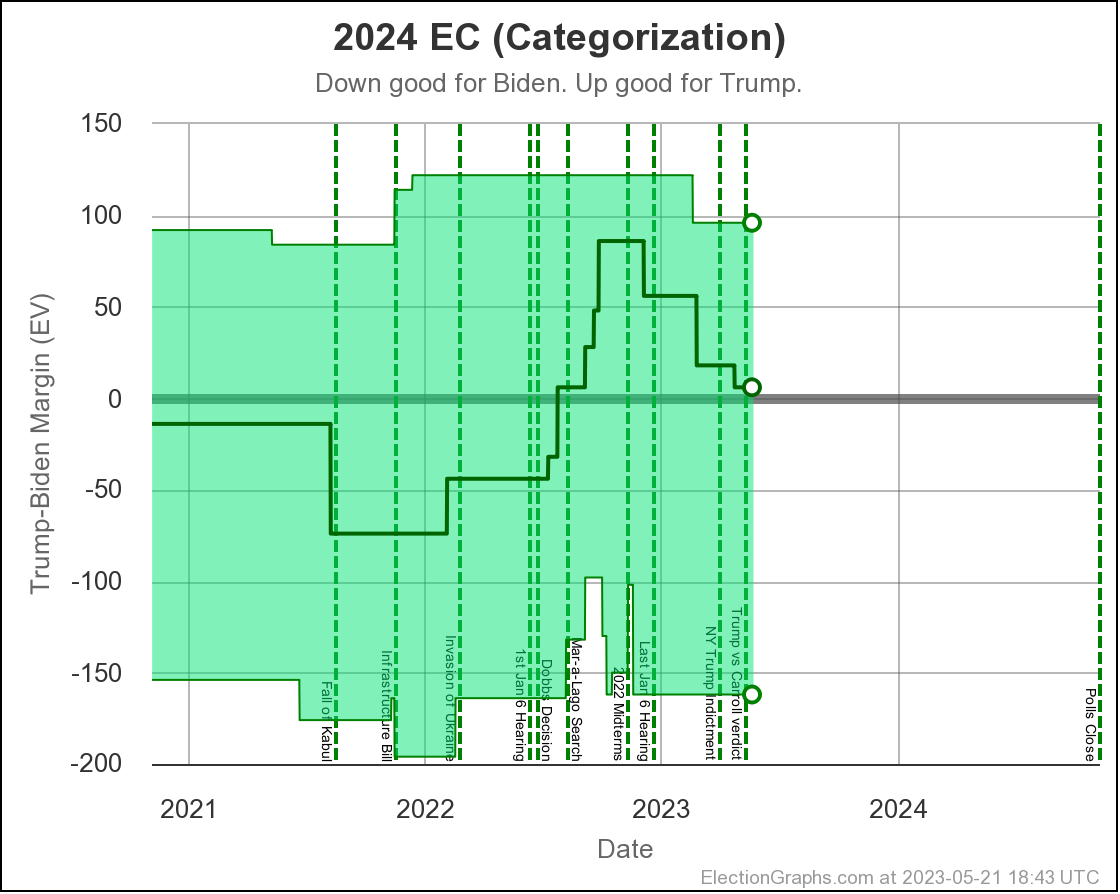
There has been no change since four weeks ago to the inventory of states where the margin is less than 5%, which the categorization view imagines as being able to potentially go either way, so the two best cases remain the same. Nevada flipping to Biden moves Trump's "expected" case here from winning by 18, to winning by 6. But the huge range between the best cases shows this is anybody's game.
Tipping Point:
- 2023-03-25: Trump by 0.7% in Wisconsin
- 2023-04-24: Trump by 0.5% in North Carolina
- 2023-05-21: Trump by 0.2% in Wisconsin
So like the others, the tipping point (the margin in the state that puts the winning candidate over the top) shows Trump's lead continuing to deteriorate.
OK, with the comparisons with four weeks ago done, let me introduce something I added to the site since my update four weeks ago. Namely comparisons with 4 and 8 years ago. Here is one of the two new charts:
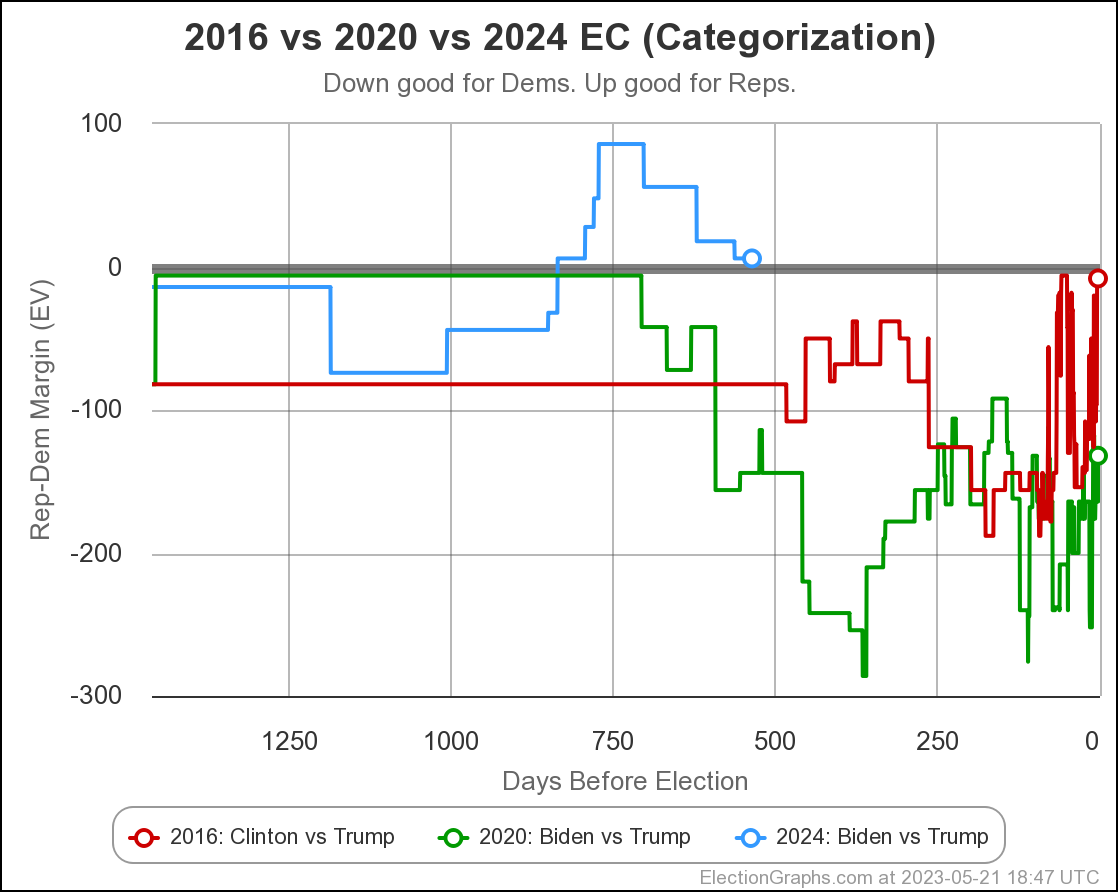
This compares the "expected case" of the categorization view from this cycle, to where the final two candidates were in 2016 and 2020 the same number of days before election.
What we see is that Trump is running significantly stronger now than he was either in 2020 when he lost to Biden, or in 2016 when he beat Clinton.
There is a lot of talk among Democrats of how in a Biden vs Trump rematch they "won in 2020 and know how to win again". I would simply caution that this is not 2020. Trump is polling better than he was then, and Biden is polling worse.
Trump may be doing worse in my models now than he was in November, but he is still doing better than he EVER did here on Election Graphs in either the 2016 or 2020 cycles. Election Graphs never had Trump in the lead in either of those election cycles.
I have him ahead right now.
Trump should not be underestimated.
I'm still not spending much time on any combination besides Biden vs Trump, because that is still the only combination with enough state level polling to be able to feel confident about the national picture.
Biden vs DeSantis is getting close though, and we have a view where you can compare candidate combinations. On that view you can see that in the last few weeks for the first time since 2021 DeSantis looks like he fares better against Biden than Trump does in the Independent States Probabilistic View.
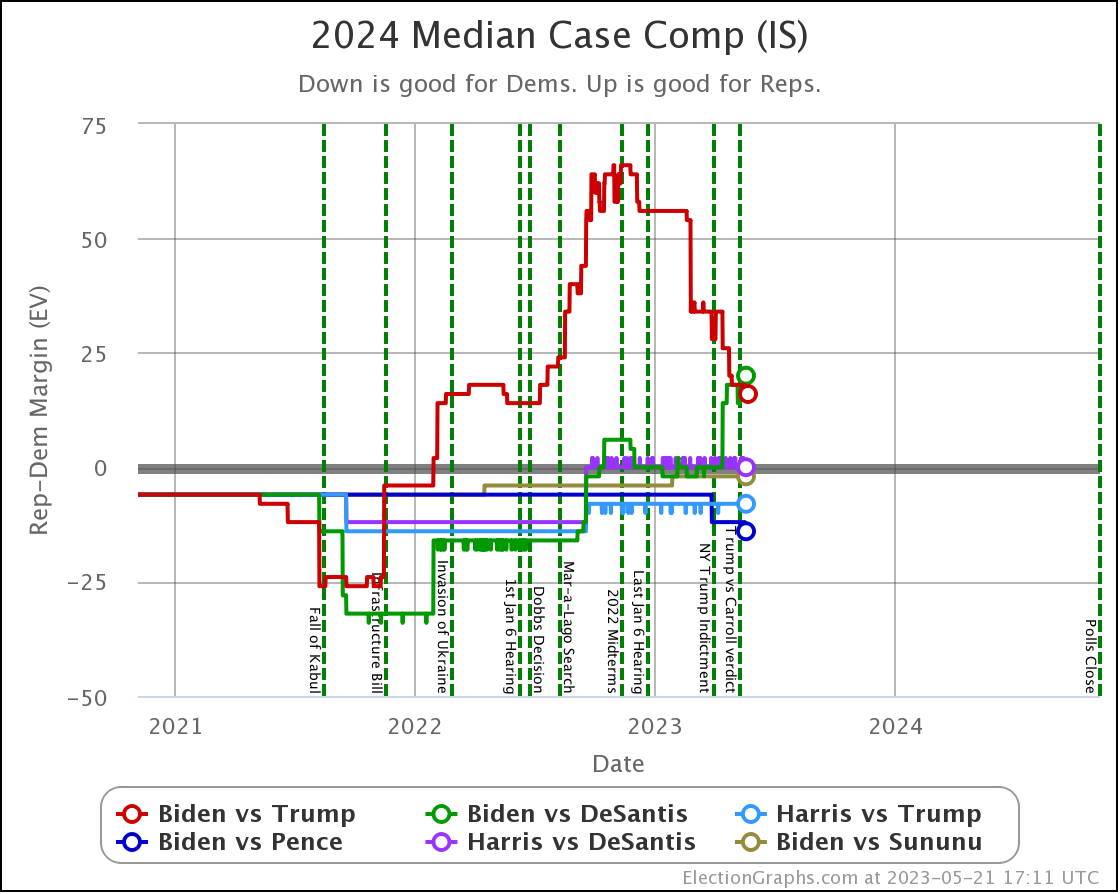
But the data for everything other than Biden vs Trump is still sparse.
Biden vs Trump has 15 states with 5 or more 2024 polls, including ALL the close states, meaning that we have poll averages that do not rely on "filling out" the average with old election results.
By comparison Biden vs DeSantis only has 5 or more polls in Georgia, Arizona, and Florida. Three states. That's it. So treat that combination with a big grain of salt until there is more polling.
If you want to look at that matchup yourself anyway, here is the Biden vs DeSantis summary.
As for ANY other combination besides Biden vs Trump and Biden vs DeSantis, there is so little data it is not worth looking at, unless you are specifically curious about the handful of states that polled a specific combination, rather than trying to get any insights about the national picture.
But you can explore all the combinations you want on the 2024 Electoral College page, and see some charts I haven't highlighted on the blog yet, as well as being able to click through to individual states to see individual polls in each state for each combination, etc. I encourage you to explore.
In the mean time, I'll close with the updated national map:
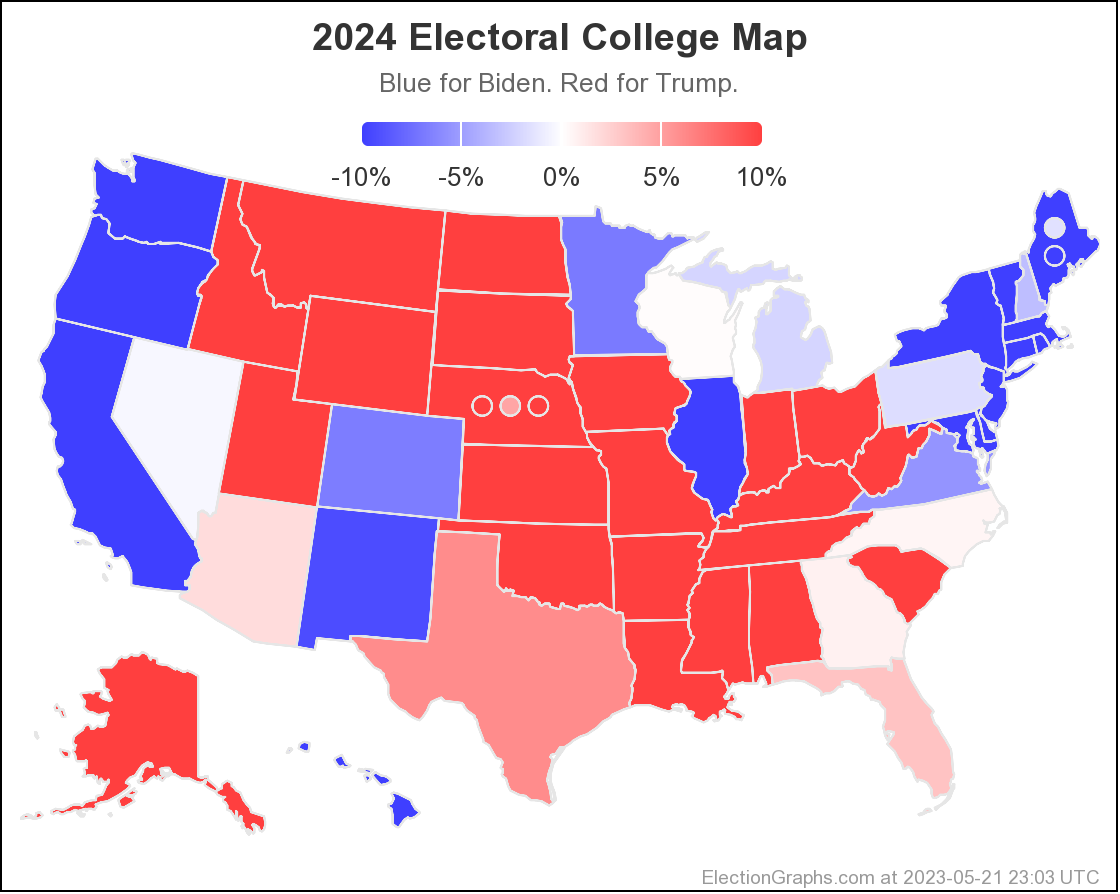
534.0 days until polls start to close on Election Day 2024.