
I had thought about doing another blog post update at the one year mark, but never got around to it. So I guess for now I am sticking to approximately every 50 days. We are now just under the 350 day mark. And it is a long holiday weekend, so I have some time. So here goes.
These only represent snapshots where I look back at how things have changed recently. The live current situation is updated whenever new polls come out, as quickly as I can manage given other commitments. That live status is now the main page of ElectionGraphs.com instead of this blog, since it is always more current.
Anyway, the TL;DR of where things are right now:
- The last 50 days of polls have been great for Trump and horrific for Biden. Specifically starting in early October there have been poll after poll after poll showing Trump leading in critical states.
- With this change, the situation has moved from "A toss up race with Trump slightly favored" 50 days ago to "If the election was today, Trump would be the heavy favorite."
- Although down a little bit from his peak at the end of October, Trump is very near his all time best polling compared to his Democratic rivals, not just in this cycle, but also far outperforming his own numbers in both 2016 and 2020.
- That fact should NOT be underestimated. Because of that, Trump is most definitely favored right now. Democrats acting like everything is fine are deluding themselves. Polls right now are NOT predictive of the final outcome. But they do indicate where things are now, and where things are now is that Biden has lots of work to do.
There are several reasons for Biden and his partisans not to despair yet though:
- The election is not today, there are nearly 350 days of developments yet to play out, including several Trump trials. These may or may not end up damaging Trump's poll numbers, but they represent a major source of uncertainty.
- Historically incumbent candidates have been weakest about a year out before their elections, and have often "come back" and finished strongly, using the advantages of incumbency to benefit their campaigns.
- The "heavy favorite" narrative I quoted above is in large part due to the fact that this site assumes the pattern of polls underestimating the Republican that held in 2 of the last 4 elections (2016 and 2020) holds again. The picture starts looking very different if the polls underestimate the Democrat like they did in 2012 (which would perhaps even indicate a Biden lead), or even if they are about right as they were in 2008 (where Trump still leads, but it seems much closer).
- While Trump currently leads in all the critical battleground states in the EG averages, his leads are quite small, with the current tipping point being Pennsylvania, where Trump only leads by 1.2%, a margin which could literally disappear with a single good poll for Biden.
- The percentage of respondents saying "neither", including both 3rd party support and people who insist they are undecided, is huge. This number swamps the margins between Biden and Trump in the swing states. Both 3P and undecided numbers tend to collapse as the election approaches, leaving a lot of room for persuasion.
Reminder that those who want to see a list of all the polls can just look here, and if you want updates on each and every poll as it comes out, as well as daily summaries of the status for the best polled matchup (currently Biden vs Trump), follow Election Graphs on Mastodon.
OK, now for actual numbers and graphs and such for those who want them.
This is how the spectrum of close states looked as of the last blog post on 2023-10-02:
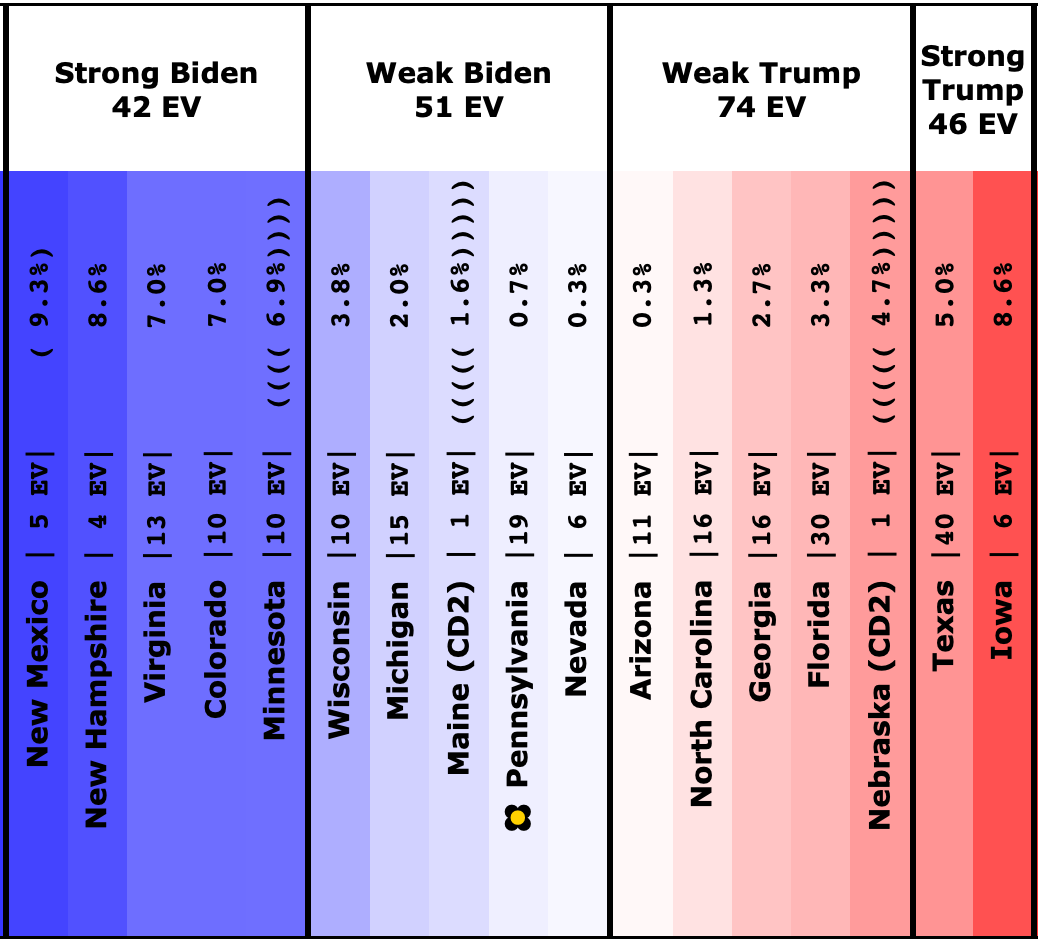
And here is what it looks like as I write this on 2023-11-24:
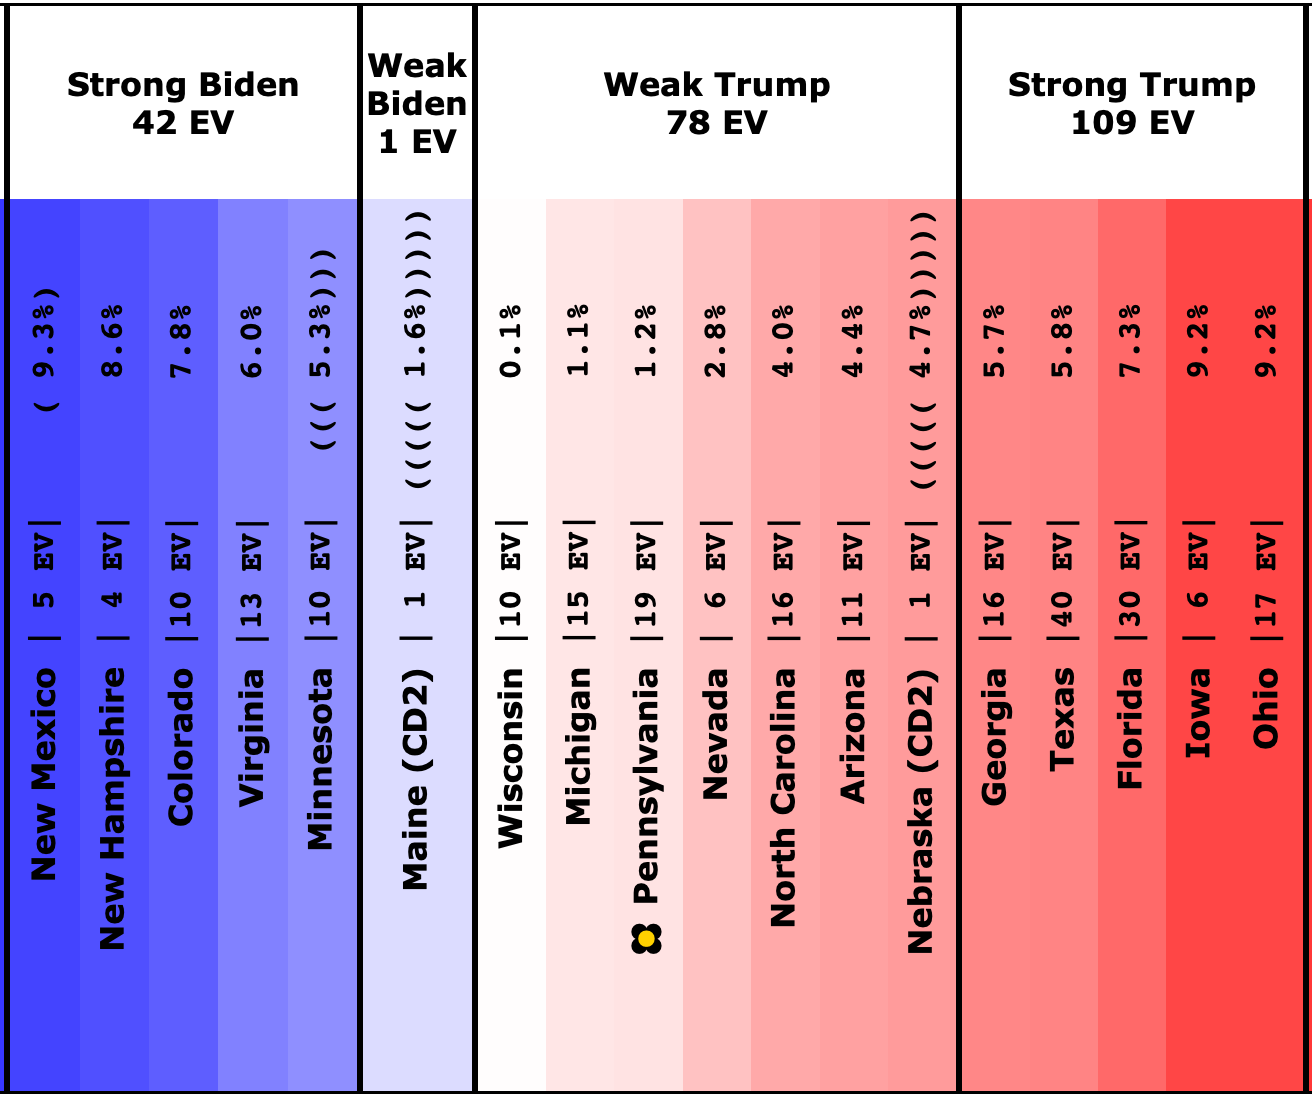
There is clearly a lot more red than there was. Here is the movement since last time:
Places where the poll average moved toward Trump:
- Arizona (11 EV): Trump by 0.3% -> Trump by 4.4% (Trump+4.1%)
- Florida (30 EV): Trump by 3.3% -> Trump by 7.3% (Trump+4.0%)
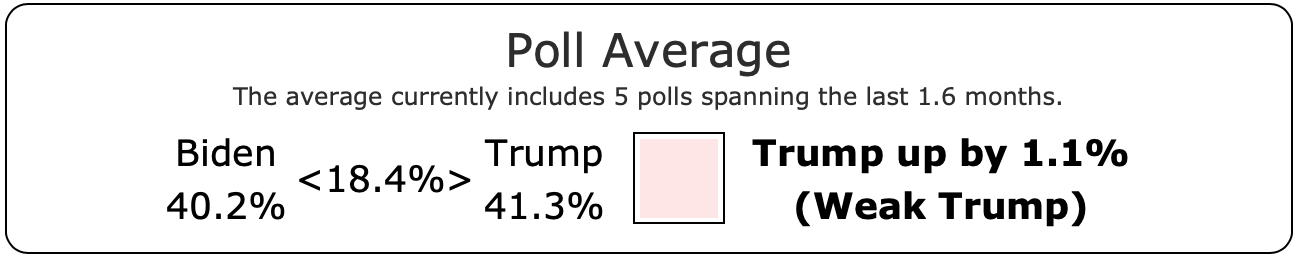
- Wisconsin (10 EV): Biden by 3.8% -> Trump by 0.1% (Trump+3.9%)
- Michigan (15 EV): Biden by 2.0% -> Trump by 1.1% (Trump+3.1%)
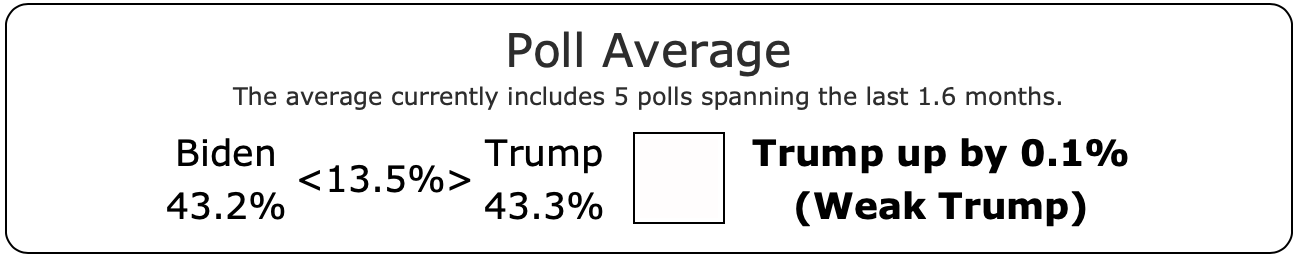
- Nevada (6 EV): Biden by 0.3% -> Trump by 2.8% (Trump+3.1%)
- Georgia (16 EV): Trump by 2.7% -> Trump by 5.7% (Trump+3.0%)
- North Carolina (16 EV): Trump by 1.3% -> Trump by 4.0% (Trump+2.7%)
- Pennsylvania (19 EV): Biden by 0.7% -> Trump by 1.2% (Trump+1.9%)
- Minnesota (10 EV): Biden by 6.9% -> Biden by 5.3% (Trump+1.6%)
- Virginia (13 EV): Biden by 7.0% -> Biden by 6.0% (Trump+1.0%)
- Texas (40 EV): Trump by 5.0% -> Trump by 5.8% (Trump+0.8%)
- Iowa (6 EV): Trump by 8.6% -> Trump by 9.2% (Trump+0.6%)
Places with no change:
- New Mexico (5 EV): Biden by 9.3%
- New Hampshire (4 EV): Biden by 8.6%
- Maine CD2 (1 EV): Biden by 1.6%
- Nebraska CD2 (1 EV): Trump by 4.7%
Places where the poll average moved toward Biden:
- Colorado (10 EV): Biden by 7.0% -> Biden by 7.8% (Biden+0.8%)
- Ohio (17 EV): Trump by 10.6% -> Trump by 9.2% (Biden+1.4%)
The overwhelming trend is obviously toward Trump in this timeframe. The small movements in Colorado and Ohio in the other direction don't matter much in the face of all the movement elsewhere, especially since neither of these two states are particularly competitive.
No states flipped from the Trump side to the Biden side. And while there are lots of states that moved toward Trump without flipping sides, lets take a closer look at the four states (highlighted in red above) where the EG average actually flipped from having Biden ahead to having Trump ahead:
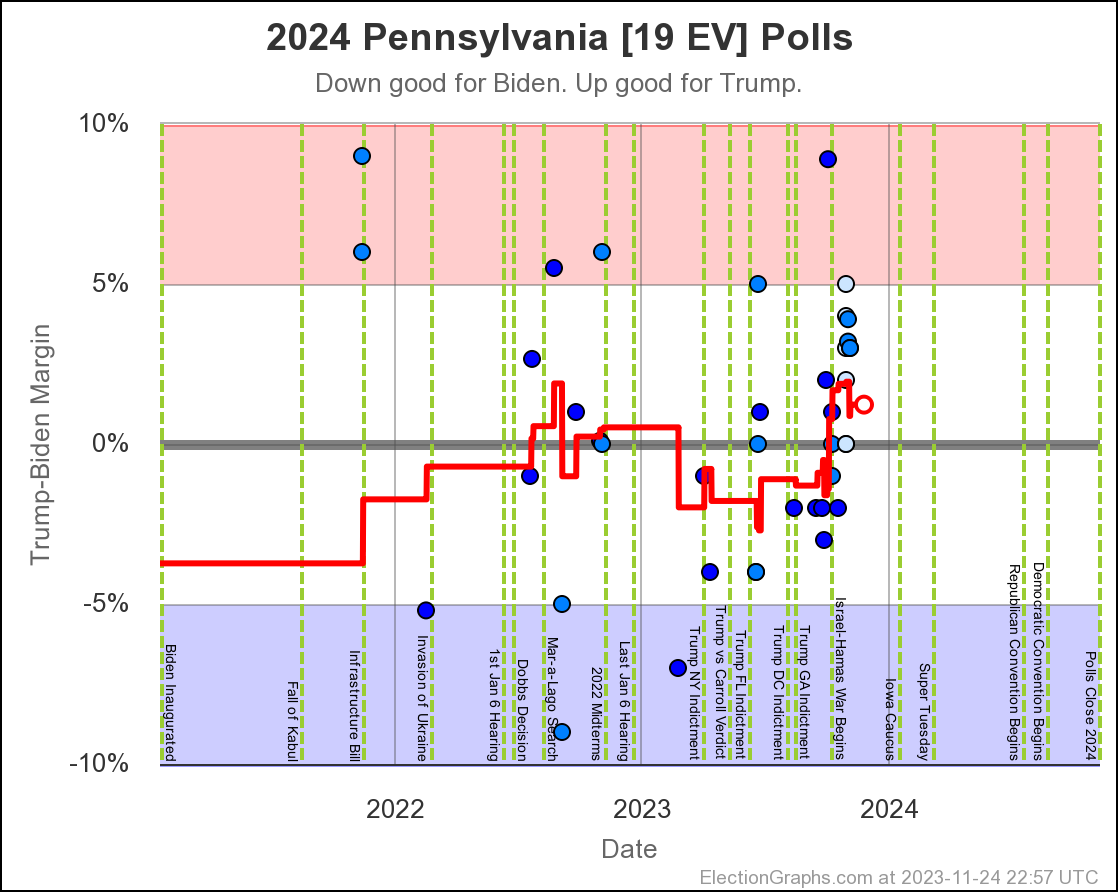

Starting with Pennsylvania as it is both the tipping point state and of these four the one with the most electoral votes, so a doubly critical state.
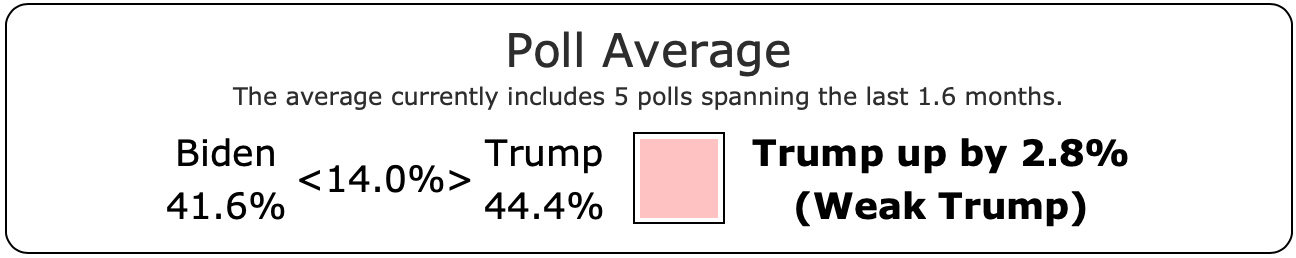
In the past in these posts, I've just shown the graph, but this time I'm including the status block that shows the averages for each candidate as well. Plus the "neither" number, which I added to the display a few weeks ago within the "<>" brackets.
As I mentioned in the TL;DR, this shows a big part of the story that otherwise is not visible. Yes, Trump is up by 1.2% in my average, but the average also shows full 14.4% refusing to support either. This just puts that 1.2% in context that is necessary to understand the potential volatility of that margin number.
Having said that, let's look at the trend. Biden's lead in Pennsylvania had peaked in June, and was slipping away a bit since, but the big jump came at the beginning of October. Although it looks like this jump coincides pretty closely with the start of the Israel-Hamas war, a few of the polls that started this move toward trump actually were in the field right before that. But additional polls later in the month confirmed the trend.
In the end this moves Pennsylvania from a small Biden lead to a small Trump lead. But given where all the other states lie, Pennsylvania is one of the critical states. For both candidates, most of the likely paths to victory include Pennsylvania.
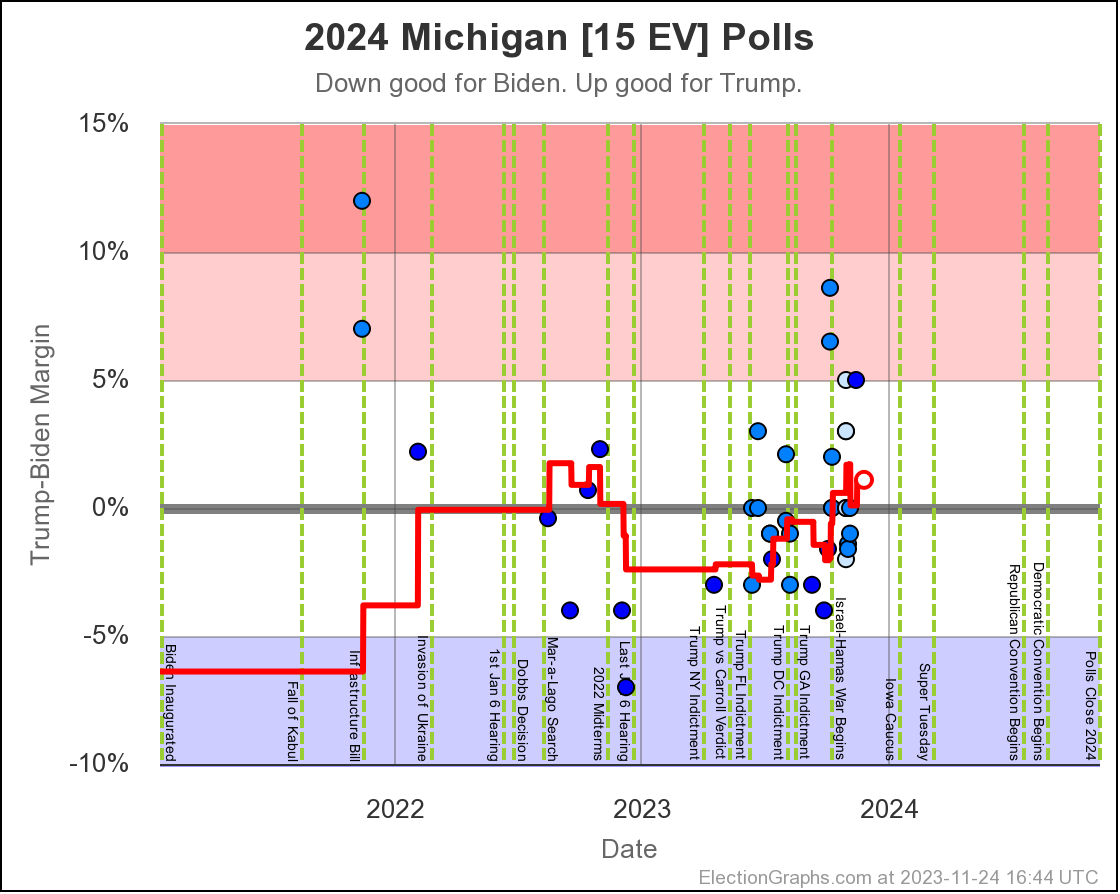
The story looks similar in Michigan, except the upward trend seems less abrupt, looking like more of a continuation of a trend that started in June rather than something abrupt and new in October. The "neither" group is even bigger here than in Pennsylvania.
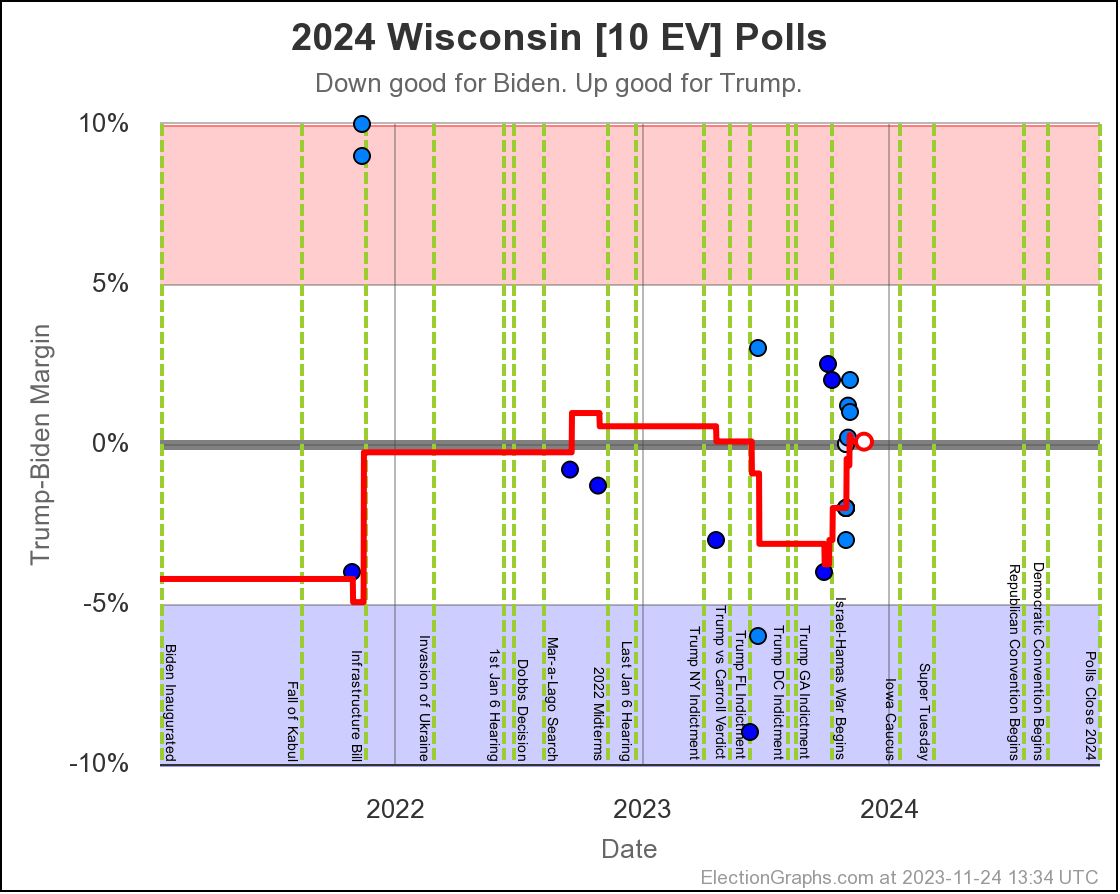
All of these seem similar to a degree. All have a movement toward Trump in October, all have a huge number in the "neither" category. In Wisconsin's case, we also have what is currently the closest state in our poll averages. Yes, there is a Trump lead in the poll average, but just barely.
Now, given the history of how the final poll averages did in 2008-2020, I translate a 0.1% Trump lead into a 63.3% chance of Trump winning the state if the election was today, simply because looking over all of those years, more often than not a nearly tied poll average resulted in a Republican win.
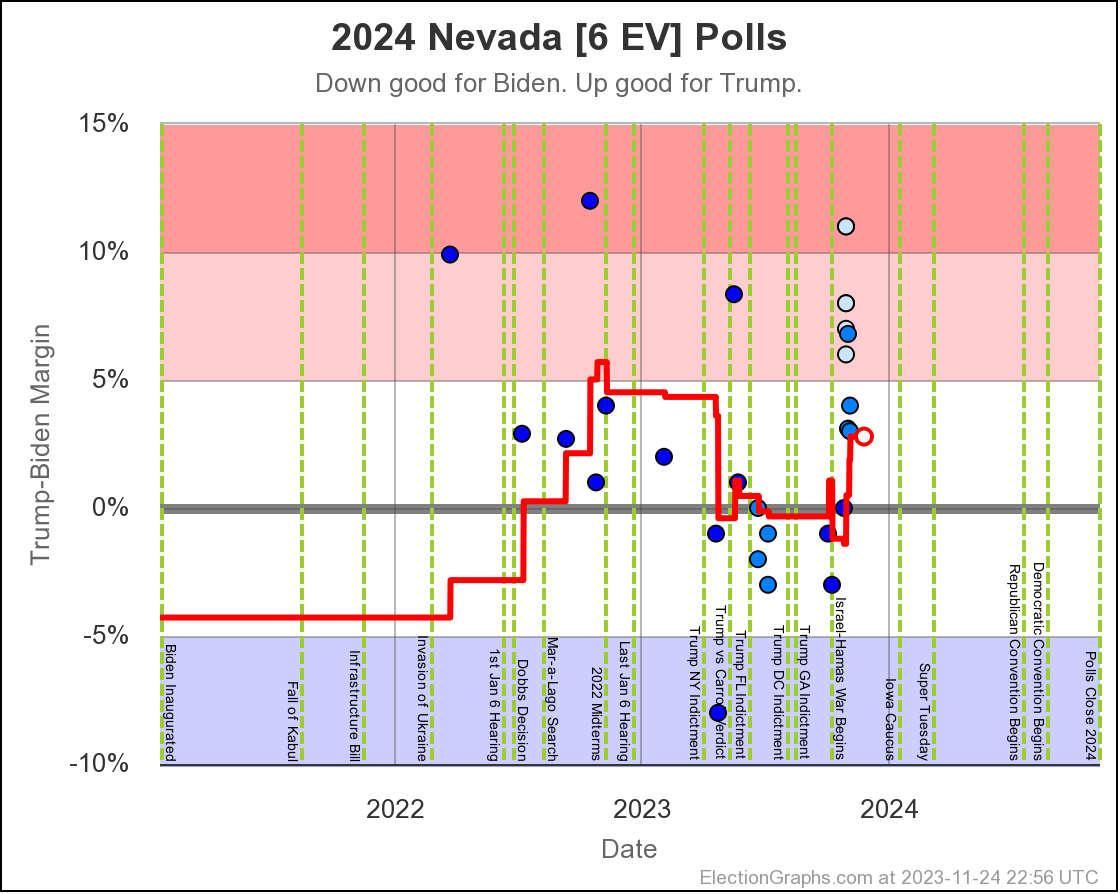
Finally Nevada. Nevada had been straddling the center line since April. The jump toward Trump in this case really didn't hit until the end of October rather than the beginning. That may just be related to when there was polling and when there wasn't though. We still aren't at the point in the cycle where all the close states are being polled every week or anything.
This move just puts Nevada back where it had been in the first part of the year though.
All four of these states are in the situation where a small number of polls favoring Biden could flip the average back to the other side quickly. So the situation is volatile. That will always be true in a situation where the tipping point state is "close". There is lots of opportunity for the situation to change.
But as of right now, the national situation looks like this:
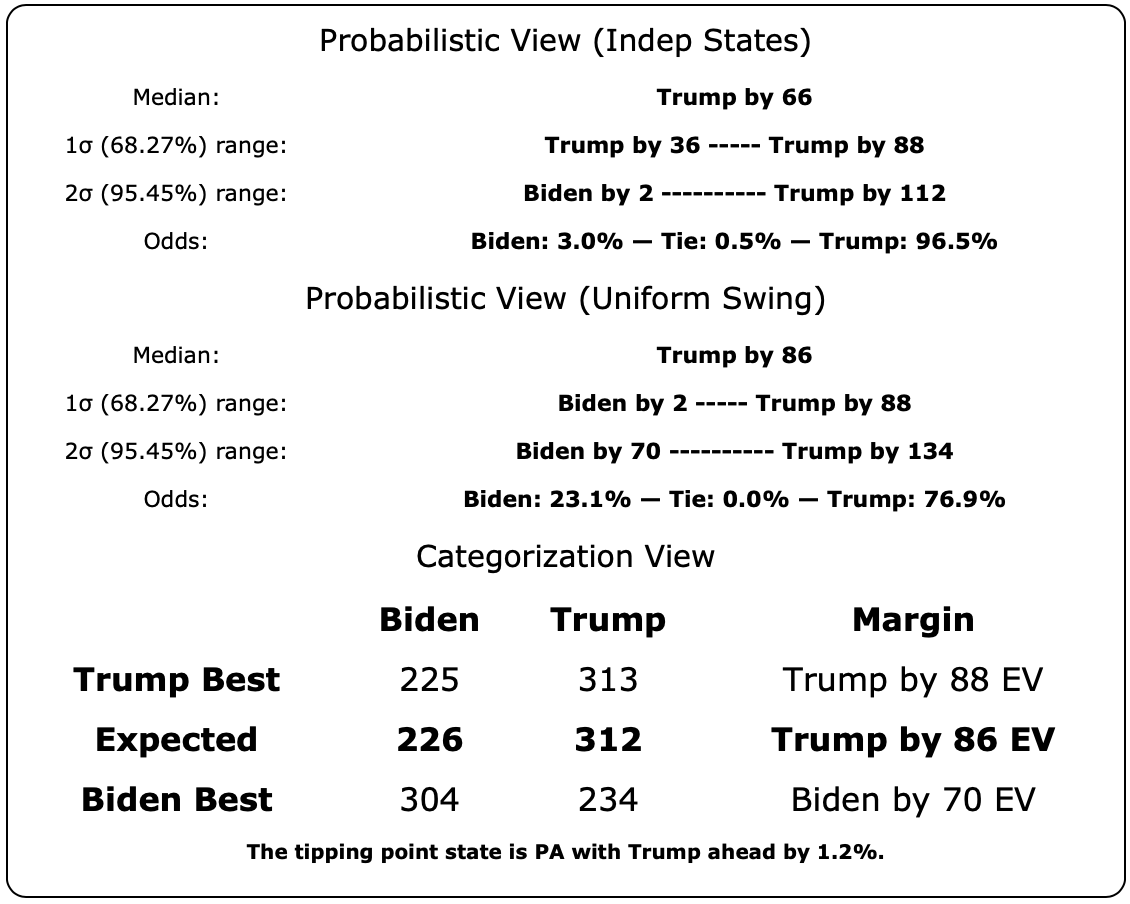
All of this looks incredible for Trump, and horrible for Biden.
As of right now Trump is ahead in all the critical states, and in the probabilistic views, to look good for Biden, he would not only have to be leading in those states, but leading by a couple percent.
Looking at how the probabilistic ranges have evolved in terms of the Biden win odds:
- 2023-03-25: Between 17.8% and 25.8%
- 2023-04-24: Between 24.9% and 32.3%
- 2023-05-21: Between 34.9% and 35.9%
- 2023-06-25: Between 43.9% and 46.0%
- 2023-08-13: Between 42.9% and 44.2%
- 2023-10-01: Between 35.7% and 44.2%
- 2023-11-26: Between 3.0% and 23.1%
This is the lowest Biden has been this cycle.
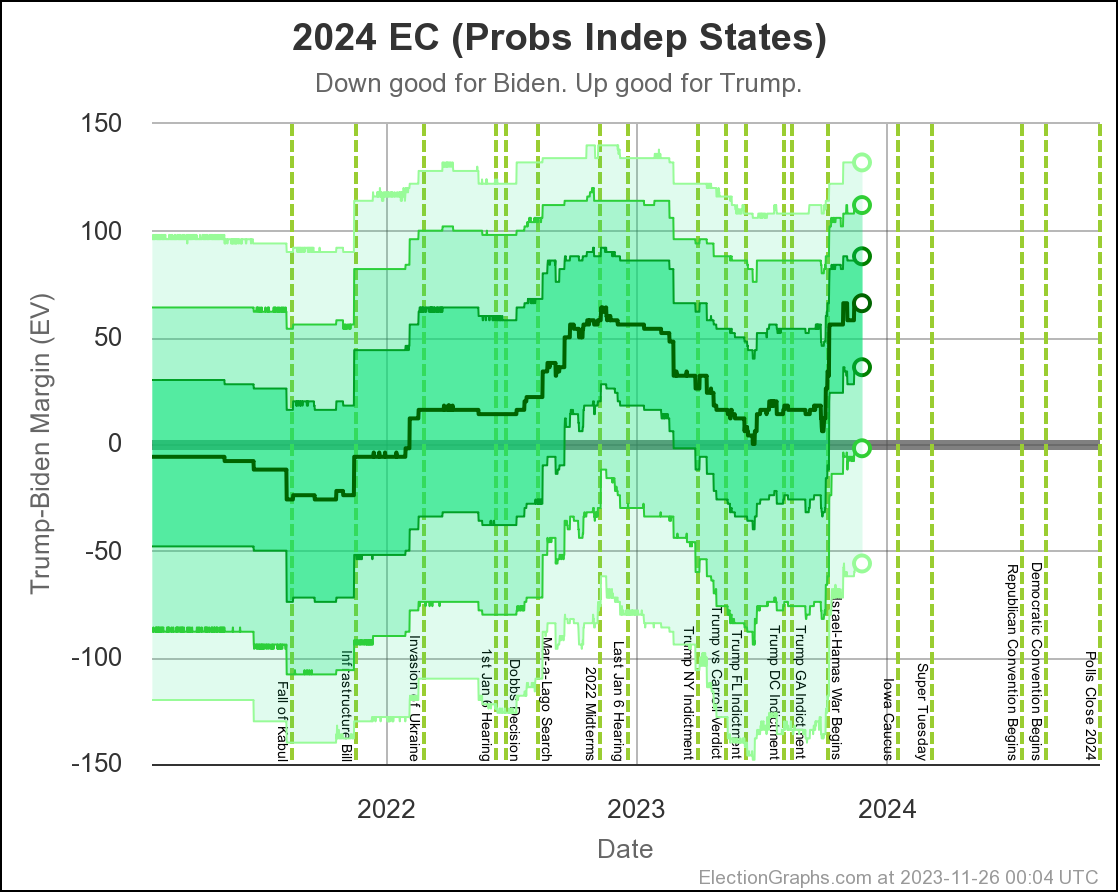
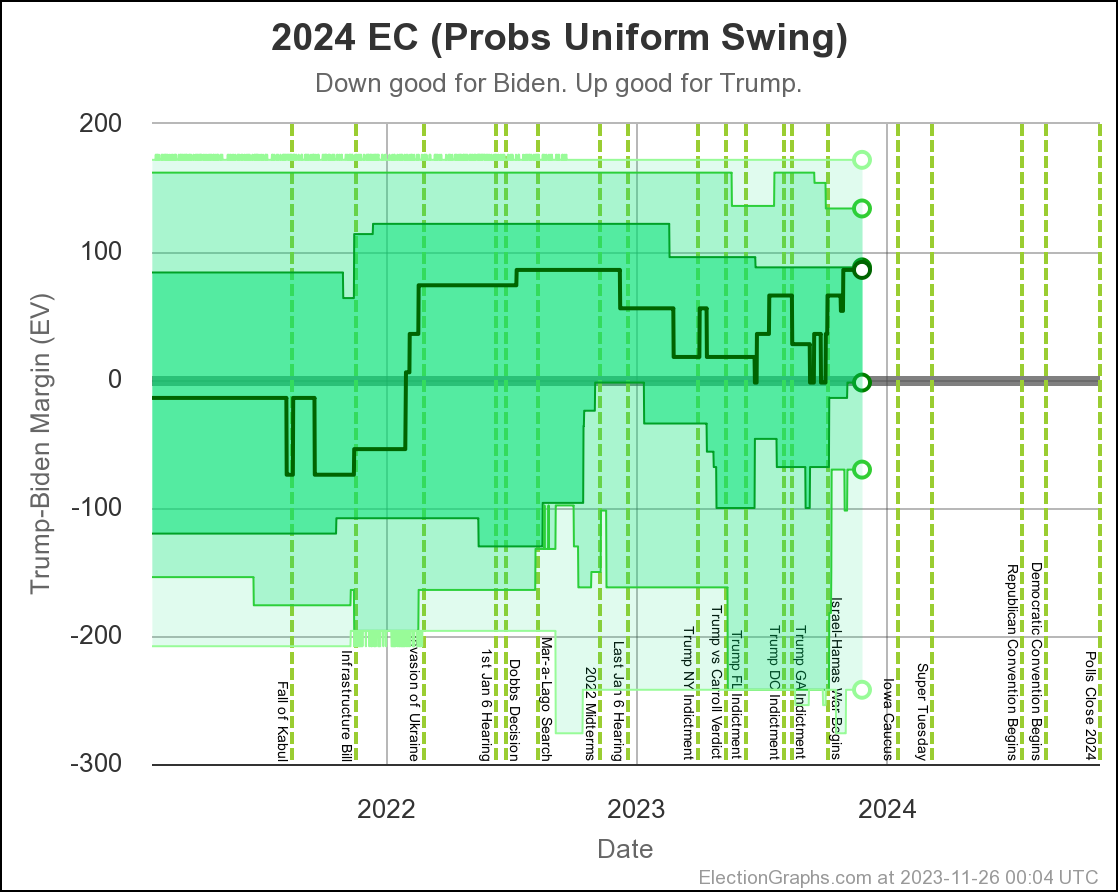
Looking at the two odds charts:
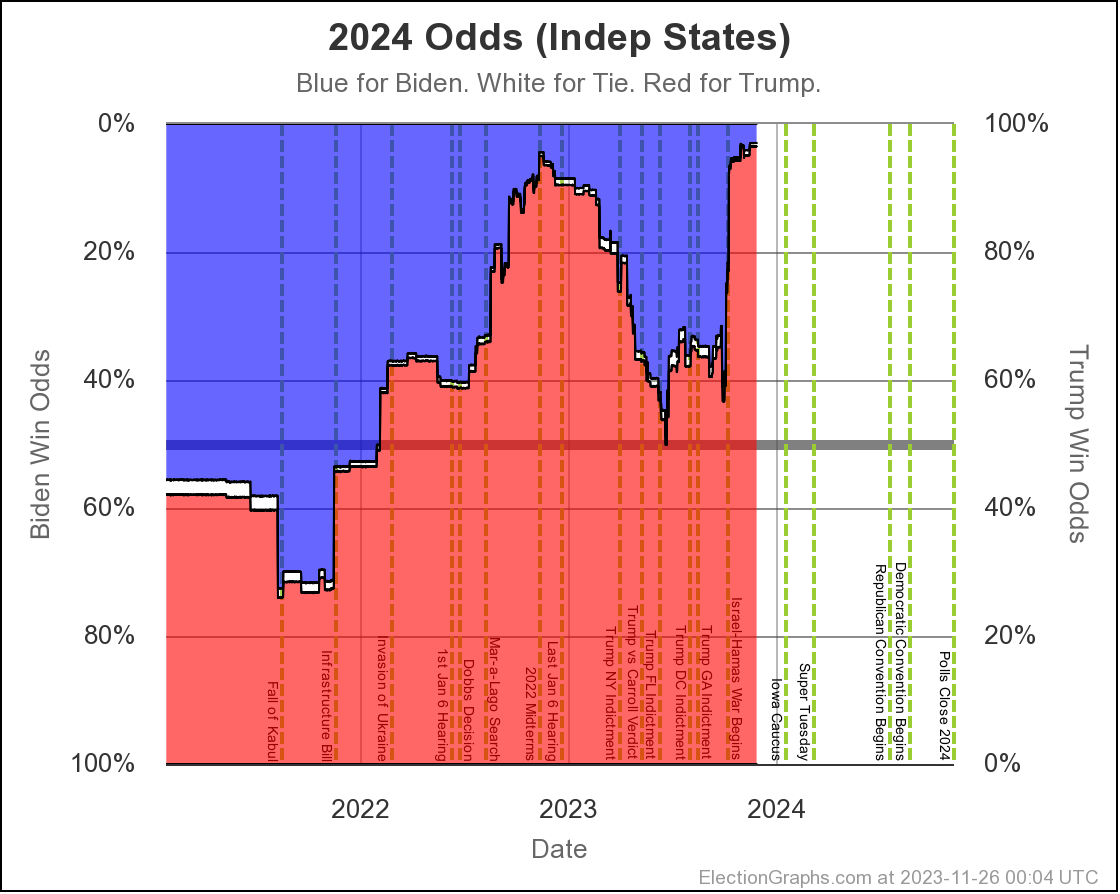
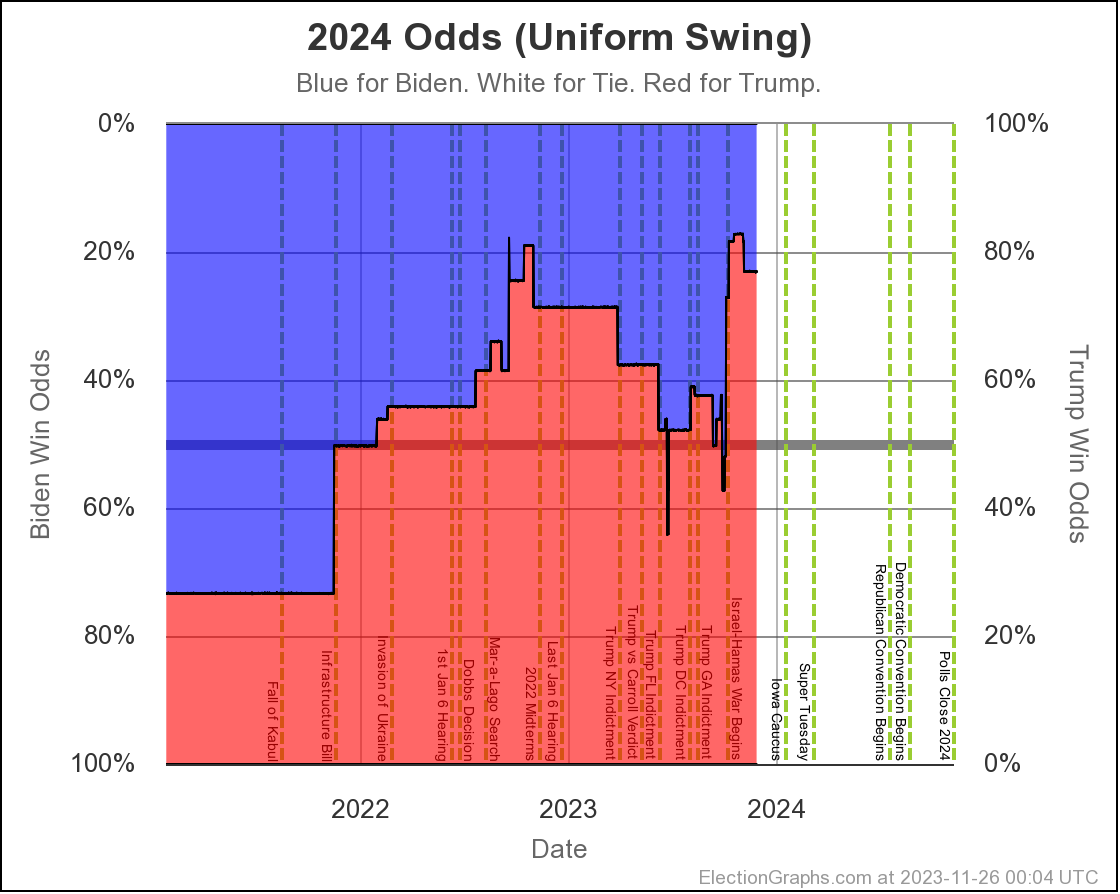
These vary by how the eventual errors between poll averages end up correlating between states.
That is, in the independent states version, the polls can be off from historical norms in one direction in one state, and in the other direction in the next state and there is no relation between what happens in one state and what happens in another. Whereas in the uniform swing model, if polls underestimate one side, they do so in the same way in every state. Of course the reality is somewhere in between.
The general shape is the same, but the Independent States version is more dynamic, so it is nicer to visualize trends. At the moment it is also worse for Biden and better for Trump, basically because the polls have to be underestimating the Democrats in multiple states to get to a Biden win, where with Uniform swing, you just have to have the nationwide error be missing Biden support.
Moving away from win odds to the Electoral College, here are the current views for each of the three ways EG has of showing the range of possible outcomes:
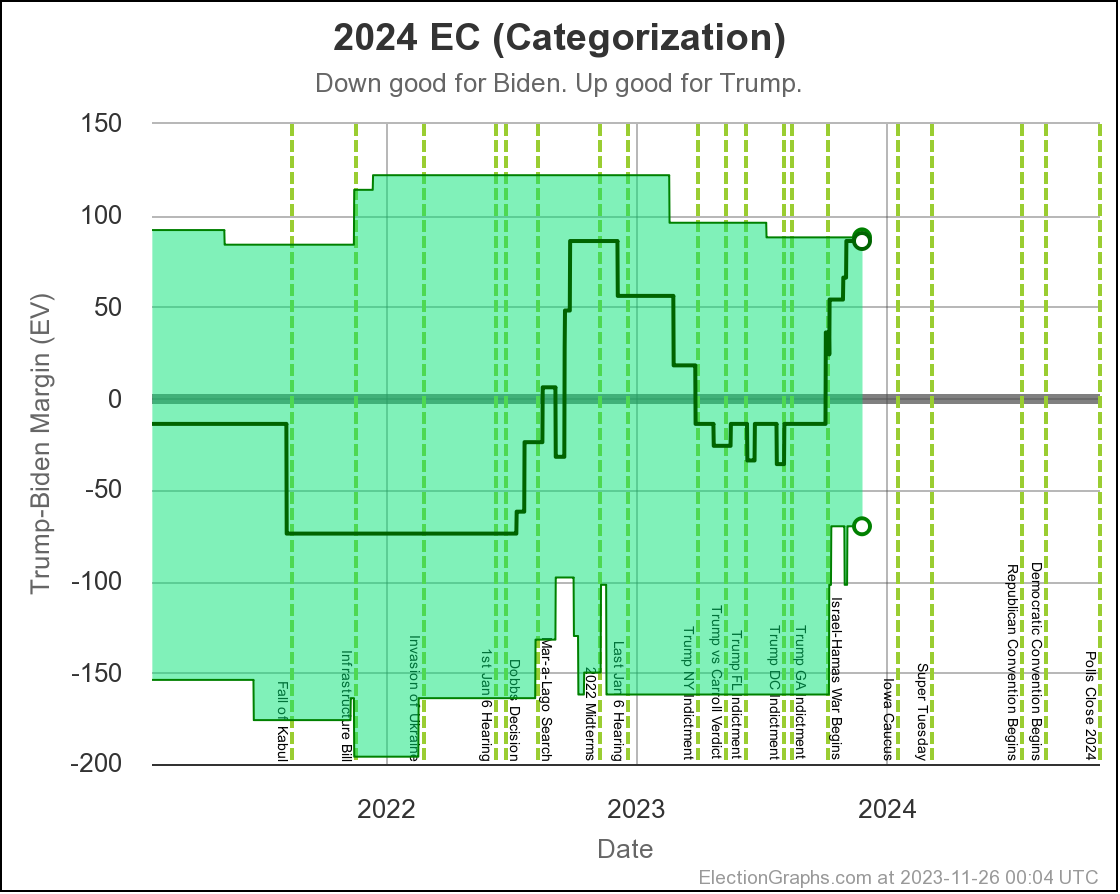
We are just showing all the different ways of looking at the same picture here. The median cases with Trump ahead by several states, but Biden wins are possible if he flips a few of the key states.
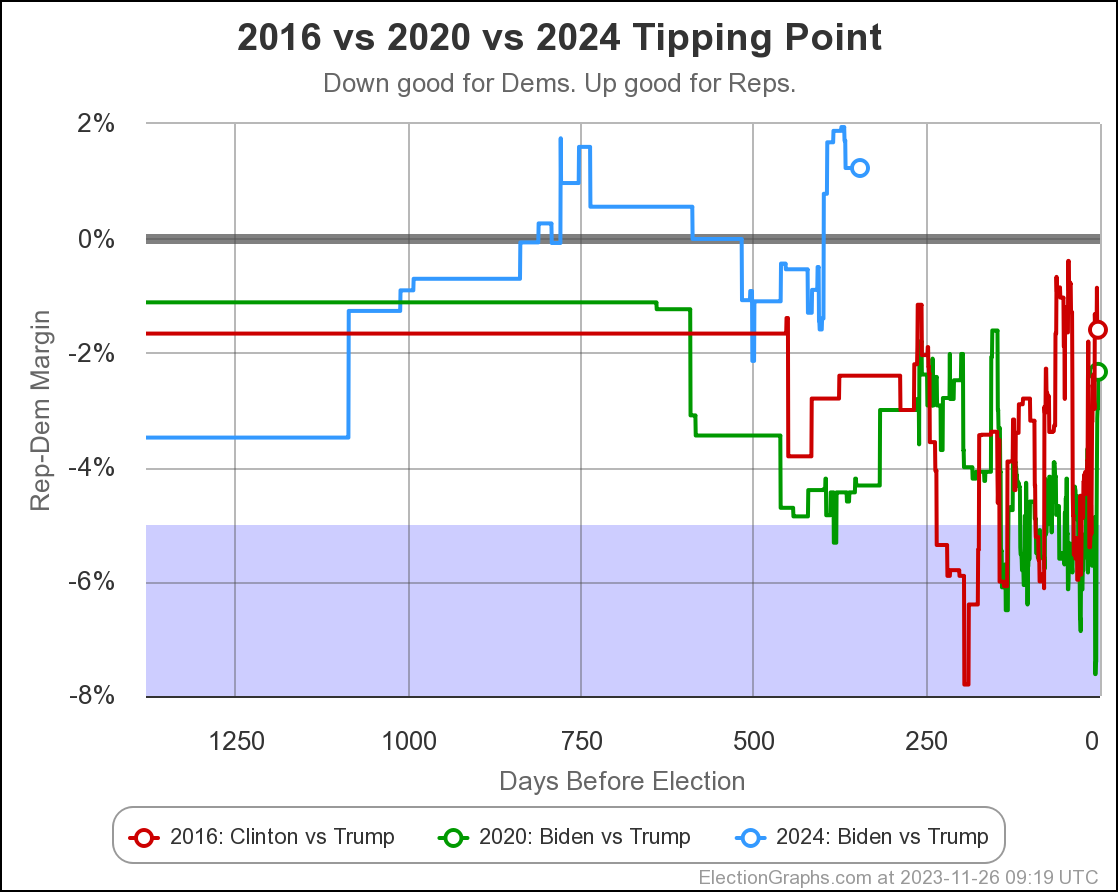
The other way we have of measuring how hard those flips would be besides the probabilistic models, is looking at the "tipping point", which is the margin in the state that would put the winner over the top.
Here is how that number has evolved:
- 2023-03-25: Trump by 0.7% in Wisconsin
- 2023-04-24: Trump by 0.5% in North Carolina
- 2023-05-21: Trump by 0.2% in Wisconsin
- 2023-06-25: Biden by 0.9% in Georgia
- 2023-08-13: Biden by 0.7% in Michigan
- 2023-10-02: Biden by 0.7% in Pennsylvania
- 2023-11-26: Trump by 1.2% in Pennsylvania
Or in graph form:
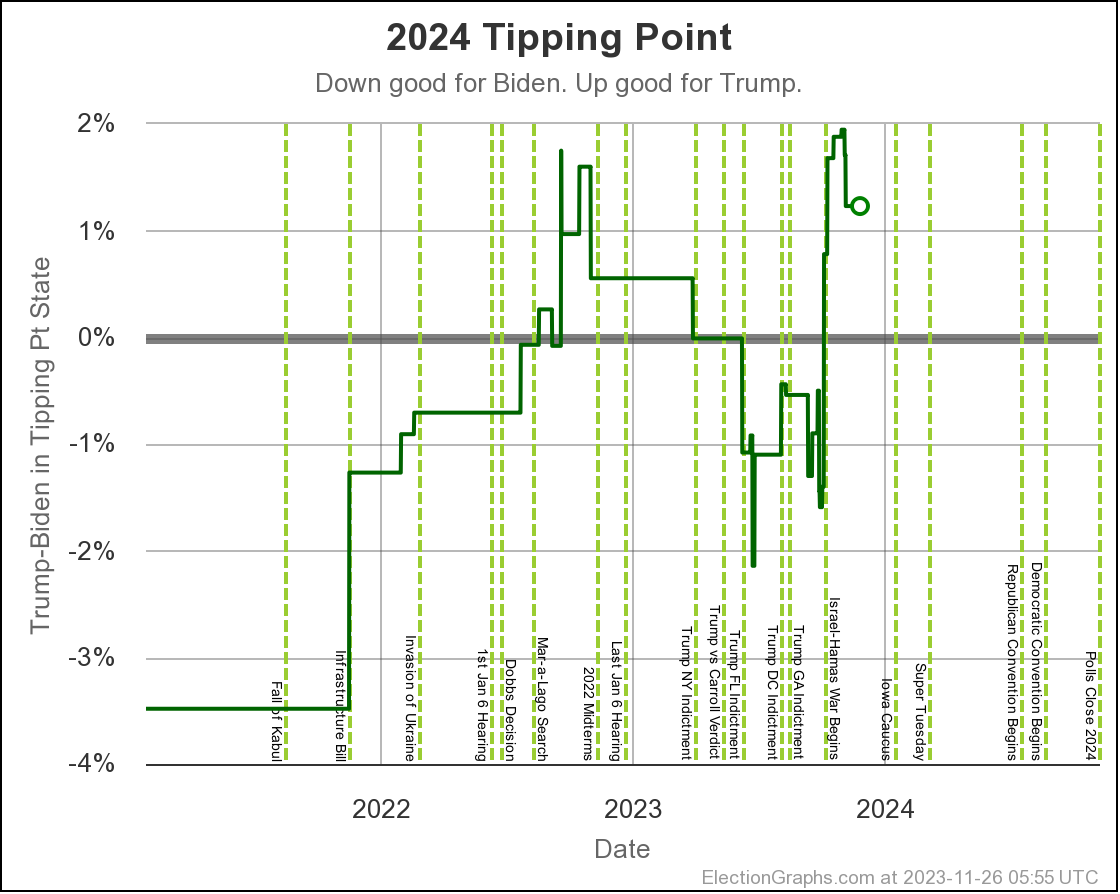
One point that shows up more in this view than in the others, is that there has already been some movement back toward Biden after a peak around the beginning of November.
And it is a good time to point out again that 1.2% is not much. The tipping point went from Biden by 1.6% at the end of September to Trump by 1.9% at the end of October. These numbers can be volatile and move quickly. If the election was today, Biden would be an underdog, but there is time.
Having said that, the overall trends compared to 2016 and 2020 are dismal for Biden. For more than a year, Trump's polling has been consistently better than the previous cycles looking at both the median electoral college result and the tipping point:
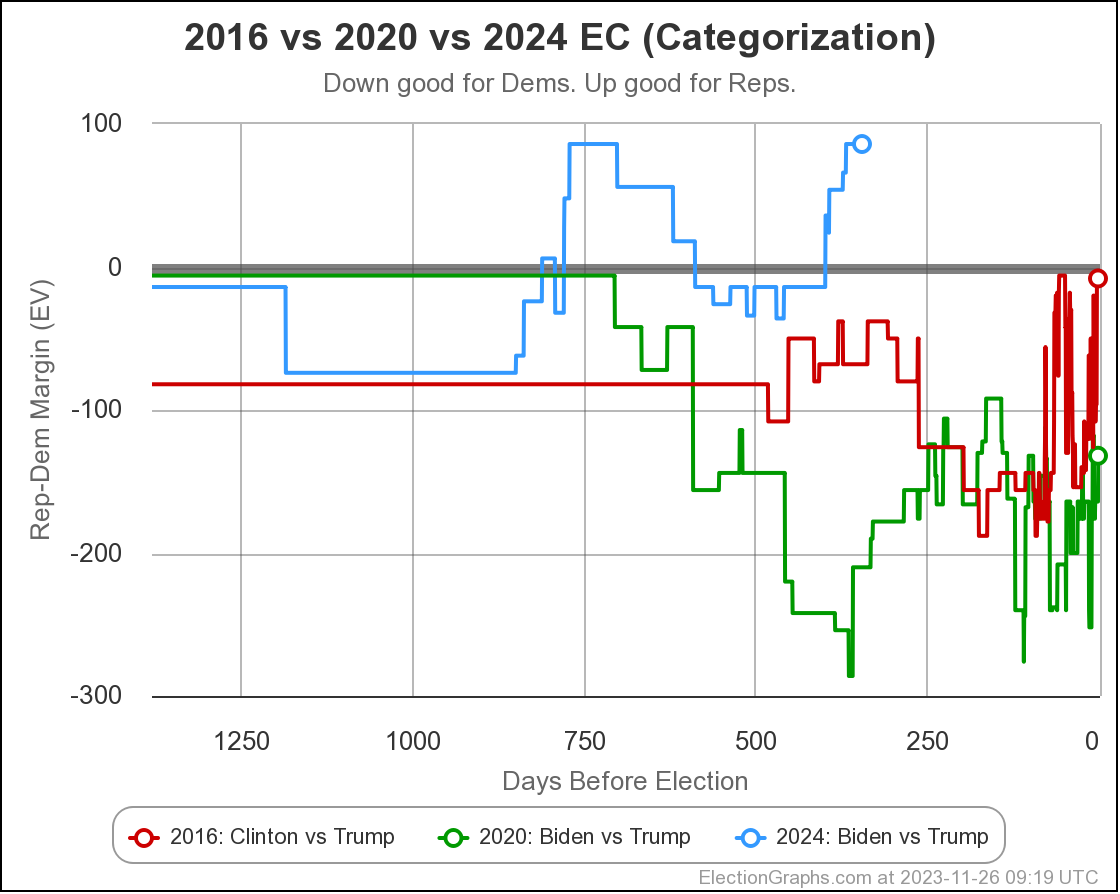
Even with all the reasons I gave that Biden isn't out of the game even though numbers don't look great right now, this last observation should concern Biden folks the most.
Maybe the polls are all just wrong, and completely missing a large swath of Biden support. But if not… then Biden is not only running behind the pace of his narrow win in 2020, but is also lagging Clinton's loss in 2016.
Team Biden has some work to do. Running on a strategy of "well, we won last time" and/or "Trump's support will eventually collapse" is highly risky.
OK, quick look at the "What if it isn't Biden vs Trump" chart:
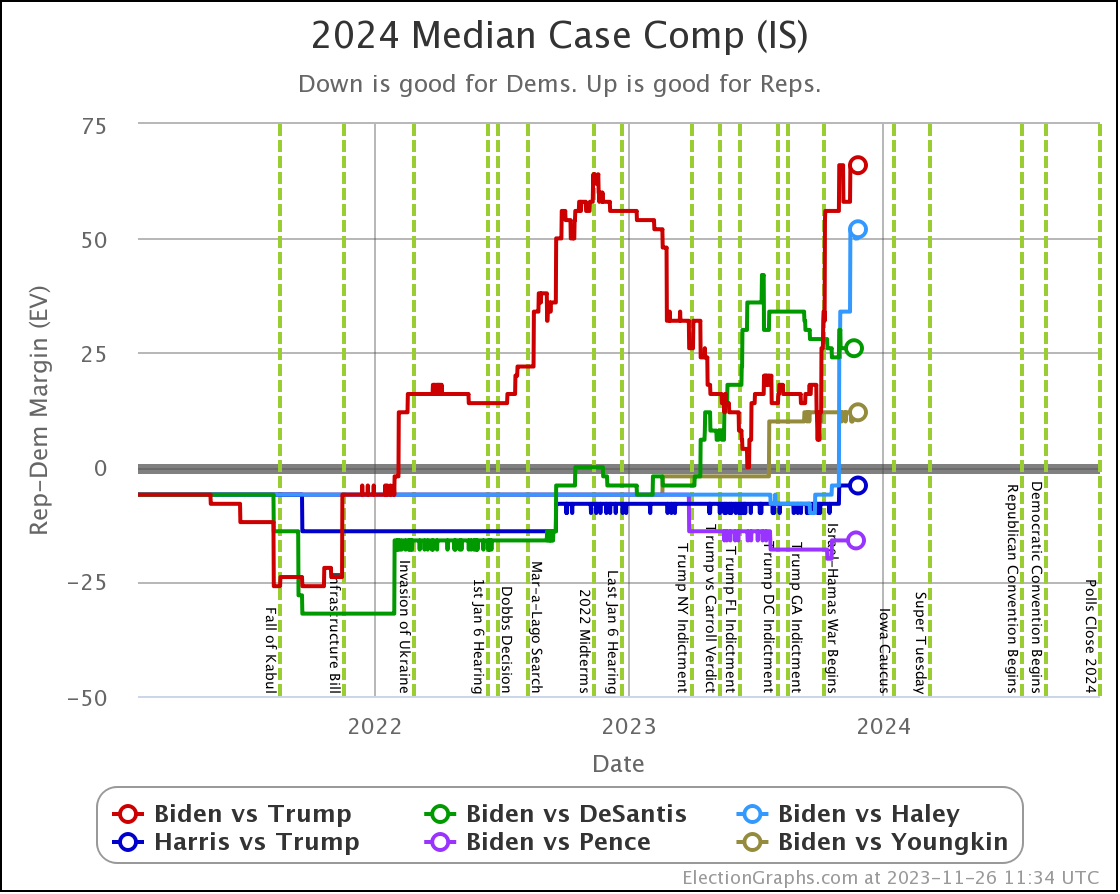
At this point there is finally just about enough polling to consider the Biden vs DeSantis numbers trust worthy as well as the Biden vs Trump numbers.
But you can safely ignore all of the others. There just isn't enough polling to say anything meaningful about those combinations. Don't trust those lines.
But we do see that with this latest surge, Trump once again does better against Biden than DeSantis does.
To explore Biden vs DeSantis more, look here.
Finally, as usual, closing with the current Biden vs Trump map:
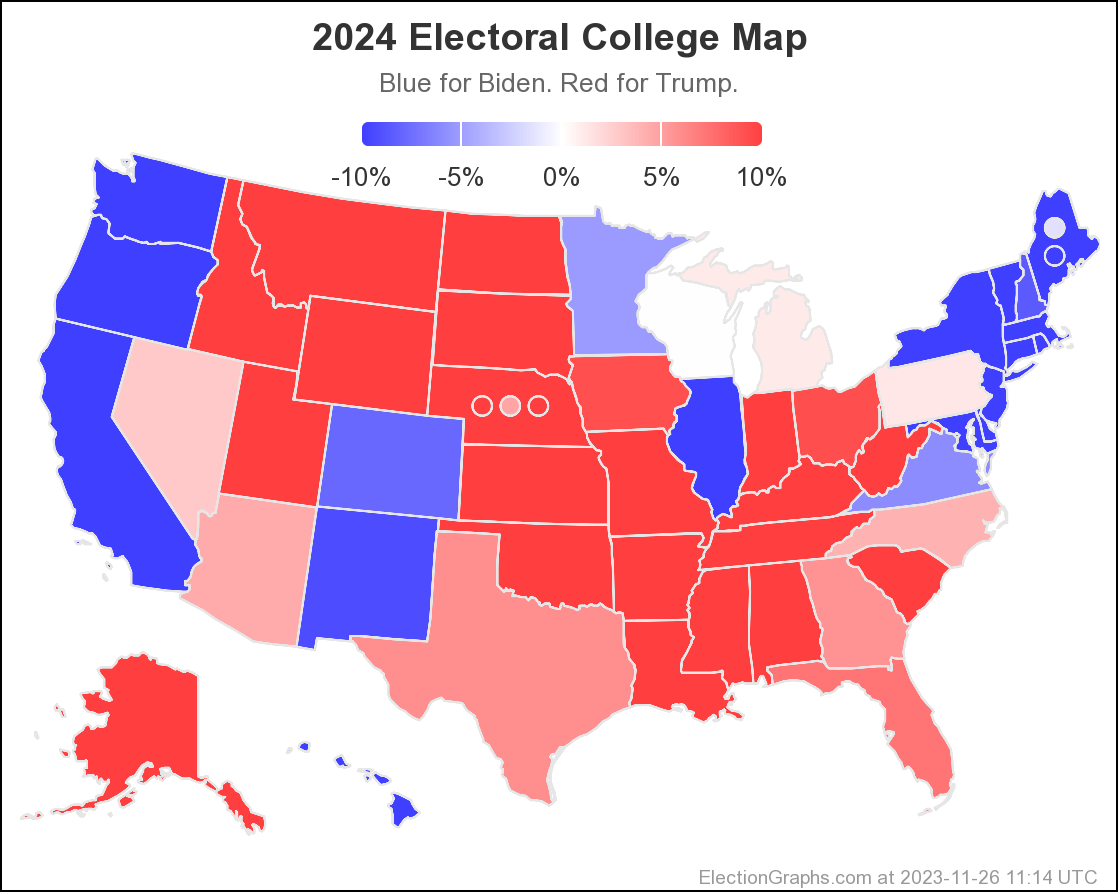
345.1 days until polls start to close on Election 2024.