
It has been five weeks since my last post instead of four, but I noticed we were coming up on a milestone, so I waited an extra week.
As I start writing this post, it has been 75 minutes since we passed the 500 day mark until the first states close their polls for Election 2024, and we start seeing real results. It will be a bit less by the time I finish and hit publish, but still, it seemed worth noting.
For those not wanting to read all the details below, here is the TLDR:
- If a Biden vs Trump election was held today, it would be a dead heat and could easily go either way. A ton of critical states are "too close to call".
- Biden has a narrow lead if you take the polls at face value, but given that on average in the last four election cycles polls have tended to underestimate the Republican, I still give Trump a slight edge on the probabilistic view.
- Since November the trend has been in Biden's direction, and this trend has continued in the last month.
OK, now some details:
Since the last post there have been 29 new data points added.
- 16 for Biden vs Trump [NVx2, CAx2, GAx2, KY, TX, IA, VA, NC, WA, MD, MI, AZ, PA]
- 11 for Biden vs DeSantis [TX, IA, NV, NC, WA, CA, MD, MI, AZ, GA, PA]
- 1 for Harris vs Trump [TX]
- 1 for Harris vs DeSantis [TX]
If you want updates on each and every poll as it comes out, as well as daily summaries of the status for the best polled matchup (currently Biden vs Trump), follow Election Graphs on Mastodon.
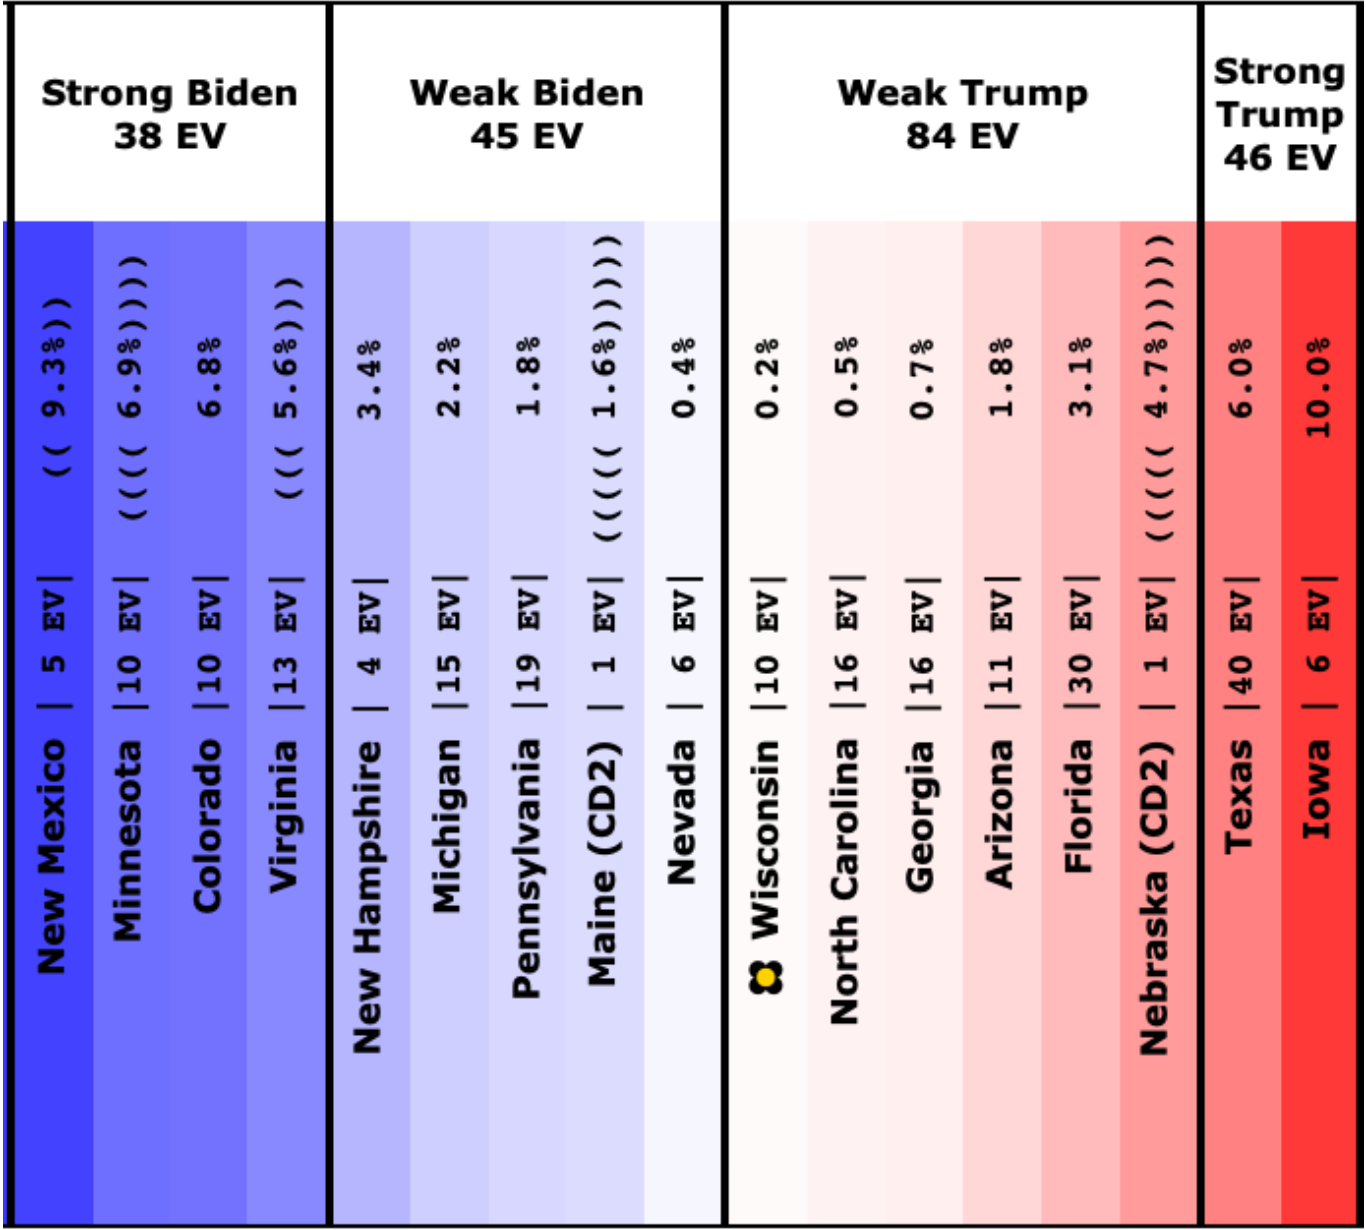
Let's start again with the "spectrum of close states" for Biden vs Trump.
As it was on the last post on 2023-05-21:
And now on 2023-06-25:
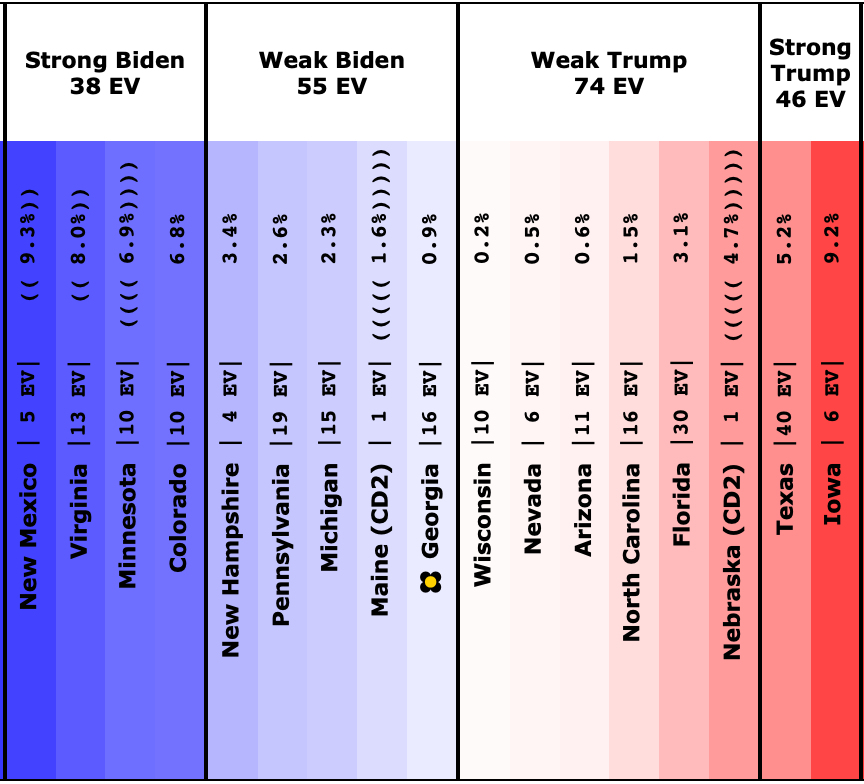
The states where the poll average moved toward Trump are:
- North Carolina: Trump by 0.5% -> Trump by 1.5% (Trump+1.0%)
- Nevada: Biden by 0.4% -> Trump by 0.5% (Trump +0.9%)
And the states where the poll average moved toward Biden are:
- Michigan: Biden by 2.2% -> Biden by 2.3% (Biden+0.1%)
- Pennsylvania: Biden by 1.8% -> Biden by 2.6% (Biden+0.8%)
- Texas: Trump by 6.0% -> Trump by 5.2% (Biden+0.8%)
- Iowa: Trump by 10.0% -> Trump by 9.2% (Biden+0.8%)
- Arizona: Trump by 1.8% -> Trump by 0.6% (Biden+1.2%)
- Georgia: Trump by 0.7% -> Biden by 0.9% (Biden+1.6%)
- Virginia: Biden by 5.6% -> Biden by 8.0% (Biden+2.4%)
Of these there were two that changed categories, so lets take a closer look at those.
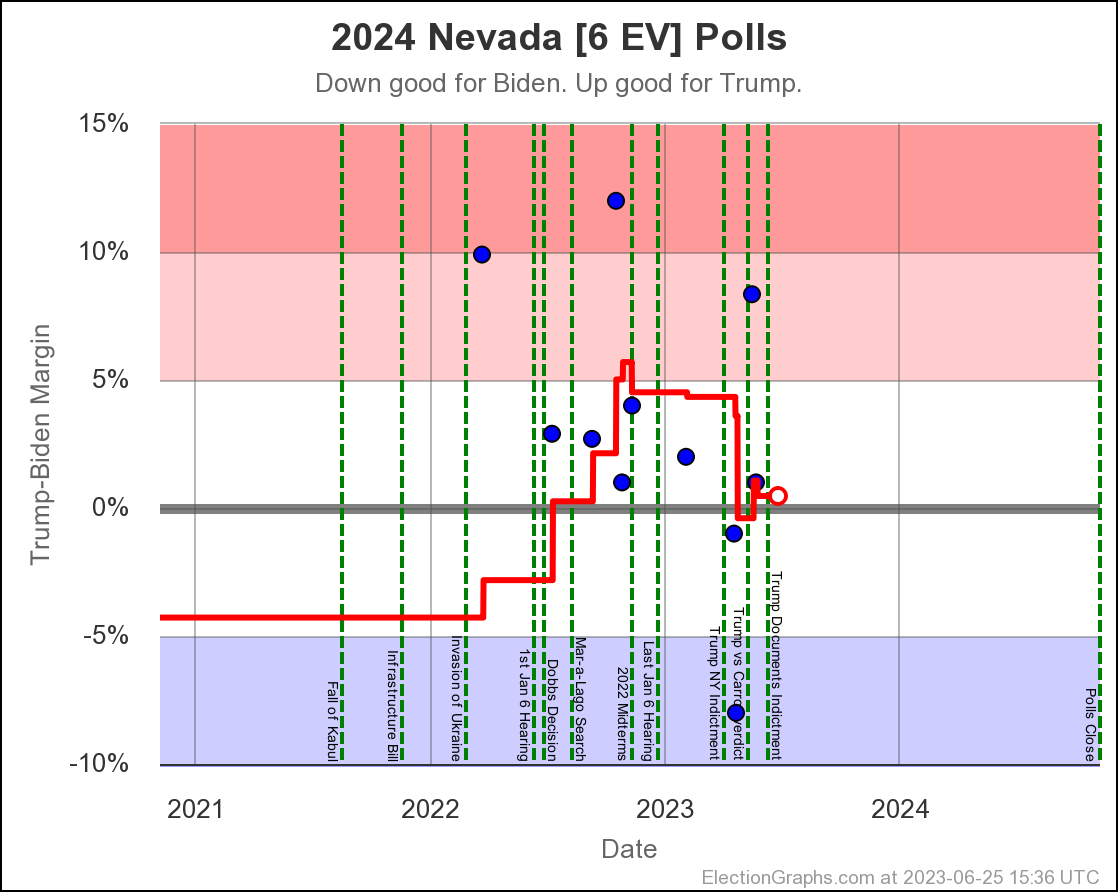
In the last update I said this about Nevada:
You can see that what happened here is that what looks like an outlier leaning toward Trump was replaced in the "last five polls" by an outlier that leans toward Biden, thus moving the average significantly toward Biden. But this leaves us JUST BARELY on the Biden side of the fence. The next poll in Nevada could easily flip the state back to the red side. Or it could show that this was no outlier, but a harbinger of a new trend. Too soon to tell.
Basically, the next poll in Nevada flipped the state back to the red side, just as I said might happen. It was another poll that looks like an outlier, this time on the Trump side. The Election Graphs poll averages don't exclude polls, but just glancing at the chart above and using human judgement, I'd probably throw out any of the polls showing either candidate with a lead over 5%. All the other polls show a close race, and all but one of those show a small Trump lead. So if I had to guess the "true" state of Nevada, I'd say there is a narrow Trump lead.
The one caveat would be that if you look at only those non-outlier polls, the rest seem to be trending slowly toward Biden over time. If you mentally draw that trend line, Nevada is actually pretty close to a tie right now. So maybe the real situation is a tie race in Nevada right now, but trending toward Biden.
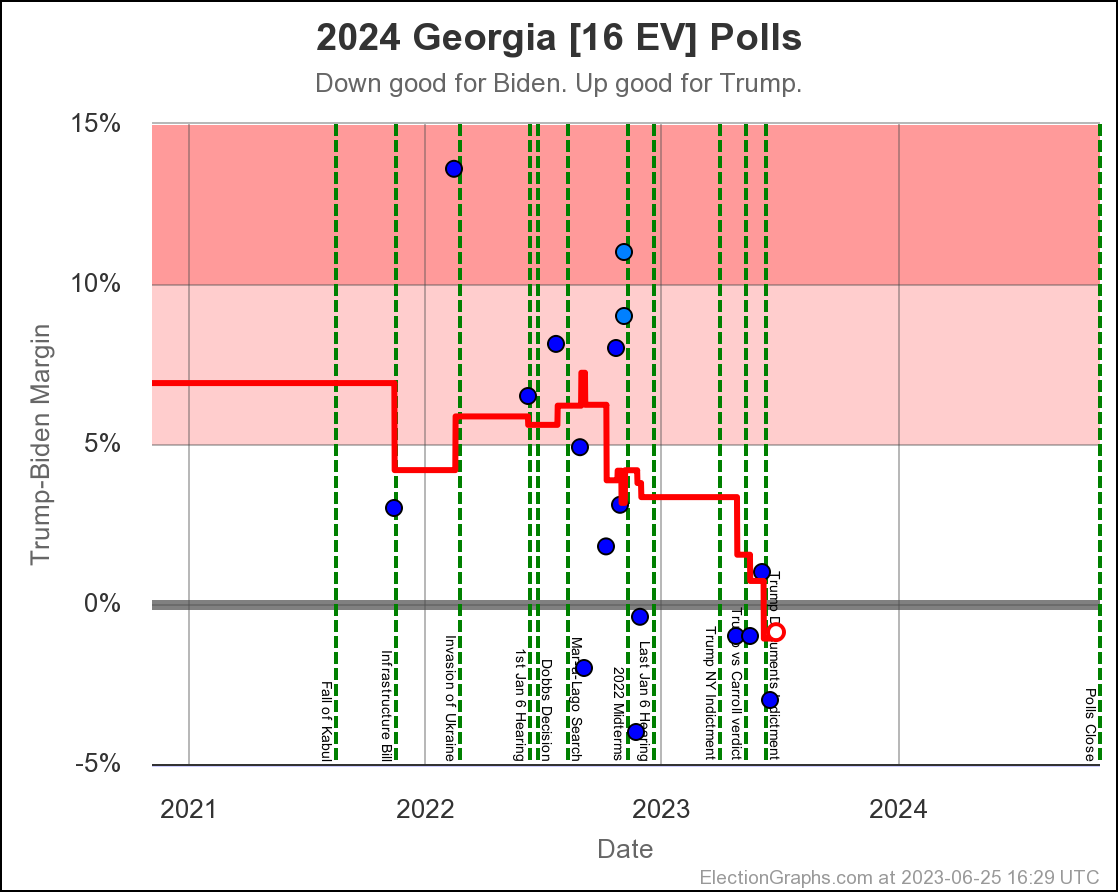
Georgia doesn't seem to have the same outlier issue as Nevada, but there does seem to have been a shift around the midterms in November 2022.
Before that point, there was only a single poll showing a Biden lead, and most polls didn't just show a Trump lead, they showed a Trump lead of more than 5%.
After the midterms, there has only been a single poll showing a Trump lead, with all of the others showing narrow Biden leads.
So what we are seeing here is the Election Graphs average finally having enough post-midterms polls for the trend line to reflect this change and show a narrow Biden lead, which seems about right for Georgia right now.
The actual poll average right now is an 0.9% Biden lead in Georgia. But based on looking at how Election Graphs poll averages correlated to actual election results from 2008 to 2020, a Democratic lead of 0.9% only translates into a 46.1% chance of the Democrat winning, at least based on that historical performance.
Simply put, more times than not, the polling average has underestimated the Republican, which means the Democrat needs to be leading the poll average by more than 1.3% for me to list them as having a better than 50/50 shot of winning. If anybody wants details of how I calculate that, look at this post from January.
As everyone knows, "past performance is not a guarantee of future results", but looking at past performance is the best I can do.
Bottom line though, Georgia is looking super close at the moment, and like Nevada, could easily go either way if the election was held today. (Which, obviously, it won't be, and things will change a thousand times before we get there.)
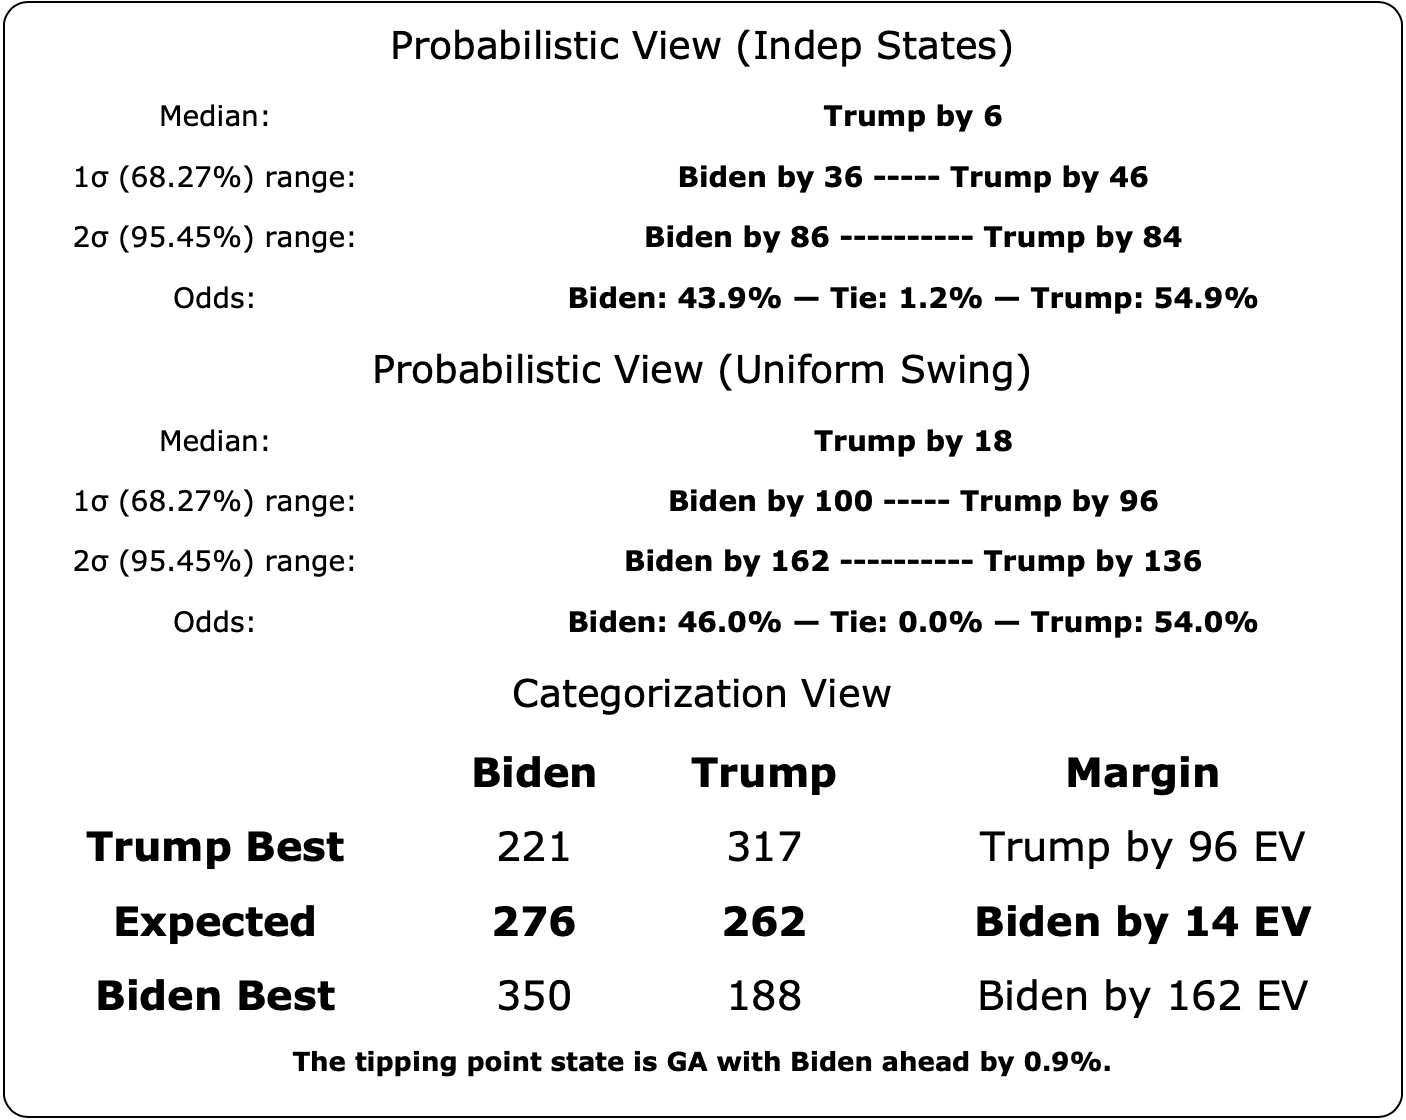
OK, so how does all this change the national picture? Here is the current overall summary:
Looking at the evolution of the Biden win odds first:
- 2023-03-25: Between 17.8% and 25.8%
- 2023-04-24: Between 24.9% and 32.3%
- 2023-05-21: Between 34.9% and 35.9%
- 2023-06-25: Between 43.9% and 46.0%
Each month Biden has been stronger than the month before.
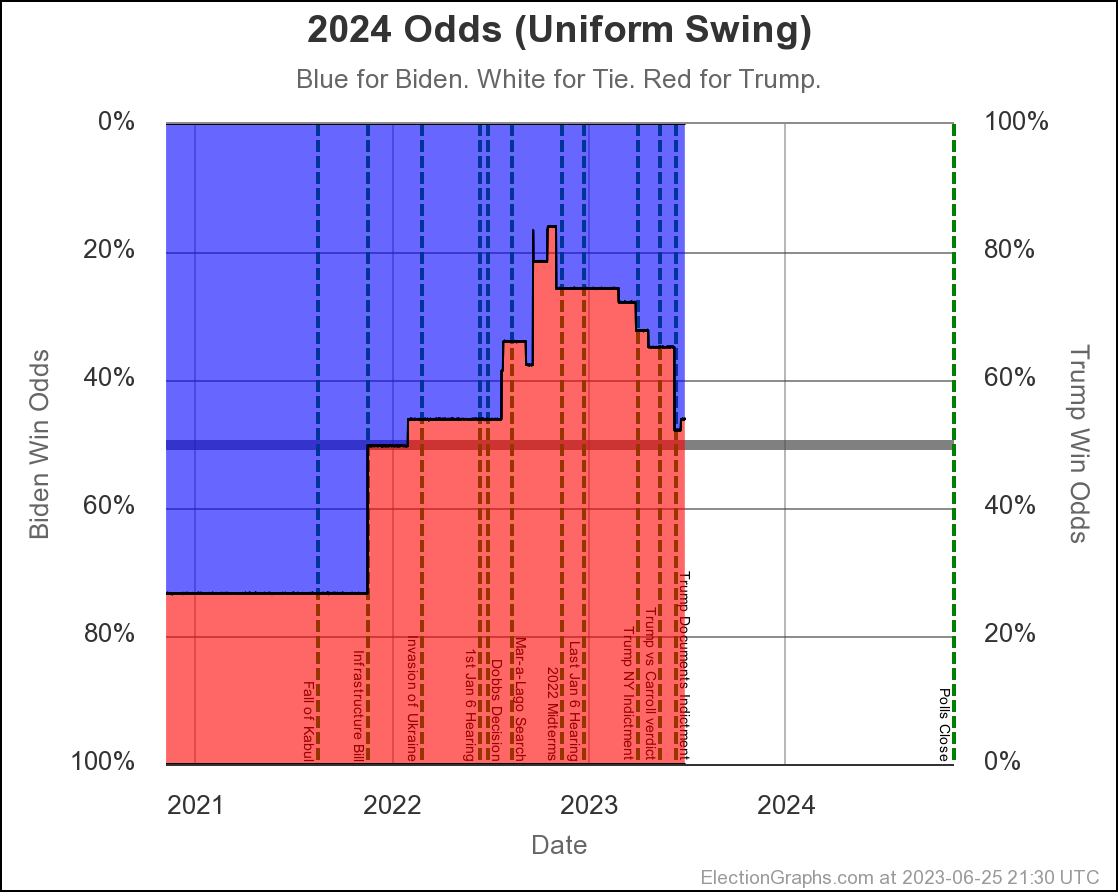
Visually, the two odds charts:
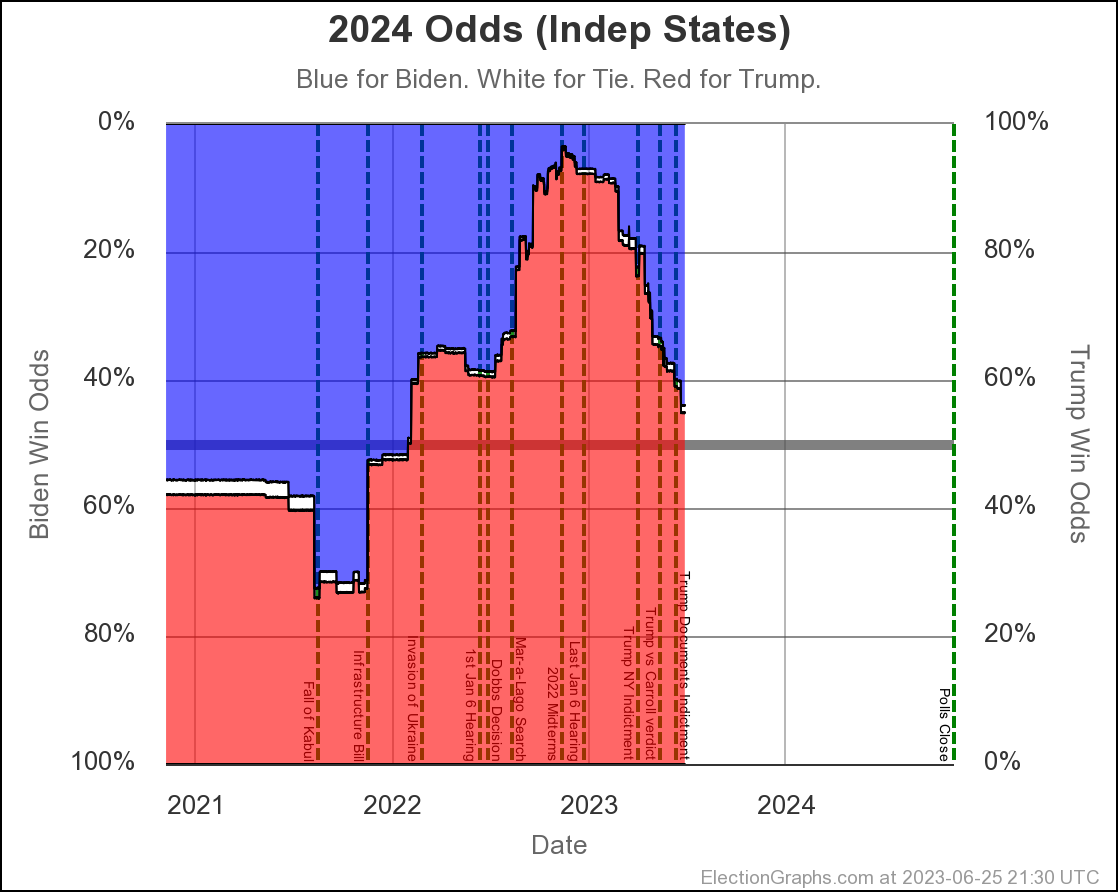
Trump still has a slight advantage, but only due to what I mentioned earlier about the Election Graphs polling average tending to underestimate the Republicans in the last few cycles.
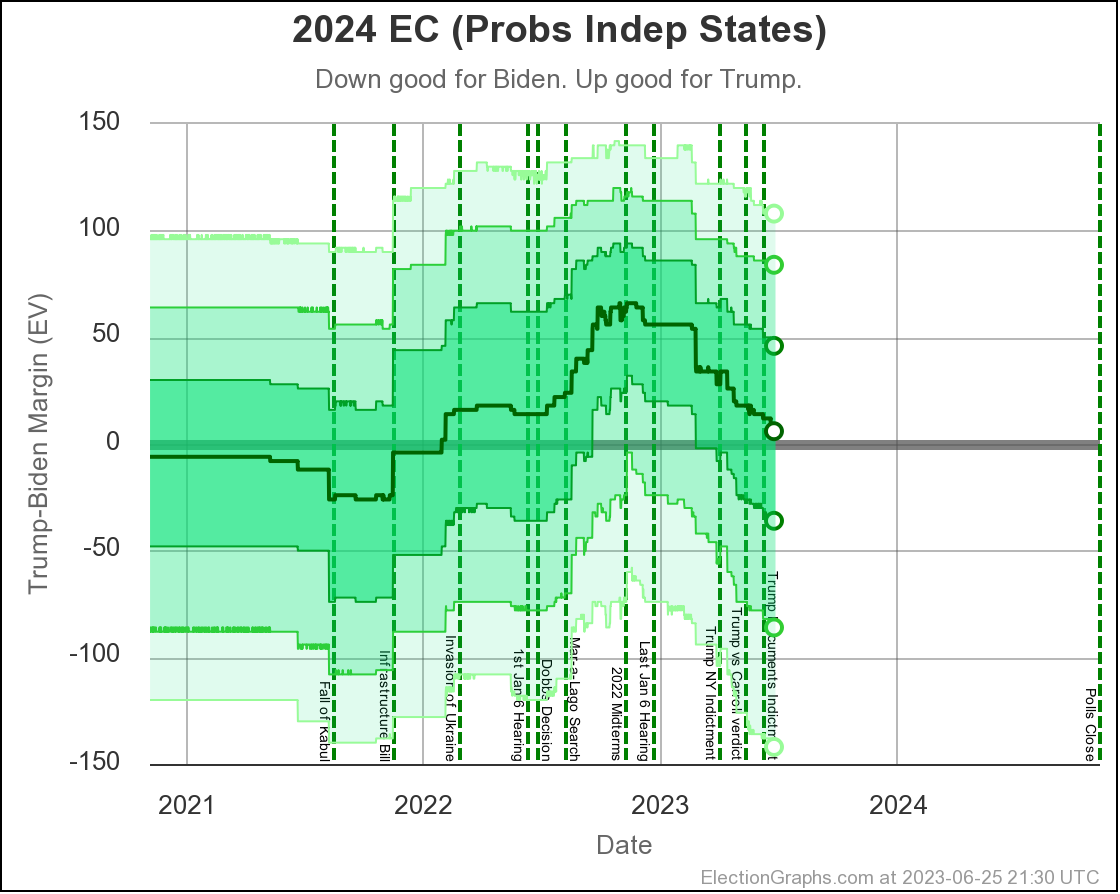
Taking that factor into account here is what the trend in the range of possibilities looks like assuming the states are completely independent:
And assuming any polling error will be the same in every state:
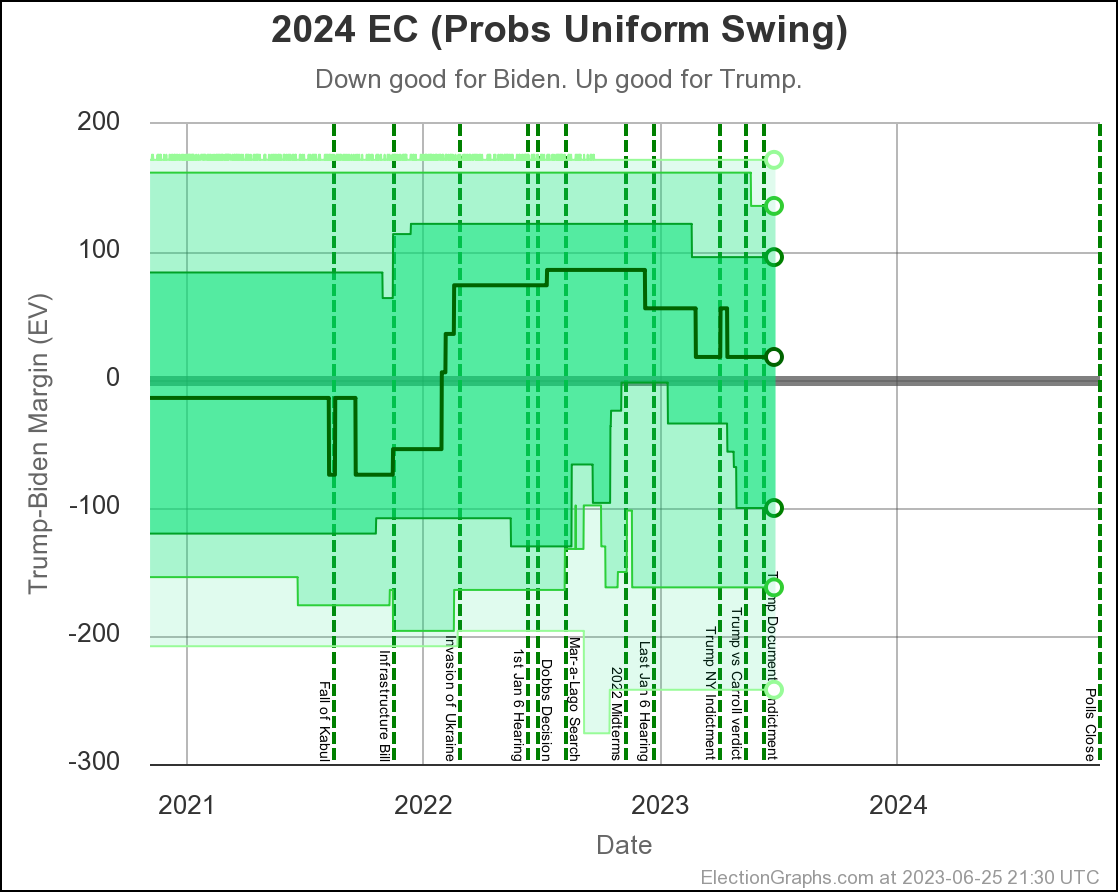
Both of these views show Trump with a slight advantage, but with a huge range of possible outcomes very possible. The darker the green, the more likely the outcome is in that range, with the three shades being 1σ (68.27%), 2σ (95.45%), and 3σ (99.73%) probability bands.
In both models above, even the 1σ bands include either candidate winning, so this remains a situation where either candidate could win easily.
Removing the "well, polls have underestimated Republicans in the past" factor and just looking at who is ahead in each state and what the close states are, you get this:
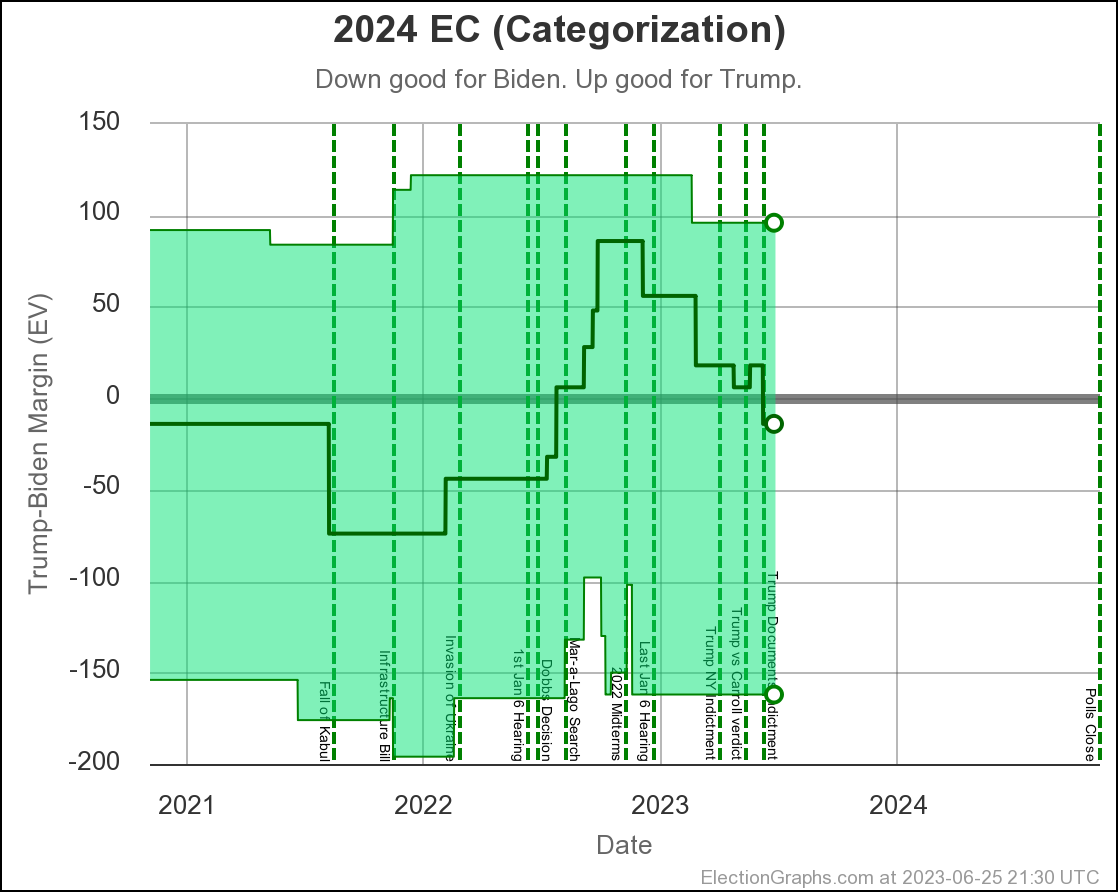
Looking at snapshots of this on the days I've done blog posts:
Categorization Trump Best / Expected / Biden Best:
- 2023-03-25: Trump+96 / Trump+18 / Biden+162
- 2023-04-24: Trump+96 / Trump+18 / Biden+162
- 2023-05-21: Trump+96 / Trump+6 / Biden+162
- 2023-06-25: Trump+96 / Biden+14 / Biden+162
It is easy to just fixate on that middle number moving toward Biden. Unlike the two probabilistic models, Biden is indeed in the lead for the first time since September.
But once again the full picture here is that there is a wide range of reasonably possible options, and we essentially have a tie race right now.
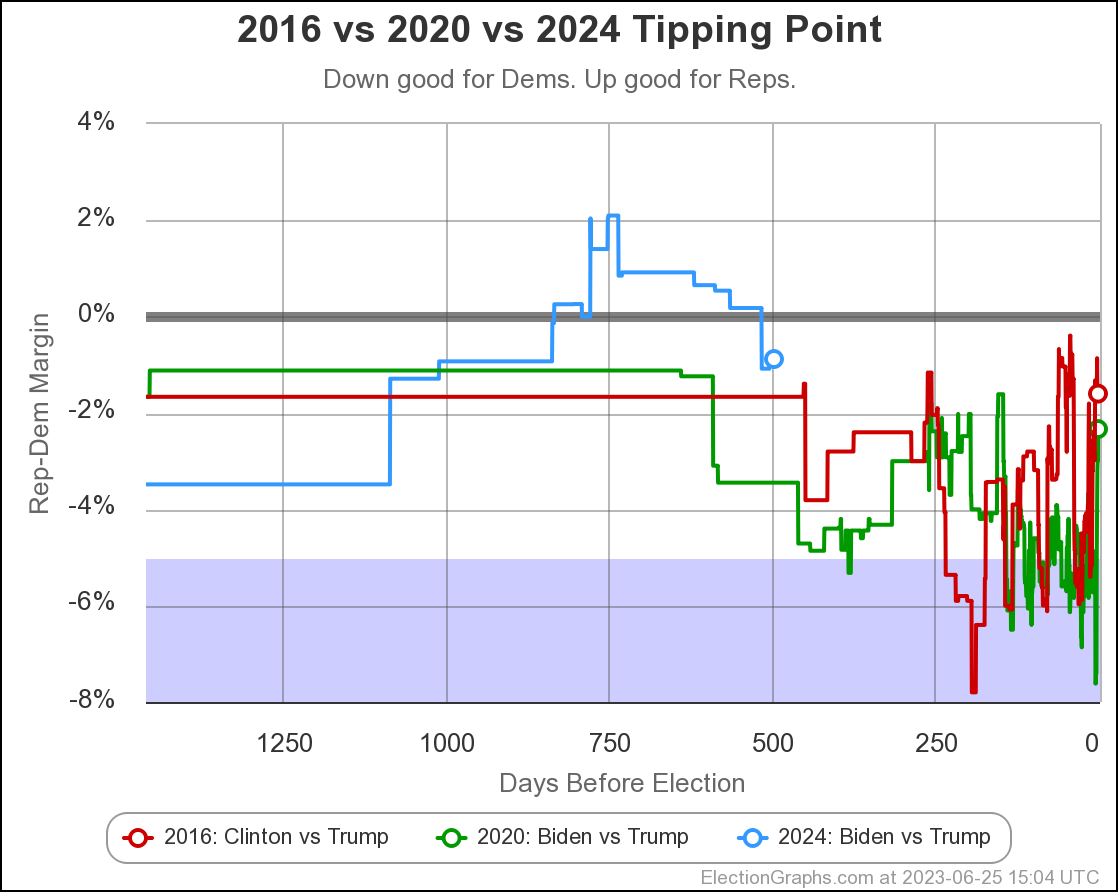
A more subtle way to look at the straight unmodified polls is to look at the "tipping point", which is how much you would have to shift all the polls to change the winner. It has been evolving like this:
- 2023-03-25: Trump by 0.7% in Wisconsin
- 2023-04-24: Trump by 0.5% in North Carolina
- 2023-05-21: Trump by 0.2% in Wisconsin
- 2023-06-25: Biden by 0.9% in Georgia
Once again, this is just another way of showing a very close race, but one that is moving slowly in Biden's direction.
But how does this compare to the last couple of cycles?
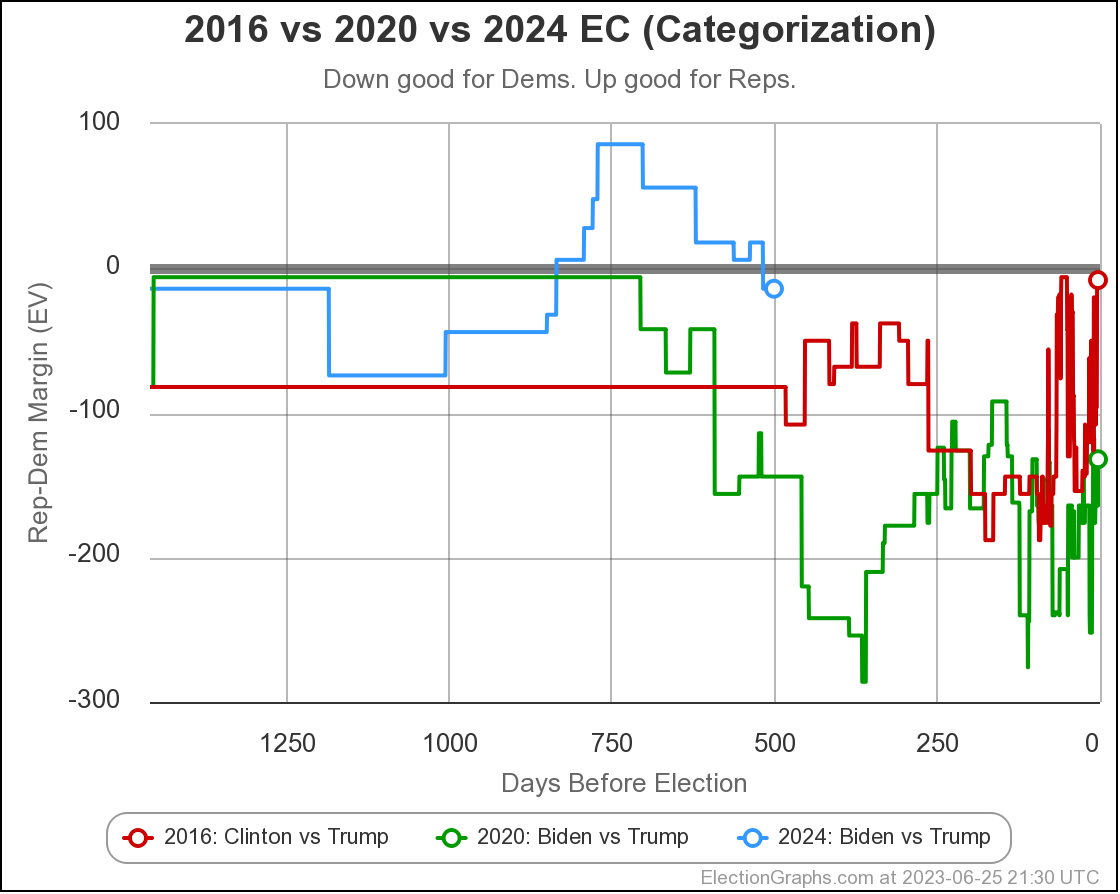
So… yes, things have been moving away from Trump and toward Biden. But Trump is polling better now than he was either 4 or 8 years ago. I've said this before, and I'll say it many more times I'm sure: Nobody should underestimate Trump in this situation.
But what about people other than Trump?
The only other candidate combination with more than scattered polls here and there is Biden vs DeSantis. But the polling at the state level for this combination is still woefully inadequate.
For Biden vs Trump there are enough polls for a full poll average that doesn't rely on old election results as a baseline in every single one of the close states (not counting ME and NE CDs).
For Biden vs DeSantis, the only close states with that much polling are Georgia, Nevada, and Arizona. (DeSantis also has that level of polling in Florida, but while Florida is a close state for Trump, it is not for DeSantis.)
Bottom line, continue to treat Biden vs DeSantis with a big grain of salt until there is a lot more polling. And completely ignore all the OTHER possible combinations. The polling for those is still just completely useless.
Having said that, here is a look at the median case for the independent states model that compares the most polled combinations:
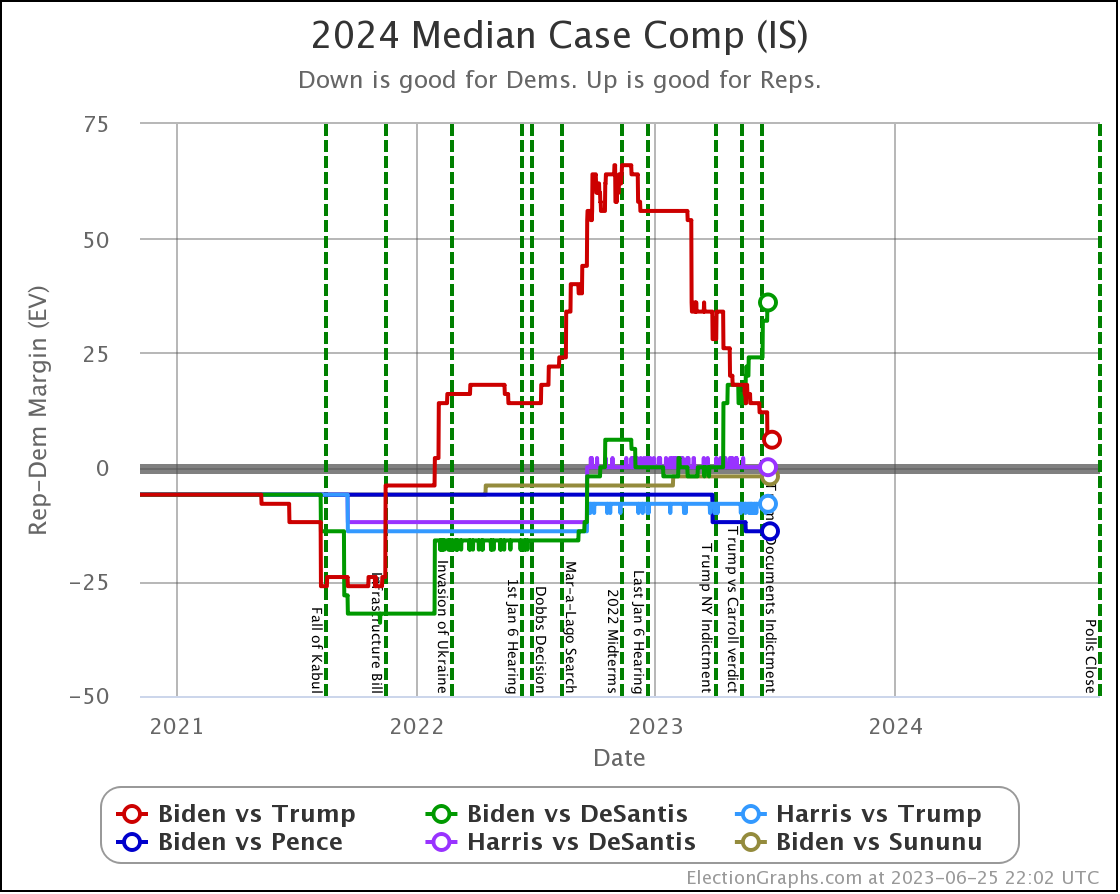
Like I said, ignore everything besides Biden vs Trump and Biden vs DeSantis, and take Biden vs DeSantis with a grain of salt, but…
The recent trend does show that while Trump has been falling vs Biden, DeSantis has been rising. Based on this particular view of the current state level polls, DeSantis would do much better against Biden than Trump would.
Again though, until there are a good number of Biden vs DeSantis polls in all of the close states, I would not completely trust that Biden vs DeSantis picture.
I'm also showing the single chart that shows the best picture for DeSantis here. While DeSantis is improving on the other metrics too, it is nowhere near as dramatic as this one. For full Biden vs DeSantis info, look here.
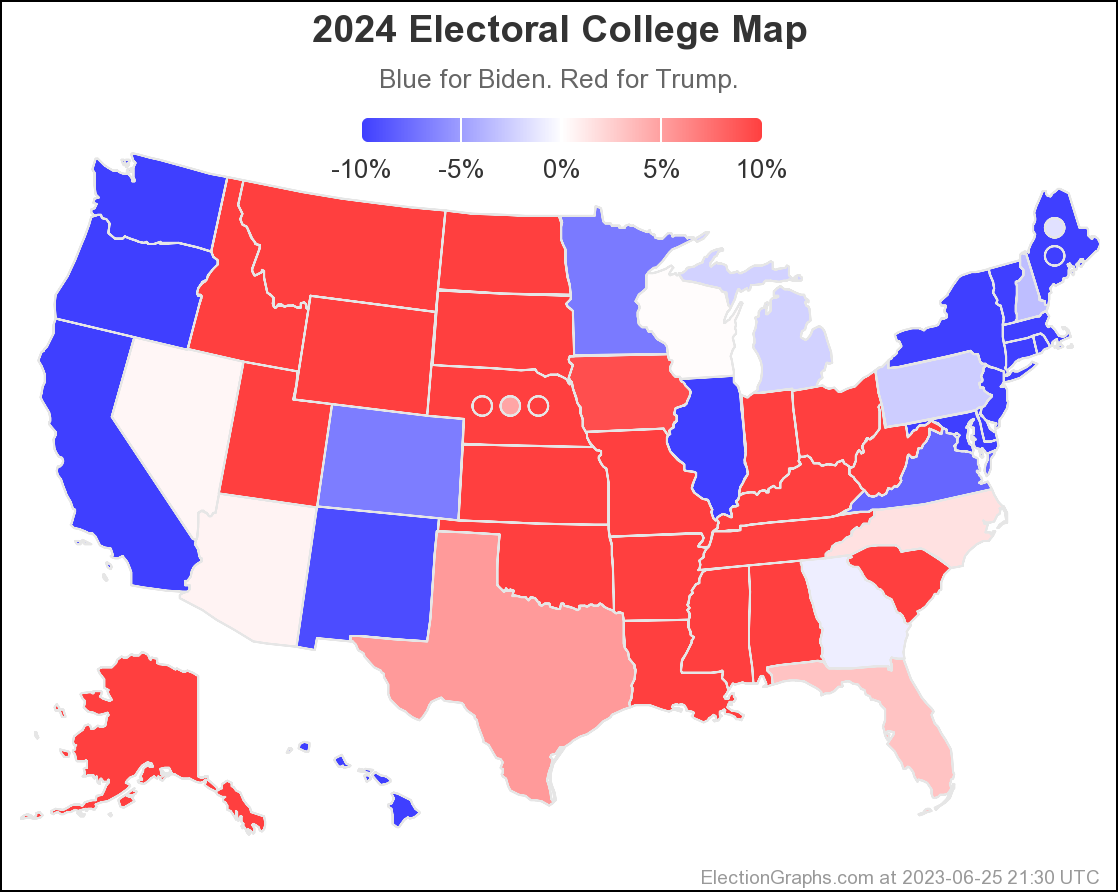
That is enough for now. As usual, I'll close with the update national map for Biden vs Trump:
I mentioned at the top that there would be less than 500 days left by the time I got the post published. I was right. It is a whole day later. 🙂
499.0 days until polls start to close on Election Day 2024.