It has been 12 days since my last post. I probably should be doing these weekly at this point, but other things still get in the way. I'm taking time off from the day job for the final two weeks before the election though, so I'll probably do more updates then.
Within reason. Even with updates 12 days apart like this, a lot of the "movement" may just be noise. Just changes within the inherent uncertainty of polling, and with which pollsters happened to be included in the averages at the time of the update. So even when we talk about week to week changes, it will be important to look at the longer term trends, because there is so much polling going on these days, that short term variations may not be "real".
So we'll try to do that, starting with the summary of where we are:
In the last 12 days, the Election Graphs state level polling averages in the critical states have moved toward Trump. Harris is now in the weakest position she has been in since the end of July.
That however still leaves us with a race that is too close for polling to be able to reliably predict a winner. The range of reasonable possibilities goes from a healthy Harris win to a healthy Trump win, and anything in between.
At this very moment, Trump would be favored by a bit (EG currently gives Trump a 70% to 75% chance of winning), but the tipping point is close enough that the next batch of swing state polls could change that dramatically.
Polling is so close to the tie line, that tiny differences in the most recent polls can change who is "ahead". It is just too close for us to be able to tell who is "really" ahead with these kinds of poll averages, and the day to day or week to week changes may not be "real", and it is best to look at longer term trends.
And the longer term trend is that this "right on the line, could go either way" scenario has been where we have been since the end of July. There has been some back and forth in the numbers week to week, but that overall conclusion has not changed substantially since shortly after Harris took over from Biden.
OK, with that out of the way, let's look at some of those short term changes I just told you to ignore.
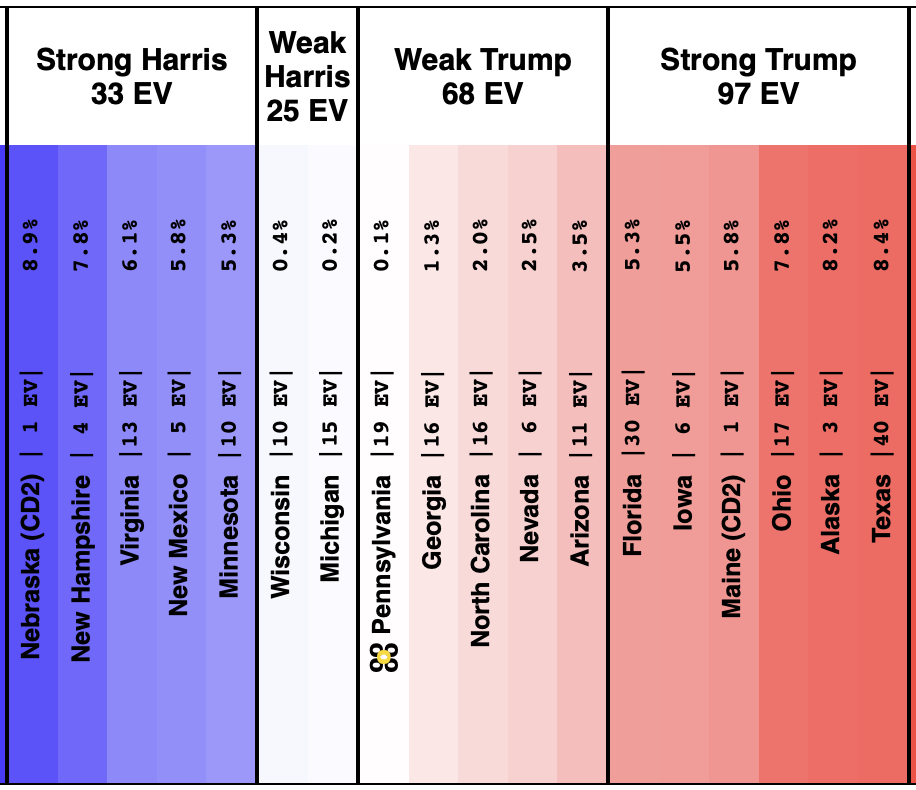
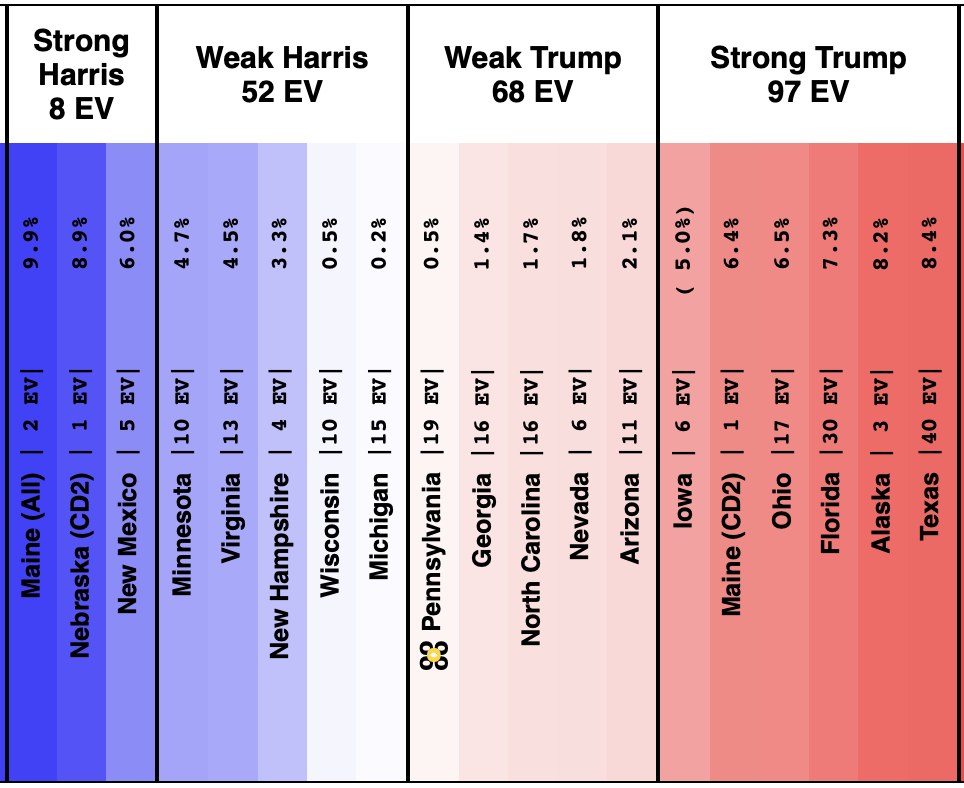
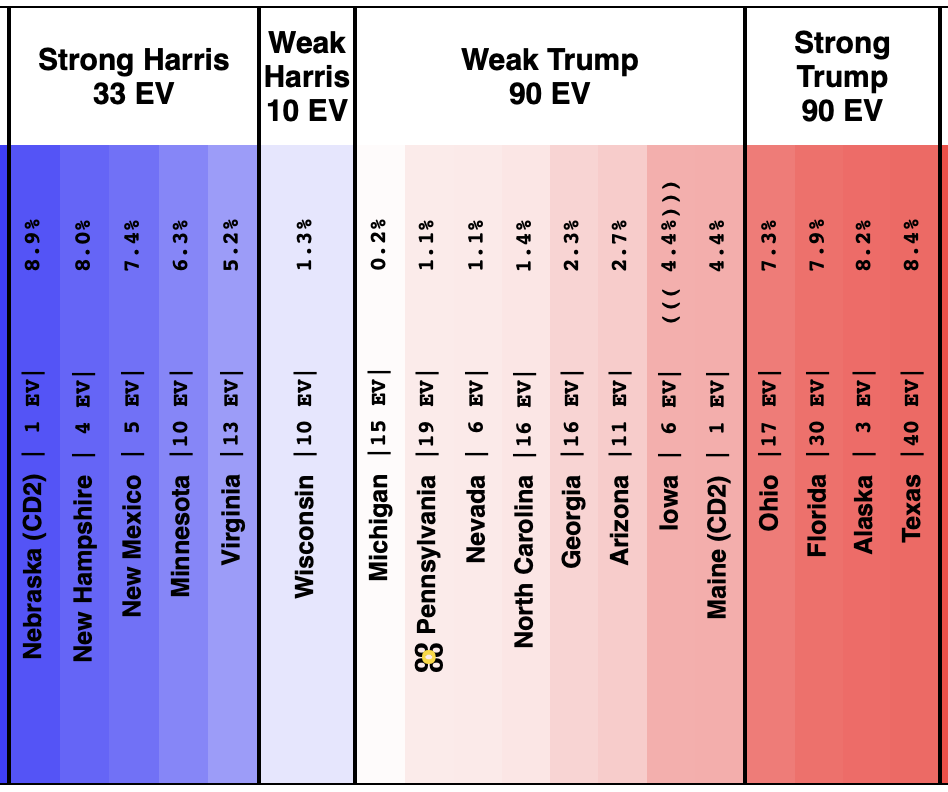
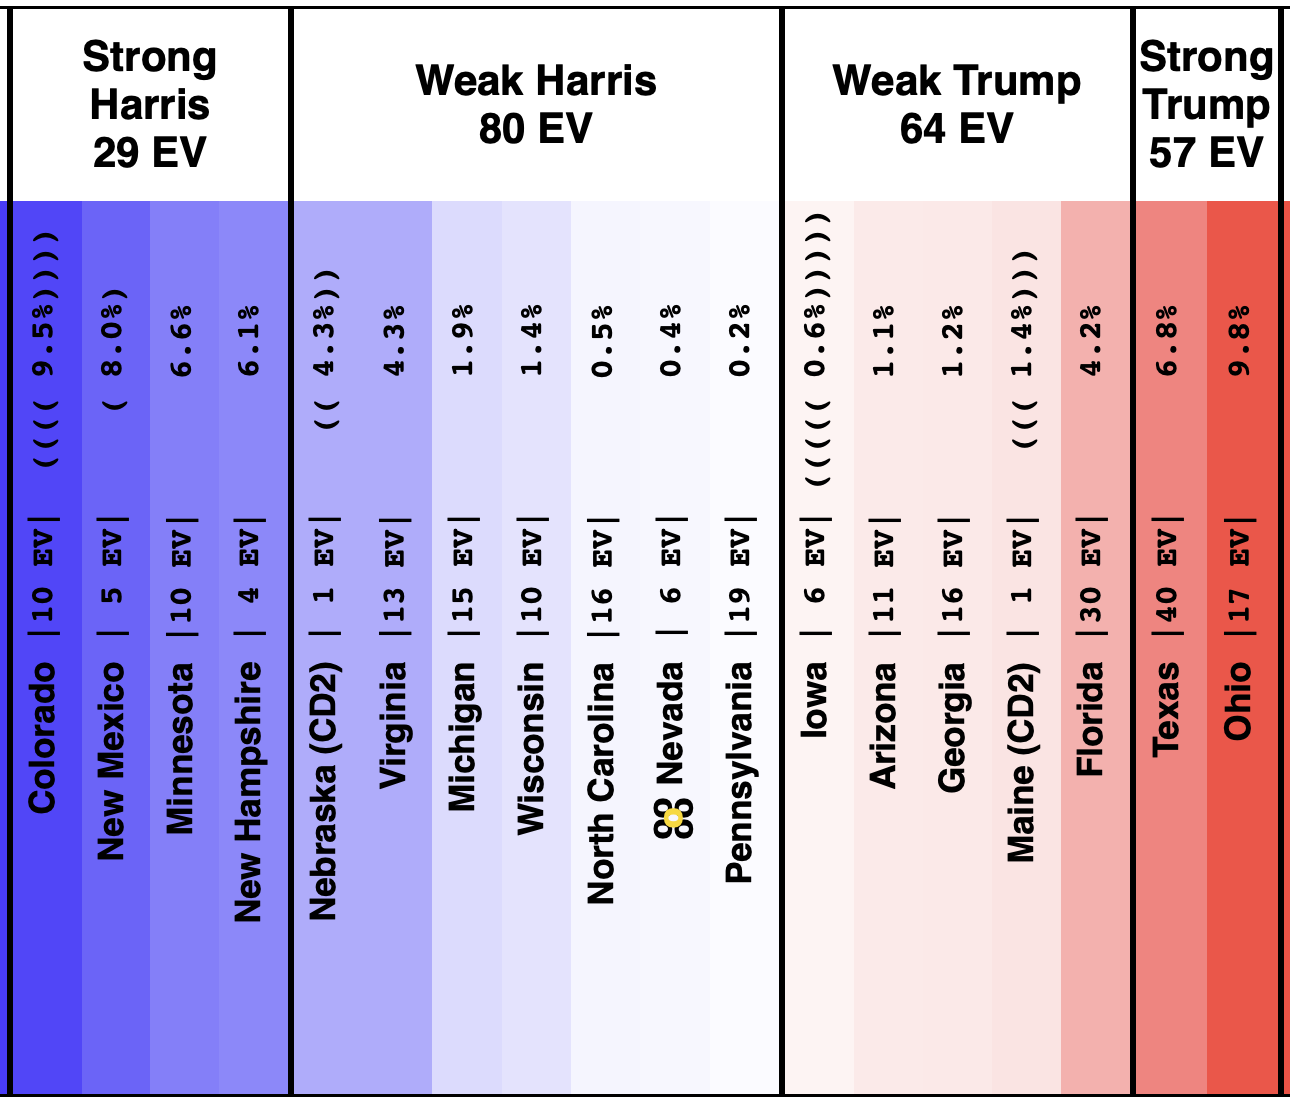
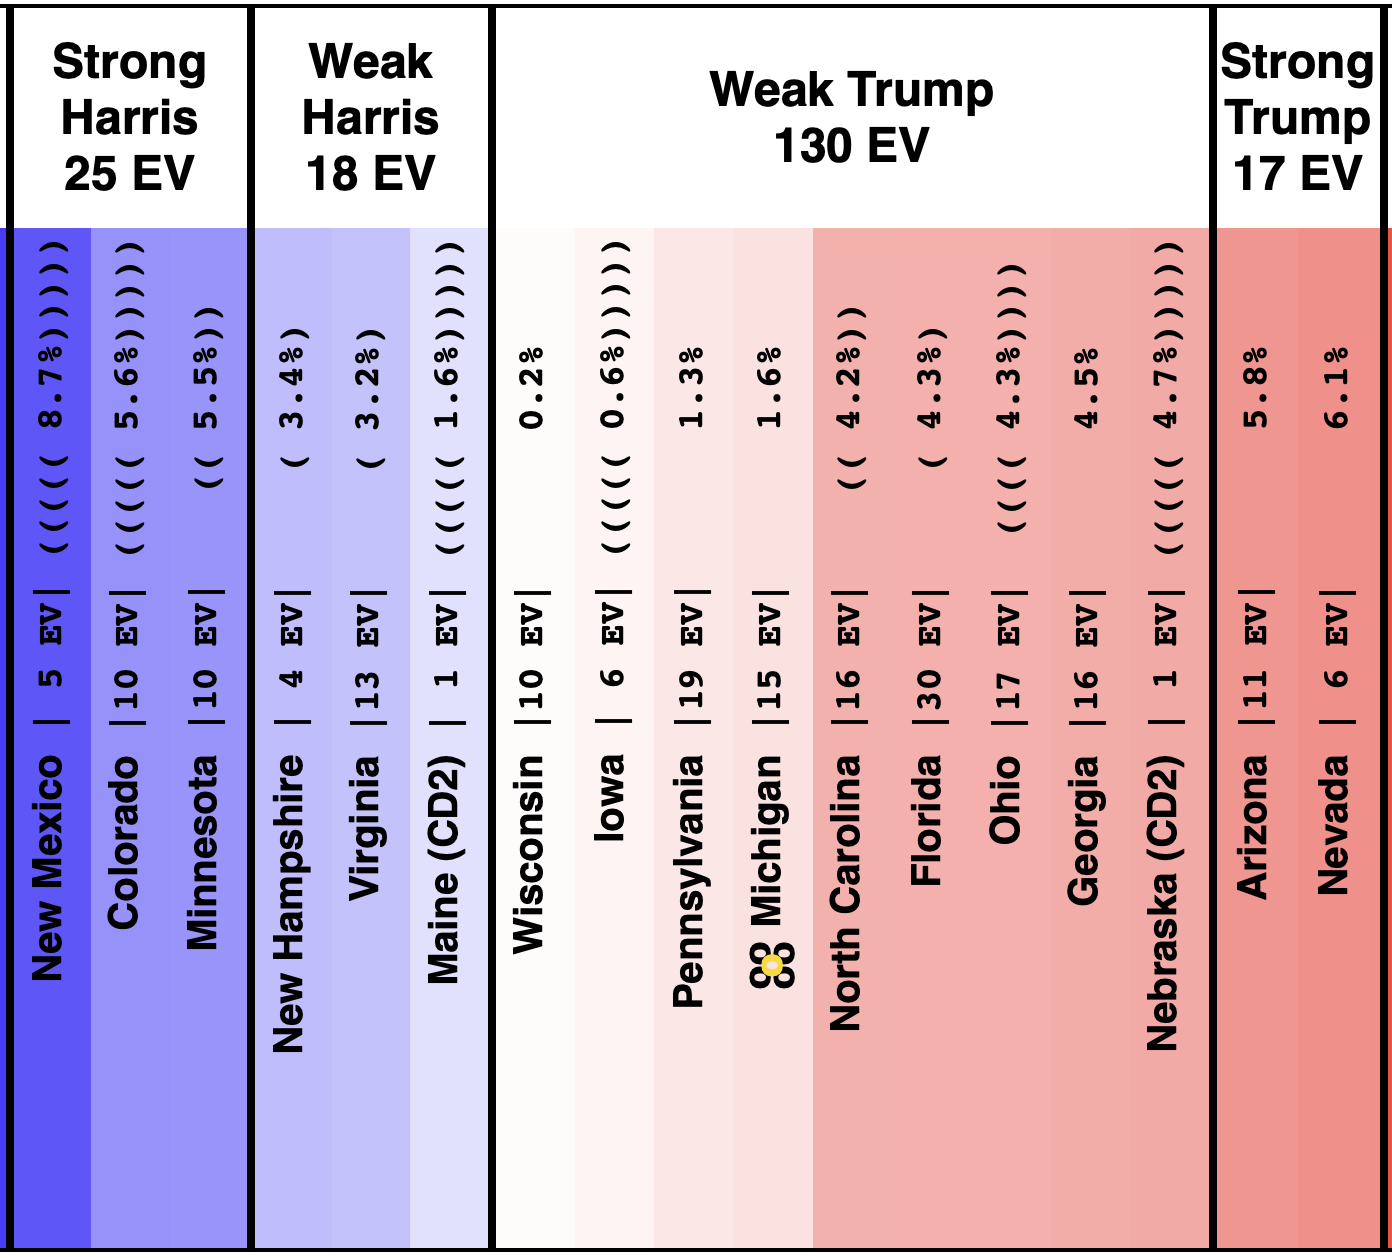
On 2024-09-25 the spectrum of states with margins under 10% looked like this:

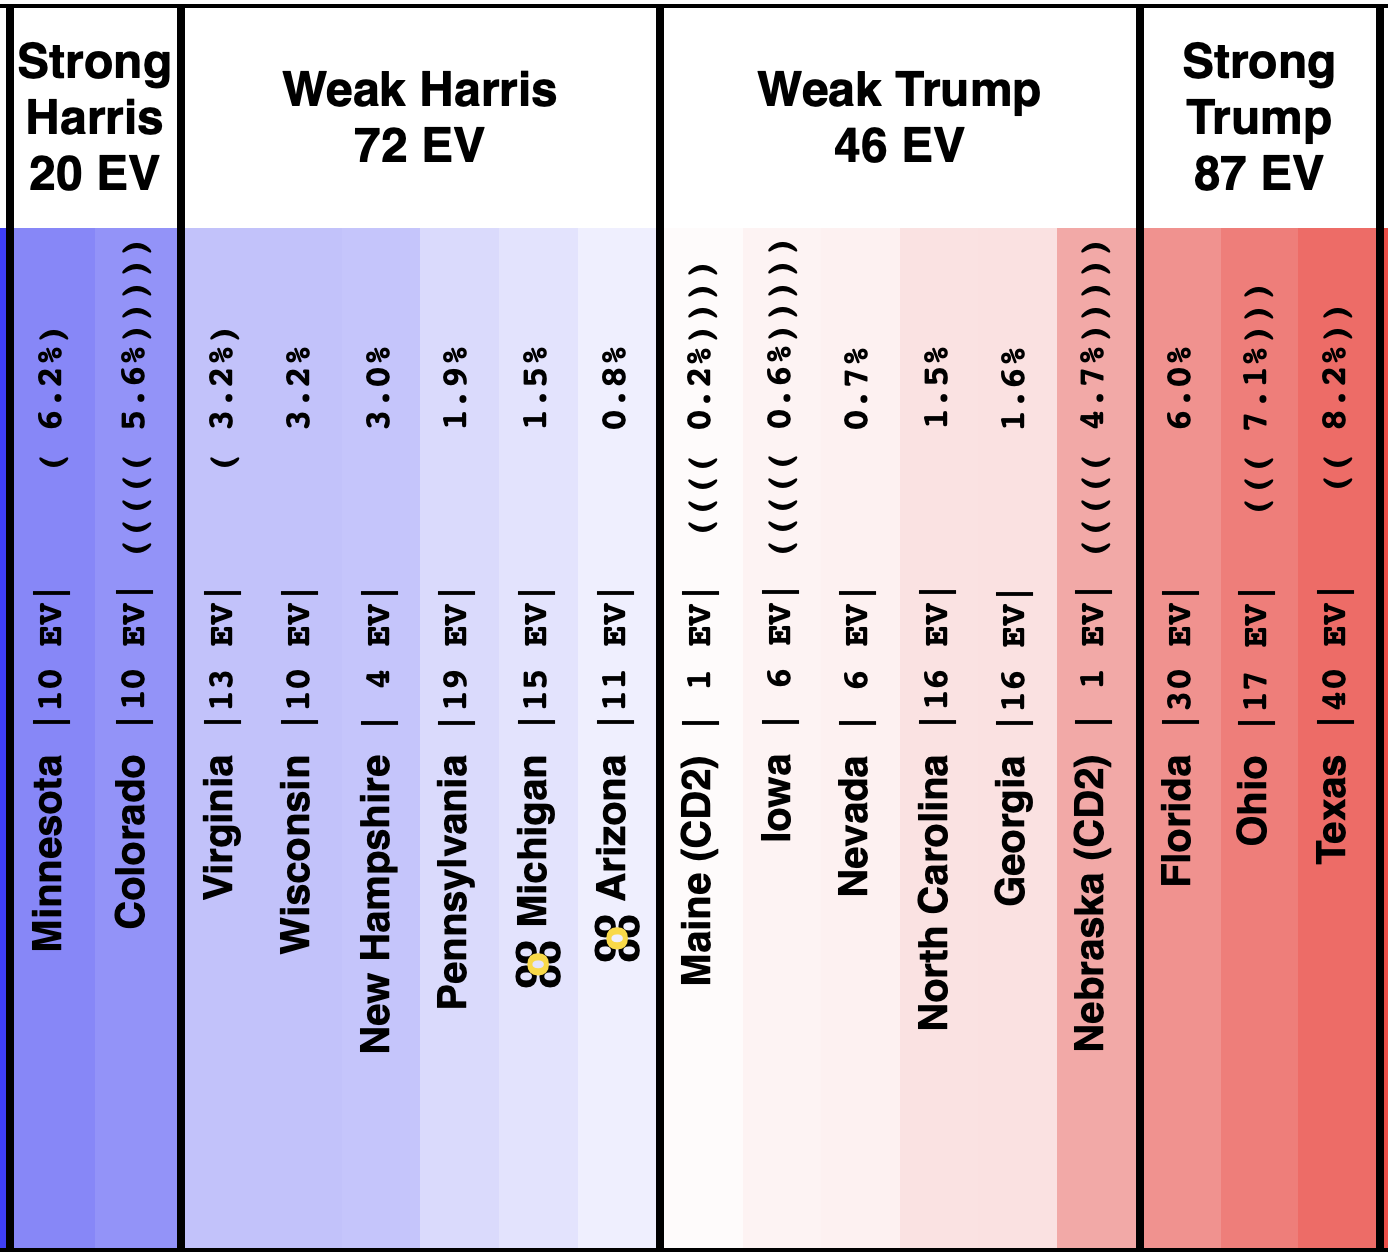
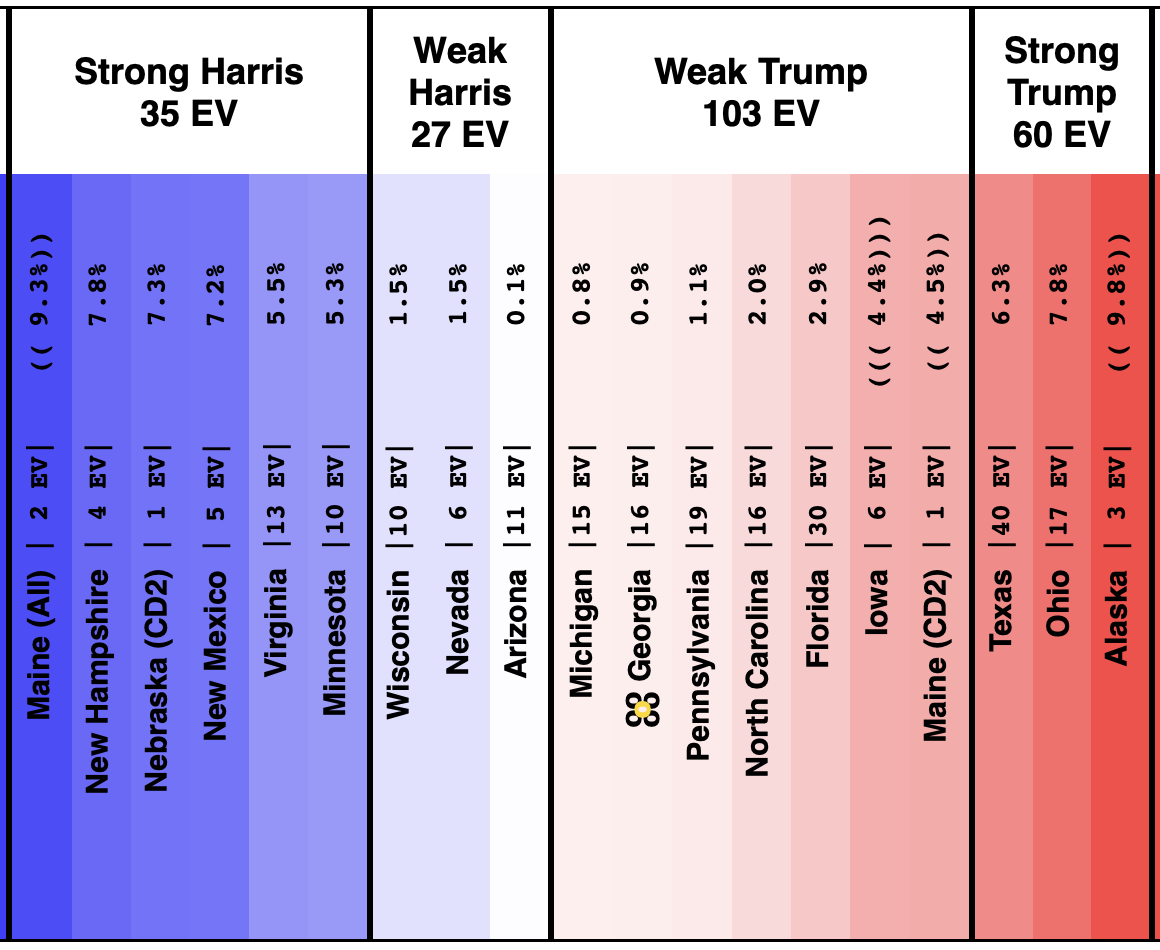
And as of 01:00 UTC on 2024-10-07 when I started this blog post:
So lets look at the changes:
Movement toward Trump:
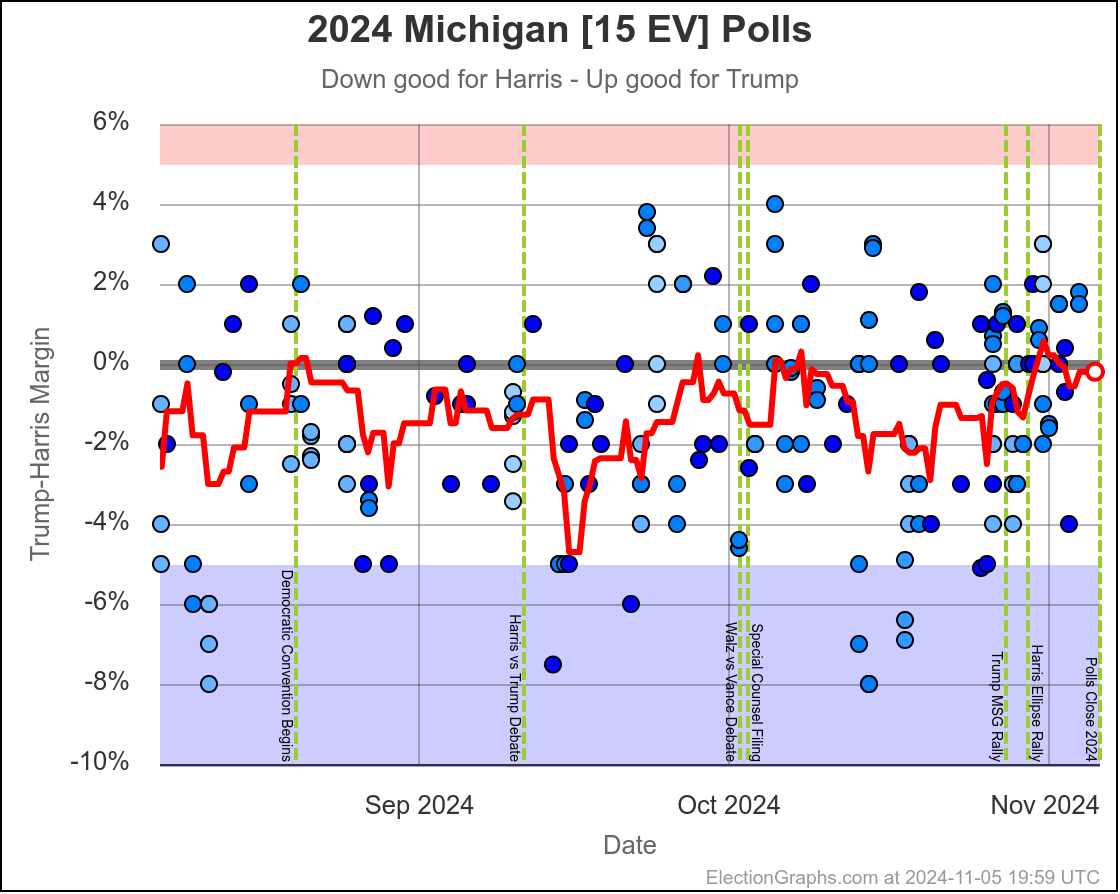
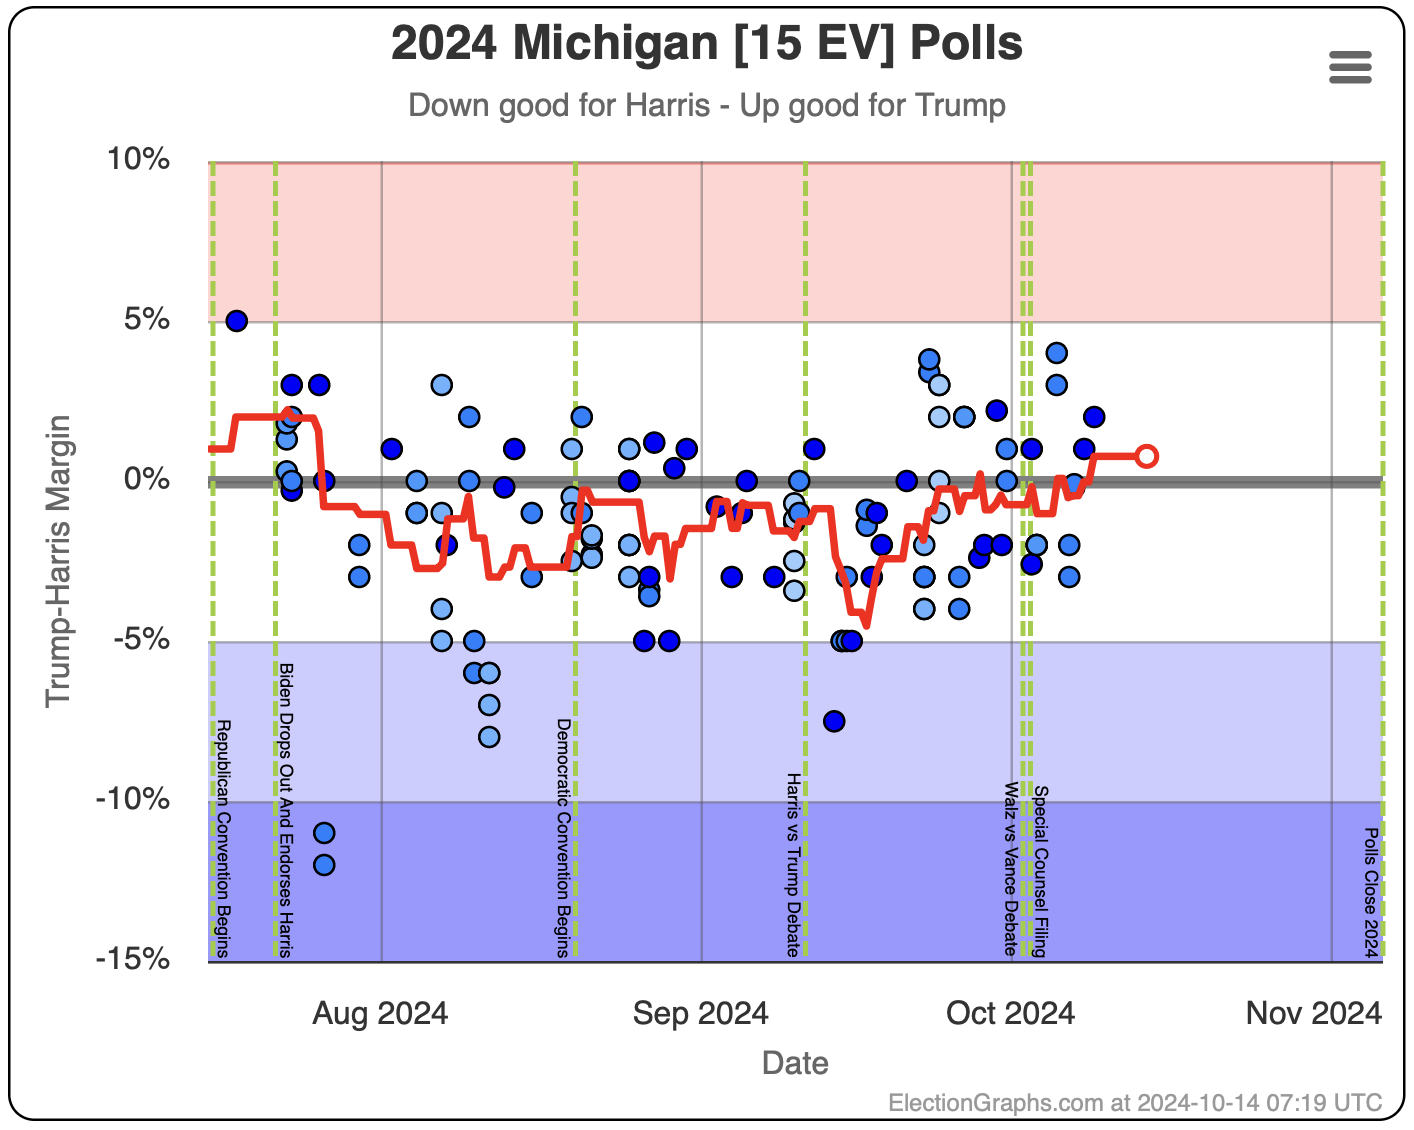
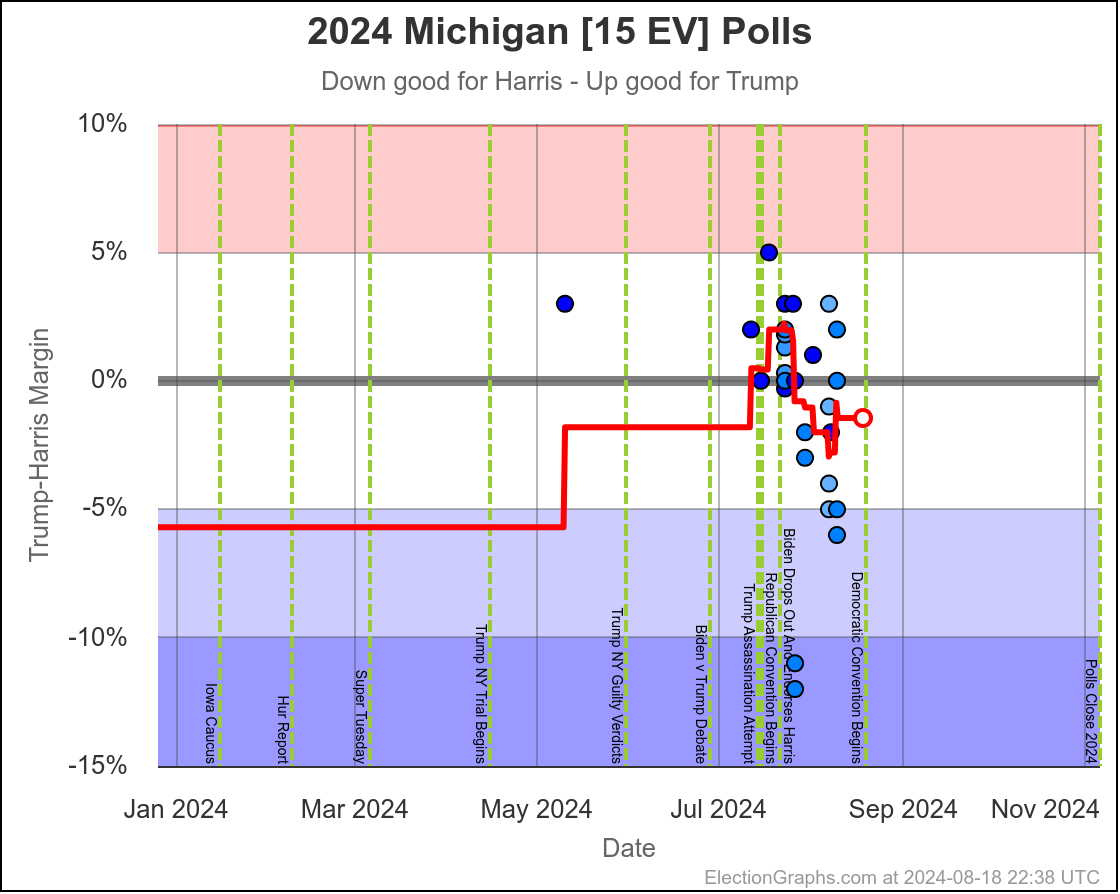
- Michigan (10 EV): Harris by 2.8% -> Trump by 0.8% (Trump+3.6%)
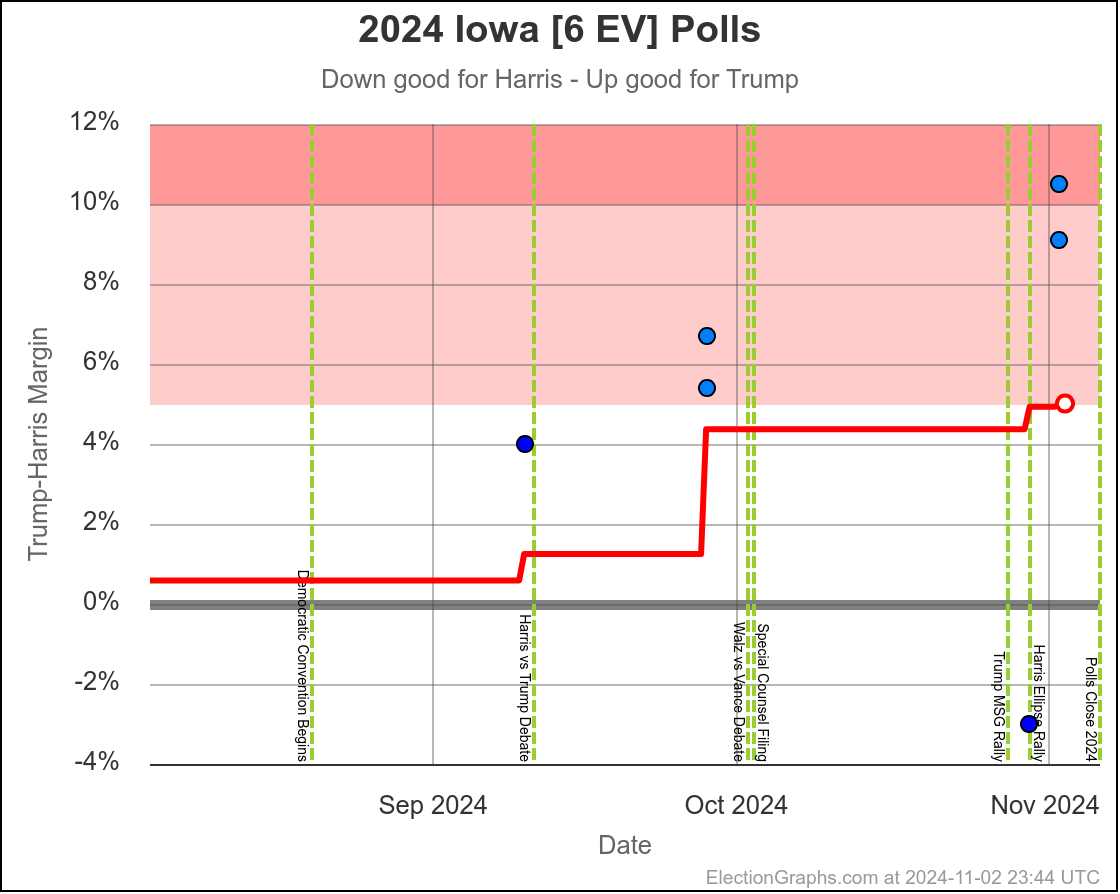
- Iowa (6 EV): Trump+1.3% -> Trump+4.4% (Trump+3.1%)
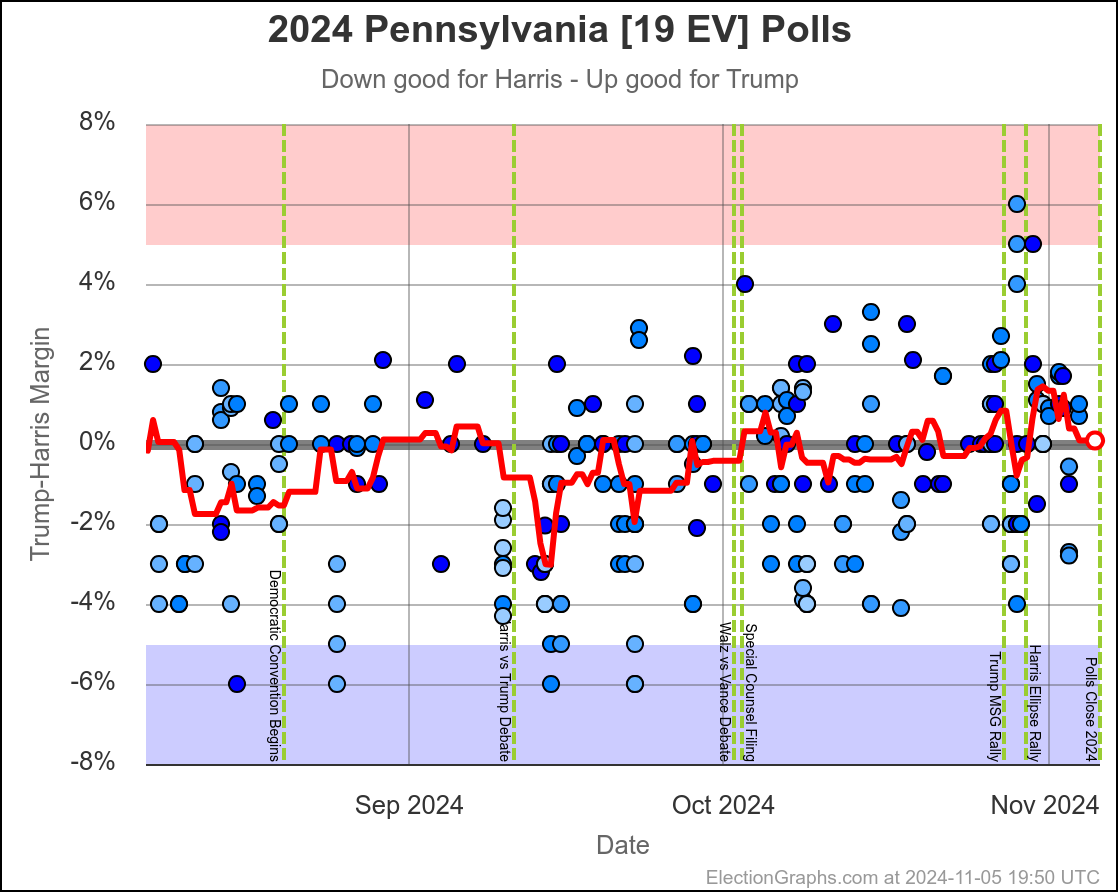
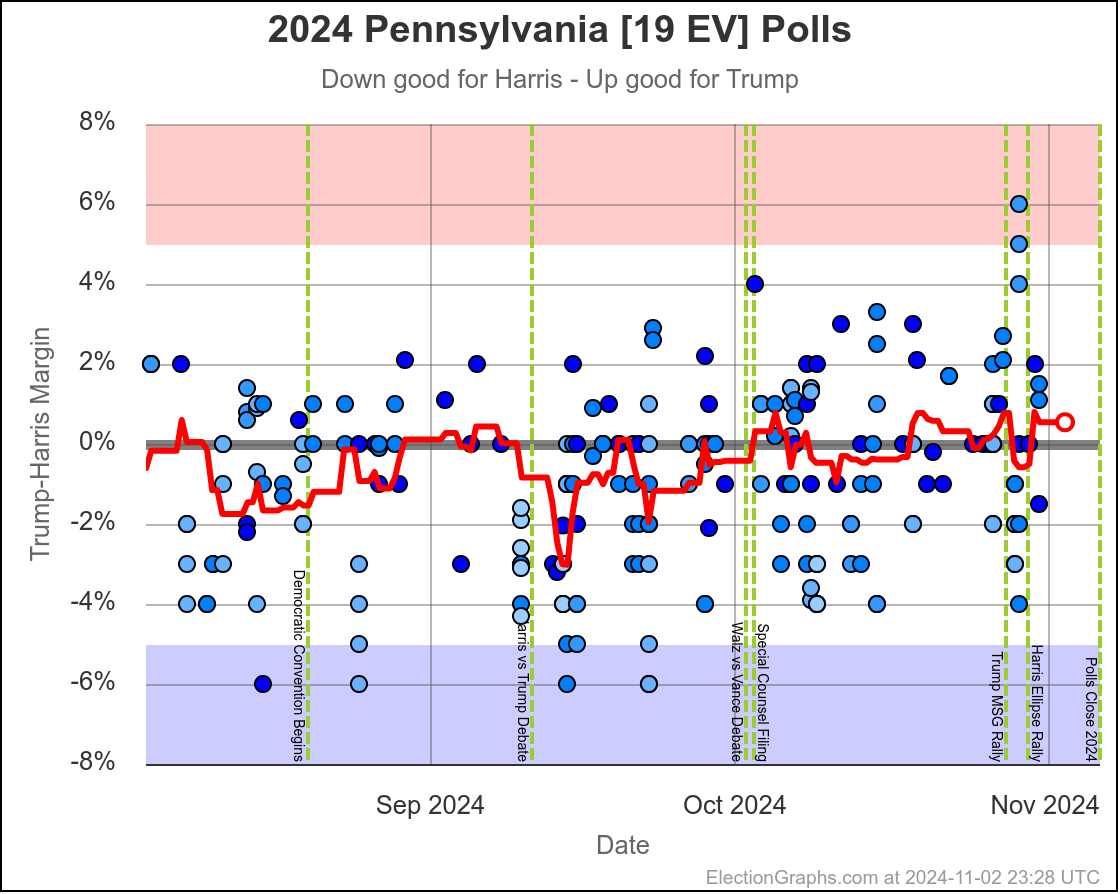
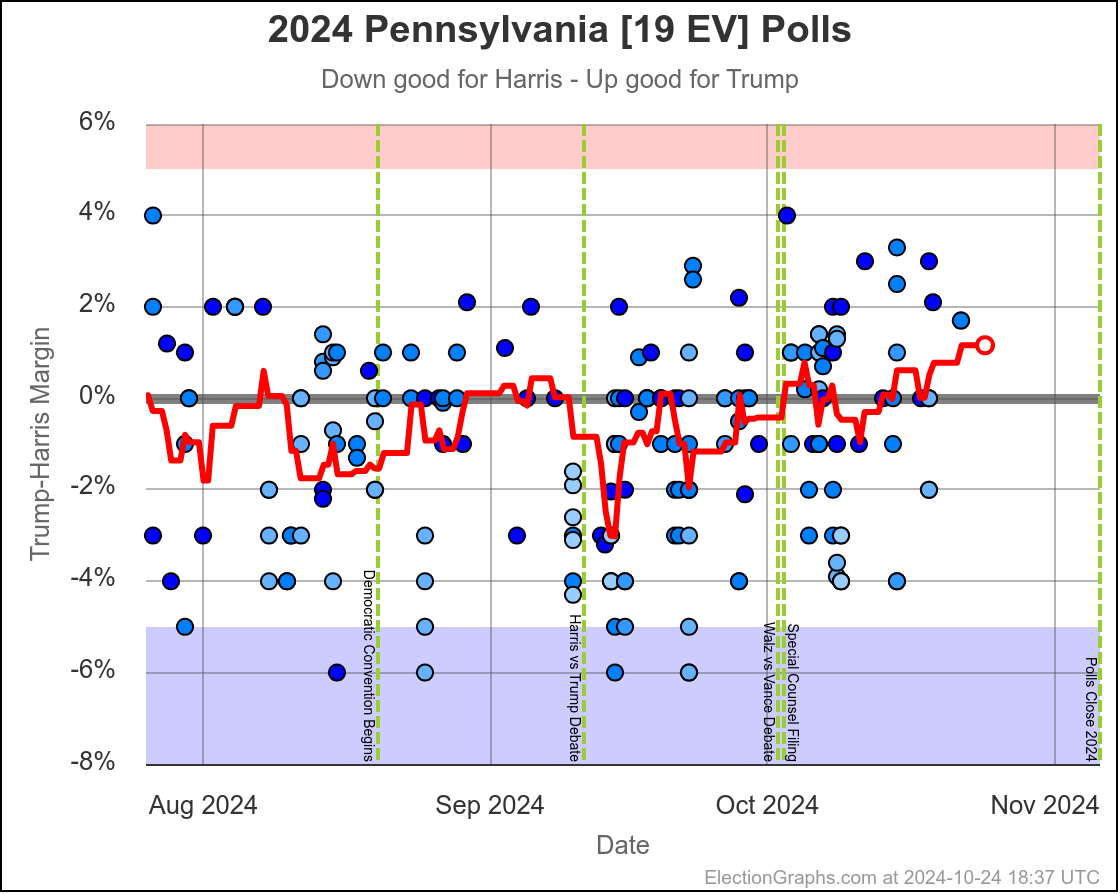
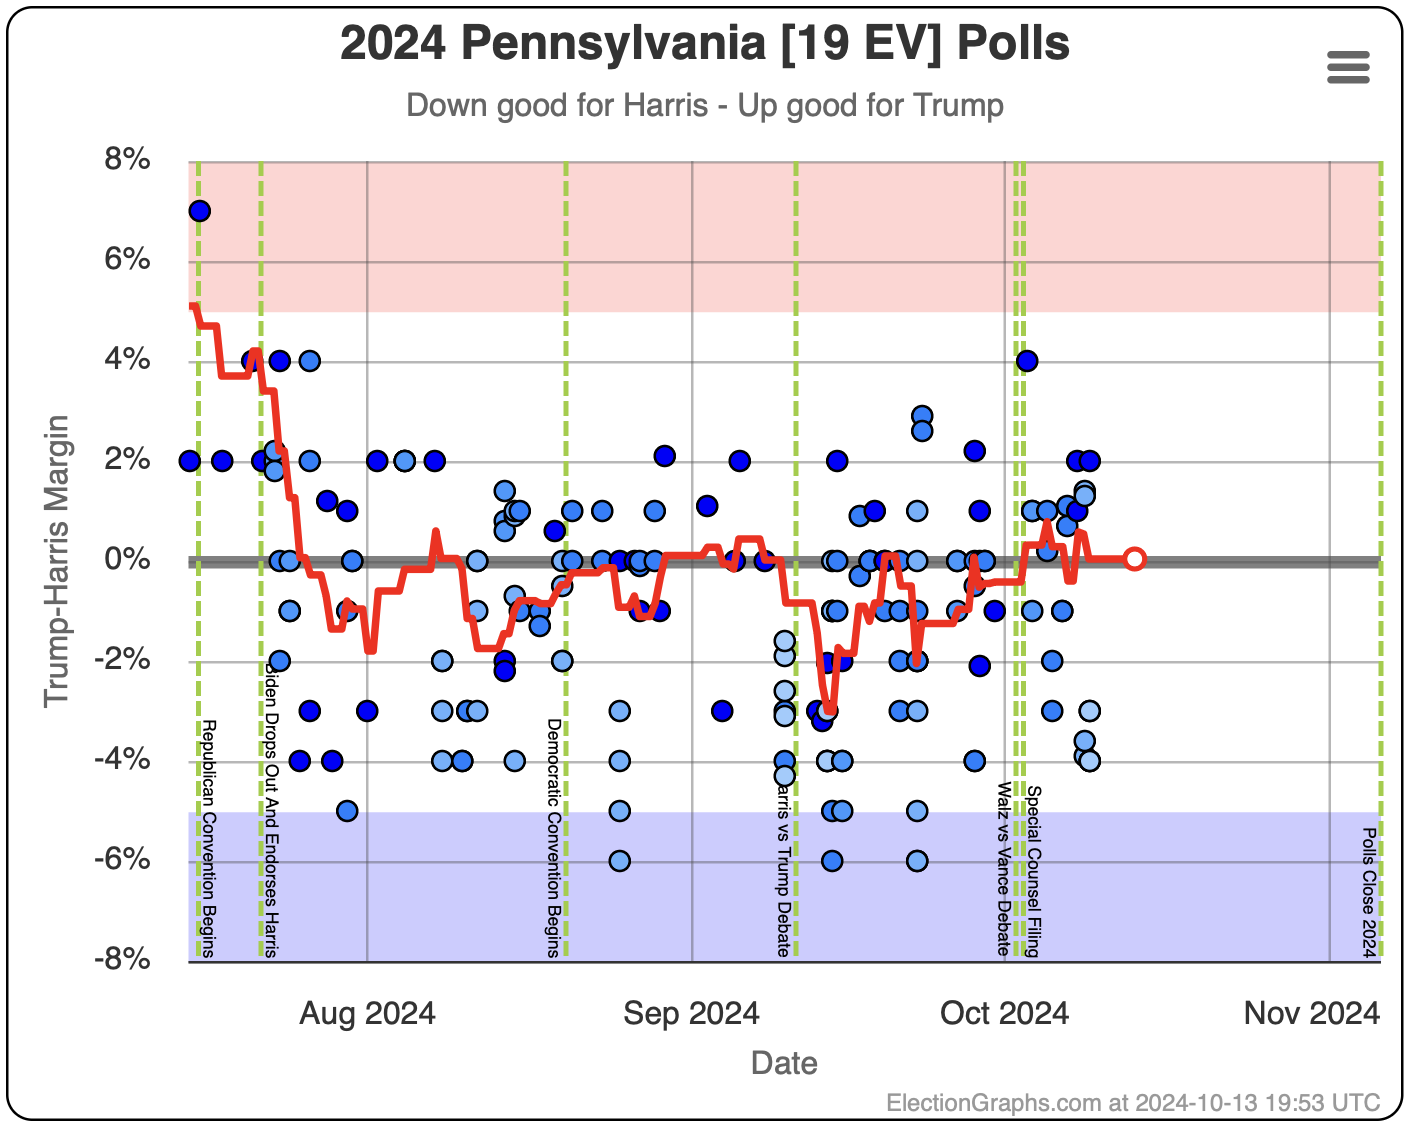
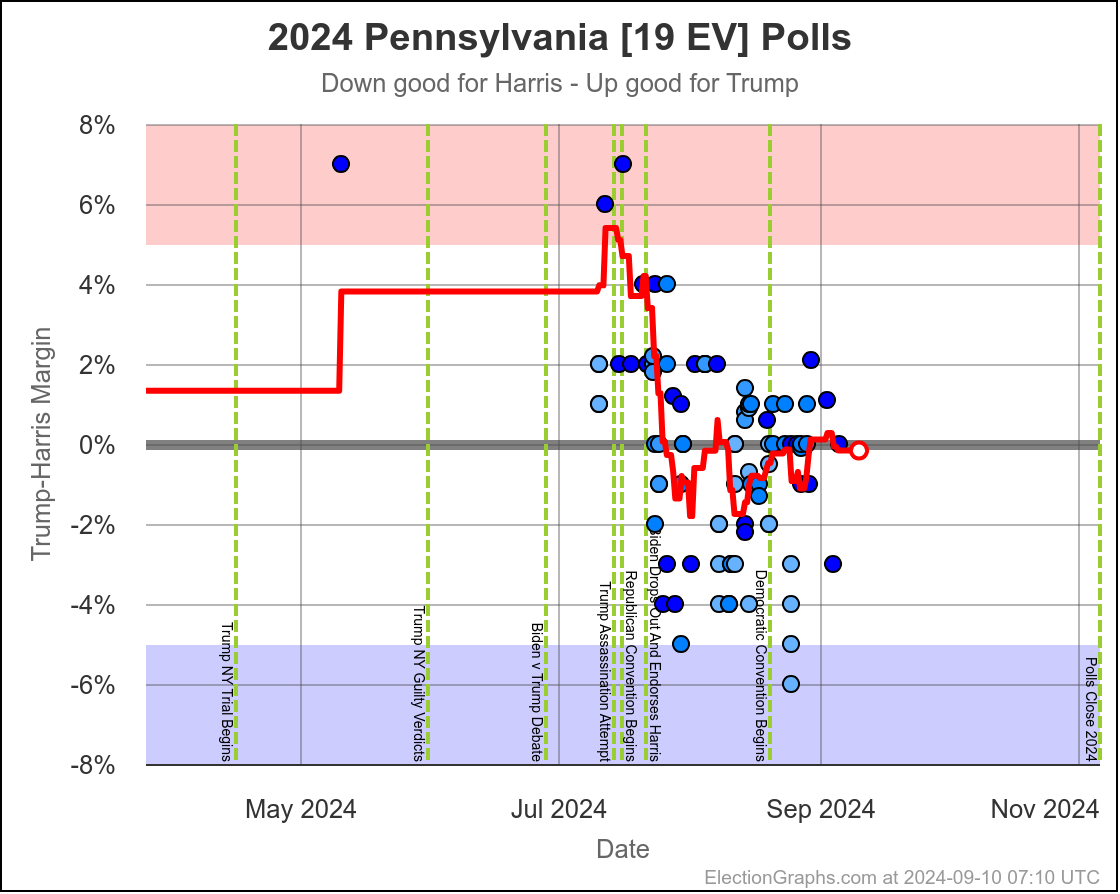
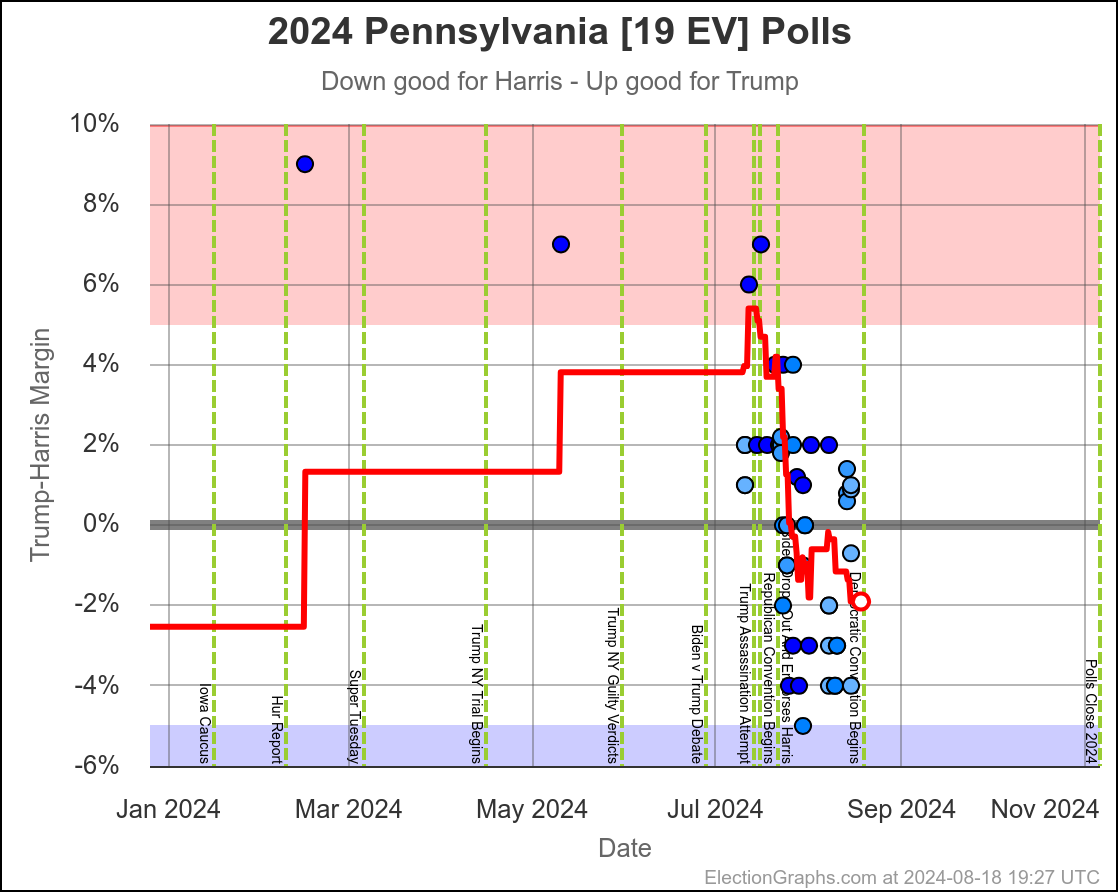
- Pennsylvania (19 EV): Harris by 0.5% -> Harris by 1.1% (Trump+1.6%)
- Virginia (13 EV): Harris by 7.0% -> Harris by 5.5% (Trump+1.5%)
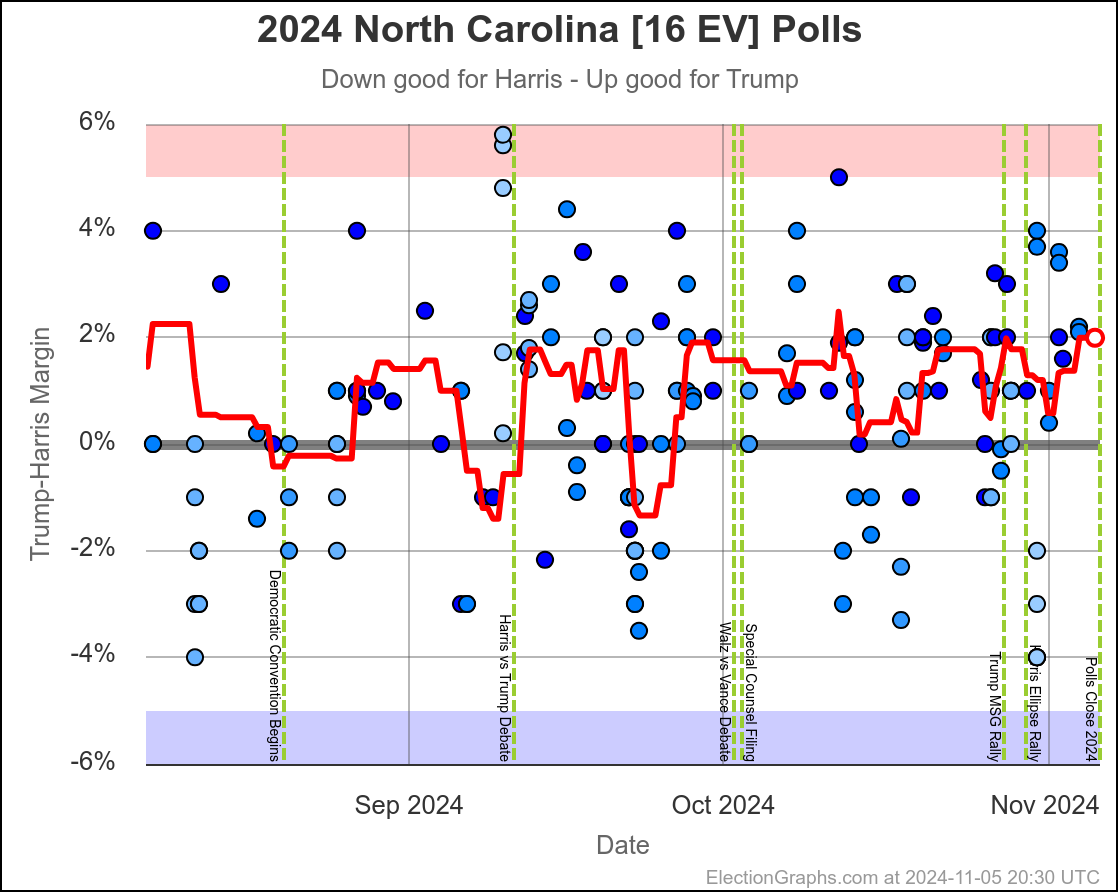
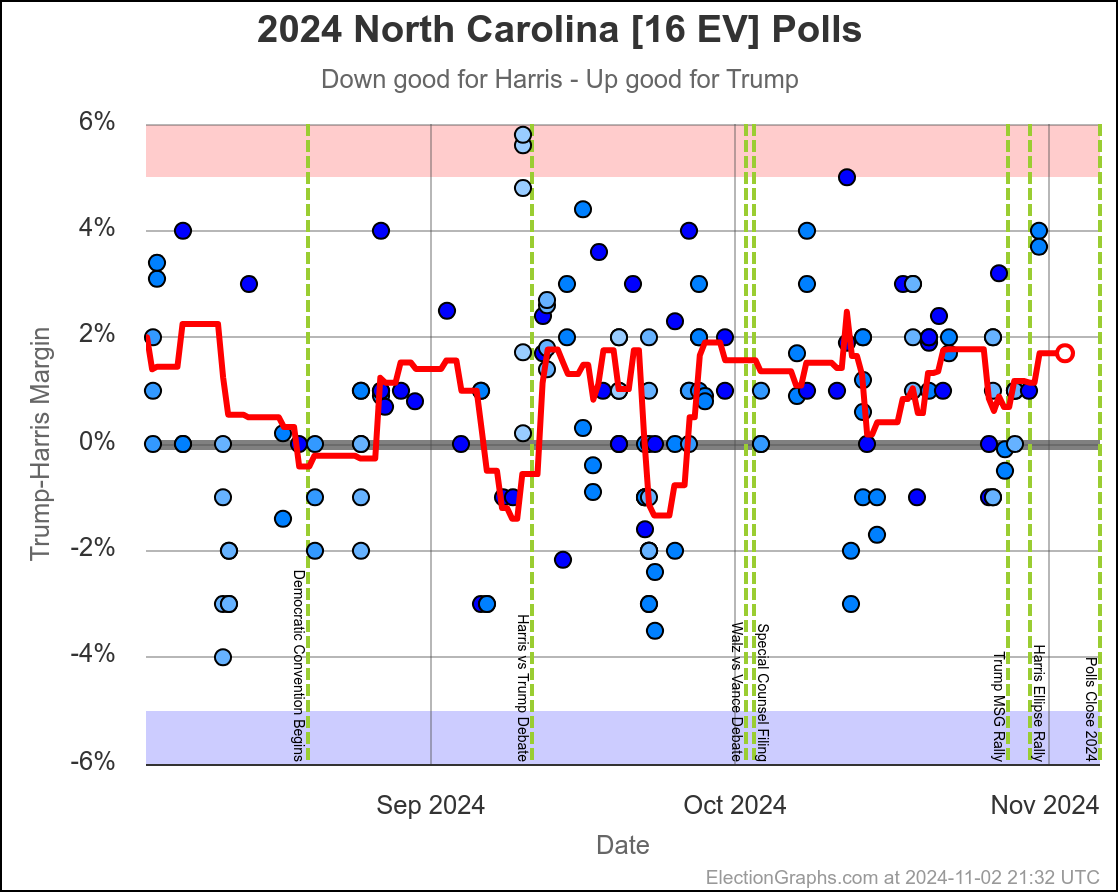
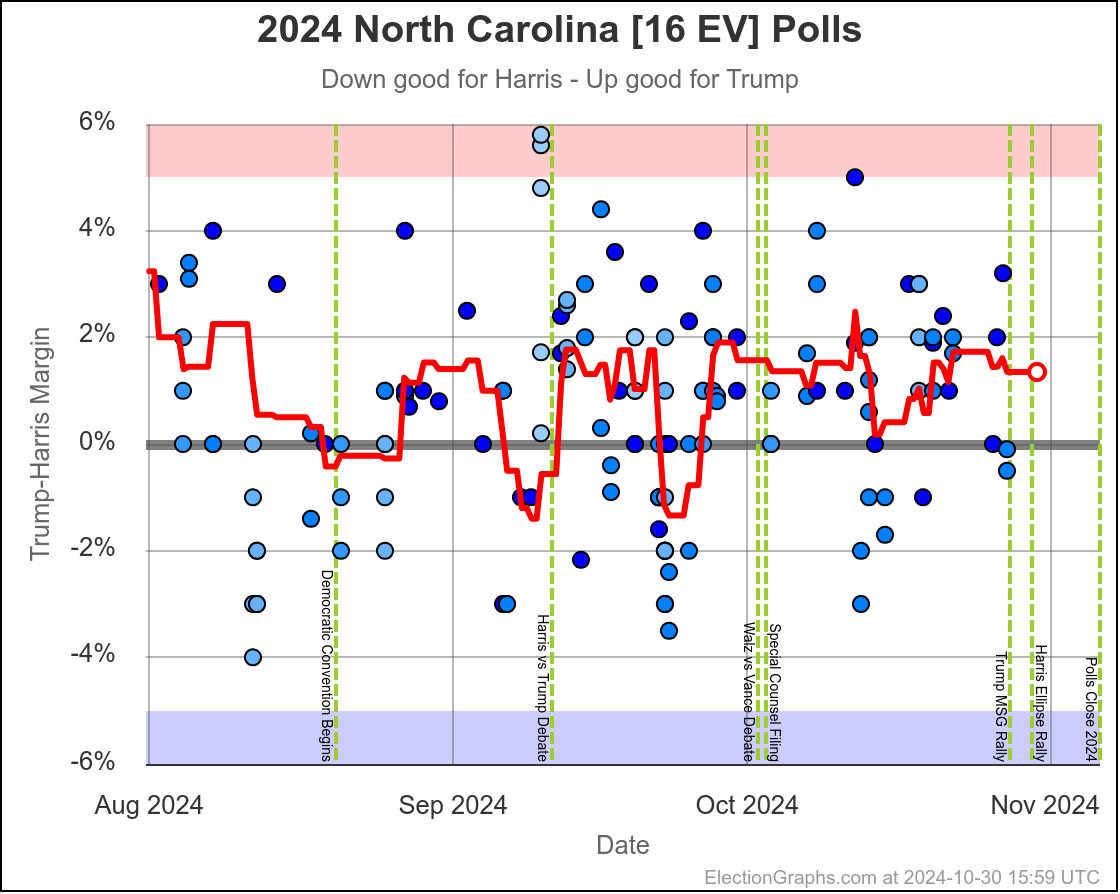
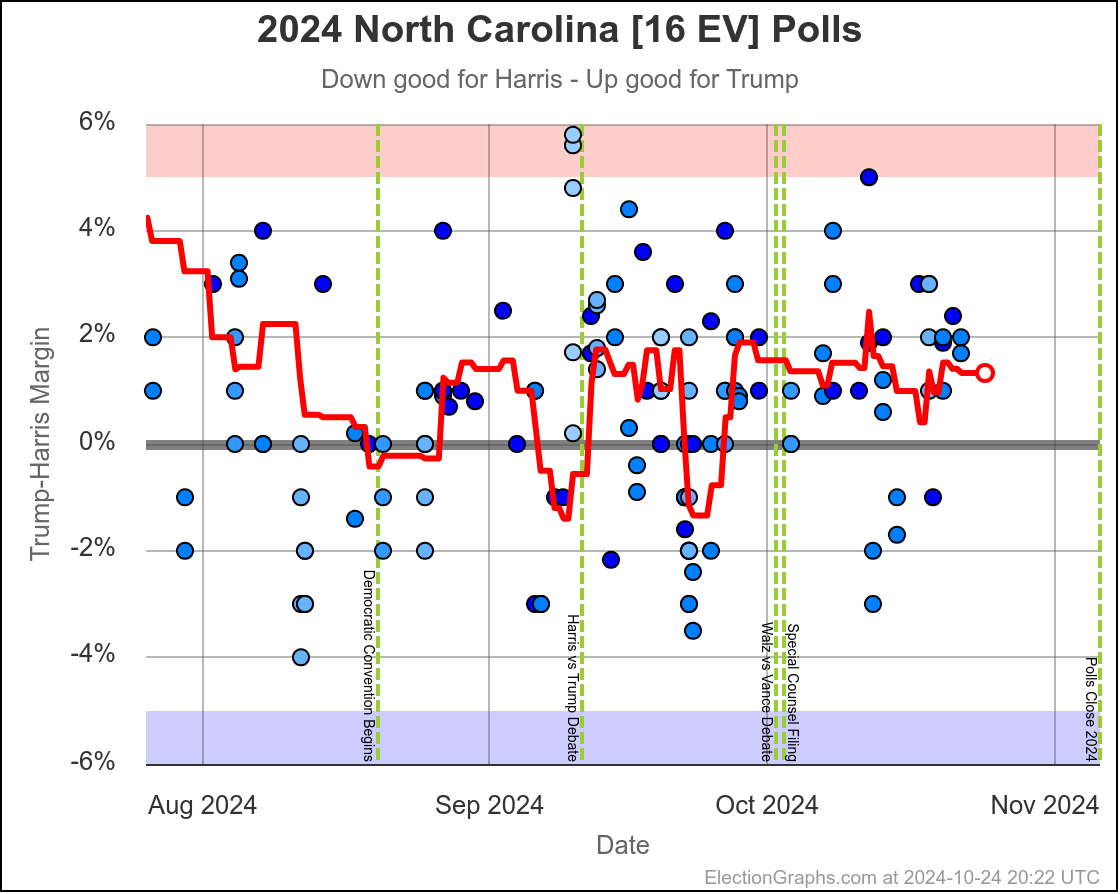
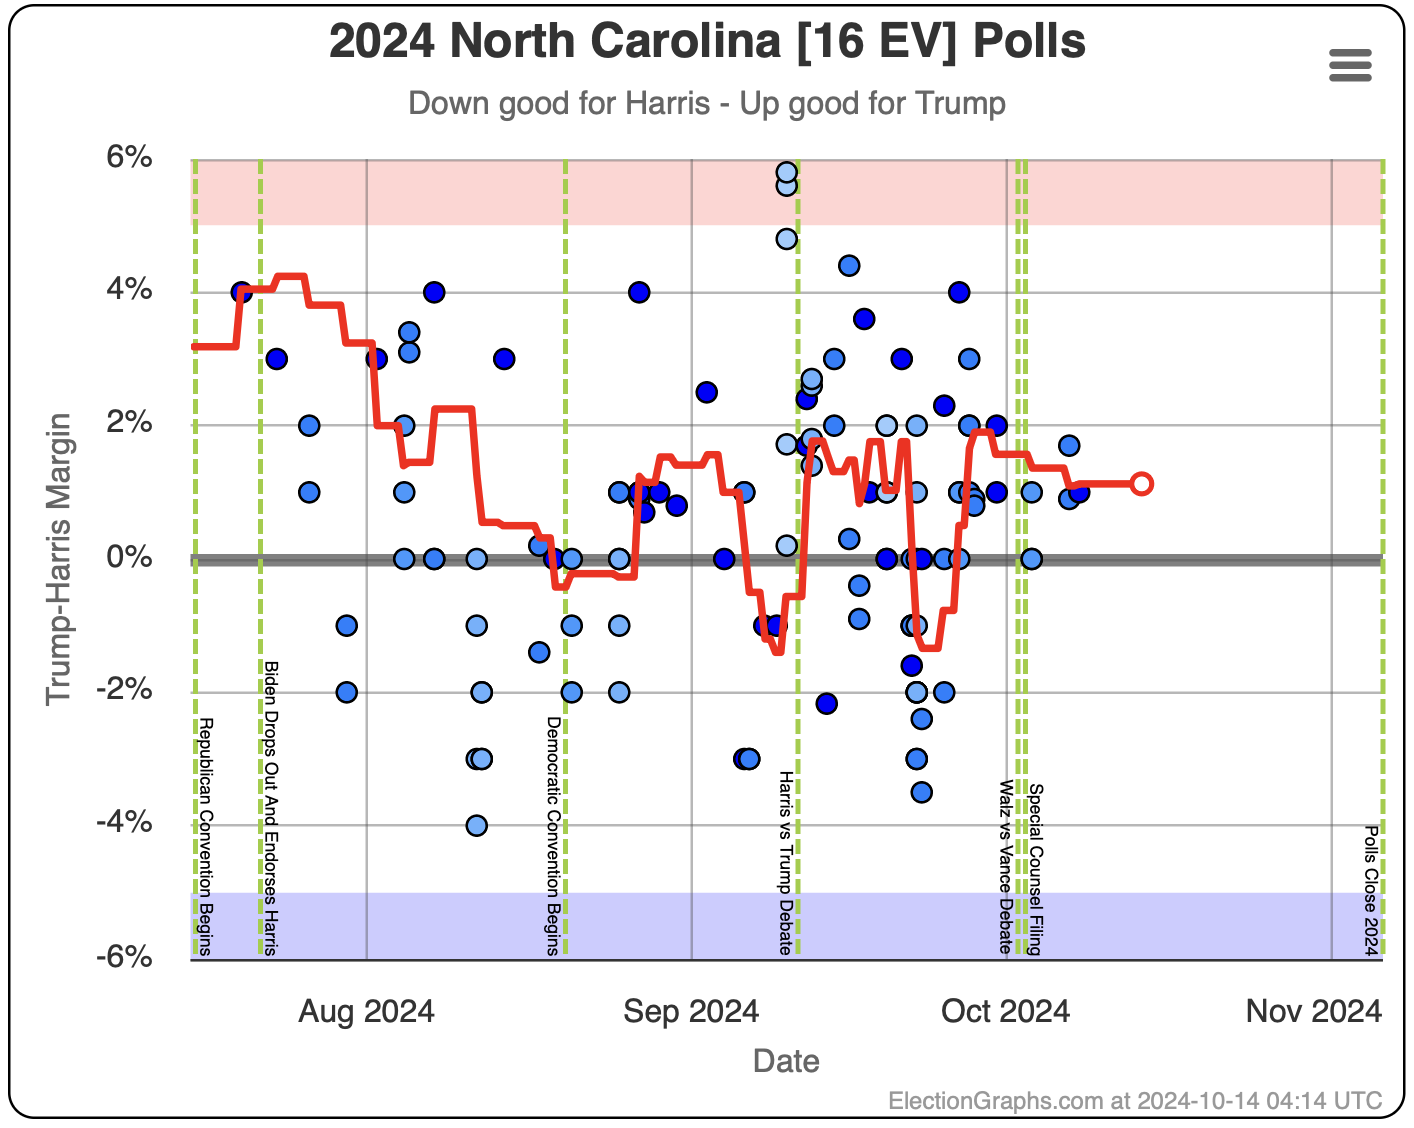
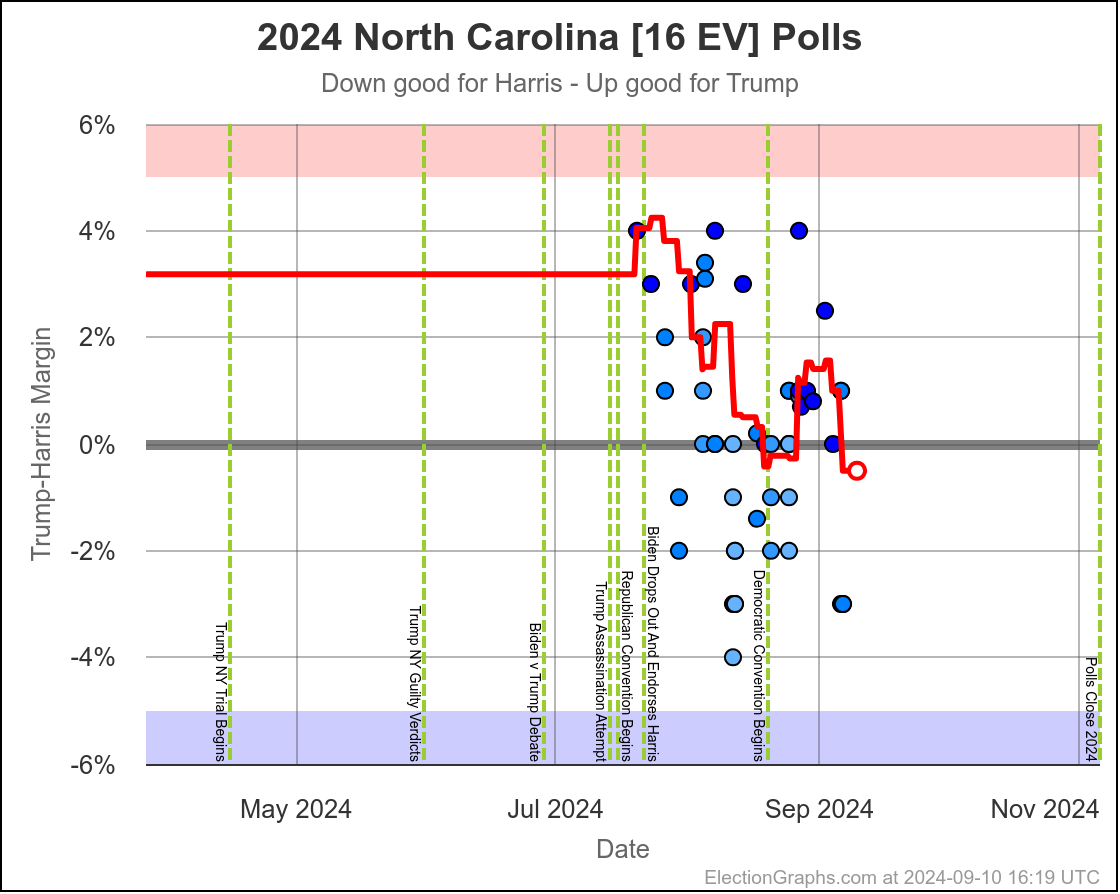
- North Carolina (16 EV): Trump by 0.8% -> Trump by 2.0% (Trump+1.2%)
- New Mexico (5 EV): Harris by 7.9% -> Harris by 7.2% (Trump+0.7%)
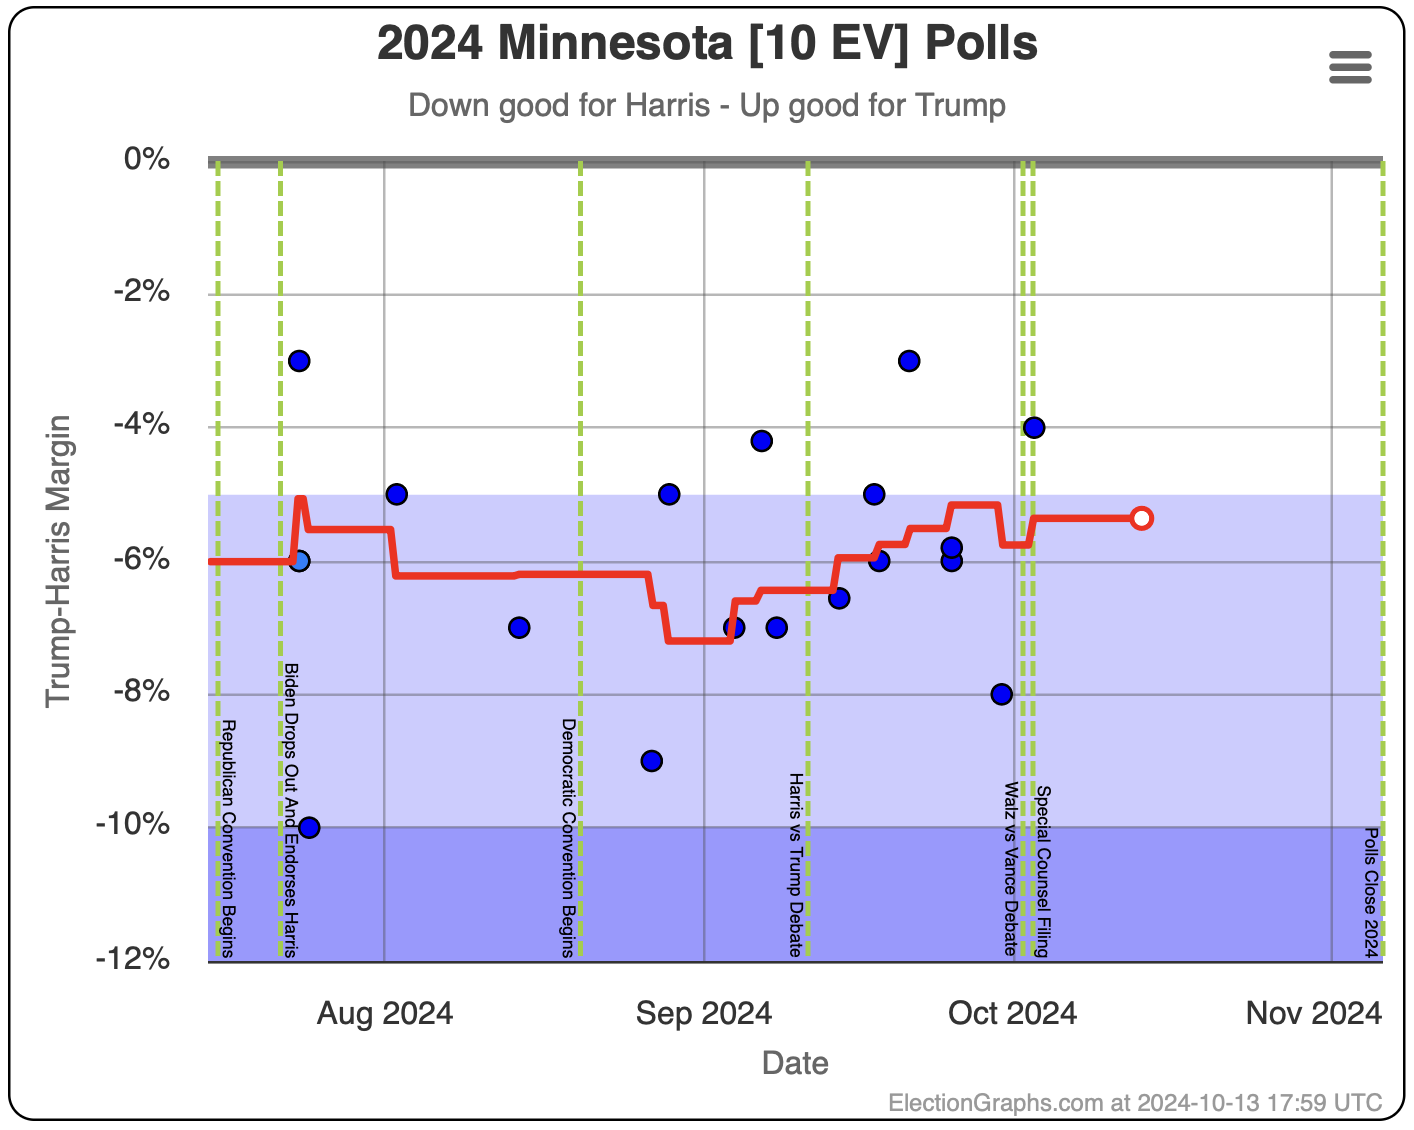
- Minnesota (10 EV): Harris by 5.8% -> Harris by 5.3% (Trump+0.5%)
- Texas (40 EV): Trump by 5.9% -> Trump by 6.3% (Trump+0.4%)
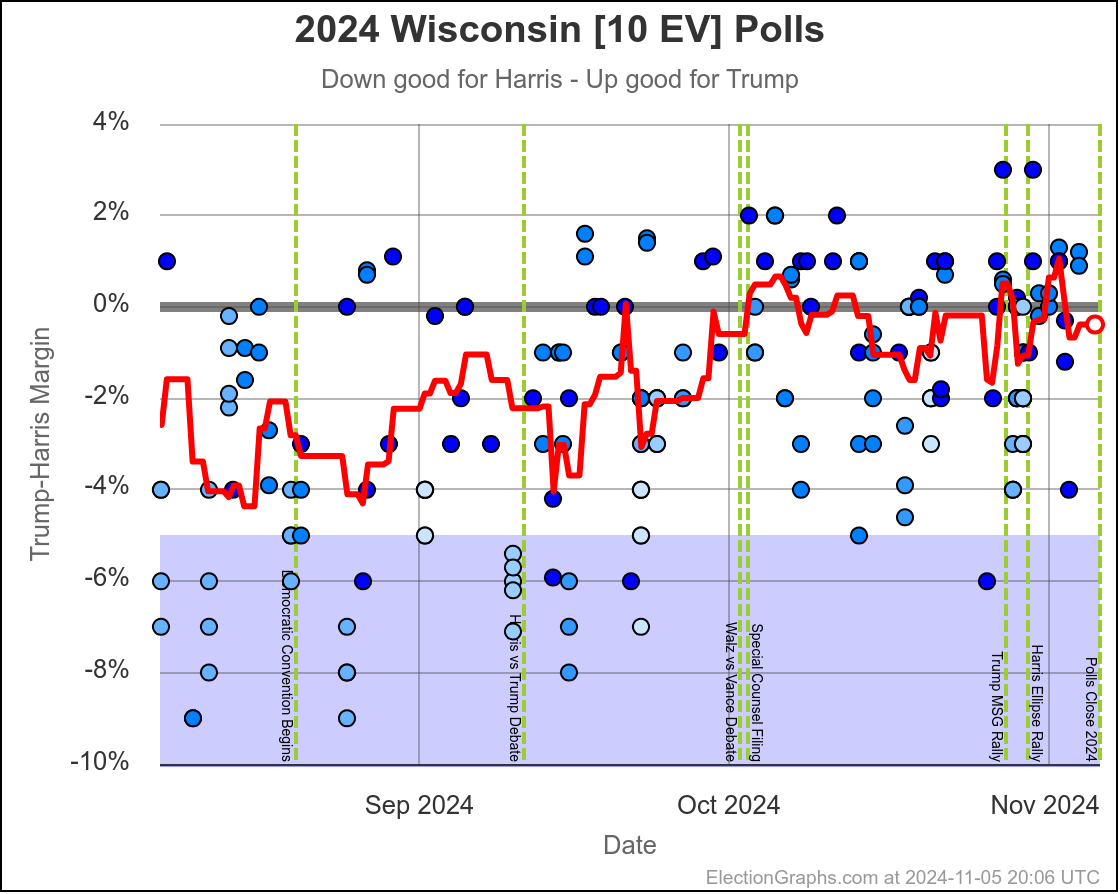
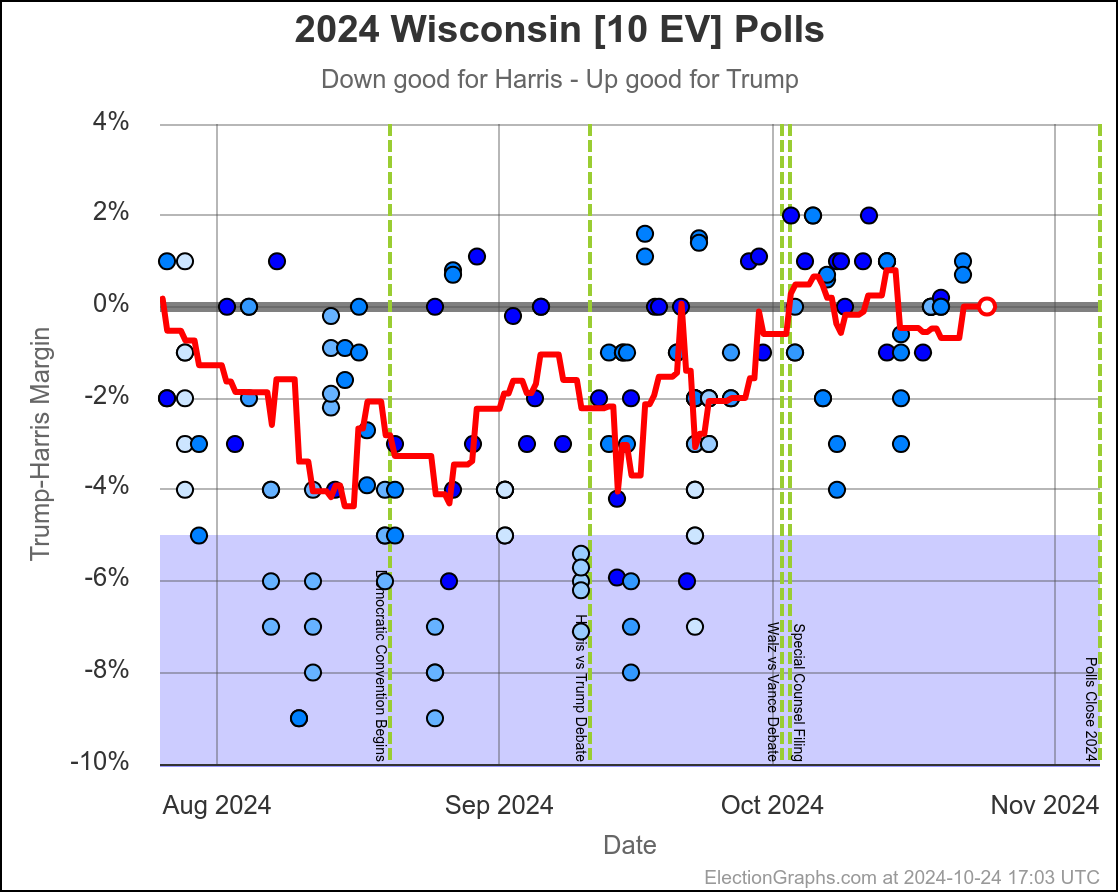
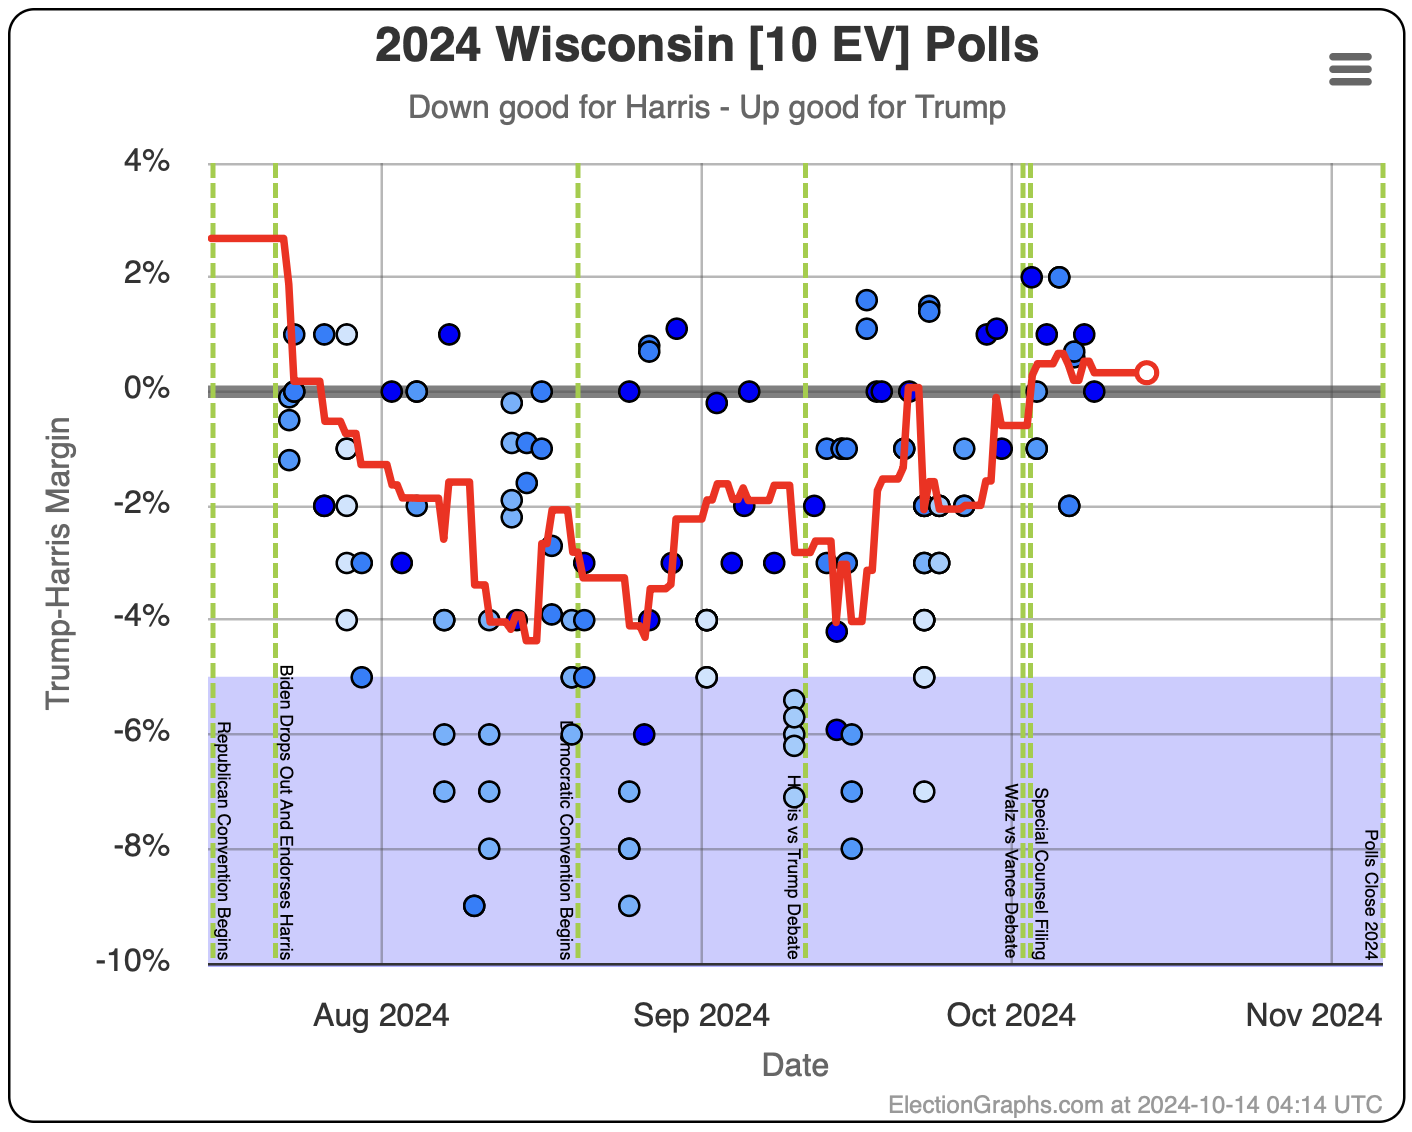
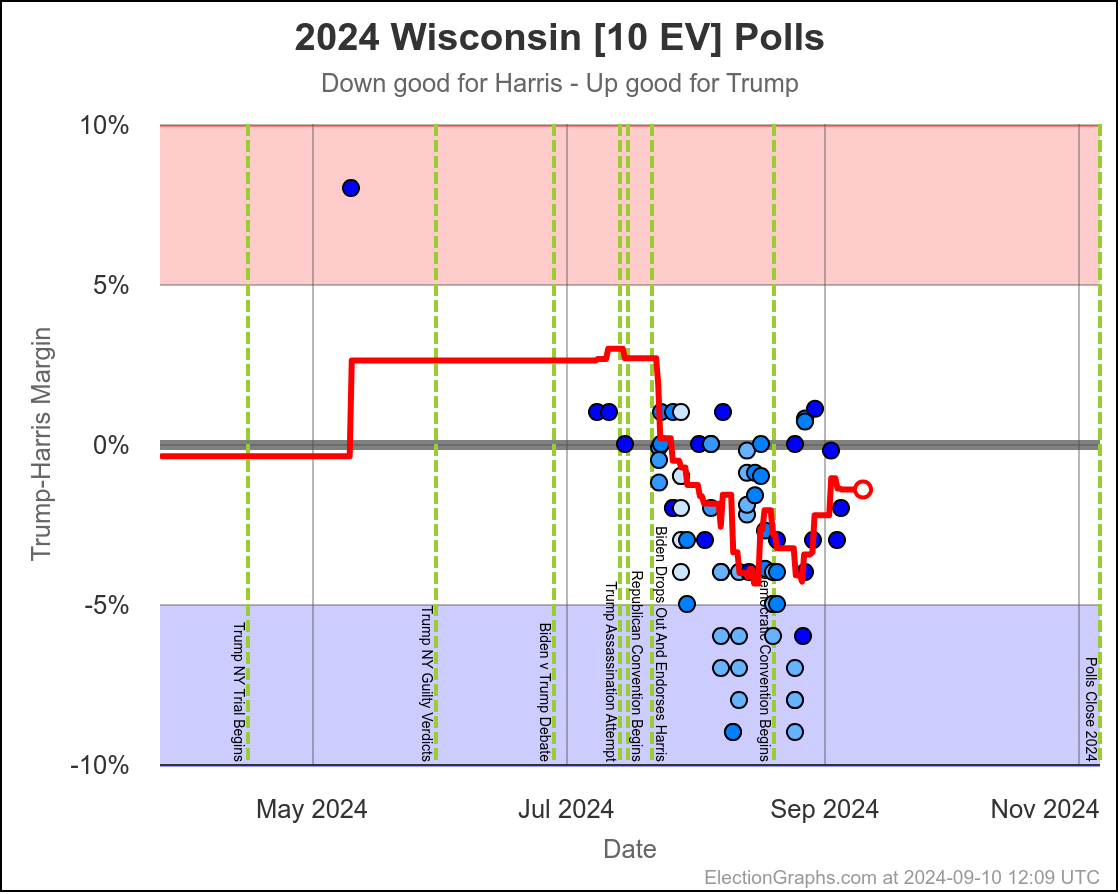
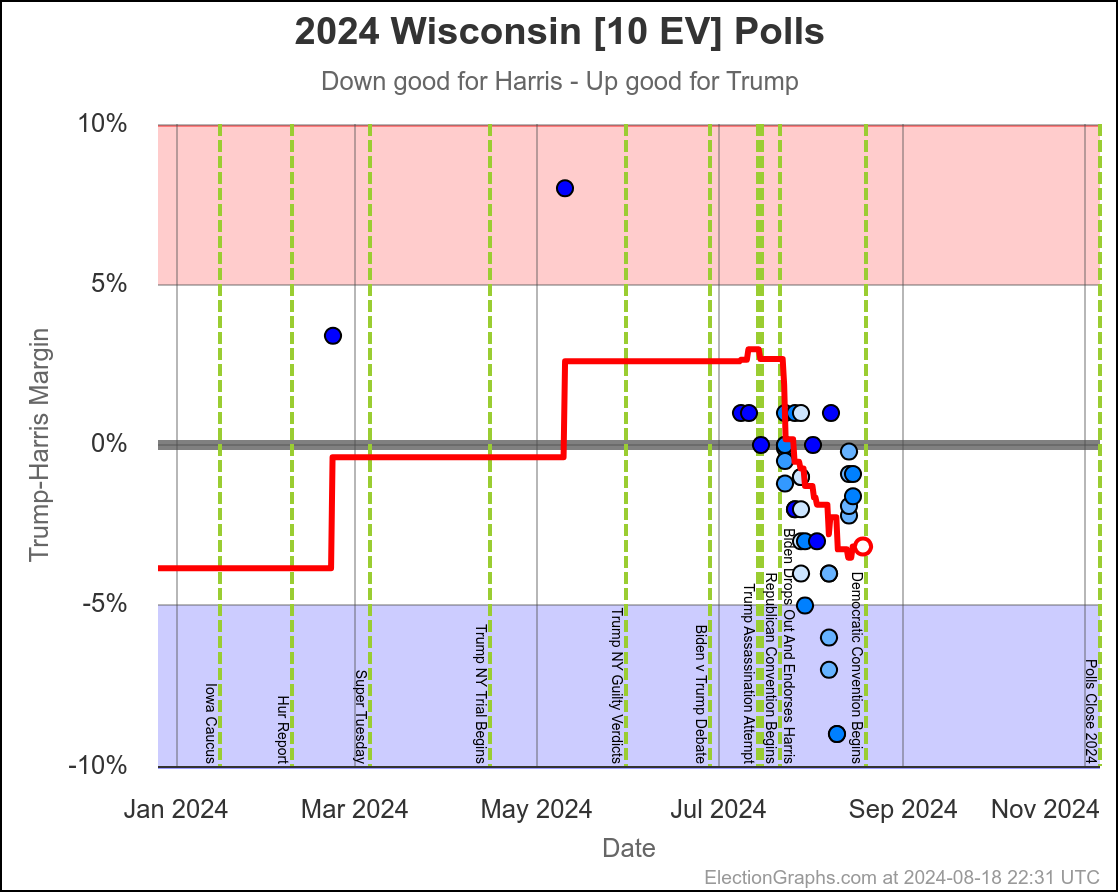
- Wisconsin (10 EV): Harris by 1.7% -> Harris by 1.5% (Trump+0.2%)
No Movement:
- Maine-All (2 EV): Harris by 9.3%
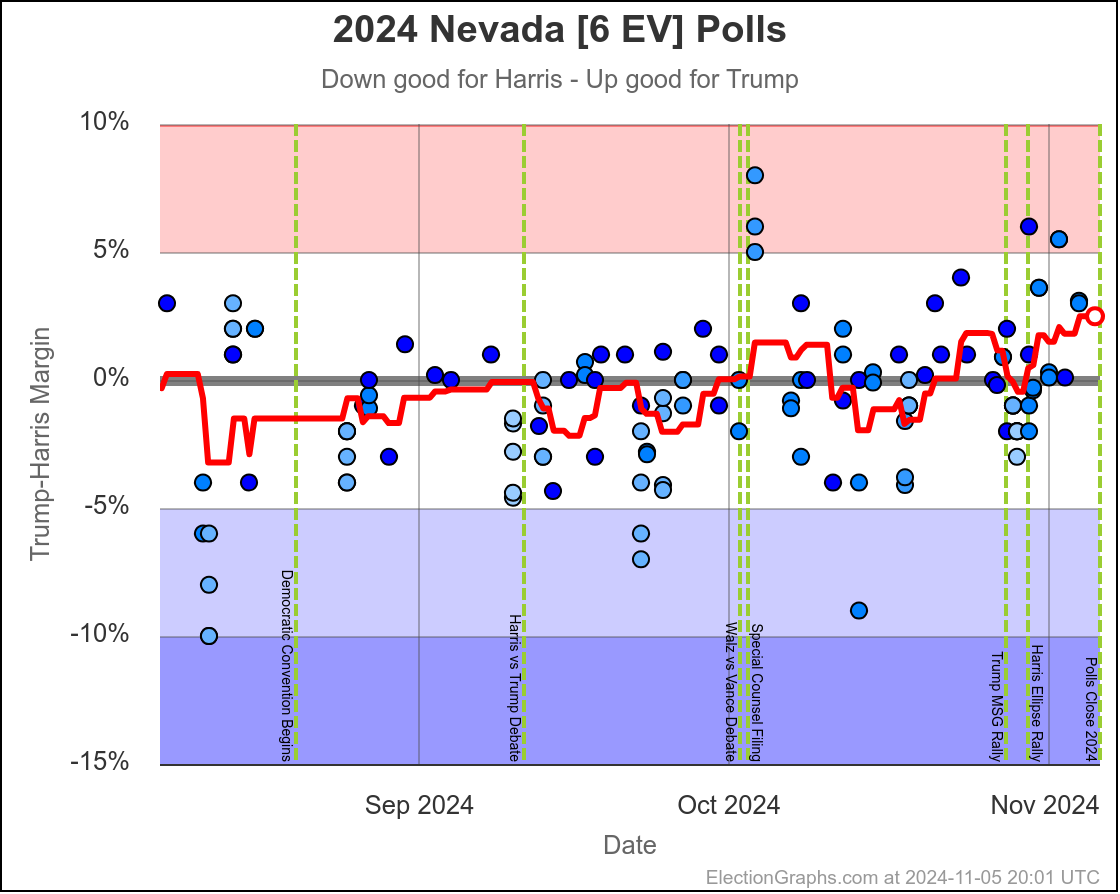
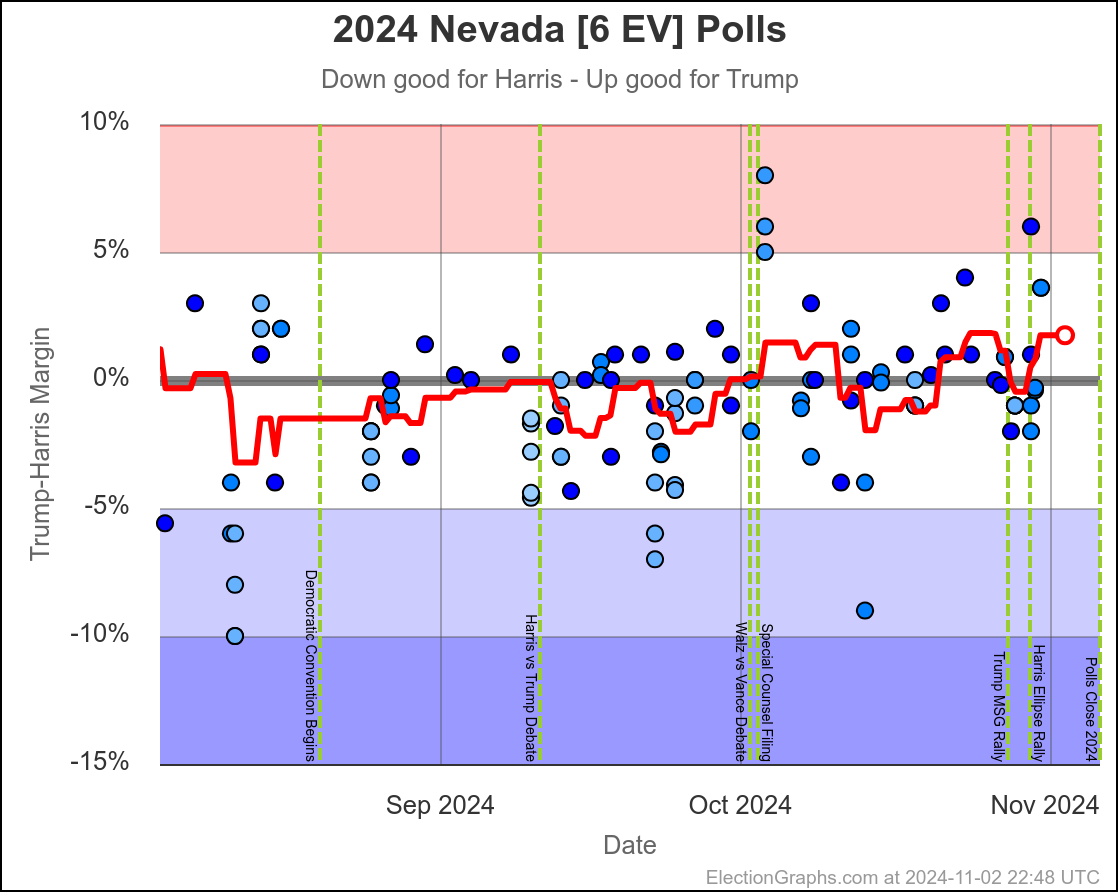
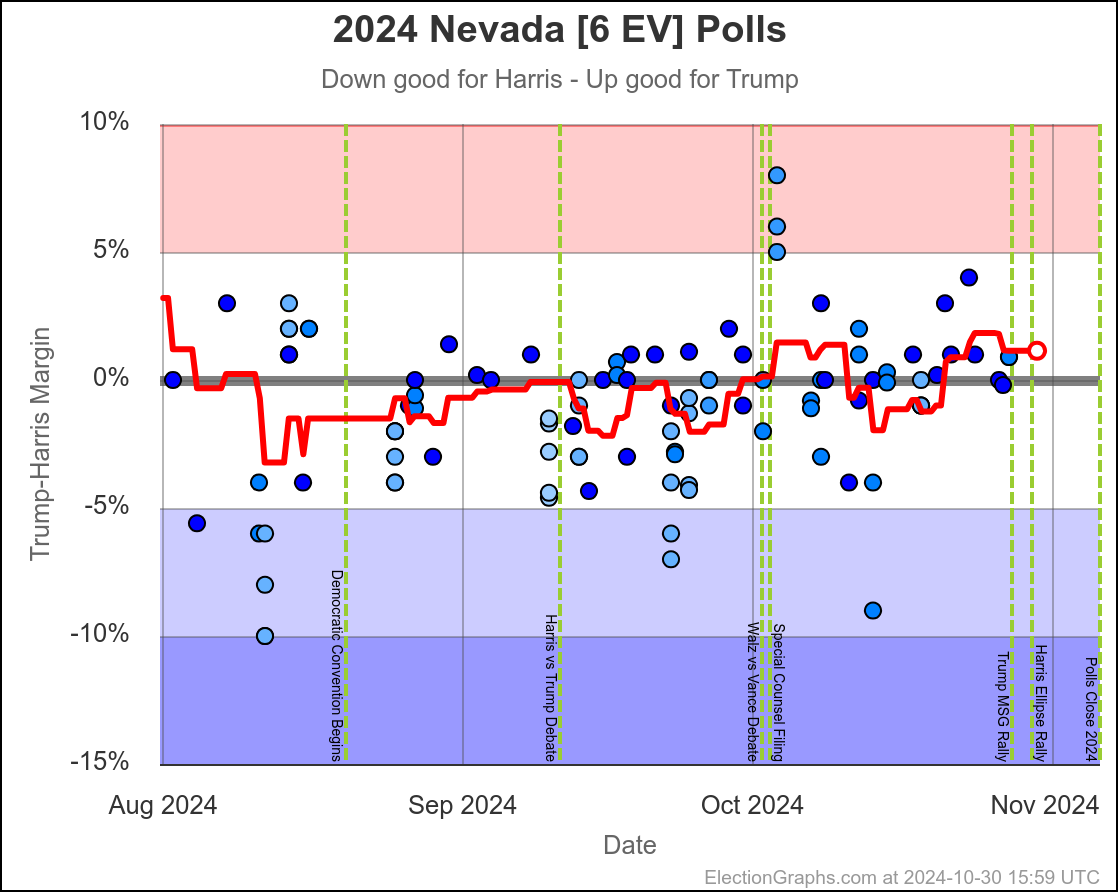
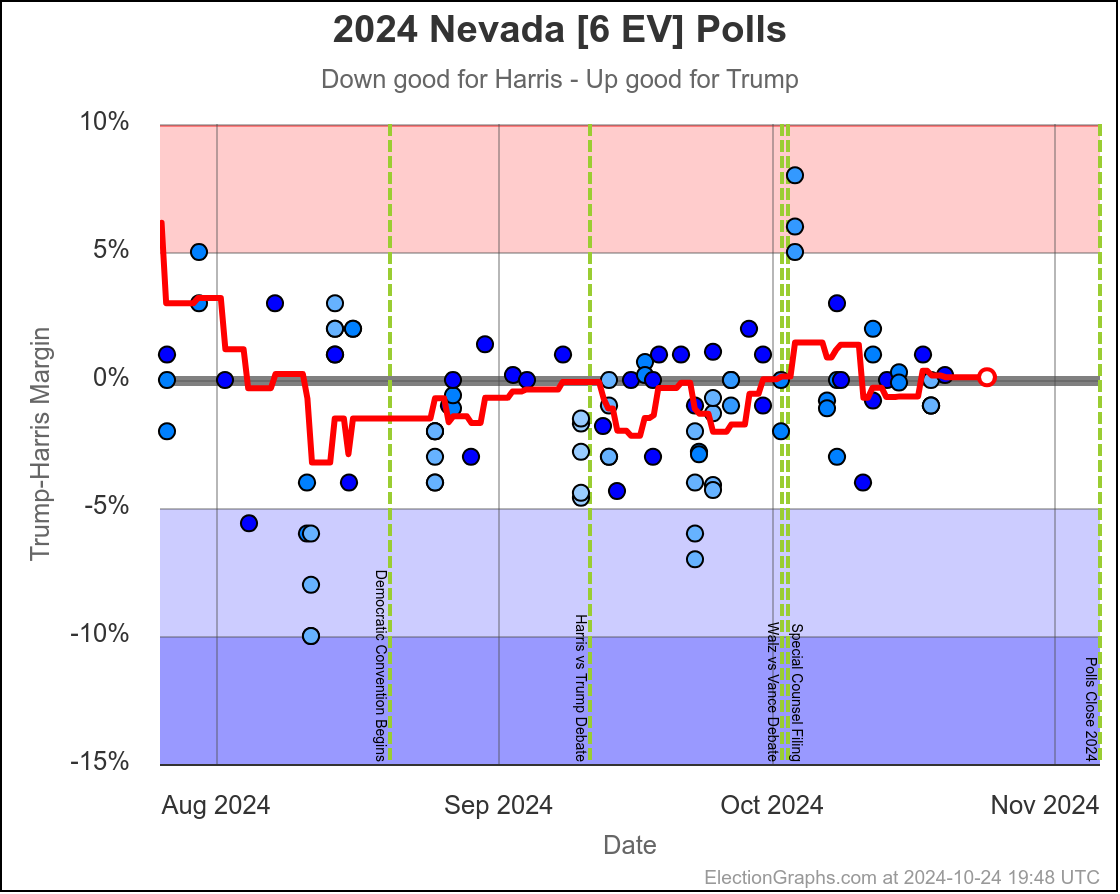
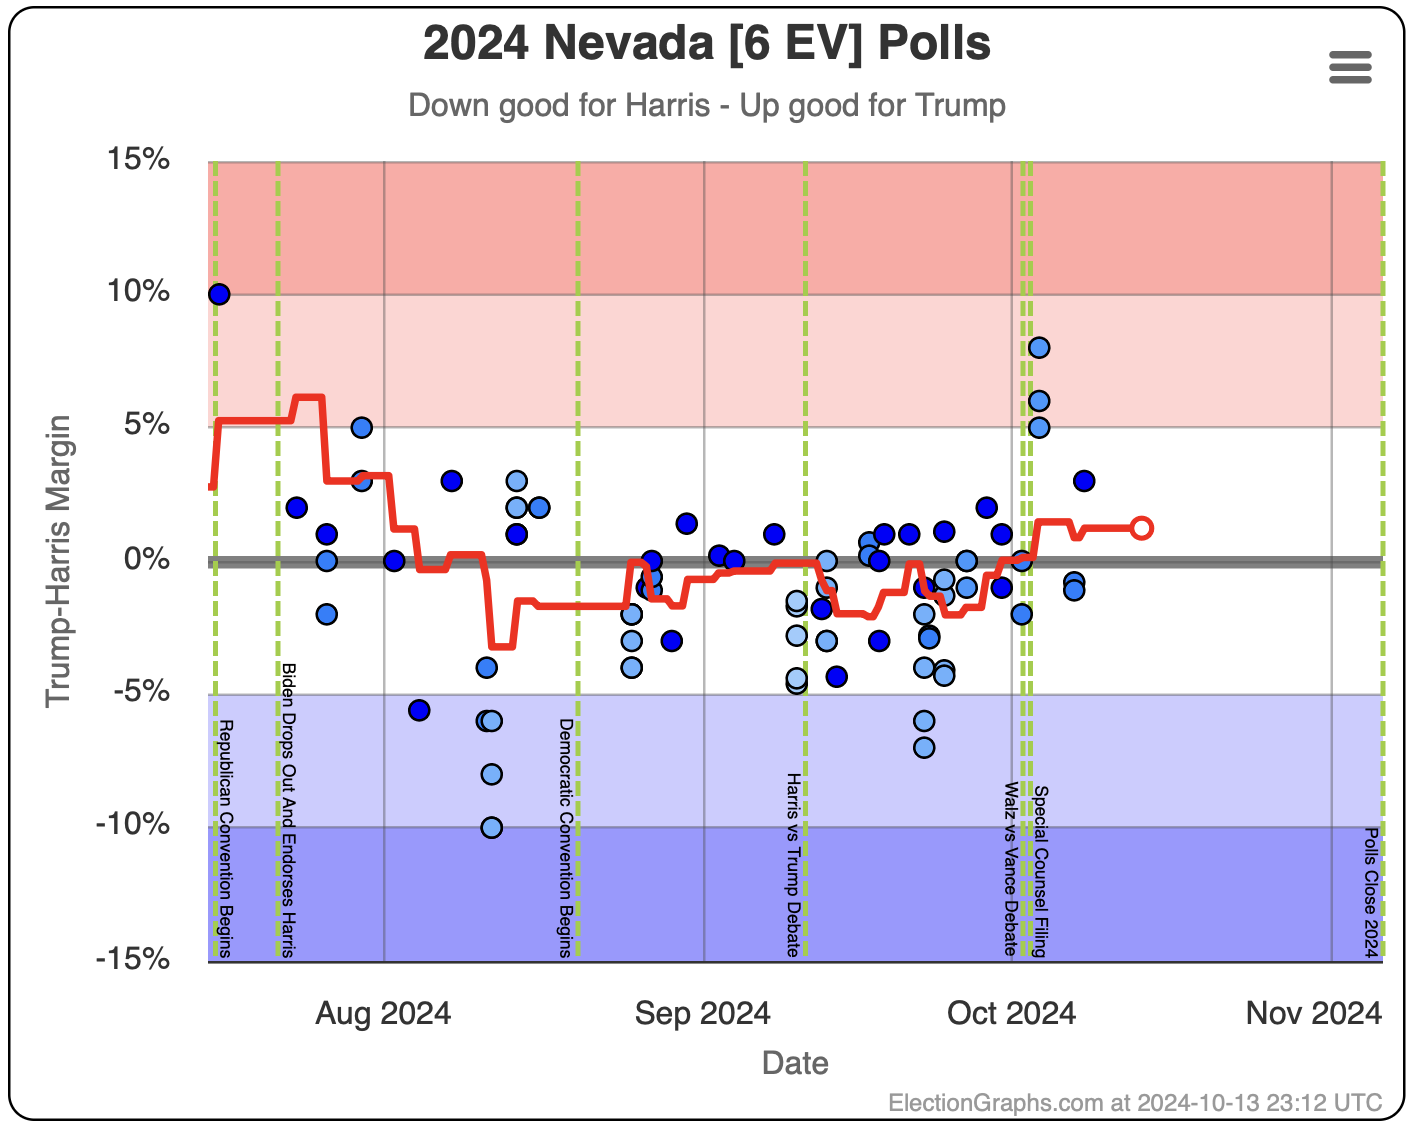
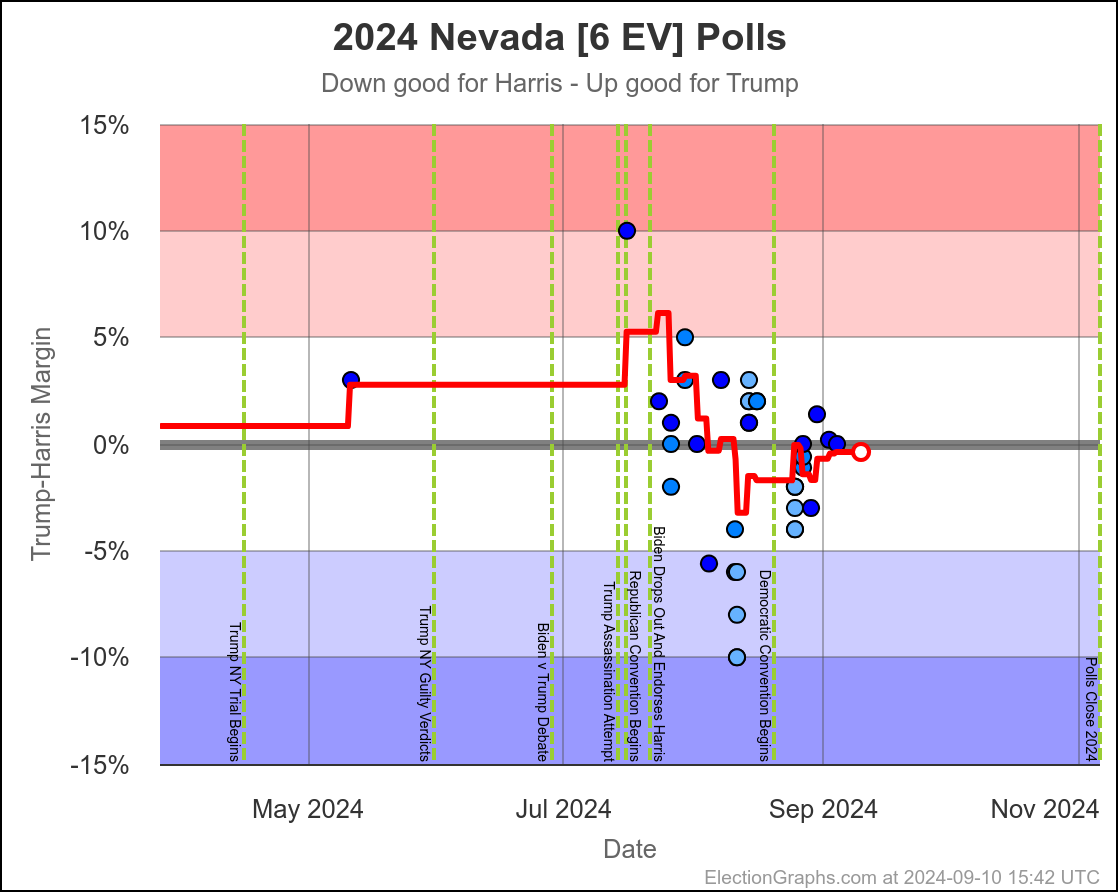
- Nevada (6 EV): Harris by 1.5%
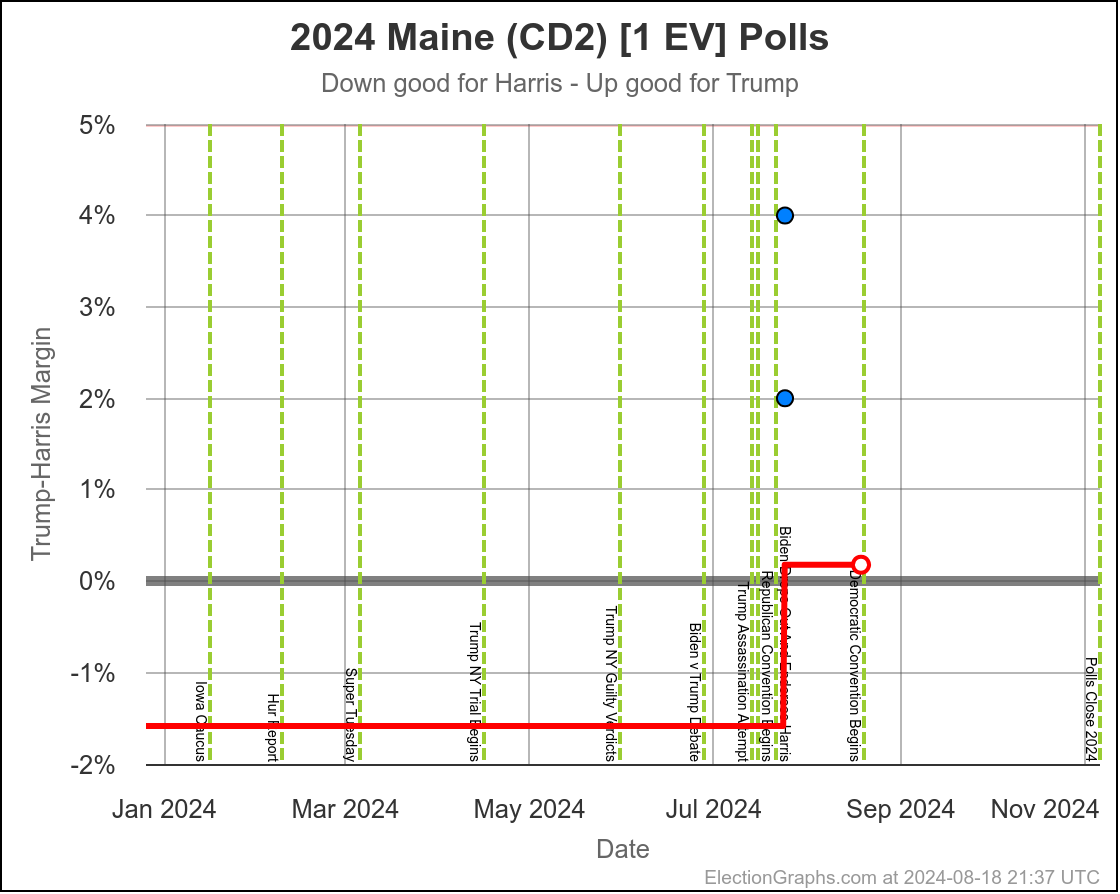
- Maine-CD2 (1 EV): Trump by 4.5%
Movement toward Harris:
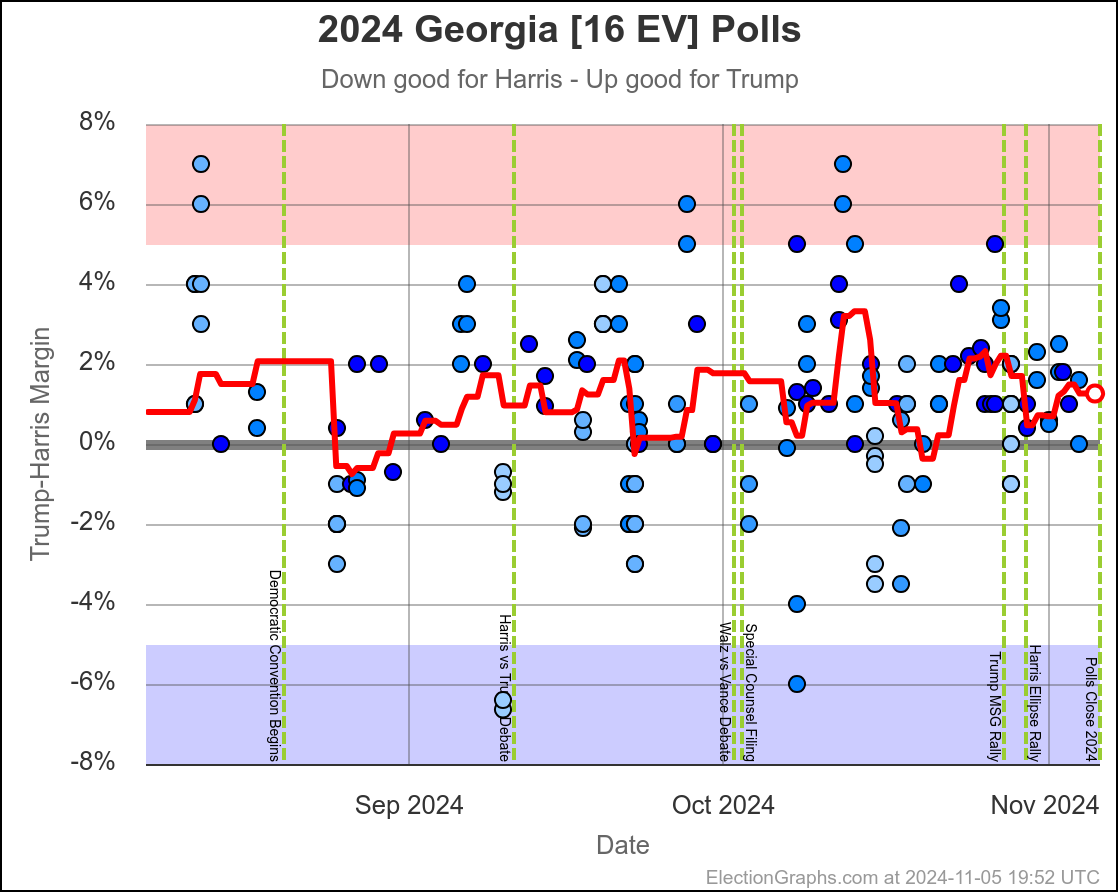
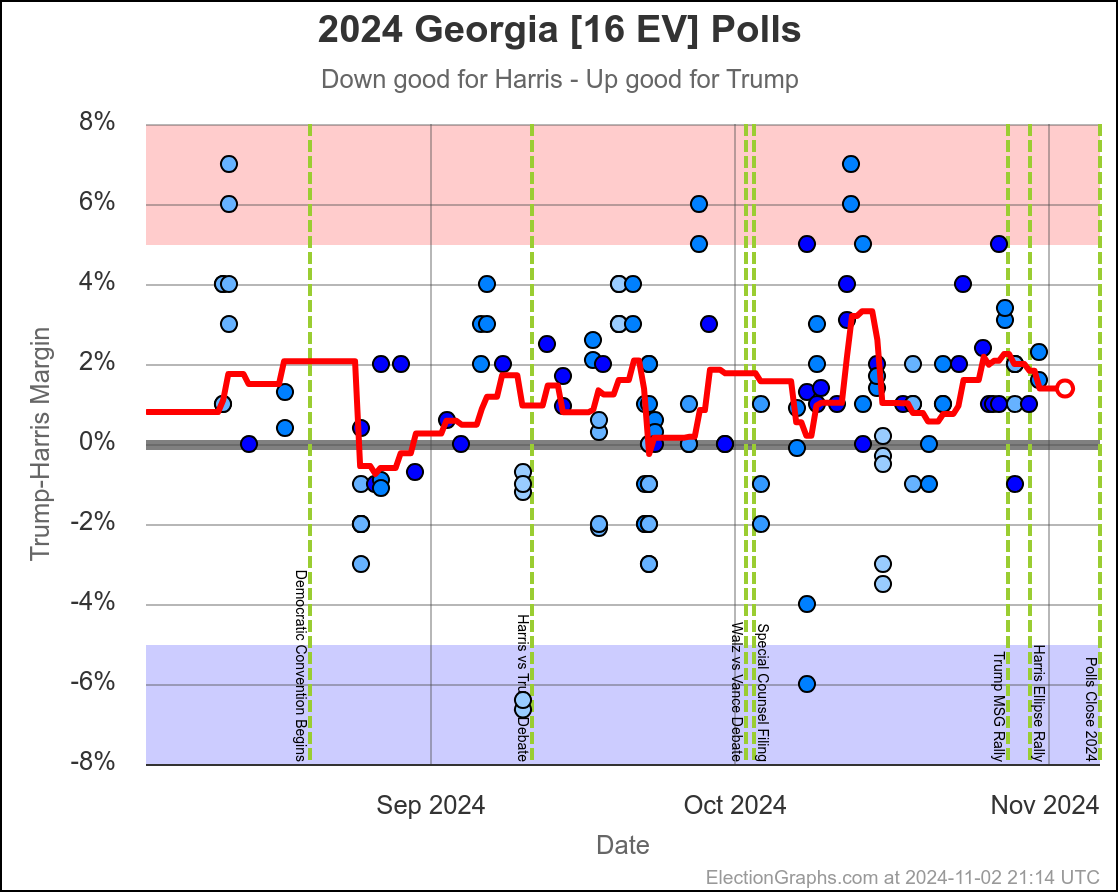
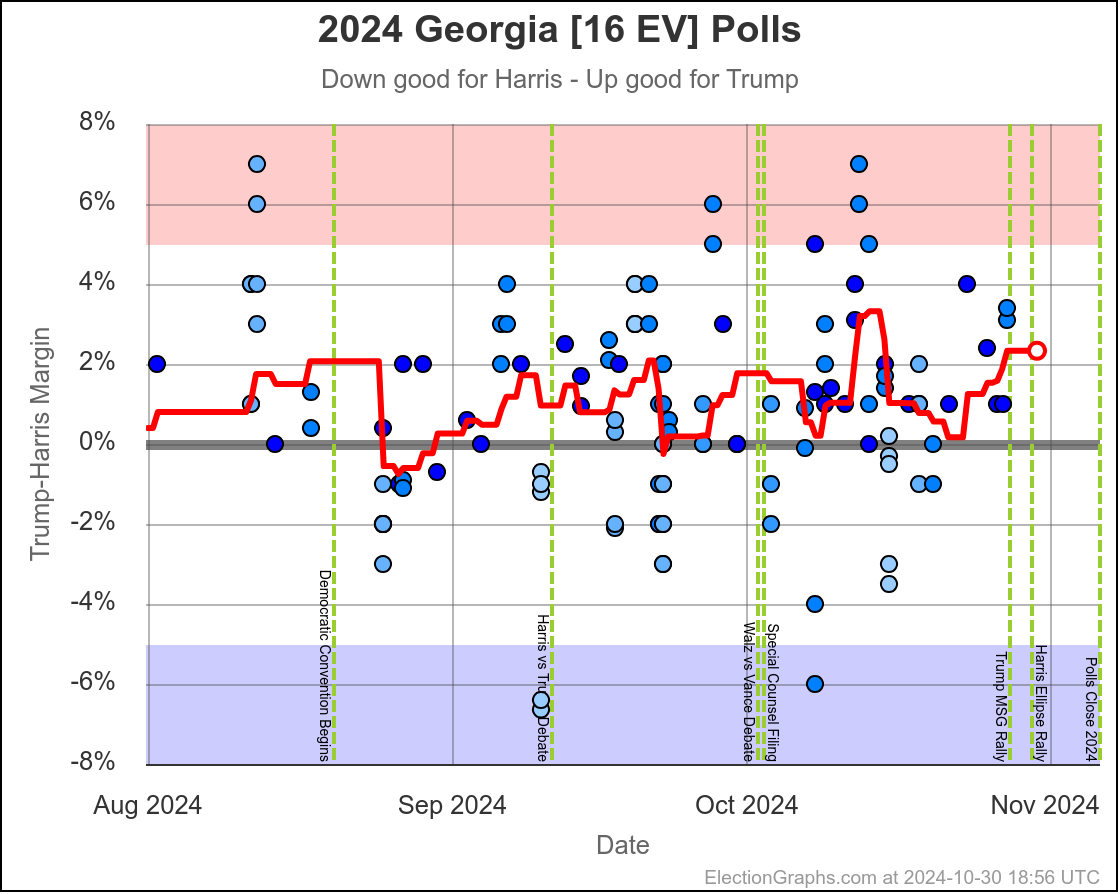
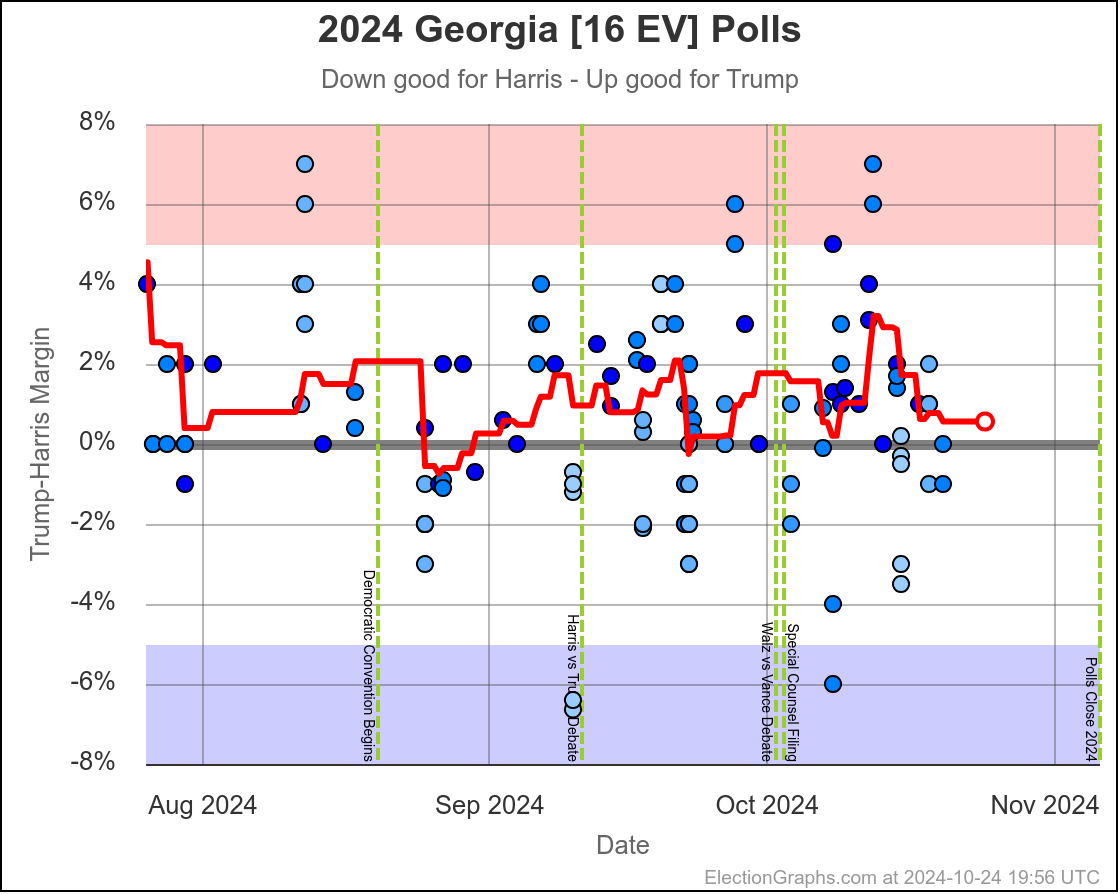
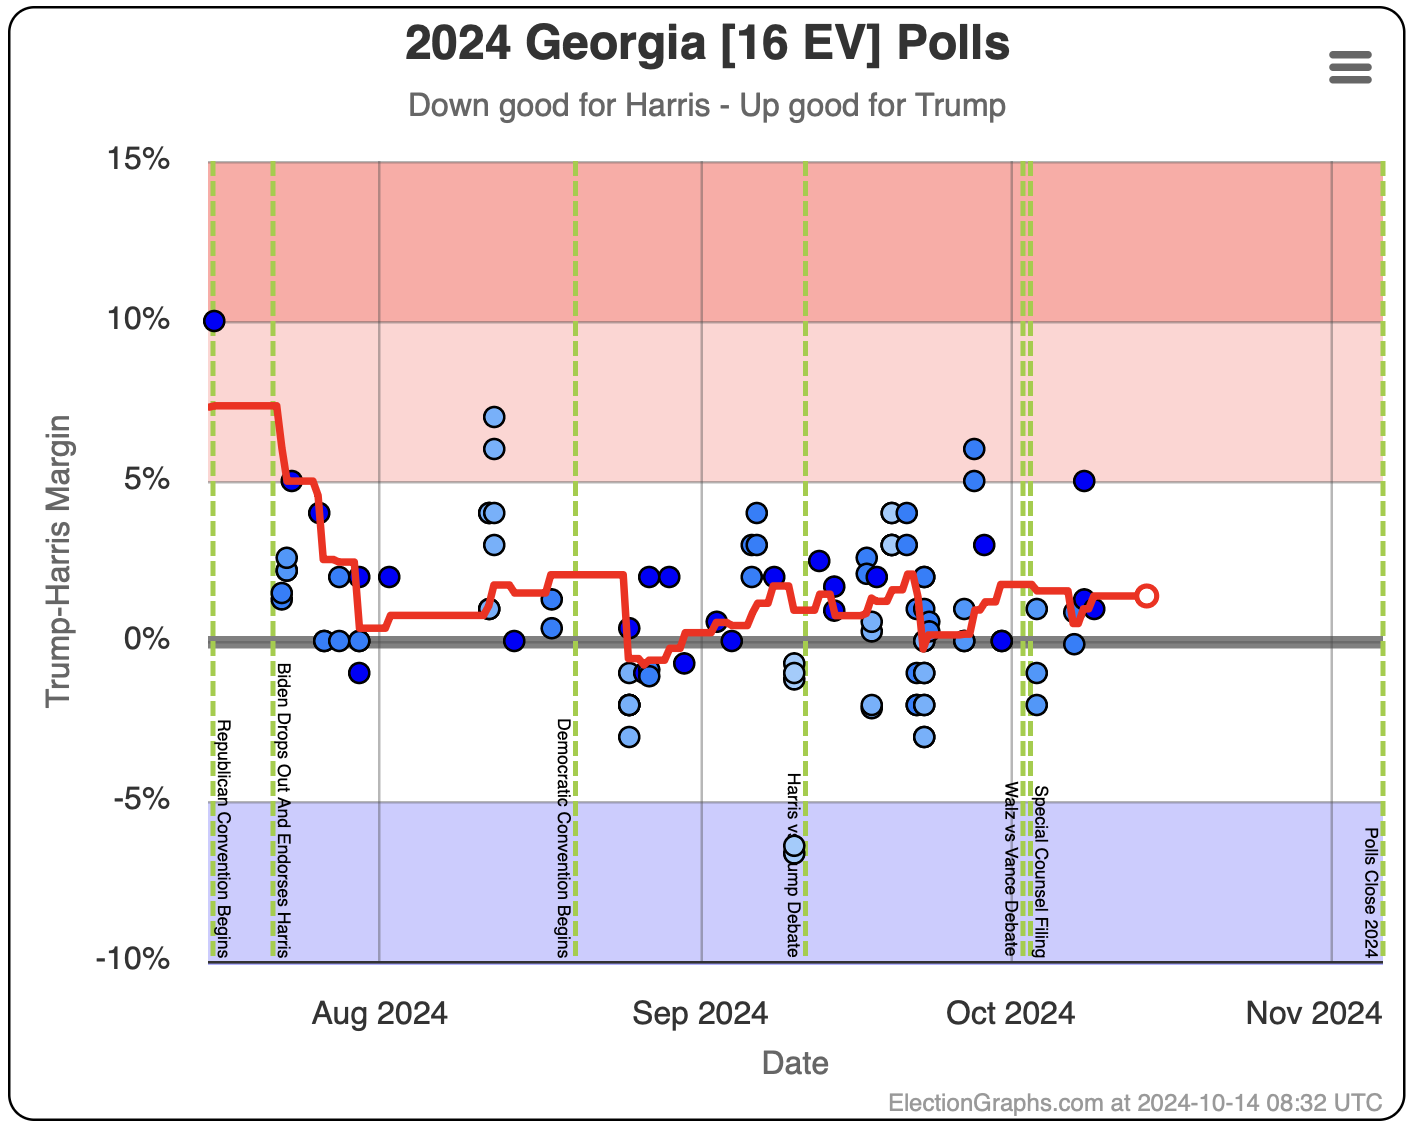
- Georgia (16 EV): Trump by 1.0% -> Trump by 0.9% (Harris+0.1%)
- New Hampshire (4 EV): Harris by 7.4% -> Harris by 7.8% (Harris+0.4%)
- Florida (30 EV): Trump by 3.7% -> Trump by 2.9% (Harris+0.8%)
- Alaska (3 EV): Trump by 10.8% -> Trump by 9.8% (Harris+1.0%)
- Colorado (10 EV): Harris by 9.8% -> Harris by 10.9% (Harris+1.1%)
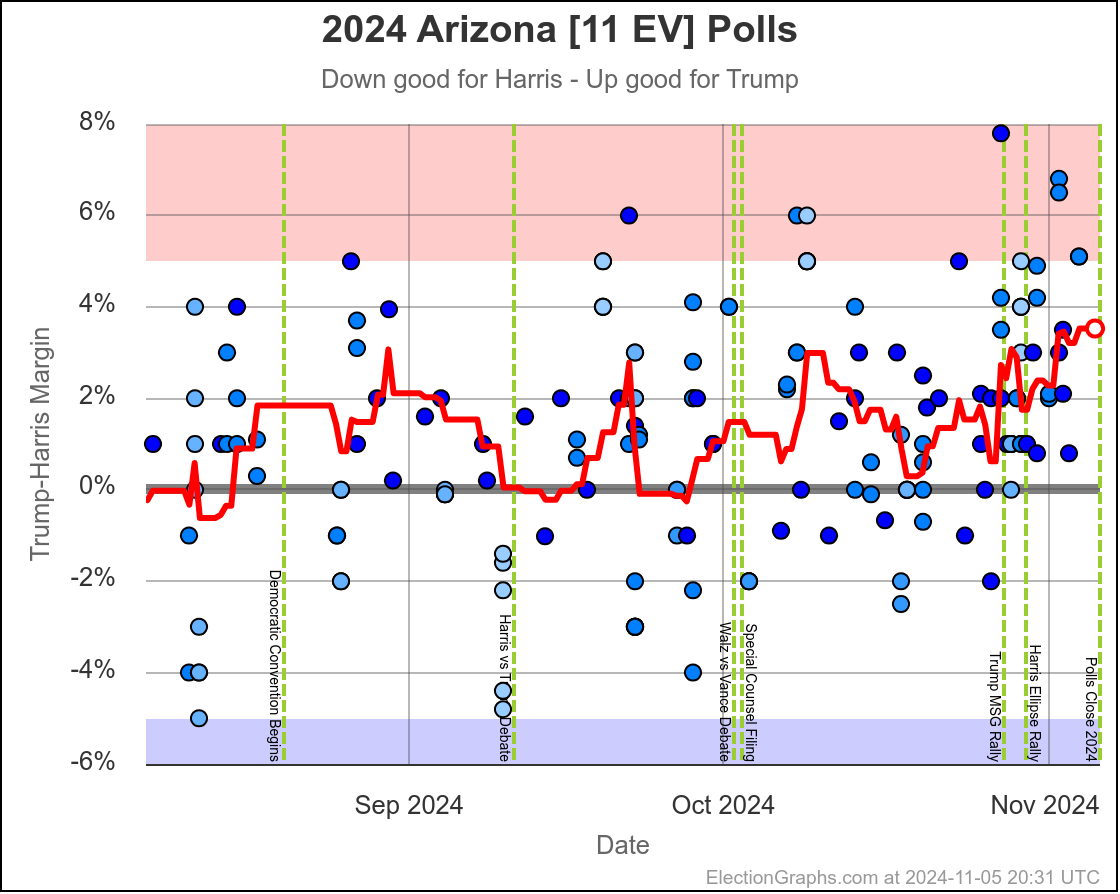
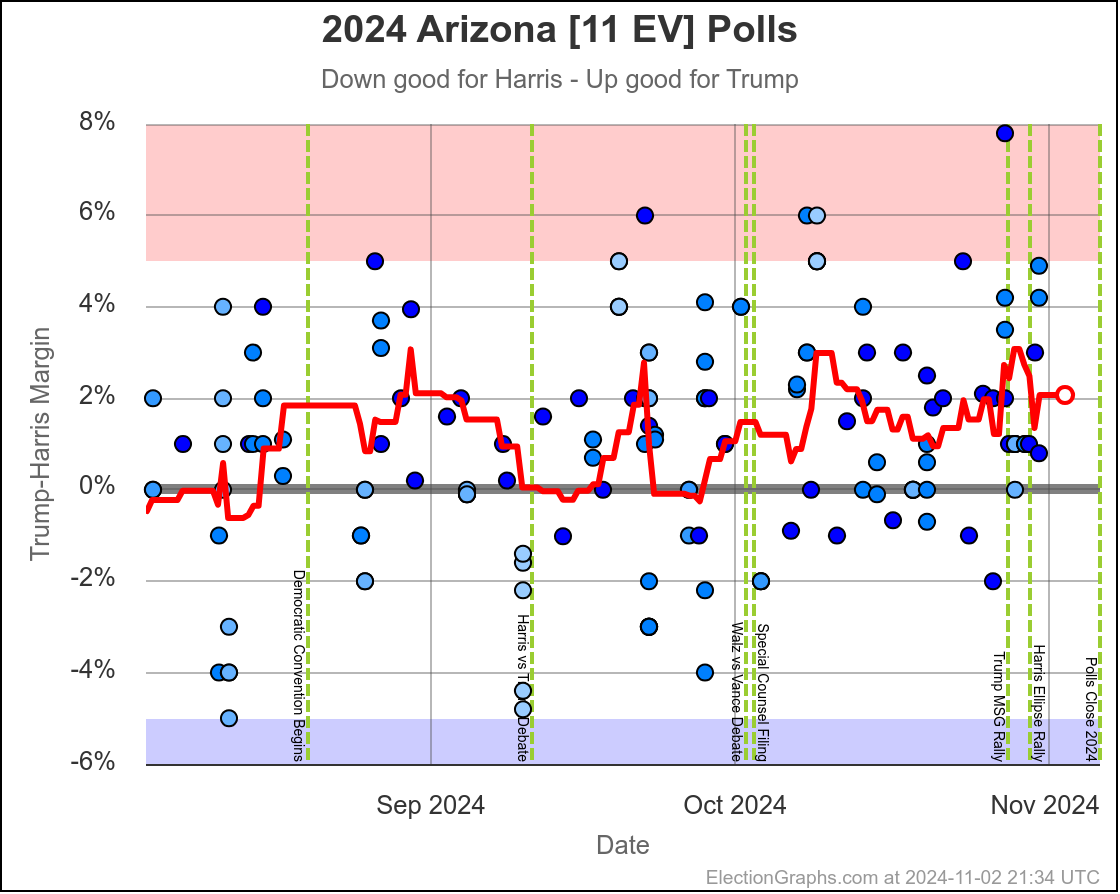
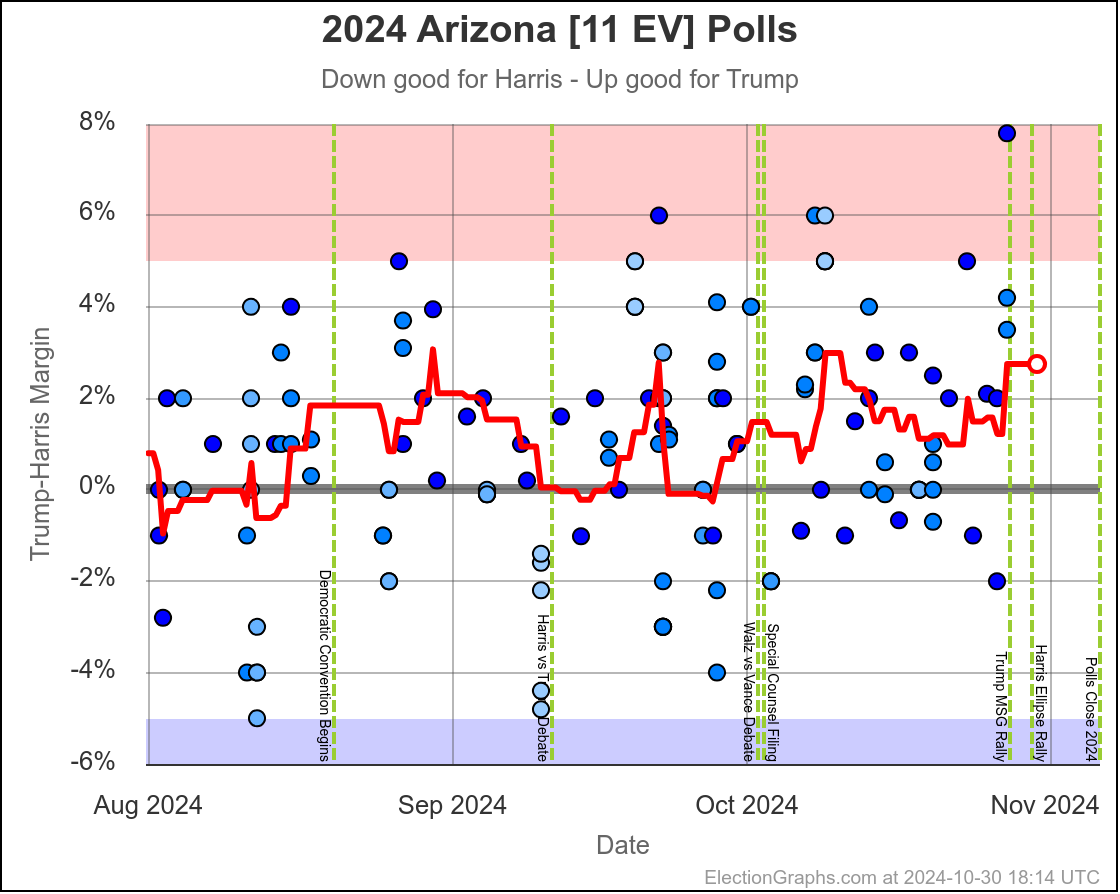
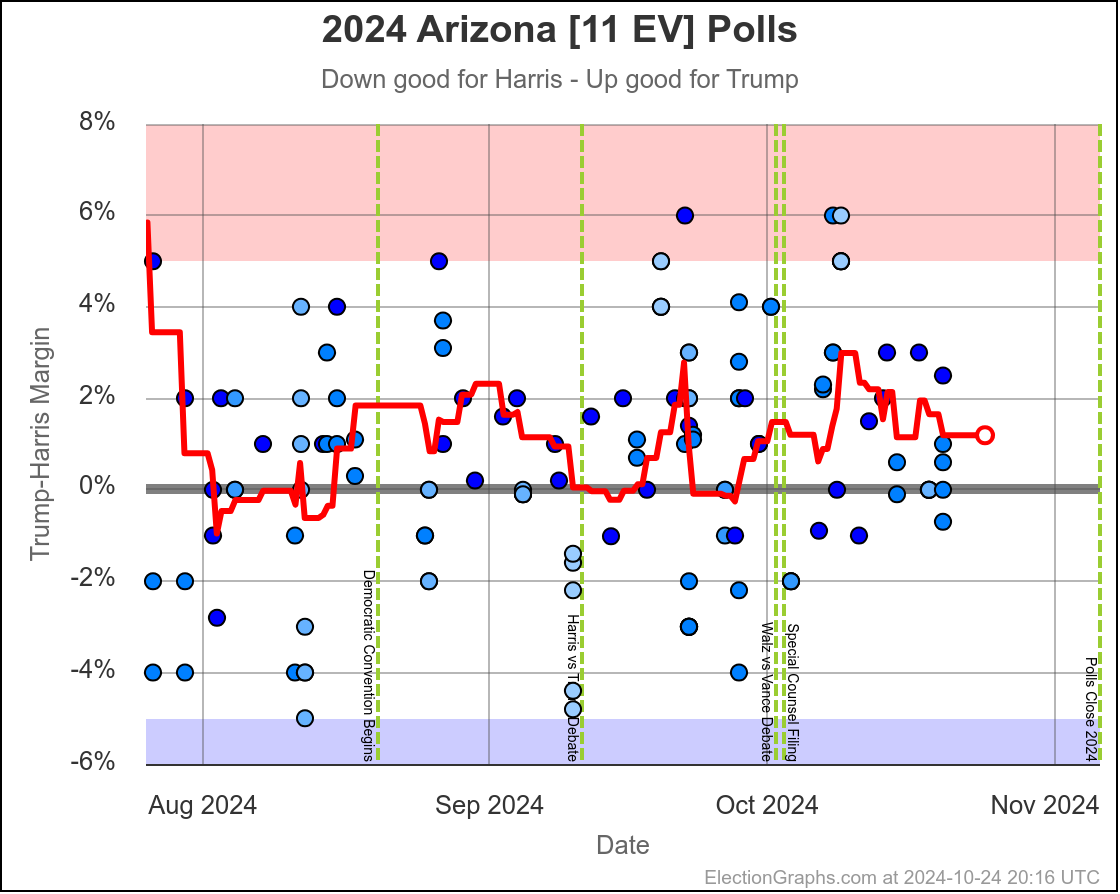
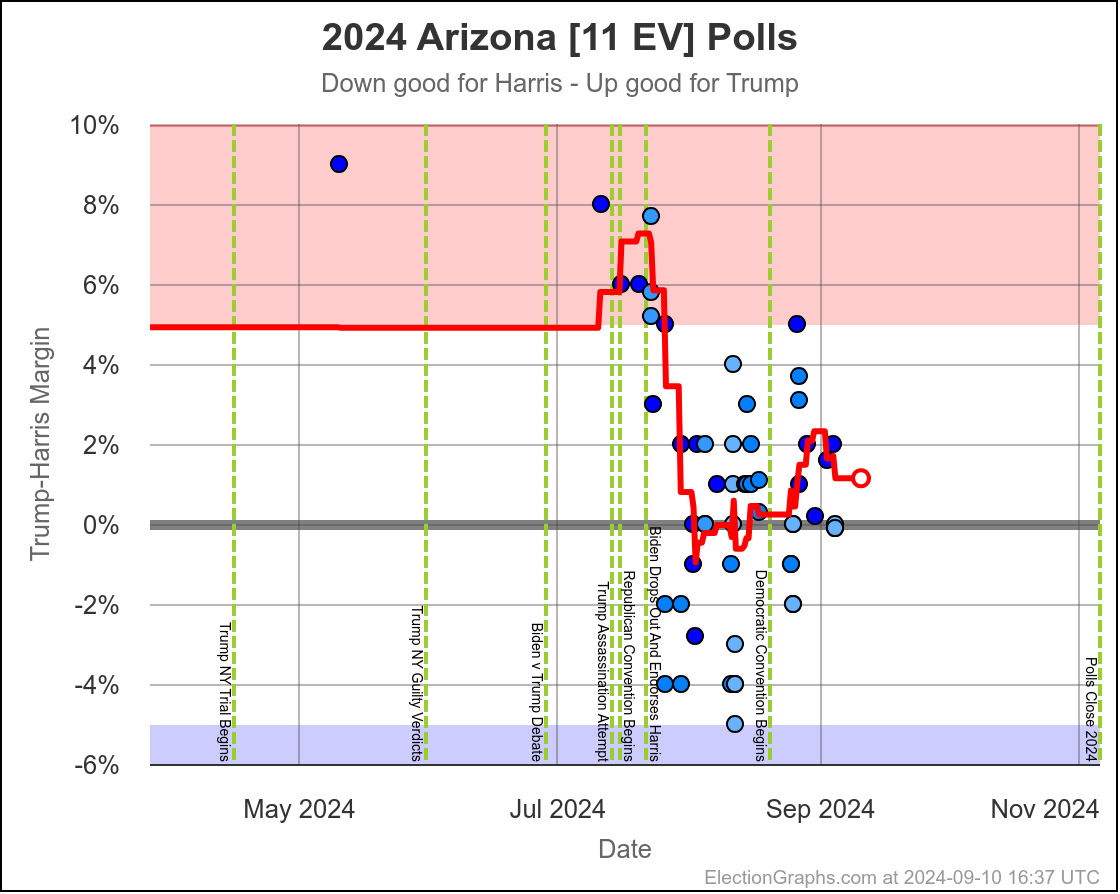
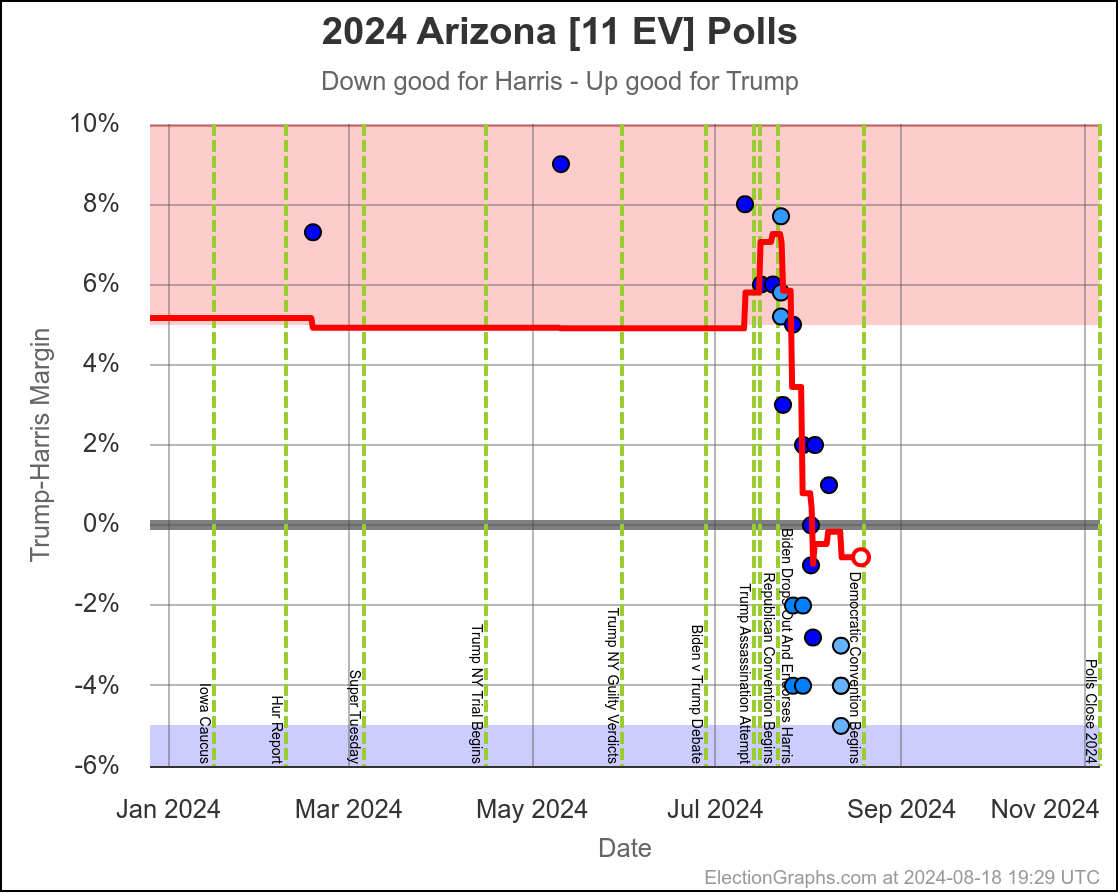
- Arizona (11 EV): Trump+1.2% -> Harris by 0.1% (Harris+1.3%)
- Ohio (17 EV): Trump+9.4% -> Trump+7.8% (Harris+1.6%)
- Nebraska-CD2 (1 EV): Harris by 4.3% -> Harris by 7.3% (Harris+3.0%)
Some changes in both directions. Arizona does move from Trump to Harris, but both Michigan and Pennsylvania move from Harris to Trump, and they outweigh Arizona, and the tipping point moves from Harris by 0.5% in Pennsylvania to Trump by 0.9% in Georgia.
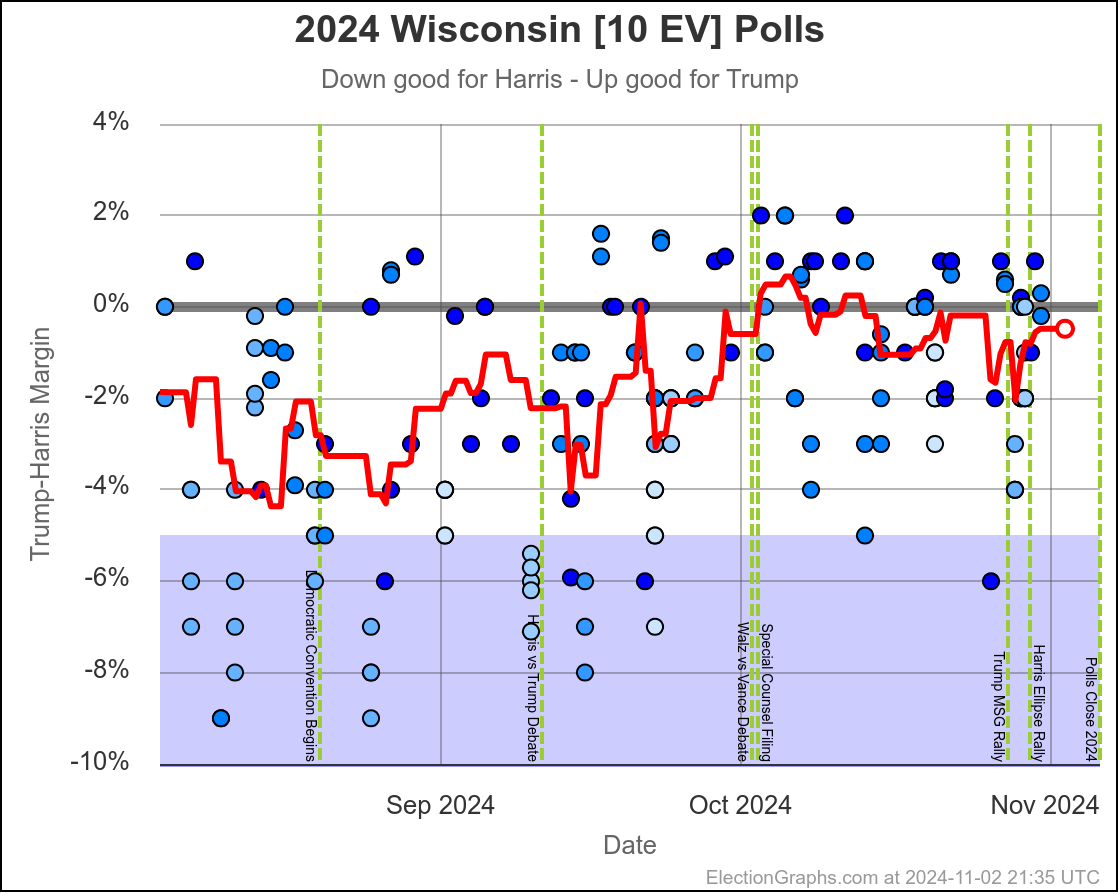
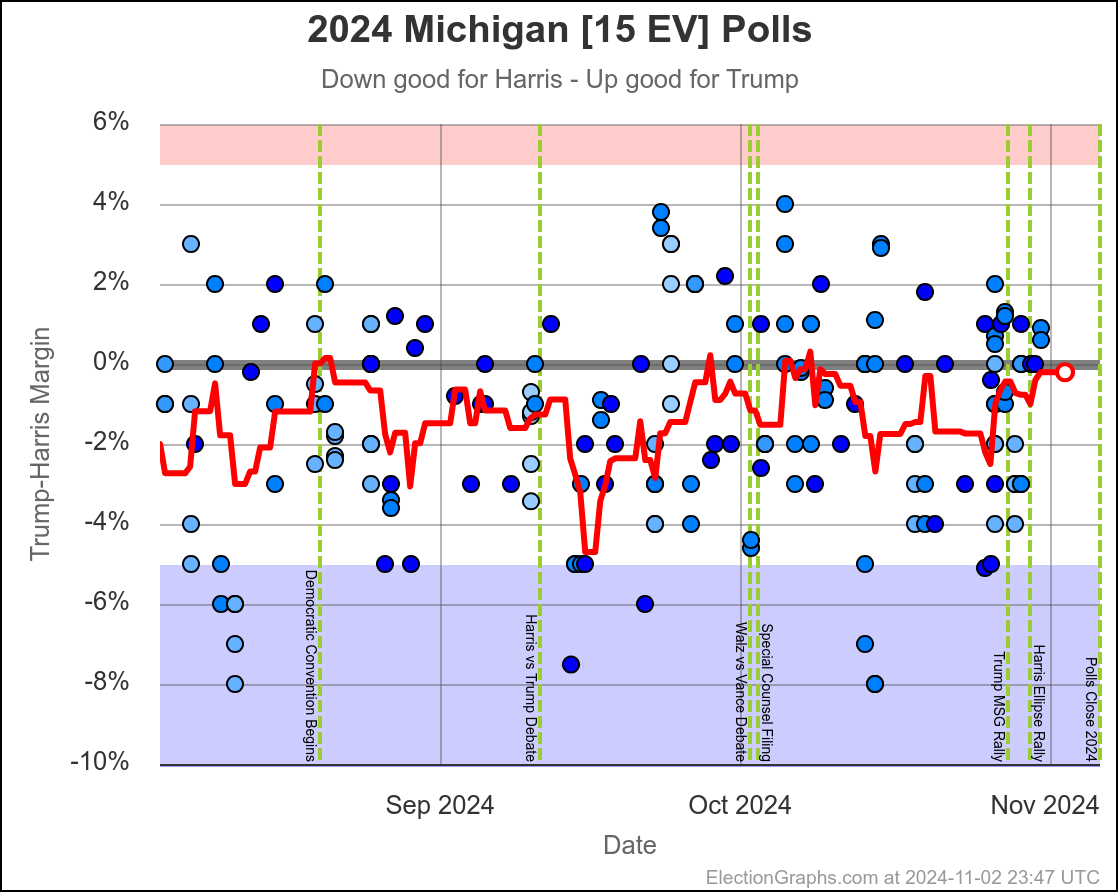
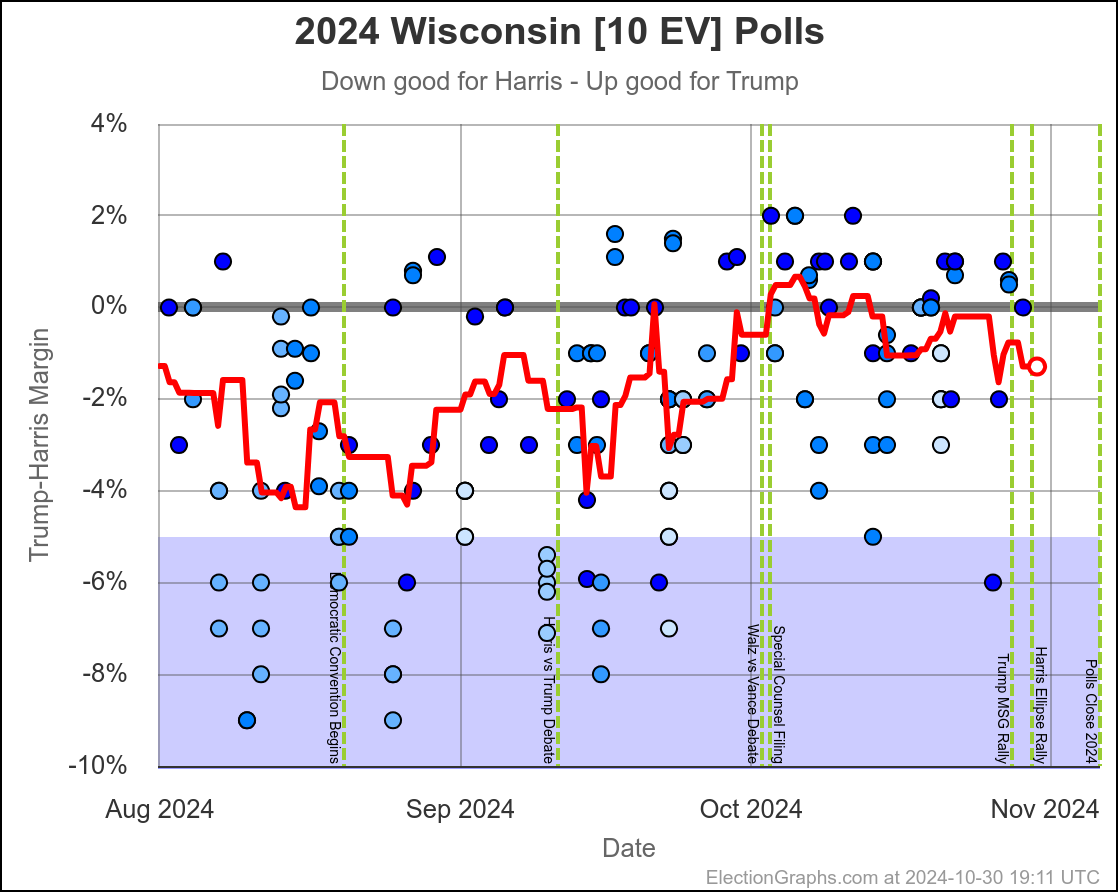
Lets take a close up look at the tipping point state, along with three states on each side:
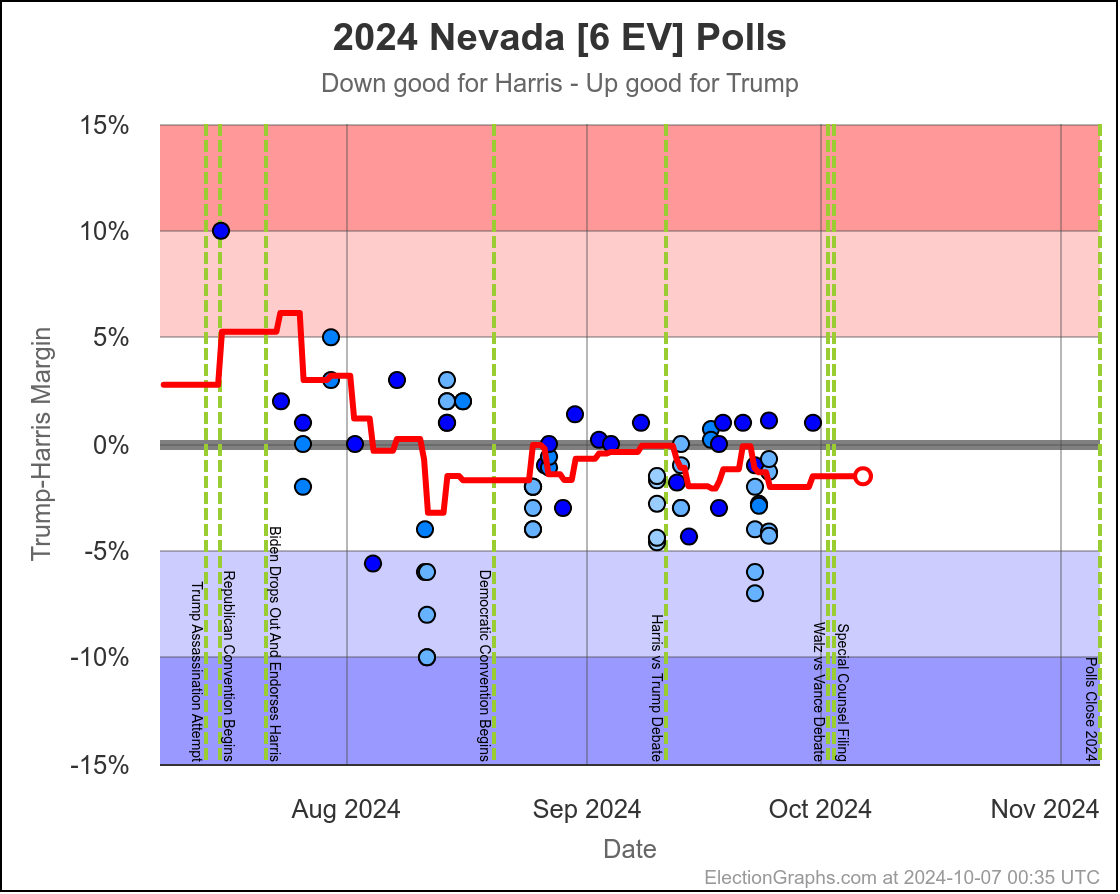
In the last two months the average in Nevada has ranged from Harris by 3.2% to Trump by 0.2%. Right now we have Harris by 1.5%, which is pretty close to the middle of that range. Looking at the longer term trend, Nevada looks like a pretty consistent narrow Harris lead.
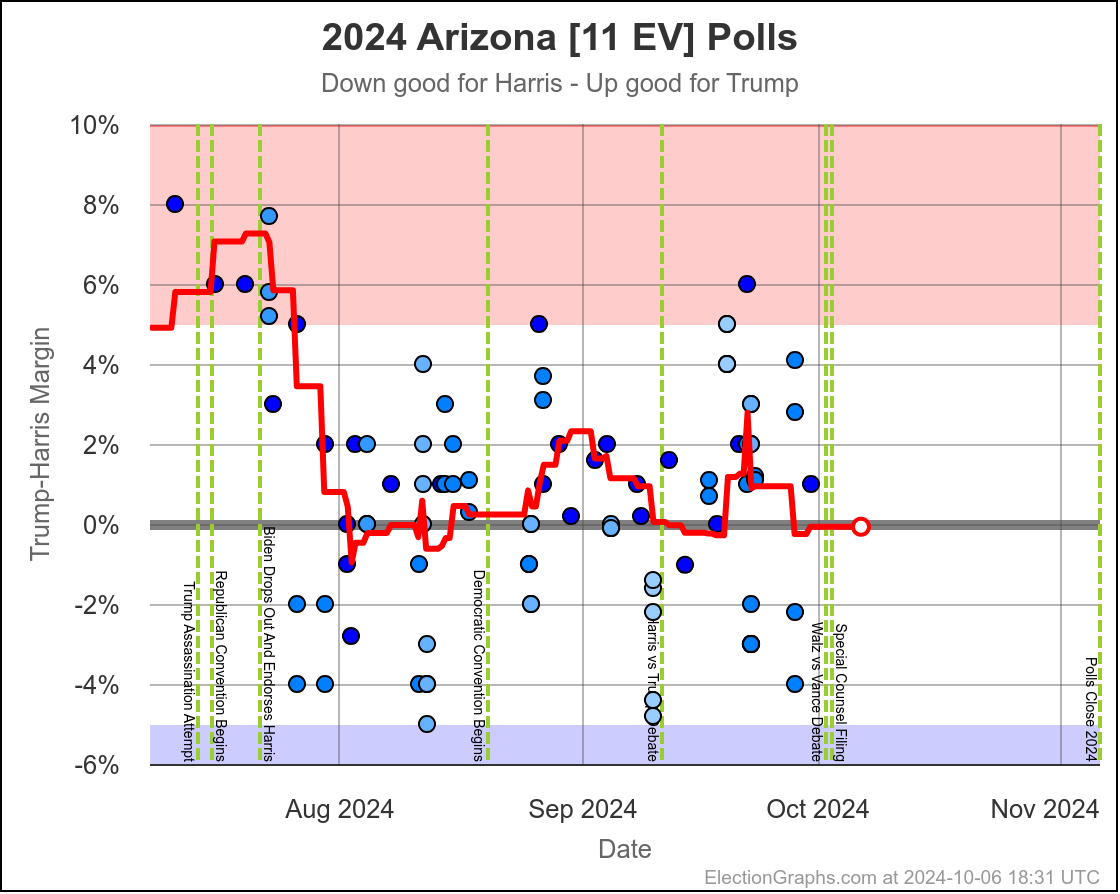
The two month range in Arizona is from Harris by 0.6% to Trump by 2.8%, with Harris currently leading by 0.1%. While there have been occasional very narrow Harris leads here, most of the time Trump has led in Arizona. There is always the possibility of polls just systematically underestimating Harris, or a last minute change, but Arizona looks like a Trump state at the moment, despite the current tiny lead by Harris.
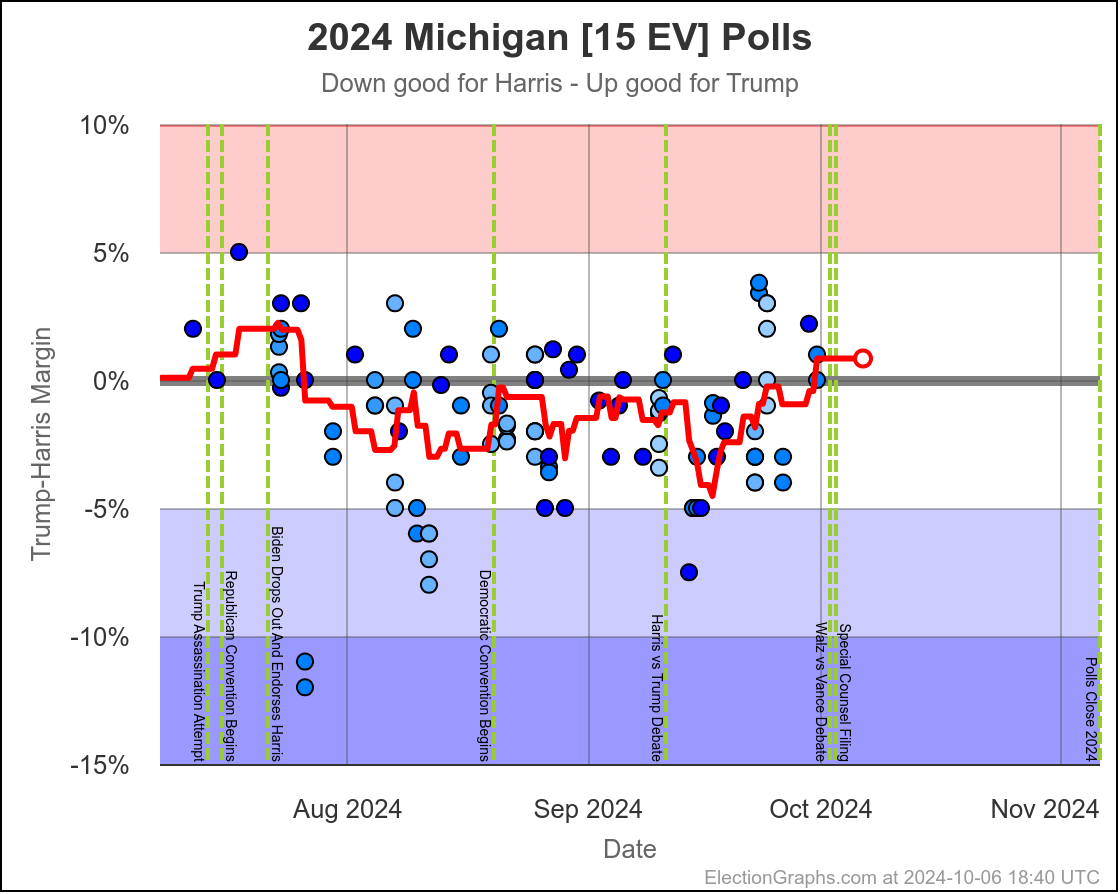
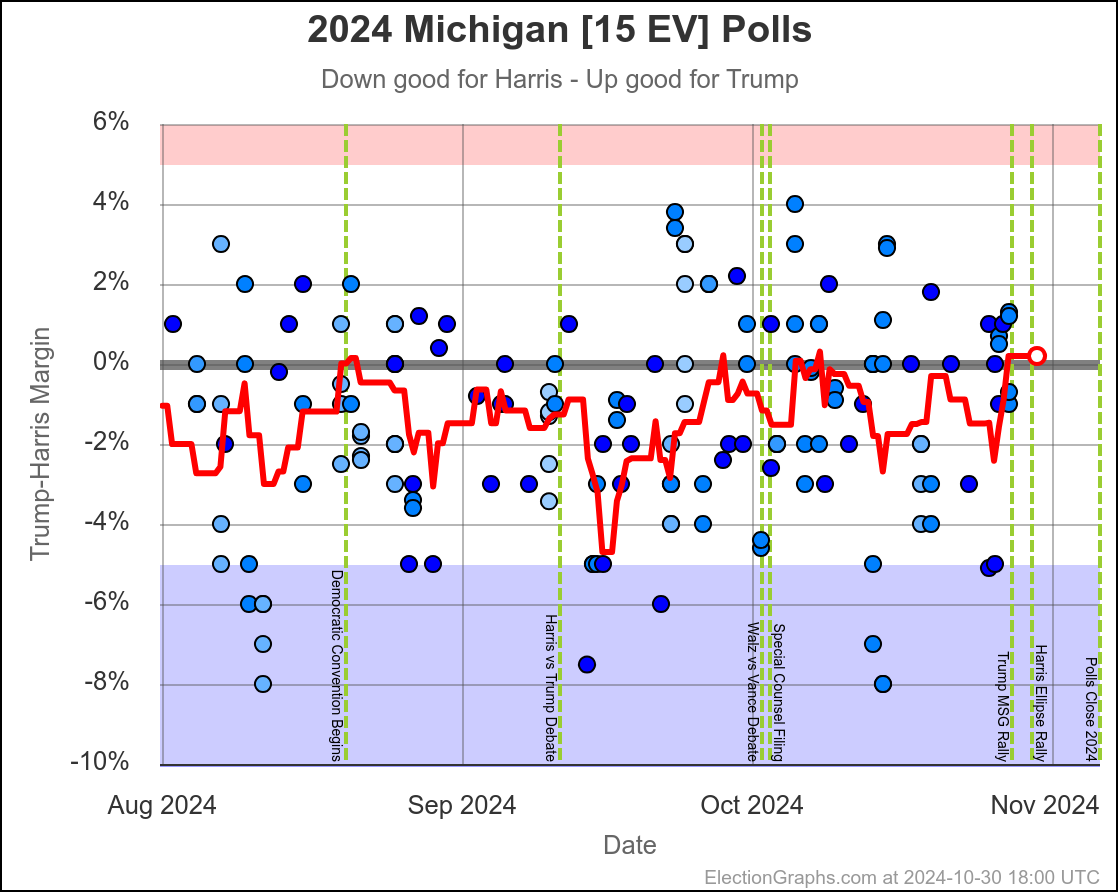
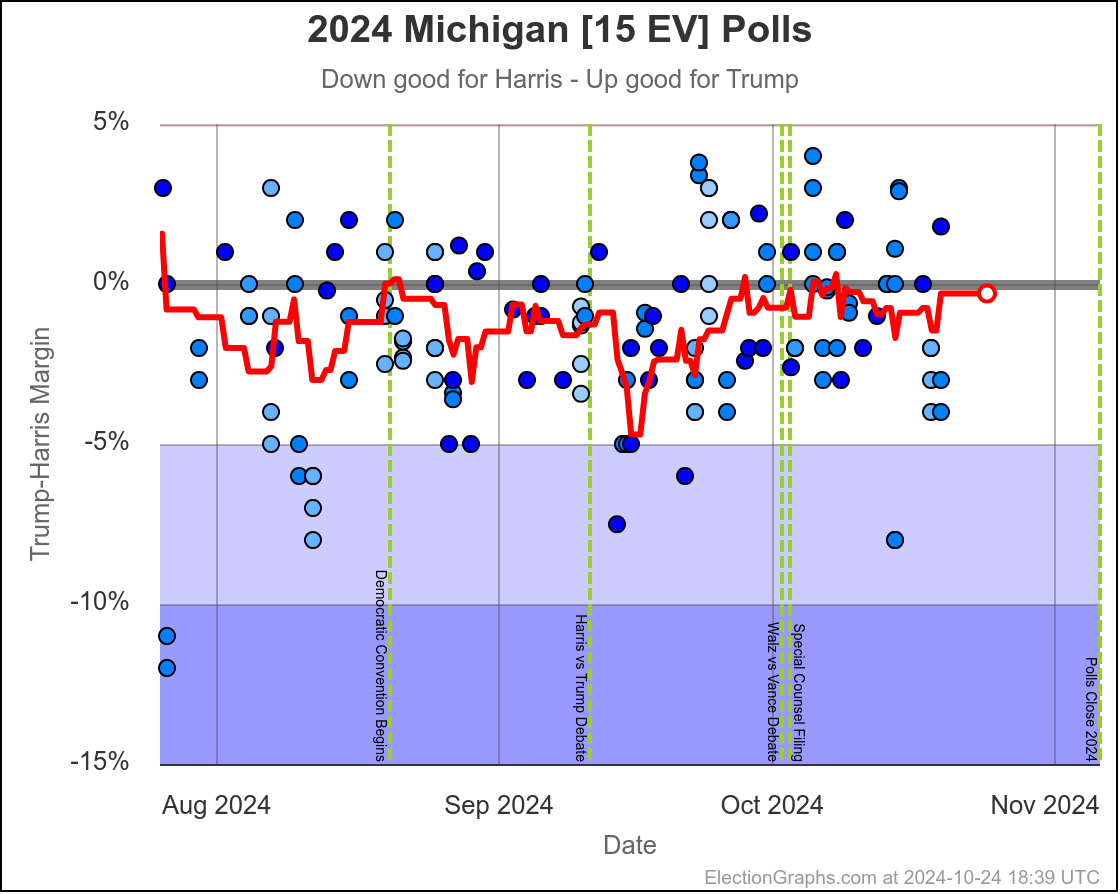
Michigan ranges from Harris by 4.5% to Trump by 0.8%, which is where it is right now. Almost the entire time Harris has been leading, but RIGHT NOW Trump is leading. The question is if this is an actual trend, or just that Trump has had a few good polls recently, and there will be a reversion to the mean with the next batch of polls.
Since there haven't really been any news events that you would think would move the polls, it seems reasonable to think Michigan is "really" a very narrow Harris lead. But it is worth paying close attention to the next few polls we see to see if this pops back to the Harris side of the center line.
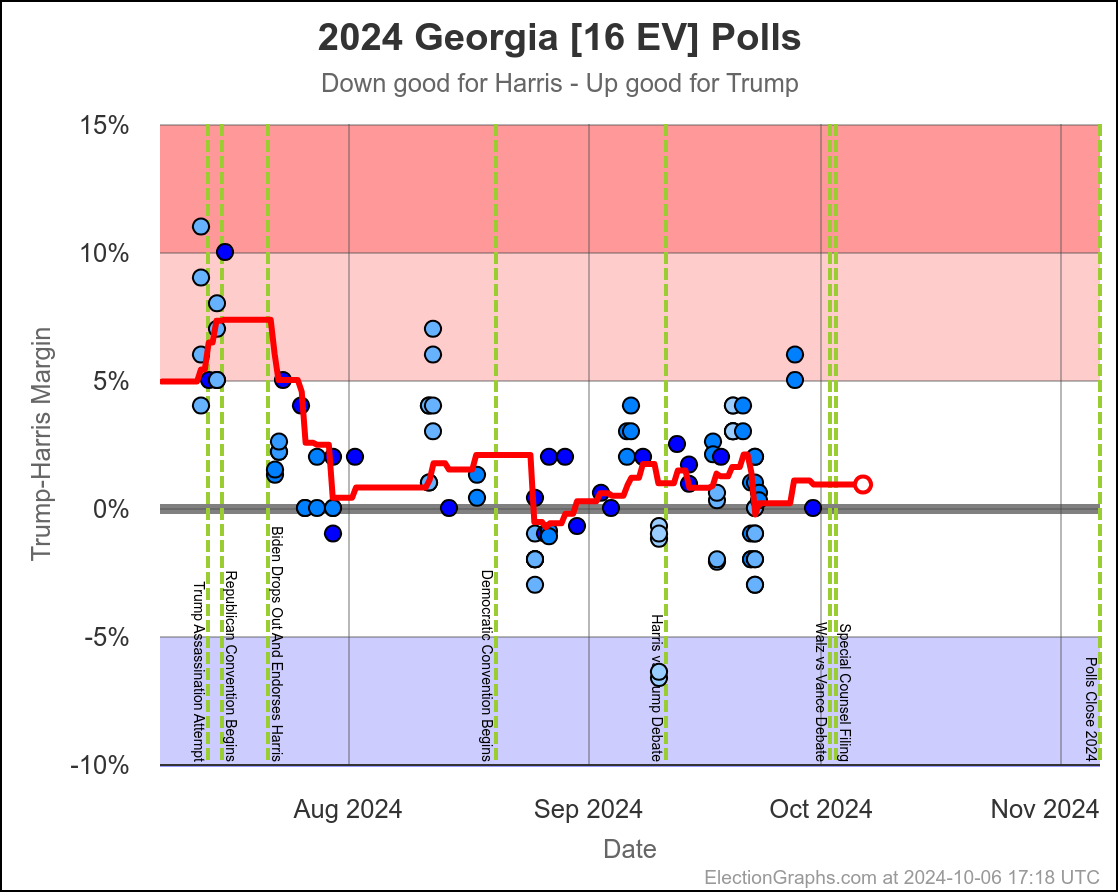
Harris by 0.6% to Trump by 2.1%. Currently Trump by 0.9% and this is the tipping point state. Georgia has almost always been Trump. It is probably really a narrow Trump win minus systematic polling error or a last minute move.
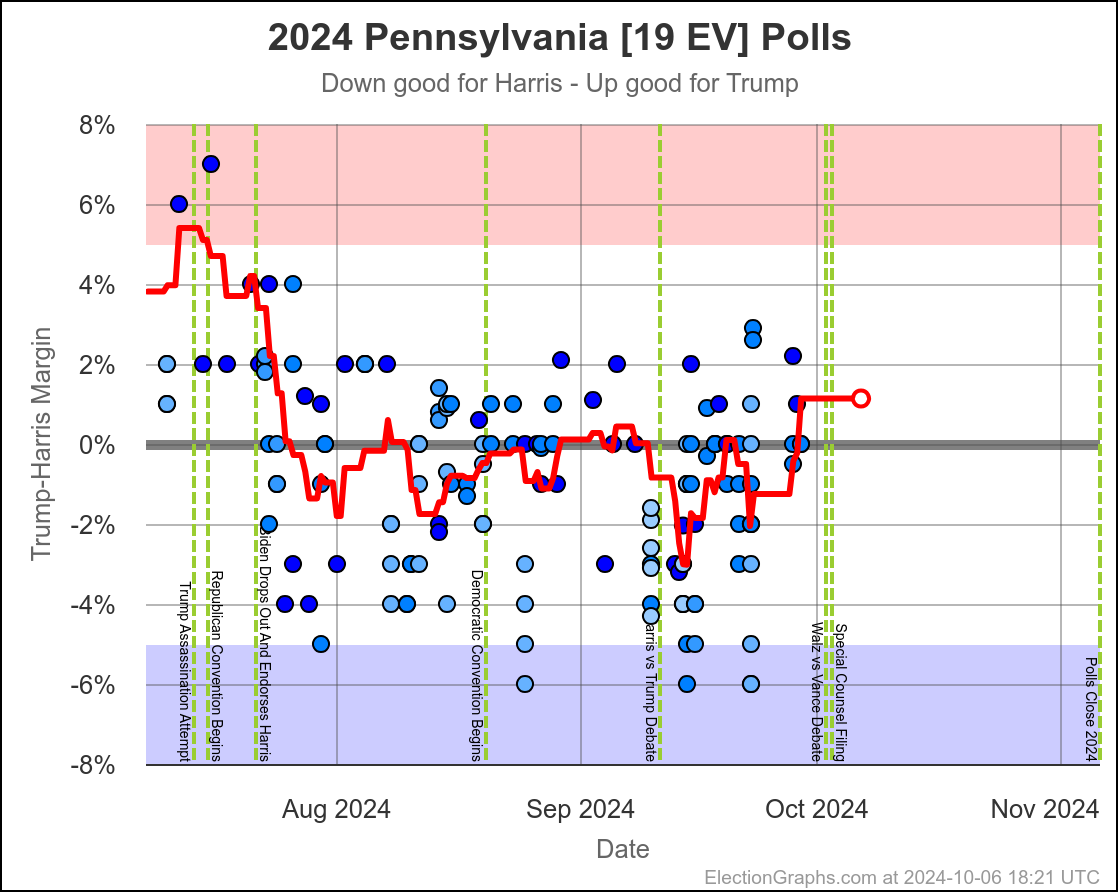
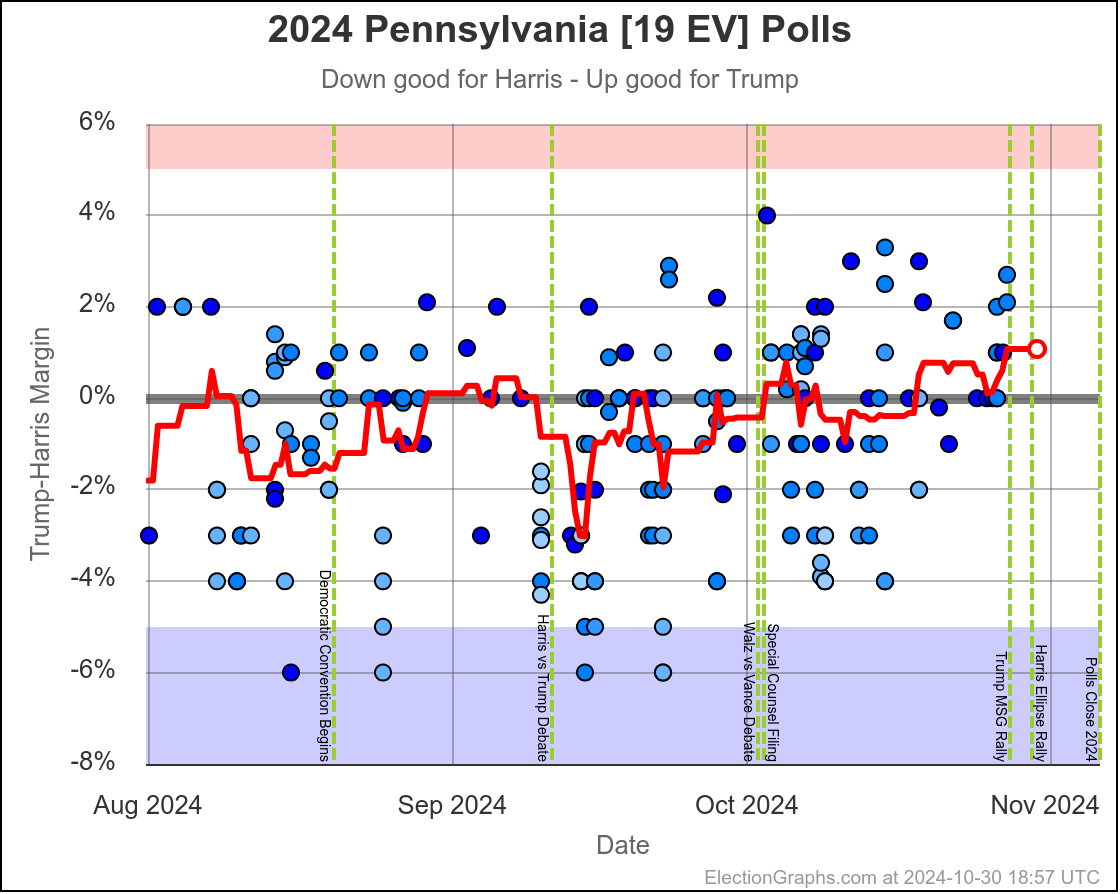
Harris by 3.0% to Trump by 1.1%, which is where things are now. Very similar to Michigan, almost all the time in the last two months, Harris has held a small lead in Pennsylvania. But at this very moment things have moved toward Trump and he is better off there than he has been since July.
The question is if this is a "real" move, or one that is just driven by a handful of outlier polls, where Trump's lead will disappear as soon as the next batch of polls comes in. We will see soon enough.
If I had to bet though, Pennsylvania is really still a very narrow Harris lead and this is a blip rather than a new trend.
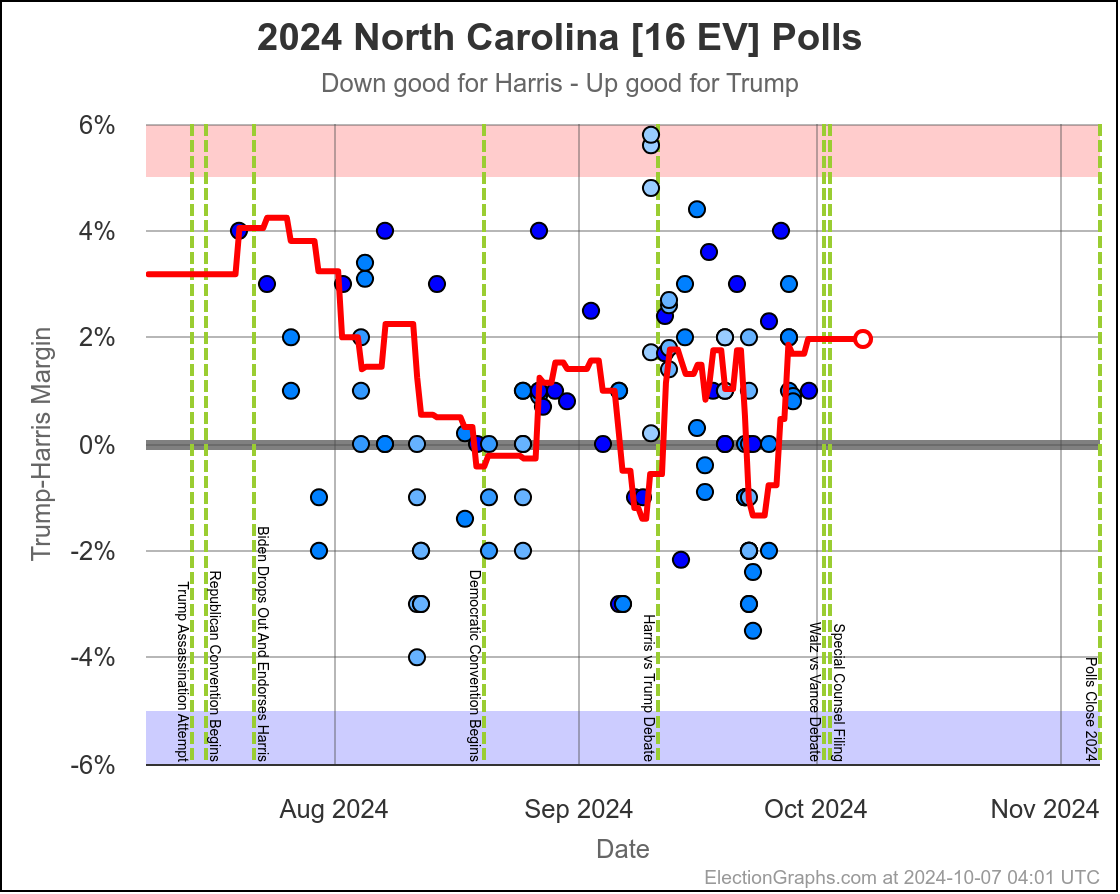
North Carolina has ranged from Harris by 1.4% to Trump by 2.3%, and is currently Trump by 2.0%. Trump seems to be at the upper end of his range here, but Harris has only briefly taken the lead here. If I had to guess, I would say this is really just bouncing around Trump up by 1%.
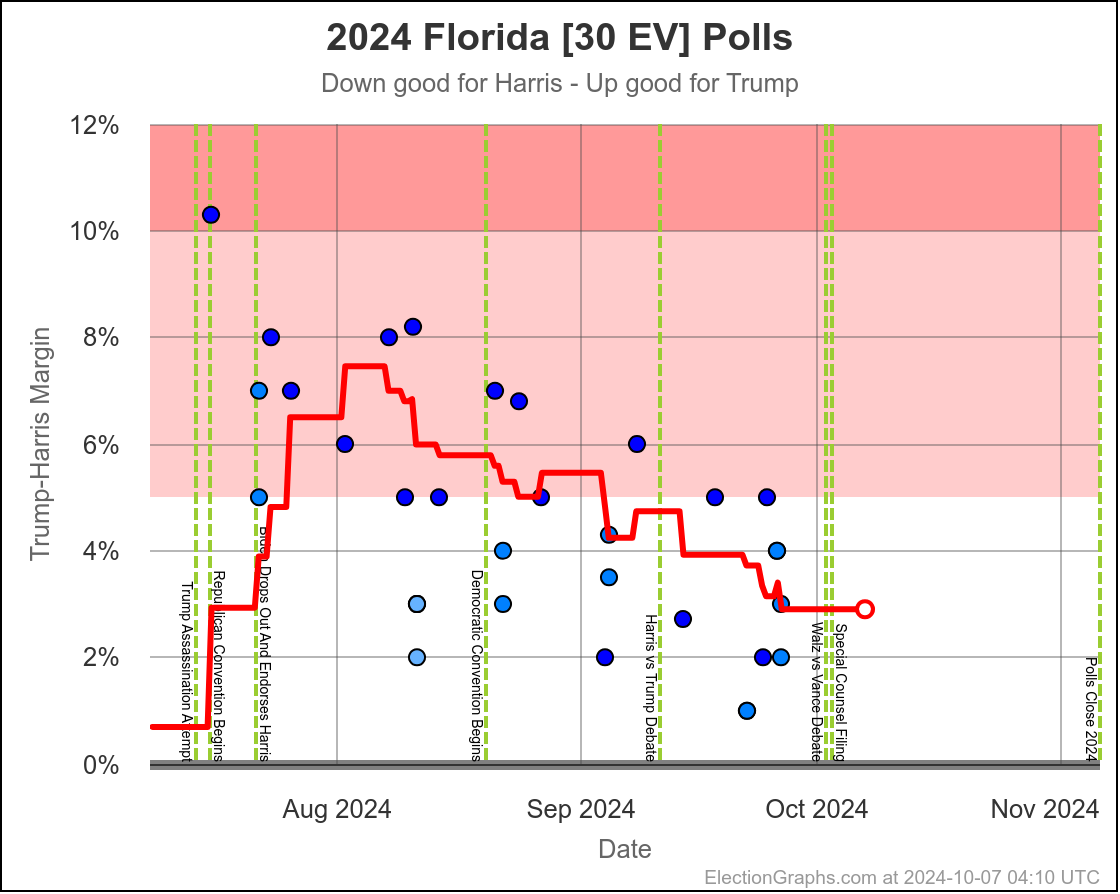
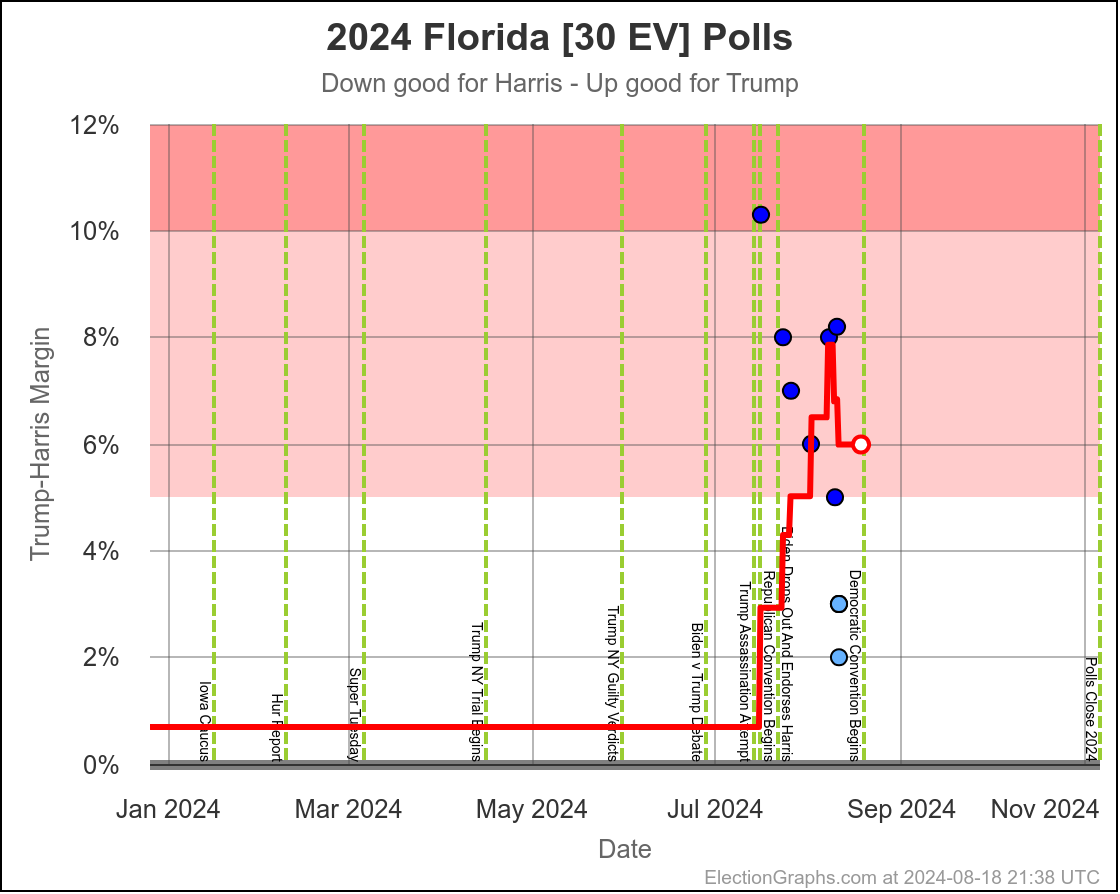
Of all seven states we are looking at here, Florida is the ONLY one where there appears to be an actual trend, rather than just bouncing around a range as individual polls come in and out of the average, with no "real" movement.
In Florida two months ago Trump was ahead by 7.0%, but now he is only ahead by 2.9%. That's a 4.1% movement toward Harris. Trump is still leading Florida though, and a Harris win would still be an upset.
OK, that is all seven.
So, the point of all that was to try to classify all of these key states by the longer term trends rather than by the poll values at this exact moment.
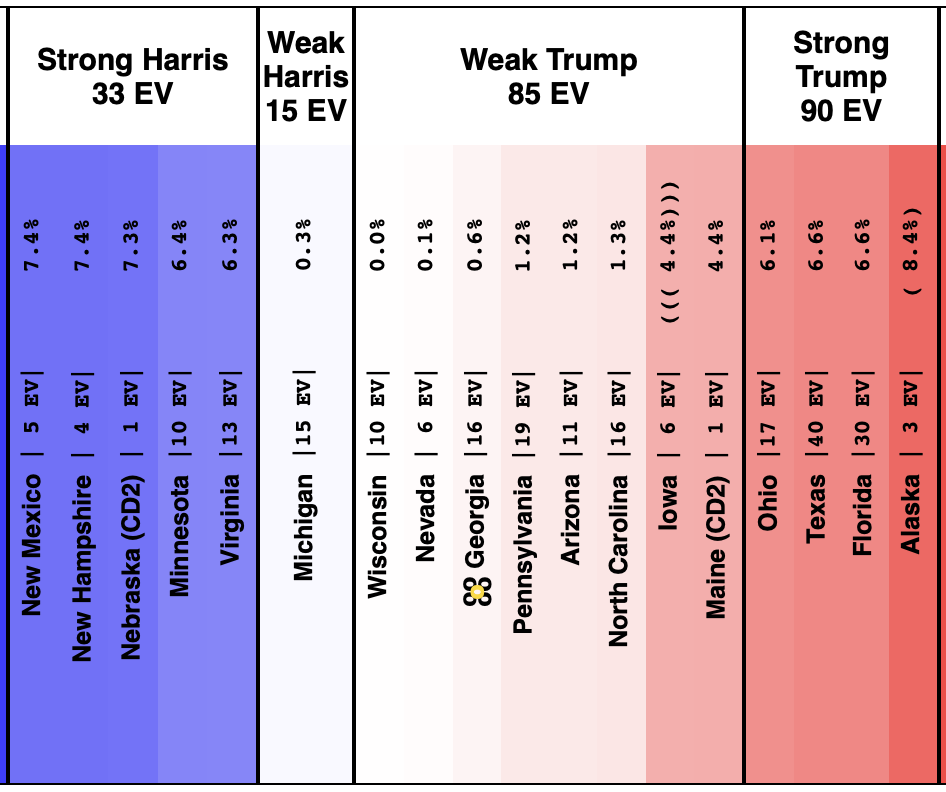
Doing this, you would give Nevada, Michigan, and Pennsylvania to Harris, but Arizona, Georgia, North Carolina, and Florida to Trump. (To round out the under 5% places, also Wisconsin to Harris, plus Iowa and Maine-CD2 to Trump.)
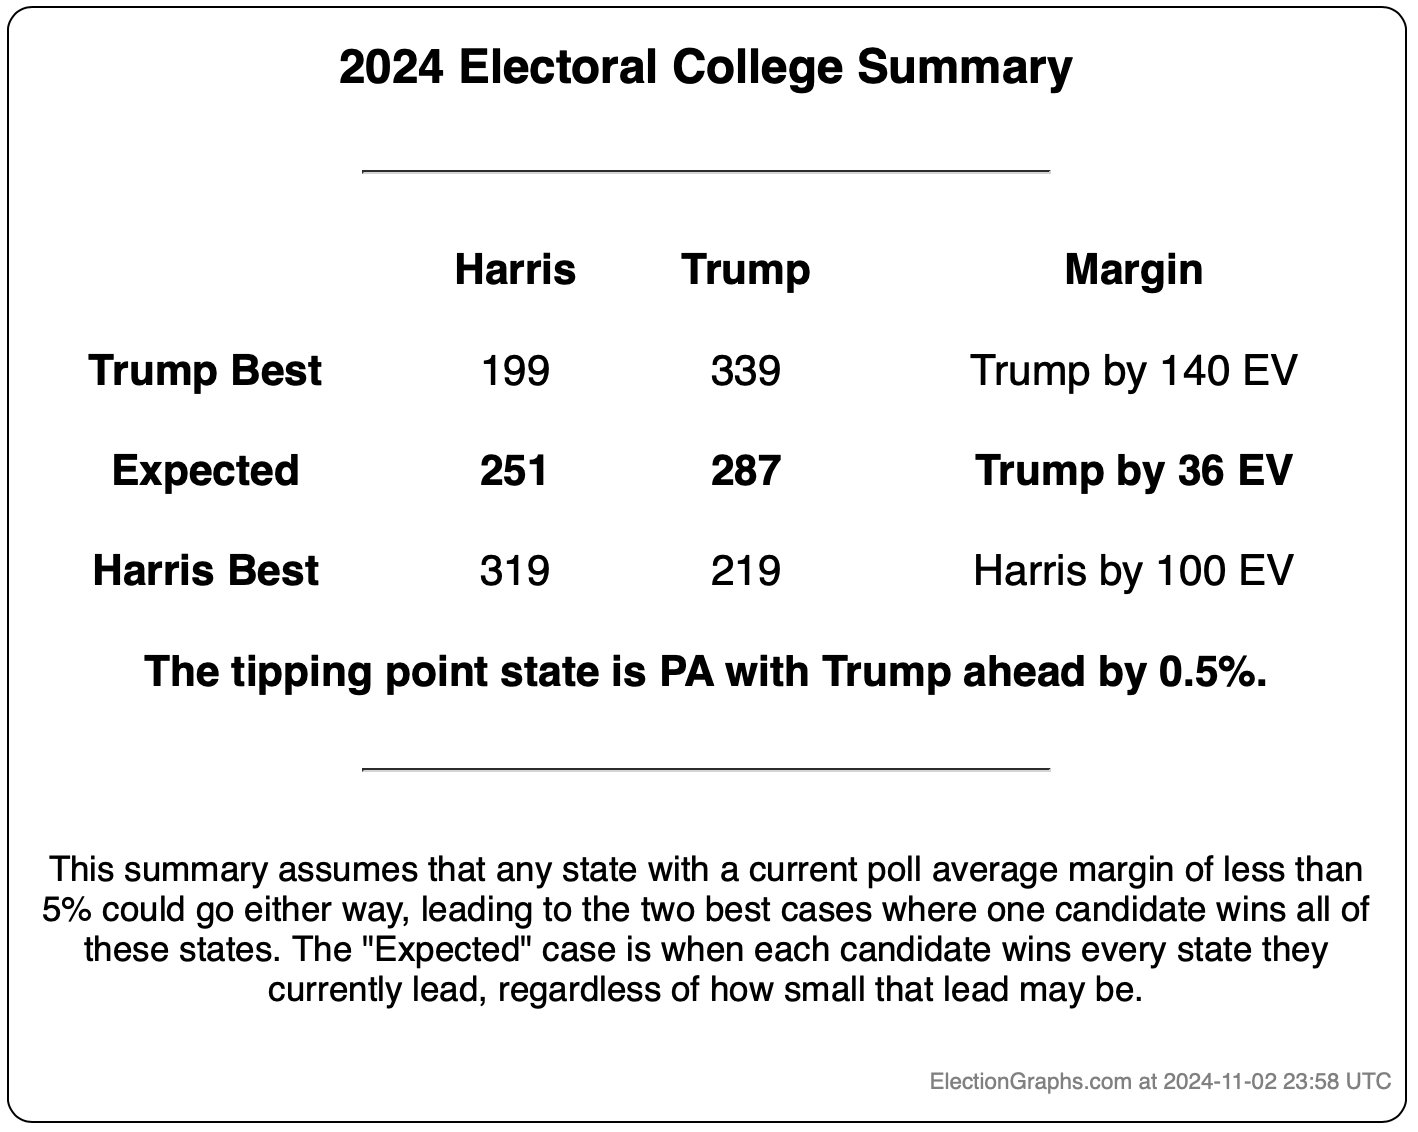
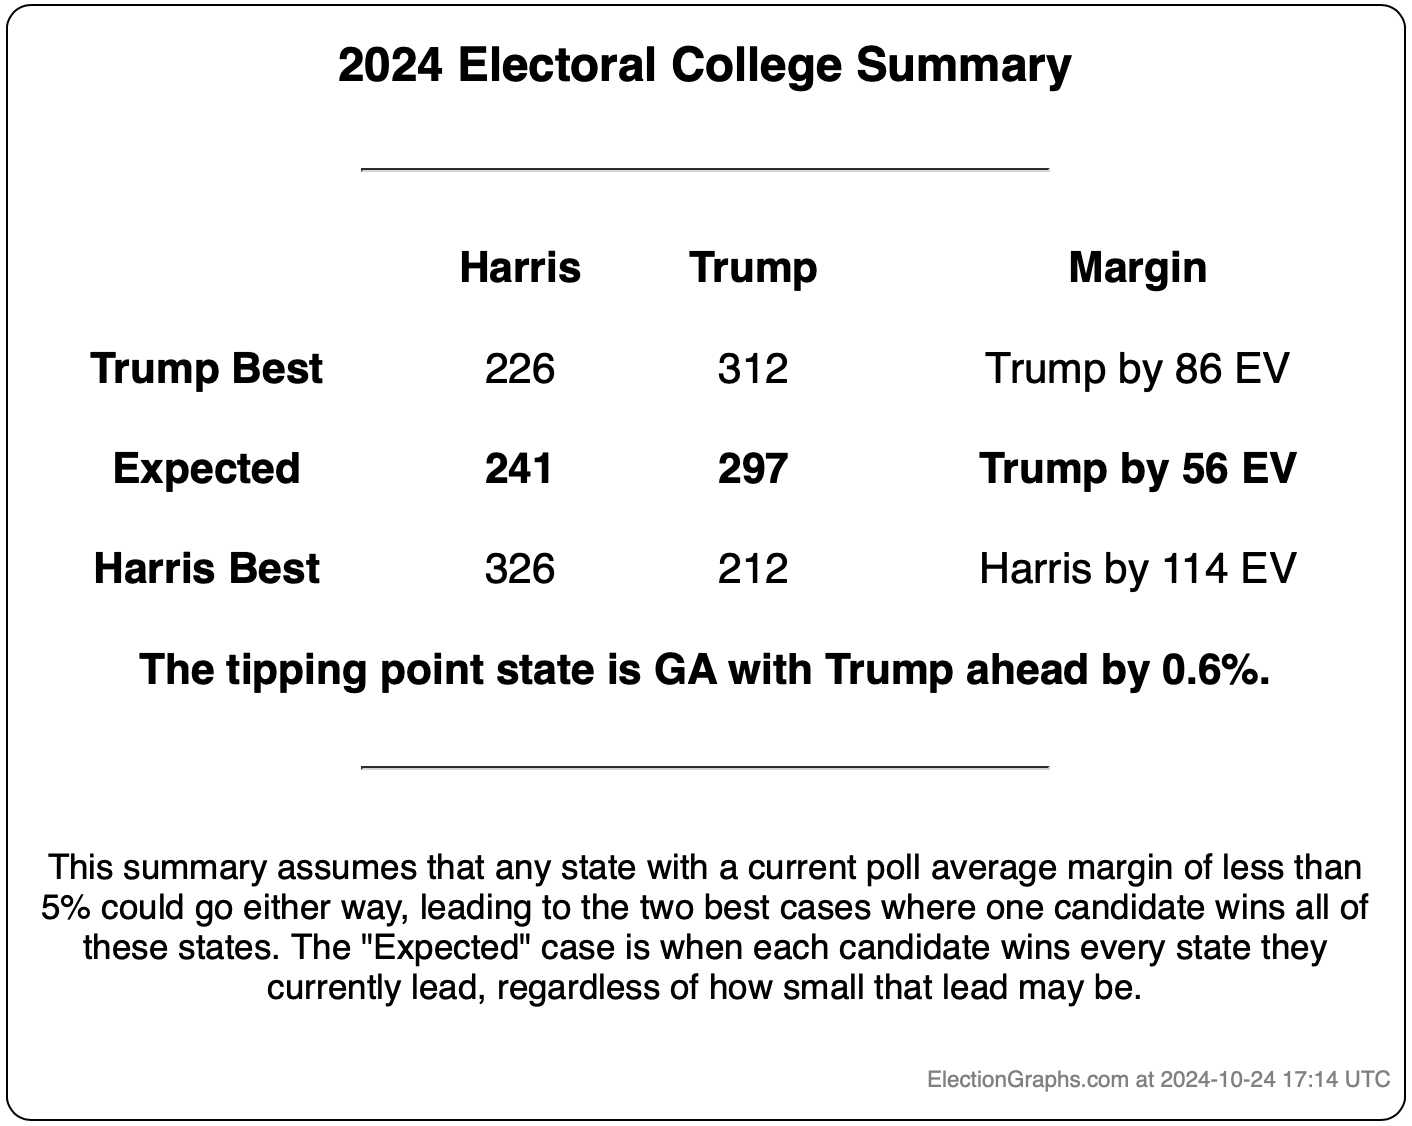
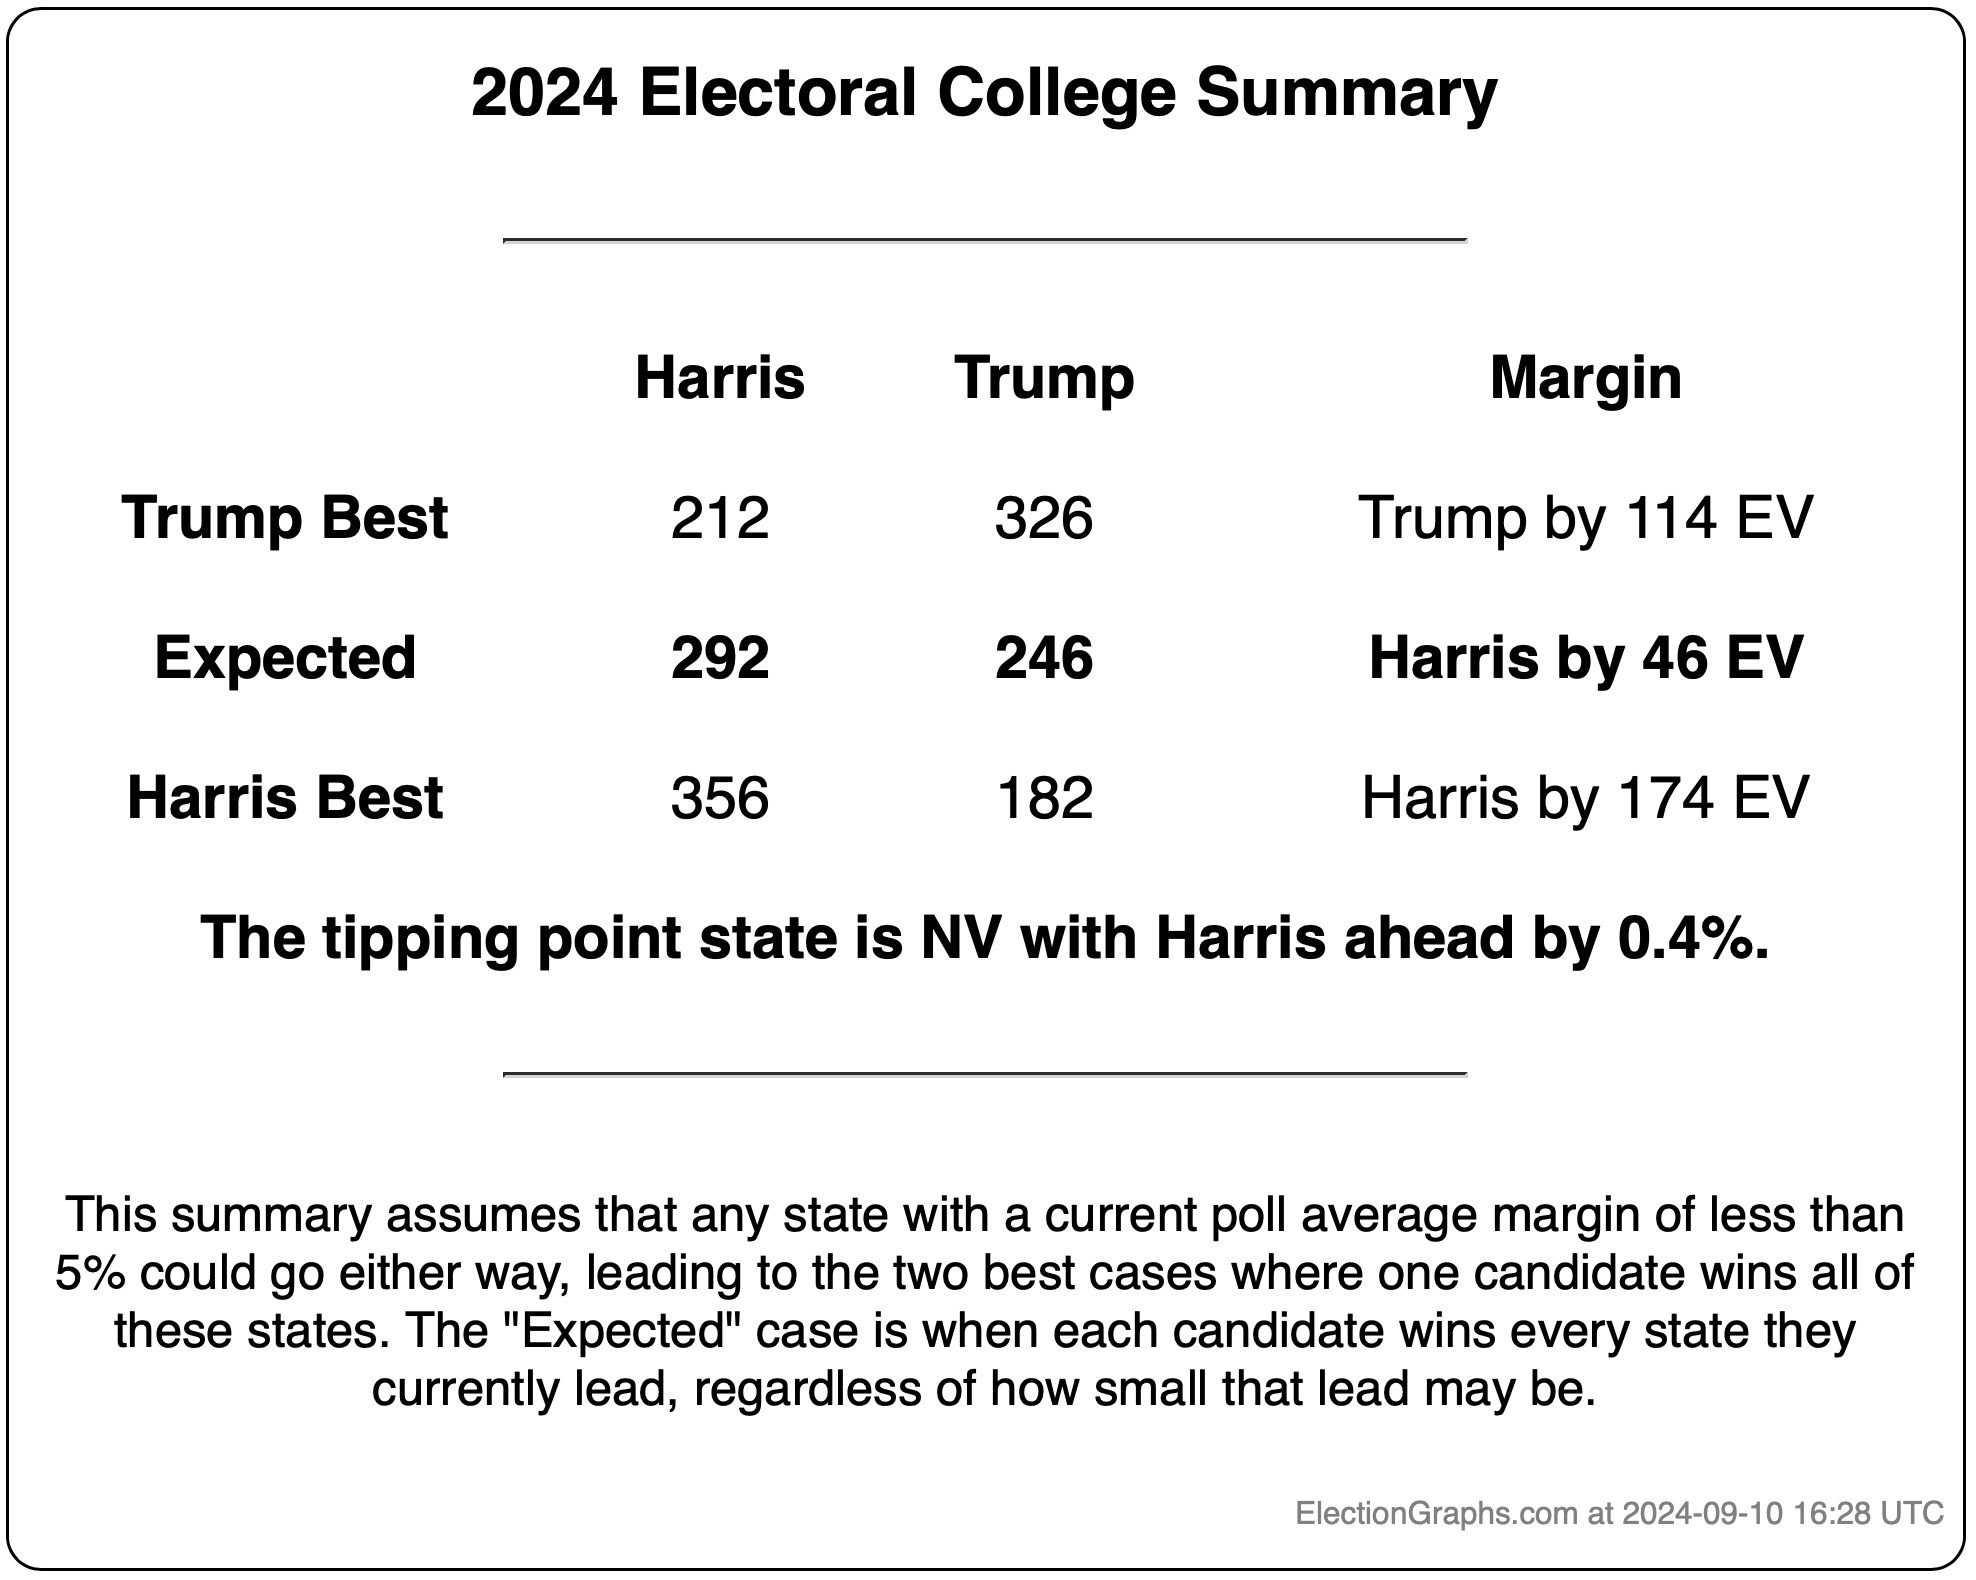
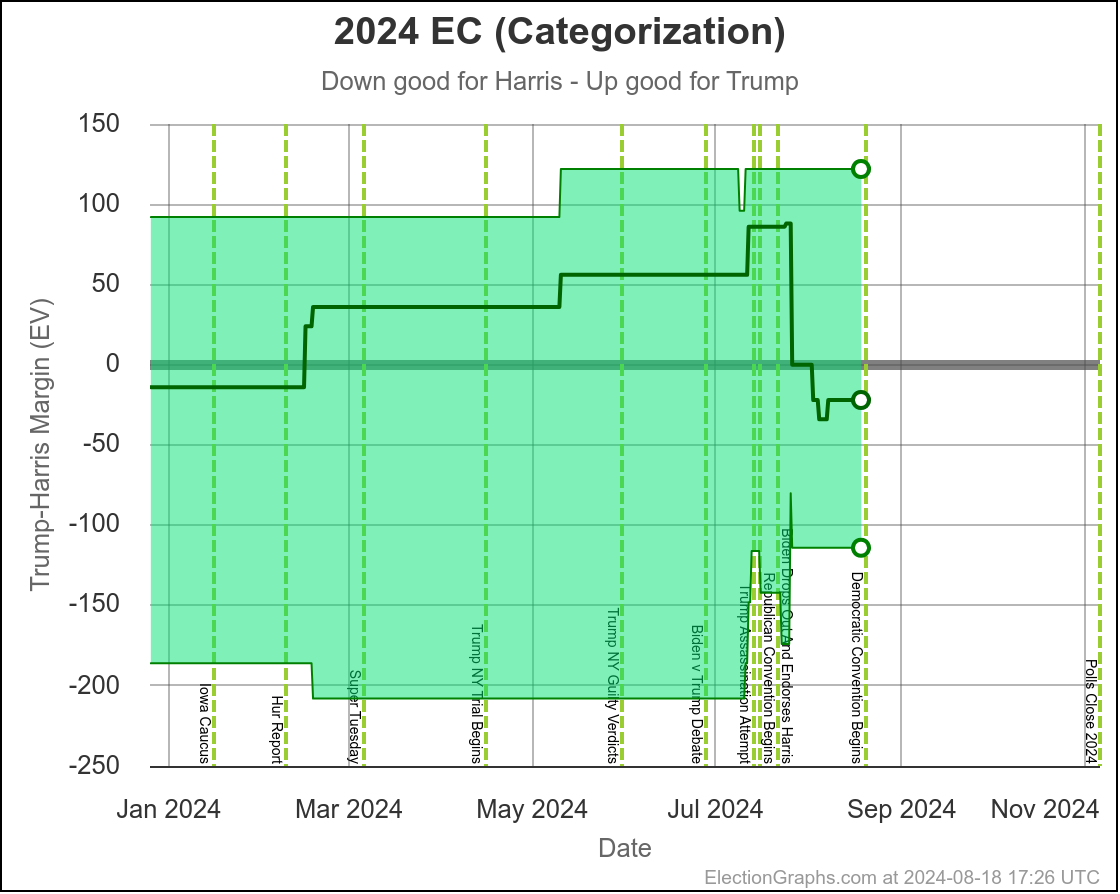
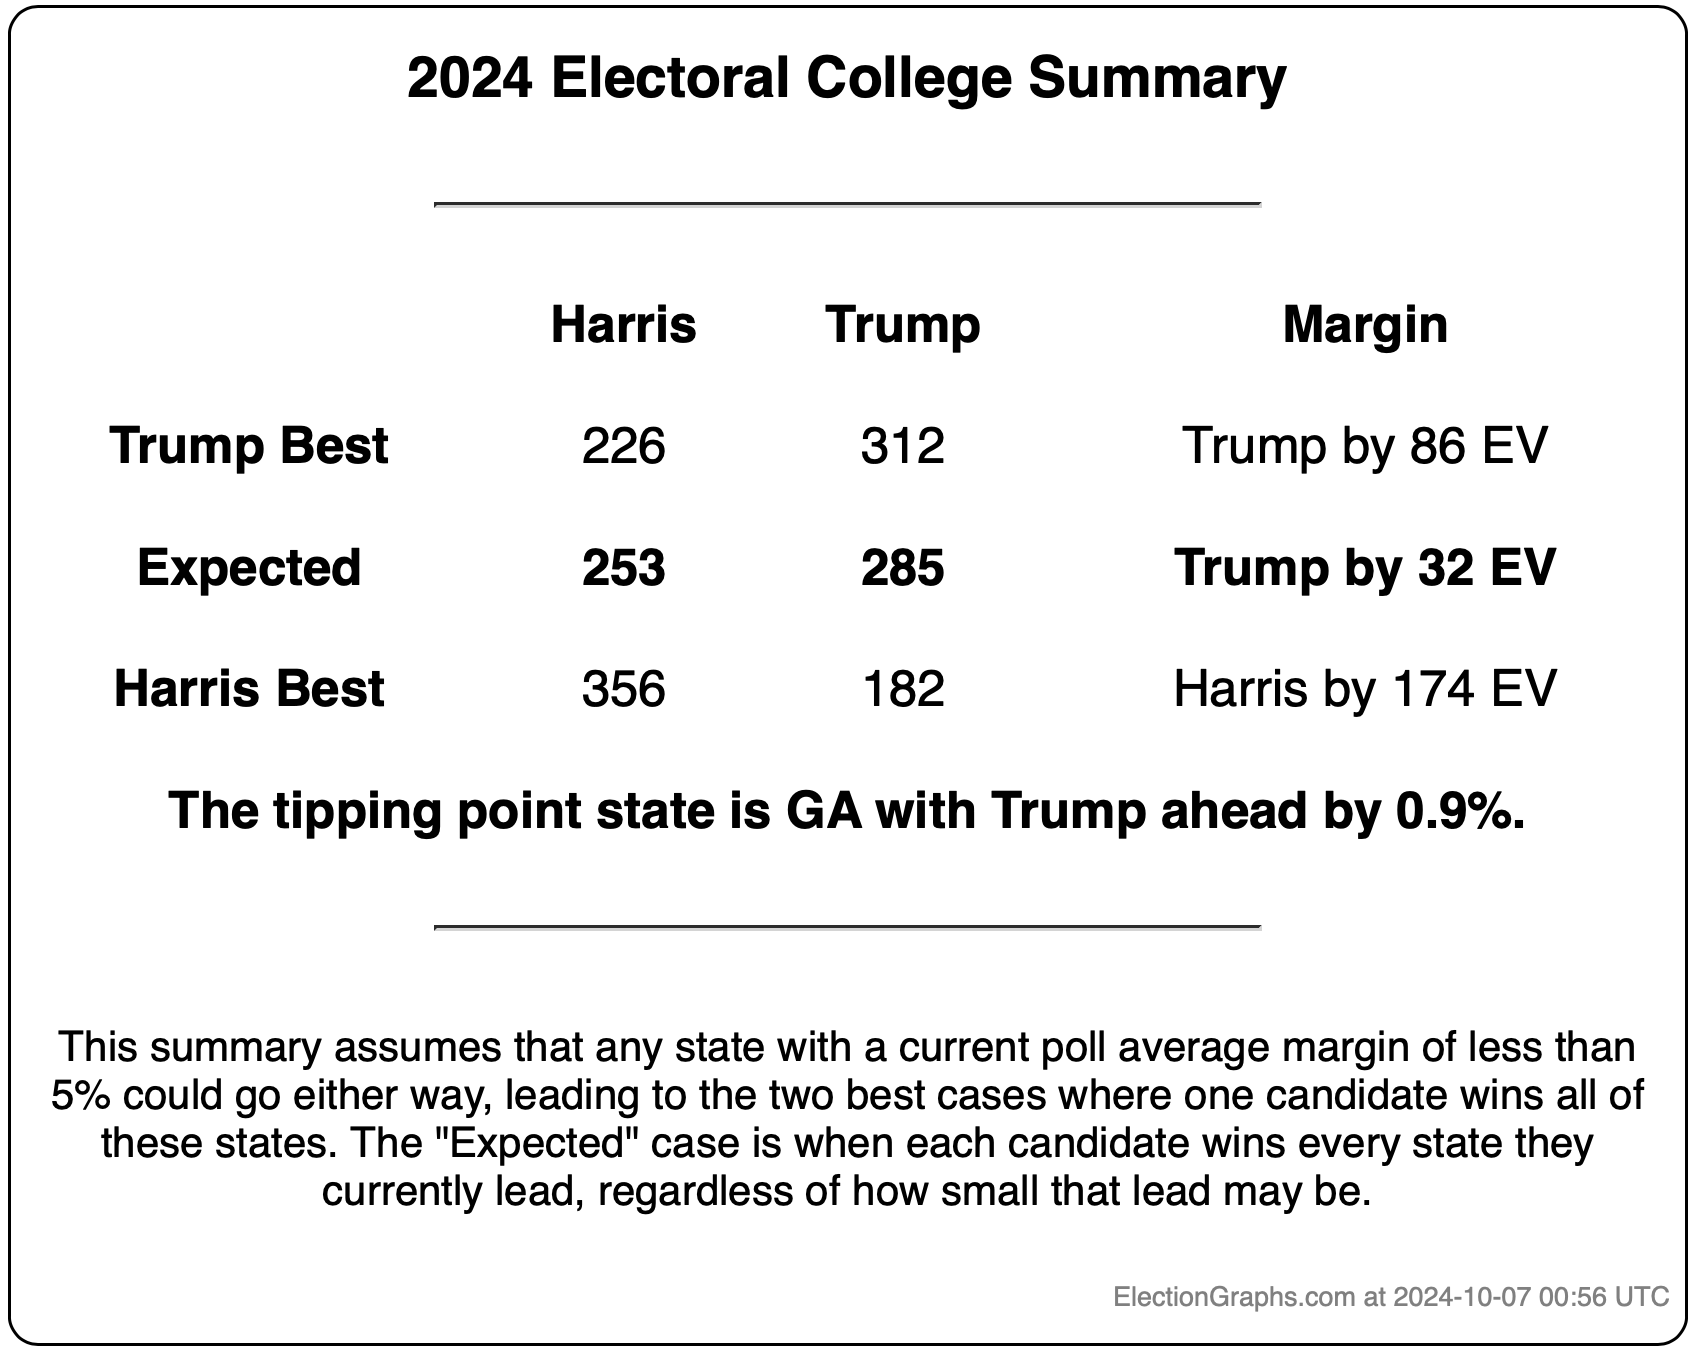
This would leave you with Harris 276 to Trump 262, a 14 electoral vote Harris win, which is a bit different than the straight up trust the averages summary currently on the site, which has Trump by 32 electoral votes:
Here is the thing though, ALL of the states reviewed above are close enough that if there is a systematic polling error favoring one side or the other, that they might not actually even be close.
Is my argument that "well, even though right now this state is on one side of the line, it has usually been on the other side and there is no clear trend, so therefore it is probably really on the other side" which I used on Arizona, Michigan, and Pennsylvania plausible? Well yes. It is plausible.
It is also plausible that the straight "trust the current poll averages" number is closer to right than the exercise I just did above. Maybe the recent moves in Arizona, Michigan, and Pennsylvania aren't just short term spikes, but represent a real change that will last.
But it would also be plausible to suppose that the poll averages are systematically underestimating Trump in all or most of the close states, much as they did in 2016 and 2020, and therefore Trump may actually be ahead in all seven of these states (and maybe Wisconsin too).
And it would also be plausible to argue that lots of pollsters are overcompensating for their misses in 2016 and 2020 (see this Nate Cohn article for one possible mechanism) and so maybe Harris is really actually leading in most or all of these states.
And of course, there is always the possibility of an "October Surprise" news event that will change things completely in the last few weeks.
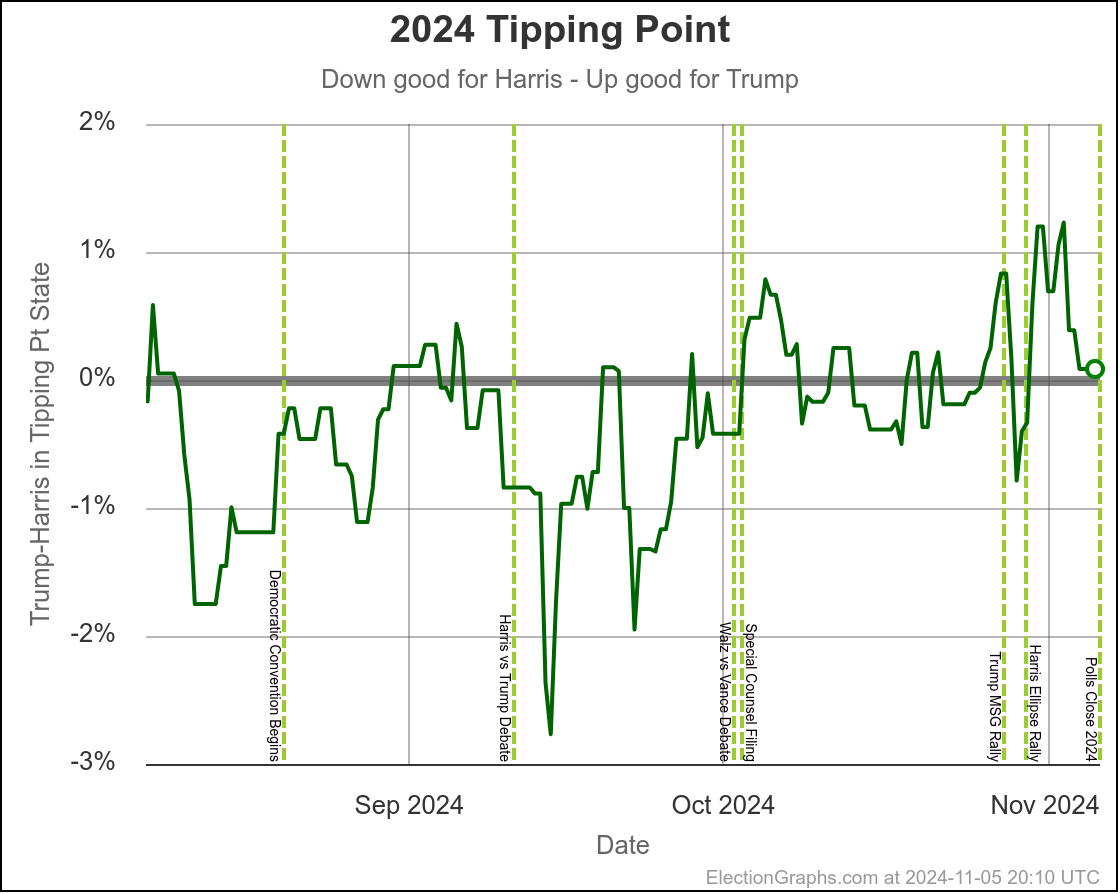
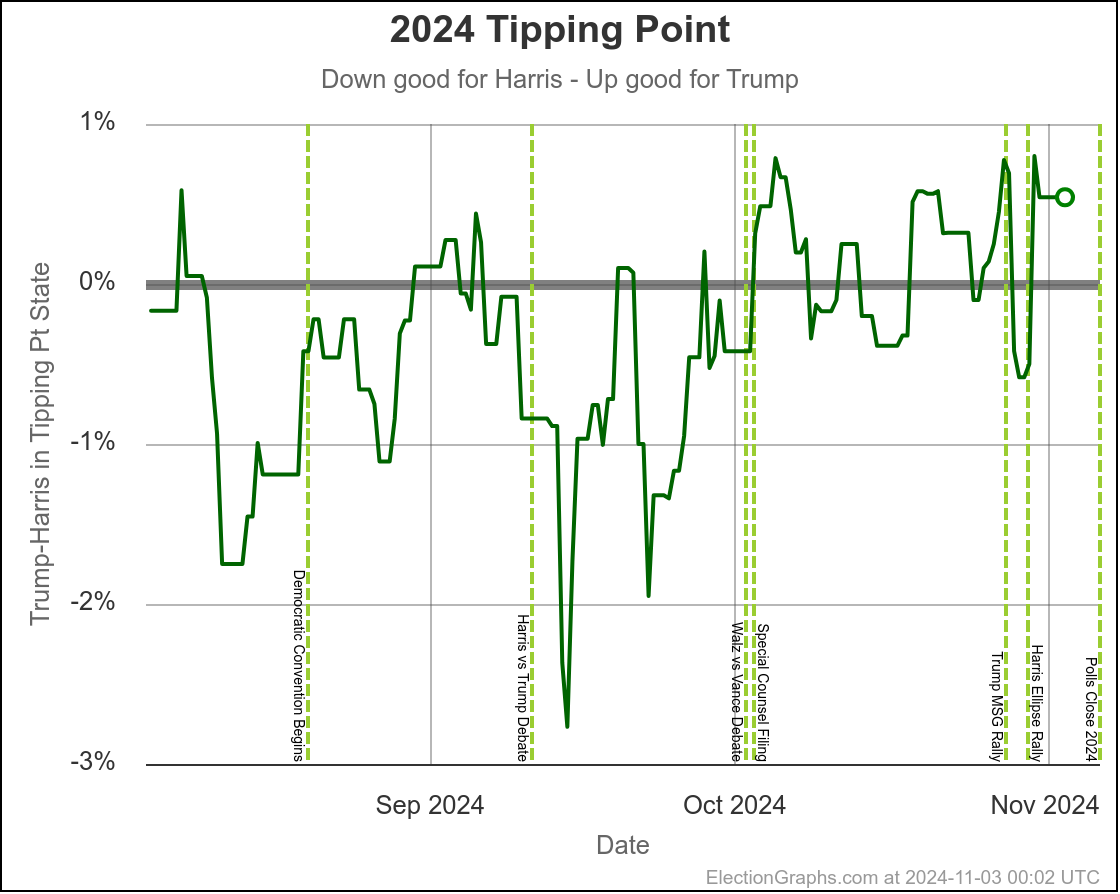
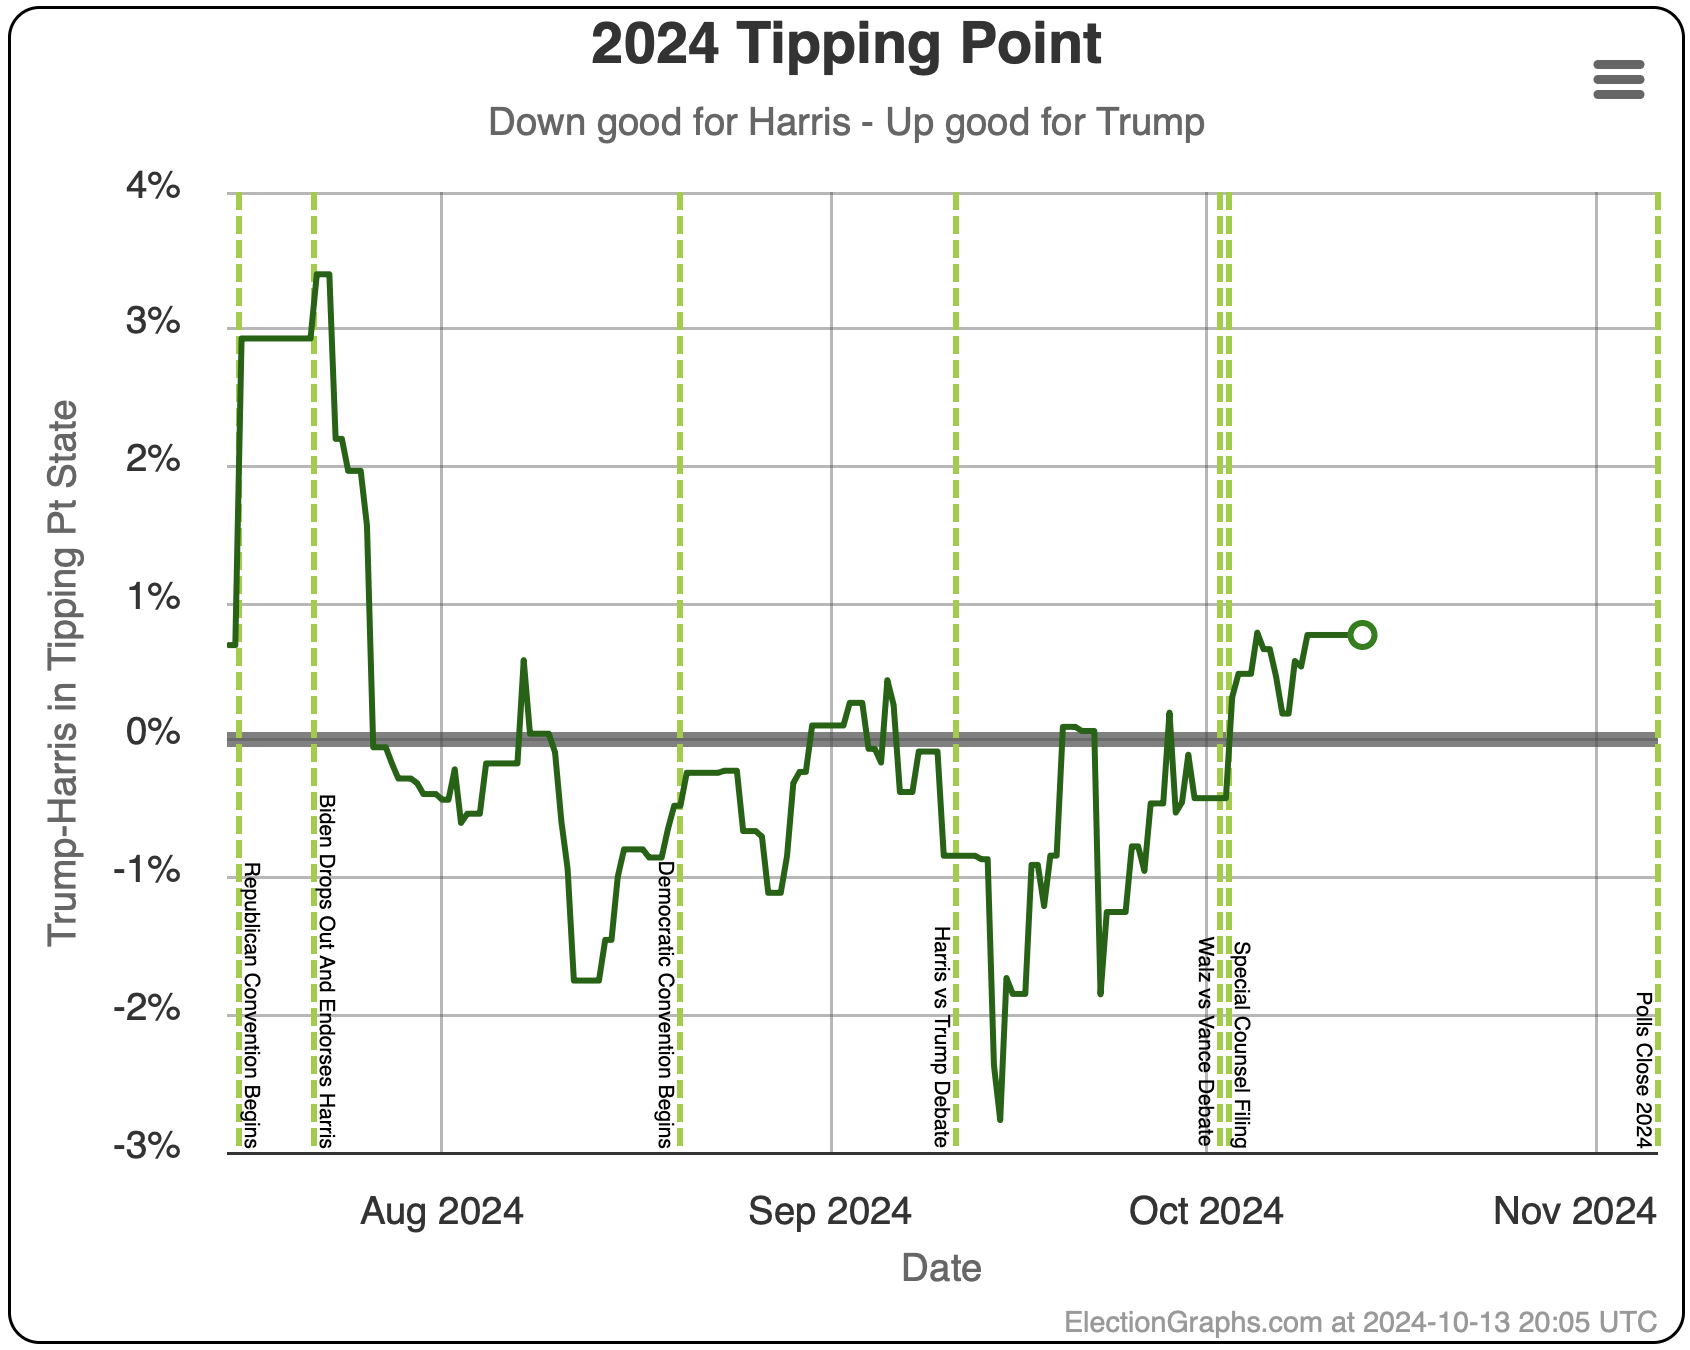
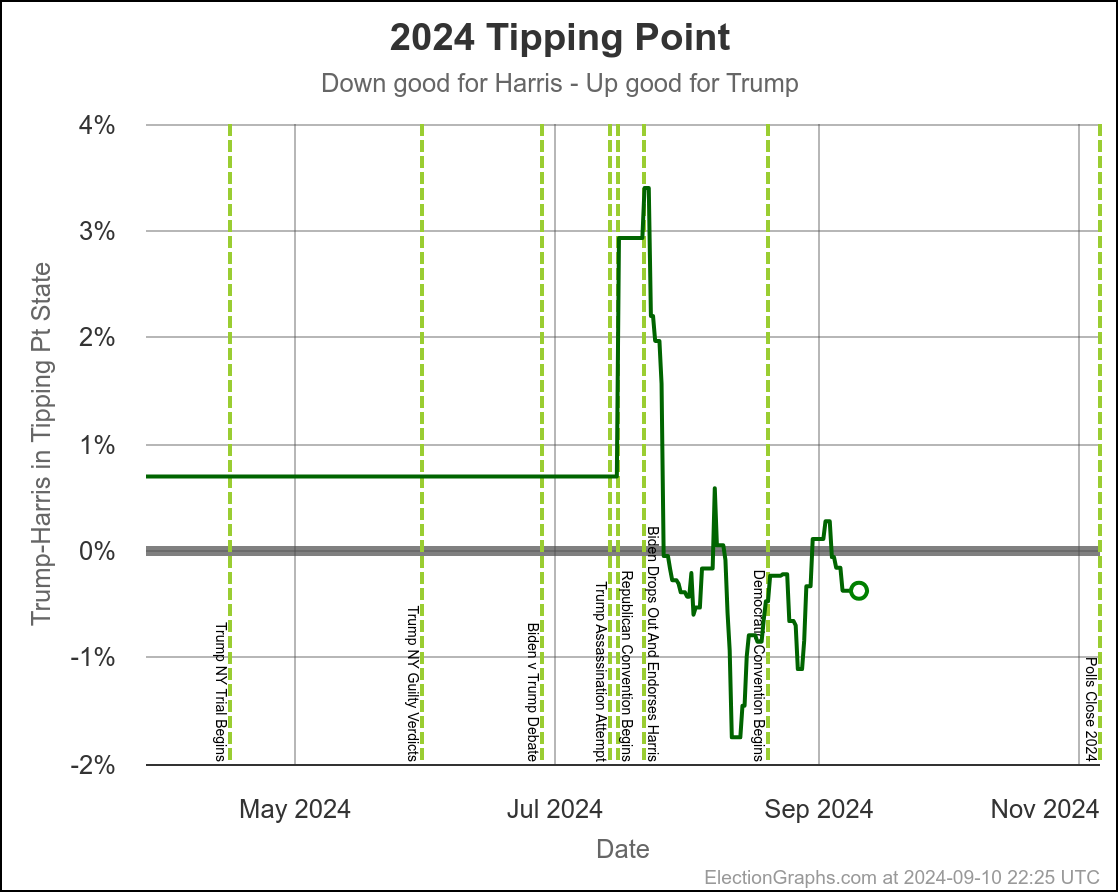
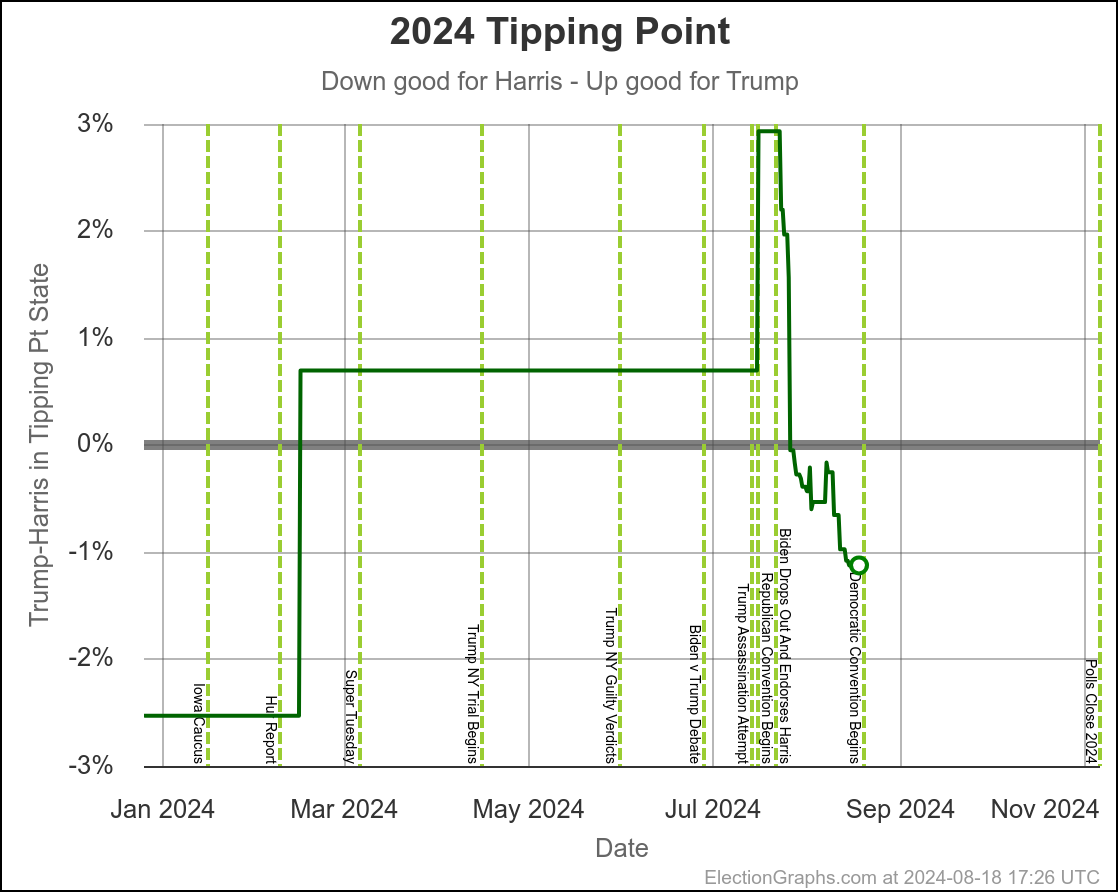
You could look at the tipping point the same way we have looked at the close states:
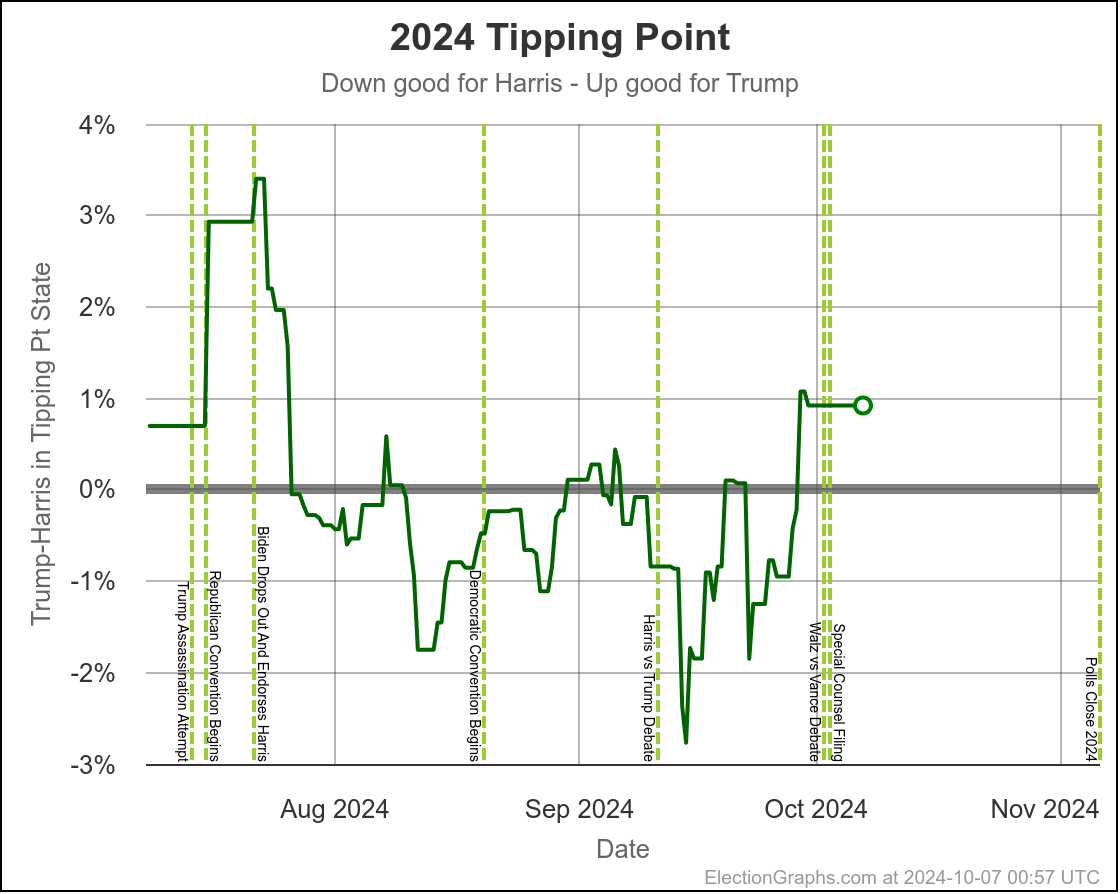
Using the same sort of logic, you'd say the tipping point has ranged from Harris by 2.8% to 1.1% over the last two months, with Trump currently ahead by 0.9%.
You'd say that this is mostly just bouncing around, and the center of attraction is probably just Harris ahead by maybe 1% or so. But you'd wonder about the recent move toward Trump, and watch the next polls in Michigan and Pennsylvania pretty closely to see if this just bounces back toward Harris.
The bottom line is we don't know. There are just too many states near the tipping point that are too close to call. To feel we could feel pretty confident about a winner, I'd want a tipping point over 5%, or at least close to 5%. But we are at a tipping point of 0.9%. So we just don't know.
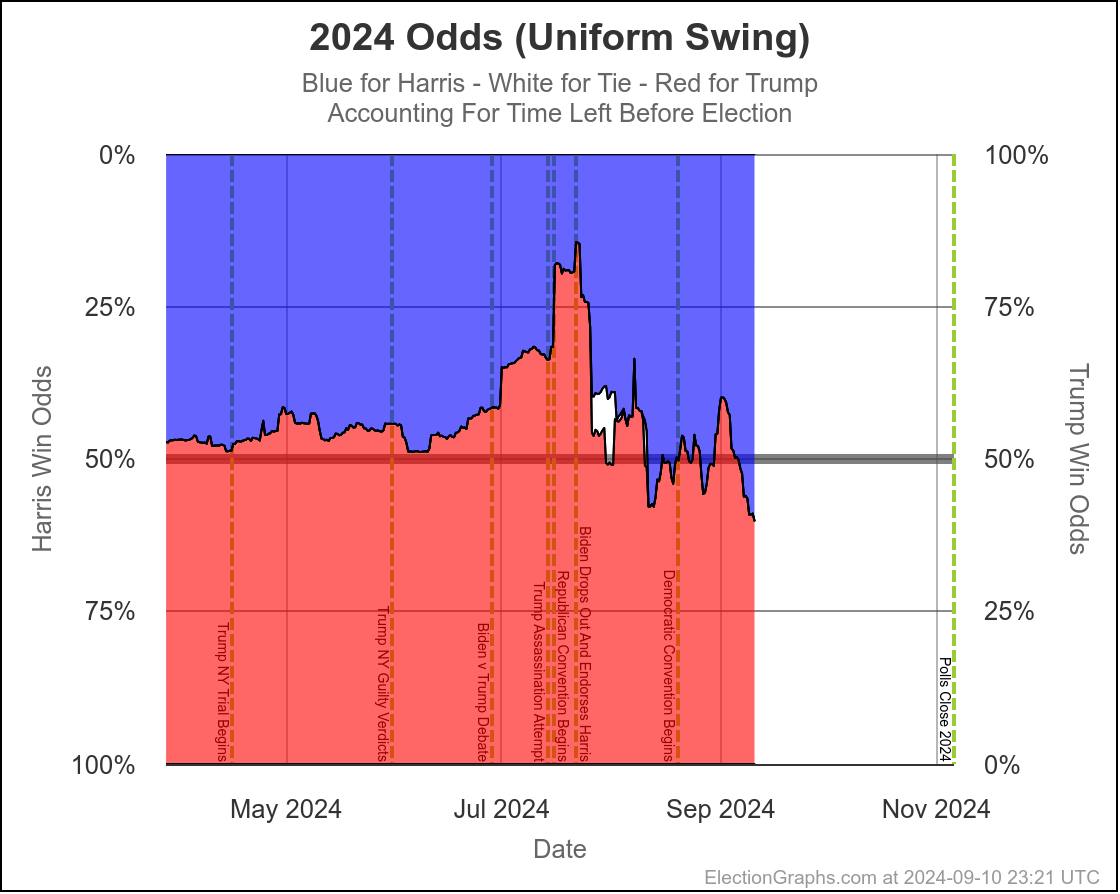
This is where the probabilistic views I do here at Election Graphs come into place. I use data from 2008 through 2020 to compare final election results in those years to my poll averages X days before the election, and in turn use that to simulate the current election with the same levels of variation that were seen historically.
Originally, I had only done "If the election was today" with these simulations. But because until Election Day, that just isn't true, earlier this year I added a view taking into account the amount of time left.
At a super high level, the more time left, the higher the chances that the person behind in a state would be able to win after all. Also, on average over the last four elections, the final election graphs average underestimated the Republican by about 1.3% in the close states. (That simplifies things, but close enough.) But with more time left, how far off the close states were was different.
With only 30 days left, the "with X days left" view and the "if the election was today" views have gotten much much closer together. Which is of course what you expect. When we get to the very end, they will match exactly, because the election WILL be today.
But at this point they are already pretty close, basically indicating that the time left for things to change dramatically is disappearing quickly, and the probabilities are starting to be dominated by how the polling error will work out, where earlier the probabilities were dominated by the chances of "things changing" in the time left before the election.
So where are we right now?
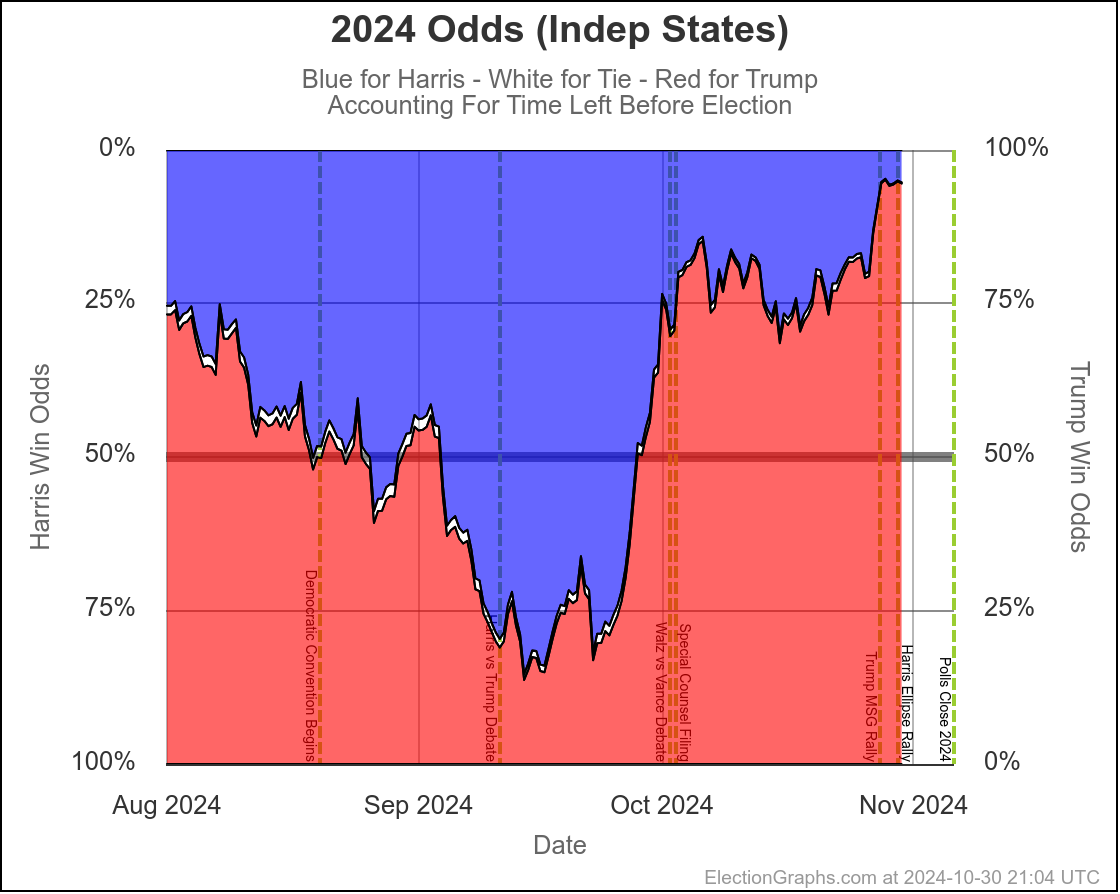
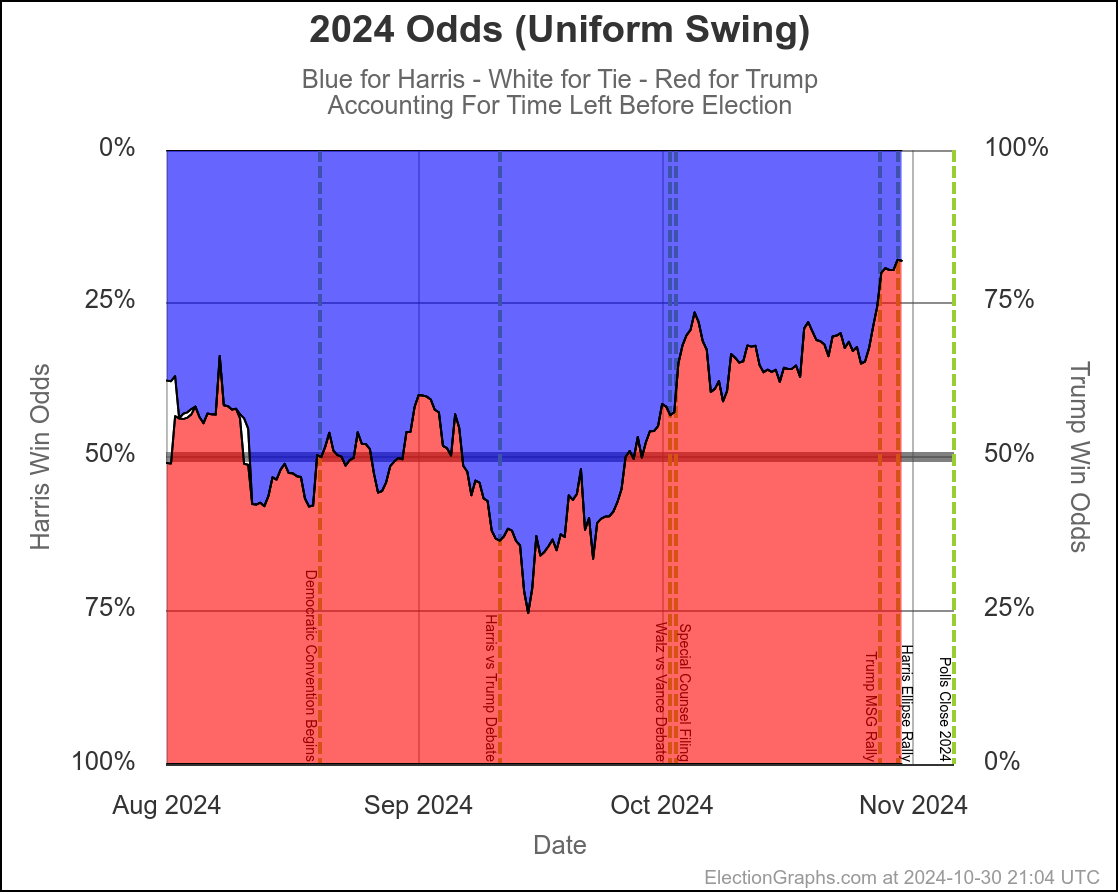
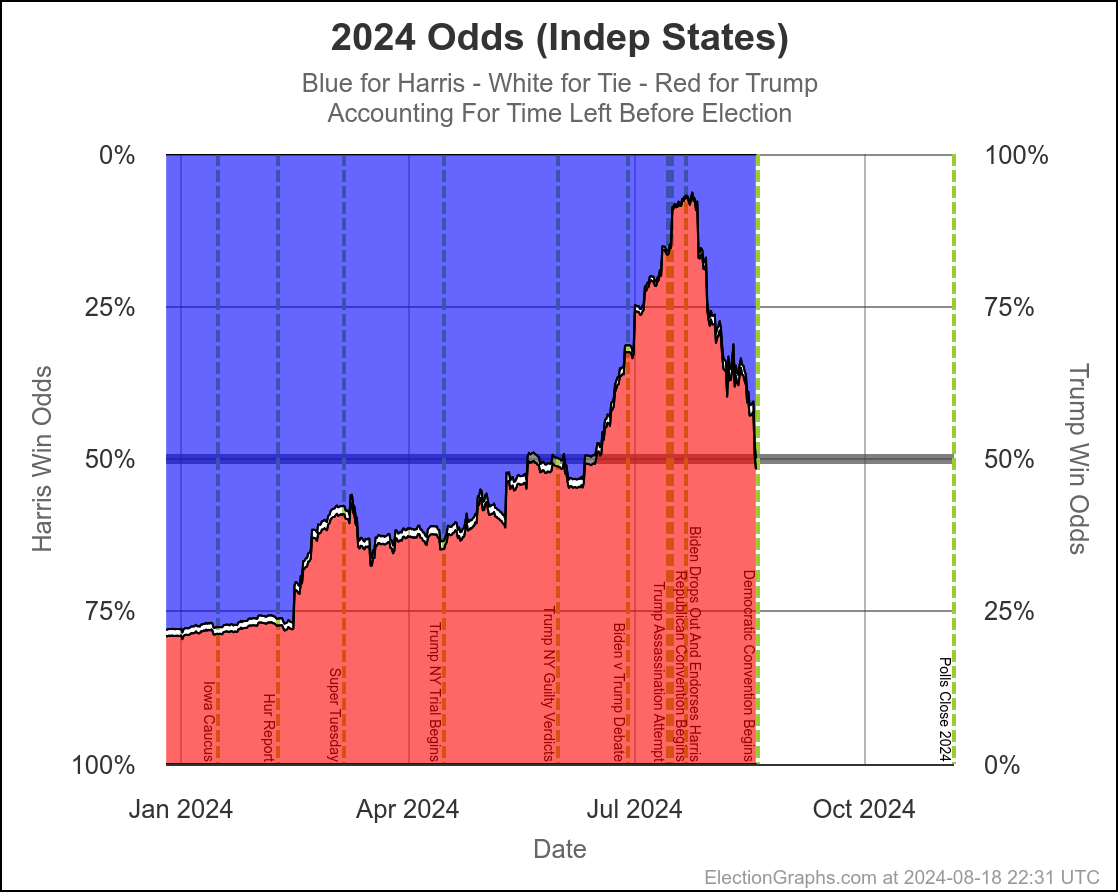
- With 30 days left:
- Harris odds between 23.5% and 30.4%
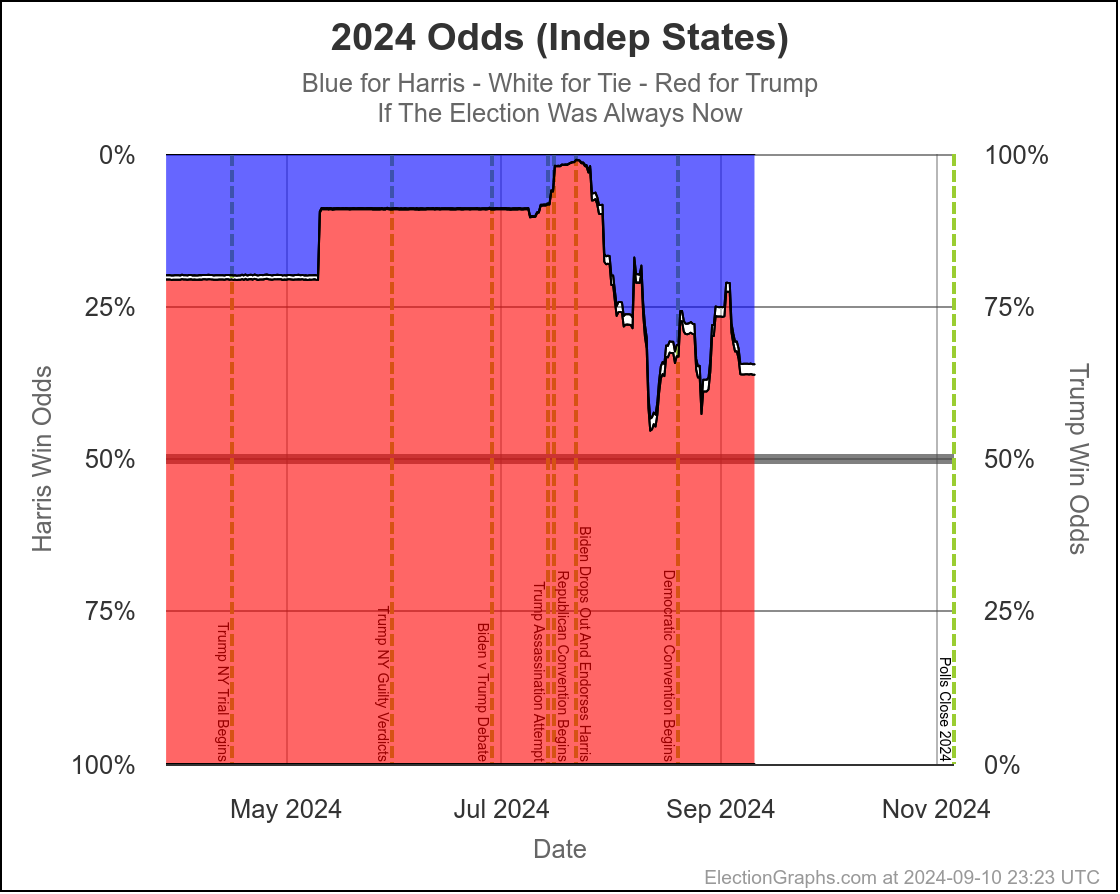
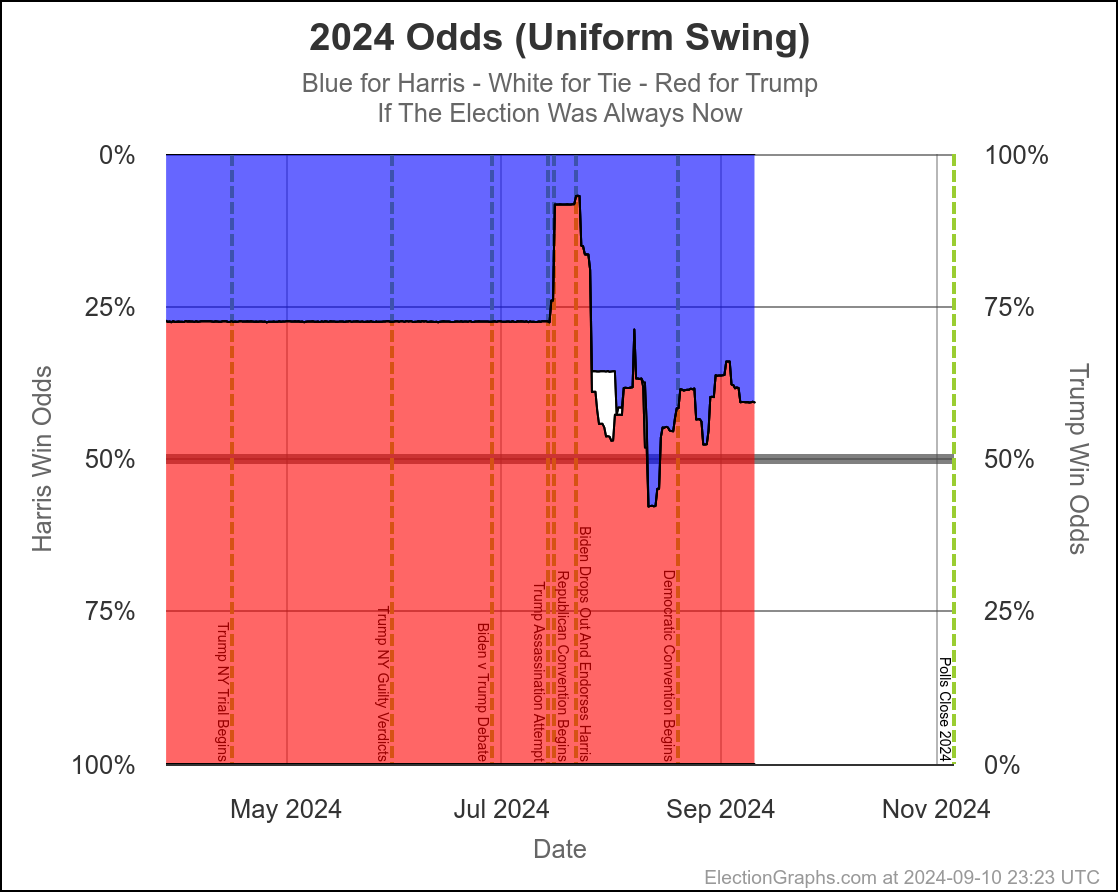
- If the election was today:
- Harris odds between 20.7% and 25.0%
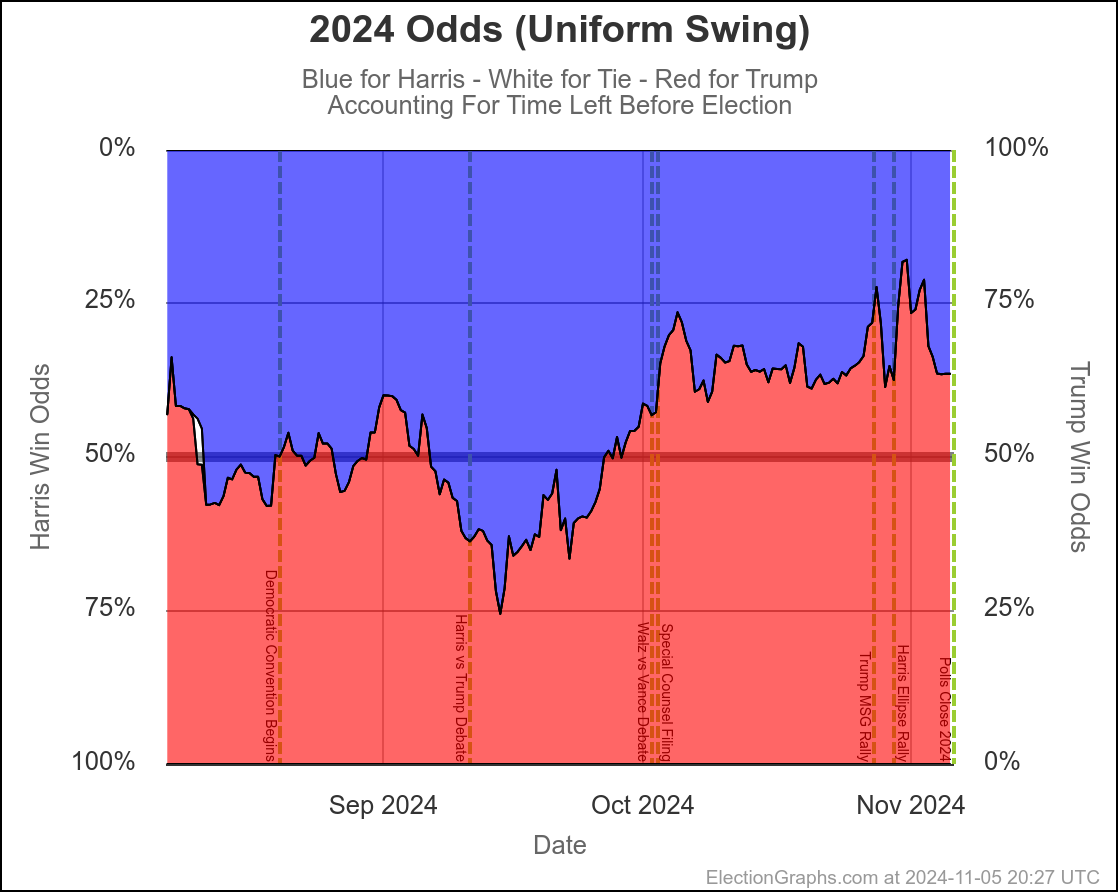
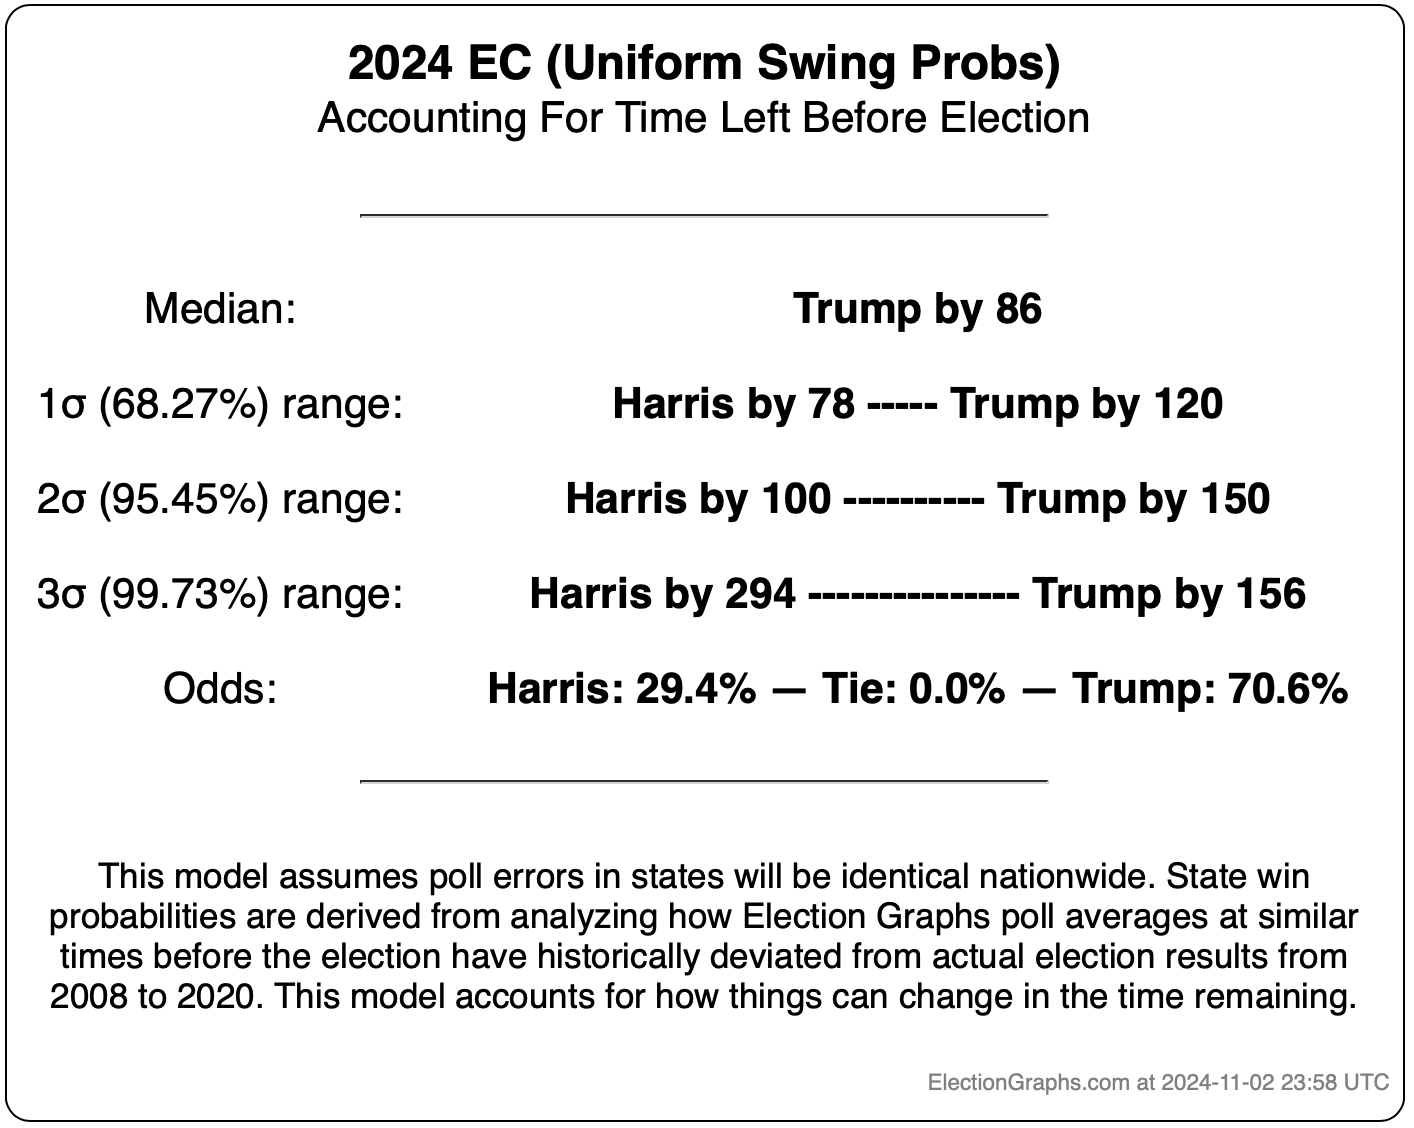
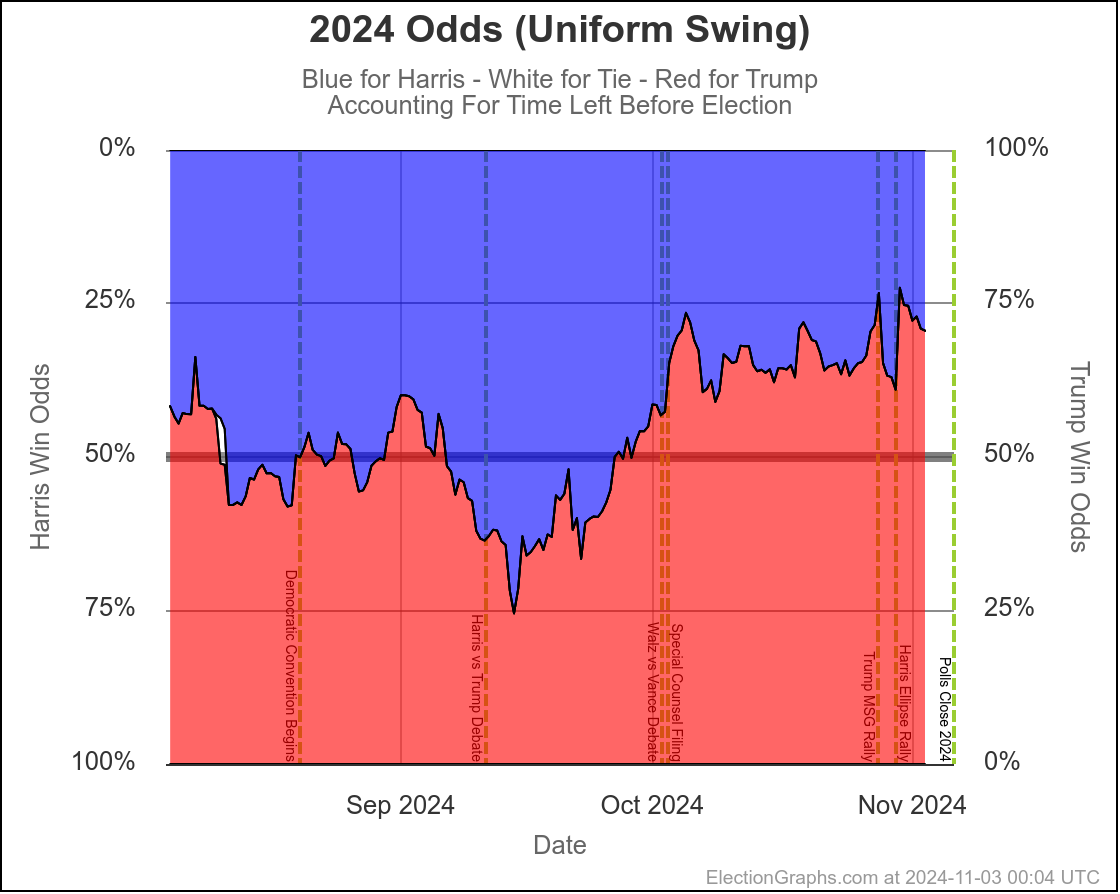
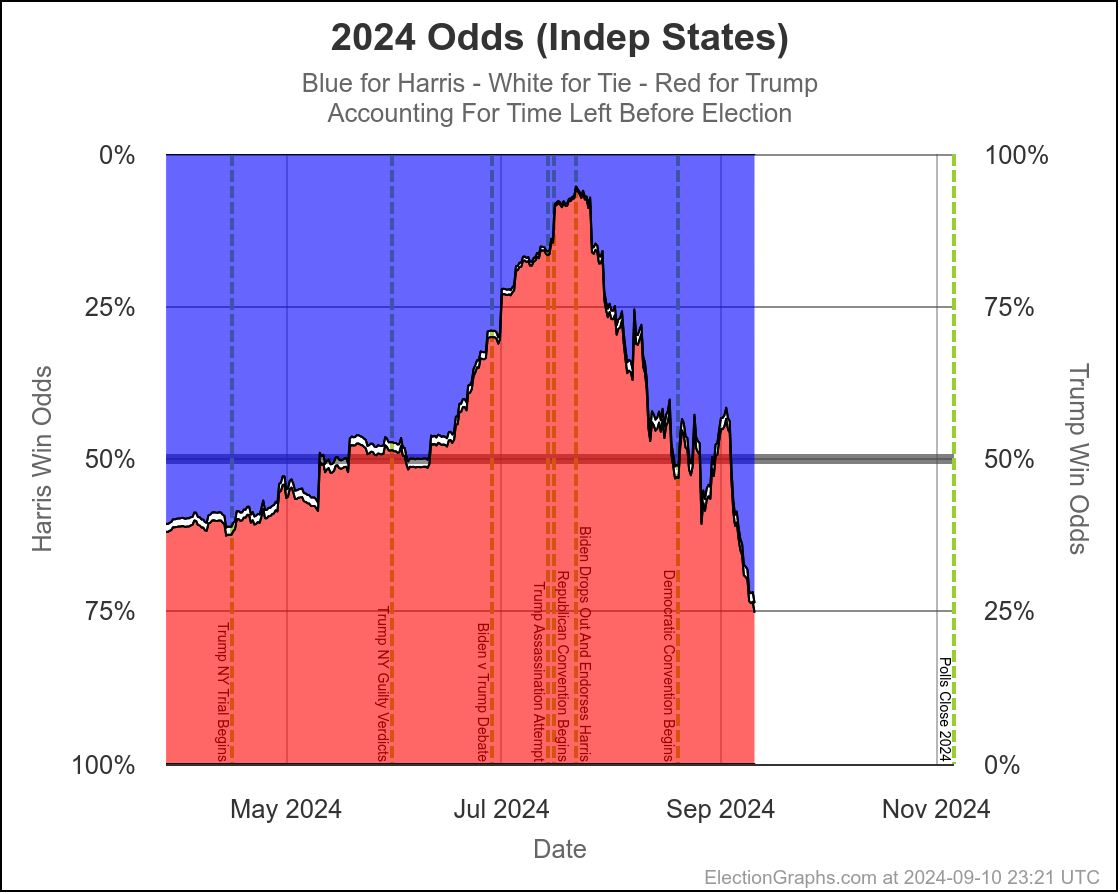
Here are the charts for the 30 days left view:
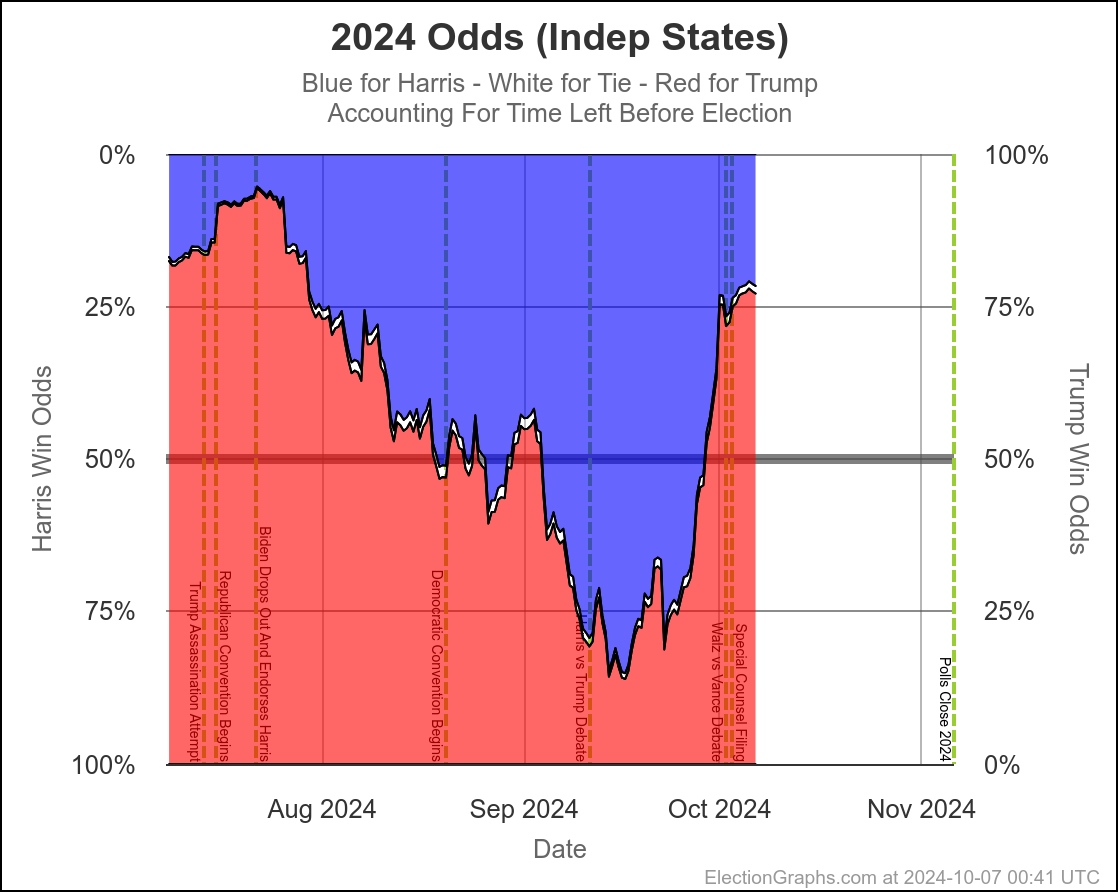
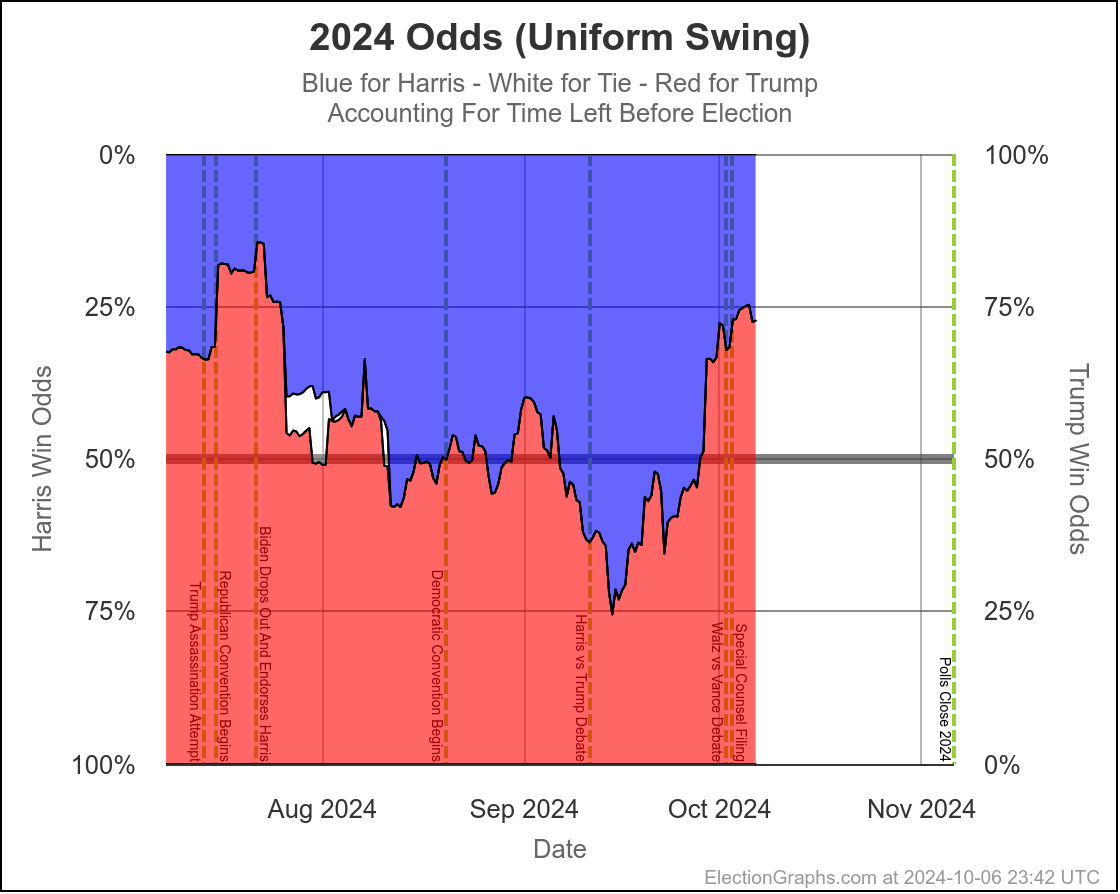
So wait, what's the deal here? Didn't I spend most of the first part of the post describing the race as a toss up where there was a decent chance either side could win by a decent margin?
Well yes. Yes I did. And this is NOT inconsistent with that. I also said that currently it would be a tossup with Trump favored. And this is exactly what this shows.
Rounding to big fractions, at the moment we're talking Trump favored over Harris by roughly 75/25. This is still a "toss up". We're not talking about a world where the underdog has a 1% chance, or a 0.1% chance or something else that is essentially miniscule. 25% can happen easily. There are many different scenarios you can imagine that get you to the person with a 25% chance winning.
I often use 2016 as an example here. Election Graphs did not have a probabilistic view in 2016, but the median of sites I could find that did have probabilities gave Trump a 14% chance of winning. And he won. That was a long shot underdog win, and it still happened.
A 25% chance is a much bigger chance than that, and is very possible. I still consider that in the toss up zone, although admittedly on the edge of it.
This is lower than the big guys have Harris at this point. Here is a sampler:
So why do I have it so much lower? It really comes down to the following:
- The Election Graphs odds are based on how far off the EG polling averages were from 2008 to 2020. On average over these four cycles, in close states the polls underestimated the Republican by 1.3%. So we essentially (again a simplification) don't give the Democrat a 50/50 shot at winning a state unless they are ahead by at least 1.3%. So we are essentially assuming the pols are going to underestimate the Republican, meaning that a small Trump lead has a bigger impact on the odds than you might think otherwise.
- At this exact moment, the last week or two so has been full of polling showing Trump ahead in key states. One week ago, we had Harris odds between 53.4% and 57.5%. The dip in the last week is very specifically due to these recent polls moving the tipping point from Harris ahead by 1.2% to Trump ahead by 0.9%. If the next set of polls pops averages back in Harris's direction, the odds will go back up quite a bit. With things so close, a move of 1% or 2% has a huge impact on the odds.
- My polling averages are intentionally designed to be much more reactive to short term changes as polls get more frequent as the election gets closer. The "big guys" average over longer time periods, and so are less reactive to each individual poll. On the one hand, this makes EG susceptible to false movements due to outliers. On the other, it let us catch the last minute swing toward Trump in 2016 that many others did not.
- If this last week of polls are actually the start of a new trend, then my numbers are just a leading indicator, and the others will follow as more polls come in. If they are just outliers, my numbers will revert to the mean as the next few polls come in.
My argument when I went through the 7 key states was essentially that Arizona, Michigan, and Pennsylvania are probably just being pushed around by outliers right now and will revert to the mean, probably bringing the EG probabilistic numbers back closer to 50/50 as more polls come in.
Of course that is just a gut feel. An educated guess looking at the long term trends and also at which pollsters are currently included in the averages. Maybe the next polls will confirm the recent move toward Trump instead.
We will know soon enough.
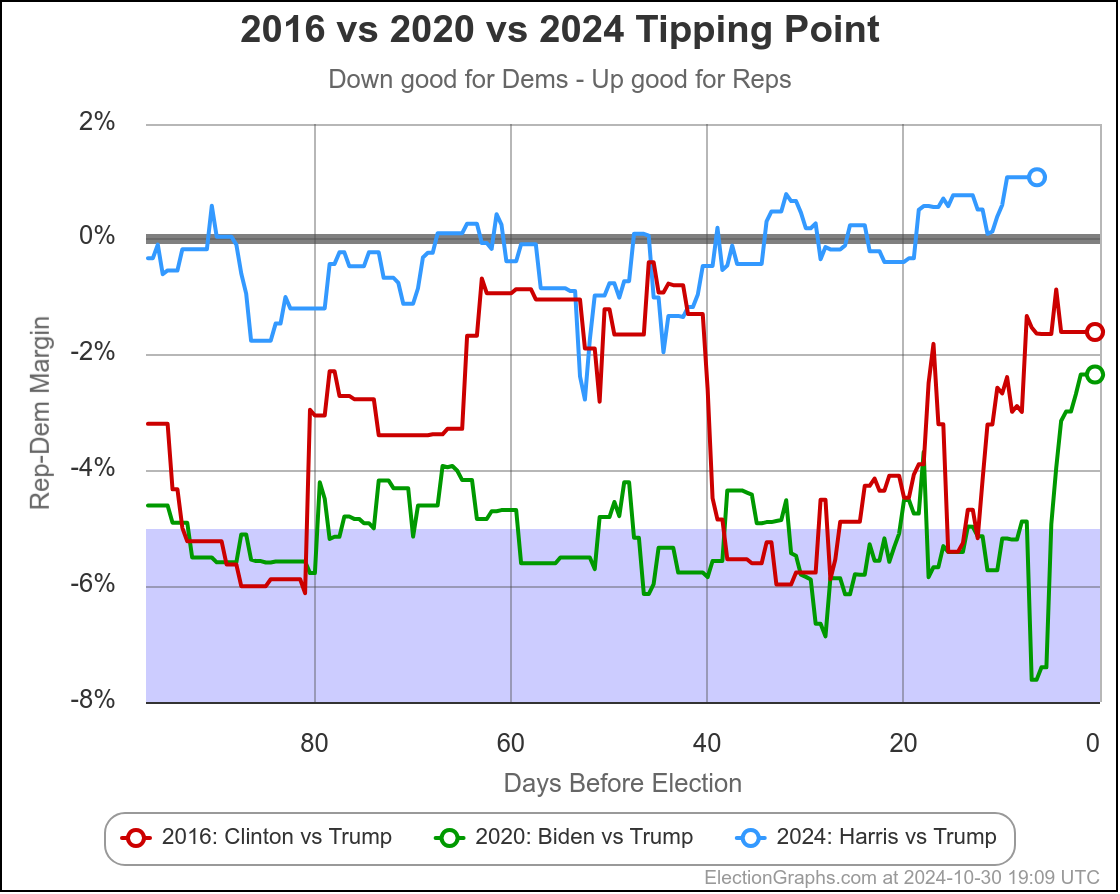
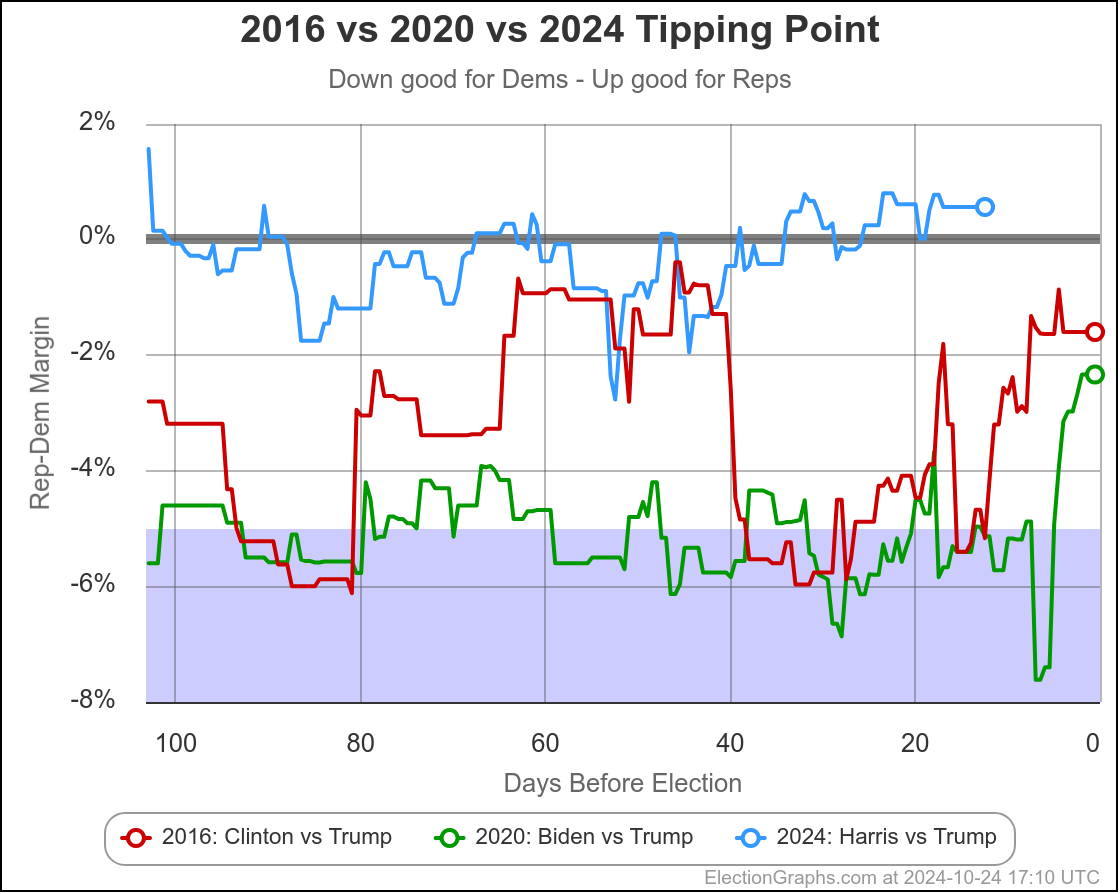
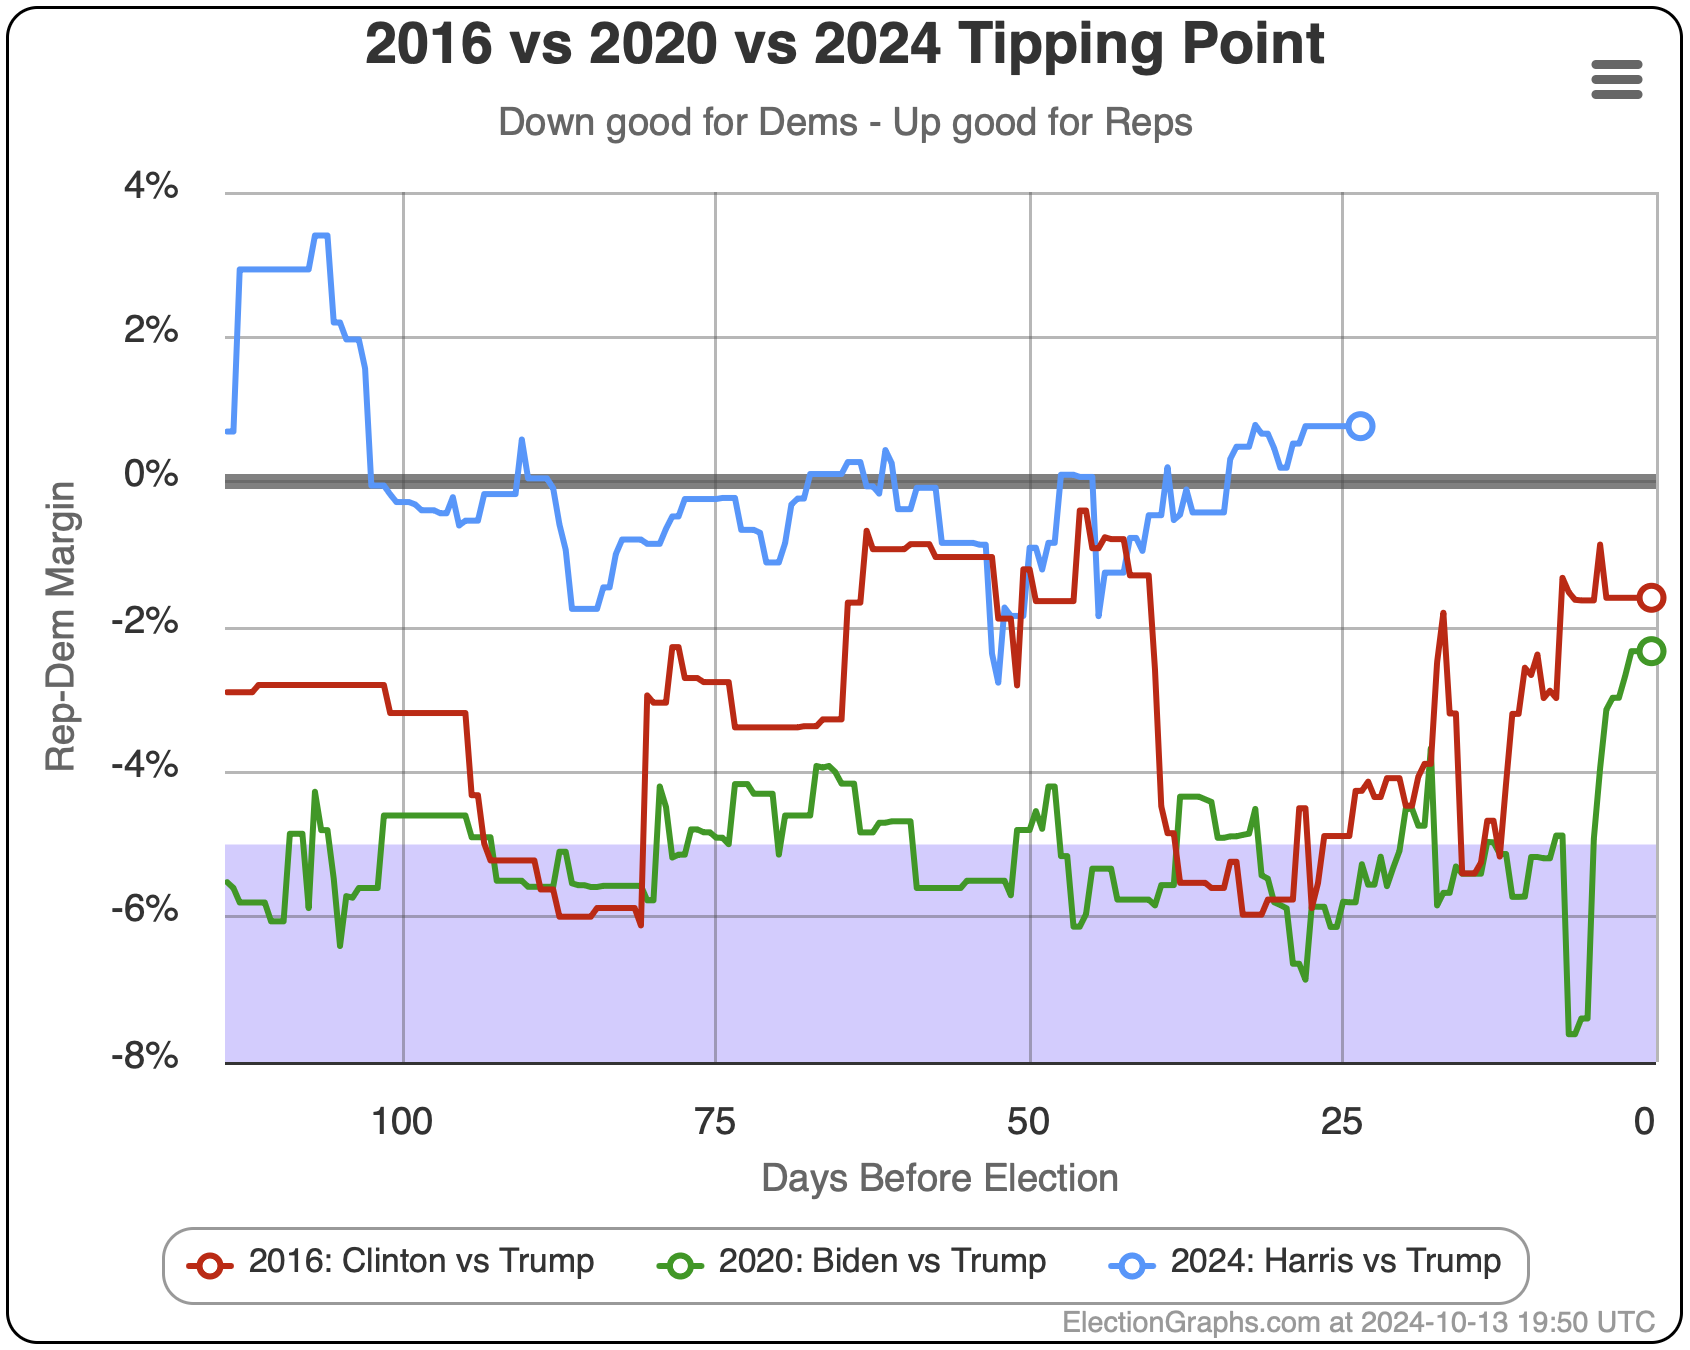
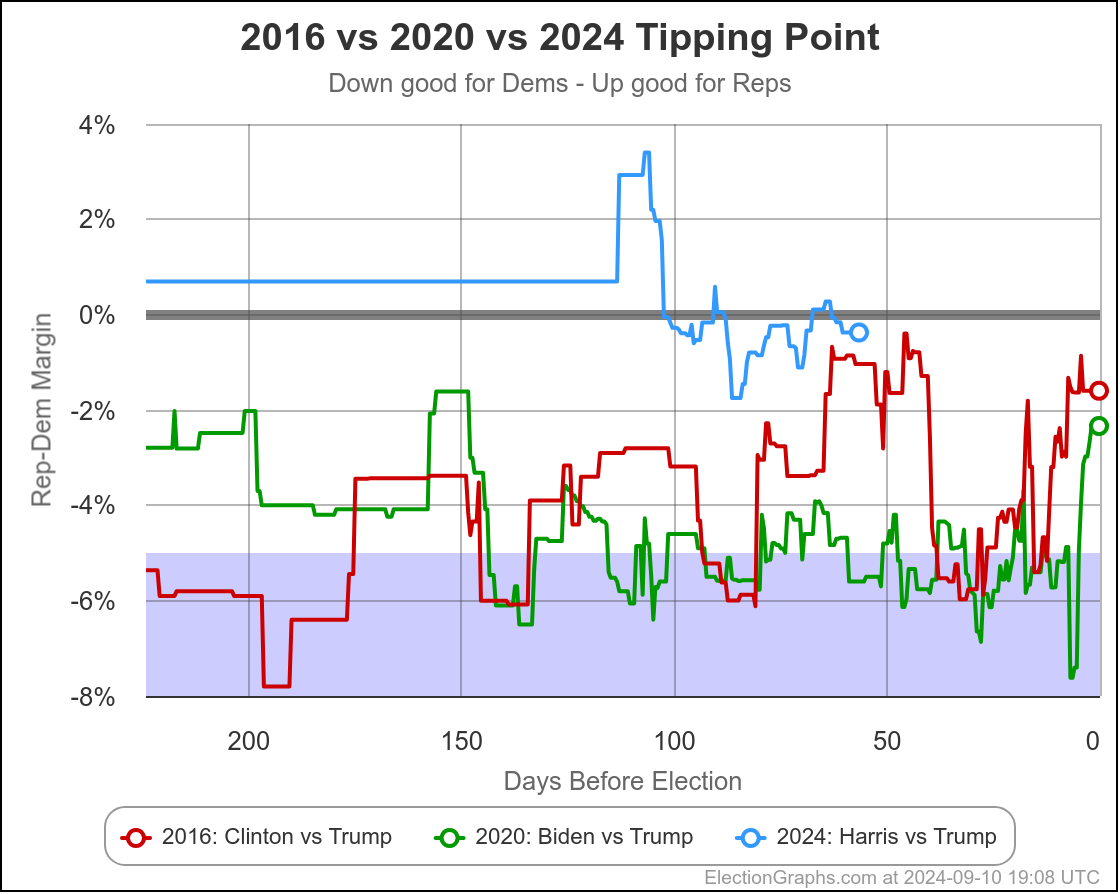
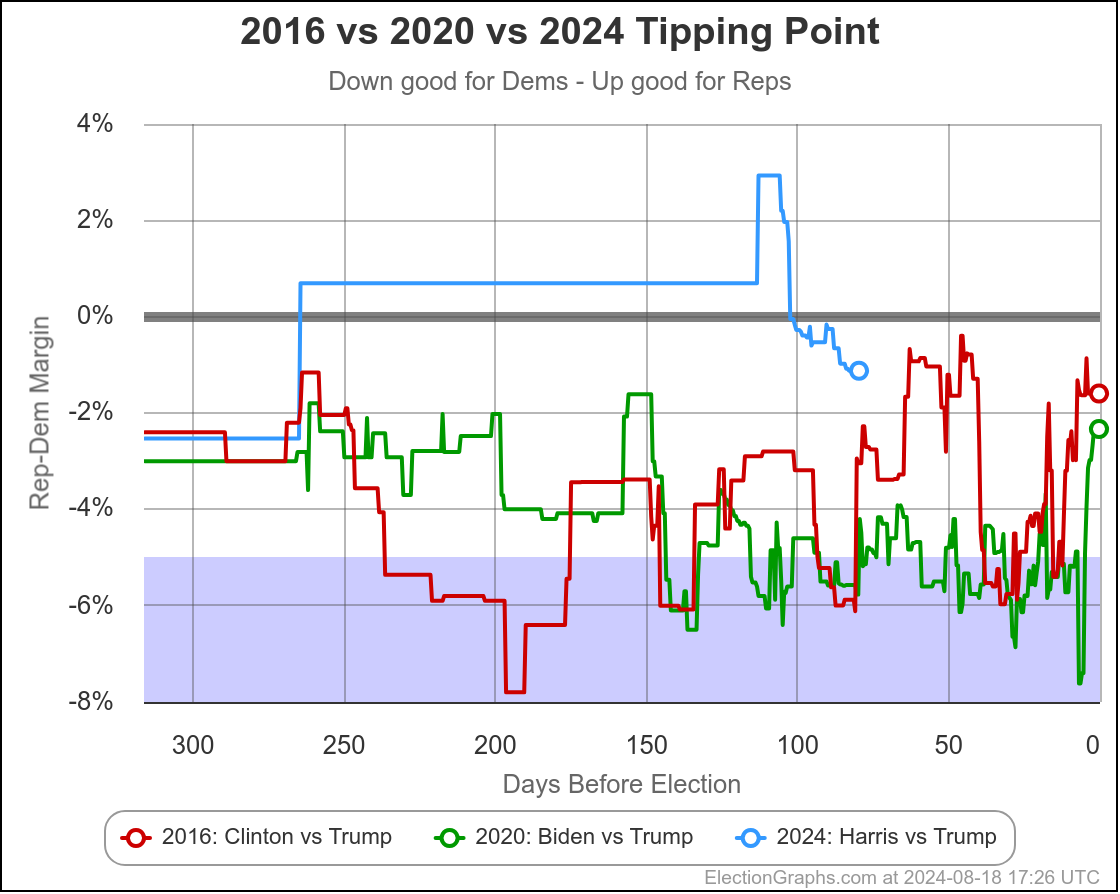
The first bullet above… the direction of historical polling errors, can also be shown by this chart:
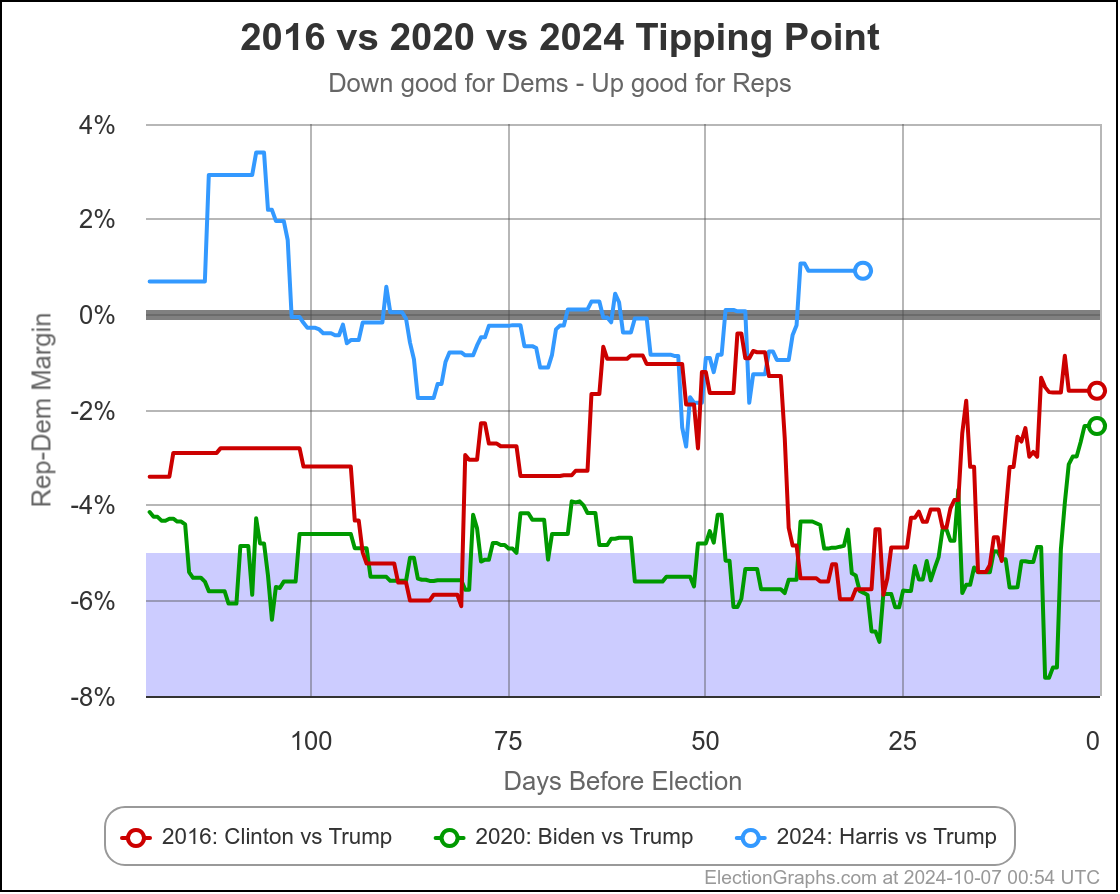
This only shows 2016 and 2020, not the previous elections, but it shows very clearly how much better Trump is doing in the state polling in 2024 than he did in 2020 when he lost, but also how much better he is doing than in 2016 when he won.
Almost the entire time, Trump has been polling better in 2024 than he did not only in 2020, but than he did in 2016, when he won.
Given that context, 25% odds for Harris don't seem that unreasonable. For a Harris win, we either need a big move in the next few weeks, or for the polling error to be in the opposite direction than it has been the last couple cycles.
Now, there are a variety of good reasons to think the polling error might indeed be the opposite direction this time. But we won't really know until after the election.
And this comes to another point. The fact that all the averages and the tipping point are close does not necessarily mean the actual election will be close. It might be. But it also might not be.
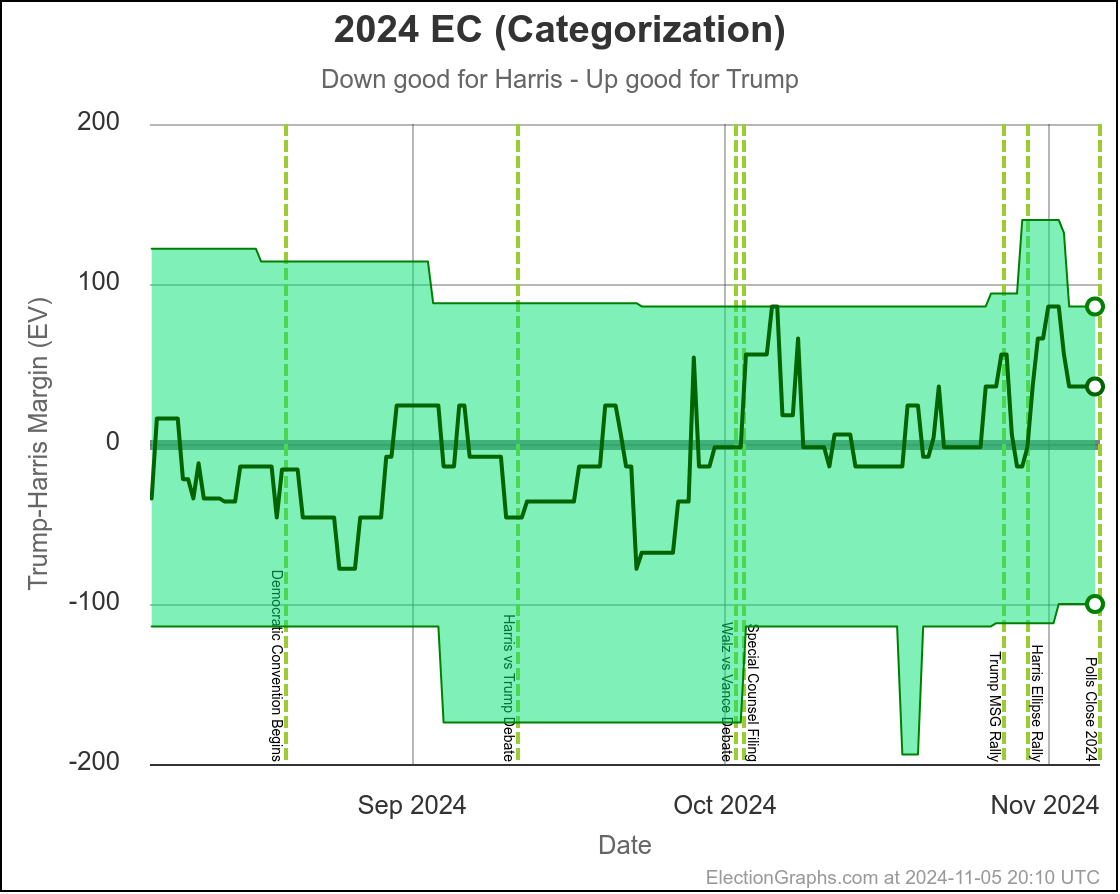
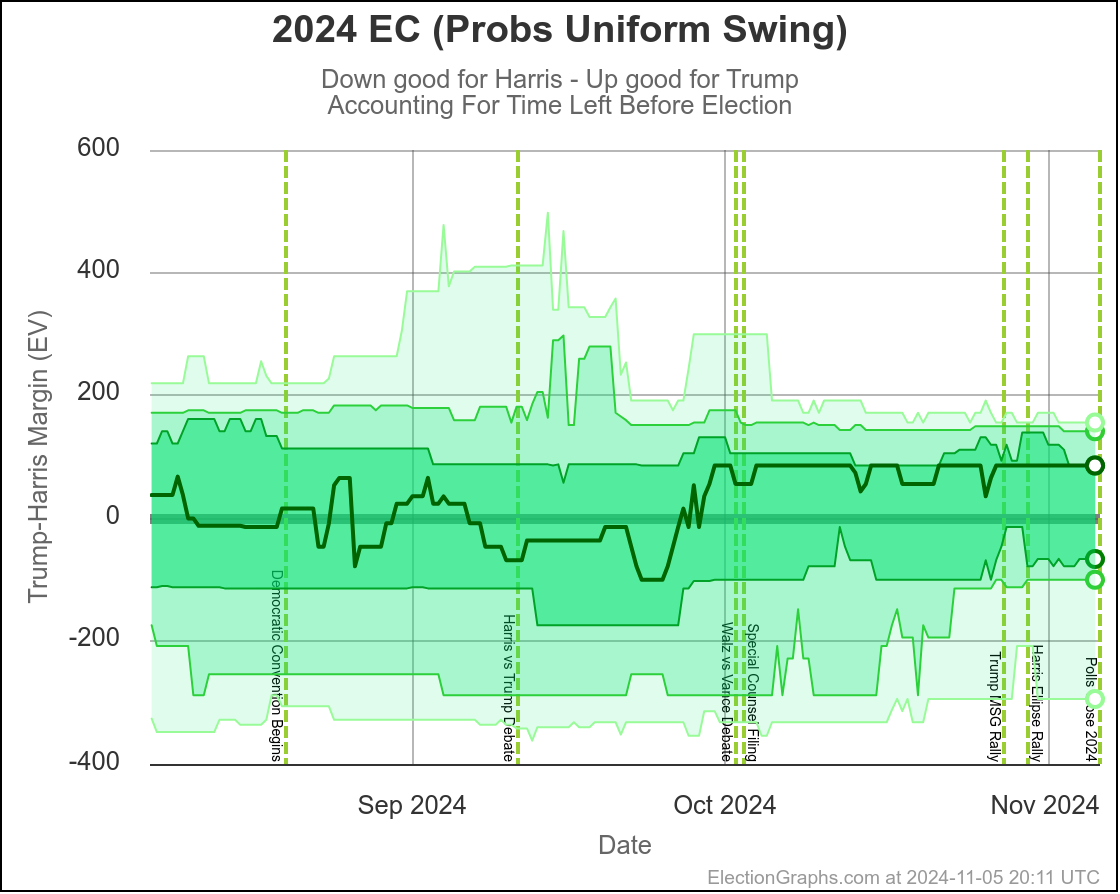
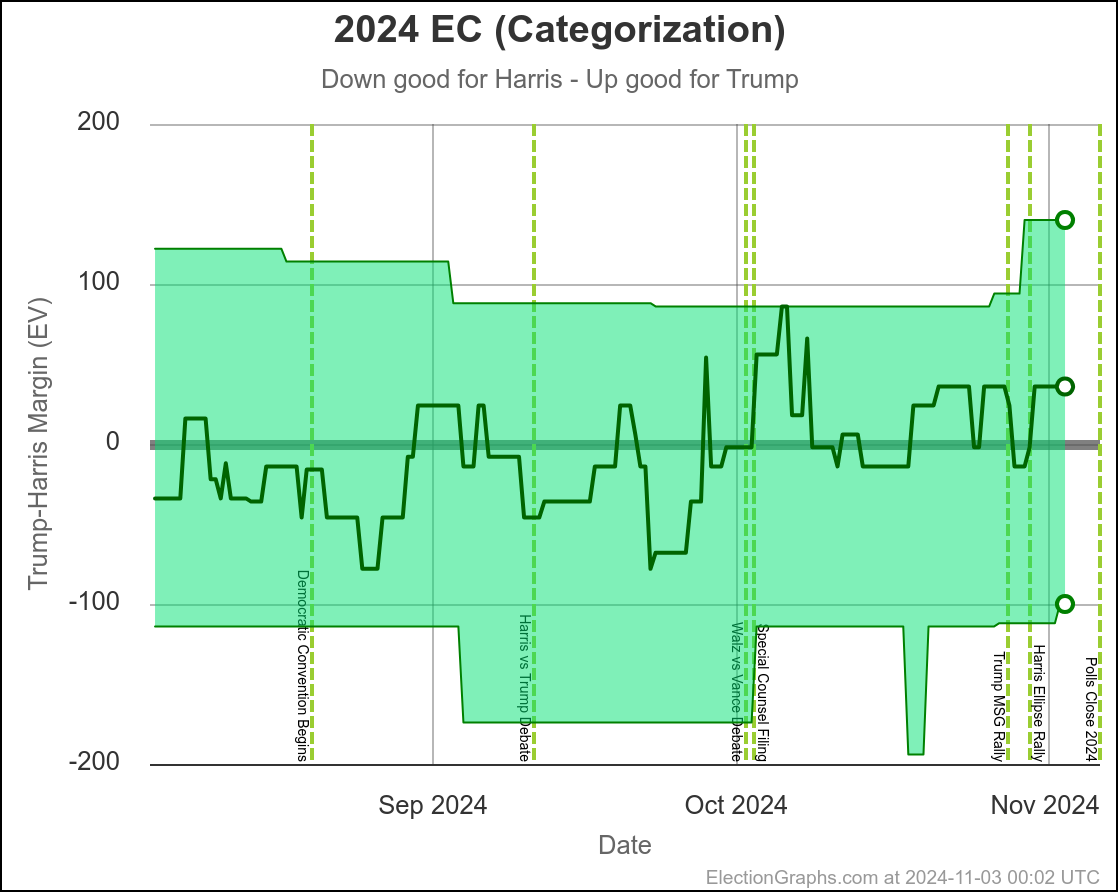
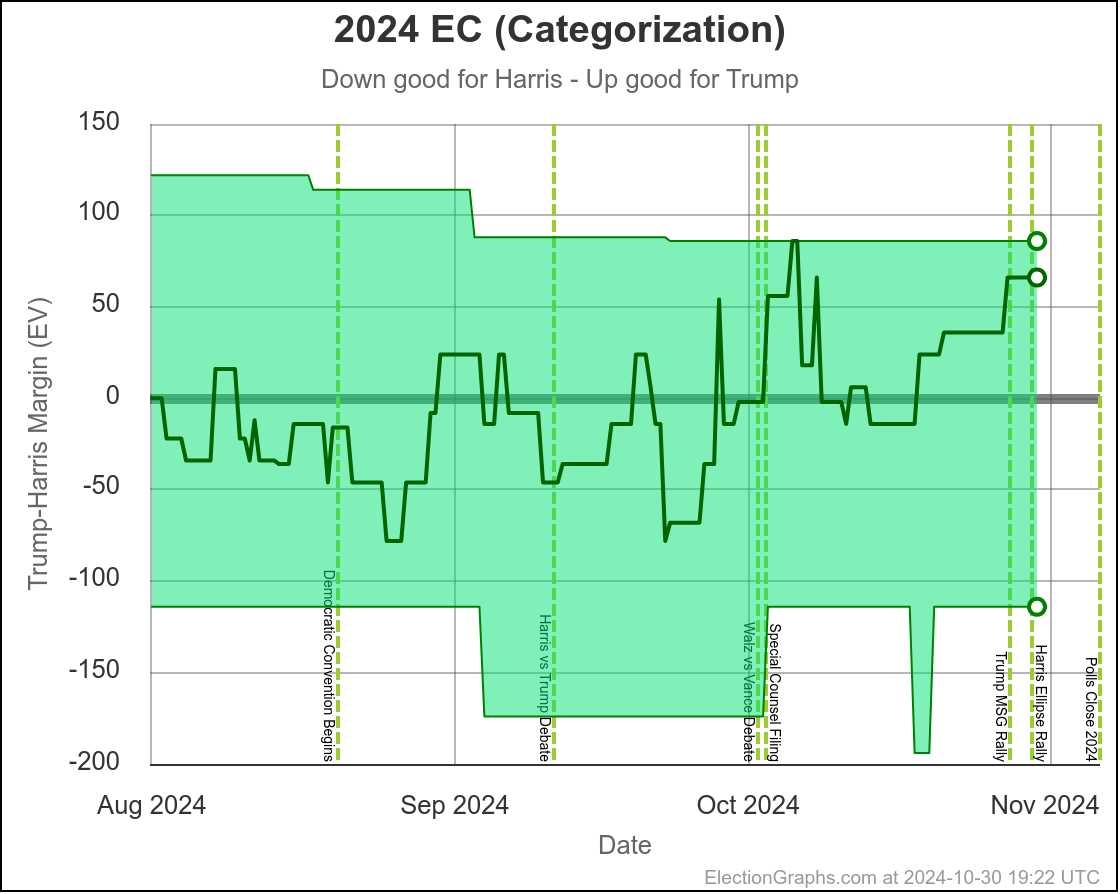
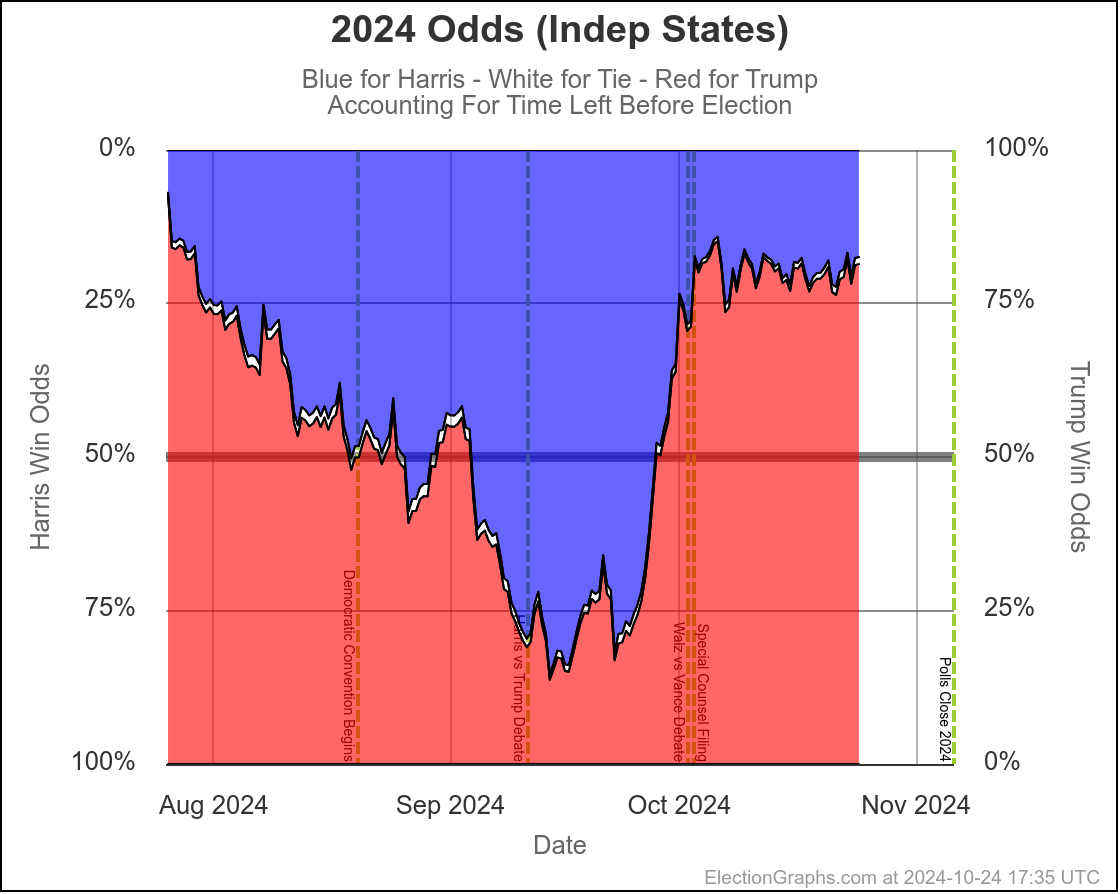
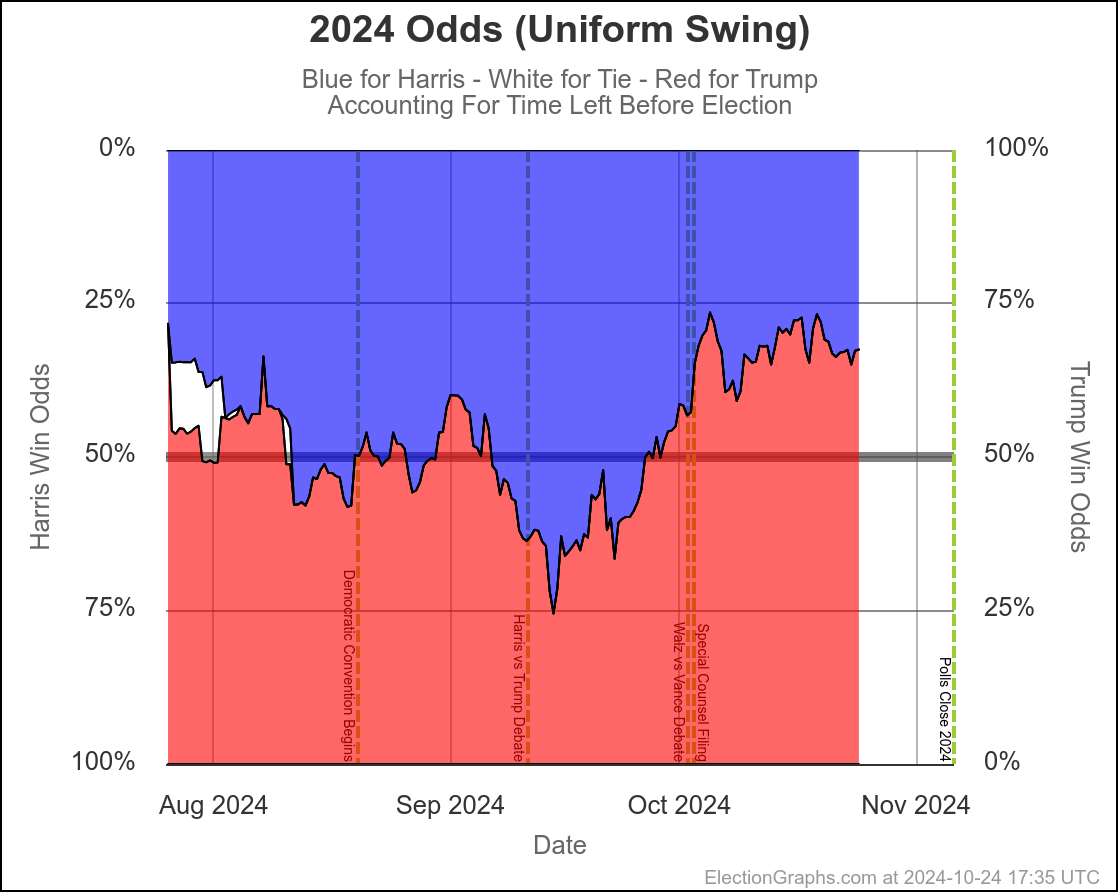
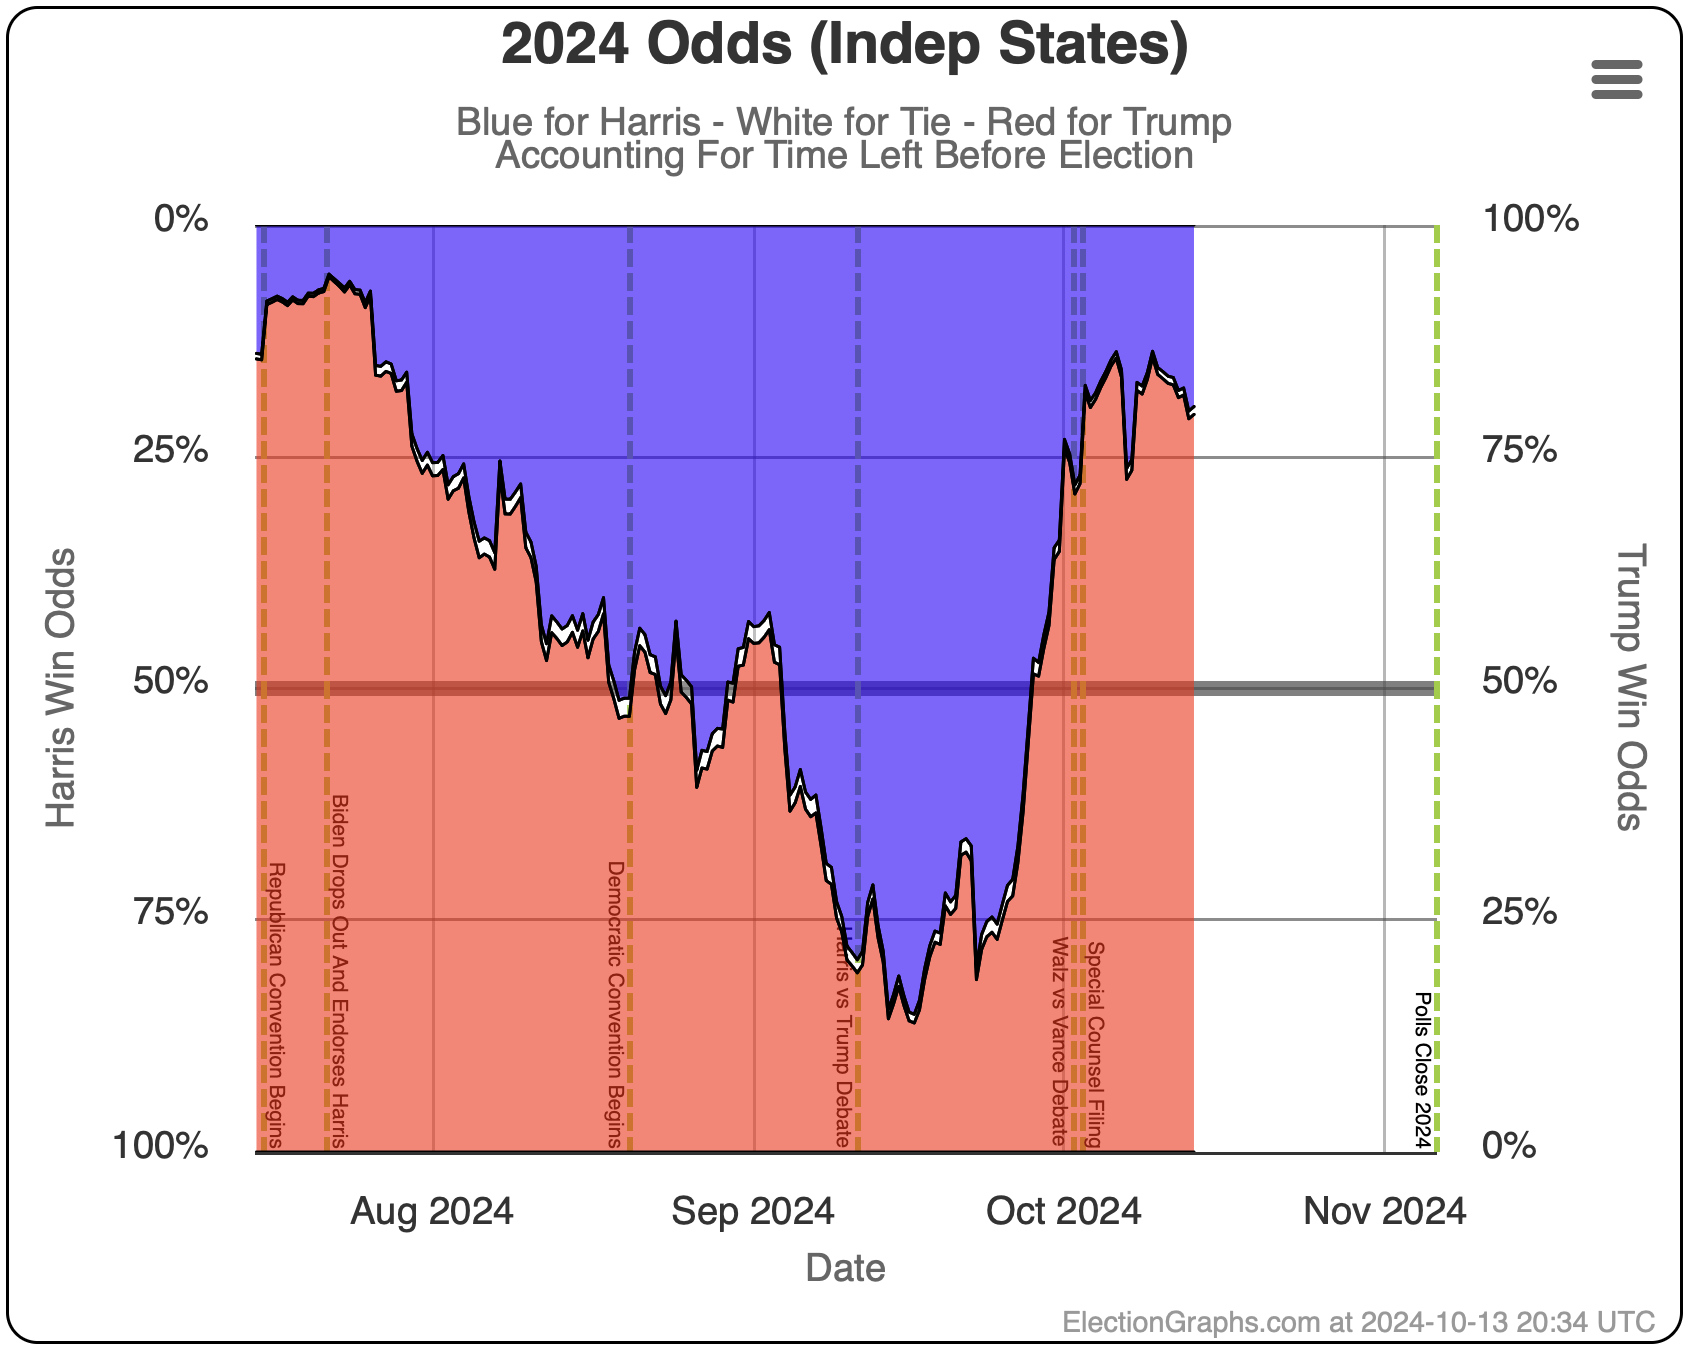
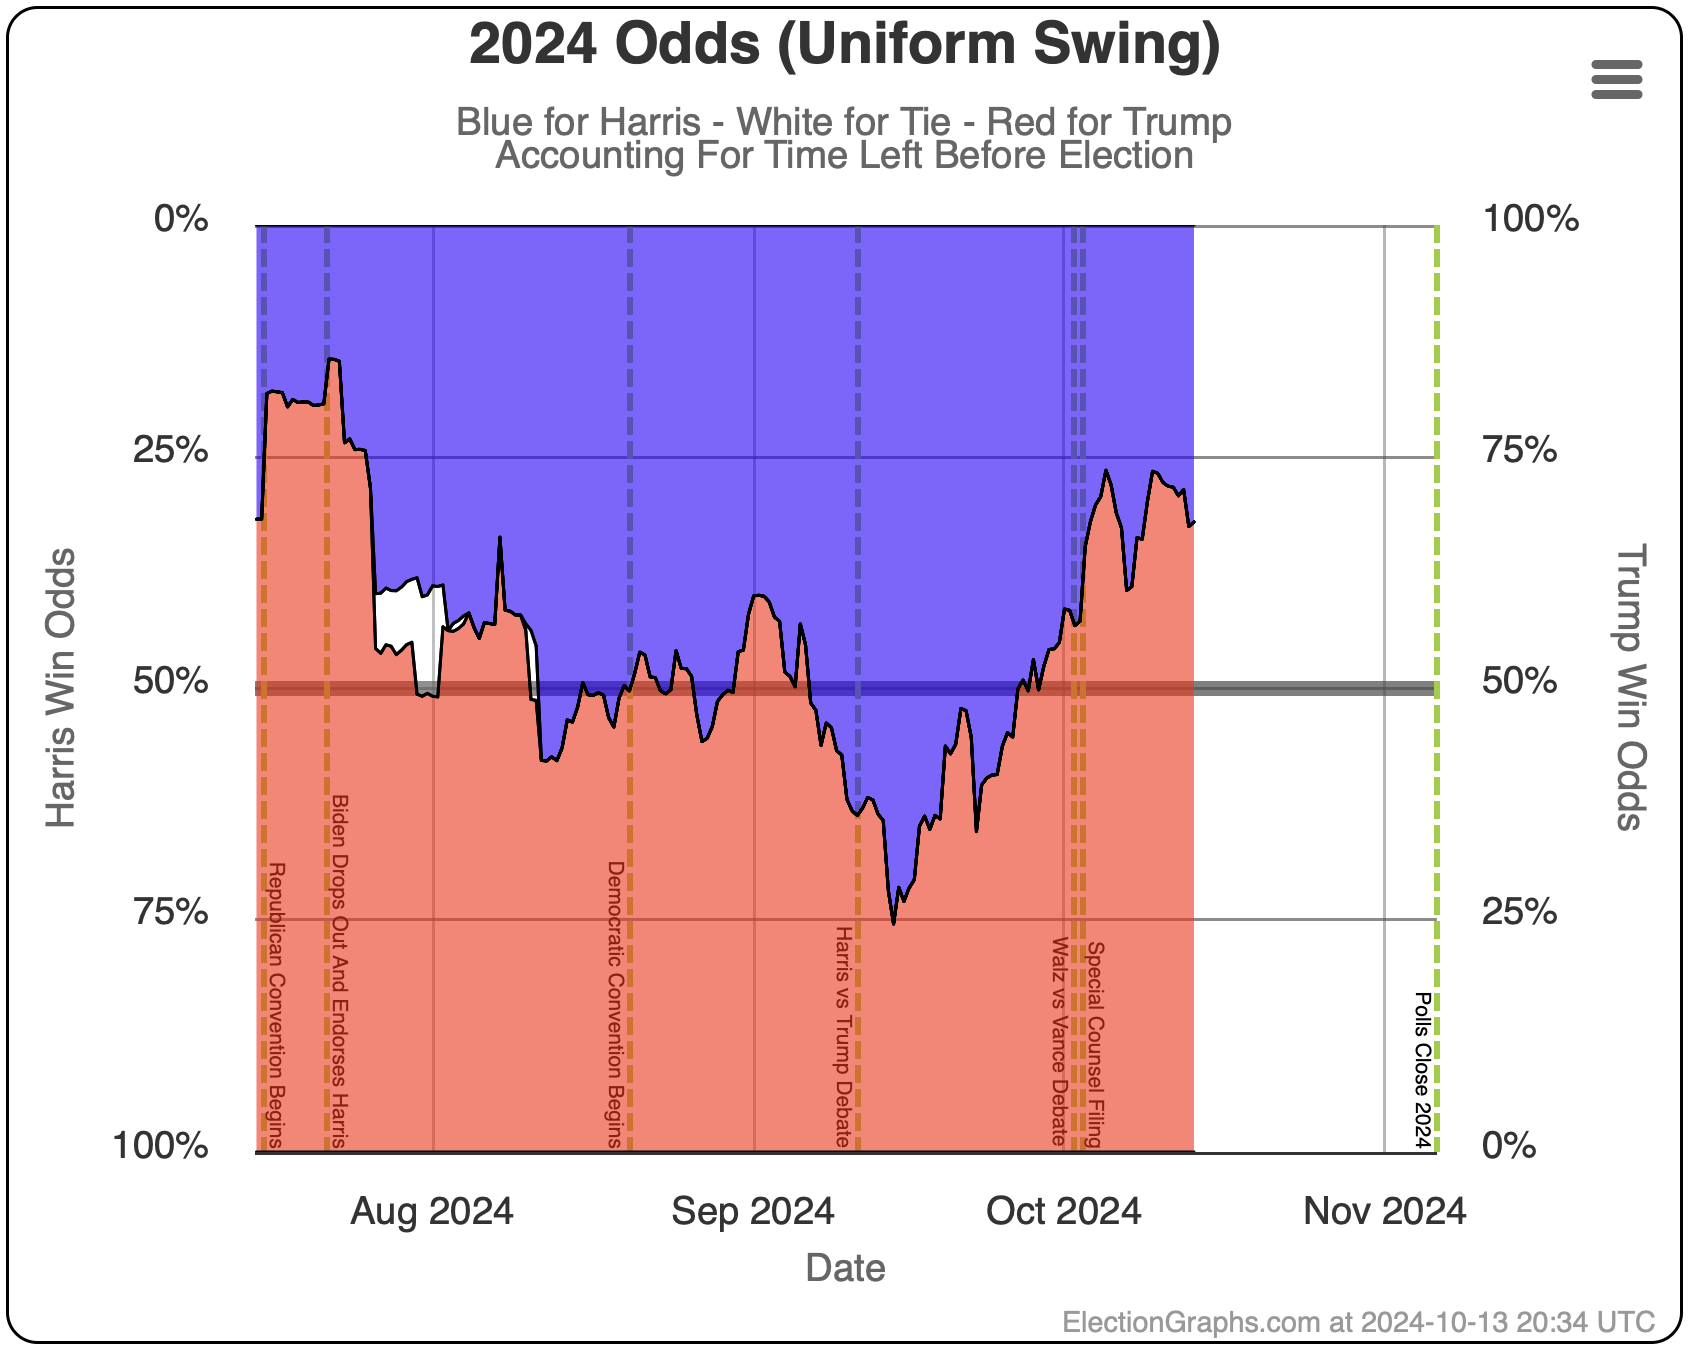
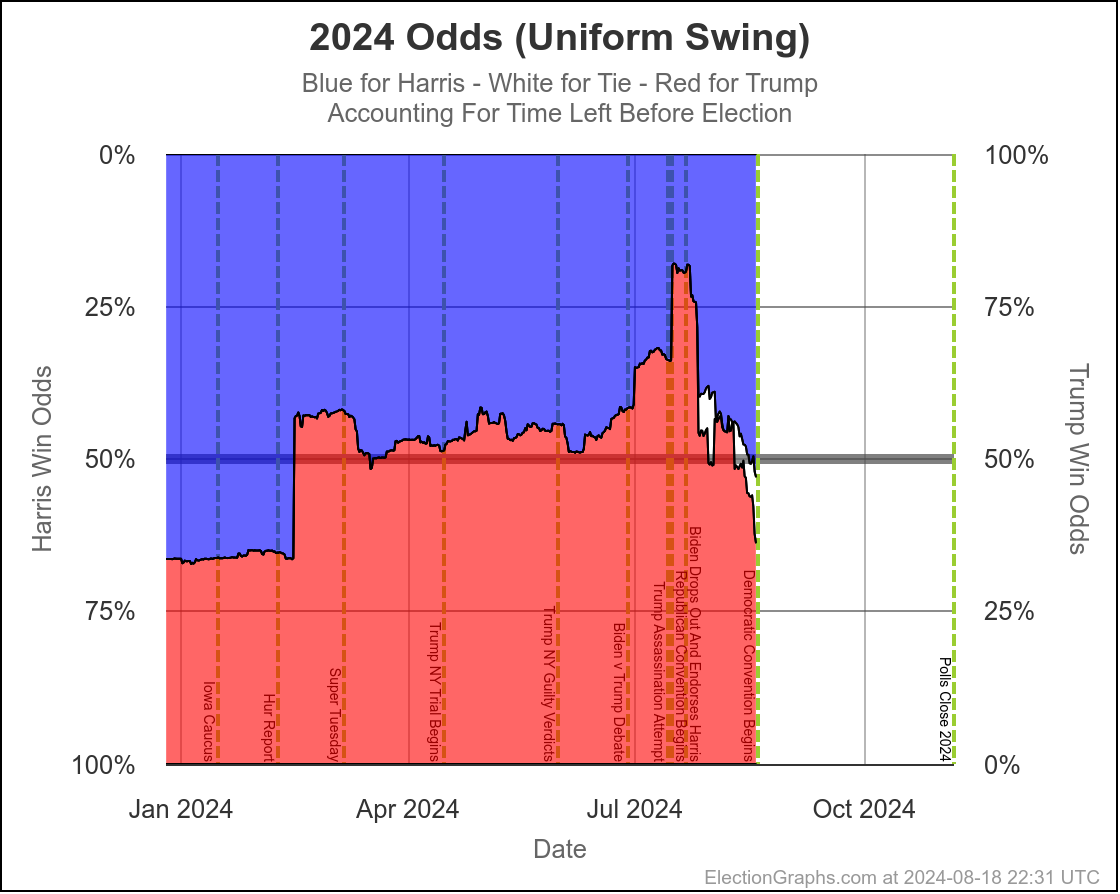
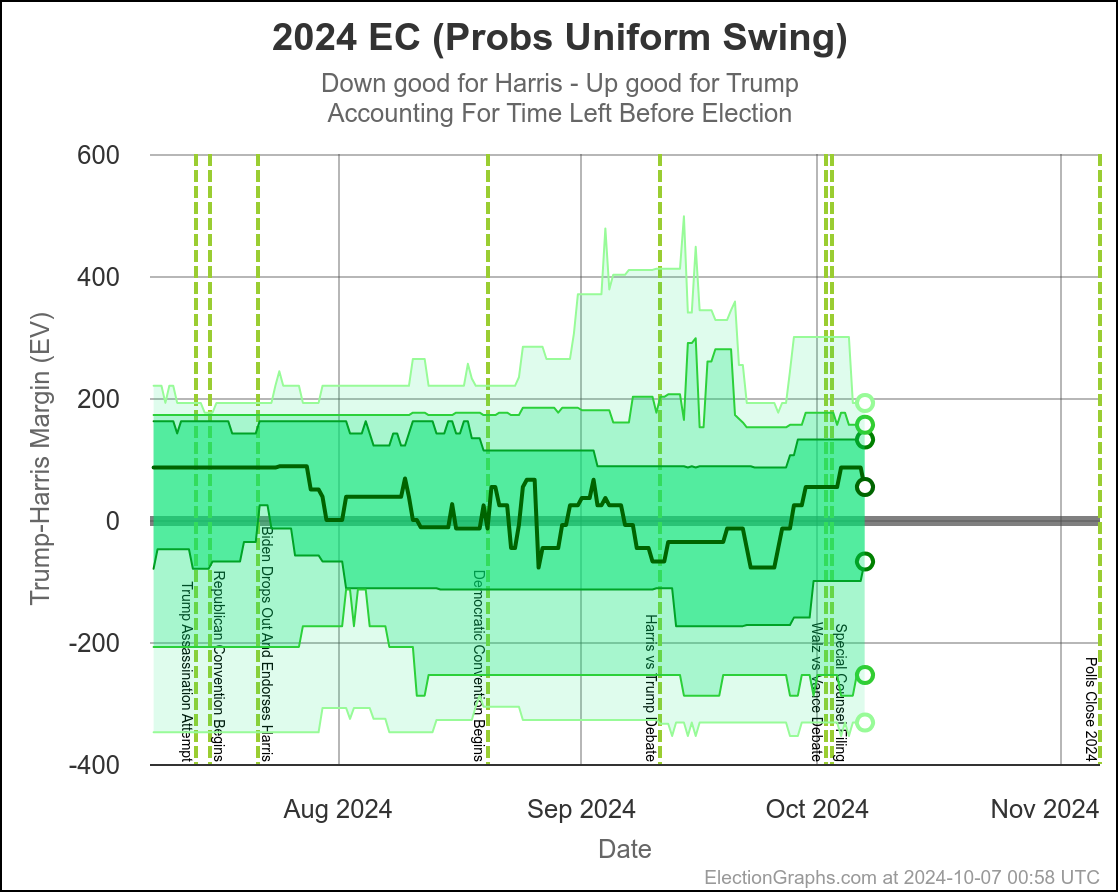
Here are charts based on my two models (Independent States and Uniform Swing) showing the range of reasonable possibilities given current polling and the probabilistic model based on historical data:
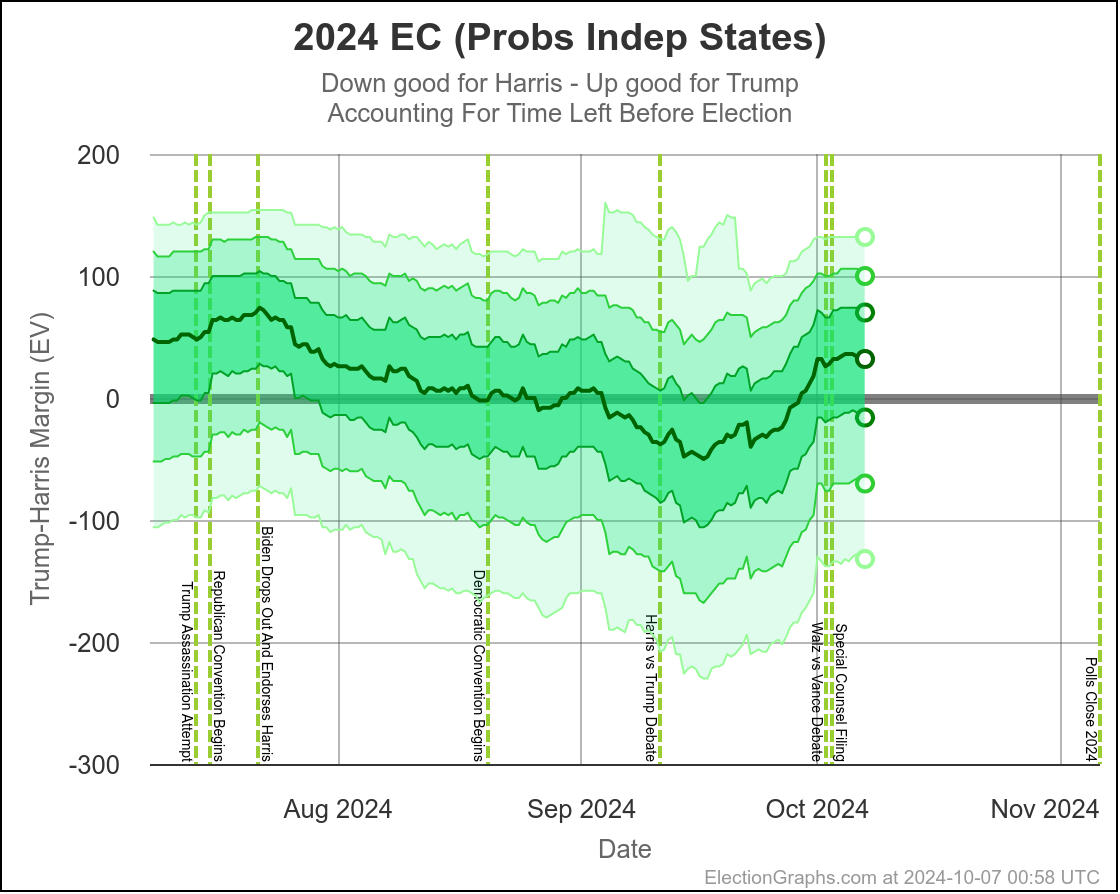
With Independent States, the 2σ (95.45%) range goes from Harris by 70 to Trump by 100.
With Uniform Swing that 2σ (95.45%) range increases to Harris by 254 to Trump by 156.
That second range is probably a bit too wide. As I've said before the "real" numbers are probably somewhere between the two models. But even the narrower of these two is still a really wide range.
Yes, it might end up close, we could end up waiting a week to find out who won the election. But it is also very reasonably possible that EITHER of the two candidates will end up winning by a healthy margin in the Electoral College and we will know the winner on Election Night. Landslides on either side are even still possible, although less likely.
We just don't have the precision in polling data to have a reliable prediction of who will win.
It may not be close in the end, but it IS too close to call.
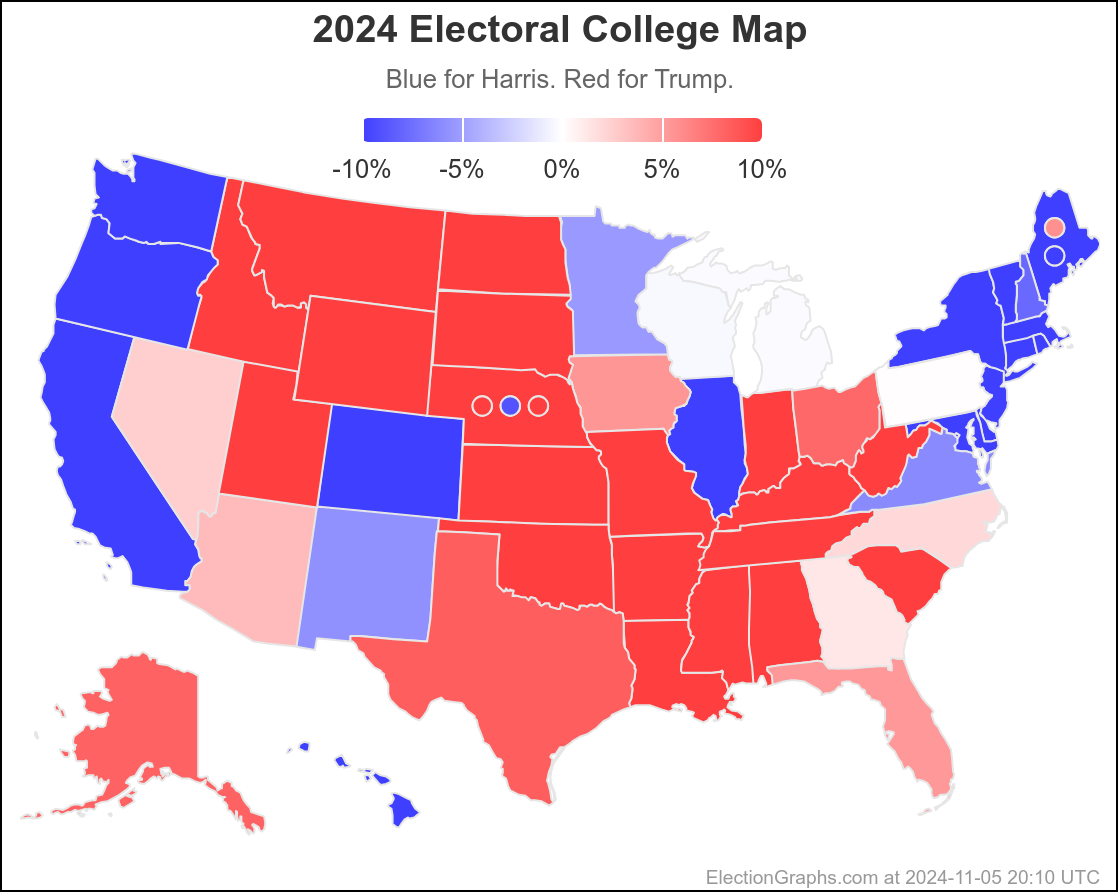
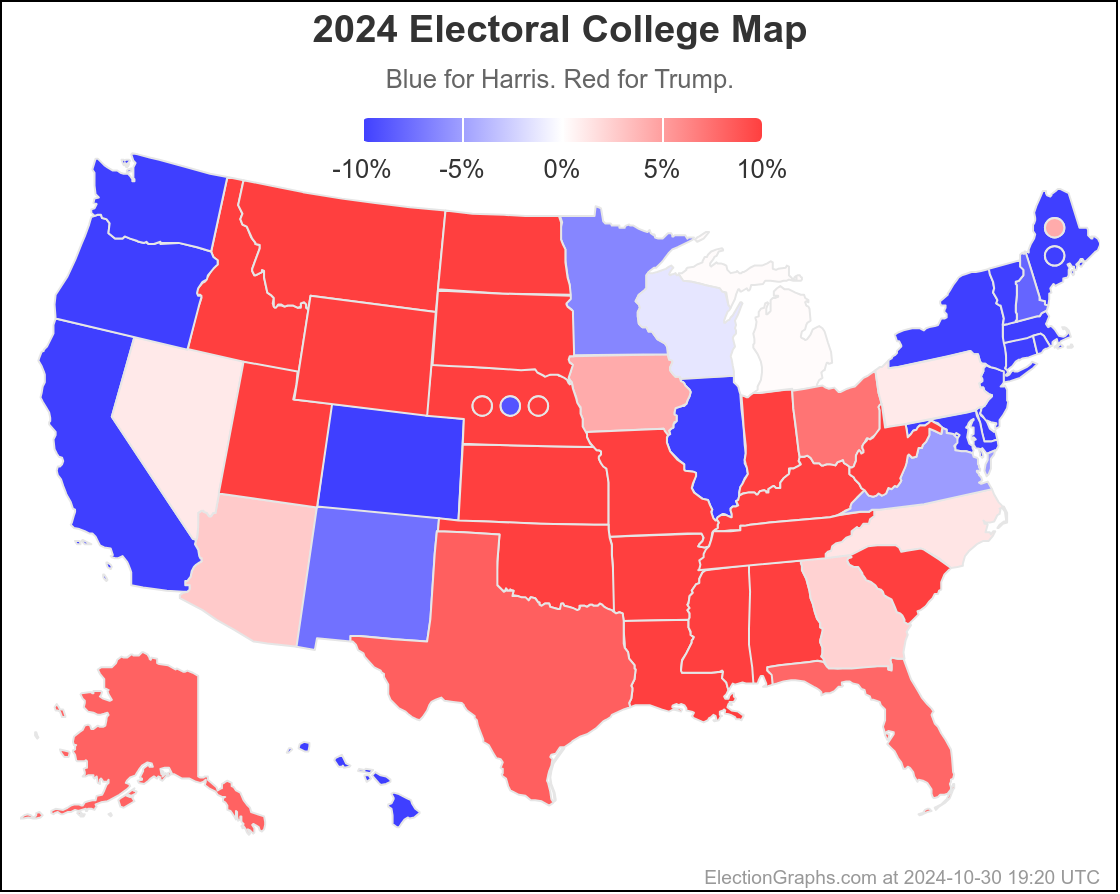
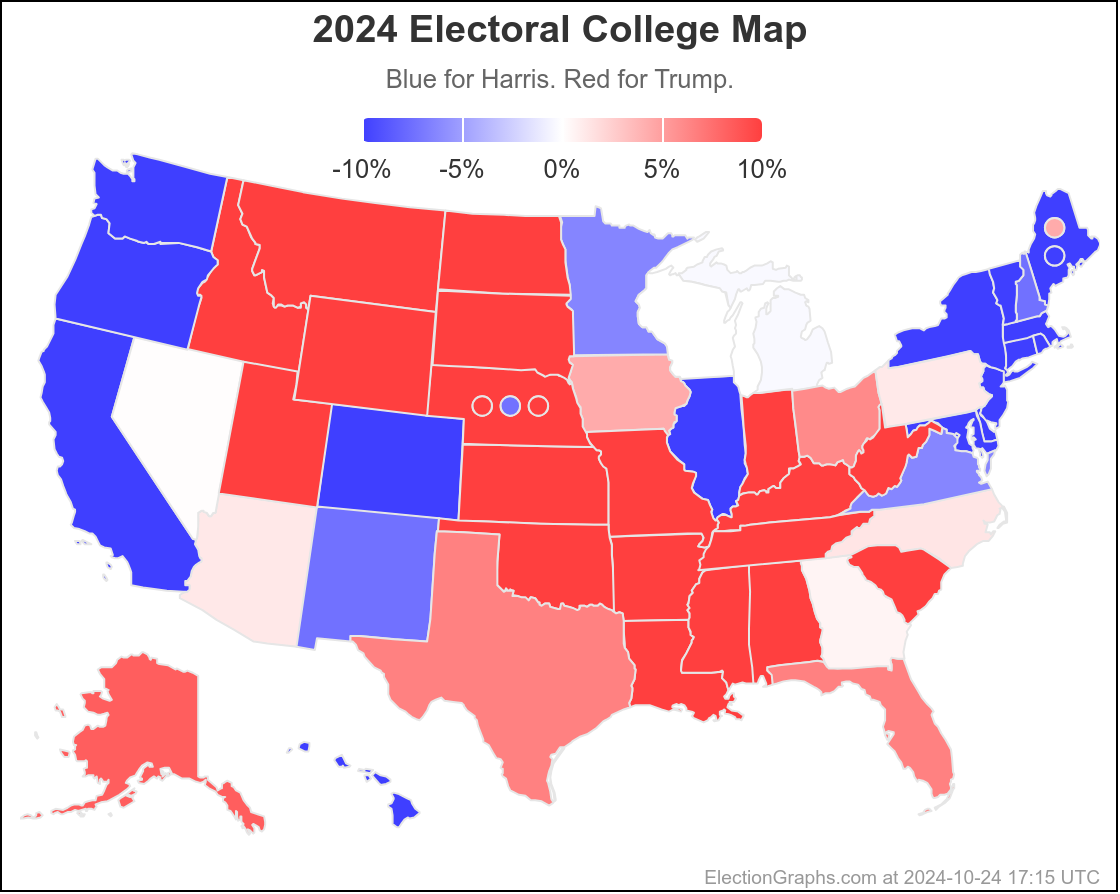
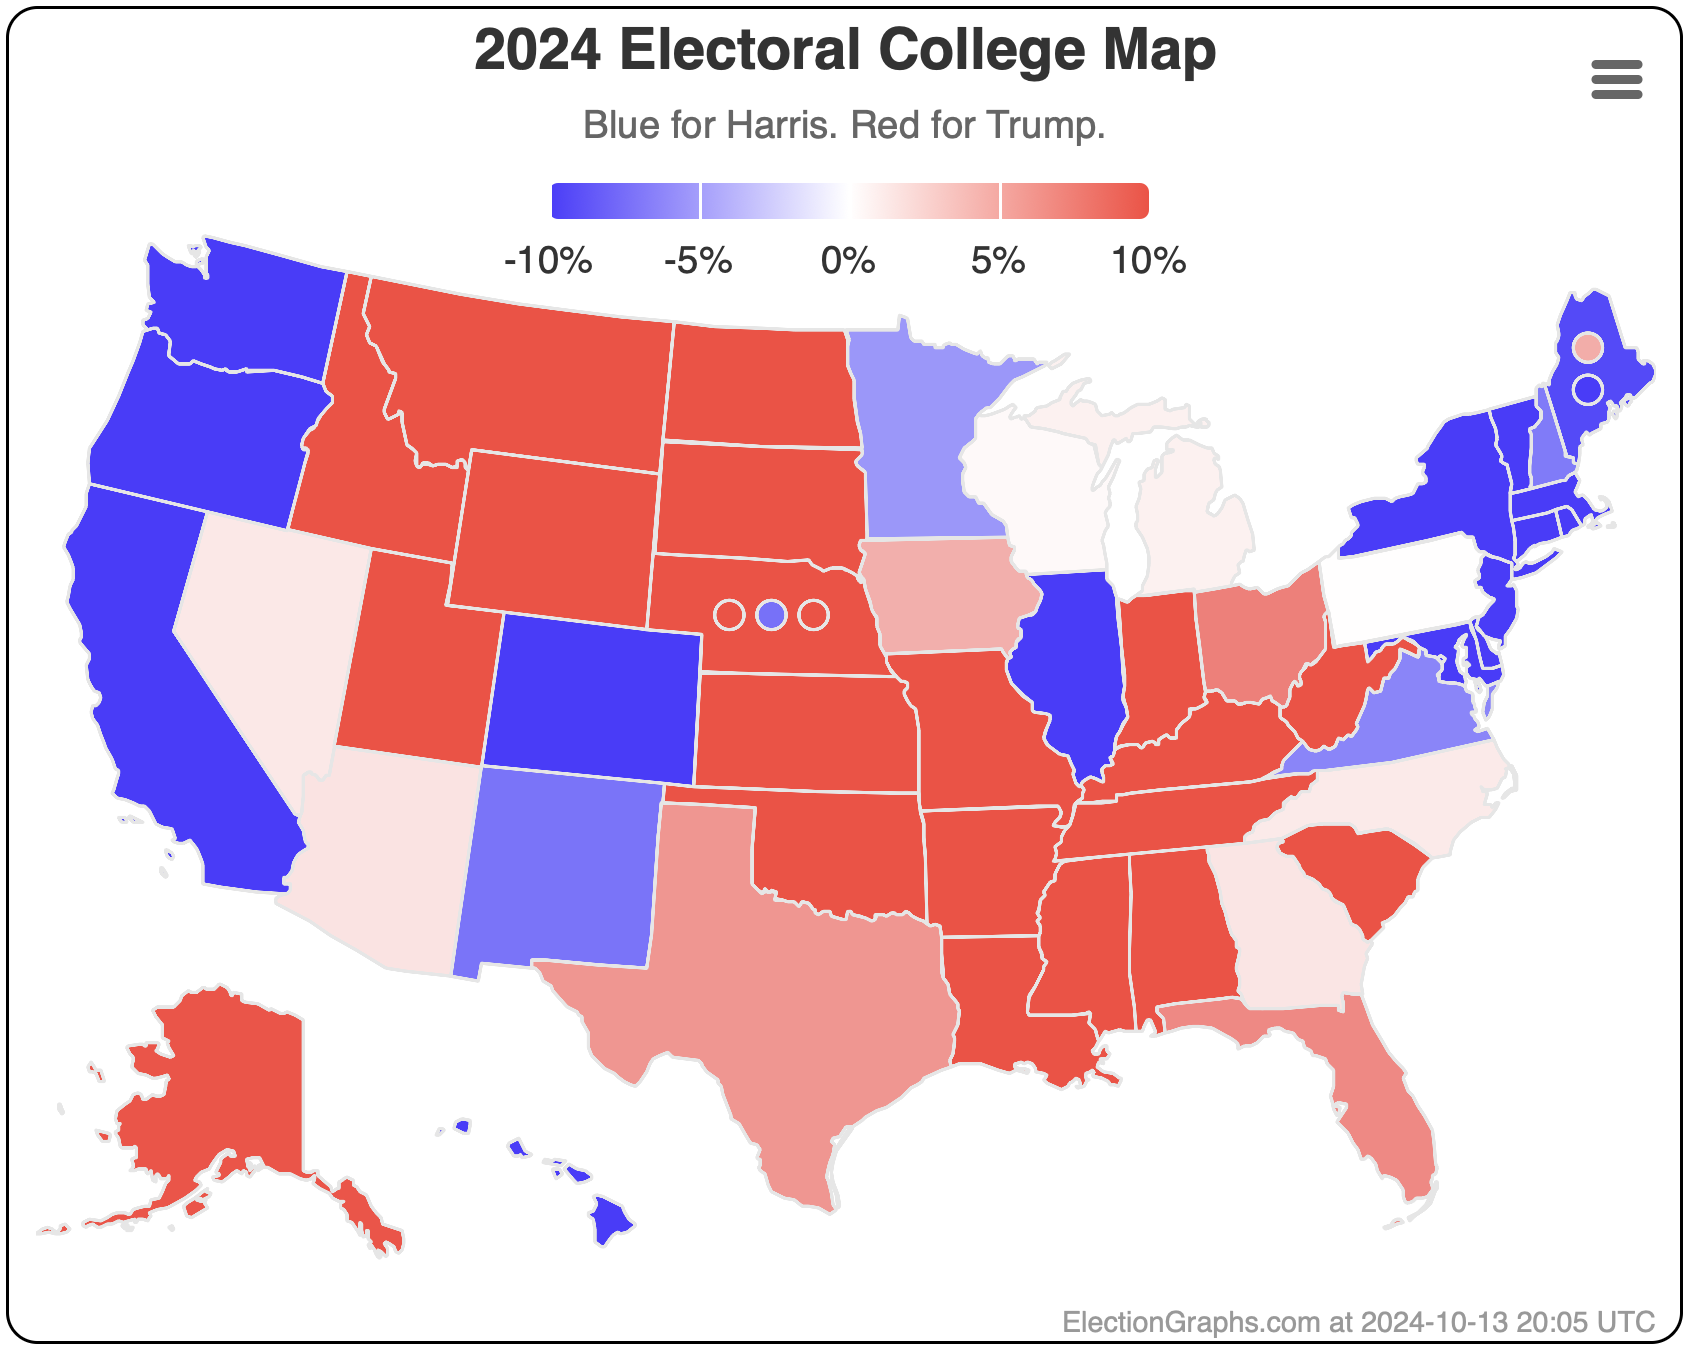
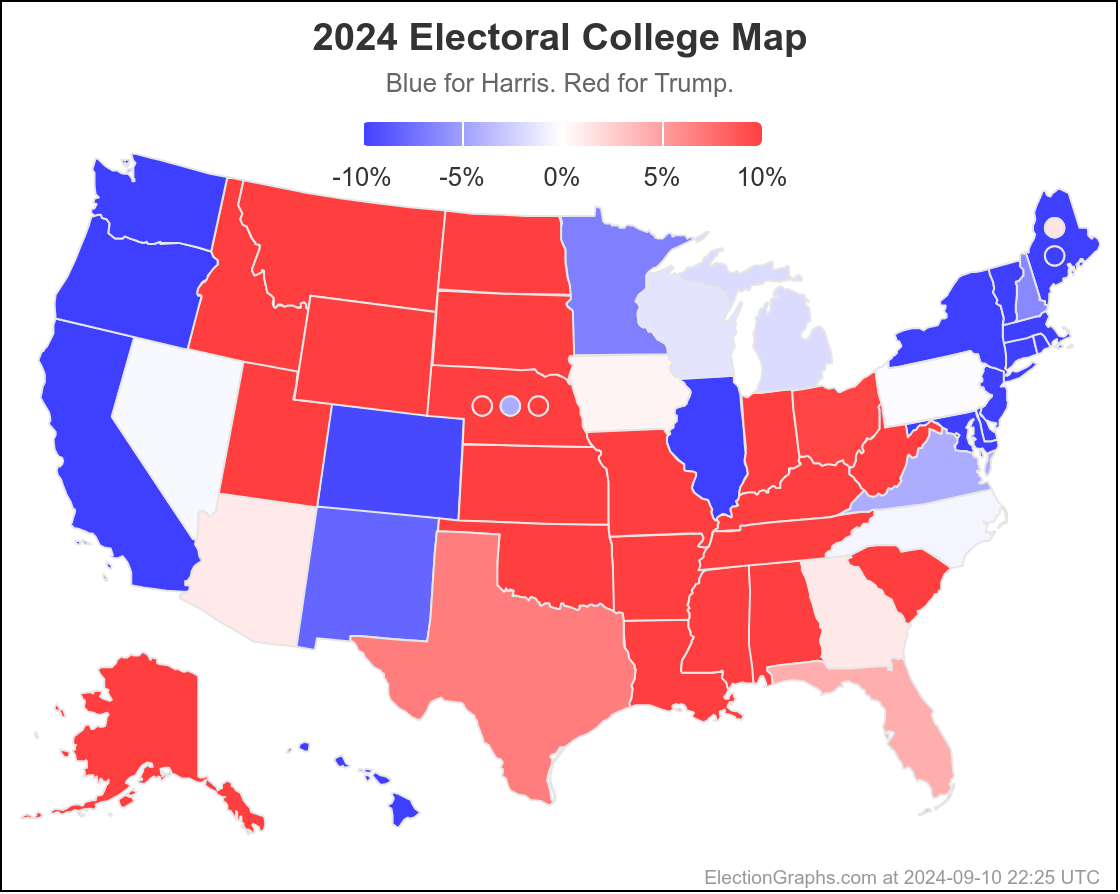
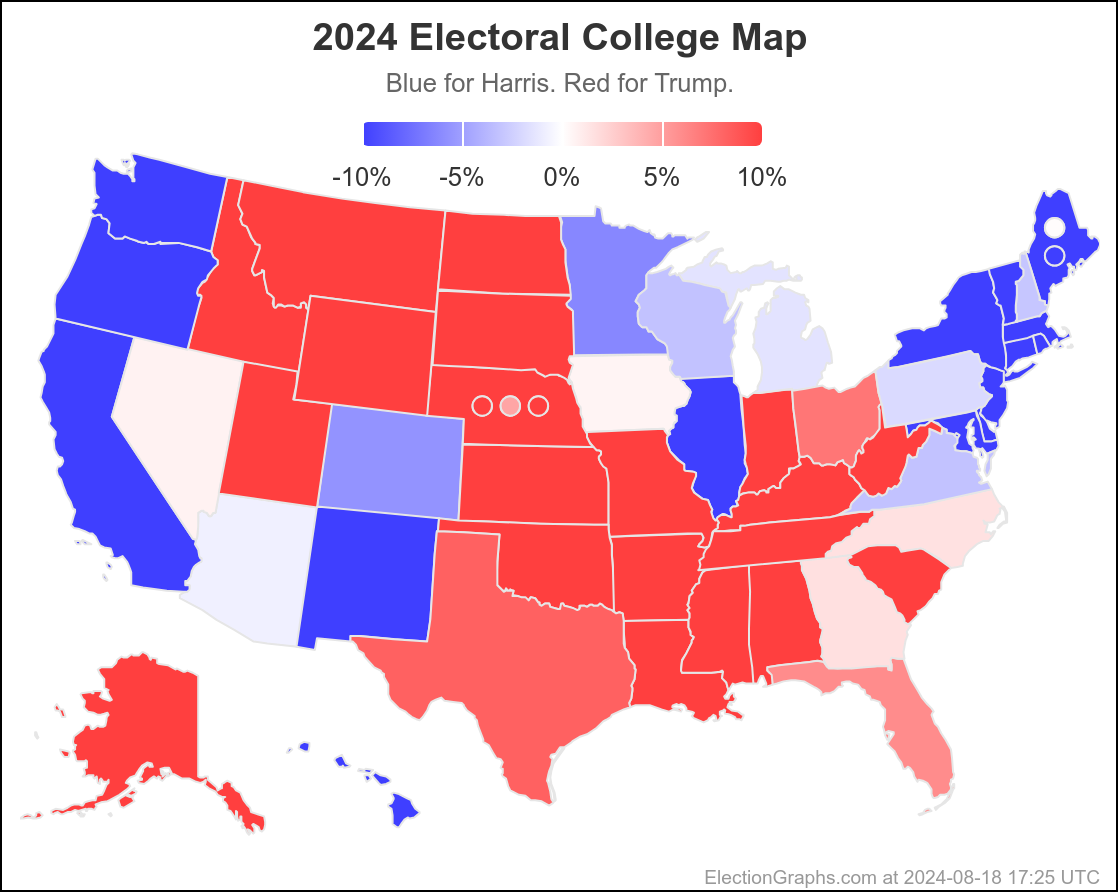
Finally, the current map:
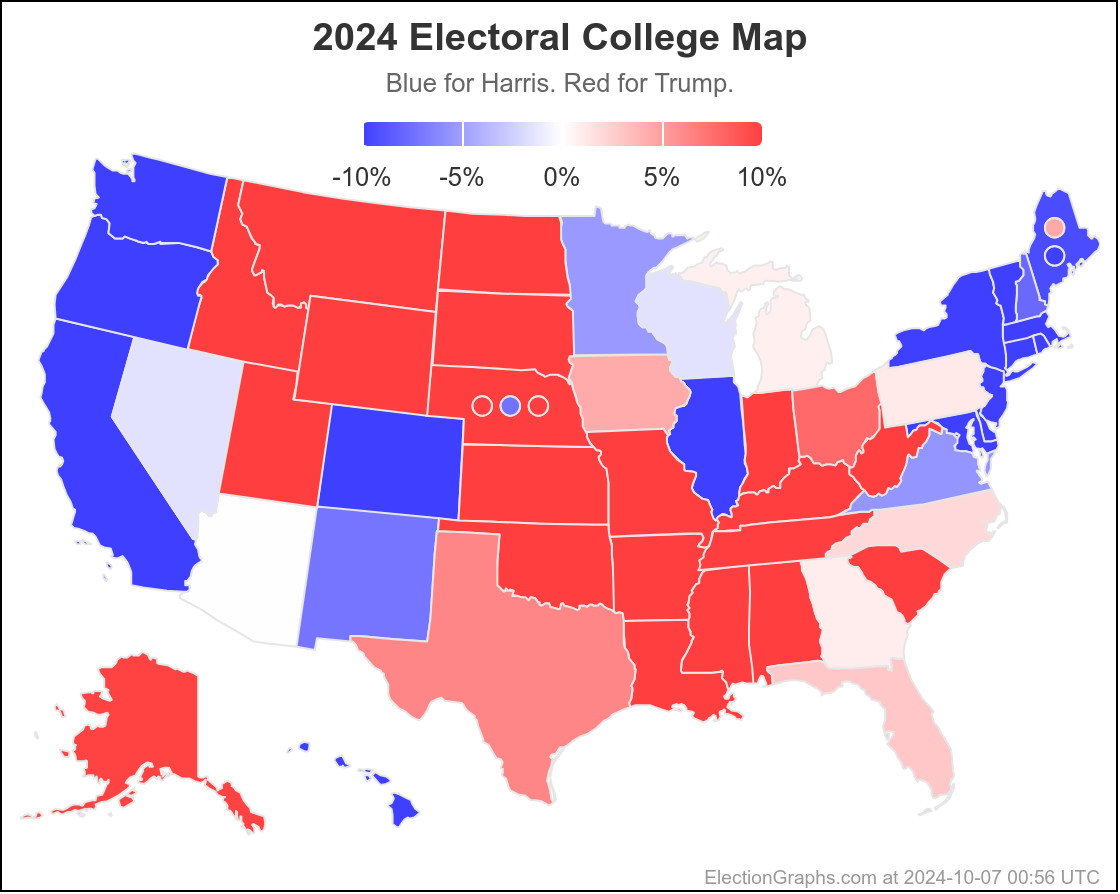
29.6 days until polls start to close on Election Night.
Keep watching.
[Edited 2024-10-07 15:21 UTC to correct one place where I flipped Harris and Trump, and spacing in one other place.]