
I had hoped to do another update four weeks after the last one, but here it is about 50 days after my last post instead. Life gets in the way. Oh well. But it does mean that this update is right on the 450 days away from polls closing mark. So there is that.
The quick summary for those who don't want to read all the details:
- Once again, if a Biden vs Trump election was held today (it won't be), it would be fundamentally too close to call.
- Biden's odds are slightly less than they were last time, but in between that update and this one, he was better off, so things have at least leveled off, and may have started moving in Trump's direction again.
- Biden has a lead if you take the state poll averages at face value, but this relies on several states where his lead is less than the average amount polls have underestimated Republicans in close states from 2008 to 2020, so be wary of trusting those leads.
- Because of the above, both of my probabilistic views give a slight advantage to Trump despite the face value result.
- Biden's polling is weaker than both his own polling in 2020, and Clinton's polling in 2016 at the same amount of time before the election.
If you want updates on each and every poll as it comes out, as well as daily summaries of the status for the best polled matchup (currently Biden vs Trump), follow Election Graphs on Mastodon.
OK, now all the details that only the die hard will be interested:
New polling added since 2023-06-25:
- 24 Biden vs Trump: MIx4, AZx3, NVx2, PAx2, WIx2, NHx2, OHx2, NY, TN, FL, GA, NC, CA, VA, KY
- 11 Biden vs DeSantis: MIx2, OHx2, NH, WI, TN, NV, FL, AZ, VA
- 2 Biden vs Scott: NH, OH
- 1 Biden vs Pence: OH
- 1 Biden vs Haley: OH
- 1 Biden vs Christie: OH
- 1 Biden vs Youngkin: VA
- 1 Kennedy vs Trump: NH
- 1 Kennedy vs Scott: NH
Also, after going back and forth a bit on how much I wanted to do it this cycle, I decided that like previous cycles, when a pollster releases multiple versions of their results, like one for Registered Voters and one for Likely Voters, or they do "Definite" supporters vs "Total" supporters or what not. When this happens, I include both versions of the poll, but I weight them so the "sub-polls" together have the same weight as a single poll.
So I've been slowly going back and reviewing older polls I have in my system, and checking to see if they have these sorts of multiple results, and if so I've been adding the "half-polls" I missed originally. I'm slowly catching up with the current day as I do this. All of the below were old polls that I have updated.
- 31 Biden vs Trump: IAx4, AZx3, GAx3, PAx3, FLx2, MIx2, WI, CO, WA, AR, KS, LA, MS, MT, OH, OK, RI, SC, TX, NC
- 20 Biden vs DeSantis: AZx2, GAx2, PAx2, AR, FL, KS, LA, MS, MT, OH, OK, RI, SC, TX, NC, IA, MI
- 1 Biden vs Pence: NC
As has been the norm the last few updates, I start with looking at the changes to the "spectrum of close states":
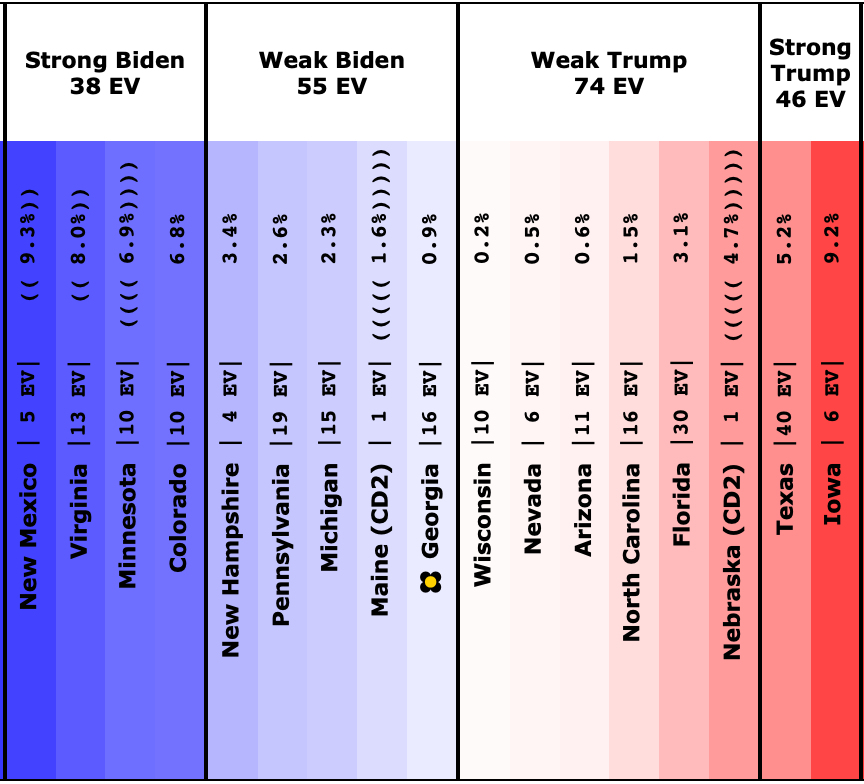
As it was on 2023-06-25:
And now on 2023-08-13:
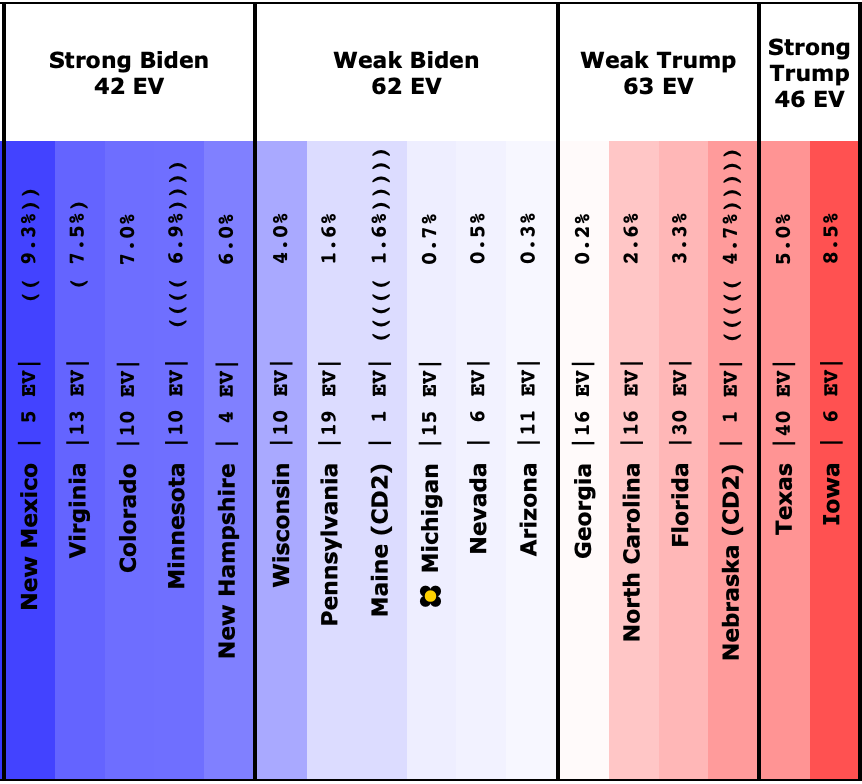
The states where the poll average moved toward Trump are:
- Michigan (15 EV): Biden by 2.3% -> Biden by 0.7% (Trump+1.6%)
- North Carolina (16 EV): Trump by 1.5% -> Trump by 2.6% (Trump+1.1%)
- Georgia (16 EV): Biden by 0.9% -> Trump by 0.2% (Trump+1.1%)
- Pennsylvania (19 EV): Biden by 2.6% -> Biden by 1.6% (Trump+1.0%)
- Virginia (13 EV): Biden by 8.0% -> Biden by 7.5% (Trump+0.5%)
- Florida (30 EV): Trump by 3.1% -> Trump by 3.3% (Trump+0.2%)
And the states where the poll average moved toward Biden are:
- Colorado (10 EV): Biden by 6.8% -> Biden by 7.0% (Biden+0.2%)
- Texas (40 EV): Trump by 5.2% -> Trump by 5.0% (Biden+0.2%)
- Iowa (6 EV): Trump by 9.2% -> Trump by 8.5% (Biden+0.7%)
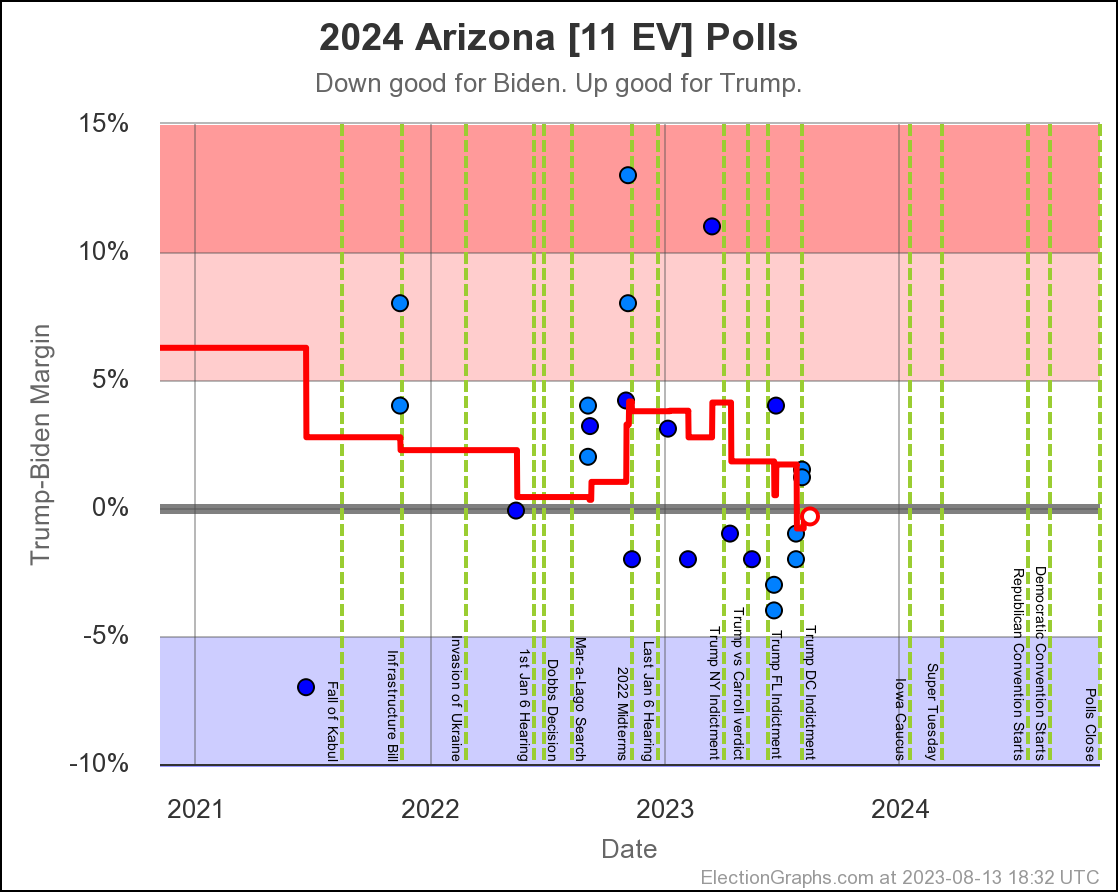
- Arizona (11 EV): Trump by 0.6% -> Biden by 0.3% (Biden+0.9%)
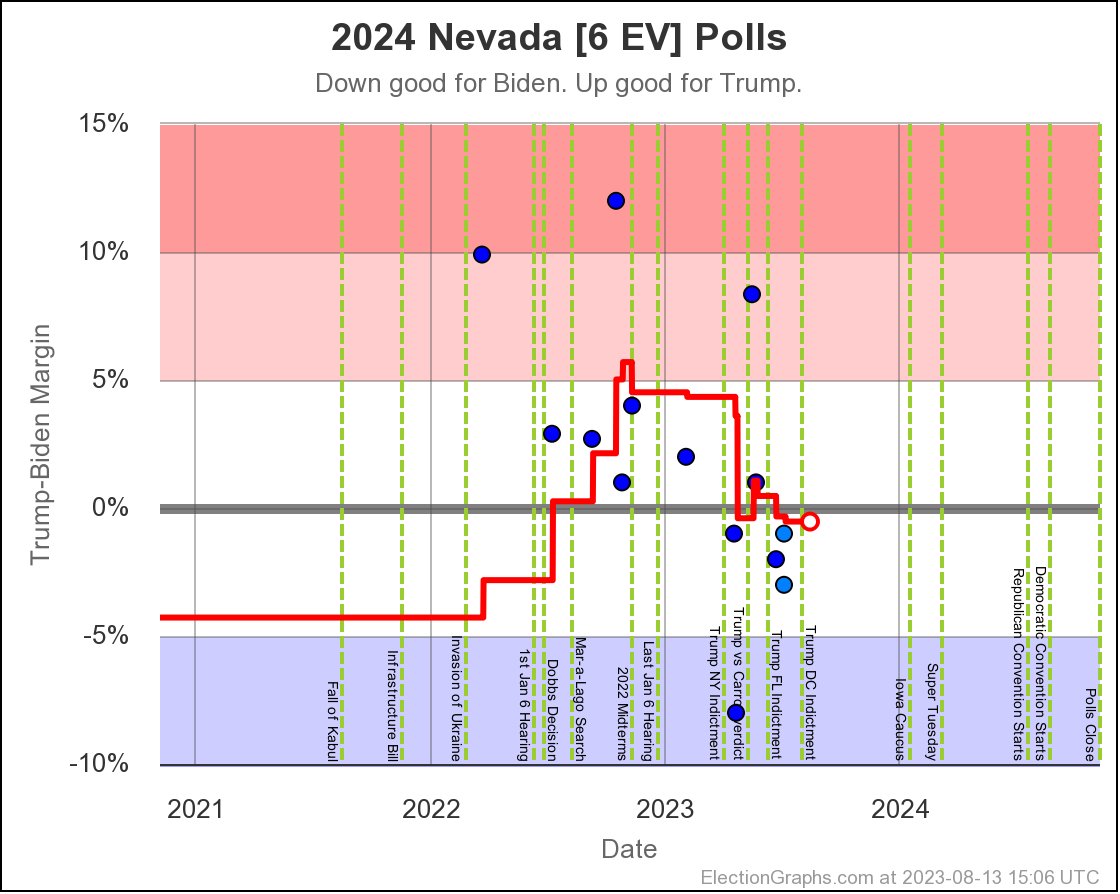
- Nevada (6 EV): Trump by 0.5% -> Biden by 0.5% (Biden+1.0%)
- New Hampshire (4 EV): Biden by 3.4% -> Biden by 6.0% (Biden+2.6%)
- Wisconsin (10 EV): Trump by 0.2% -> Biden by 4.0% (Biden+4.2%)
The last few (roughly) monthly updates have been very lopsided, with a lot more states moving toward Biden than moving toward Trump from this group of close states. (We really don't care about how states move if one candidate has an overwhelming lead.) This time though, 7 states moved toward Biden, 6 states moved toward Trump. That is much more even, indicating we've moved into a more stable period, at least for a little while.
Georgia, Arizona, and Nevada crossed the center line.
Let's look at them in more detail.

This time I won't write a paragraph of commentary on each state, you can look above and draw your own conclusions.
At the moment these are the three closest states according to the straight up averages though, all with margins 0.5% or less. You can expect the closest states to bounce around from one side of the center line a bit.
OK, lets look at the overall summary:
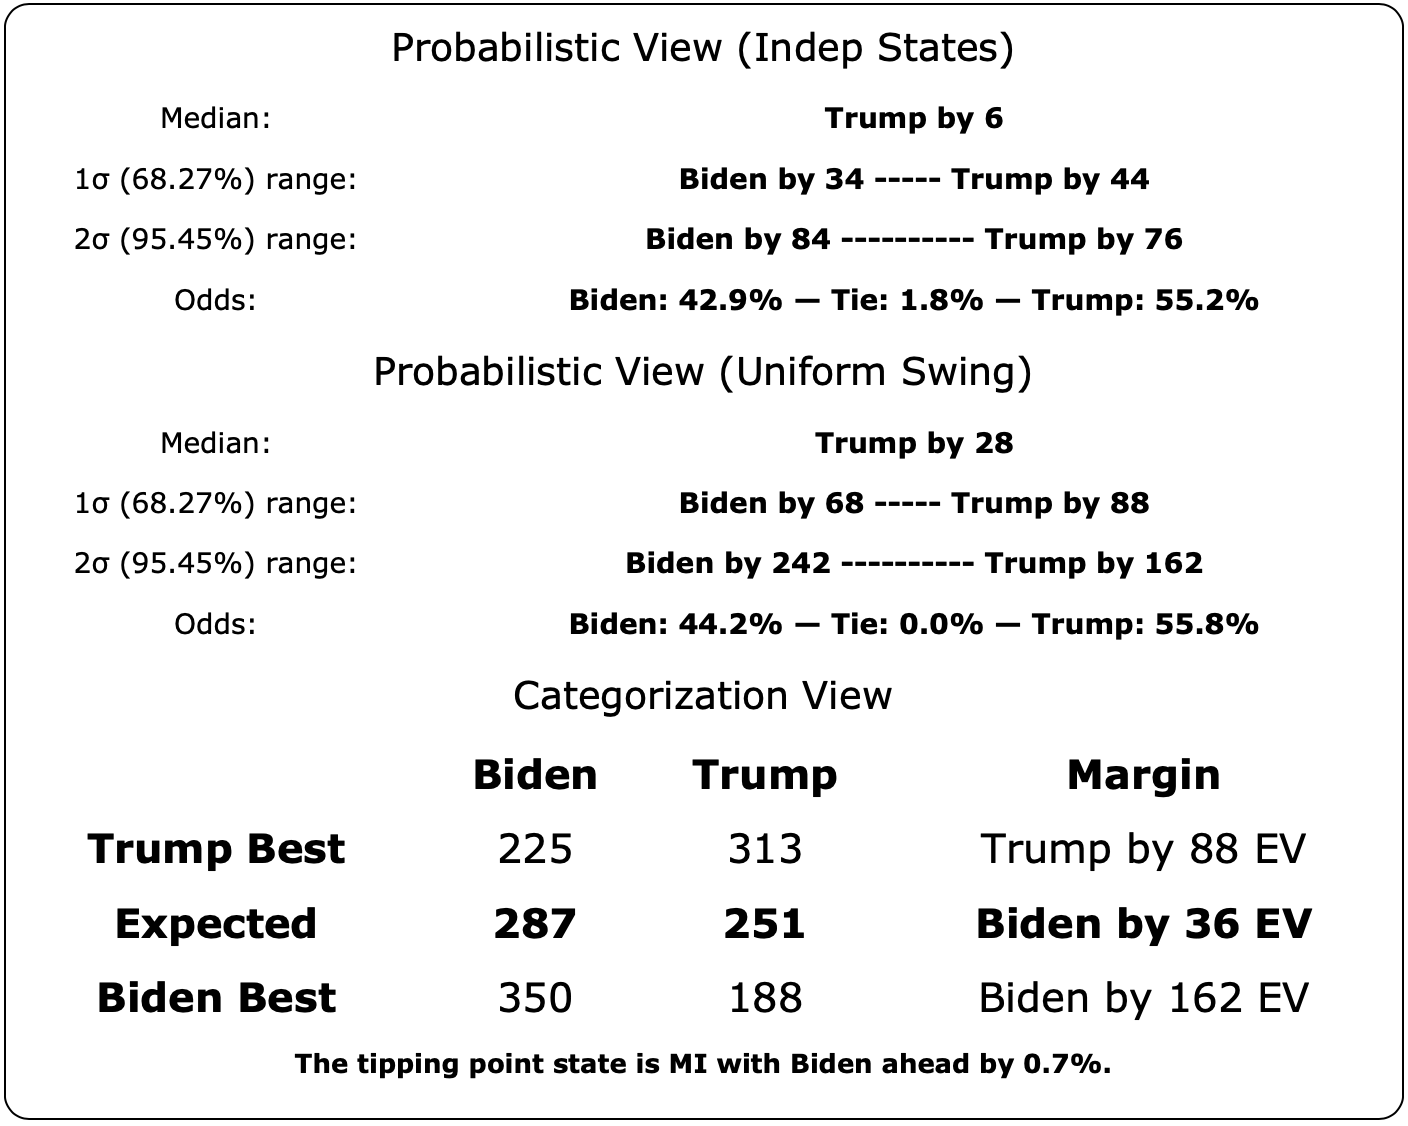
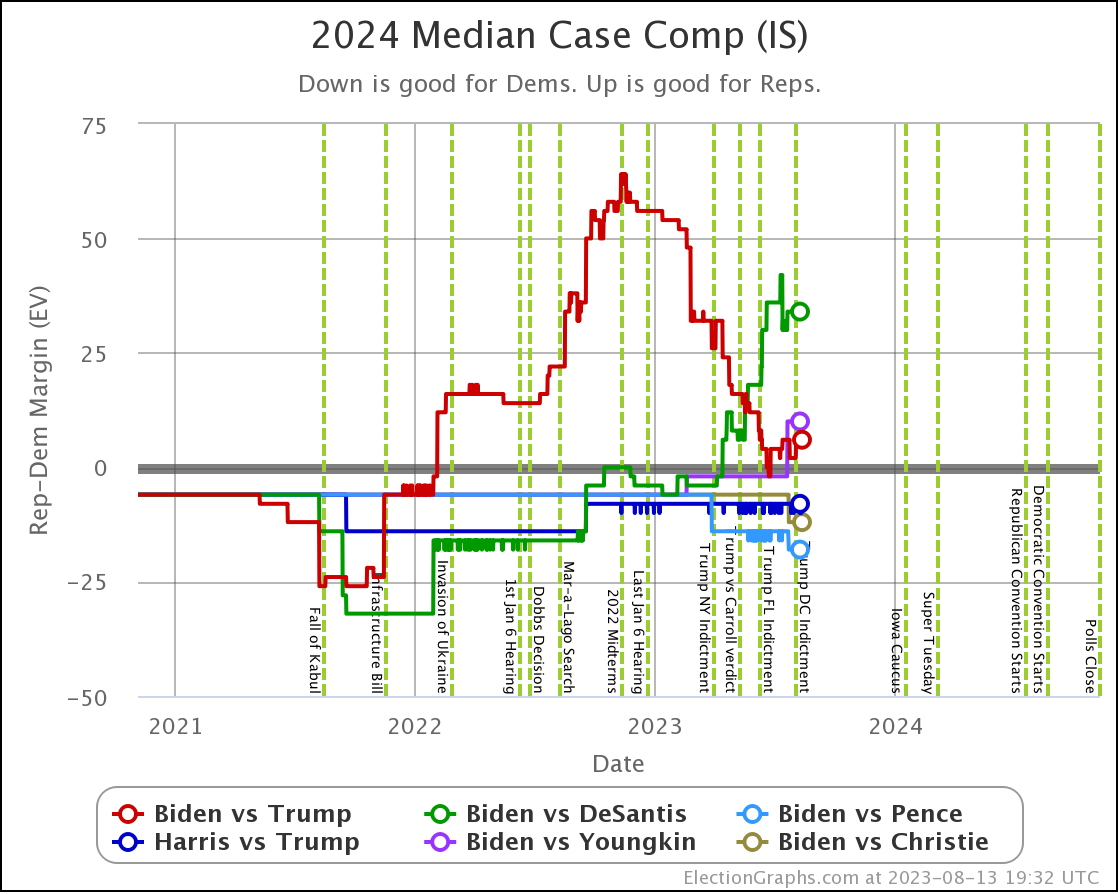
Looking at the evolution of the Biden win odds first:
- 2023-03-25: Between 17.8% and 25.8%
- 2023-04-24: Between 24.9% and 32.3%
- 2023-05-21: Between 34.9% and 35.9%
- 2023-06-25: Between 43.9% and 46.0%
- 2023-08-13: Between 42.9% and 44.2%
The trend of Biden being stronger each time than the time before has been broken, with Biden slightly weaker this time than last. Lets look at the two odds charts to see if we can get any additional insights.
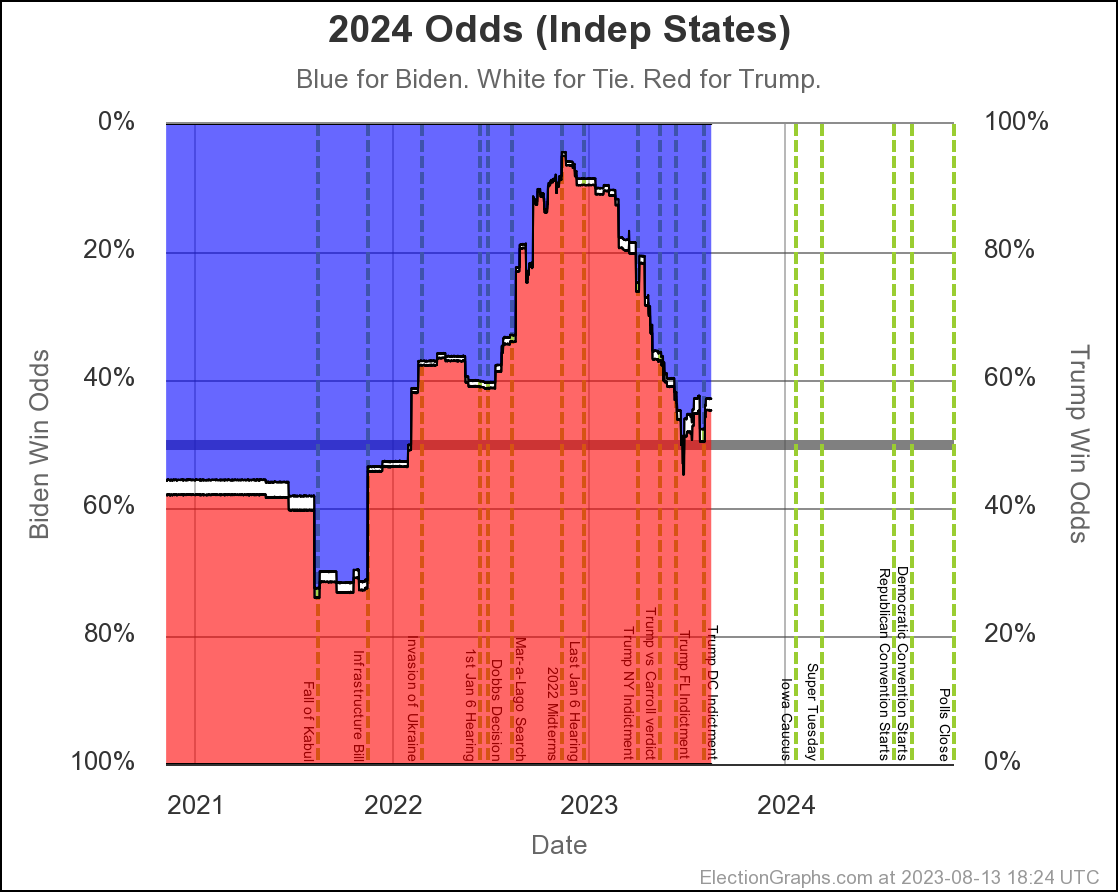
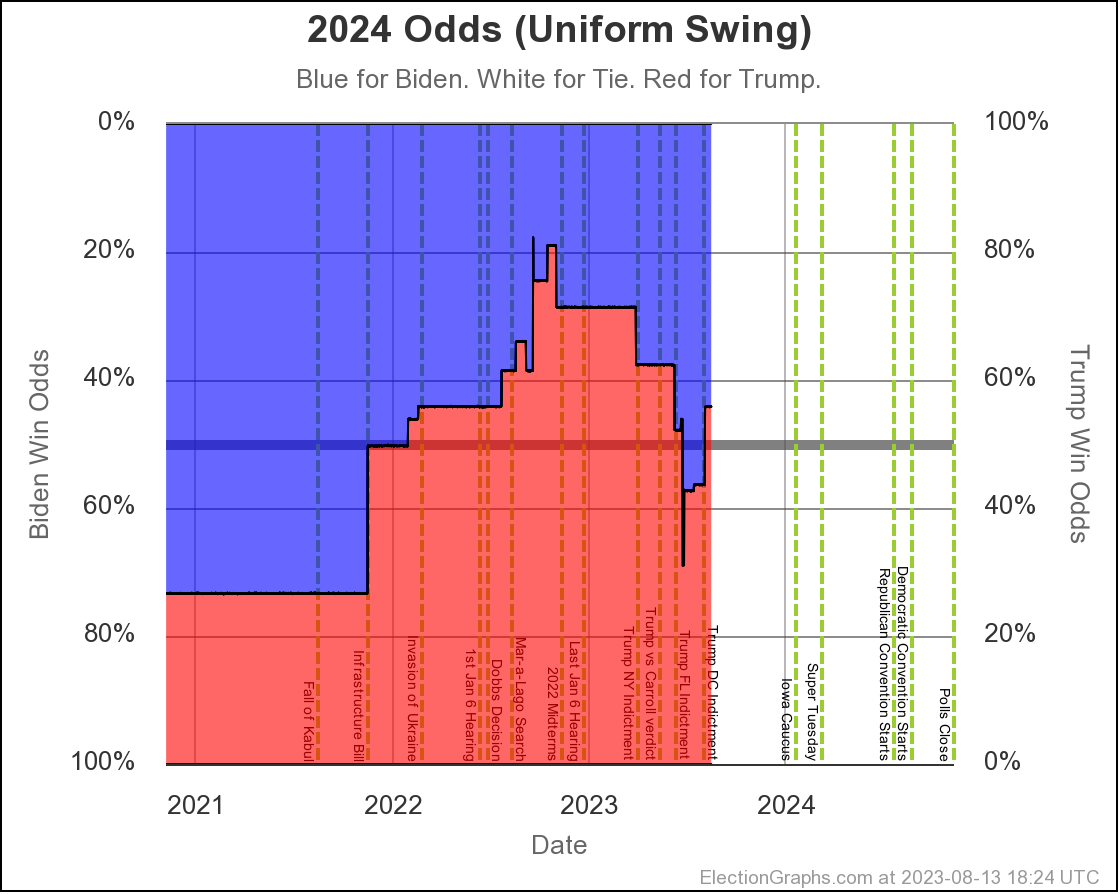
In both ways of calculating odds (the two extremes of how correlated state polling errors might be) you can see that for a time the odds actually favored Biden for a bit, but then things popped back in Trump's direction. The net result is that we are pretty close to where we were in the update 50 days ago, but the trend has reversed.
Now is this move toward Trump something that will be sustained? Or is it just a temporary blip before the trend toward Biden continues? Of course there is no way to know other than to wait and see what happens next.
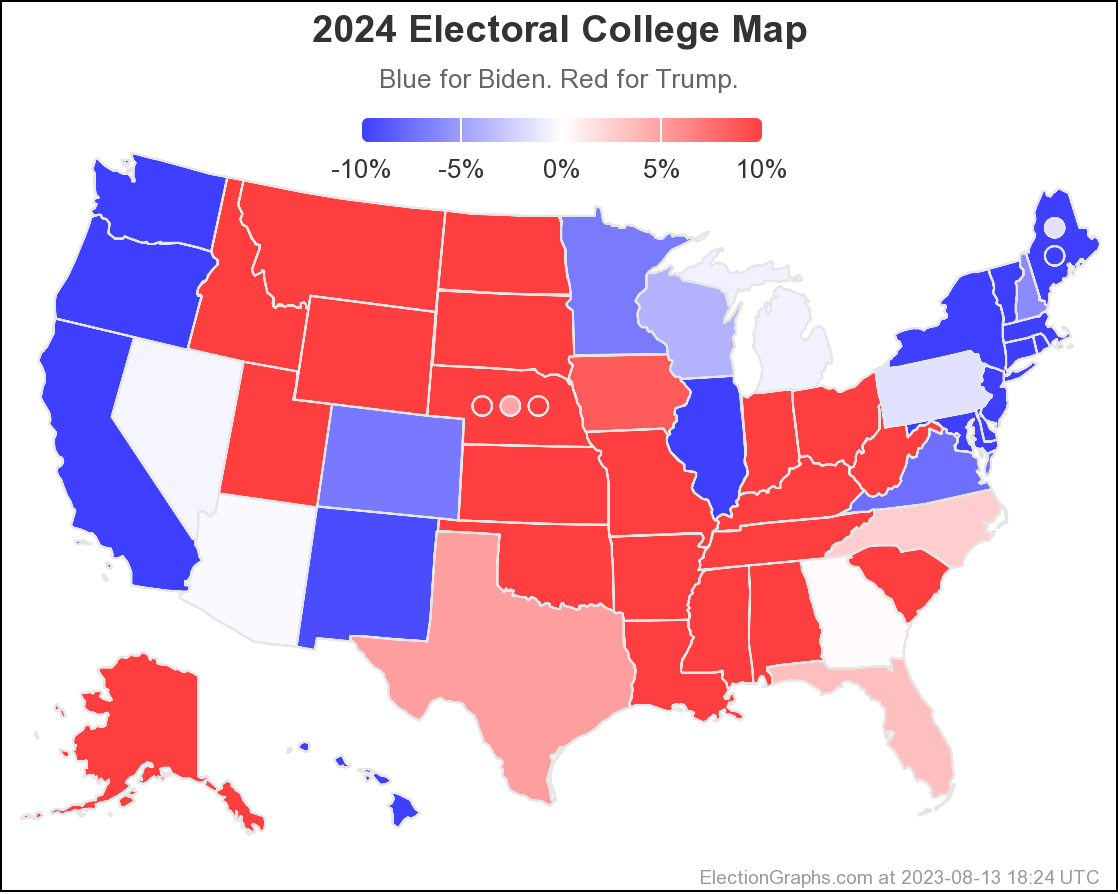
So how does this look in terms of the electoral college? Here are the three views:
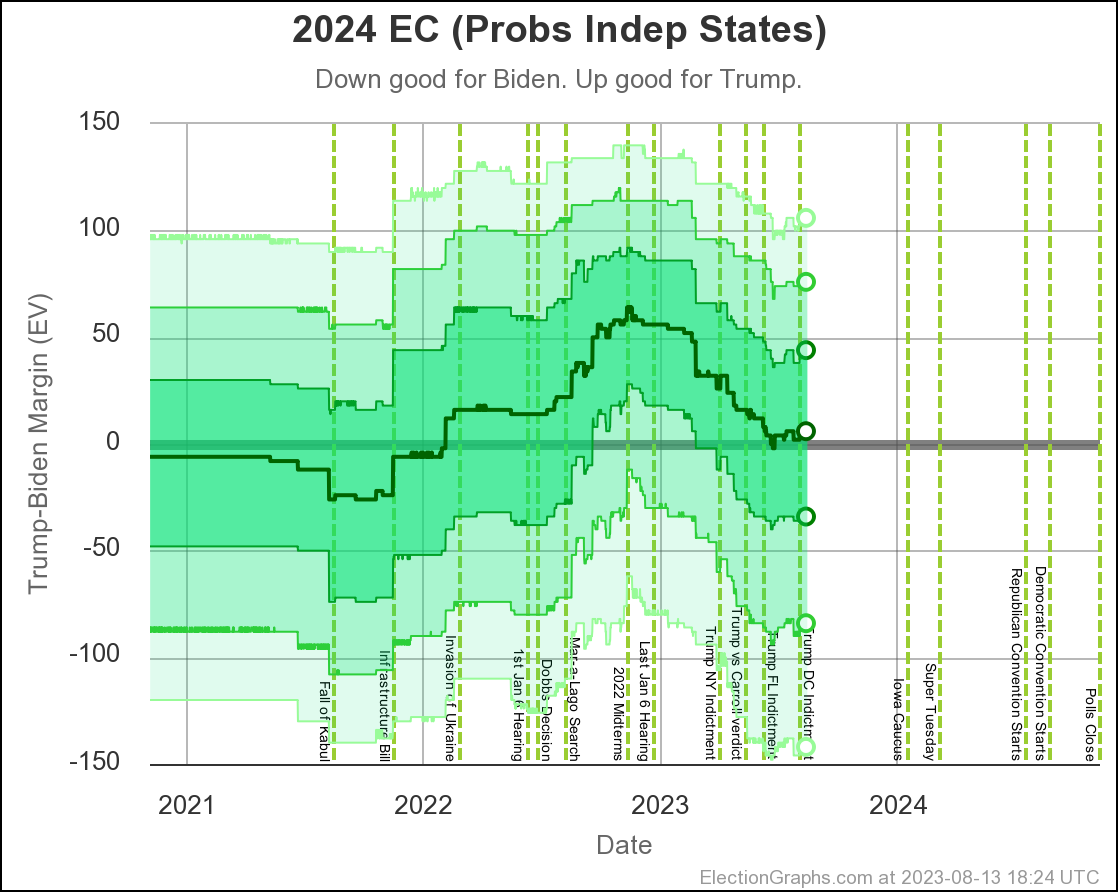
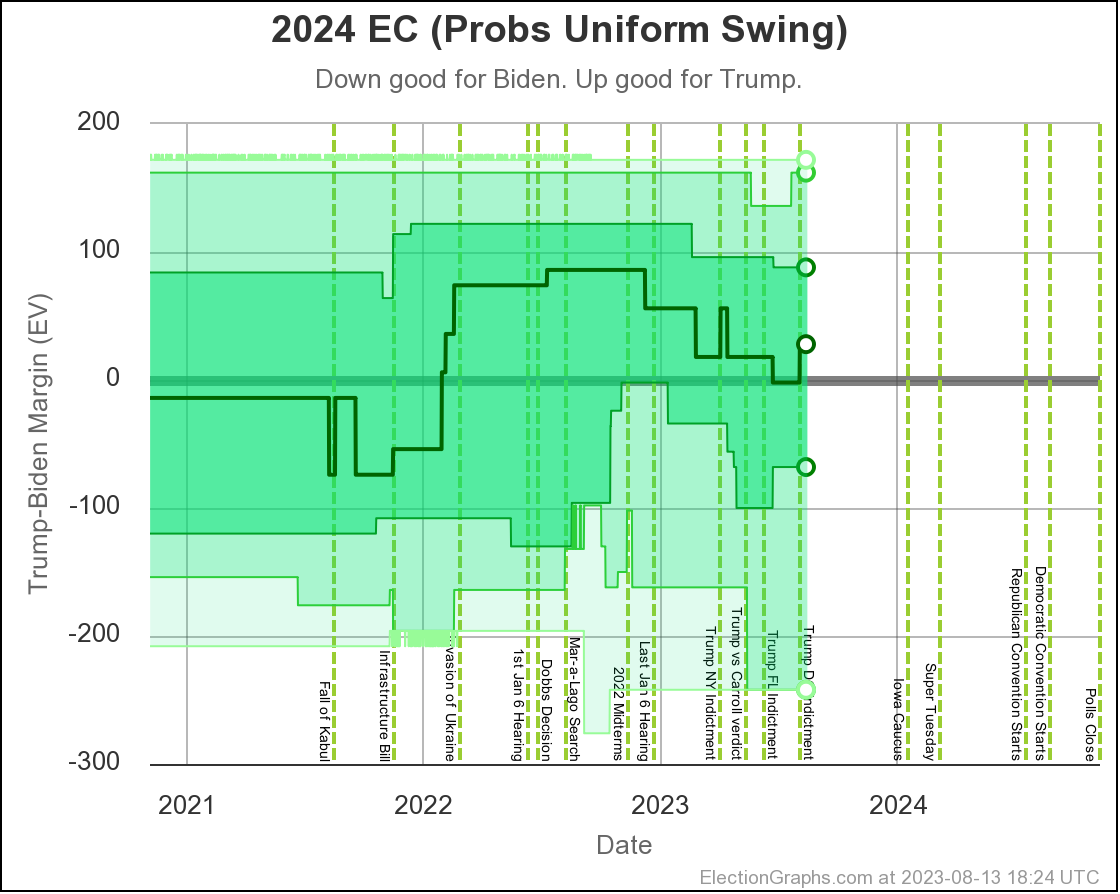
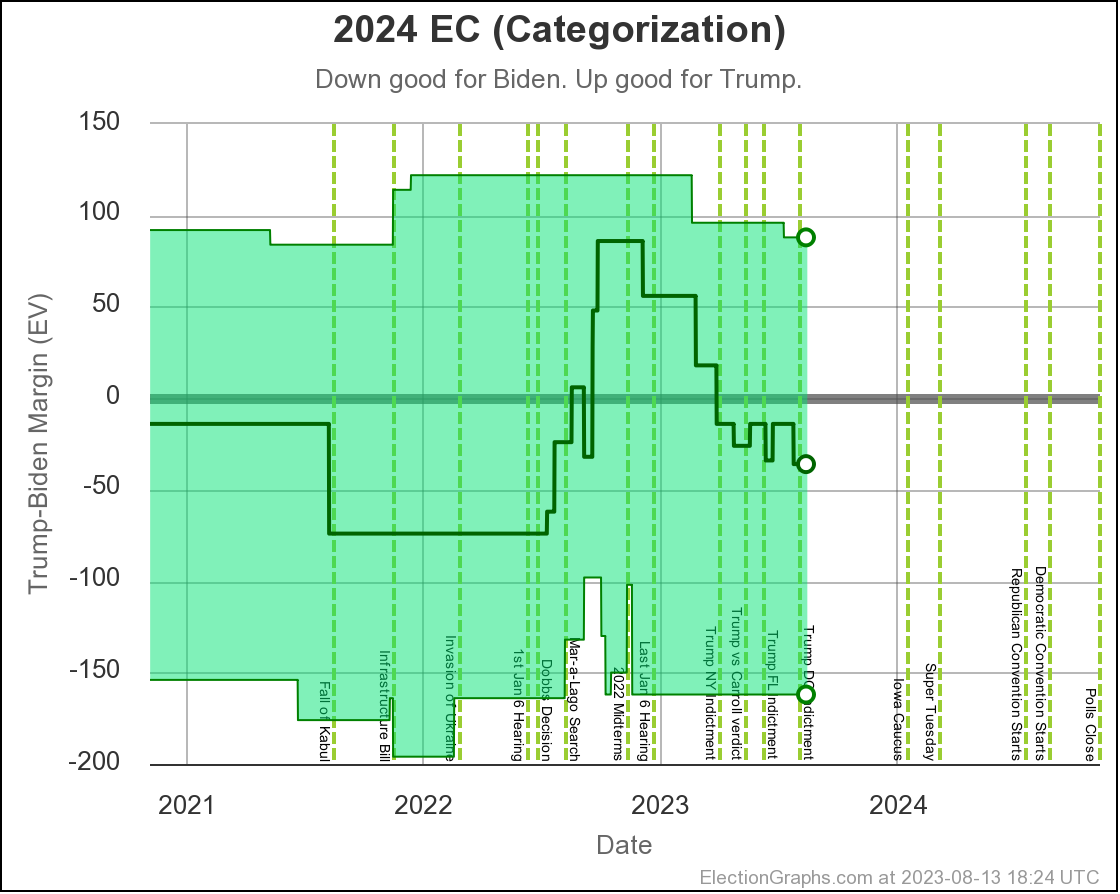
The first two are the two probabilistic views based on how correlated the state polling errors may be and taking into account how far off polls have been from the final election results in the past 4 election cycles. The third is just taking the state poll averages at face value.
But for all three the key is to not fixate on the green line in the center, but instead look at the green bands. For the probabilistic views there are graduations that don't exist in the categorization view, but in all three, there is a fair amount of green on both sides of the center line.
This means that either candidate winning is a reasonable outcome to consider, thus the summary that this race would be "too close to call" if the election was today.
It remains close. And in the last 50 days, movements have been mixed, so there isn't a clear trend either. Nobody is pulling away here.
Another way to look at the straight unmodified polls is to look at the "tipping point", which is how much you would have to shift all the polls to change the winner. It has been evolving like this:
- 2023-03-25: Trump by 0.7% in Wisconsin
- 2023-04-24: Trump by 0.5% in North Carolina
- 2023-05-21: Trump by 0.2% in Wisconsin
- 2023-06-25: Biden by 0.9% in Georgia
- 2023-08-13: Biden by 0.7% in Michigan
Just another way of showing a super close race.
Time to compare to 2020 and 2016:
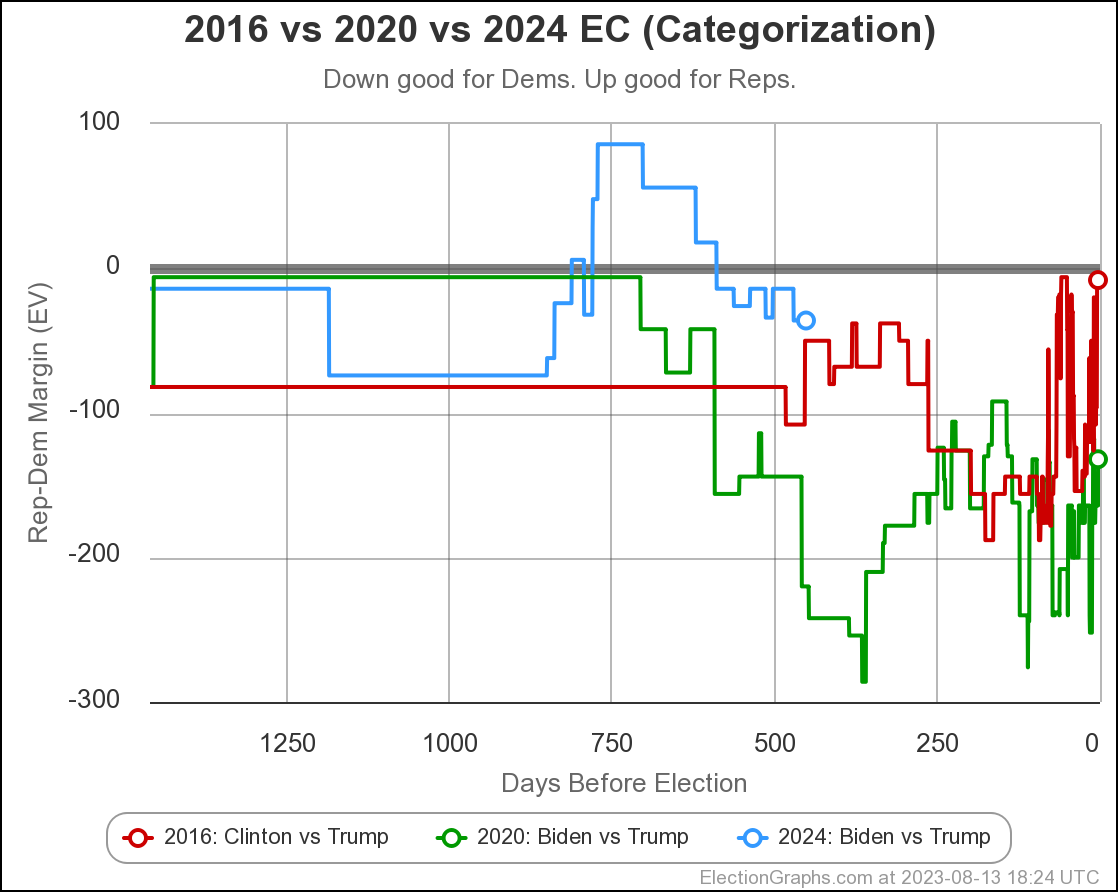
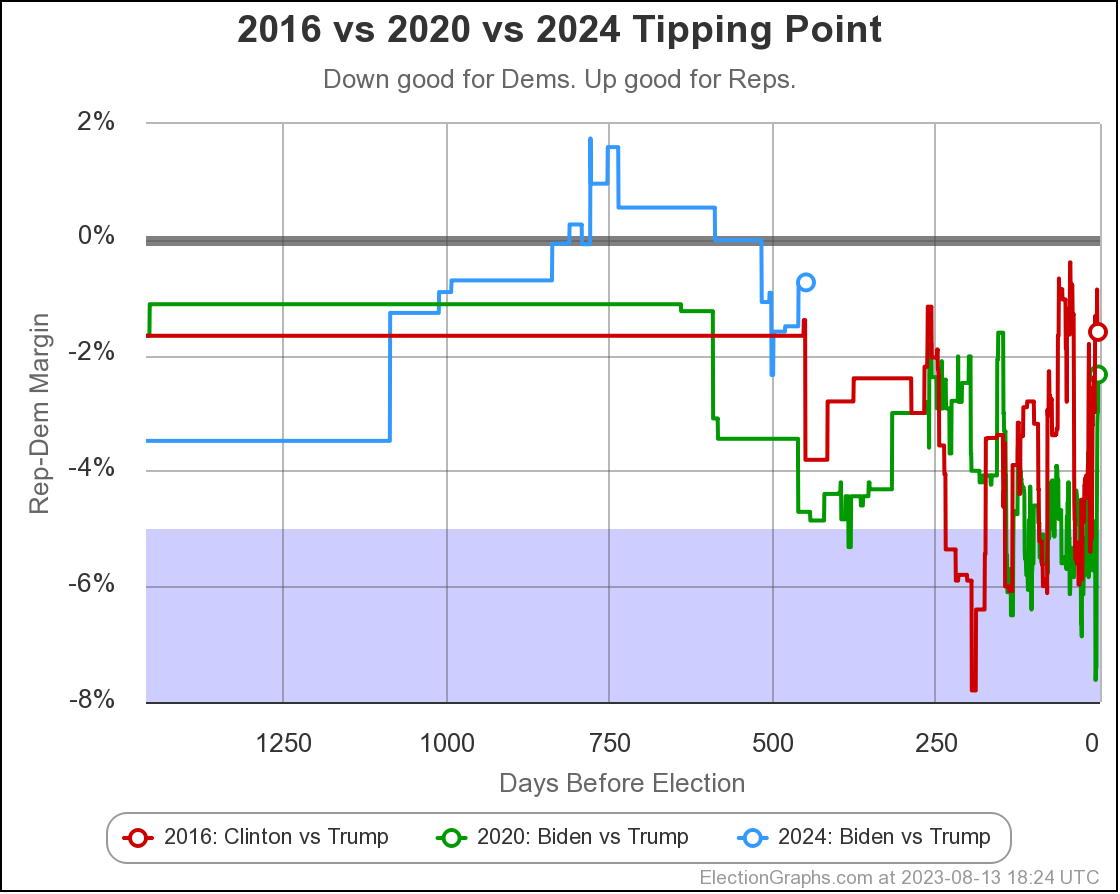
Biden still lags where Clinton was at this stage in the 2016 cycle, and is far behind where he was himself in the 2020 cycle. Given the Trump win in 2016, for Biden to be feeling good, I'd think he would AT LEAST want to be doing better in the polling than Clinton was in 2016. He is not there right now.
I have heard many folks state things like "Biden vs Trump is a rematch, Biden won last time, so he will win again" or that "surely with all his legal issues, there is no way Trump can win".
It is unwise to make these sorts of assumptions.
Well, what if Trump's legal issues (or something else) at some point cause the Republicans to give the nomination to someone else? (Yes, I know he is way ahead on that front, but what if?)
The polling for Biden vs Trump is still the only combination where there have been enough polls in the close states that I feel confident making judgements on it. Most combinations just have scattered polling, so looking at the state by state info like we do here is almost meaningless at this point.
But Biden vs DeSantis is getting closer and closer to having good polling in the close states, so lets take a look anyway.
Here is a comparison of the medians for the Independent States probabilistic view:
He may be woefully behind in the Republican Primary polling, but for the general? He does better against Biden than Trump. At least in this view. (Again, still with much more limited polling, so the picture may be incomplete.)
Looking at probabilities from both probabilistic views, the picture is a bit more muddy. While we say Biden has between a 42.9% and 44.2% chance of winning, the spread is much bigger against DeSantis. The odds are anywhere from 15.9% to 57.3%. So basically, we don't really have a good handle on this particular match up.
The reason for such a wide spread between the probabilistic views is because of the specific configuration of close states and their averages for Biden vs DeSantis. If we get to the point where I feel the Biden vs DeSantis polling is more solid, AND it looks like the chances of that matchup are increasing, AND this situation persists by then, I will of course dive into that in more detail. But not today.
For full Biden vs DeSantis info, look here.
To close up, the national map for Biden vs Trump:
450.1 days until polls start to close on Election Day 2024.