Since the last post a week ago where I laid out how things stood using just the last five presidential election results as a starting point, I've gone ahead and ingested all 214 state level presidential data points that are already out there into Election Graphs .
The main thing this tells me? Yes, it is still "super early" to look at 2024 match ups. All kinds of things will change between now and November 2024. But even last year in 2022 there was a lot going on in the polling. So maybe start earlier for the 2028 cycle. 🙂
Let me start with how things look now, then go back to how things seemed to evolve over the last year.
I will be looking specifically at the Biden vs Trump matchup.
That is by far the most polled matchup, and the only one with enough polling to even remotely be able to claim there is a good picture of what all the close states look like. Second is Biden vs DeSantis, but that lags FAR behind in polling volume. You might be able to see a few things by carefully looking at select states where there is polling, but it is hard to get a meaningful national picture. Beyond those two, other matchups only have a smattering of isolated polls, to the point it isn't even useful to look at them at all until or unless there is a lot more polling.
So where does Biden vs Trump stand right now?
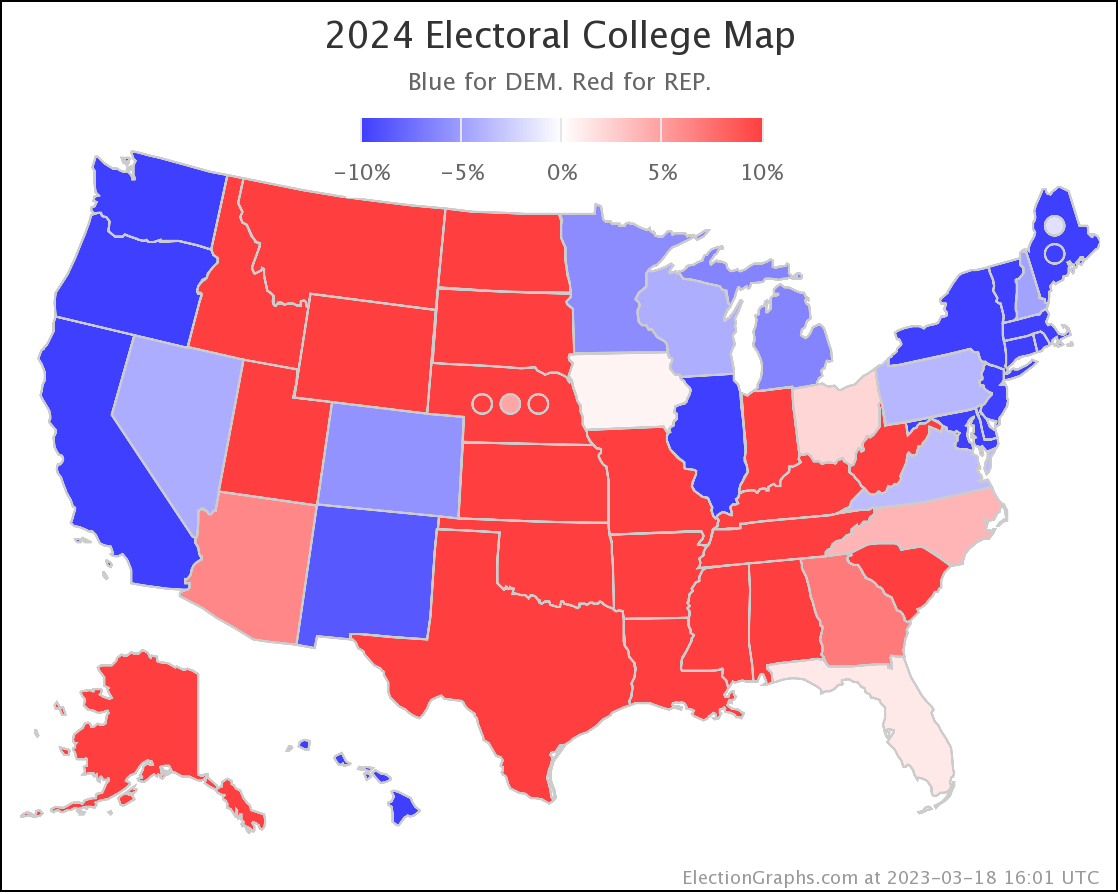
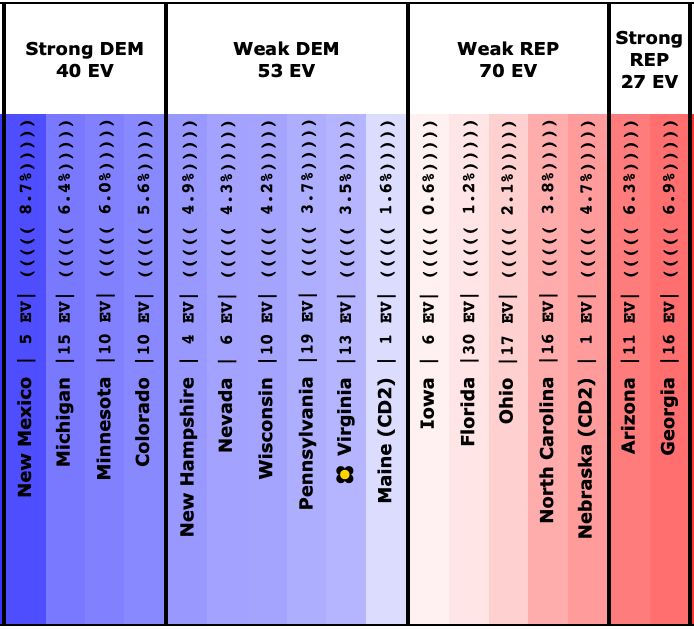
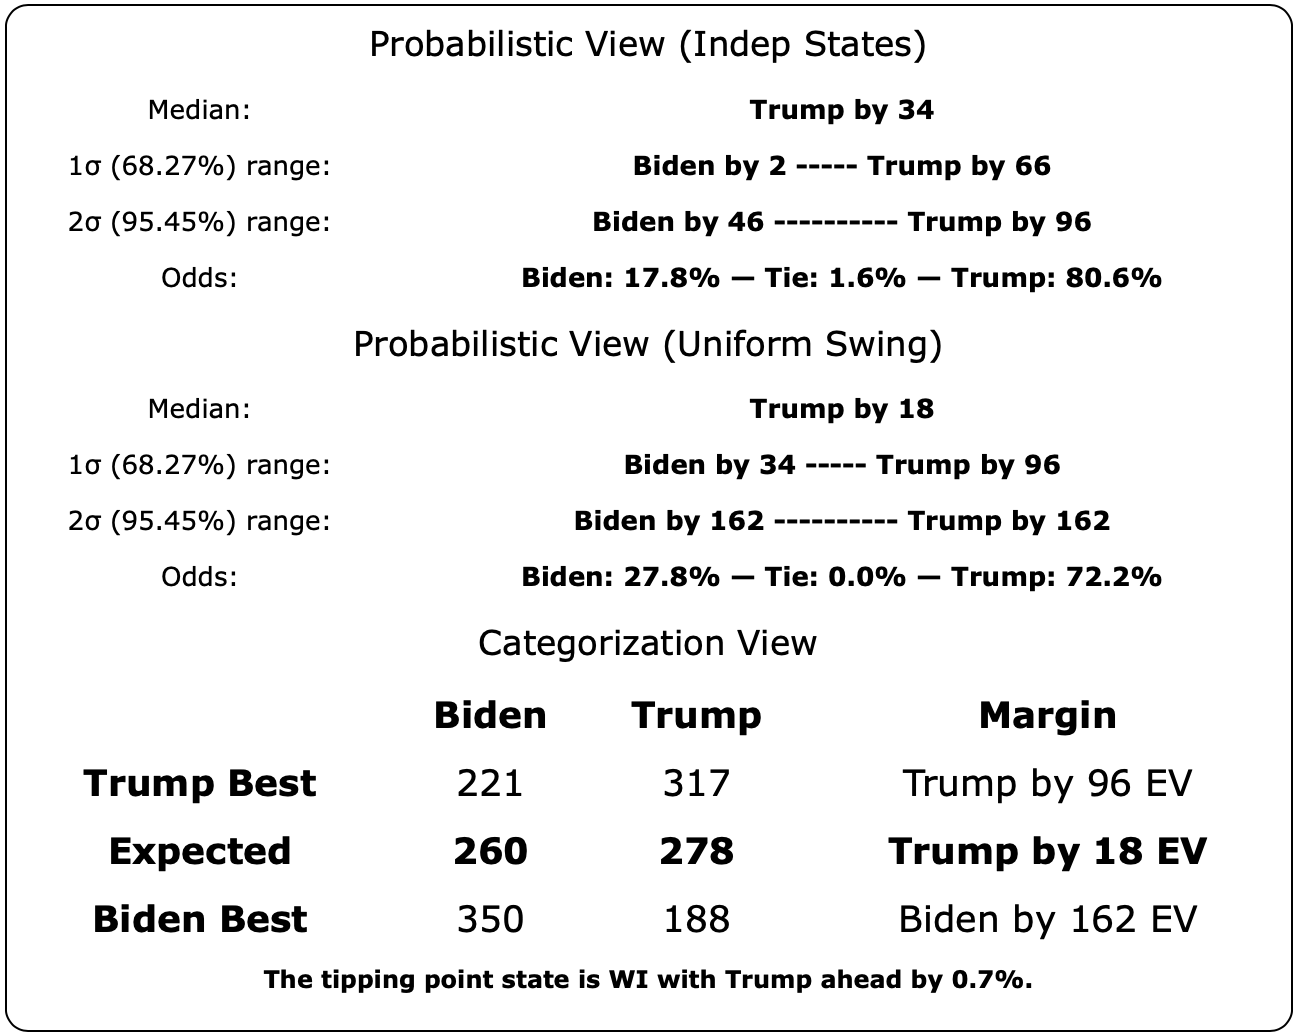
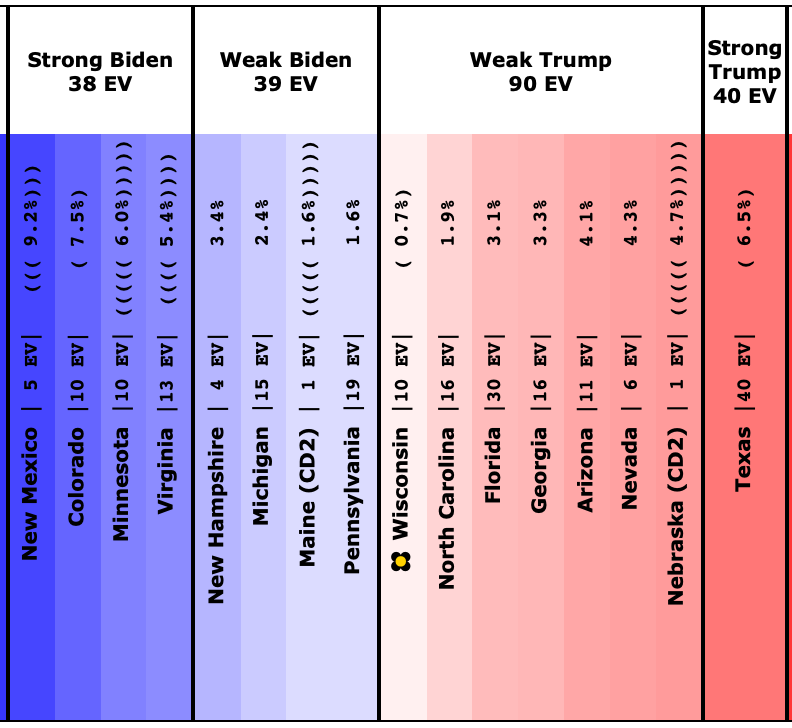
Here come the map, the summary stats, and the spectrum of the closest states:
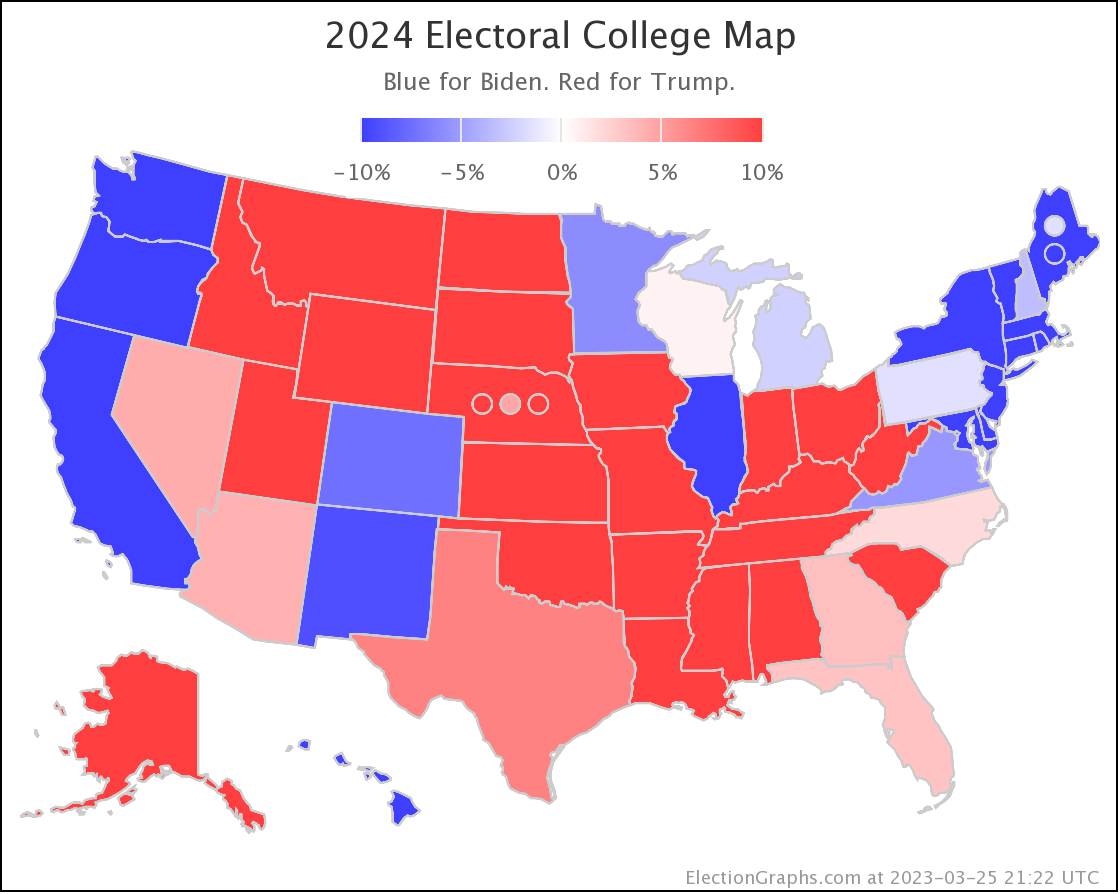
Bottom line, as of March 25th 2023, the state by state polling shows Trump with an advantage.
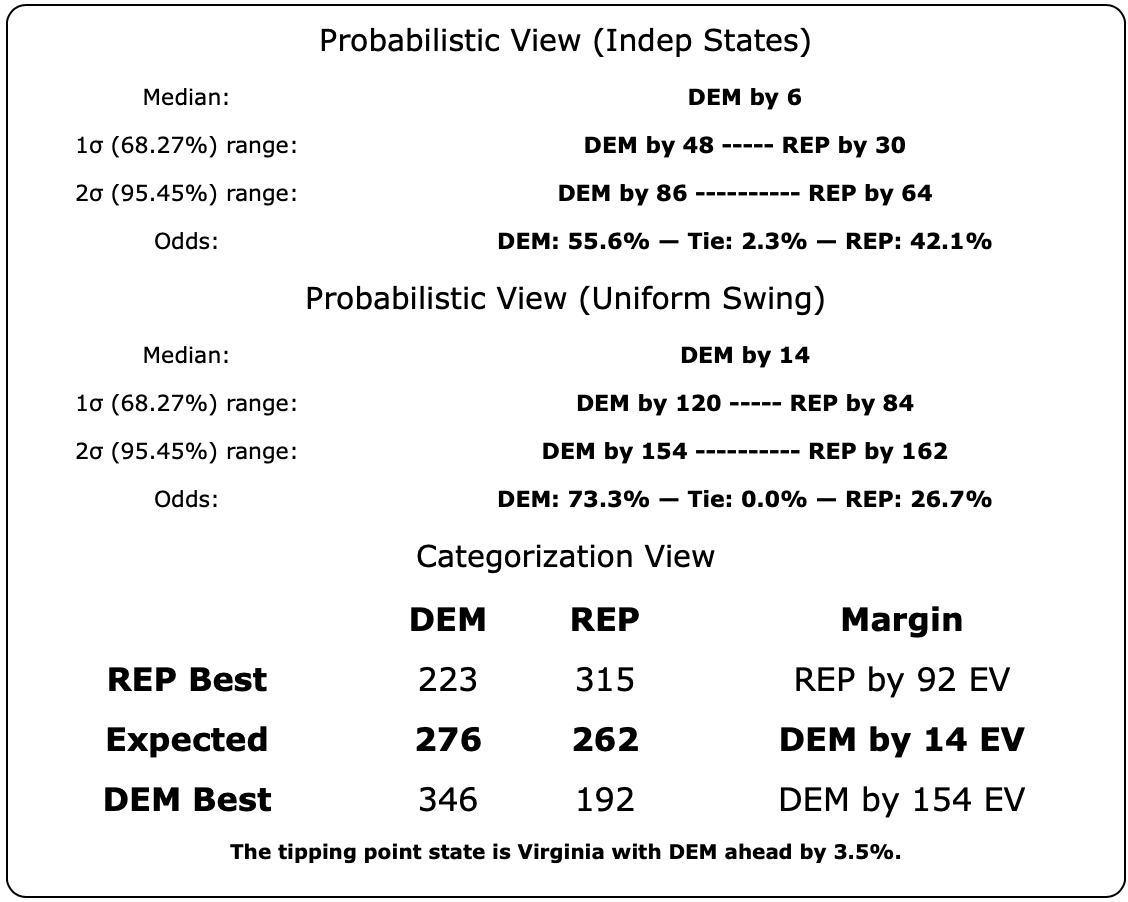
In terms of the straight up categorization view it is a slight advantage. Only one state (Wisconsin) needs to flip to put Biden in the lead, and Trump leads there by only 0.7% in my average.
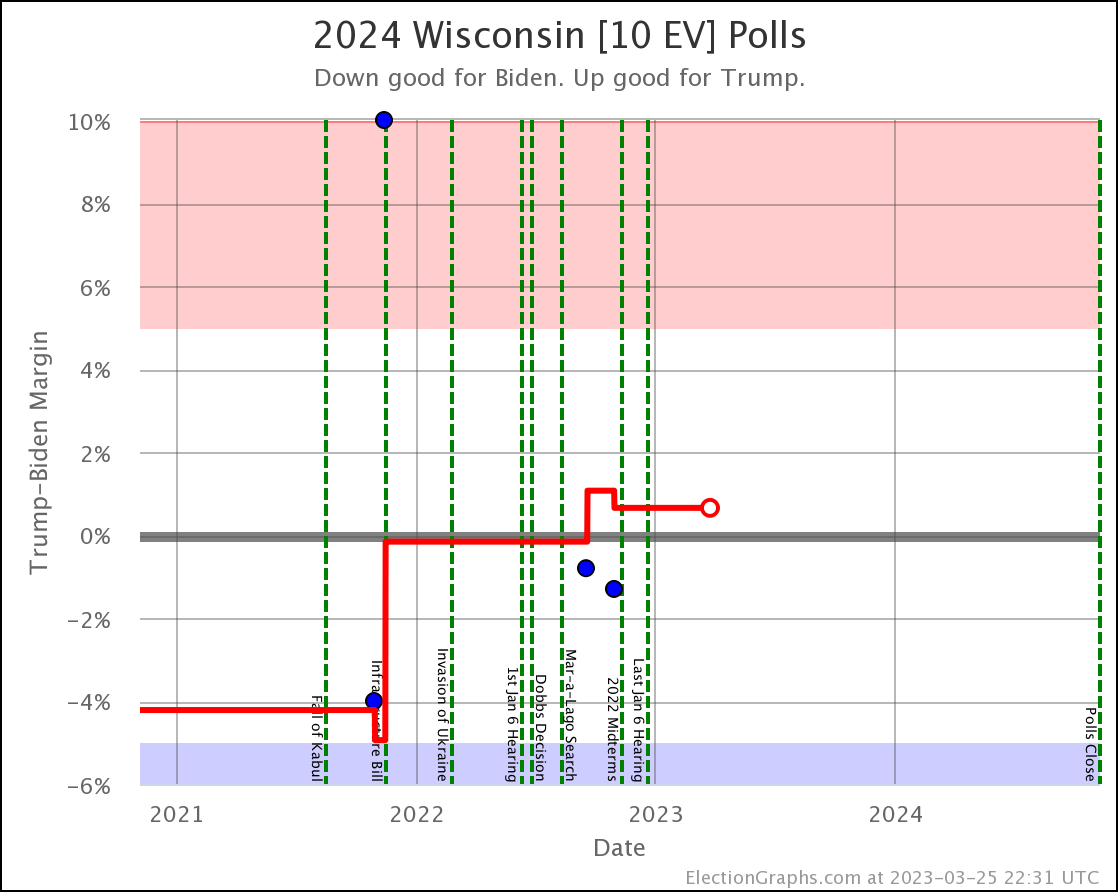
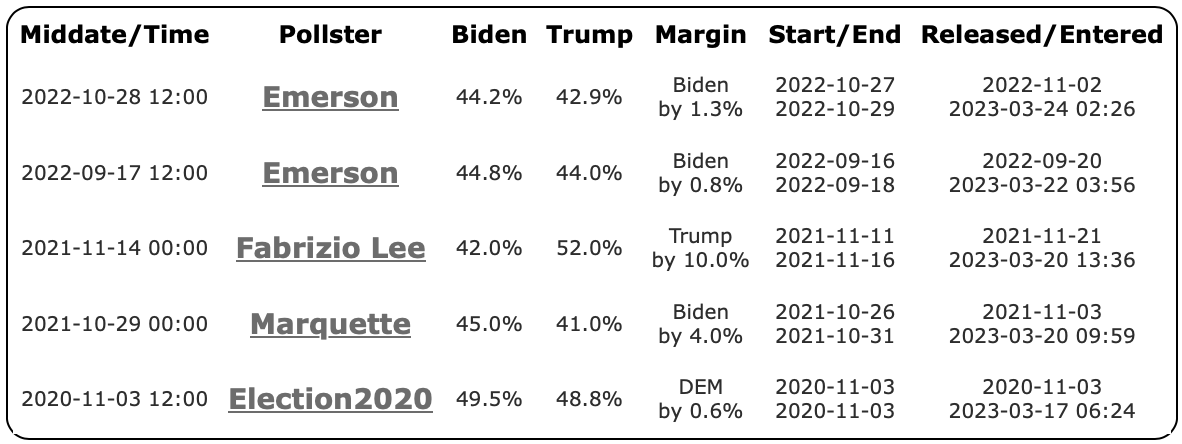
Look more carefully at Wisconsin, and you'll see that the 5 poll average contains 4 actual 2024 polls but still includes the 2020 result (Dem+0.6%), one of the 4 polls looks like it may be an outlier to the Republican side, showing a full 10% Trump lead where all the others show a close race.
So this Trump lead looks pretty tenuous.
At the moment though, our two probabilistic views show this translating into pretty good odds for Trump. 72.2% chance of winning with the Uniform Swing view, and up to 80.6% with the Independent States view. The "true" odds are somewhere between these two depending on how strongly polling errors end up correlating between states.
Why is this the case if the straight up polling gives us a very slight Trump lead?
Mainly because of what I outlined in my January post about the math behind how I calculate those probabilities. To summarize, looking at all the final Election Graphs averages from 2008 to 2020 in aggregate as they compared to the actual election results, for the Democratic candidate to have more than a 50/50 shot at winning, being ahead in the polls is not good enough. They have to have more than a 1.2% lead.
So some of those states where Biden is showing a 1%-4% lead are really pretty uncertain, where some of the states Trump is leading by the same margin are more safe than they seem.
Well, at least that is what you get by averaging out the poll errors covering the last four presidential election cycles. As covered in that previous post, each of those four cycles actually looked pretty different in terms of how the errors played out. We have no idea what the 2024 errors will look like. But starting with the range of errors over the last few cycles and the variability between those cycles is as good a guess as we have.
Also, everything on Election Graphs is "if the election was today". The election is not today, and lots and lots will happen between now and then. EG does not provide a forecast. We show how things look right now.
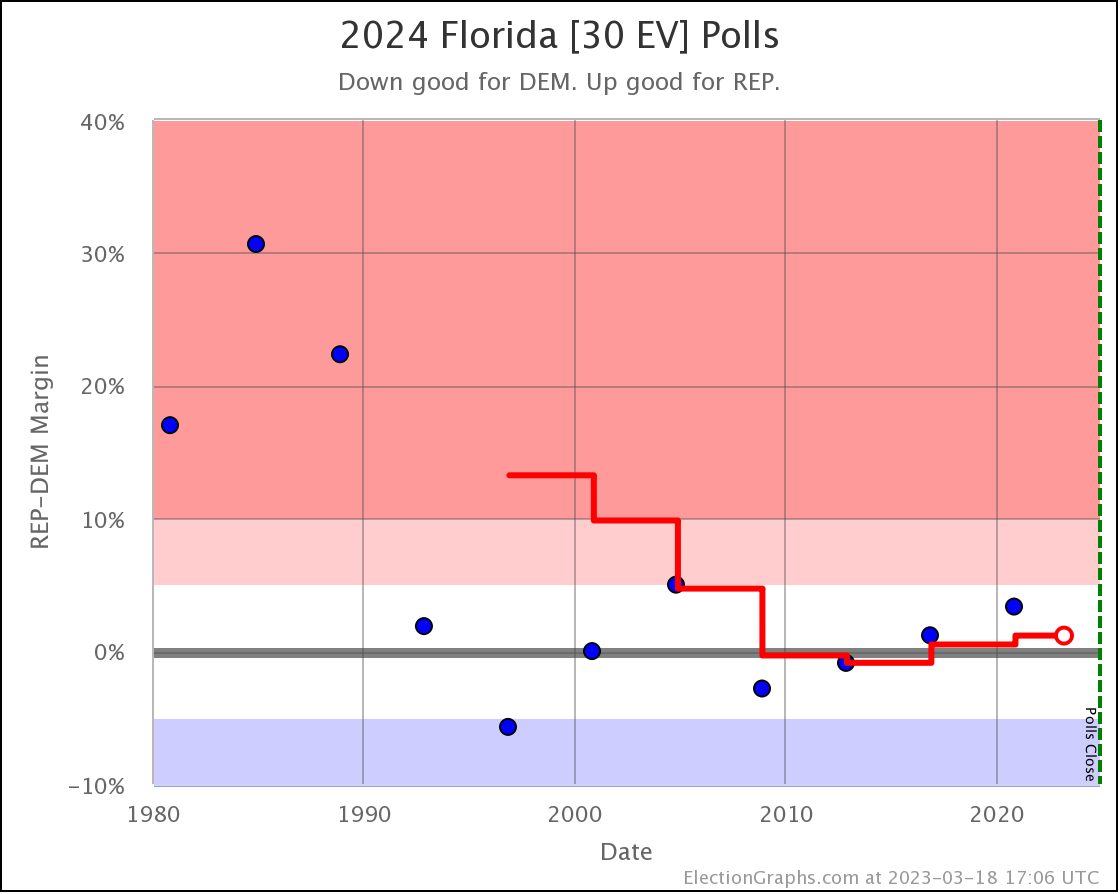
With the status above, you would say that team Biden needs to work hard at shoring up Pennsylvania, Michigan, and New Hampshire where he barely leads, and start pushing hard on the barely red states like Wisconsin. And not to take for granted Georgia, Arizona, and Nevada, which even though Biden won them in 2020, right now are looking red. And Florida may not be as far out of reach as it seems, so maybe don't ignore it.
Looking from the opposite direction, Trump should be playing some defense in those barely red states because they could easily slip away if he doesn't, and he should be going hard after Pennsylvania and Michigan. Etc.
Some of this is all pretty obvious. We have most of the same "swing states" that we have had for the last few election cycles. And both candidates will end up concentrating their efforts there and pretty much ignoring the rest of the country. Because that is how races look under an electoral college system.
Now, let's look at how things have evolved over the last year. you can see a variety of different views of this evolution on the 2024 Electoral College page. For now though, I'll look at the Electoral College Margin chart for the Probabilistic Independent States view. It is one of the two extremes I show for the probabilistic views, specifically one that assumes the polling errors between states are completely independent, which to be clear, we know they are not. But this view is the most dynamic in terms of how it changes with new polls, so is nice for showing how the overall race trends over time:
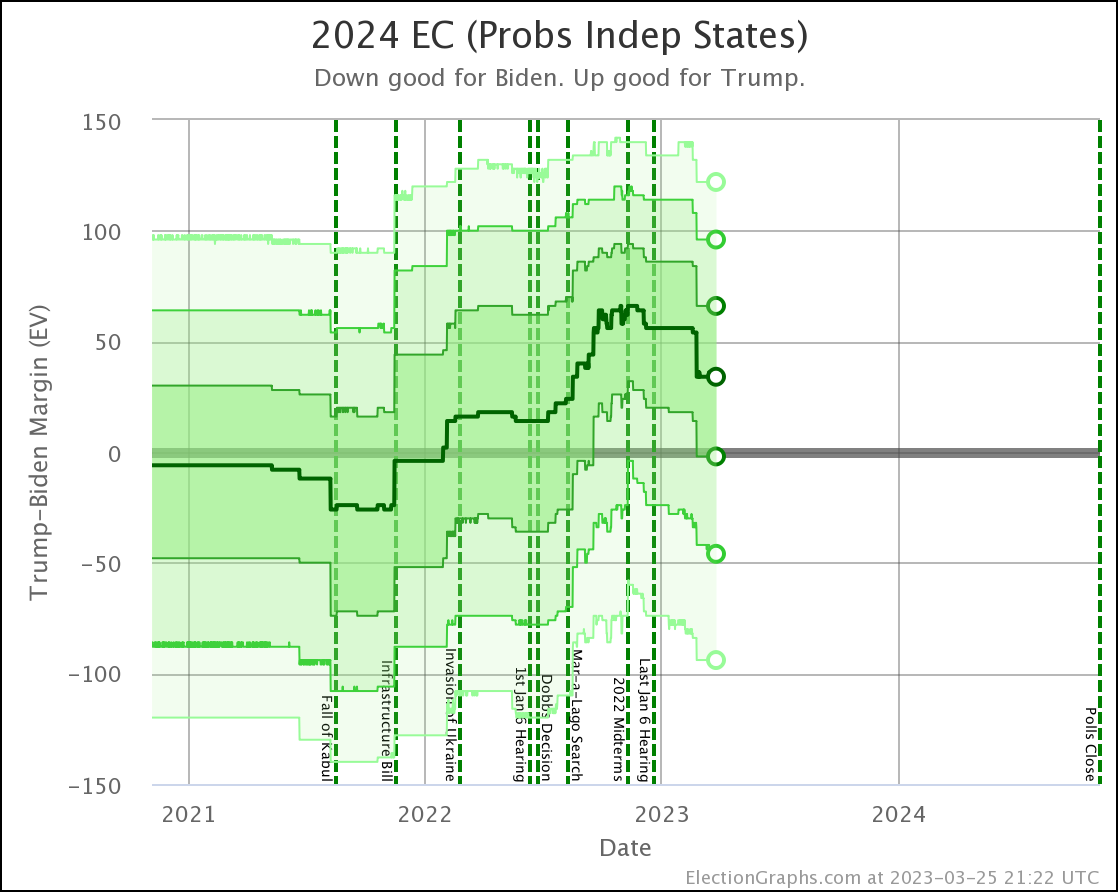
First just an explanation of the graph. The vertical axis is the Trump minus Biden margin in the electoral college. So if it is positive, that means Trump wins, if it is negative that means Biden wins. The dark green line is the median result in Monte Carlo simulations based on the state averages and the probabilities we described in January. The three bands of color are the ranges of outcomes in the 1σ (68.27%), 2σ (95.45%), and 3σ (99.73%) bands. So, roughly, the closer to the center line of this you are, the more likely that outcome, and as the green gets lighter, the less likely that outcome.
At the far left of the chart the ranges shown are just representing the "last five elections" average I posted about last week. Over the course of 2021 and 2022 the averages in the close states slowly filled in with real 2024 polls, pushing the old elections out of the average. As such, it is hard to tell how much of the "movement" seen above prior to 2023 is actually driven by changes in public opinion versus just the averages filling out. By late 2022 though, most of the close states had five or more actual 2024 polls, and we can start to interpret movement as actual changes in the status of the race.
Ignore the jagged ups and down at small scale, and at a very broad level this tells a story of either Biden weakening and Trump strengthening over the course of 2022, OR just the polling catching up to that position after showing a bluer version of things by starting with the 2004 to 2020 averages. Either way though, the trend toward Trump peaked toward the end of 2022. In fact the peak occurs very close to the 2020 midterms in November.
For the moment anyway, that seems to be the moment where things started to go the other way directionally, and started heading in Biden's direction.
To be clear though, Biden is still behind. All three of the views provided by Election Graphs show Trump in the lead at the moment. But more narrowly than he was right before the midterms.
At the moment things point to another close nail biter of a race, just like 2016 and 2020. The picture we see right now shows a race that could very easily go either way if the election was today, let alone allowing for all the things that could happen over the course of more than a year and a half.
Biden hasn't even officially announced his candidacy yet. We don't know if Trump will be indicted, and if he is, if that will help him or hurt him. We don't know if others like DeSantis will officially run, and how they will do. And who knows, one or both of the front runners could end up having health issues that impact their ability to run. You never know. Plus all the normal back and forth of national and international events.
We have a long way to go.
Specifically, we have 591.0 days until the first polls start to close on Election Day 2024.
Keep checking back here for updates on how things evolve!
Oh, and if you want to see all the notifications for new polls as they get entered, and the status changes those trigger, as well as daily summary stats of the overall situation, follow Election Graphs on Mastodon too: @ElectionGraphs@newsie.social.
[Edit 2023-03-25 23:42 – Slight wording change.]