
Welp, here is the big moment. I have just opened up the 2024 Electoral College section of the site. No actual 2024 polls are reflected yet. That will come over the next few days.
It may still be 598.2 days until polls start closing on the Election 2024 cycle, but believe it or not there have already been quite a few state level 2024 polls. I'll start getting those into the system shortly.
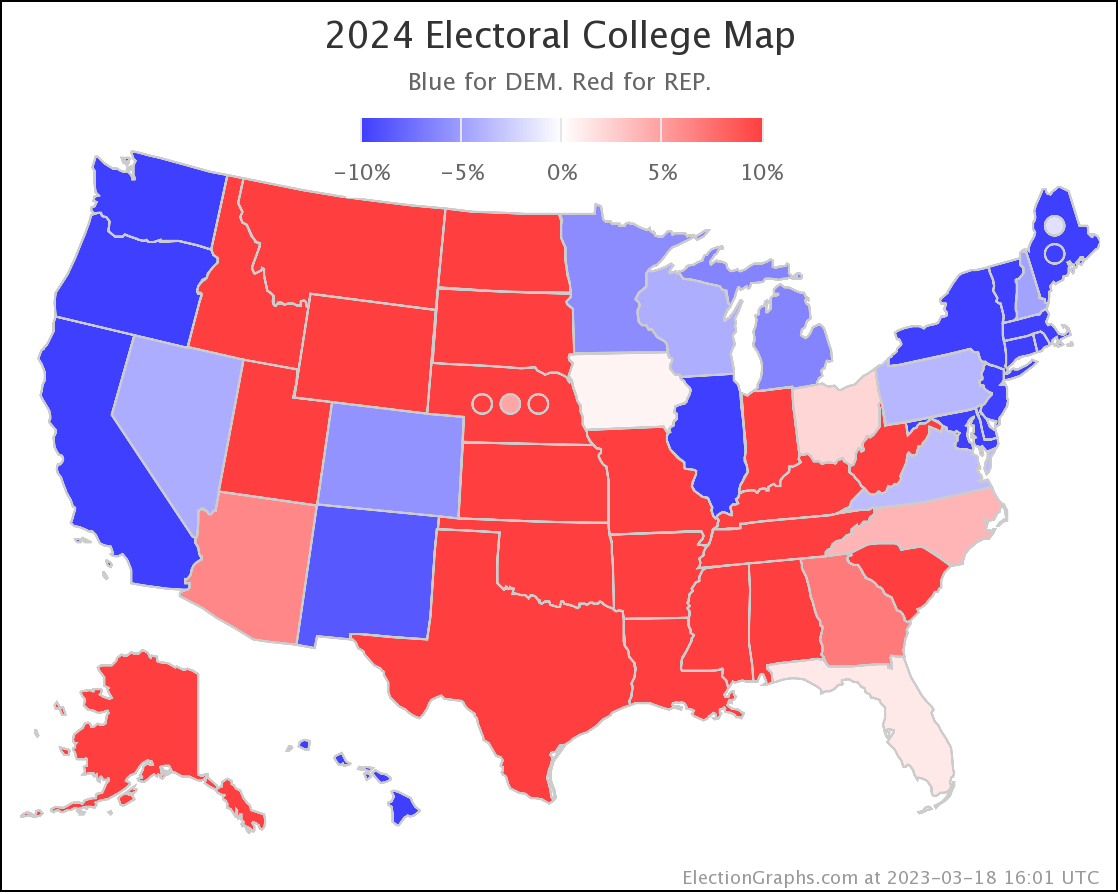
But first, Election Graphs has always used an average of the last five election results as the "baseline" when polls aren't available in a state. So the traditional "so it begins" marker for Election Graphs has been the electoral map using the average of the last five elections for all 50 states, DC, and the ME/NE congressional districts.
So here we go…
Some folks might argue that a better baseline would just be the 2020 results. After all, five elections means averaging out the results from 2004 to 2020. The world of 2004 does not really resemble the world of 2024. That was almost 20 years ago!
There is definitely a point to that. But we're basically just looking for a starting baseline here.
All the states that are remotely close will get real 2024 polls relatively quickly, certainly before we really get into the thick of the 2024 campaigns. So we will get a sense of if states that have seemed to be trending in one direction or the other over those 20 years will continue that trend, or revert to the mean a bit.
Meanwhile, the states that have booked 20 straight years of massive wins for one party or the other may get polled less and take longer to fill out with real 2024 polls, but they are also much less likely to end up being competitive. It would take an upheaval of almost unimaginable proportions for Wyoming and Oklahoma to turn blue, or for DC and Hawaii to turn red.
Based on the five election average, the "battleground" as we start this cycle is made up of all the usual suspects:
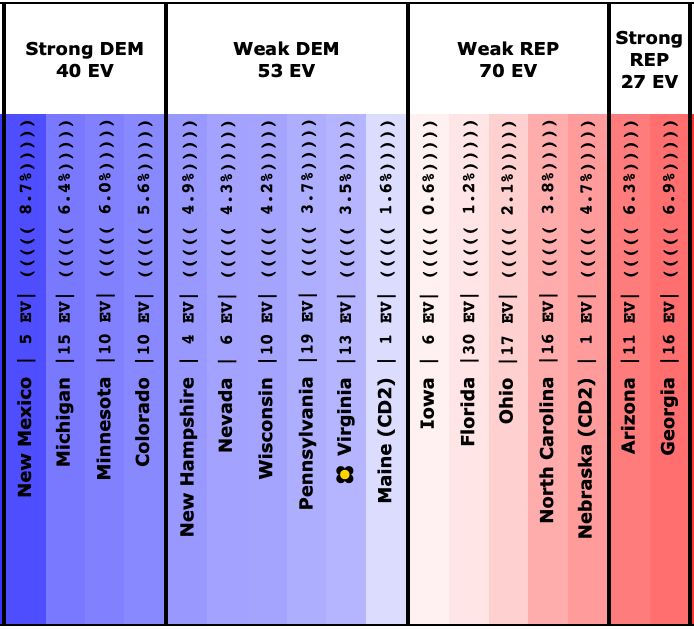
These are all the states (and ME/NE congressional districts) where the five election average gives a margin of less than 10% for the leading party.
Immediate standouts are Arizona and Georgia, which over five elections, still are tinted pretty strongly red. One of the questions new polling will answer is if the Democratic wins in these states in 2020 were flukes, or if these should truly be closer to the center of the block above as true swing states for 2024.
Similarly, in the five election average Ohio and Florida are red but not by a lot. They look like they could be in contention. Democrats won both states in two of the last five elections. But in both 2016 and 2020 Ohio actually turned out much redder. And Florida seems to be on a trend toward the red as well, although not quite as dramatically as Ohio in 2020. Will these states go even further red? Or go back to being swingy states? Iowa is in the same boat. Just smaller.
Election Graphs shows you charts for individual states. Just as an example, here is Florida since 1980.
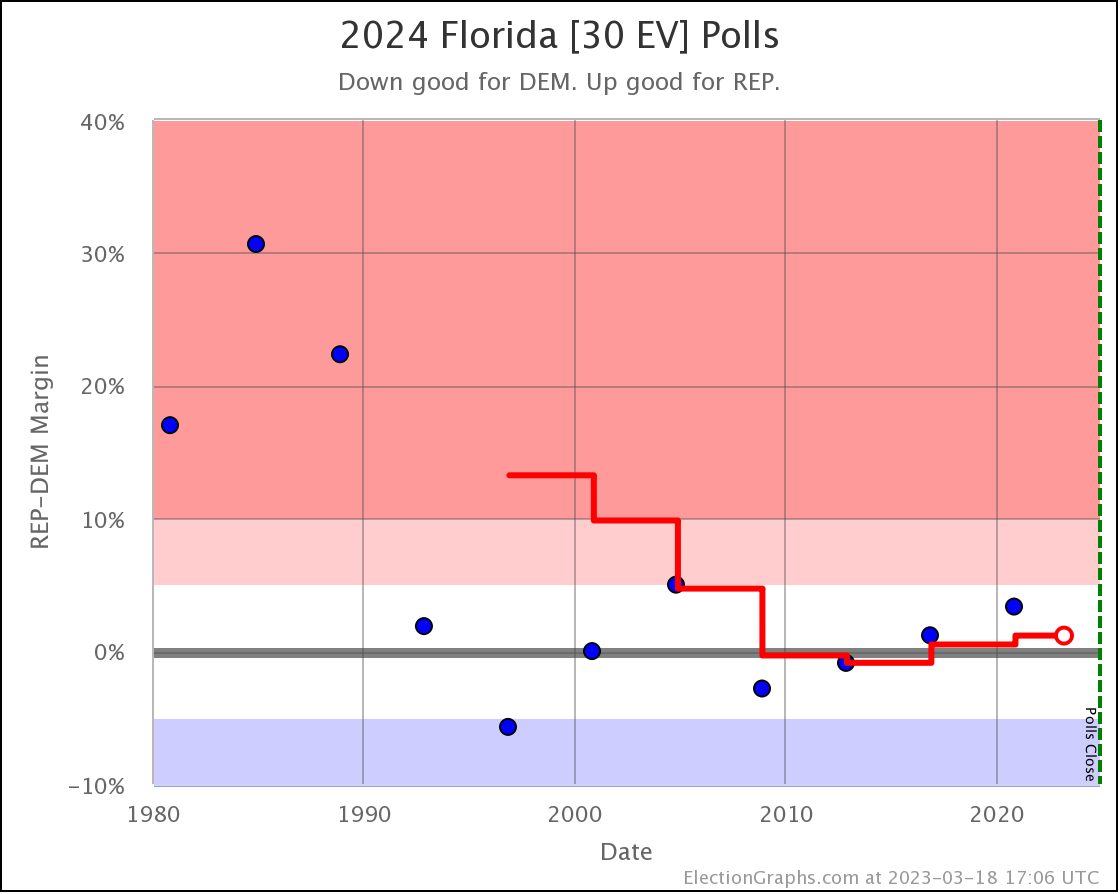
We usually won't look at that much history as actual 2024 polls start to come in. But you can see the individual election results, and how the five election average has evolved over time.
OK, so what does all this mean in terms of who has the advantage as we start this. Well, we are dealing with a five election average, and Democrats have won three of those five elections, so you would expect them to start with a little advantage given how we defined the starting line, and you would be right:
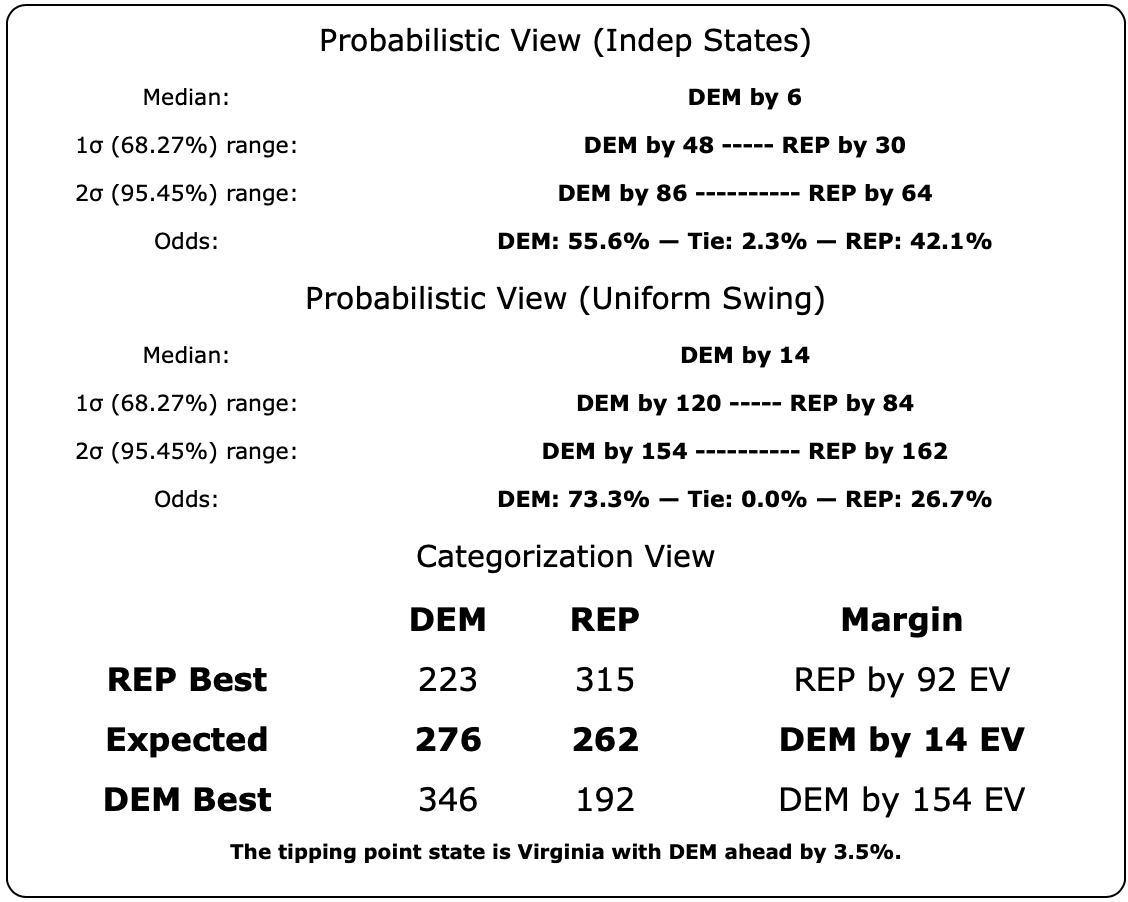
This shows my traditional "Categorization View" which just takes the averages at face value and gives an expected view where every state falls with the average, and best cases for each party assuming they win all of the "weak" states (where the margin is under 5%).
And what do we have? Democrats with a very narrow lead, with the range of outcomes based on the close states falling one way or the other including victories by both parties.
Also above are the two probabilistic views representing the extremes of how correlated poll errors are between states (completely independent to completely in lock step). These are based on looking at how far off the FINAL Election Graphs averages were from the actual election results from 2008 to 2020. See my last blog post for details.
Anyway, both of these also show a close race with a slight Democratic lead that could easily go either way, with Democratic win odds somewhere between 55.6% and 73.3%. Which leaves Republican win odds between 26.7% and 42.1%. Odds of a 269/269 tie are somewhere under 2.3%.
Keep in mind that Election Graphs does a "nowcast". That's "if the election was held today", which obviously it isn't. And we don't even have real 2024 polls in there yet. So this is even less of an actual prediction for 2024. This is just a starting point. A default look at the playing field before the game actually starts.
I'll be catching up with the actual state level 2024 polls we have over the next few days.
So here we go… Election Graphs 2024 has begun!
598.2 days until polls start to close.
Buckle up.
[Edited 2023-03-19 17:53 to correct the number of days until the election as of the time of the post, which I'd made a math error on.]
[Edited 2023-03-20 01:03 to uncorrect the number of days until the election, because I was actually right the first time, plus to correct the numbers in the probabilistic numbers, because I found an error there as well. Specifically, the Monte Carlo simulation was still using the 2020 electoral college distribution which because of the census was changed for 2024. Fixed now.]
[Edited 2023-03-21 05:55 UTC to correct a typo in the last note above.]