Since the last update on April 7th, there have been new state-level polls in Utah, Michigan, Wisconsin, Connecticut, Virginia, Arizona, North Carolina, Florida, Indiana, Washington, and Mississippi.
Also, since the last update, Sanders dropped out. As I mentioned in that post, that is my trigger for all future updates to simply be about the presumptive nominees, Biden and Trump.
I will allow myself one final note about Sanders. There were a handful of polls on Sanders vs. Trump after the last post. They just continued to make things worse for Sanders. Unless something strange happens, there will be no more Sanders vs. Trump polls.
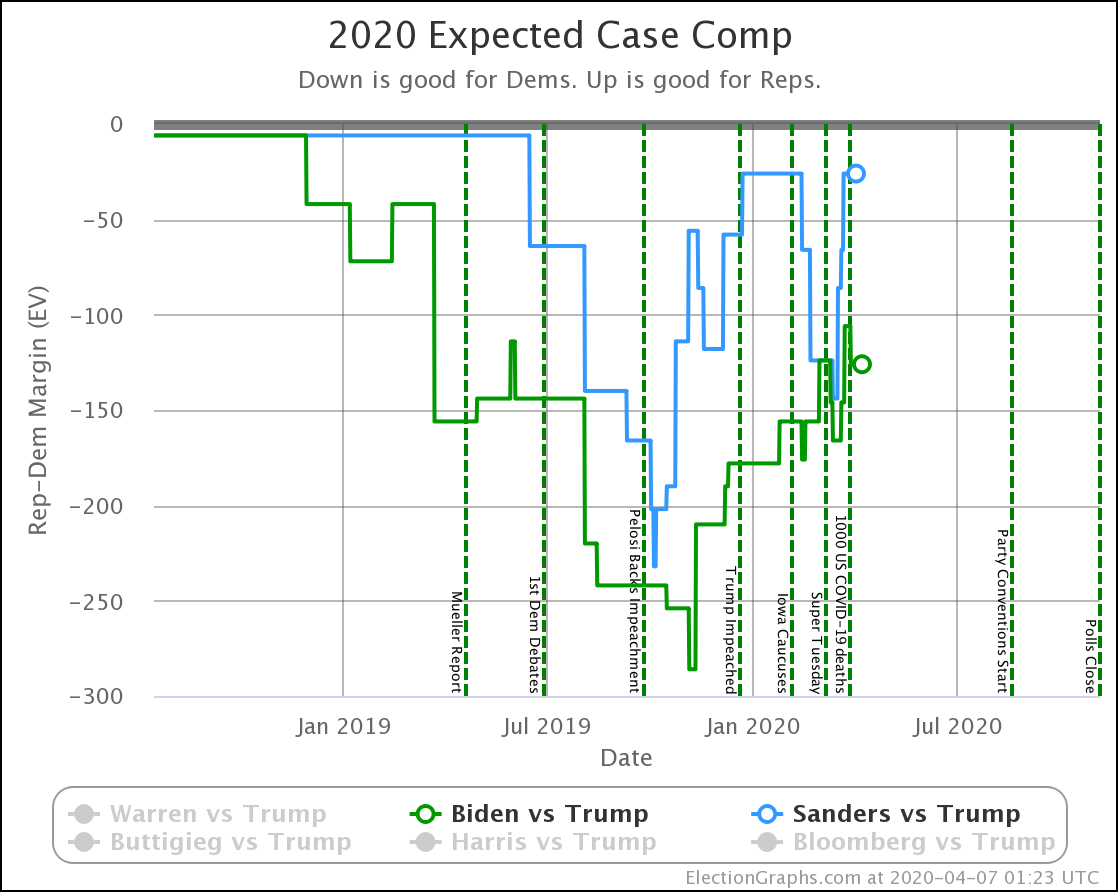
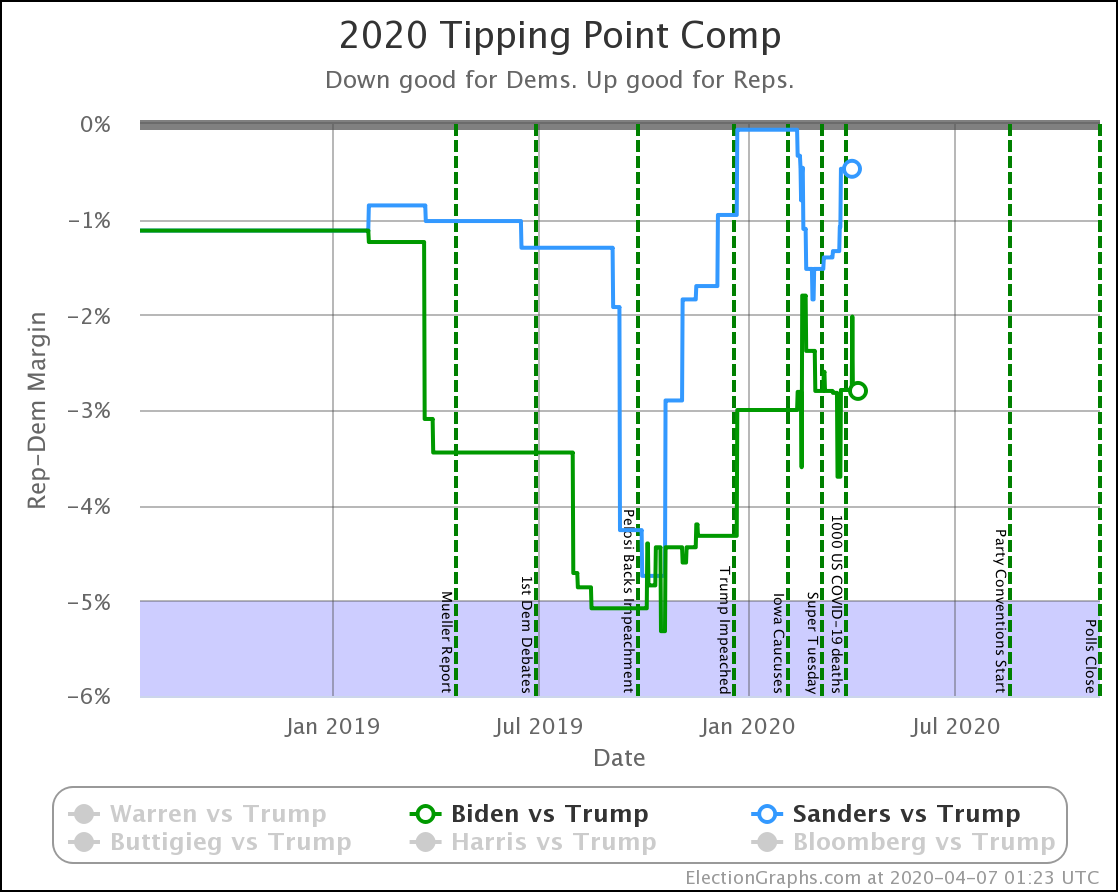
His final position in the Election Graphs categorization model "expected case" was a four electoral vote loss to Trump with a 1.1% tipping point margin.
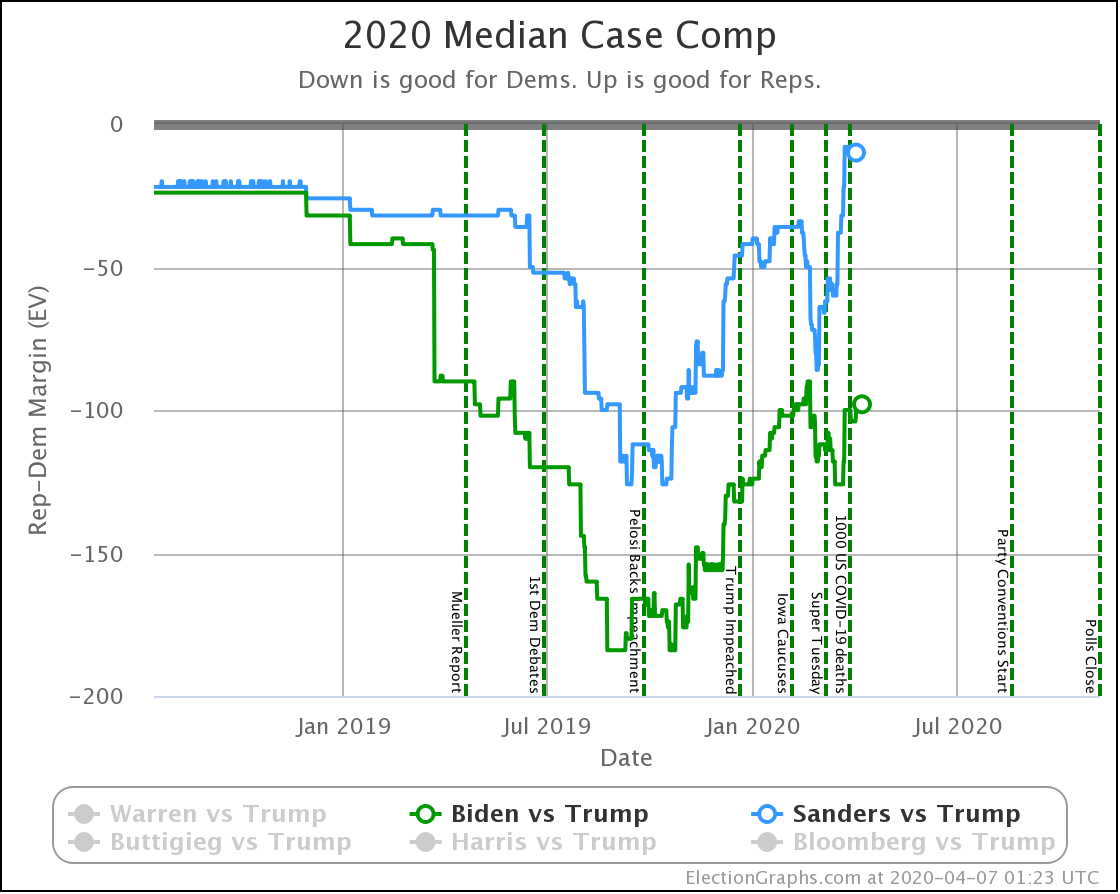
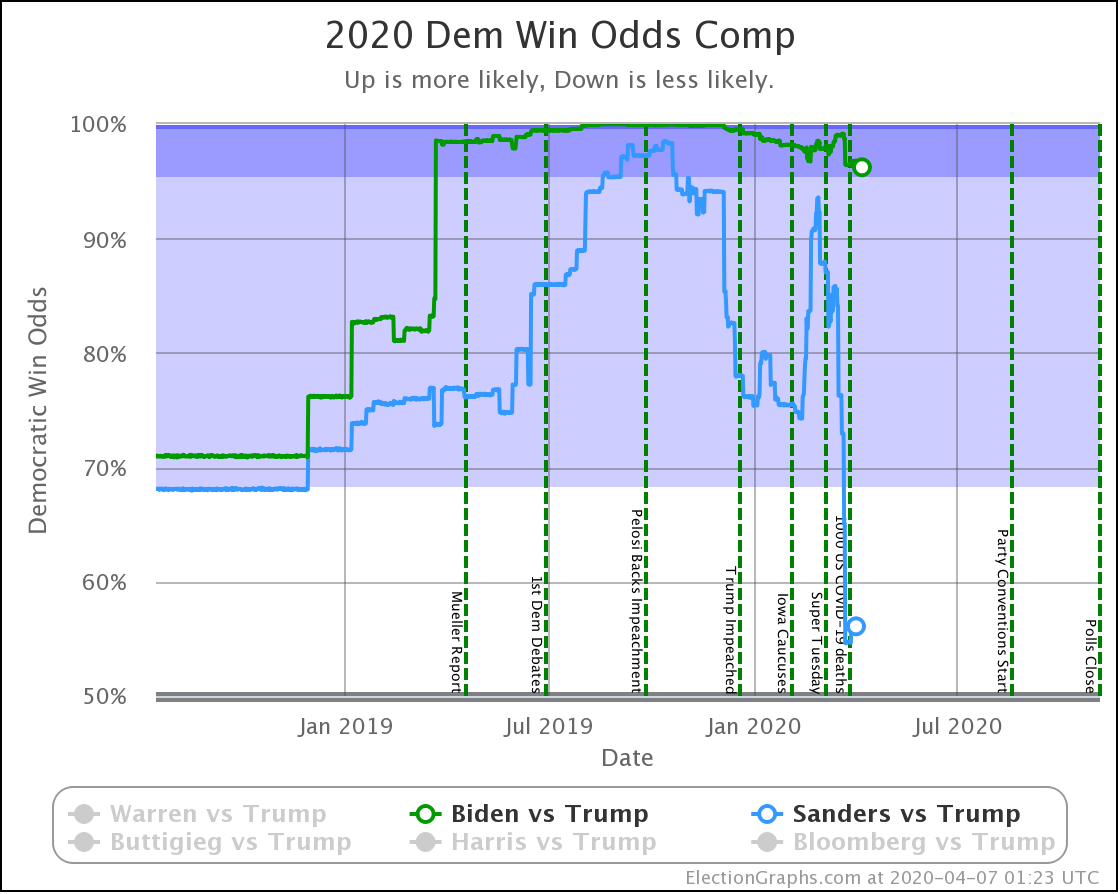
The "median case" in the probabilistic model was a 269-269 tie. The odds in that model were a 50.0% chance of a Trump win, a 48.5% chance of a Sanders win, and a 1.6% chance of that tie.
So that's that for Sanders.
Now time to talk Biden vs. Trump.
Things have gotten worse for Biden too.
Let's start with a new table comparing where we were at the last blog post compared to today:
| Model | Metric | 7 Apr | 22 Apr | 𝚫 |
| Categories | Trump Best Expected Biden Best |
Trump +94 Biden +126 Biden +286 |
Trump +72 Biden +126 Biden +286 |
Biden +22 Flat Flat |
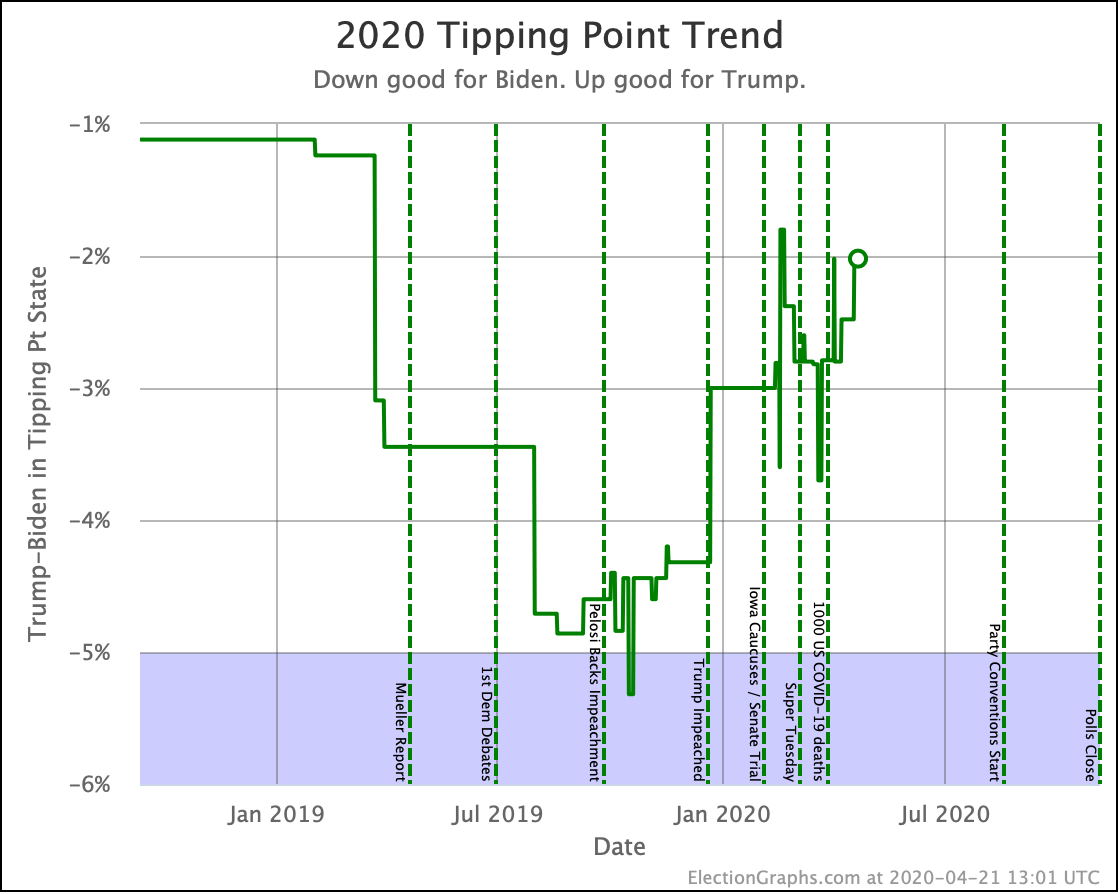
| Tipping Point | Biden +2.8% | Biden +2.0% | Trump +0.8% | |
| Probabilities | Trump 2σ Median Biden 2σ |
Trump +10 Biden +98 Biden +216 |
Trump +26 Biden +80 Biden +204 |
Trump +16 Trump +18 Trump +12 |
| Trump Win Tie Biden Win |
3.4% 0.3% 96.3% |
6.5% 0.5% 93.0% |
-3.3% +0.2% +3.1% |
There are a lot of numbers there. When we were comparing candidates, we were only looking at four of these.
The additions here are:
- The "best cases" in the categorization view, where we give all the states where the margin is less than 5% to one candidate or the other
- The "2σ" limits containing 95.45% of the results in our probabilistic Monte Carlo simulation
- The breakouts of the Trump win and tie odds as well as the Biden win odds
Including both the old metrics and the new ones, this time around all but one (Trump's best case in the categorization view) move toward Trump.
Time for some graphs.
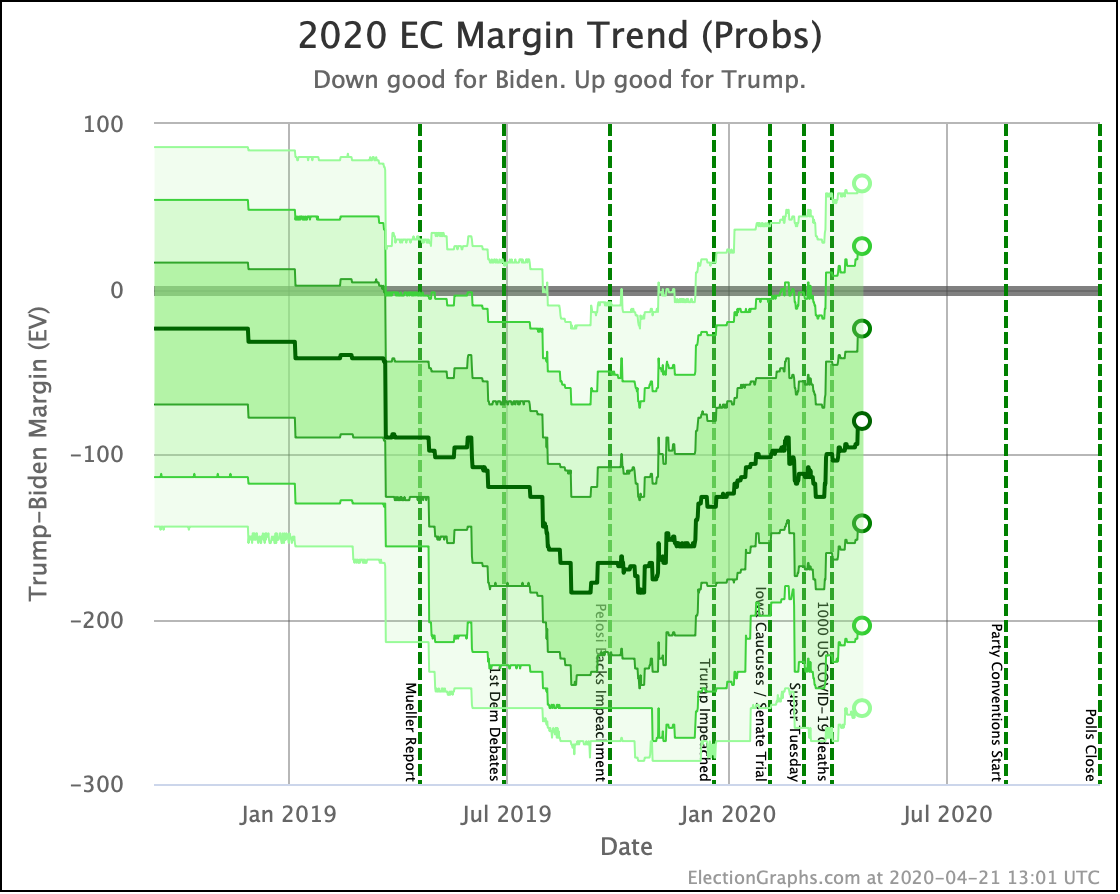
This is the graph I look at the most. This shows the results of the probabilistic Monte Carlo simulations. The dark line is the median result, where half the time Biden does better, and half the time Trump does better. The darkest center band contains 1σ (68.27%) of the simulation outcomes. The next band contains 2σ (95.45%) of the outcomes, and the lightest band contains 3σ (99.73%) of the outcomes.
From mid-February to mid-March things were moving in Biden's direction for the first time in many months. But then that reversed and things started moving in Trump's direction again. This does seem to roughly coincide with when the COVID-19 pandemic really started to dominate public discussion. So perhaps this is a "crisis bump".
Whatever the cause, Trump is in his best position relative to Biden in over a year.
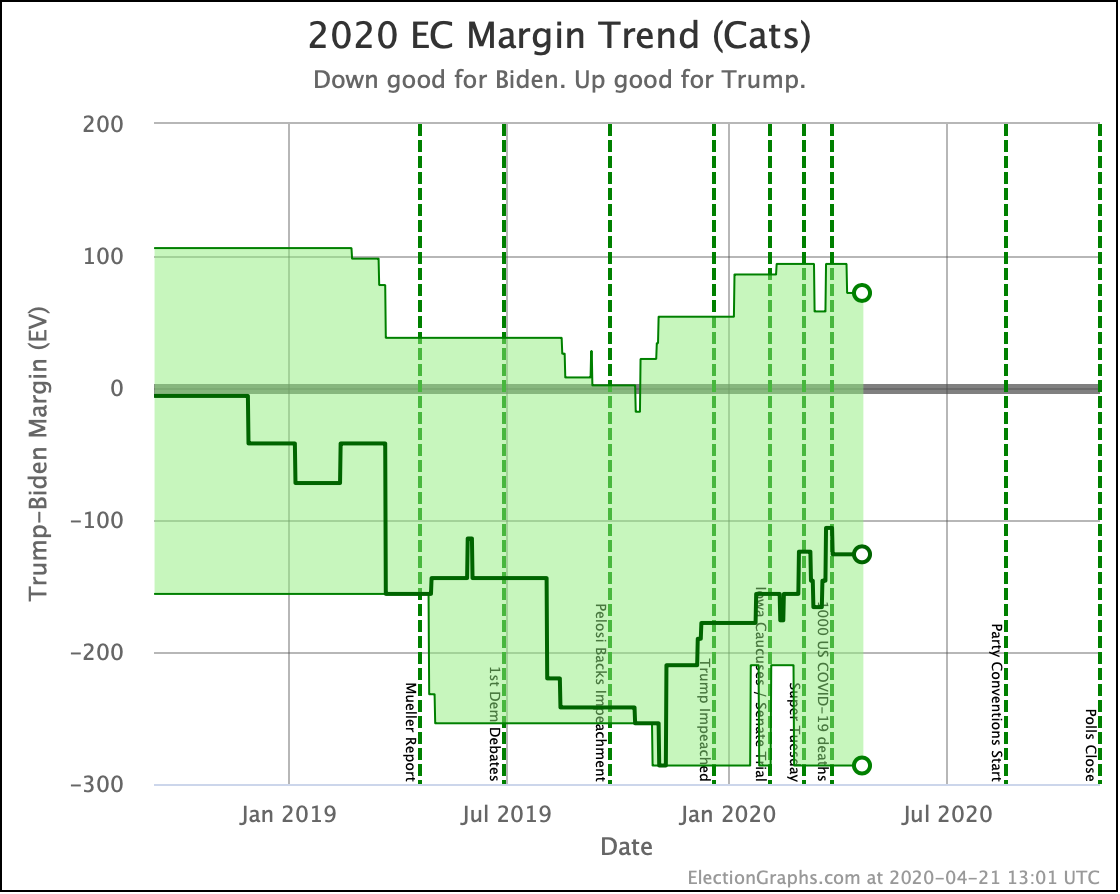
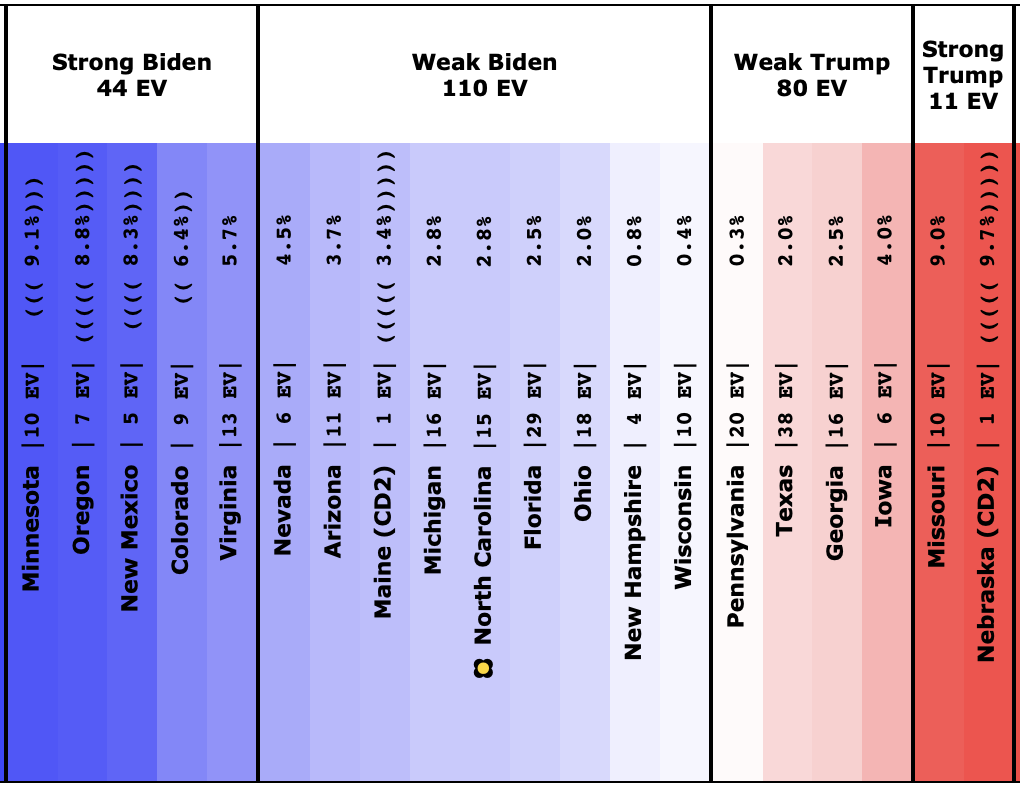
This move toward Trump in the last month is not as evident in the categorization view. Why?
Well, because most of the movement in the polls hasn't actually shifted the averages in states from Biden to Trump.
However, the margins in a lot of the "Weak Biden" states got slimmer. Biden still leads, but not by as much as he used to. This means the chances of Trump winning those states despite the Biden lead in the poll average increases. This is reflected in the probabilistic model, but not in the categorization model.
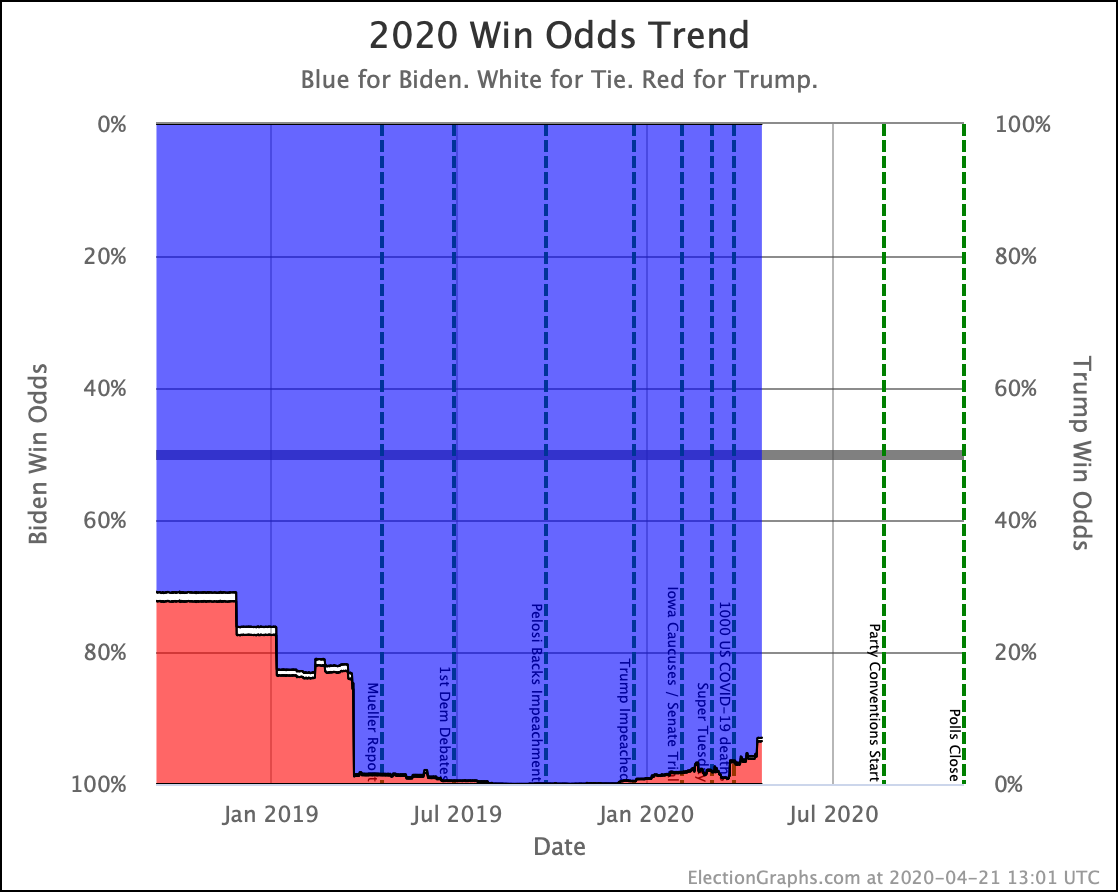
If the election was today, Biden still has a huge advantage. 93.0% chance of a win. Not anywhere near as good as he was last fall with 99.9%+ numbers of course, but still pretty respectable.
But…
As I've mentioned over and over again and will continue to mention, probably right up until the election, the odds are based on the state level polls today, which can and will change. And they can change quickly.
The tipping point tells us that overall the polls only need to shift by 2.0% to flip the winner from Biden to Trump. It is hard to express just how slim a 2.0% lead really is. Yes, if the polls were like this on election day, we'd say Biden had a 93.0% chance of winning. But 2.0% can slip away with one bad news cycle.
Even on the chart above, without having to refer back to 2016 or earlier cycles, you can see places where the tipping point moved by almost 2% in just a single day.
2.0% can literally evaporate overnight.
With that, here is the current map:
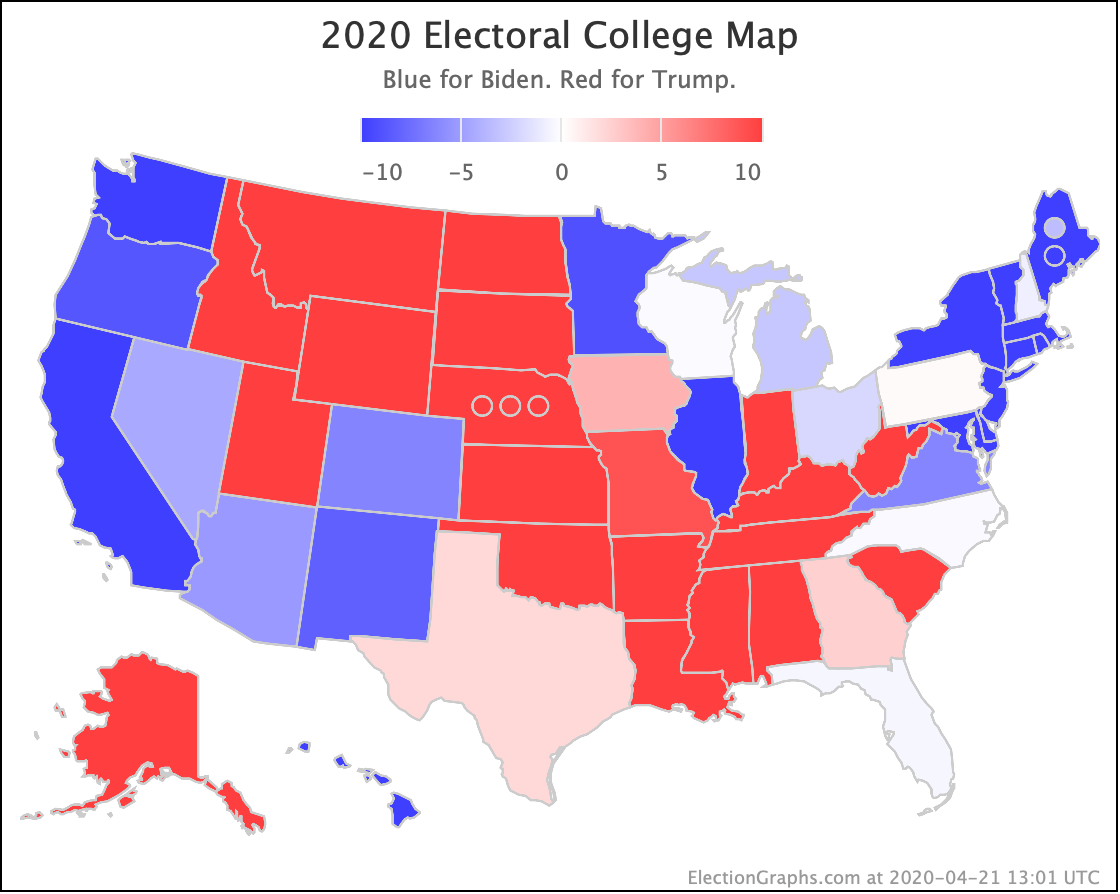
195.2 days until polls start to close on election night.
Update 2020-04-22 19:09 UTC: Of course a new Florida poll came out while I was finishing up this blog post. It was a good poll for Biden, and Florida is big and close, so it improved Biden's position a bit. Of course, that now belongs to the time period that will be covered by my next post in a week or two…
For more information:
This post is an update based on the data on the Election Graphs Electoral College 2020 page. Election Graphs tracks a poll-based estimate of the Electoral College. The charts, graphs, and maps in the post above are all as of the time of this post. Click through on any image for current interactive versions of the chart, along with additional details.
Follow @ElectionGraphs on Twitter or Election Graphs on Facebook to see announcements of updates. For those interested in individual poll updates, follow @ElecCollPolls on Twitter for all the polls as I add them. If you find the information in these posts informative or useful, please consider visiting the donation page.