Live Election Graphs Results Updates

As results start coming in, I'll update here with which states we got right, which we got wrong, and what that means for the range of possibilities based on the categorization view. I considered doing something where I updated the probabilistic numbers based on the called states, but that wouldn't really be a good model as the chances in the remaining states really should change based on which states have been called, and the vote count in the state, etc. And I'm not set up for any of that.

So we'll just stick to the best and worst cases for the candidates based on which states have been called, and assuming that only the "Weak" states might go the "wrong" way. Of course there can be surprises in the other categories too. We'll adjust appropriately if that happens.

Newer updates will be right under this introduction, scroll down for the older updates. Times listed are UTC. 0:00 UTC in November is 7 PM Eastern, 4 PM Pacific.

Refresh the page periodically to see updates.

2021-01-07 09:12 UTC

There were no faithless electors when the electoral college voted in December.

Despite a very eventful day in January when the electoral votes were presented to Congress, there were no changes to the totals.

So the final result is as expected since November 13th:

Biden 306 to Trump 232 – Biden by 74 electoral votes

At some point I'll start doing some analysis of the final state by state election results vs the final Election Graphs polling averages. I had hoped to actually do that by now. Oops.

I guess it is still fine as long as I do it before it is time to launch the 2024 version of this site, right?

Thanks again everybody for following us through the 2020 cycle.

2020-11-13 19:15 UTC

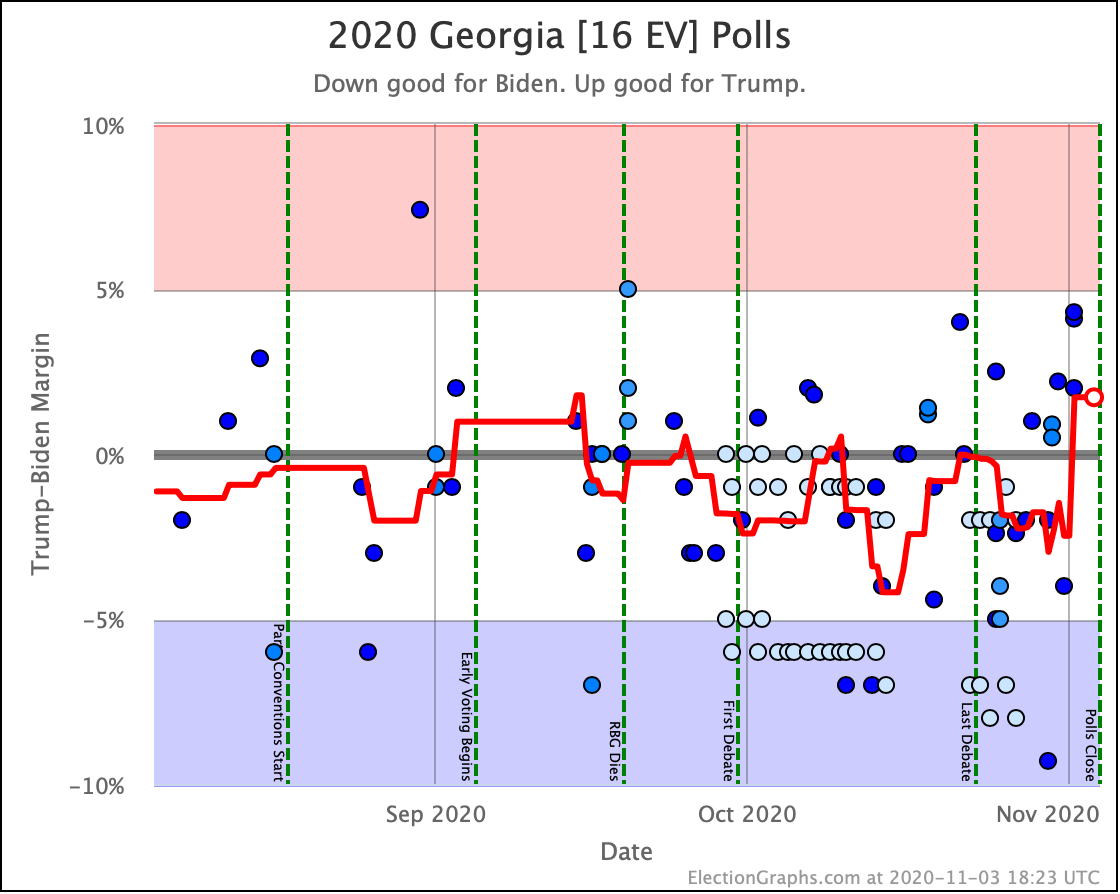
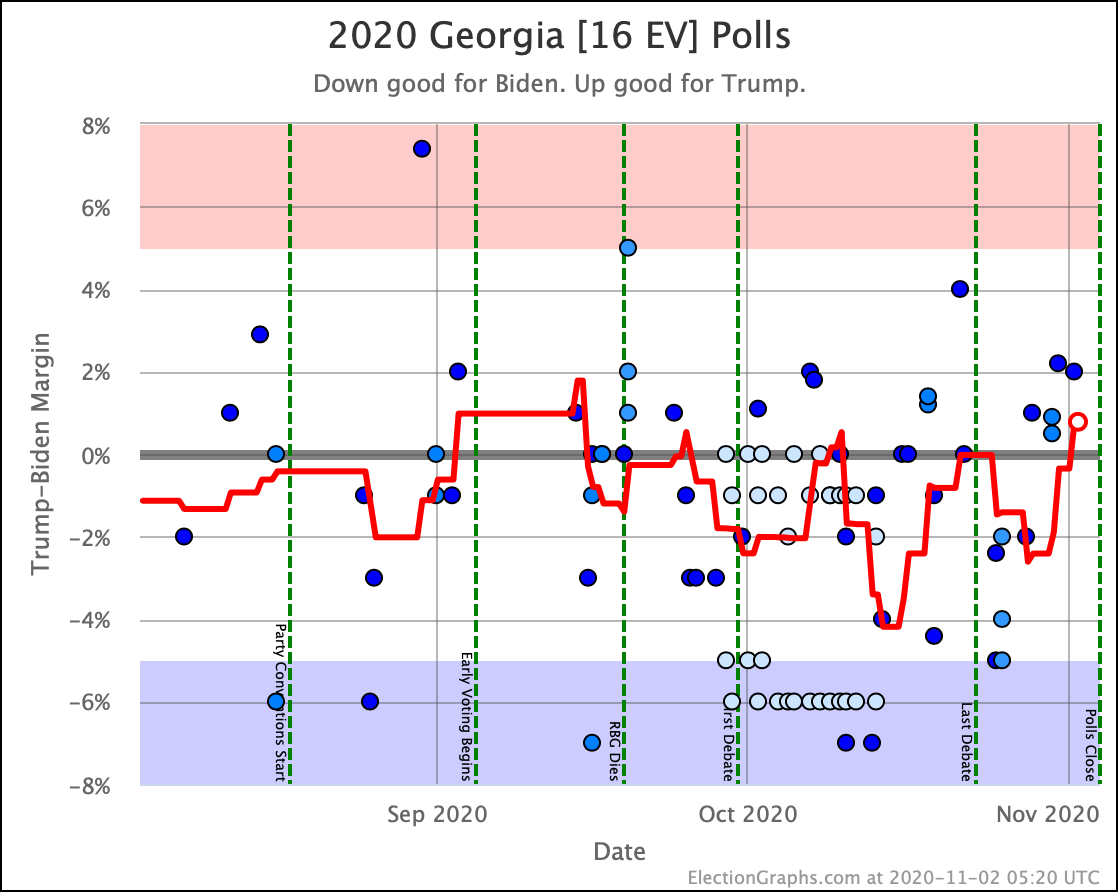
NBC just called Georgia for Biden. This is the last state that hadn't been called by anybody officially, although it has been clear for days that it was going that way.

So, final table:

Biden Trump Margin
Trump Best 306 232 Biden by 74
Expected 306 232 Biden by 74
Biden Best 306 232 Biden by 74

This leaves us with four jurisdictions where the final results differed from the Election Graphs calculations:

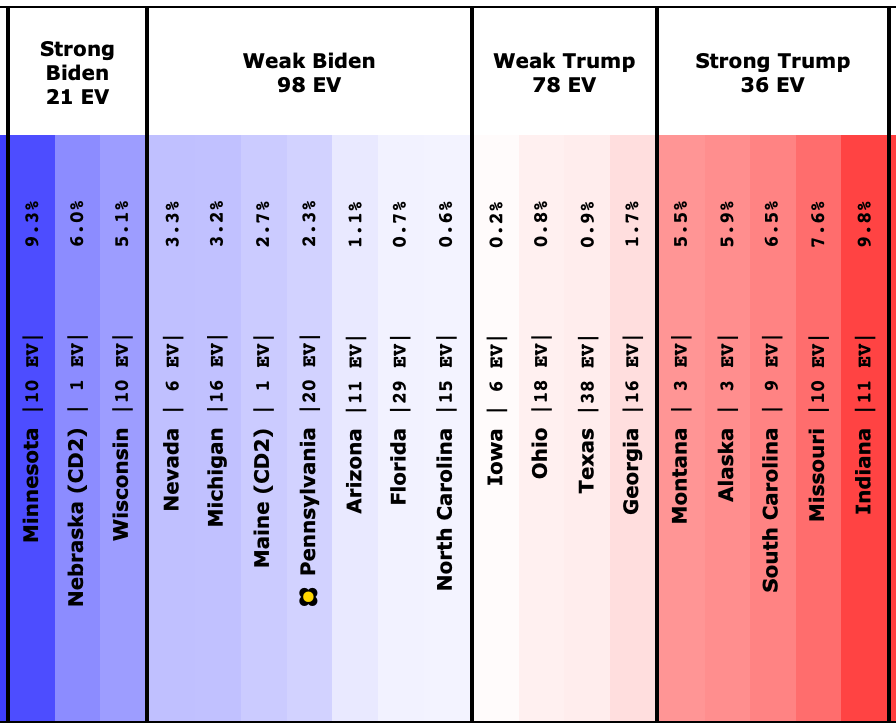
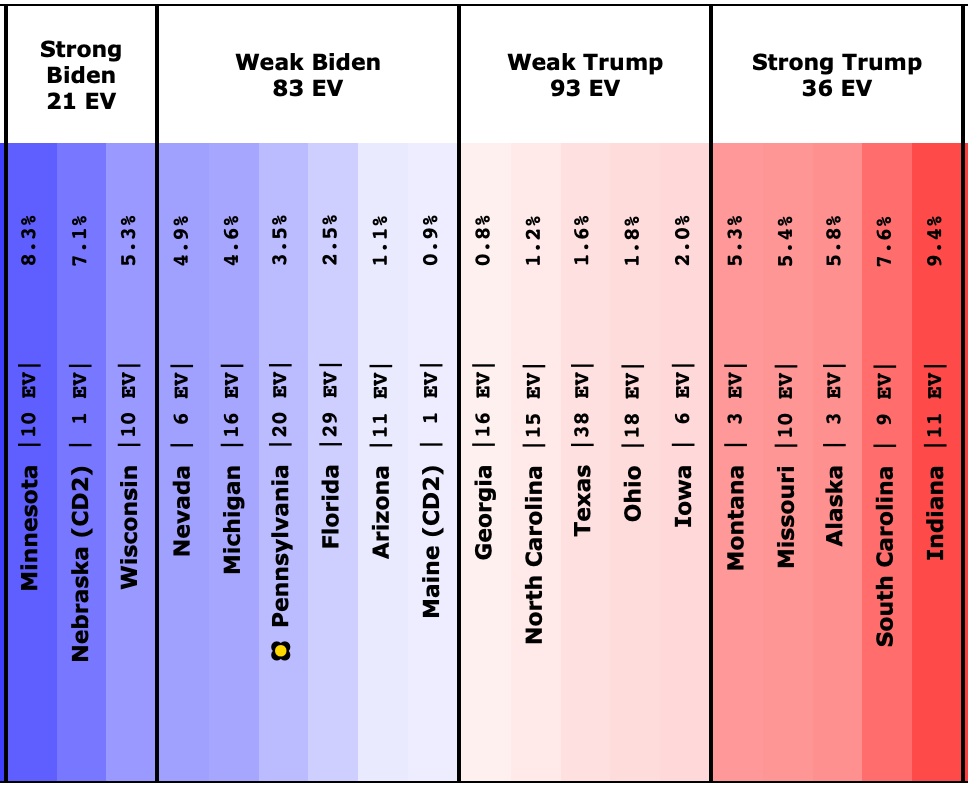
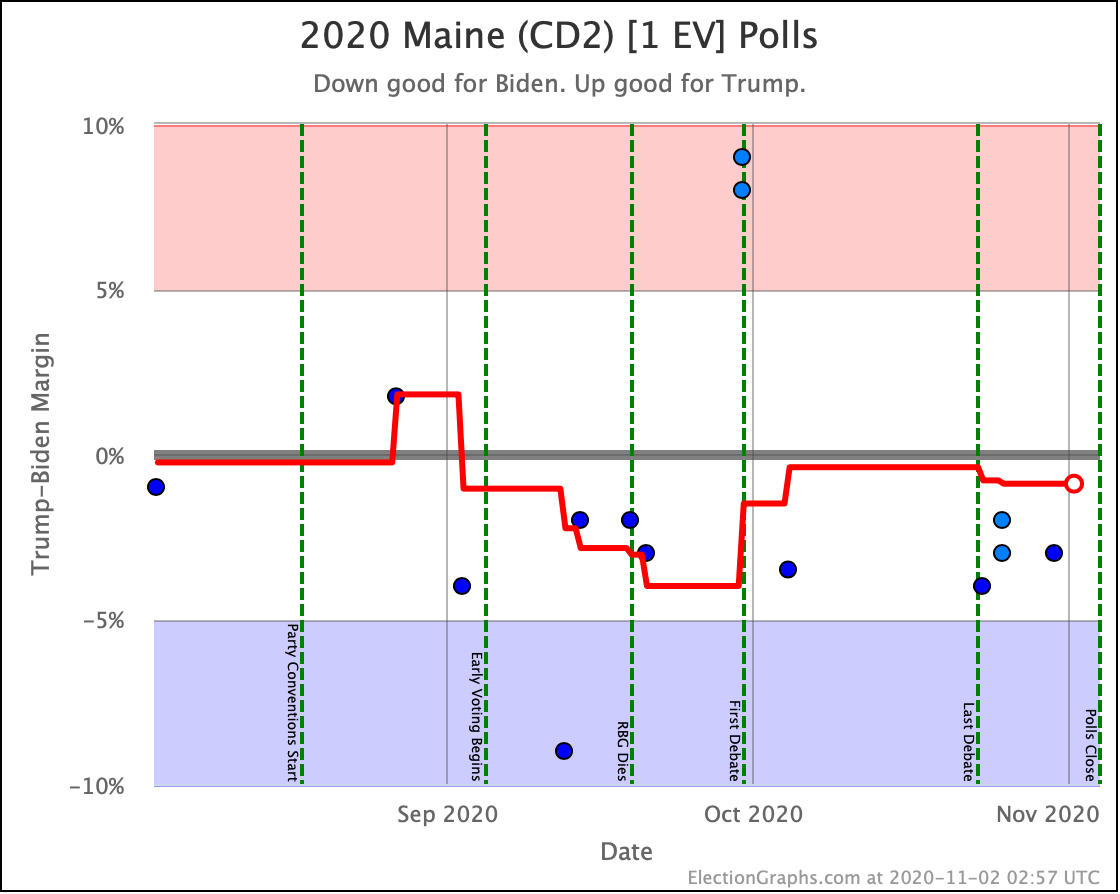
  • Maine-CD2 was "Weak Biden" where Biden led by 2.7% in our averages, which gave Biden a 71.4% chance of winning in our estimation. Trump won though, so his 28.6% chance of winning paid off.
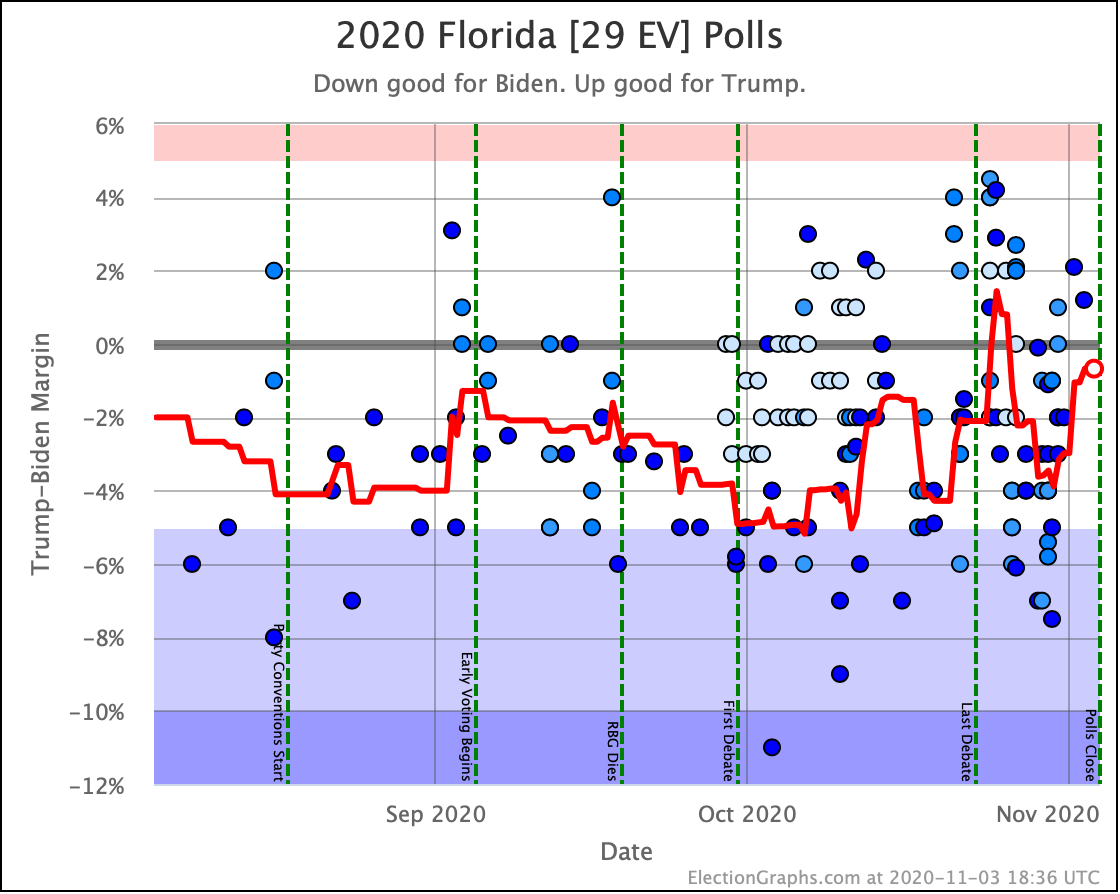
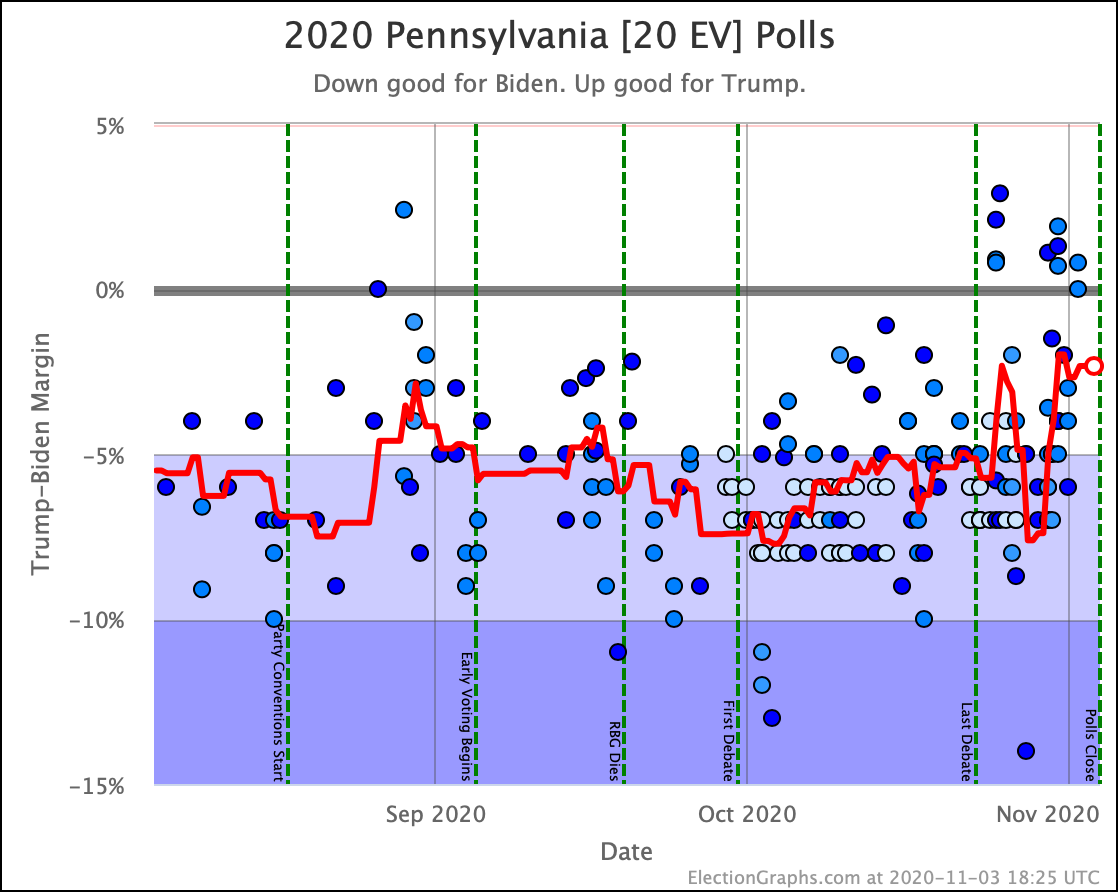
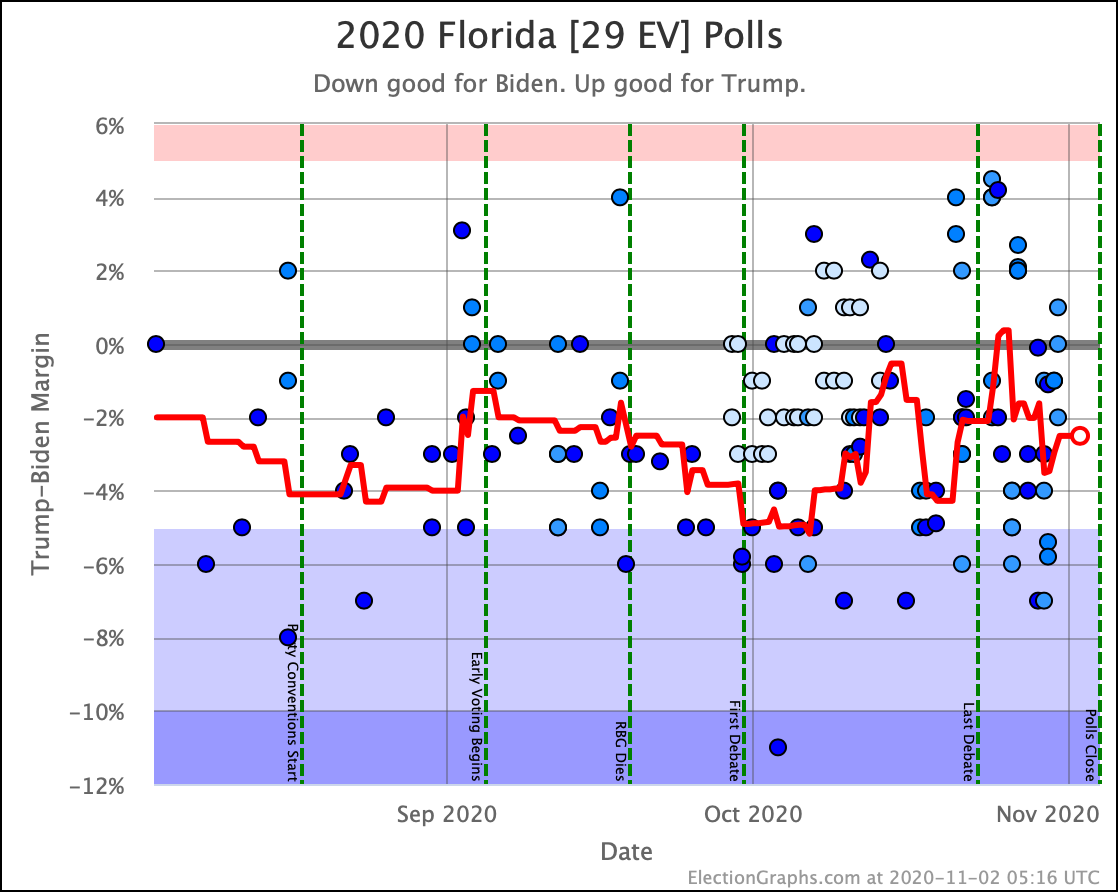
  • Florida was also "Weak Biden" with an 0.7% lead. We translated this to only a 53.2% chance of a Biden win and a 46.8% chance of a Trump win. So Trump won this, but we had essentially identified it as a coin toss.
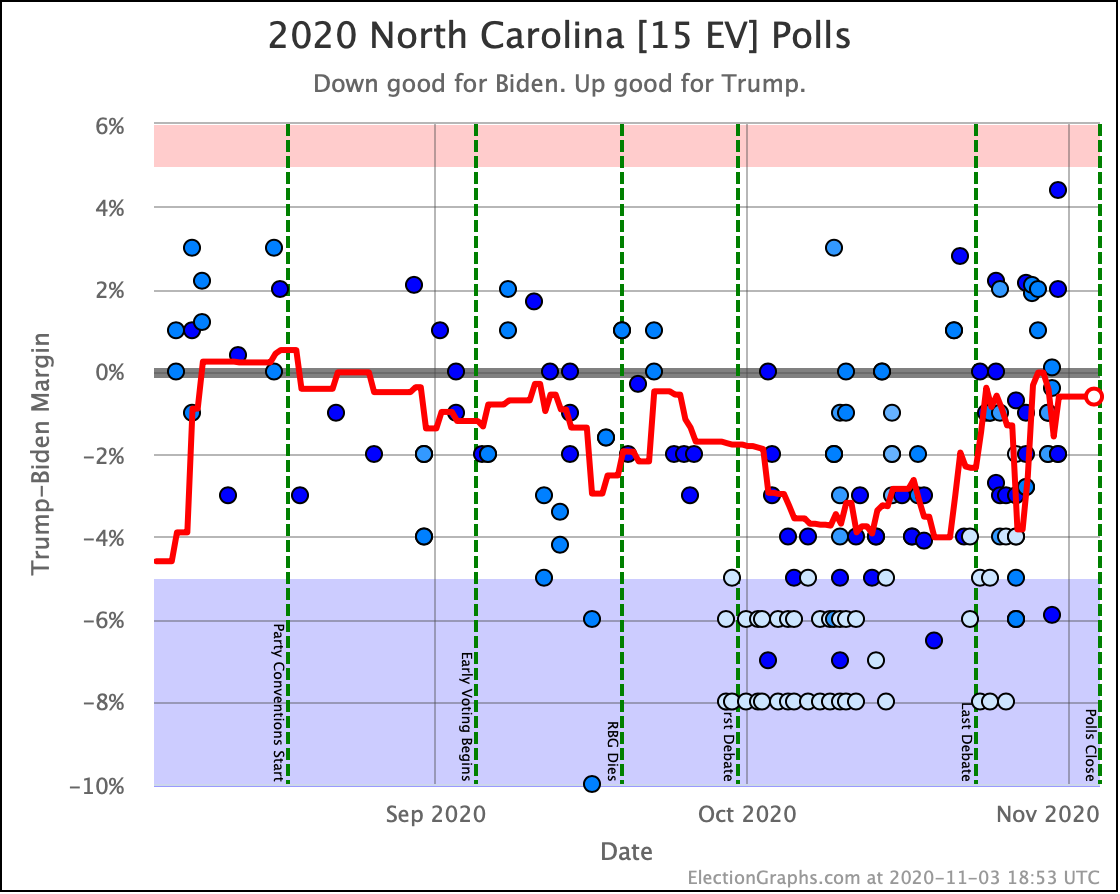
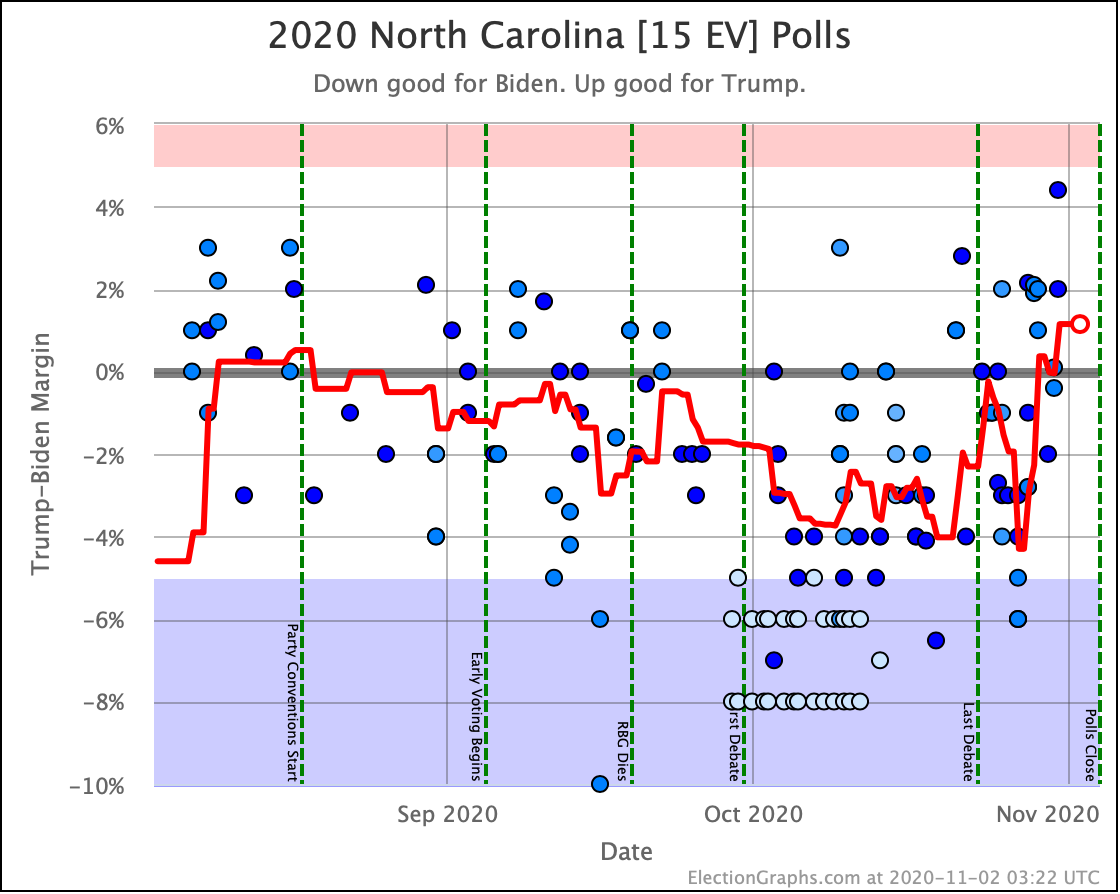
  • North Carolina was "Weak Biden" with an 0.6% lead. We gave this as a 52.1% chance of a Biden win, and a 47.9% chance of a Trump win. Again, Trump won the coin toss.
  • Georgia was "Weak Trump" with Trump's lead at 1.7%. For us that meant a 74.2% chance of a Trump win, and a 25.8% chance of a Biden win. In this case, Biden was the one who pulled off the underdog win.

All four of these places that went "the wrong way" were clearly in the zone where we gave significant odds to those states going the other way though, so none of them qualify as a huge surprise. So I am actually pretty satisfied with these results.

In addition, the "Biden by 74" EV was clearly within all of the "envelopes" this site produced, even if you go with the 1σ (68.27%) ranges for the two probabilistic views.

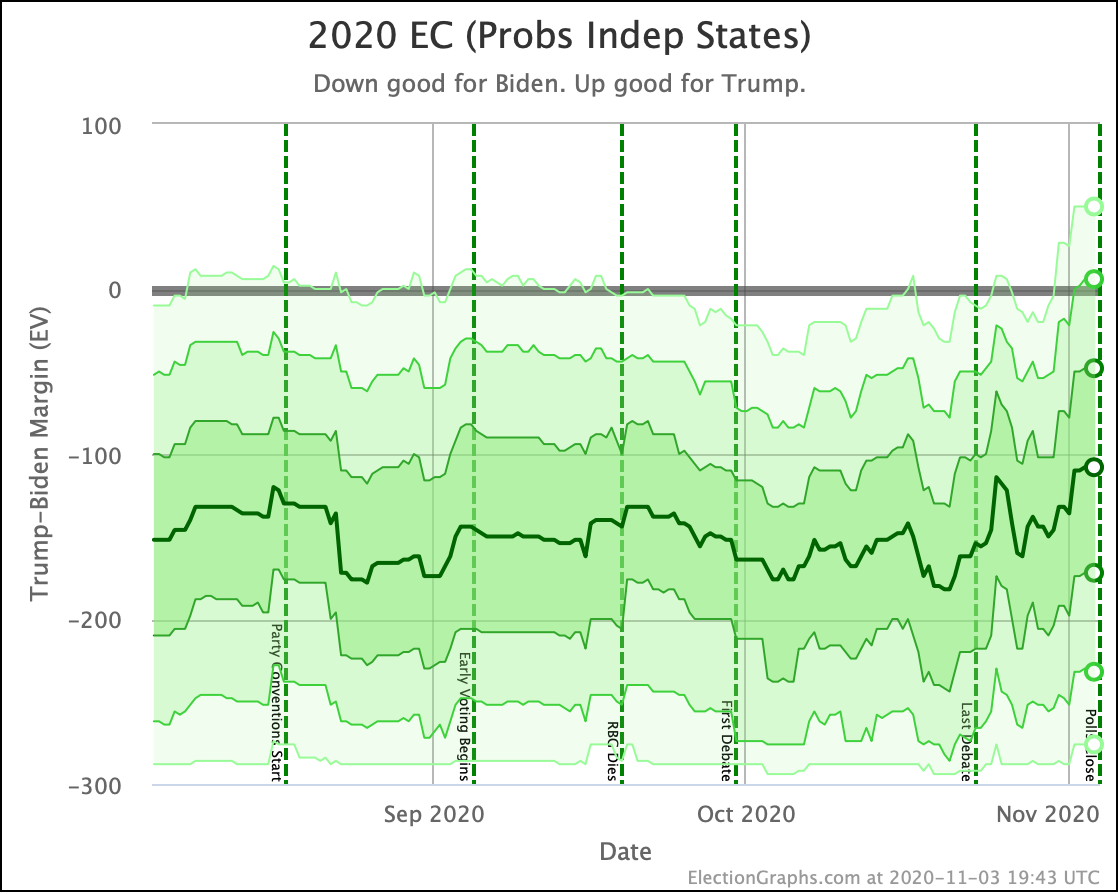
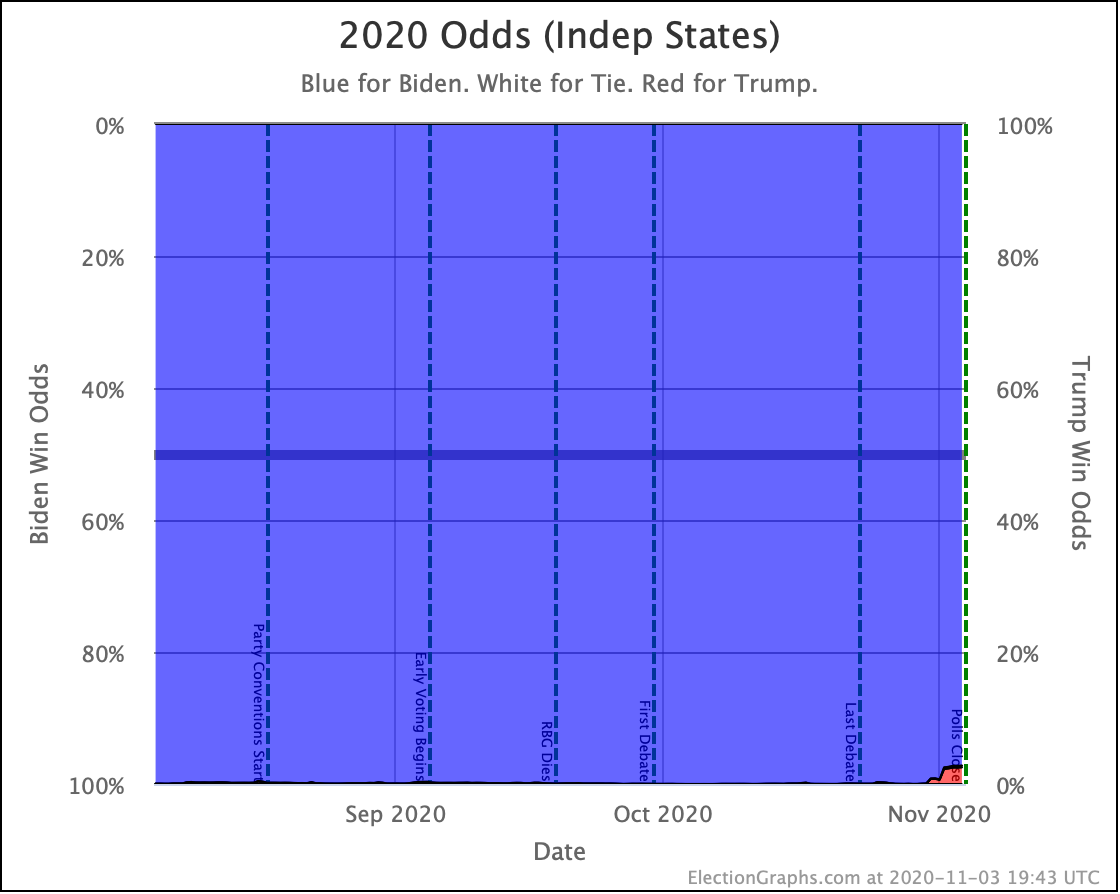
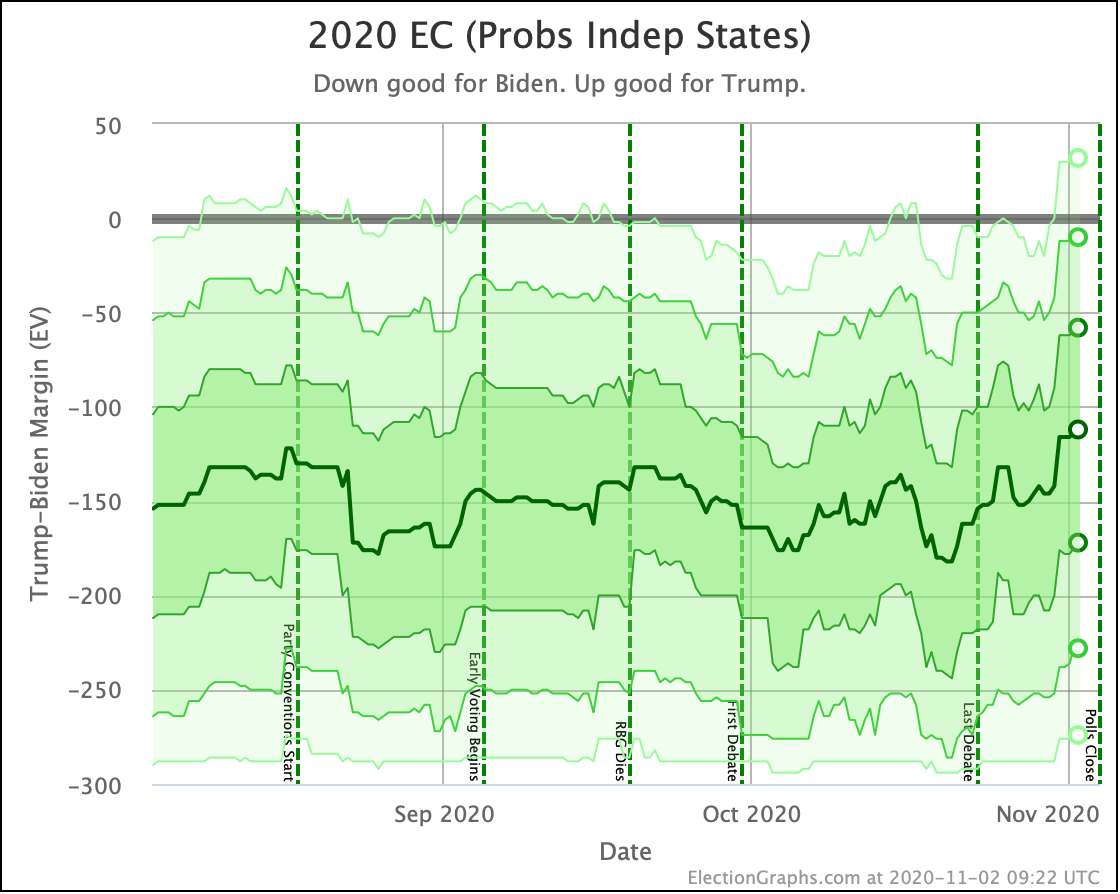
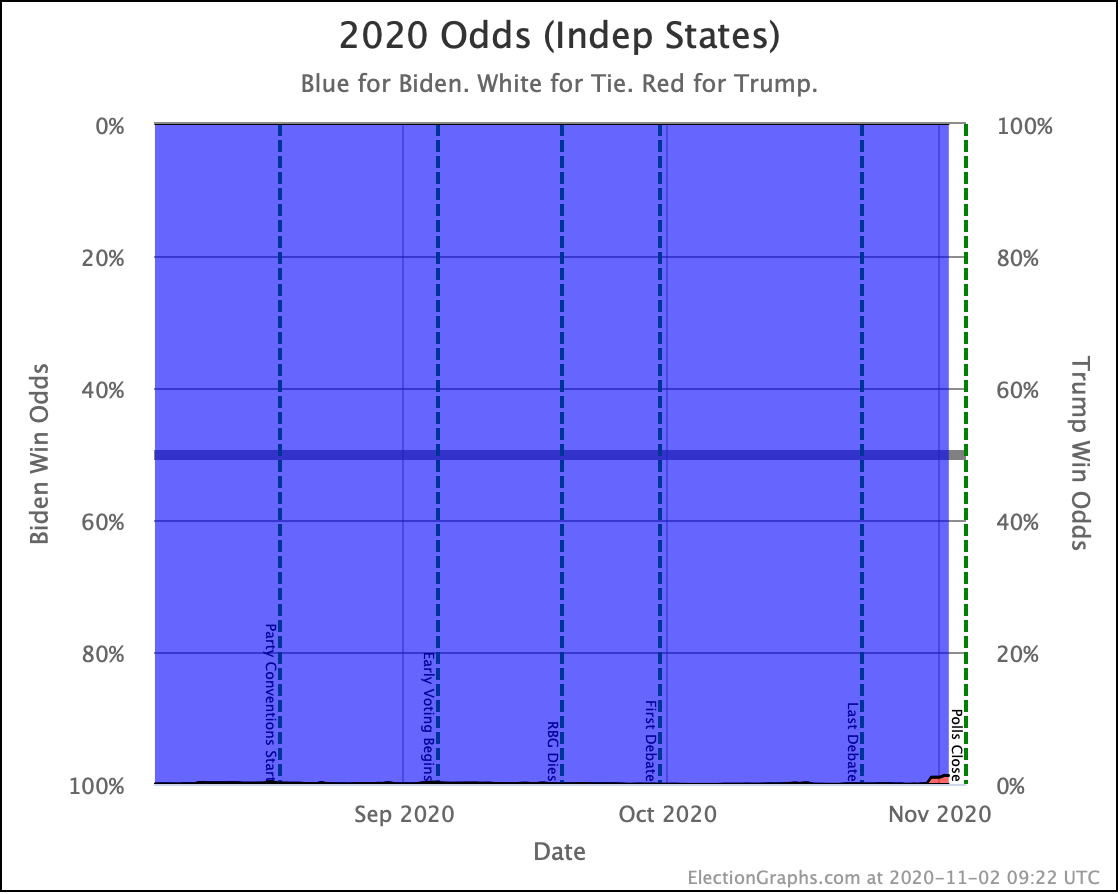
  • The "Probabilistic Independent States" 1σ (68.27%) range went from Biden by 48 to Biden by 172 with a median of Biden by 108. This was the tightest of our three ranges, and Biden by 74 was clearly in that range.
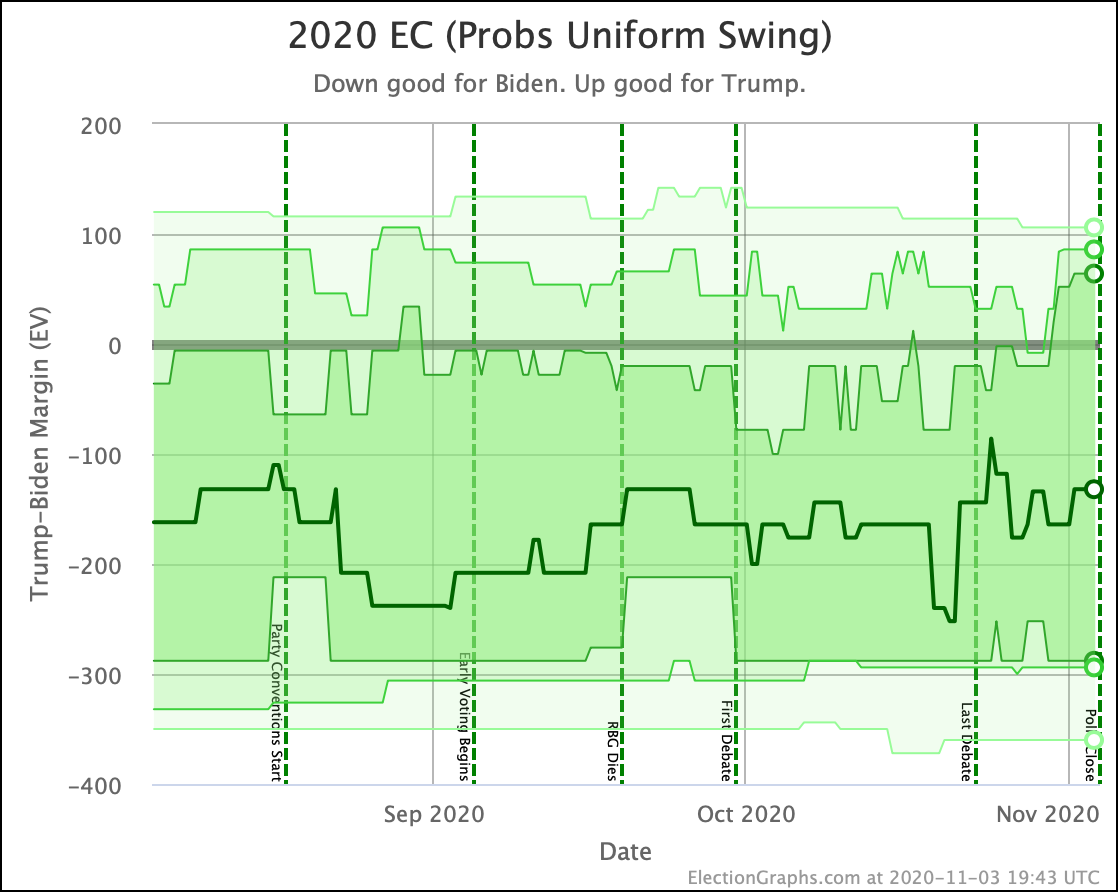
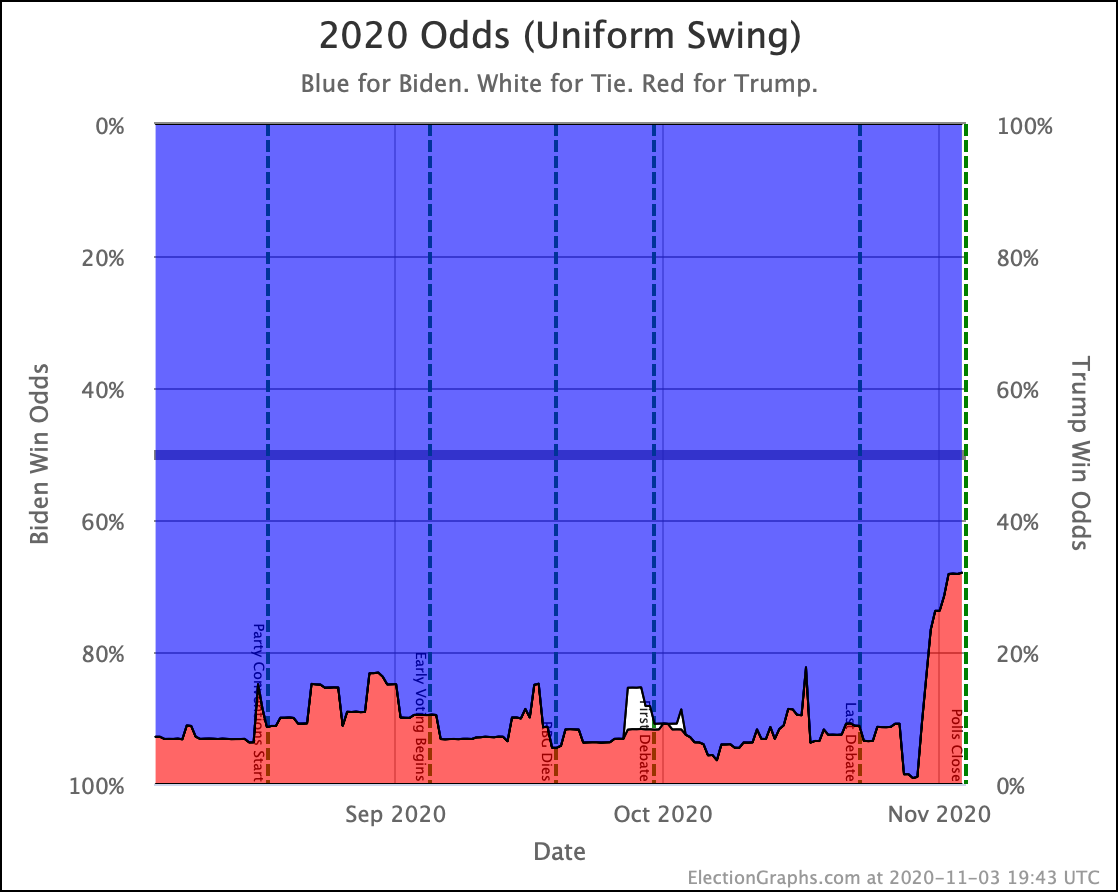
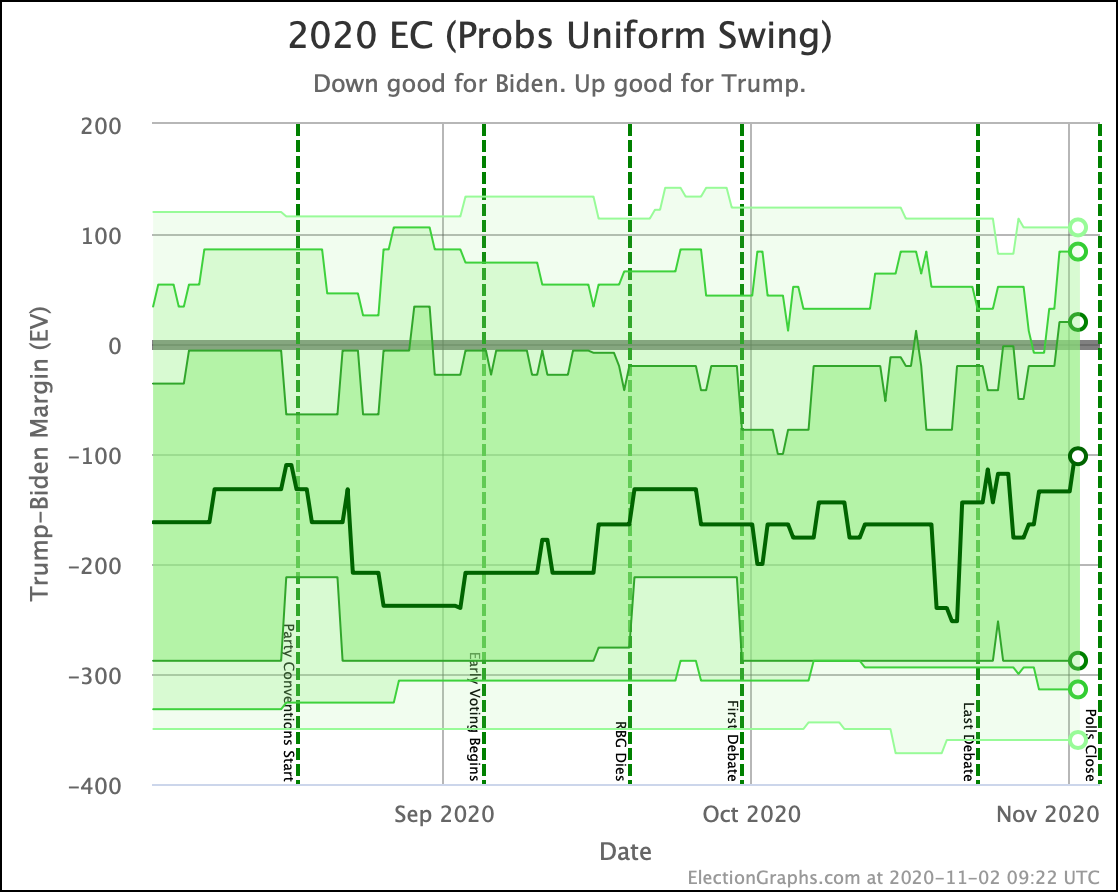
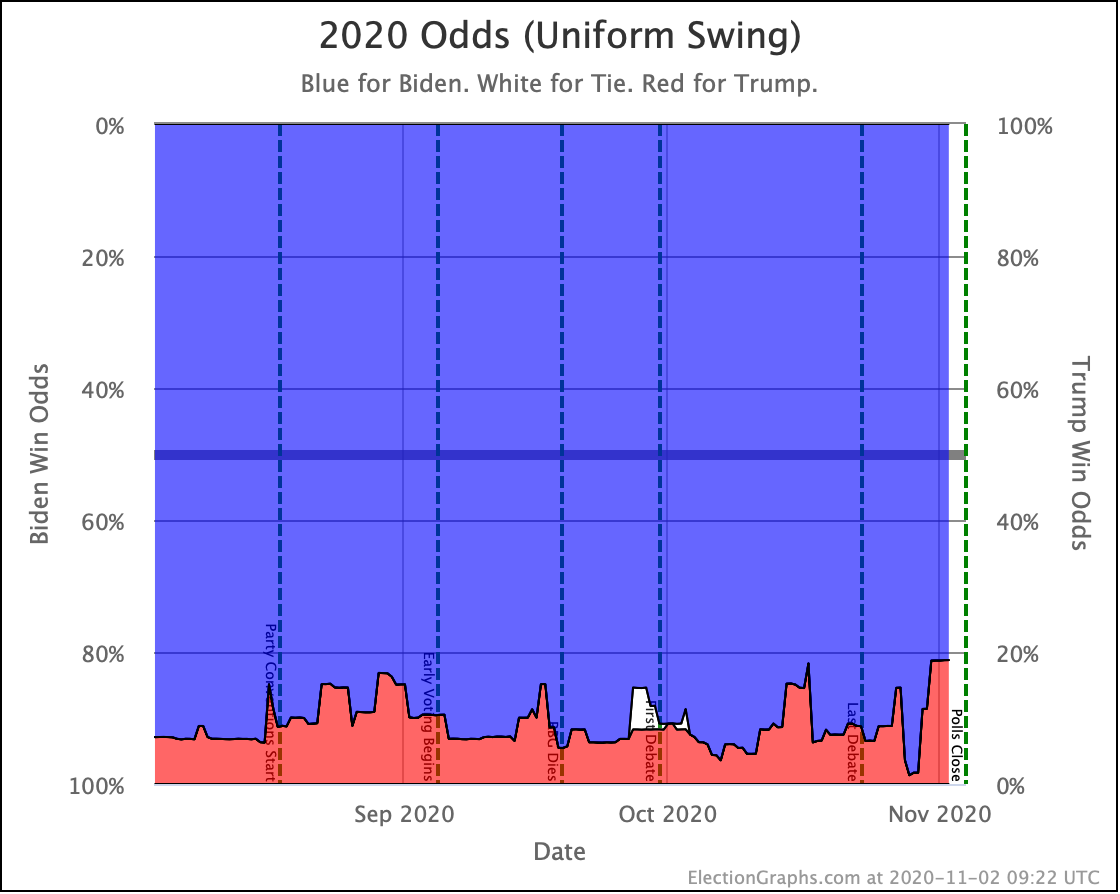
  • The "Probabilistic Uniform Swing" 1σ (68.27%) range was from Trump by 64 to Biden by 288 with a median of Biden by 132. Obviously Biden by 74 was in that range as well.
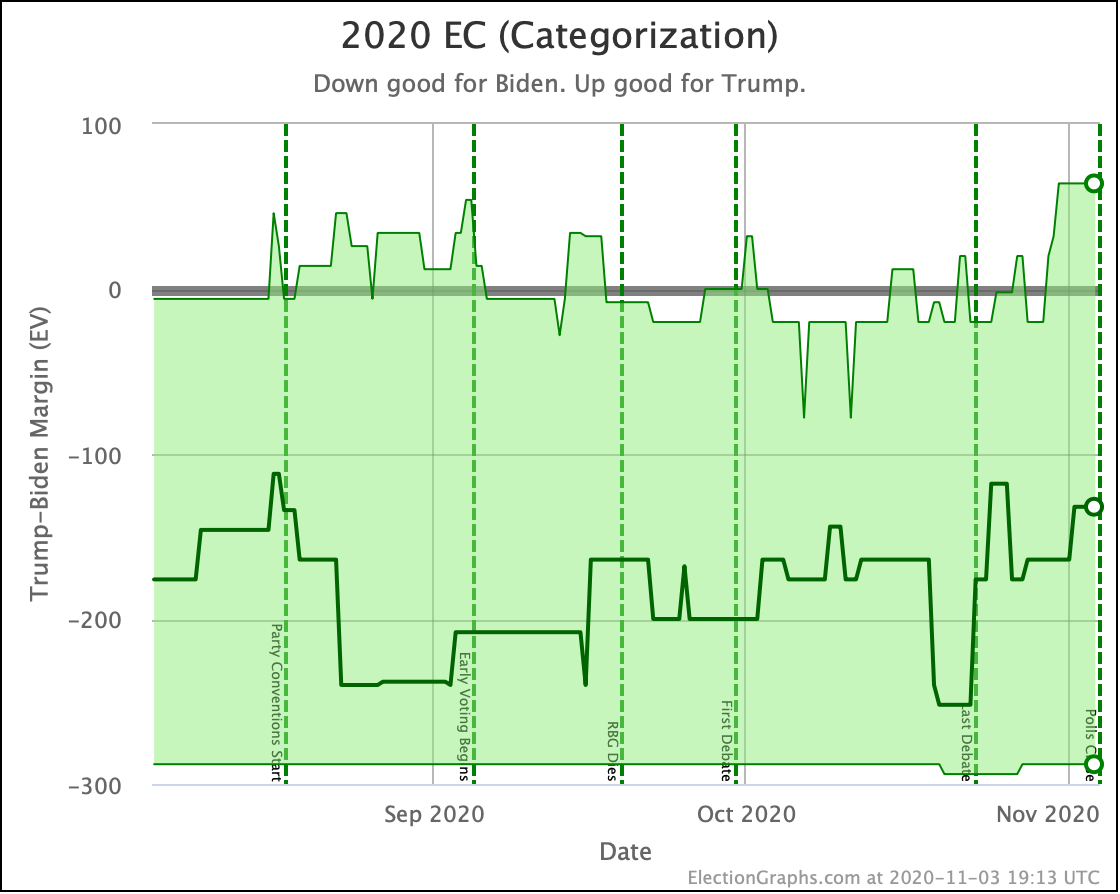
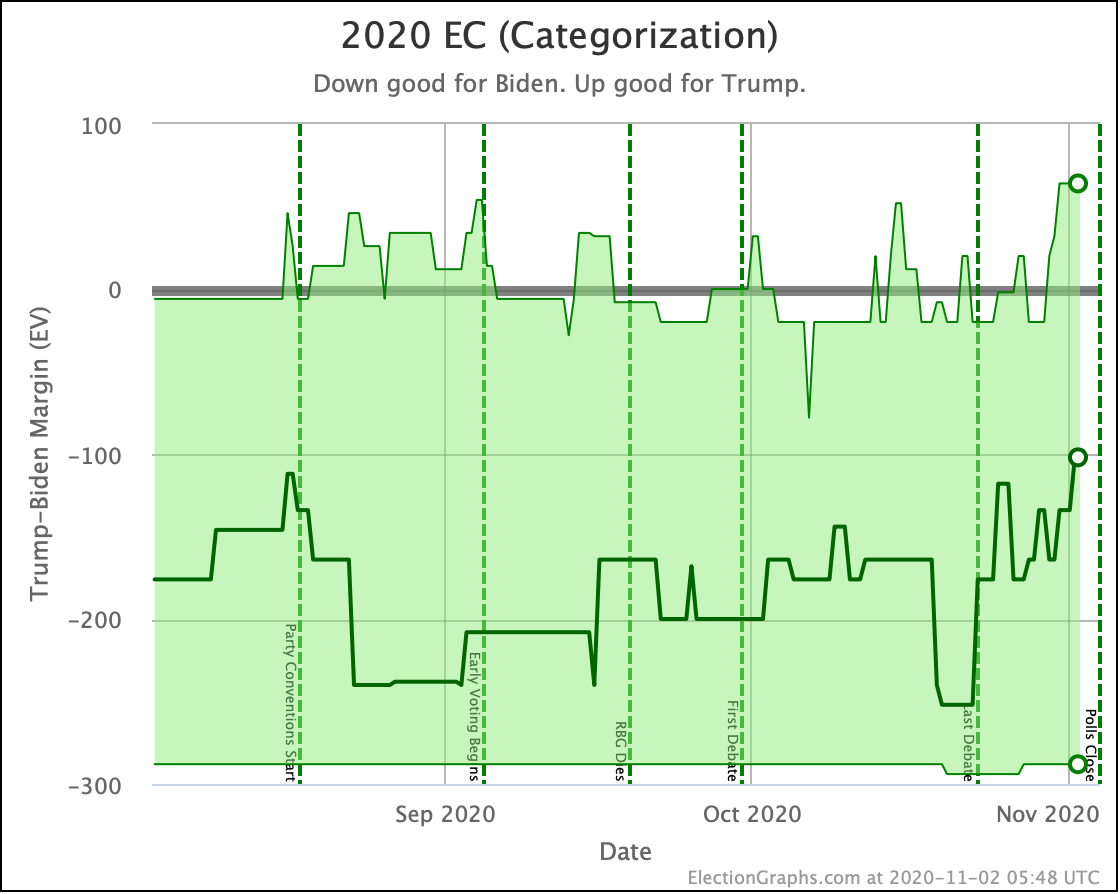
  • And finally my old fashioned simple "Categorization View Best Cases" went from Trump by 64 to Biden by 288 with Biden by 132 if everybody just won all the states they led. An exact match for the Probabilistic Uniform Swing 1σ (68.27%) range. And Biden by 74 was of course in that range.

So I don't feel bad about these results at all. Yes, there is a lot of handwringing about how far polls were off, but with ranges and probabilities that were generated by looking at how far off polls have been in the past, you end up with views that give you a level of confidence given the historical accuracy, you get a sense of just how variable the results might be given by the polling we have. Bottom line is there is a lot of uncertainty. But you can measure that uncertainty.

Once all the counts in all the states are final and certified, I will do a more detailed look at the state by state polling errors and what patterns we see there. And of course we'll track if there are any faithless electors this time around. Look for posts on both of those topics in December most likely.

But for the moment, we have calls in every state, so we'll close out this post.

Thanks everybody for following us for the 2020 cycle!

2020-11-12 03:47 UTC

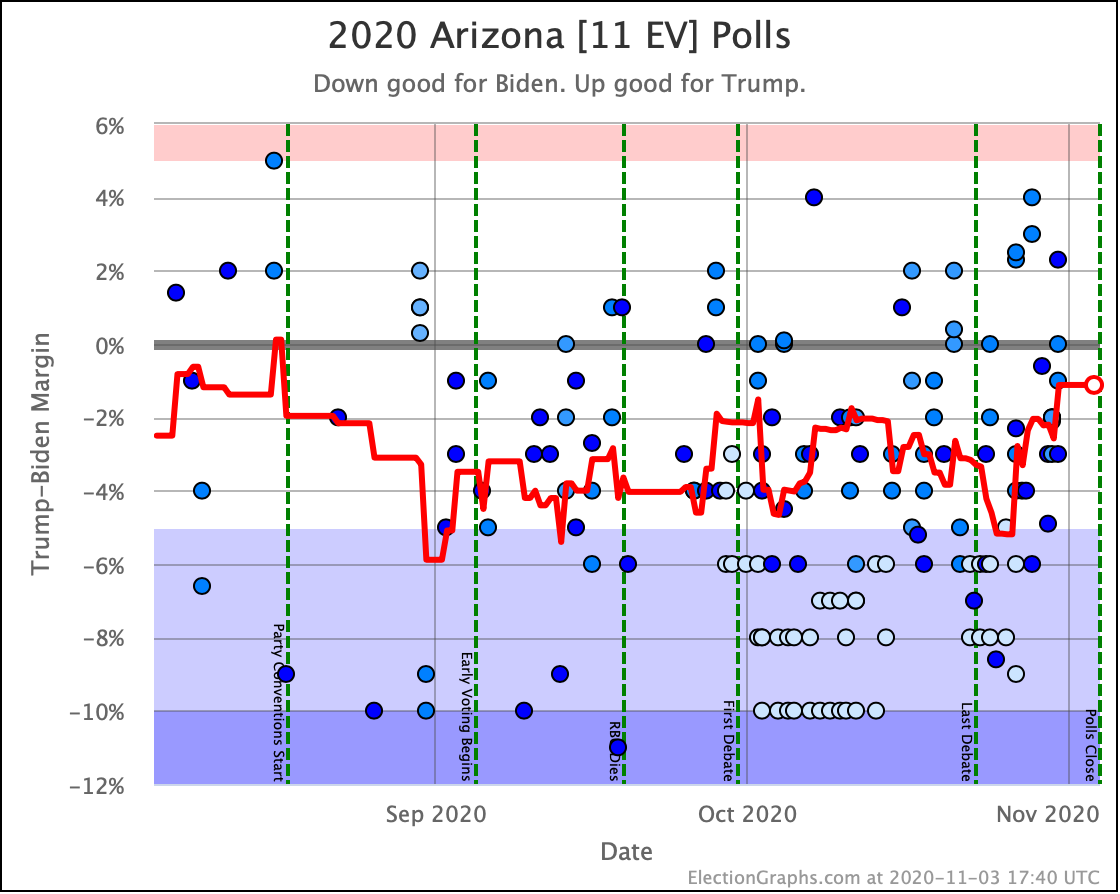
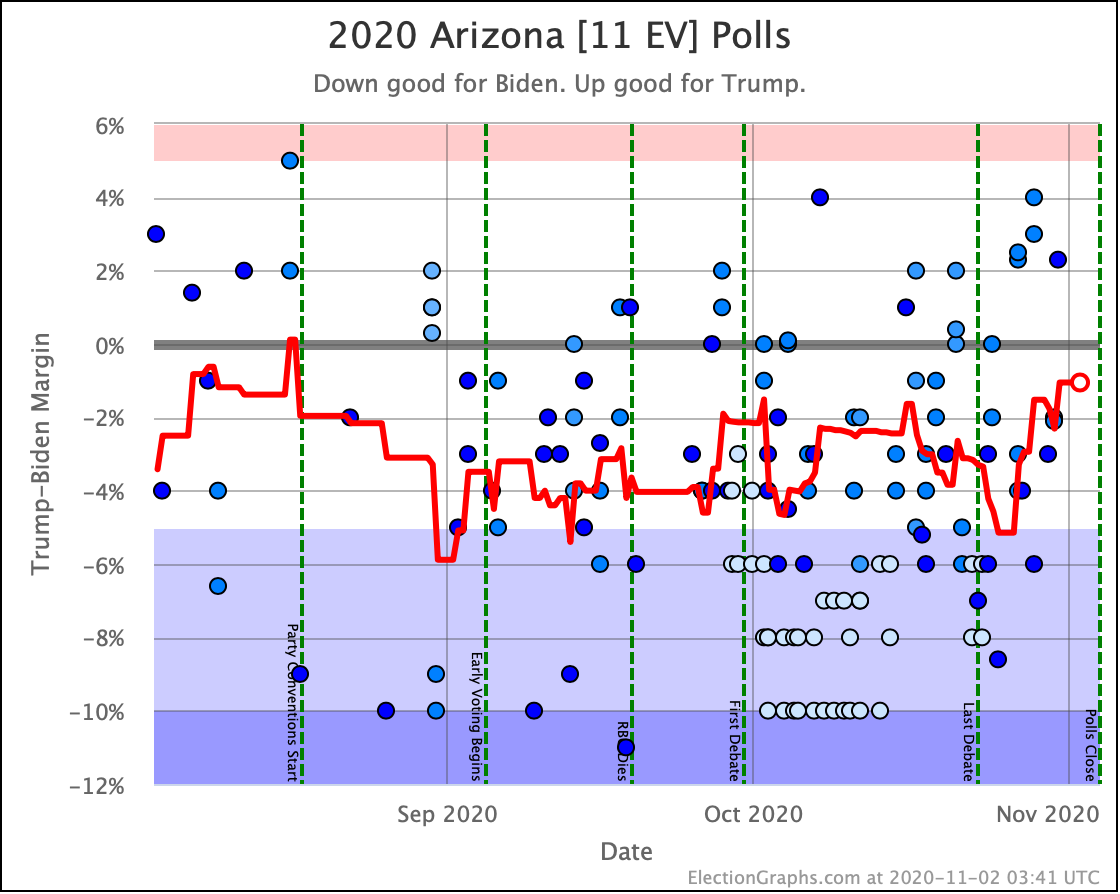
Lots of other places are now calling Arizona for Biden. But we moved it into the Biden column way back when Fox called it. So nothing changes here. We're only waiting on calls for Georgia, which is also expected to be Biden at this point absent some huge surprise.

2020-11-11 15:49 UTC

A couple of hours ago several outlets called Alaska for Trump. This does not change the matrix. The only state without a call is now Georgia, where Biden currently leads.

2020-11-10 18:50 UTC

DDHQ calls North Carolina for Trump. This is one where our averages had Biden slightly ahead, so it is the third place where Election Graphs had the wrong winner. Given the 0.6% Biden margin in the state though, we still gave Trump a 47.9% chance of winning the state, so once again, this was essentially a coin flip, so we don't feel too bad about the miss.

All three misses so far were "Weak Biden" states which ended up going Barely Trump though. If current counts hold, Georgia will be wrong in the other direction.

The new matrix:

Biden Trump Margin
Trump Best 290 248 Biden by 42
Expected 290 248 Biden by 42
Biden Best 306 232 Biden by 74

Only Georgia and Alaska left uncalled.

Note that because the Election Graphs poll average had Trump leading by 5.9%, which put it in our "Strong Trump" category, it is not included in the swing above. Based on current trends, that doesn't look likely to introduce a surprise.

So the results above depend only on the call in Georgia, where Biden is currently leading. But nobody has officially called it yet.

2020-11-07 16:43 UTC

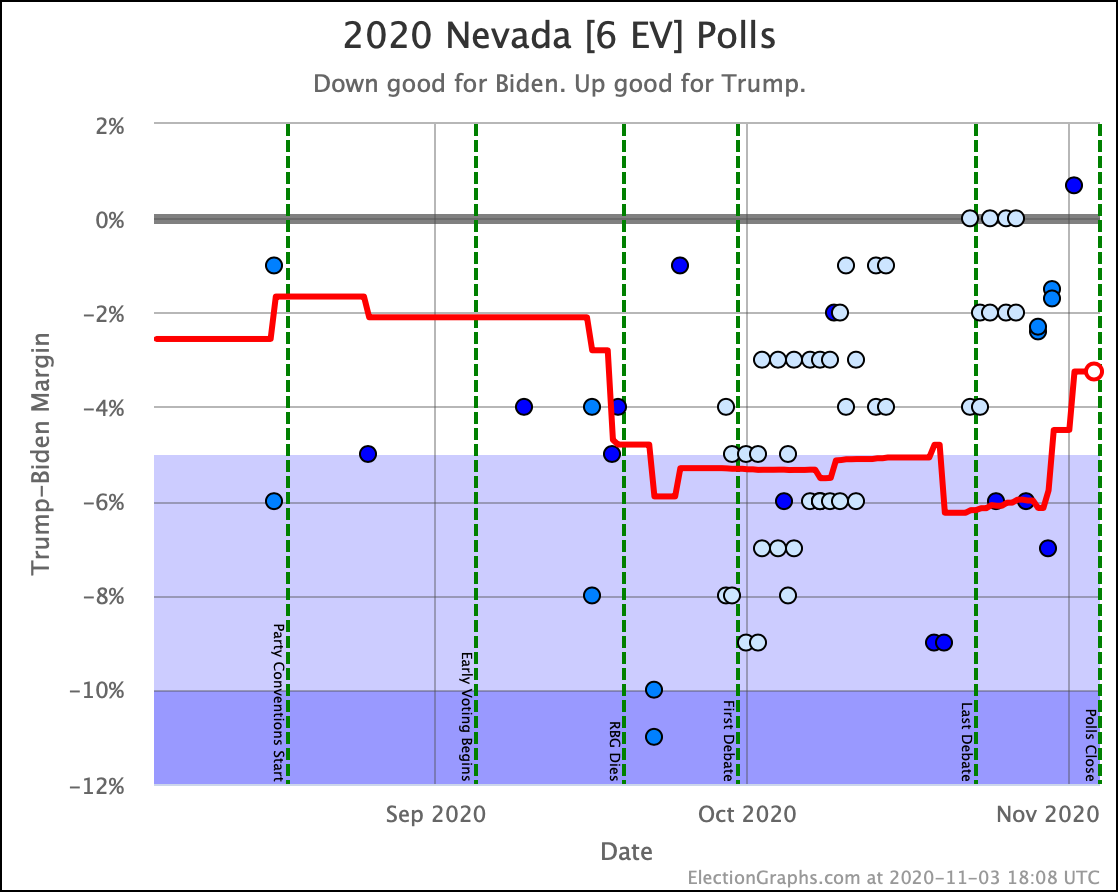
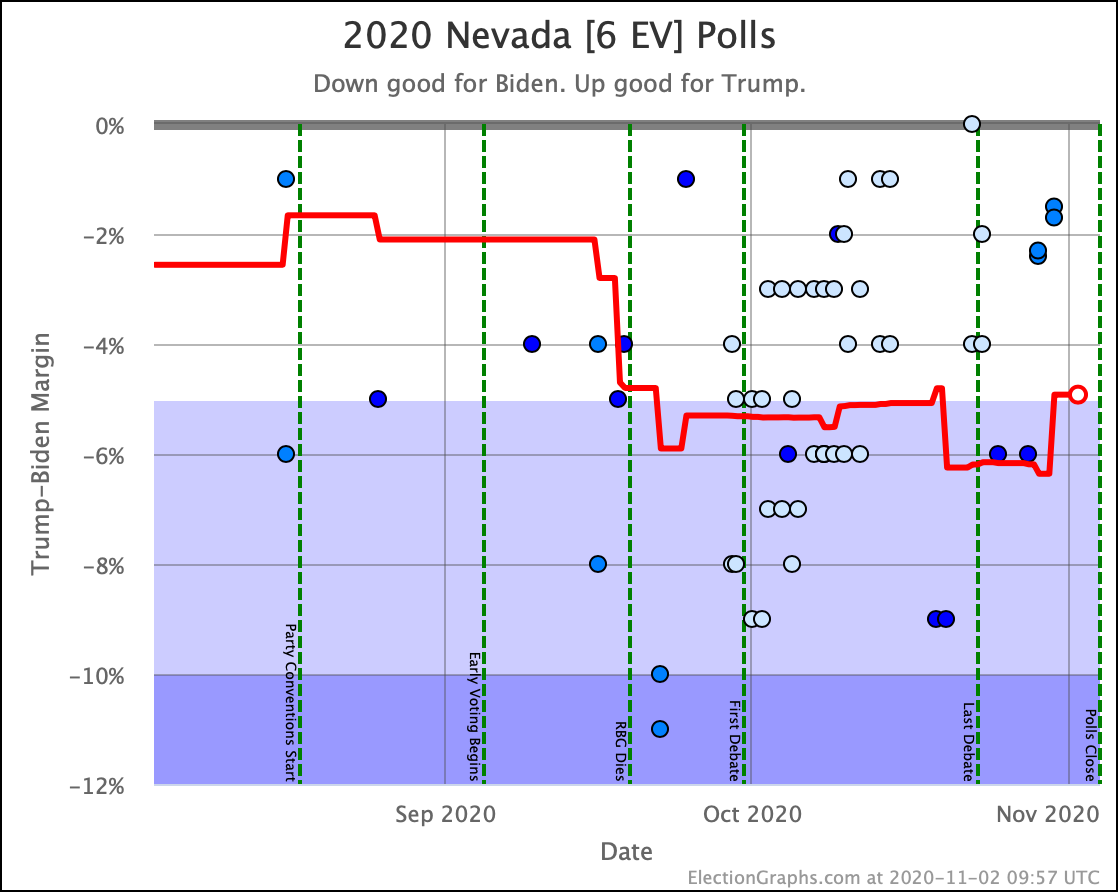
And Fox calls Nevada for Biden. So the matrix tightens further:

Biden Trump Margin
Trump Best 290 248 Biden by 42
Expected 305 233 Biden by 72
Biden Best 321 217 Biden by 104

We're only talking about what Biden's margin is now. We've known Biden was the winner since 14:00 UTC yesterday. (Arguably even before that.) Some places are just slow officially making that conclusion.

2020-11-07 16:34 UTC

Looks like all the major news outlets simultaneously called Pennsylvania, and the whole election, when Biden's lead went over 0.5% a few moments ago. But we were past that point yesterday. Still no additional change to the matrix for us. We'd already moved PA to the Biden column.

Still waiting on media calls for Nevada, North Carolina, Georgia, and Alaska.

2020-11-06 14:30 UTC

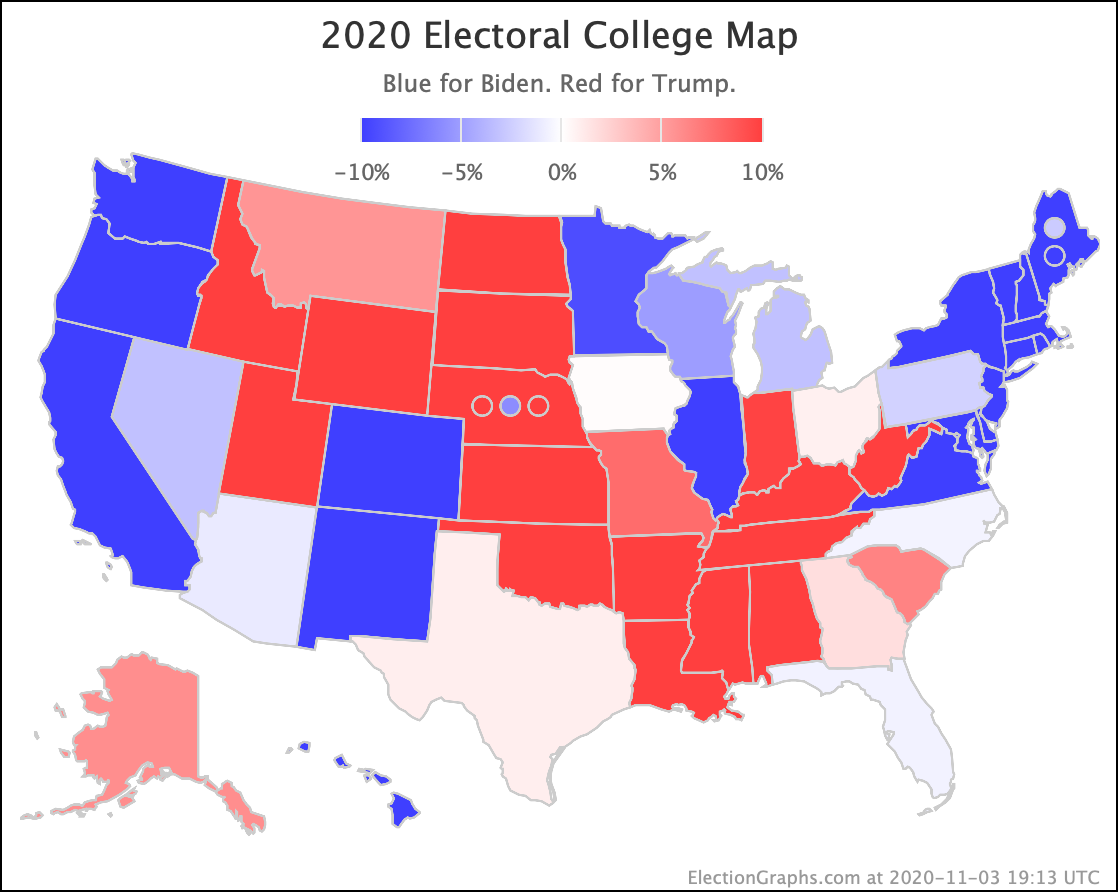
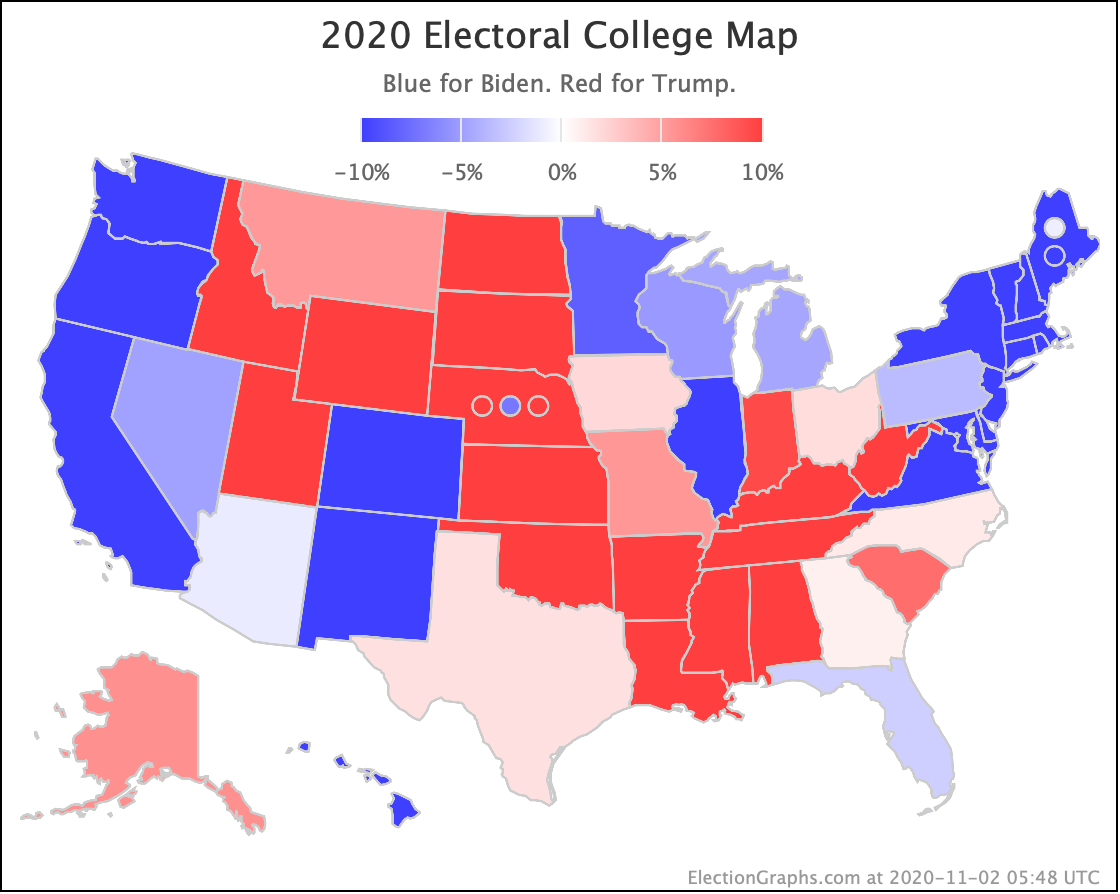
Our "Expected" case in the table below is based on who led each state based on pre-election polling. If all the remaining states just go to the candidate who currently leads the vote count, which seems very reasonable based on current trends, you get Biden 306 to Trump 232, or Biden by 74 EV.

2020-11-06 14:00 UTC

DecisionDeskHQ just called PA for Biden as soon as Biden took the lead in that state. And that is that.

Biden Trump Margin
Trump Best 284 254 Biden by 30
Expected 305 233 Biden by 72
Biden Best 321 217 Biden by 104

Biden has won the Presidency. Only question now is by how much.

(And even if Arizona is uncalled, the Trump's best cases would still be Biden by 8, so it is still just a question of how big Biden's win is.)

2020-11-06 09:22 UTC

Biden just took the lead in Georgia, and it seems unlikely that will change given the trends. Pennsylvania is expected to flip to Biden in the next few hours too. But no official calls yet. So not changing the matrix yet.

Also worth noting that while Fox/AP/Bloomberg all called Arizona for Biden, and thus we adjusted out counts here to reflect that, all the other news outlets are holding back, because Trump is closing the gap as more ballots are counted. We'll leave that call reflected here unless those outlets actually retract their calls.

2020-11-04 21:25 UTC

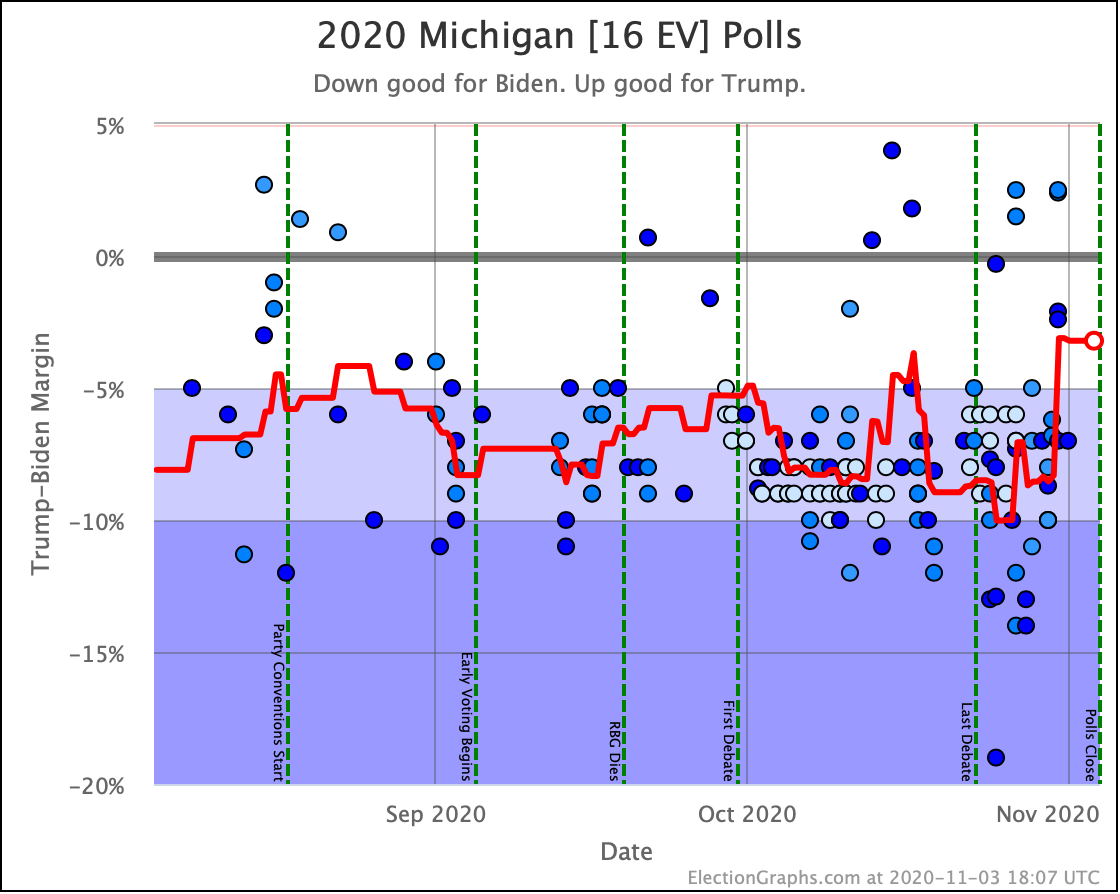
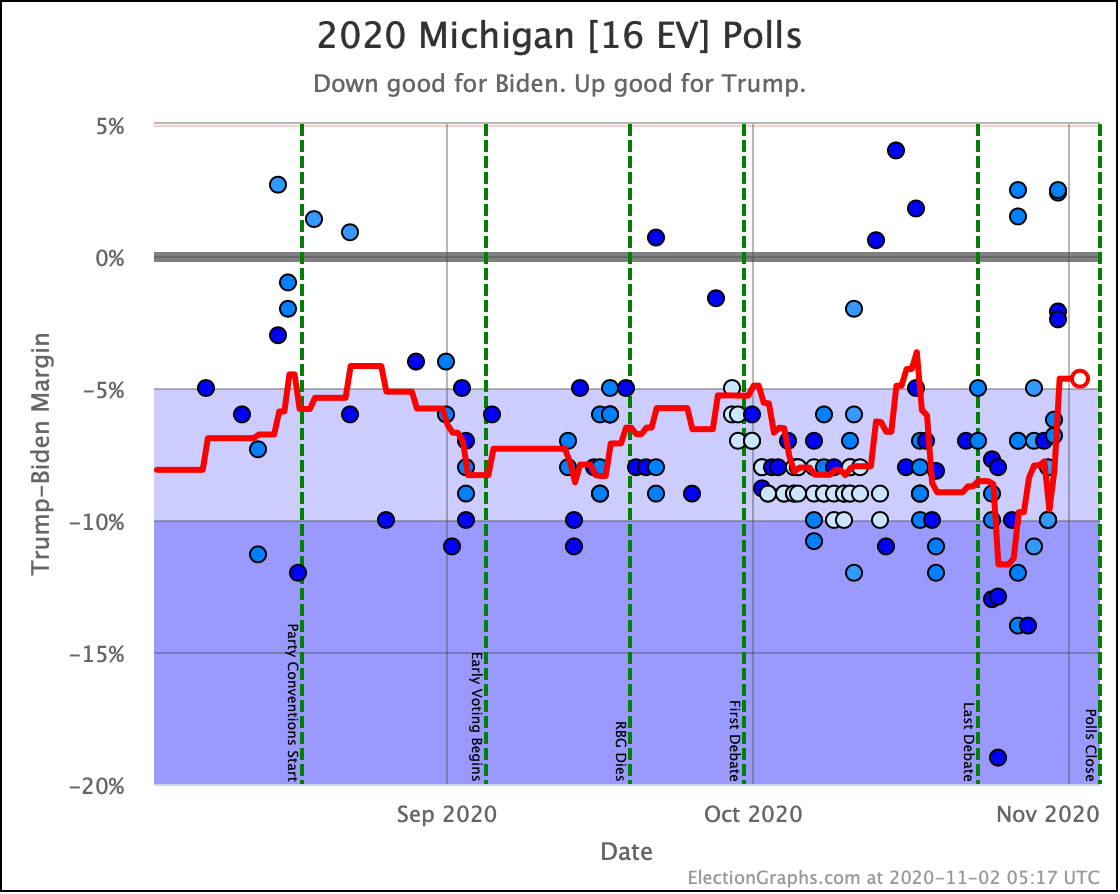
CNN calling Michigan for Biden. Takes that off the table for Trump.

Biden Trump Margin
Trump Best 264 274 Trump by 10
Expected 305 233 Biden by 72
Biden Best 321 217 Biden by 104

2020-11-04 18:35 UTC

ME-CD2 gets called for Trump by AP. That was also “Weak Biden” with a Biden lead of 2.7%. Odds wise we said Trump had a 28.6% chance of winning ME-CD2. So along with Florida, this is the second "miss" relative to our categorizations, but both were states where the odds of a flip were high enough so it isn't a surprise. That's why these are "Weak".

New matrix:

Biden Trump Margin
Trump Best 248 290 Trump by 42
Expected 305 233 Biden by 72
Biden Best 321 217 Biden by 104

2020-11-04 17:13 UTC

Wisconsin election authorities say all votes are counted, and Biden is ahead. Of course, this was "Strong Biden" by the poll average, so it wasn't even supposed to be in contention, and it is actually close enough it could be in recount territory. For the moment, the matrix doesn't change though.

2020-11-04 06:14 UTC

DDHQ calls NE-CD2 for Biden. It was Strong Biden, so expected.

2020-11-04 05:29 UTC

Montana called for Trump, no surprise.

2020-11-04 05:22 UTC

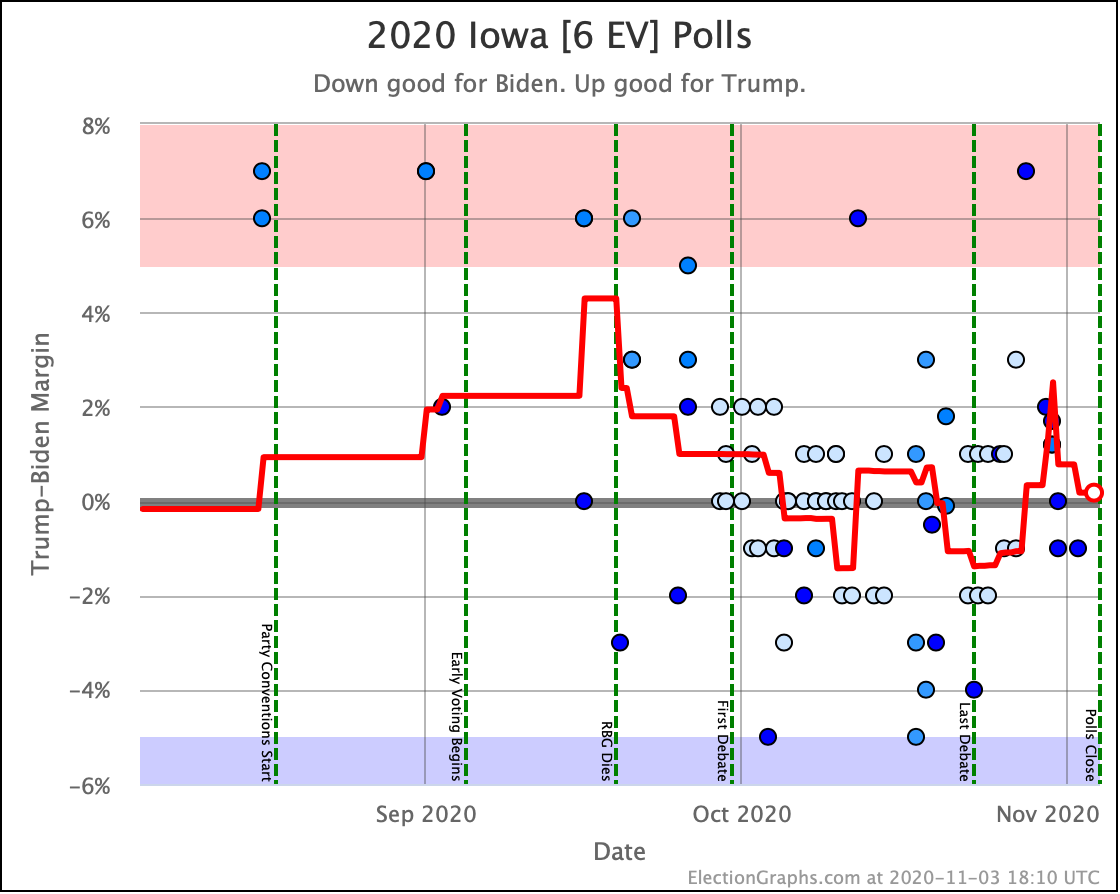
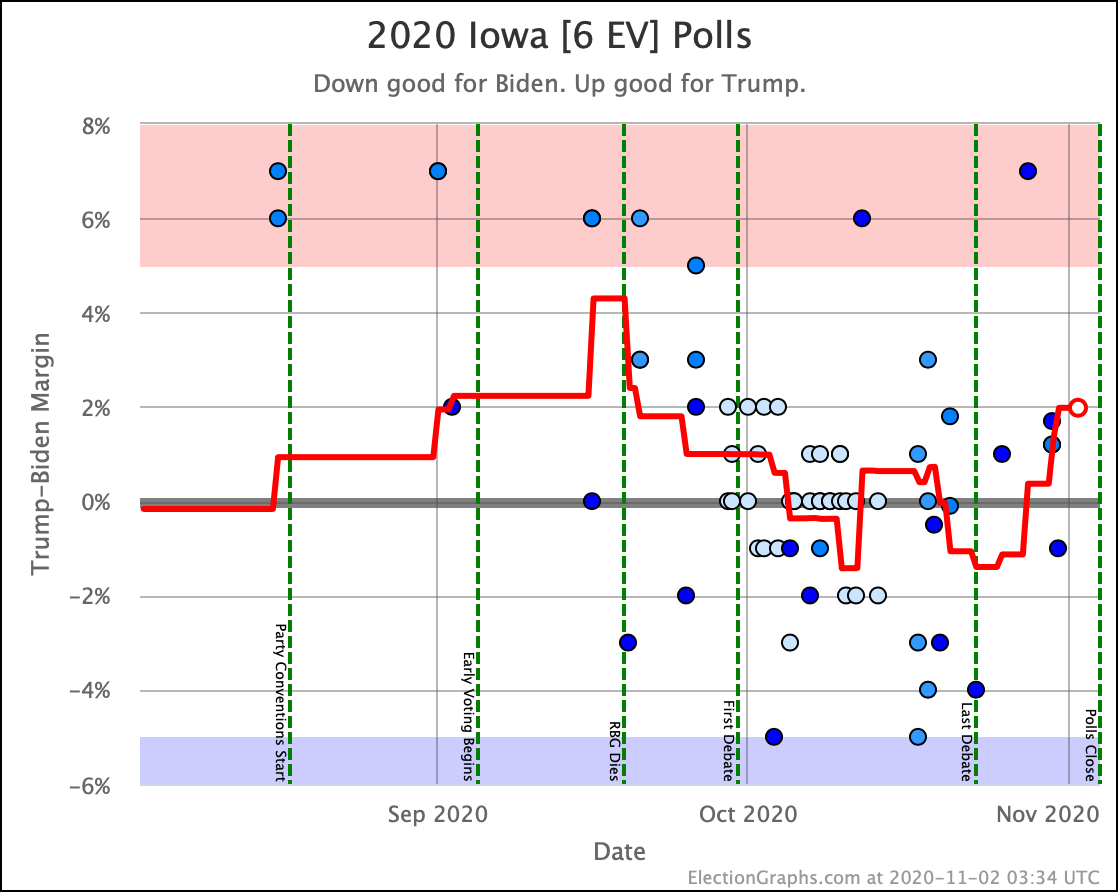
Fox/AP call Iowa for Trump. Takes it off as a possible Biden pickup:

Biden Trump Margin
Trump Best 248 290 Trump by 42
Expected 306 232 Biden by 74
Biden Best 322 216 Biden by 106

2020-11-04 05:15 UTC

Minnesota goes to Biden as expected.

2020-11-04  05:05 UTC

Hawaii goes where you expect.

2020-11-04 04:55 UTC

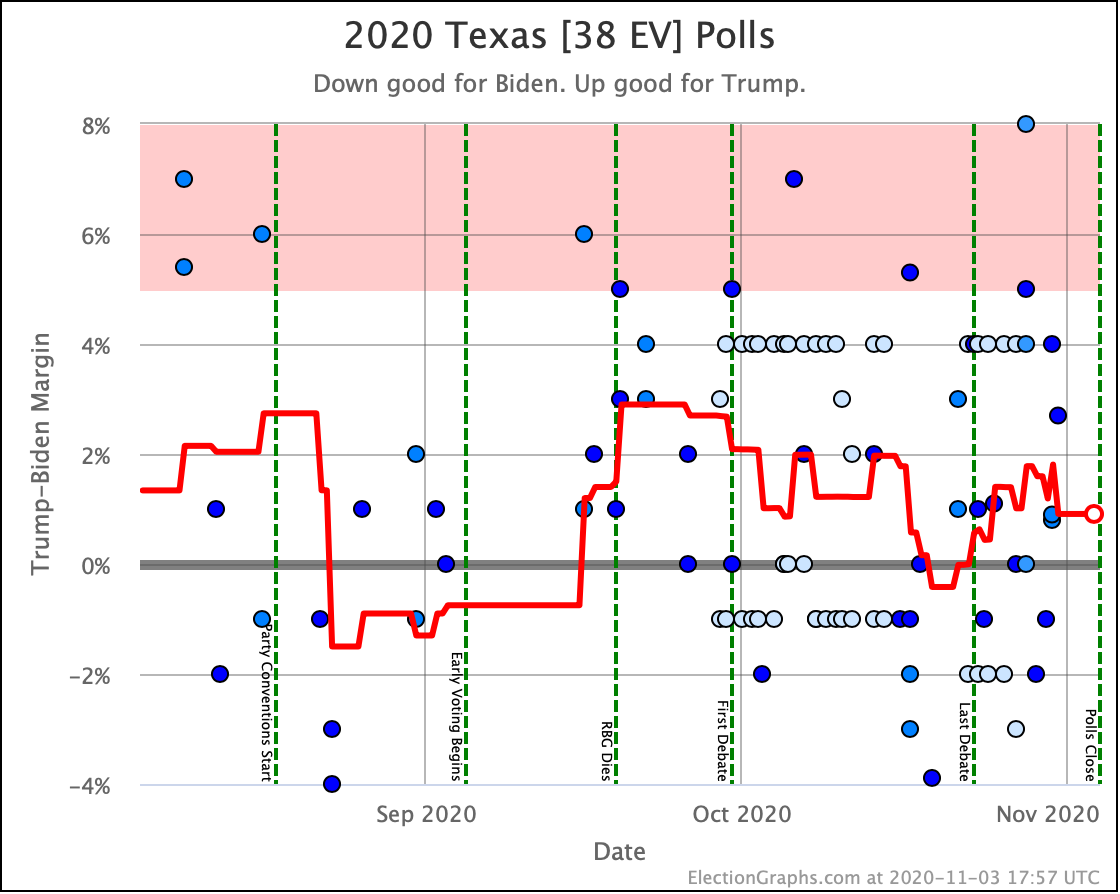
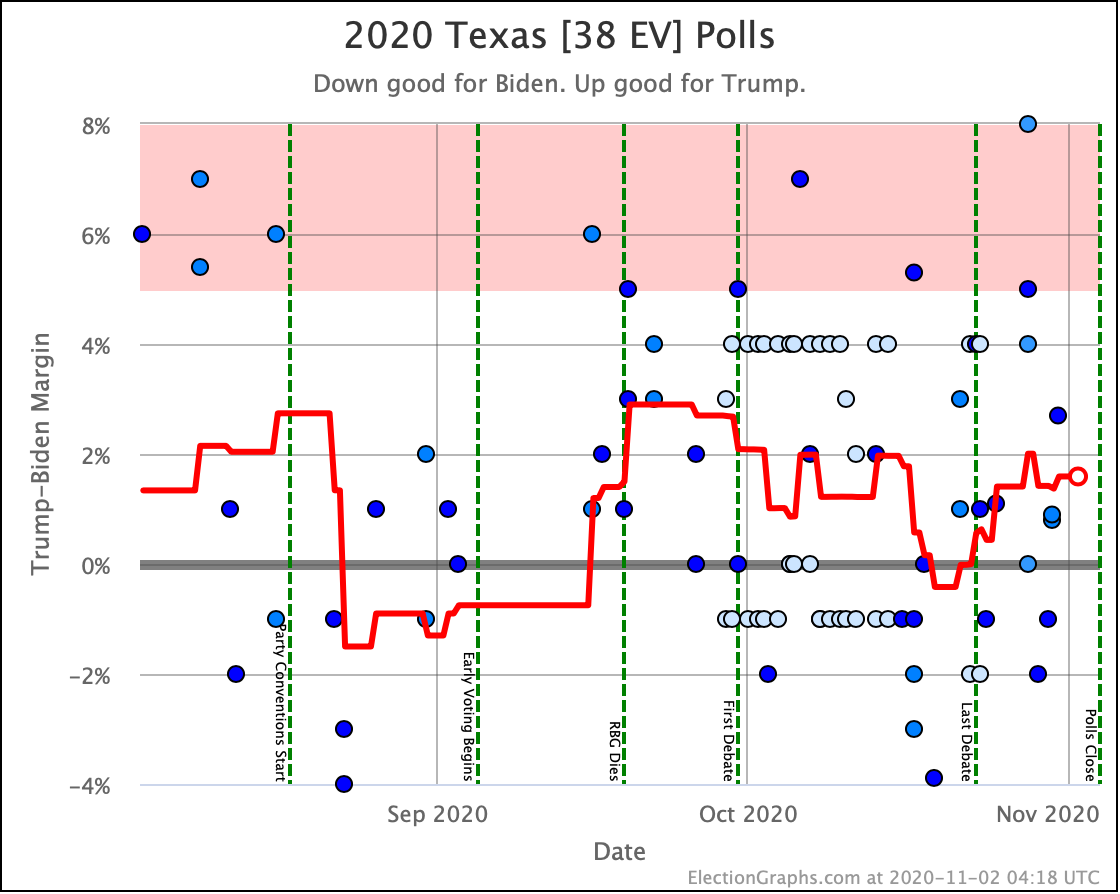
Fox calls Texas for Trump. So that's off the Biden pickup list.

Biden Trump Margin
Trump Best 248 290 Trump by 42
Expected 306 232 Biden by 74
Biden Best 321 210 Biden by 118

2020-11-04 04:46 UTC

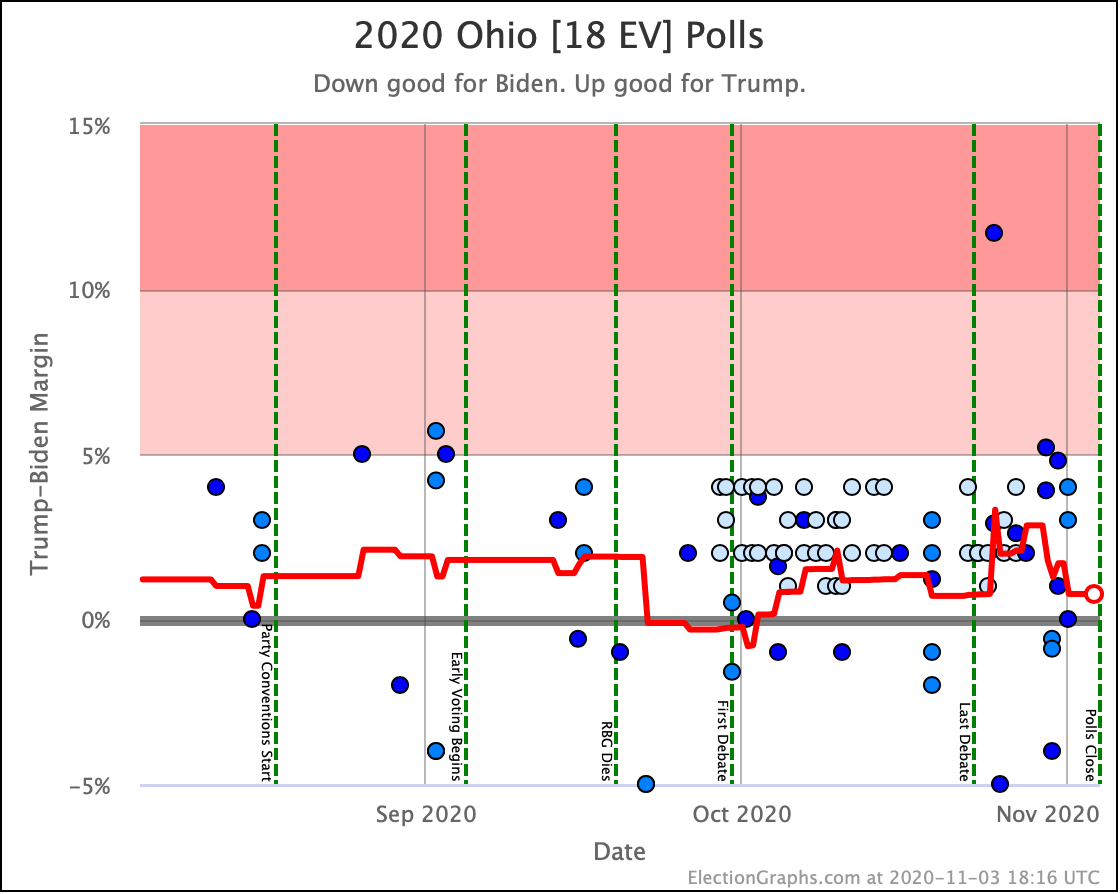
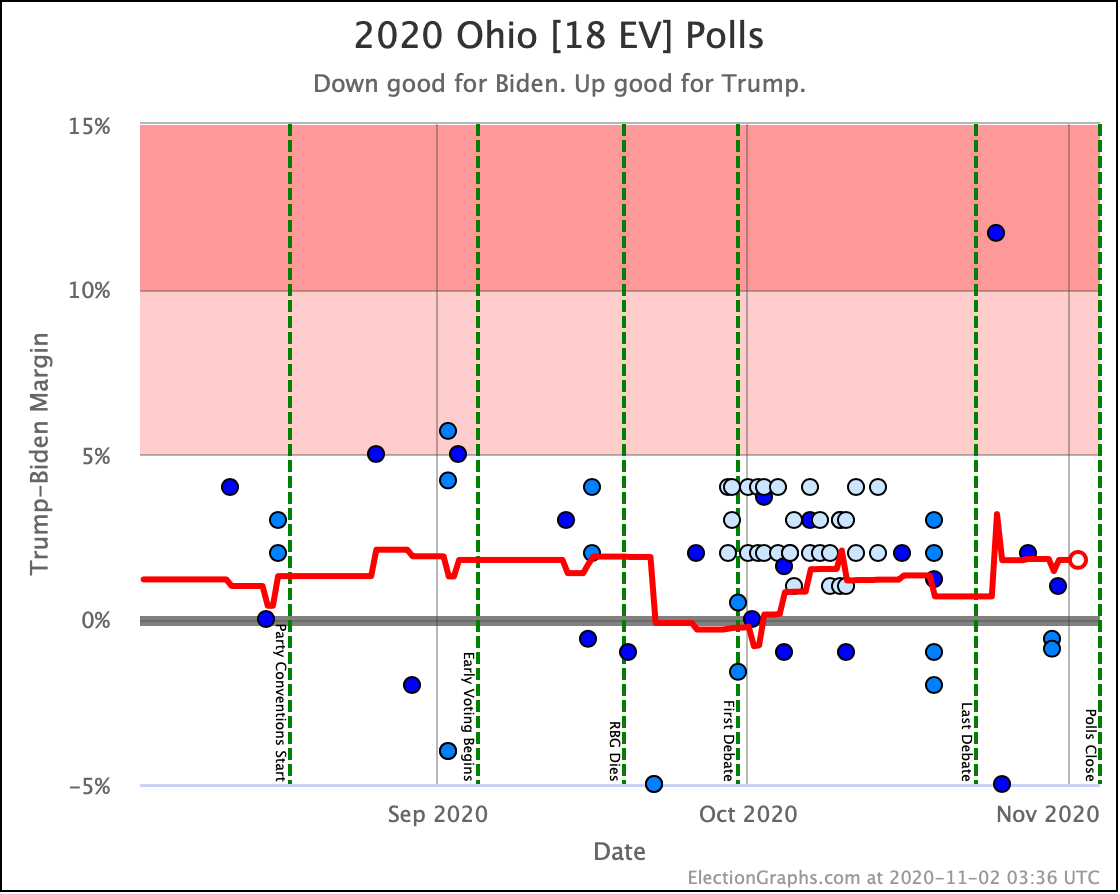
Fox calls Ohio for Trump. Takes it off the possible pick up list for Biden.

Biden Trump Margin
Trump Best 248 290 Trump by 42
Expected 306 232 Biden by 74
Biden Best 366 172 Biden by 194

2020-11-04 04:23 UTC

Fox calls Arizona for Biden. That was a "Weak Biden", so not a flip, but takes it off the table for Trump's best case. New matrix:

Biden Trump Margin
Trump Best 248 290 Trump by 42
Expected 306 232 Biden by 74
Biden Best 384 154 Biden by 230

2020-11-04 04:08 UTC

Idaho goes the way you would thing.

2020-11-04 04:02 UTC

Washington, Oregon, California for Biden.

2020-11-04 03:52 UTC

NBC calls Nebraska, EXCEPT the 2nd.

2020-11-04 03:35 UTC

Louisiana, Utah,  and Kansas called the way you would expect.

New Hampshire too.

2020-11-04 02:30 UTC

NBC calls North Dakota for Trump.

2020-11-04 02:10  UTC

And AP calls Wyoming for Trump.

And New Mexico and Colorado for Biden

NBC calls South Dakota for Trump.

2020-11-04 02:05 UTC

Biden gets New York. Shocker.

2020-11-04 01:40 UTC

Arkansas for Trump. No surprise.

2020-11-04 01:30 UTC:

Missouri for Trump, no surprise.

ME-CD1 and ME-All to Biden. No surprise.

2020-11-04 01:20 UTC

DDHQ calls Florida for Trump. That had been "Weak Biden". First wrong state of the day.

New chart:

Biden Trump Margin
Trump Best 237 301 Trump by 64
Expected 306 232 Biden by 74
Biden Best 384 154 Biden by 230

2020-11-04 01:15 UTC

Massachusetts and Maryland and Delaware and DC and New Jersey to Biden. No surprises. Illinois and Connecticut too. Rhode Island.

Trump gets Alabama, Oklahoma, Mississippi, and Tennessee

Still no states that were actually in question.

2020-11-04 01:00  UTC

AP says Trump in South Carolina. No surprise.

2020-11-04 00:15 UTC

Fox calls Virginia and Vermont for Biden. Also no surprises.

AP calls Kentucky for Trump. No surprise.

DHQ calls West Virginia for Trump. No surprise.

I'll only put in a new matrix if it changes.

2020-11-04 00:05 UTC

Indiana for Trump. It was Strong Trump, so no surprise and no change to the matrix.

Biden Trump Margin
Trump Best 237 301 Trump by 64
Expected 335 203 Biden by 132
Biden Best 413 125 Biden by 288

2020-11-03 23:00 UTC

No states called yet.

Biden Trump Margin
Trump Best 237 301 Trump by 64
Expected 335 203 Biden by 132
Biden Best 413 125 Biden by 288

Election Day: Final Tightening?

It is Election Day.

Election Graphs has logged its last poll on Twitter for the 2020 season. In just a couple of hours, polls will start closing, and we will start getting actual election results.

So where did Election Graphs end up? What is our final prediction?

If you just want the bottom line, without any of the pretty charts or discussion, it is this:

Biden continues to be heavily favored to win. He is still in a stronger position than Clinton was four years ago. However, our numbers show a significant last-minute strengthening by Trump which makes Biden's lead much more tenuous than it was a week ago. If we had the same size polling error as 2016 in Trump's direction, he would win. (The same size error in the other direction would get to a Biden landslide… there are LOTS of close states.)

Having said that, the nature of some of the recent polls raises a real question about how much of this final move is "real" rather than just a lot of partisan and lesser-known pollsters flooding the final averages with polls that are favorable to Trump.

OK. If that is all you need, goodbye! See you for the 2024 cycle!

If you want more detail though, keep reading.

(There will also be a post tracking results as they come in tonight, and eventually, later this year once all the results are known and final, an analysis of how we did, so if those interest you, check back in later!)

The last blog update here was yesterday on November 2nd. There were hundreds of new polls (or at least it seemed that way) on that last day. Here are the changes in our metrics just in the last 24 hours.

Model Metric 2 Nov 3 Nov 𝚫
Probabilities
(Indep States)
Trump 2σ
Median
Biden 2σ
Biden +10
Biden +112
Biden +228
Trump +6
Biden +108
Biden +232
Trump +16
Trump +4
Biden +4
Trump Win
Tie
Biden Win
1.2%
0.1%
98.6%
2.5%
0.3%
97.2%
+1.3%
+0.2%
-1.4%
Probabilities
(Uniform Swing)
Trump 2σ
Median
Biden 2σ
Trump +84
Biden +102
Biden +314
Trump +86
Biden +132
Biden +294
Trump +2
Biden +30
Trump +20
Trump Win
Tie
Biden Win
18.8%
0.0%
81.2%
31.9%
0.0%
68.1%
+13.1%
FLAT
-13.1%
Categories Trump Best
Expected
Biden Best
Trump +64
Biden +102
Biden +288
Trump +64
Biden +132
Biden +288
FLAT
Biden +30
FLAT
Tipping Point Biden +3.5% Biden +2.3% Trump +1.2%

On the one hand, North Carolina moved back to the Biden side of the centerline. Which strengthens Biden by 30 EV in both the Uniform Swing Median and the Expected Case Median. But in the meantime, the huge wave of final polls reduced Biden's margin in the critical "Weak Biden" states.

And yes, it is the same thing I mentioned last time when I said:

There have been dozens of new polls since the update on the 31st. While there were exceptions, the overwhelming theme was polls showing a better picture for Trump and a worse one for Biden than we had seen any time recently. So almost all of the metrics above move in Trump's direction.

As with a couple of the other recent spikes toward Trump in the last few weeks, you can look at the specific polls in the average, and start wondering if this is just a bunch of right-leaning pollsters flooding the zone with polls in the last few days. While there were plenty of results from large mainstream pollsters released in these last few days, there were quite a few partisan polls released too, and some of them definitely helped move the averages toward Trump. I talked about this phenomenon on October 20th, October 24th, and October 31st… so I won't delve into that in-depth again.

Will this deteriorate further in the limited time left? Or bounce back? Or neither? If I had to guess, I'd say reversion to the mean. There have been no major news events in the last week that would seem likely to drive a tightening. So I expect this "tightening" is actually just an artifact. But that is just an educated guess. We will all know soon enough.

It did not revert to the mean. Biden's situation deteriorated a lot more. It ended up being significant in the final numbers.

So I guess I do have to delve into it again. Bottom line, in the last few days before Election Day, every pollster in existence seems to have wanted to make sure they got a shot at Election 2020, and a huge volume of polls was released. Many of these were from pollsters that have clear partisan leanings, and whose results were much more positive to Trump than what we had been seeing. Others were just lesser-known pollsters.

Election Graphs uses a "Last X Polls" model, specifically so that as the election approaches and there is more polling, we look at shorter and shorter timeframes and are more responsive to changes. We also use the mid-date of polls to determine just which polls are part of the "Last X" rather than the end-date. This means that in terms of the "final" averages we favor the very last-minute polls put out with very short times in the field.

The result is that many of the large well-known polling companies with good reputations that put out their final polls late last week or even over the weekend got crowded out of the critical state averages by the large volume of random polls, which often just covered one or two days in the field.

Those pollsters tended to be much more bullish on Trump than the usual suspects who had been polling this race regularly over the last year.

So the averages in many states jerked a few percentage points toward Trump, just in the last few days.

If there was a big event in the news that was bad for Biden, then it would be easy to say that was the cause. The closest thing to that has been the drip-drip of information about Biden's son, but for the most part that has not seemed to actually get much traction. But maybe?

In the absence of a clear reason for movement, while there is most definitely a clear difference in the nature of the polling that comprises the average, it seems reasonable to think that maybe the movement is just an artifact of the polling, and doesn't represent a real change.

So perhaps the picture the site had of the race a week or two ago is actually a better representation of what is happening?

Maybe.

But four years ago we had a similar move in the last few days before the election. And that time it also seemed to be driven by a surge of polls from outlets that hadn't been doing a lot of polling earlier in the cycle. And we ended up closer to the final result because we reflected the change caused by those polls. That last burst of polls ended up being closer to reality than the more established pollsters they displaced.

Of course, that could well have just been luck too.

We set the rules for how we define the averages, what we would include and would not include, etc over two years ago, based heavily on what we did in 2008, 2012, and 2016. We're not going to change anything on the last day.

So it is what it is.

We'll find out in a few hours if the short time frames and the burst of lower quality polls ended up causing Election Graphs to dramatically overestimate Trump and underestimate Biden. If we are way off, maybe we'll change something for 2024. Or maybe the movement seen in these last 48 hours actually better represents what is going on.

I don't know. We will see.

So I can give the caveats above, but the numbers are what they are, and so we'll do the rest of this discussion taking them at face value.

Let's look at all the graphs.

First of all, the comparison with 2016:

After a brief spike toward a stronger position for Biden, the collapse we have been talking about happened. The final tipping point was only a 2.3% Biden lead. Biden had seen worse tipping points, but not since early June.

Even at this level though, Biden is stronger than the 1.6% that Clinton ended with. So he is still in a better position.

However, the difference between the Election Graphs final tipping point and the actual election results in 2016 was 2.36%. So the same size error in the correct direction would make Trump the winner.

In terms of the expected case, where each candidate wins every state where they lead the Election Graphs average, Biden is in the low end of his recent range, but not any lower, and still significantly ahead of where Clinton was.

OK. Let's look at the range of margins predicted by our three models:

In all three of these cases, the center lines have moved toward Trump, but are either still in their normal ranges, or are just barely out it. What has changed though is that in all cases the upper end of the envelopes, representing Trump's best cases has stretched out significantly further into the Trump wins zone.

This makes sense because most of what we saw was not states actually flipping from Biden to Trump in the averages, just Biden's lead in states being significantly diminished. So the straight-up scenario that happens if the averages are all correct doesn't move much. But the sensitivity to the averages being wrong and therefore states flipping to Trump based on those errors increases significantly.

As a sanity check, let's compare our three centerlines with what other sites are saying at the moment:

So I'm in the zone. Most of the big folks have Biden doing better than I do, but there are a few places that have him doing worse.

And the Election Graphs "expected case" exactly matches what the Upshot says would be the result if the polling error in 2020 was the same magnitude and direction as the error in 2016. Which is interesting.

I note of course that nobody has Trump winning in their "expected case".

OK, with that done, let's look at odds.

While still small, the red zone in the Independent States odds view is now significantly larger, with Trump's chances now at 2.5%.

Trump's odds in the uniform swing model are massive now though, at 31.9%.

Fundamentally, since this imagines the extreme case where all the states move in a completely synchronous way, the only thing that matters is the odds in the tipping point state. And as of the final situation, the tipping point is Pennsylvania, and our average has Biden leading Pennsylvania by only 2.3%.

And in our analysis of our results from 2008 to 2016, we discovered that when we have a Democrat leading by 2.3%, that translates into a 68.1% chance of the Democrat winning, and a 31.9% chance of the Republican winning.

So Trump's chance of winning Pennsylvania is 31.9%, and if all the states are locked together, that means his odds of winning the whole election would be 31.9% too.

Since both of these models are extremes, and the truth is somewhere in between, the official Election Graphs statement on Trump's chances at this point is "between 2.5% and 31.9%". Election Graphs doesn't actually model where the right spot is within this range, but the middle is as good a spot to look at as any. That would be a 17.2% chance of a Trump win at the moment.

Once again, let's compare with the other folks:

My two extreme models are unsurprisingly near the extremes. "The middle" puts me lower than most of the "big" outlets. So maybe they think which there is some correlation between the states, their models still think they are more independent than not.

In any case, Biden is a favorite in all of these views. But in some, the chances of an upset are much more than others.

Not including the three from me, the median is a 9.3% chance of a Trump win. Including all three of mine, the median is 10.0%.

So as usual I make the statement that people tend to be bad at interpreting odds. 10% is not 0%. 10% happens all the time. Biden is favored, but a Trump win is still very possible.

Looking at the tipping point without the 2016 comparison, the main thing to notice is the huge volatility at the end. Swinging first in favor of Biden, then against him. This is an indication that perhaps for 2024, I should look into ways to make this a little LESS sensitive to short term changes in the last weeks.

OK. Time for the map and spectrum:

This view makes the volatility of the race clear. There are 10 states (and Maine CD2) with margins less than 5%.

The polling error in 2016 was 2.36%. There are 8 states closer to the centerline than that, including the tipping-point state.

If we get a 2016 size error favoring Trump, we get a very narrow win for Trump, squeaking past the post with an 18 EV margin.

If we get a 2016 size error favoring Biden, Biden wins by 288 EV, the largest winning margin since 1988.

More likely than either extreme of course is that we just get a solid but not extraordinary Biden win.

And now the trends in all the close states:


And that is that.

It is election night. The first results will be coming out within a couple of hours. We may or may not end up knowing who wins tonight, but we'll still learn a lot. And soon enough, we will indeed have a winner.

I hope you have enjoyed Election Graphs and found it useful this year. Aside from seeing how things turn out and how we did, we are done.

It was fun. Thanks everyone!

For more information:

This post is an update based on the data on the Election Graphs Electoral College 2020 page. Election Graphs tracks a poll-based estimate of the Electoral College. The charts, graphs, and maps in the post above are all as of the time of this post. Click through on any image for current interactive versions of the chart, along with additional details.

Follow @ElectionGraphs on Twitter or Election Graphs on Facebook to see announcements of updates. For those interested in individual poll updates, follow @ElecCollPolls on Twitter for all the polls as I add them. If you find the information in these posts informative or useful, please consider visiting the donation page.

1.5 Days Out: Good Poll Cycle for Trump

As always, if you are impatient for one of these updates, the 2020 Electoral College pages on Election Graphs are updated multiple times every day as new polls come in. Or you can follow @ElecCollPolls on Twitter to see all the polls as I add them. While you are at it, follow @ElectionGraphs too.

The last blog update here was on October 31st. It is now November 2nd. We only have about a day and a half to go until we start getting actual results from Election 2020. I expect to do one more blog update before polls close on Election Day.

Model Metric 31 Oct 2 Nov 𝚫
Probabilities
(Indep States)
Trump 2σ
Median
Biden 2σ
Biden +52
Biden +150
Biden +256
Biden +10
Biden +112
Biden +228
Trump +42
Trump +38
Trump +28
Trump Win
Tie
Biden Win
0.1%
0.0%
99.9%
1.2%
0.1%
98.6%
+1.1%
+0.1%
-1.3%
Probabilities
(Uniform Swing)
Trump 2σ
Median
Biden 2σ
Trump +52
Biden +176
Biden +294
Trump +84
Biden +102
Biden +314
Trump +32
Trump +74
Biden +20
Trump Win
Tie
Biden Win
14.6%
0.0%
85.4%
18.8%
0.0%
81.2%
+4.2%
FLAT
-4.2%
Categories Trump Best
Expected
Biden Best
Trump +20
Biden +176
Biden +288
Trump +64
Biden +102
Biden +288
Trump +44
Trump +74
FLAT
Tipping Point Biden +4.3% Biden +3.5% Trump +0.8%

There have been dozens of new polls since the update on the 31st. While there were exceptions, the overwhelming theme was polls showing a better picture for Trump and a worse one for Biden than we had seen any time recently. So almost all of the metrics above move in Trump's direction.

As with a couple of the other recent spikes toward Trump in the last few weeks, you can look at the specific polls in the average, and start wondering if this is just a bunch of right-leaning pollsters flooding the zone with polls in the last few days. While there were plenty of results from large mainstream pollsters released in these last few days, there were quite a few partisan polls released too, and some of them definitely helped move the averages toward Trump. I talked about this phenomenon on October 20th, October 24th, and October 31st… so I won't delve into that in-depth again.

But there is one critical difference. Judging by what happened in the last couple of cycles, there might be a handful of straggler polls released Tuesday morning, but we really only have one full day left for polls to be released. And many of the major pollsters have already released their "final polls" for the critical states. That means that any outliers introduced in the last few days, or in the remaining time we have left, will very likely still be part of the final averages this site produces.

There is no longer much time for an outlier poll to be "washed out" by additional polling. We are nearly at the end.

So while there may be some changes tomorrow, let's take seriously what we have today, and not try to make excuses. Four years ago on this site, there was a similar move toward Trump in the final days, and I somewhat dismissed it by pointing out the influence of partisan pollsters and what looked like possible outliers in the late-breaking polls. And of course, in retrospect, that move was real.

Is this move real? We'll know once the actual votes get counted.

So what do we have today if we take our averages seriously?

So let's look at all the graphs.

First of all, the comparison with 2016:

In the tipping point, which represents the degree polls need to be wrong and/or change before the end in order to flip the winner, Biden now holds a 3.5% lead. This is the worst level Biden has been at since mid-June, but it still beats the 1.6% Clinton was at four years ago by a significant amount.

Will this deteriorate further in the limited time left? Or bounce back? Or neither? If I had to guess, I'd say reversion to the mean. There have been no major news events in the last week that would seem likely to drive a tightening. So I expect this "tightening" is actually just an artifact. But that is just an educated guess. We will all know soon enough.

In terms of the expected case, where each candidate wins every state where they lead the Election Graphs average, Biden has a slightly lower margin than he has seen before in the last three months. Georgia, North Carolina, Texas, Ohio, and Iowa, all of which have spent time on the Biden side of the centerline, are all now in "Weak Trump" territory in the Election Graphs averages at the same time.

But Biden is still ahead by 102 electoral votes in this view. By this time four years ago, Clinton was hanging on with only an 8 electoral vote lead.

OK. Let's look at the range of margins predicted by our three models:

All three of these still have their centerlines with the narrowest Biden lead they have seen in the last three months. These levels were last seen in June. So not unprecedented, but still breaking out of the recent zone.

In terms of odds from the probabilistic views, the Independent States chart no longer just looks like a blue square. So here it is:

See that little bit of red at the bottom right? For the first time in a long time, Trump's chance of winning is visible in this view, as it rises to 1.2%. Prior to this bump, the highest this has been in the last three months was 0.2%.

Those odds assume that there is no correlation between polling errors in different states though. So time to look at the other extreme.

In this view, Trump is now at an 18.8% chance of winning.

As with all of the other views, this is the best Trump's numbers have been in the last three months.

Since both of these models are extremes, and the truth is somewhere in between, the official Election Graphs statement on Trump's chances at this point is "between 1.2% and 18.8%". The middle of that range is 10.1%.

While Election Graphs doesn't actually model where the right spot is within this range, the middle is as good a spot to look at as any. So I'll just call it a 10.1% chance of a Trump win at the moment. That is up from 7.4% when we looked at this two days ago.

As 2016 should have taught everyone, a 10% chance of winning is not the same thing as a 0% chance of winning. Things that happen 1 in 10 times happen many many times every day.

Having said that, Biden is still a heavy favorite. We're not in a coin toss scenario, and certainly not in a situation where Trump is favored.

Looking at the tipping point without the 2016 comparison, there is one additional thing I would like to point out besides the fact that the tipping point is at a 3.5% Biden lead, which is outside of the range it has been in for the last three months.

Specifically, look a few days earlier. The many polls that came since the last update included a lot of polls that were very favorable to Biden that were in the field a few days earlier than the ones that drove the current numbers toward Trump. So I now show a peak on October 29th to a 7.4% tipping point lead for Biden based on that polling! That was also outside the normal range for the last three months. In fact, it was the best tipping point number Biden has EVER seen!

Because polls are coming in fast and furious, and Election Graphs is intentionally very sensitive to short term changes as polling velocity increases, we are seeing LOTS of volatility as outliers come and go from the averages.

Which is another reason to think that the "truth" here is probably a fairly stable Biden +5% tipping point lead, and the ups and downs here are just polling noise. Maybe in future cycles, I should consider making things a little LESS sensitive to short term changes. Maybe a 10 poll average instead of a 5 poll average. That would smooth things out a little bit.

For now though, when you see a noisy graph like this, it almost always means that the true "signal" is not actually an underlying reality rapidly moving up and down, but rather you are just seeing measurement artifacts, and you want to consider the overarching trend, not the transient jiggles.

OK. Time for the map and spectrum:

As with all the other views, we have shown, this spectrum shows a lot closer race than we have seen since June. There are more states on the Trump side of the centerline, and the "Weak Biden" states are weaker than they were.

Subject to any changes due to additional polls coming in over the next day or so, what does that mean in different polling error scenarios?

As we discussed last time, the Election Graphs tipping point was off by 0.89% in 2012, 2.36% in 2016, and 3.45% in 2008.

You need a larger error than any of those three election cycles to get a straight-up Trump victory.

But a 2008 level error would have Trump winning Maine CD2, Arizona, and Florida in addition to the states he leads, and leave Biden's win dependant on a lead of less than 0.1% in Pennsylvania. With all of the talk of legal disputes over what ballots are counted, a 2008 level polling error in this direction would certainly put that scenario into play.

On the other hand, even a 2016 level polling error in the other direction would result in Biden winning Georgia, North Carolina, Texas, Ohio, and Iowa. That would be Biden 413, Trump 125 in the final count, or a 288 electoral vote margin, which would be the largest win since Bush beat Dukakis in 1988.

The most likely result is of course in between: A Biden win, but not by an overwhelming margin.

And now the trends in all the close states:

And that is that.

1.5 days until the first results start coming in on election night.

If you are eligible to vote in the US and have not yet done so, make your plan and get it done.

For more information:

This post is an update based on the data on the Election Graphs Electoral College 2020 page. Election Graphs tracks a poll-based estimate of the Electoral College. The charts, graphs, and maps in the post above are all as of the time of this post. Click through on any image for current interactive versions of the chart, along with additional details.

Follow @ElectionGraphs on Twitter or Election Graphs on Facebook to see announcements of updates. For those interested in individual poll updates, follow @ElecCollPolls on Twitter for all the polls as I add them. If you find the information in these posts informative or useful, please consider visiting the donation page.