It is Election Day.
Election Graphs has logged its last poll on Twitter for the 2020 season. In just a couple of hours, polls will start closing, and we will start getting actual election results.
So where did Election Graphs end up? What is our final prediction?
If you just want the bottom line, without any of the pretty charts or discussion, it is this:
Biden continues to be heavily favored to win. He is still in a stronger position than Clinton was four years ago. However, our numbers show a significant last-minute strengthening by Trump which makes Biden's lead much more tenuous than it was a week ago. If we had the same size polling error as 2016 in Trump's direction, he would win. (The same size error in the other direction would get to a Biden landslide… there are LOTS of close states.)
Having said that, the nature of some of the recent polls raises a real question about how much of this final move is "real" rather than just a lot of partisan and lesser-known pollsters flooding the final averages with polls that are favorable to Trump.
OK. If that is all you need, goodbye! See you for the 2024 cycle!
If you want more detail though, keep reading.
(There will also be a post tracking results as they come in tonight, and eventually, later this year once all the results are known and final, an analysis of how we did, so if those interest you, check back in later!)
The last blog update here was yesterday on November 2nd. There were hundreds of new polls (or at least it seemed that way) on that last day. Here are the changes in our metrics just in the last 24 hours.
| Model | Metric | 2 Nov | 3 Nov | 𝚫 |
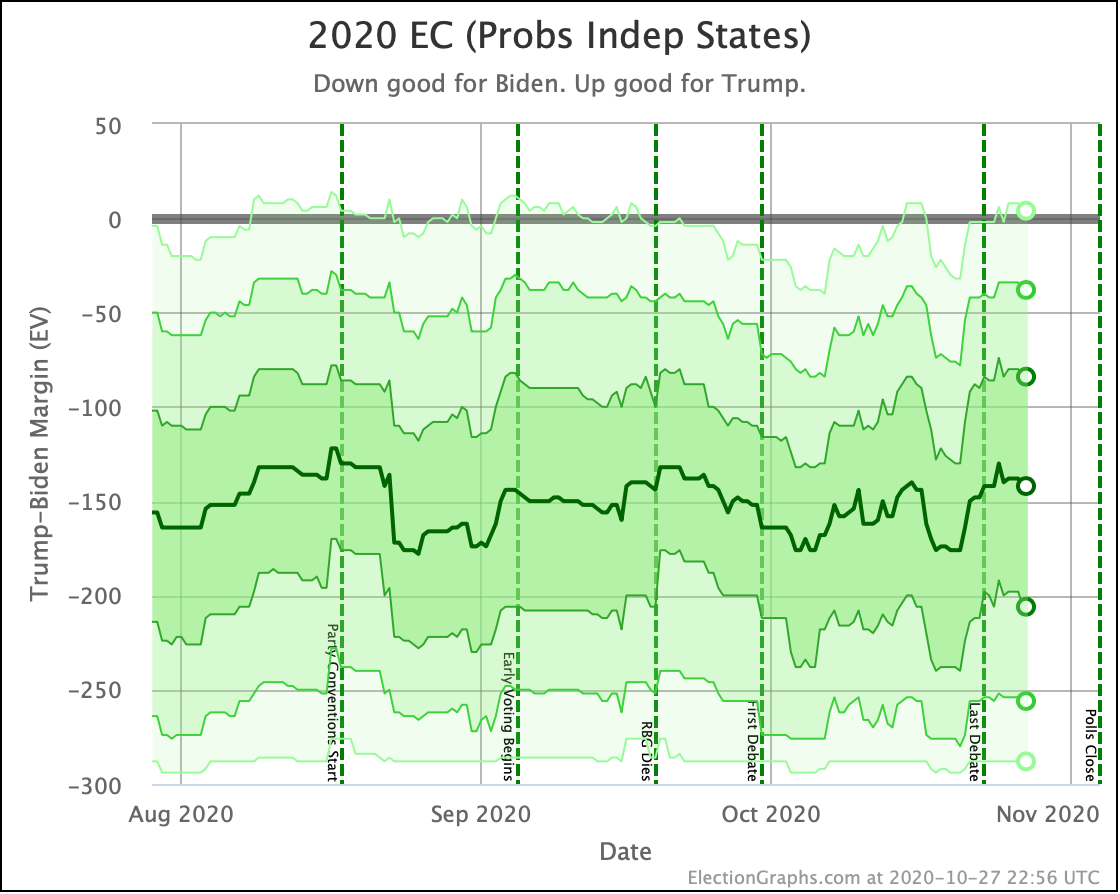
| Probabilities (Indep States) |
Trump 2σ Median Biden 2σ |
Biden +10 Biden +112 Biden +228 |
Trump +6 Biden +108 Biden +232 |
Trump +16 Trump +4 Biden +4 |
| Trump Win Tie Biden Win |
1.2% 0.1% 98.6% |
2.5% 0.3% 97.2% |
+1.3% +0.2% -1.4% |
|
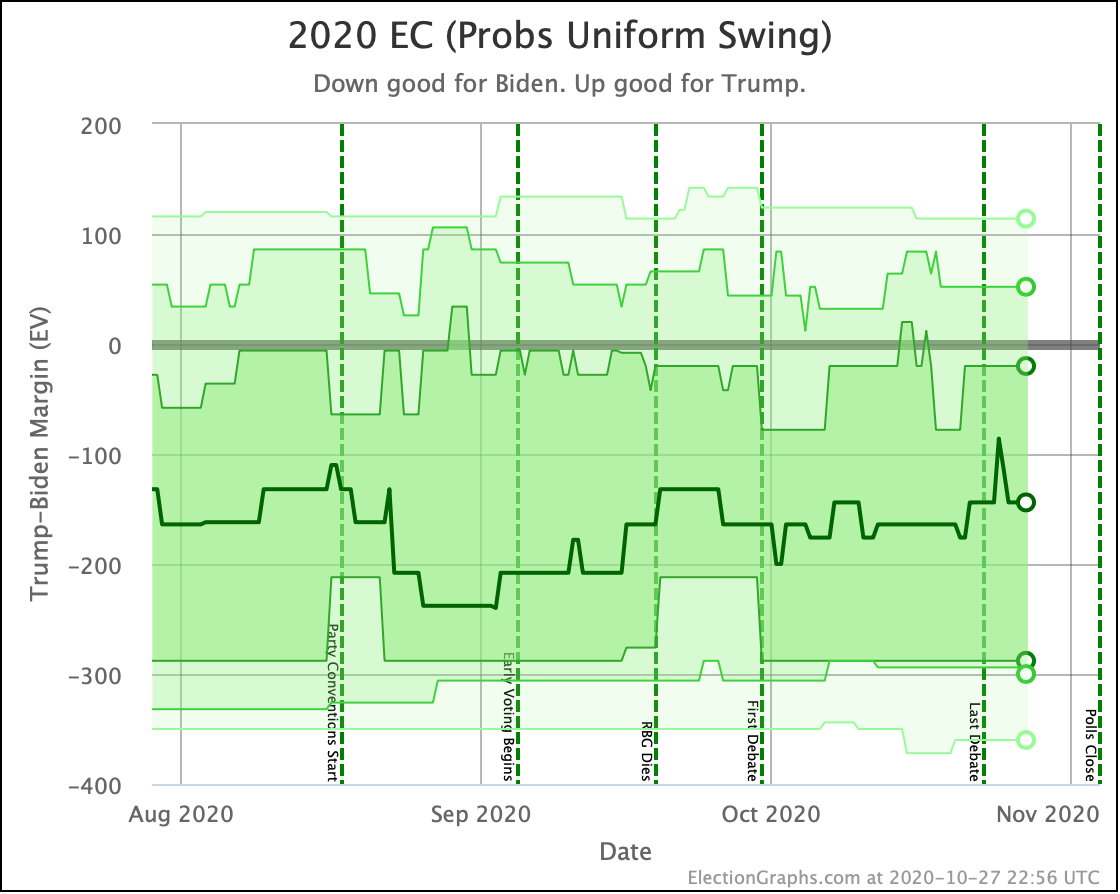
| Probabilities (Uniform Swing) |
Trump 2σ Median Biden 2σ |
Trump +84 Biden +102 Biden +314 |
Trump +86 Biden +132 Biden +294 |
Trump +2 Biden +30 Trump +20 |
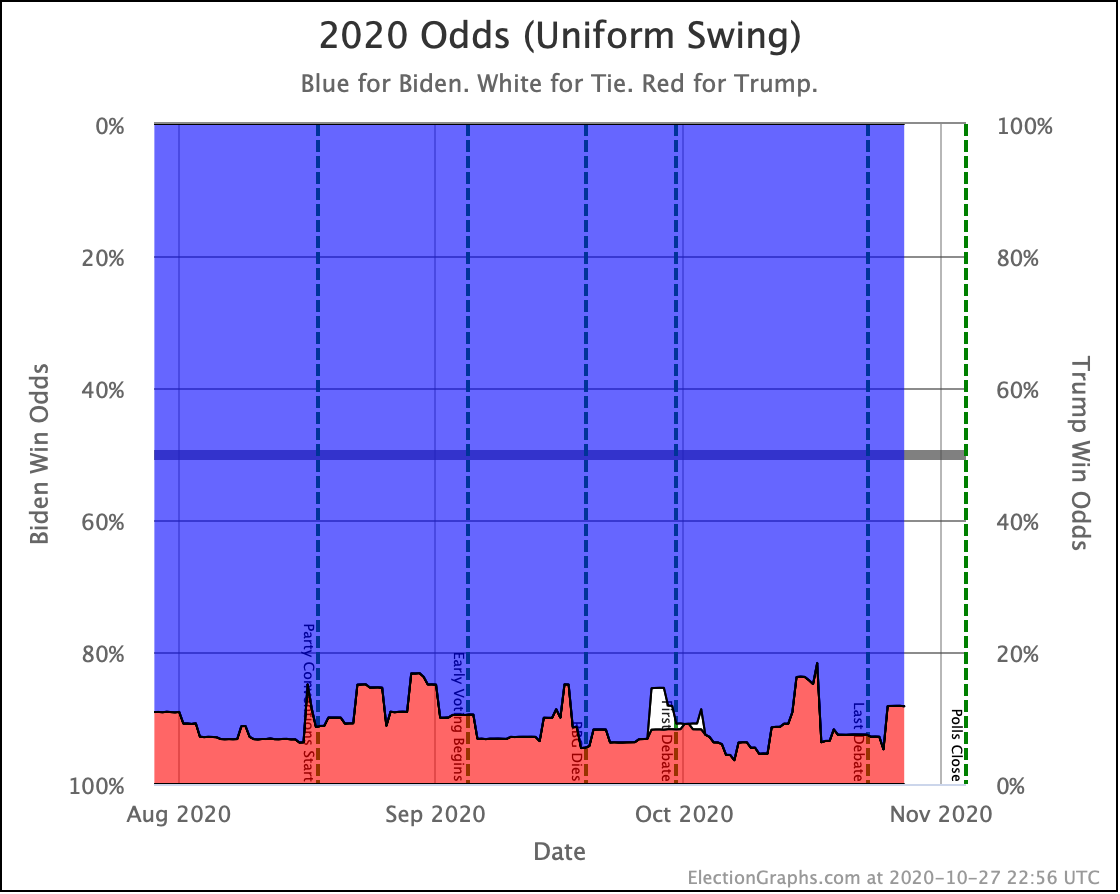
| Trump Win Tie Biden Win |
18.8% 0.0% 81.2% |
31.9% 0.0% 68.1% |
+13.1% FLAT -13.1% |
|
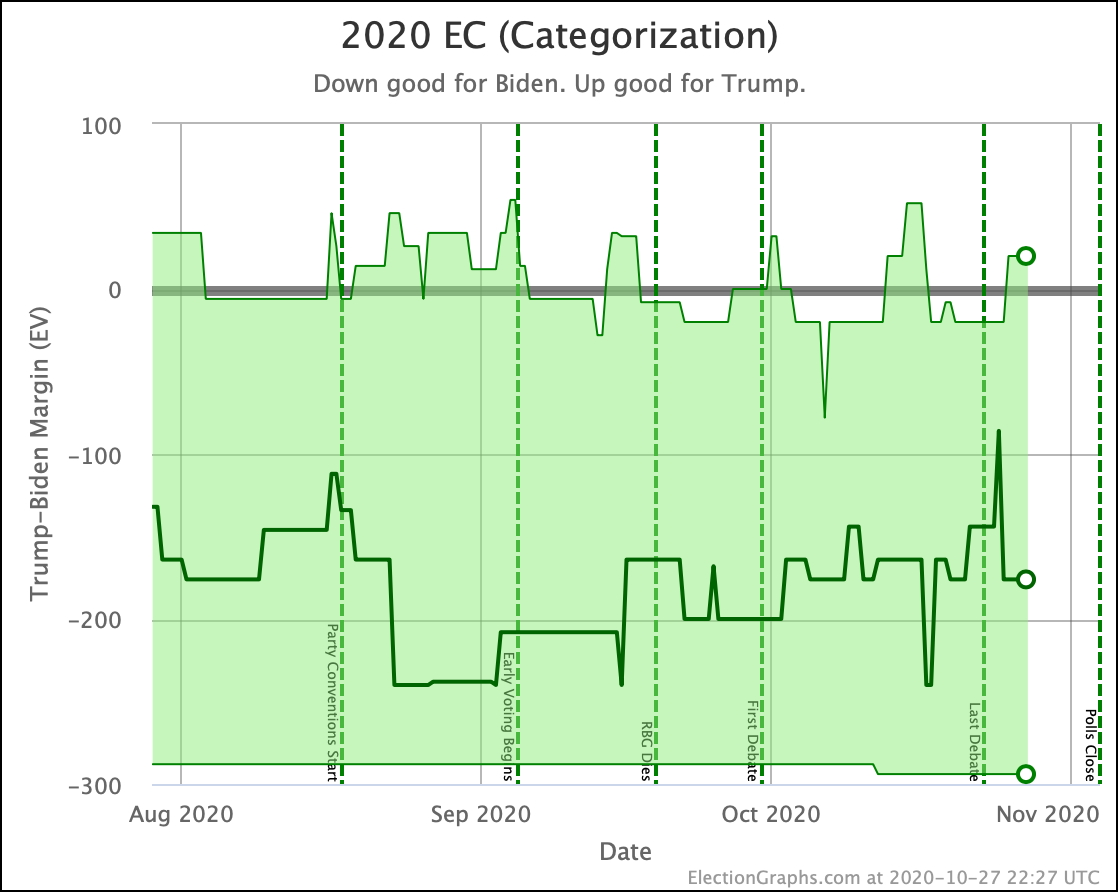
| Categories | Trump Best Expected Biden Best |
Trump +64 Biden +102 Biden +288 |
Trump +64 Biden +132 Biden +288 |
FLAT Biden +30 FLAT |
| Tipping Point | Biden +3.5% | Biden +2.3% | Trump +1.2% |
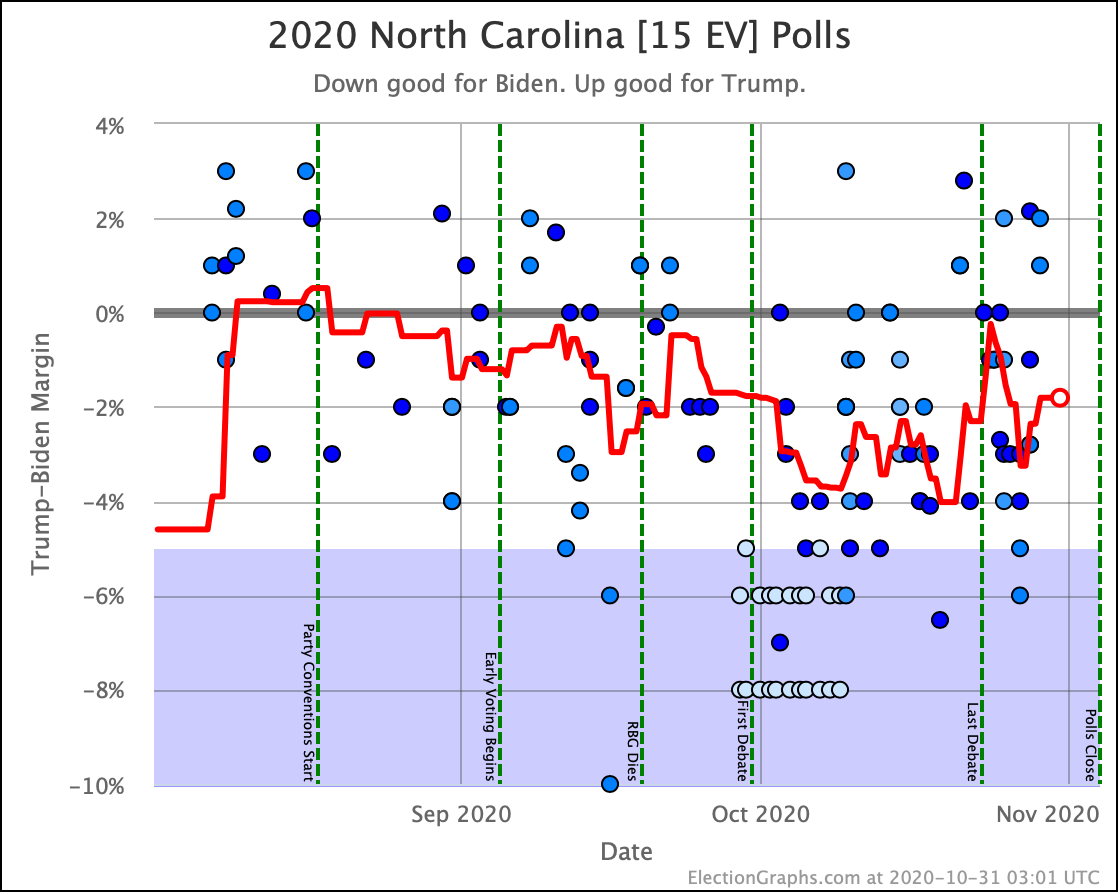
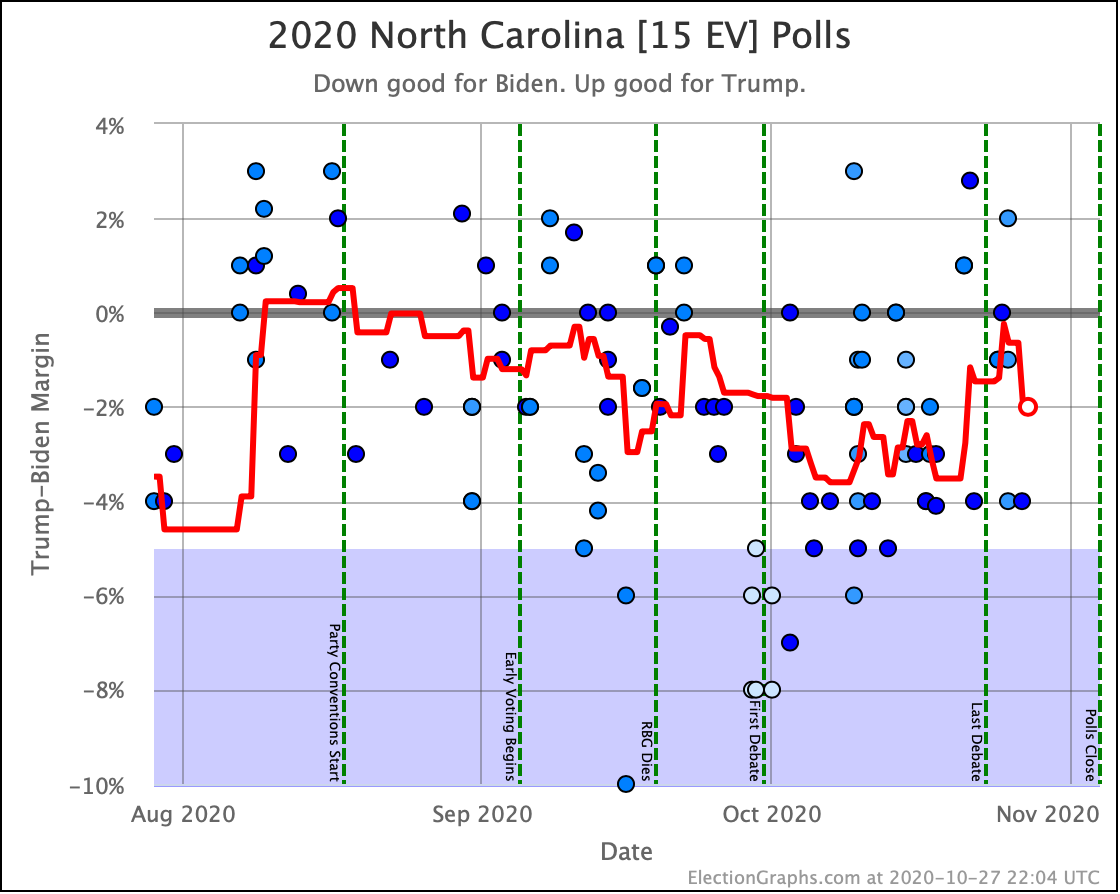
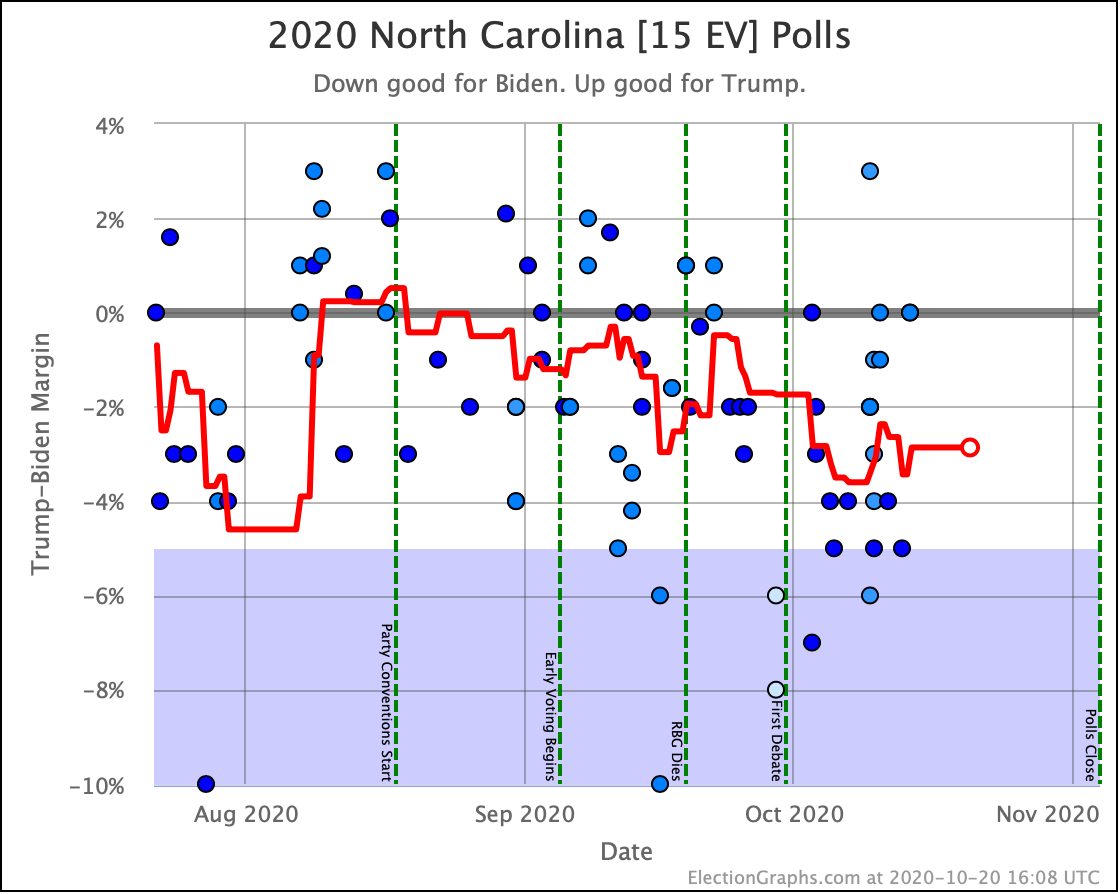
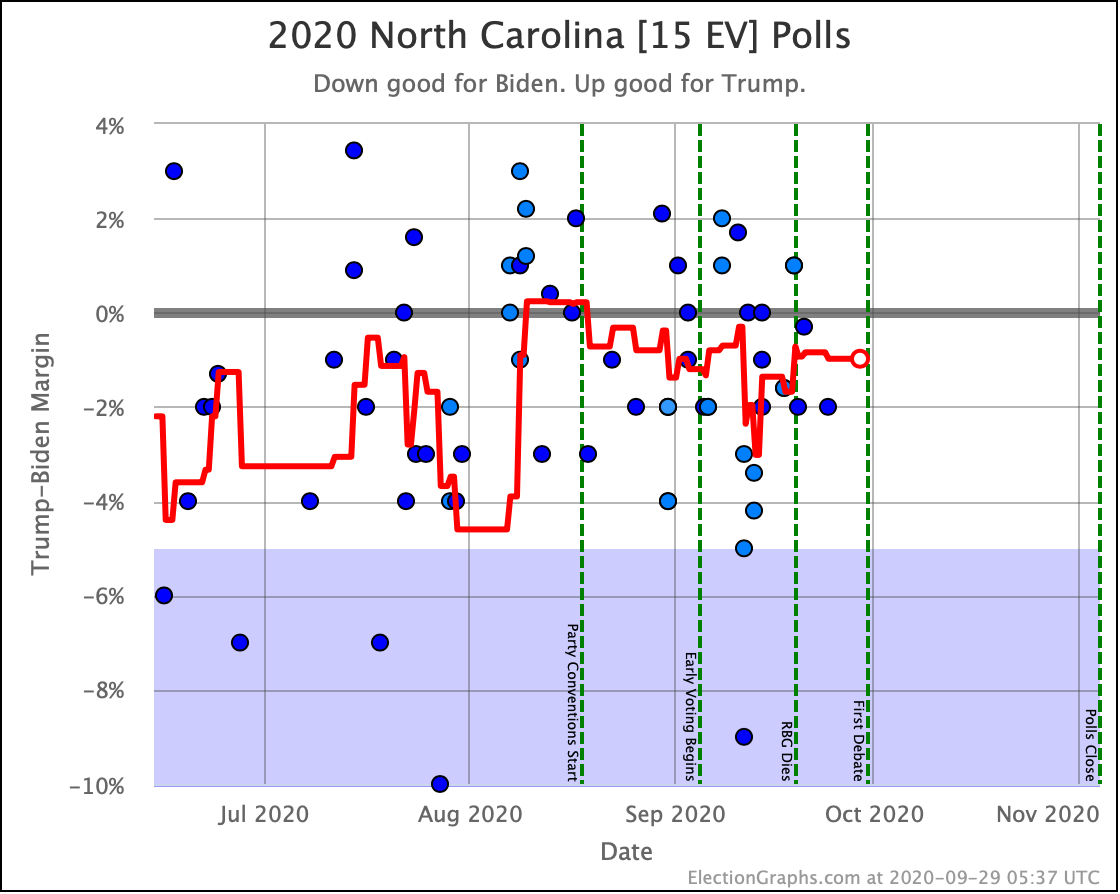
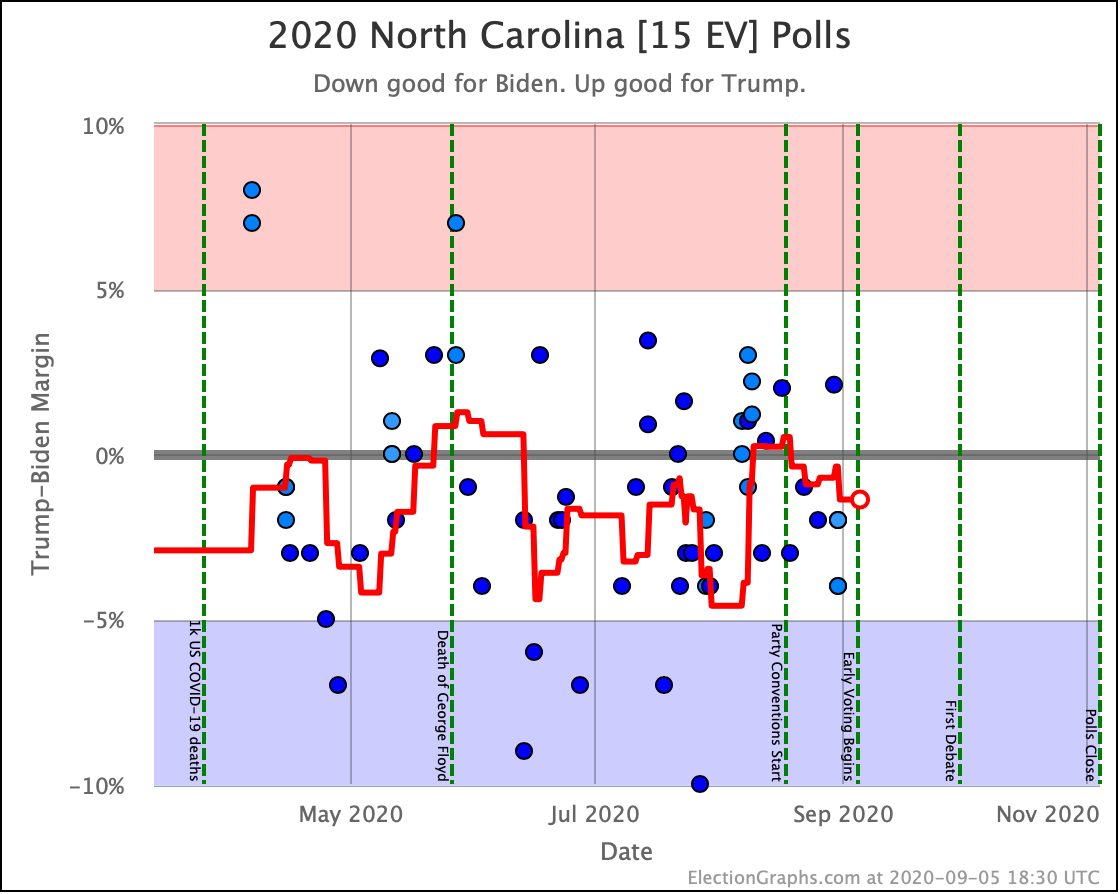
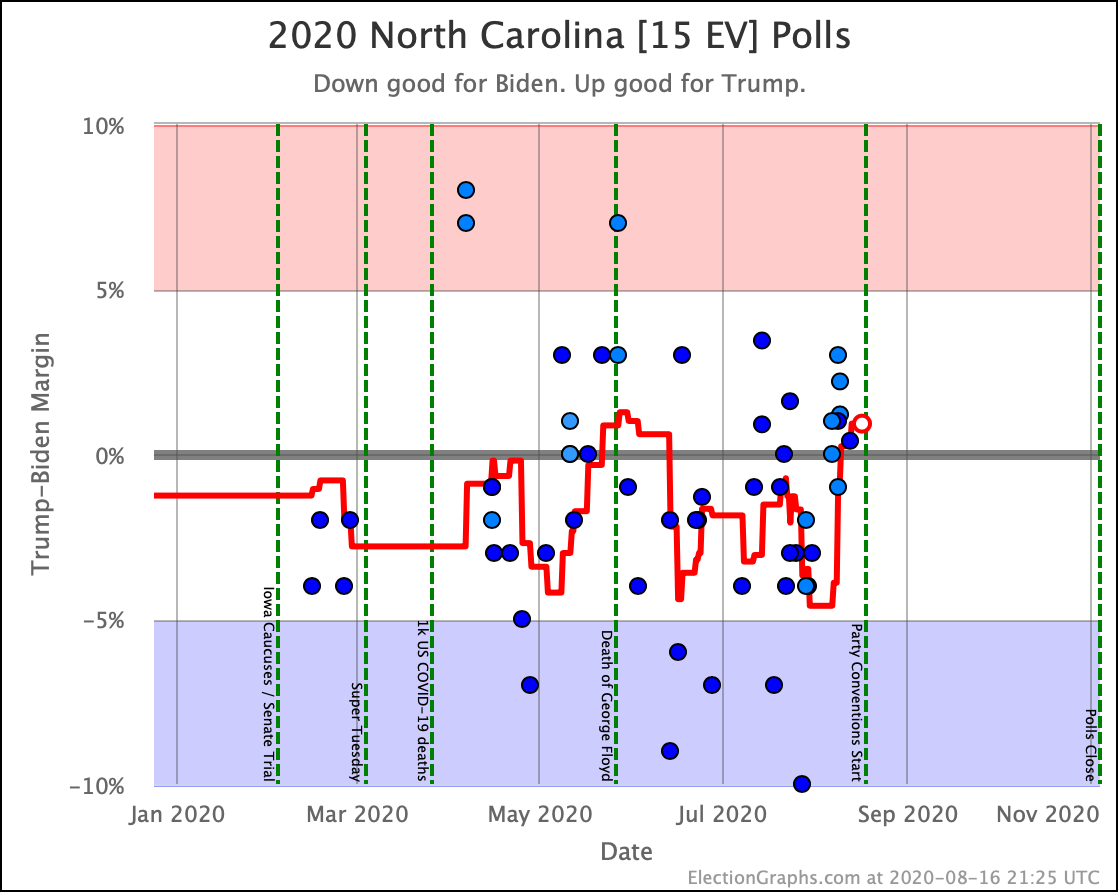
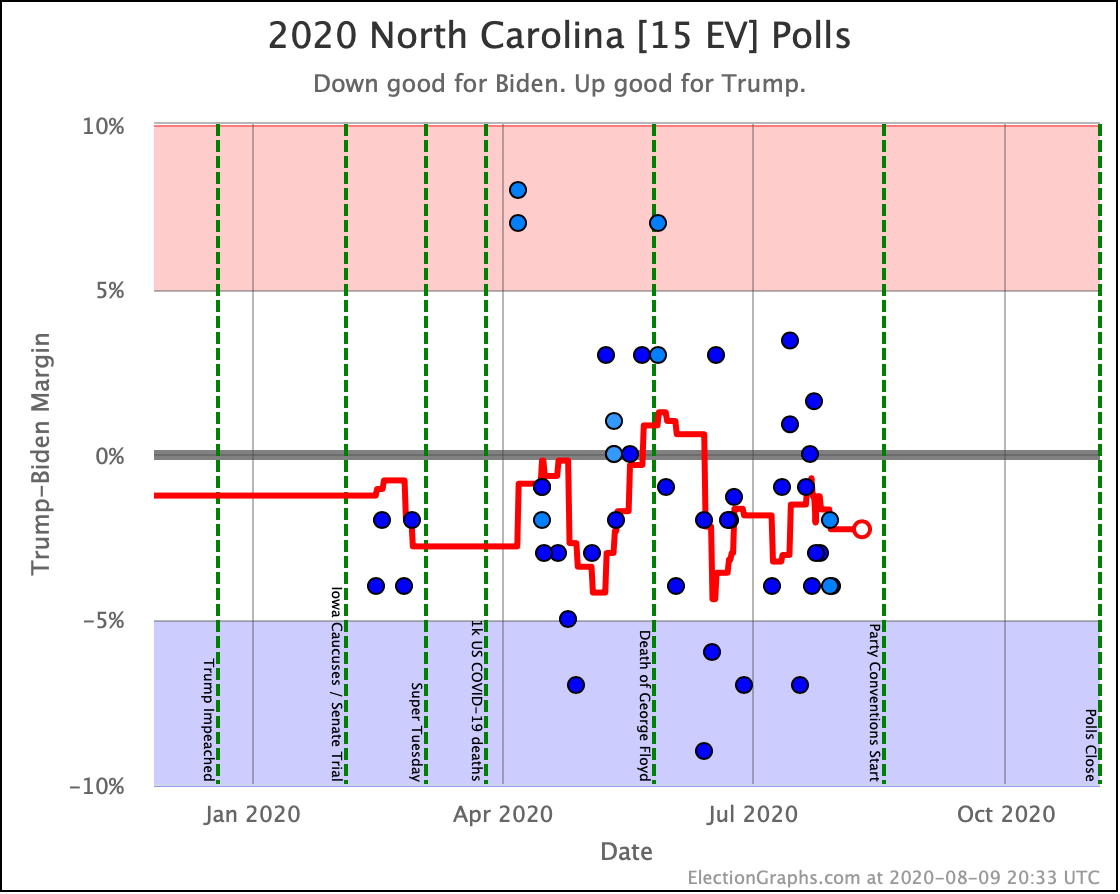
On the one hand, North Carolina moved back to the Biden side of the centerline. Which strengthens Biden by 30 EV in both the Uniform Swing Median and the Expected Case Median. But in the meantime, the huge wave of final polls reduced Biden's margin in the critical "Weak Biden" states.
And yes, it is the same thing I mentioned last time when I said:
There have been dozens of new polls since the update on the 31st. While there were exceptions, the overwhelming theme was polls showing a better picture for Trump and a worse one for Biden than we had seen any time recently. So almost all of the metrics above move in Trump's direction.
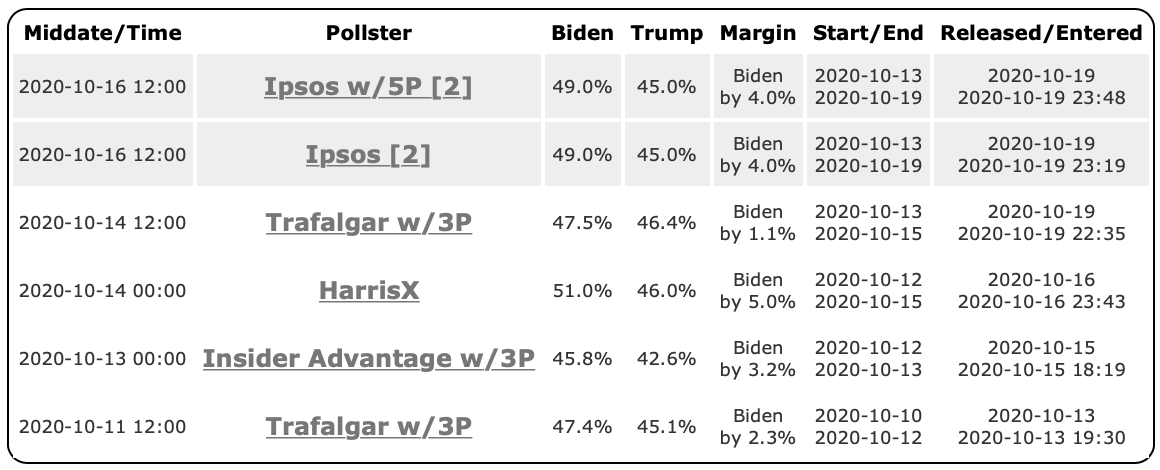
As with a couple of the other recent spikes toward Trump in the last few weeks, you can look at the specific polls in the average, and start wondering if this is just a bunch of right-leaning pollsters flooding the zone with polls in the last few days. While there were plenty of results from large mainstream pollsters released in these last few days, there were quite a few partisan polls released too, and some of them definitely helped move the averages toward Trump. I talked about this phenomenon on October 20th, October 24th, and October 31st… so I won't delve into that in-depth again.
…
Will this deteriorate further in the limited time left? Or bounce back? Or neither? If I had to guess, I'd say reversion to the mean. There have been no major news events in the last week that would seem likely to drive a tightening. So I expect this "tightening" is actually just an artifact. But that is just an educated guess. We will all know soon enough.
It did not revert to the mean. Biden's situation deteriorated a lot more. It ended up being significant in the final numbers.
So I guess I do have to delve into it again. Bottom line, in the last few days before Election Day, every pollster in existence seems to have wanted to make sure they got a shot at Election 2020, and a huge volume of polls was released. Many of these were from pollsters that have clear partisan leanings, and whose results were much more positive to Trump than what we had been seeing. Others were just lesser-known pollsters.
Election Graphs uses a "Last X Polls" model, specifically so that as the election approaches and there is more polling, we look at shorter and shorter timeframes and are more responsive to changes. We also use the mid-date of polls to determine just which polls are part of the "Last X" rather than the end-date. This means that in terms of the "final" averages we favor the very last-minute polls put out with very short times in the field.
The result is that many of the large well-known polling companies with good reputations that put out their final polls late last week or even over the weekend got crowded out of the critical state averages by the large volume of random polls, which often just covered one or two days in the field.
Those pollsters tended to be much more bullish on Trump than the usual suspects who had been polling this race regularly over the last year.
So the averages in many states jerked a few percentage points toward Trump, just in the last few days.
If there was a big event in the news that was bad for Biden, then it would be easy to say that was the cause. The closest thing to that has been the drip-drip of information about Biden's son, but for the most part that has not seemed to actually get much traction. But maybe?
In the absence of a clear reason for movement, while there is most definitely a clear difference in the nature of the polling that comprises the average, it seems reasonable to think that maybe the movement is just an artifact of the polling, and doesn't represent a real change.
So perhaps the picture the site had of the race a week or two ago is actually a better representation of what is happening?
Maybe.
But four years ago we had a similar move in the last few days before the election. And that time it also seemed to be driven by a surge of polls from outlets that hadn't been doing a lot of polling earlier in the cycle. And we ended up closer to the final result because we reflected the change caused by those polls. That last burst of polls ended up being closer to reality than the more established pollsters they displaced.
Of course, that could well have just been luck too.
We set the rules for how we define the averages, what we would include and would not include, etc over two years ago, based heavily on what we did in 2008, 2012, and 2016. We're not going to change anything on the last day.
So it is what it is.
We'll find out in a few hours if the short time frames and the burst of lower quality polls ended up causing Election Graphs to dramatically overestimate Trump and underestimate Biden. If we are way off, maybe we'll change something for 2024. Or maybe the movement seen in these last 48 hours actually better represents what is going on.
I don't know. We will see.
So I can give the caveats above, but the numbers are what they are, and so we'll do the rest of this discussion taking them at face value.
Let's look at all the graphs.
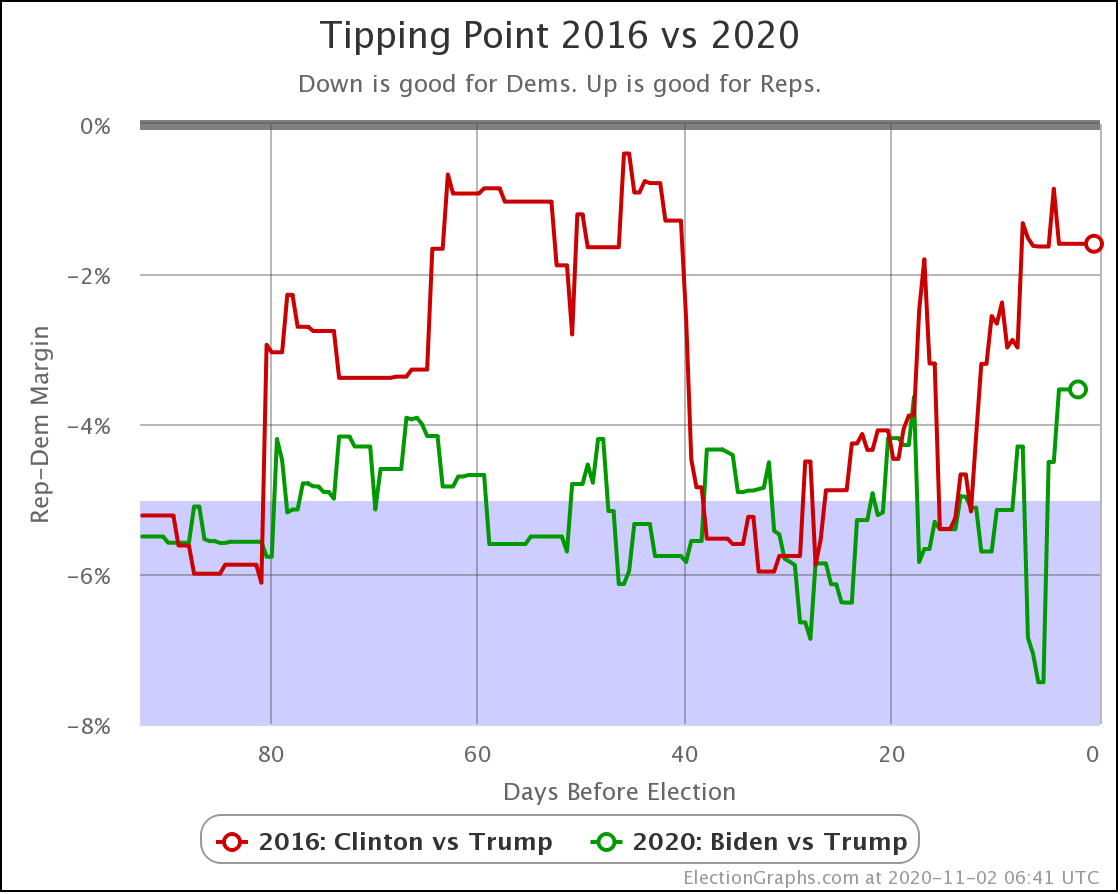
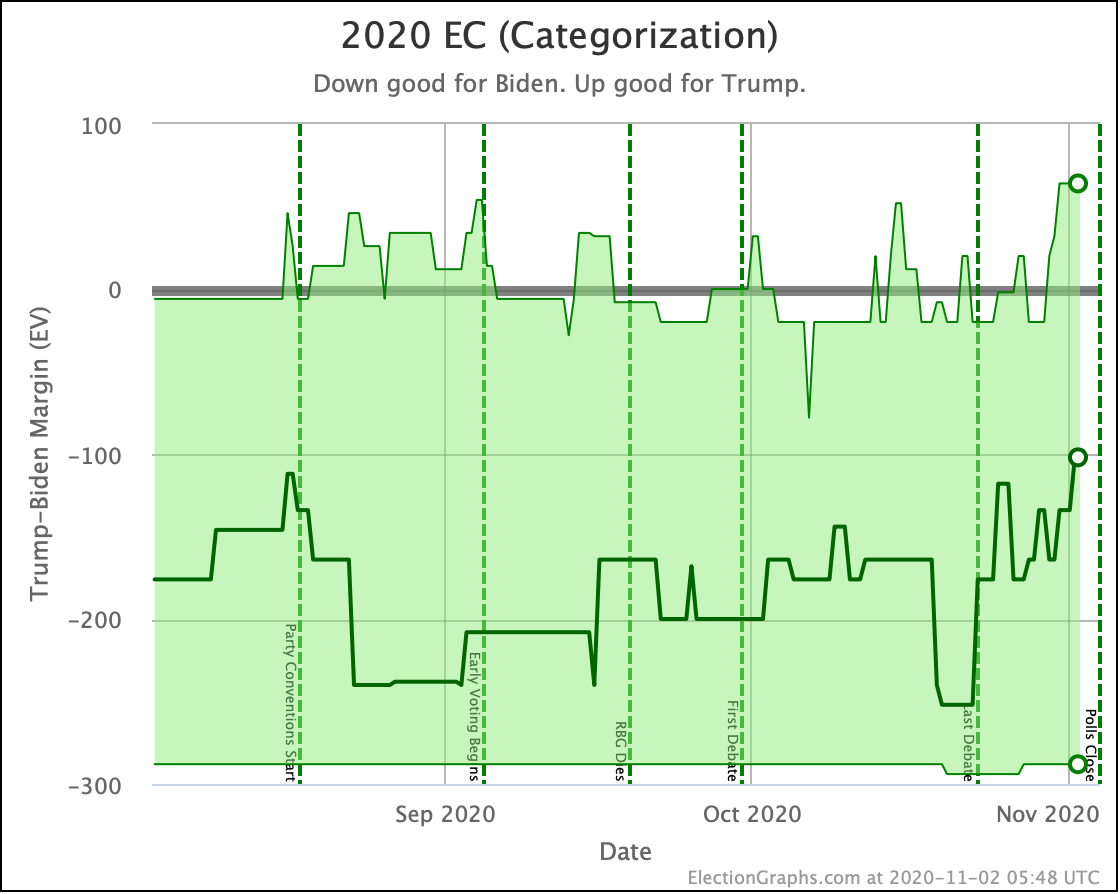
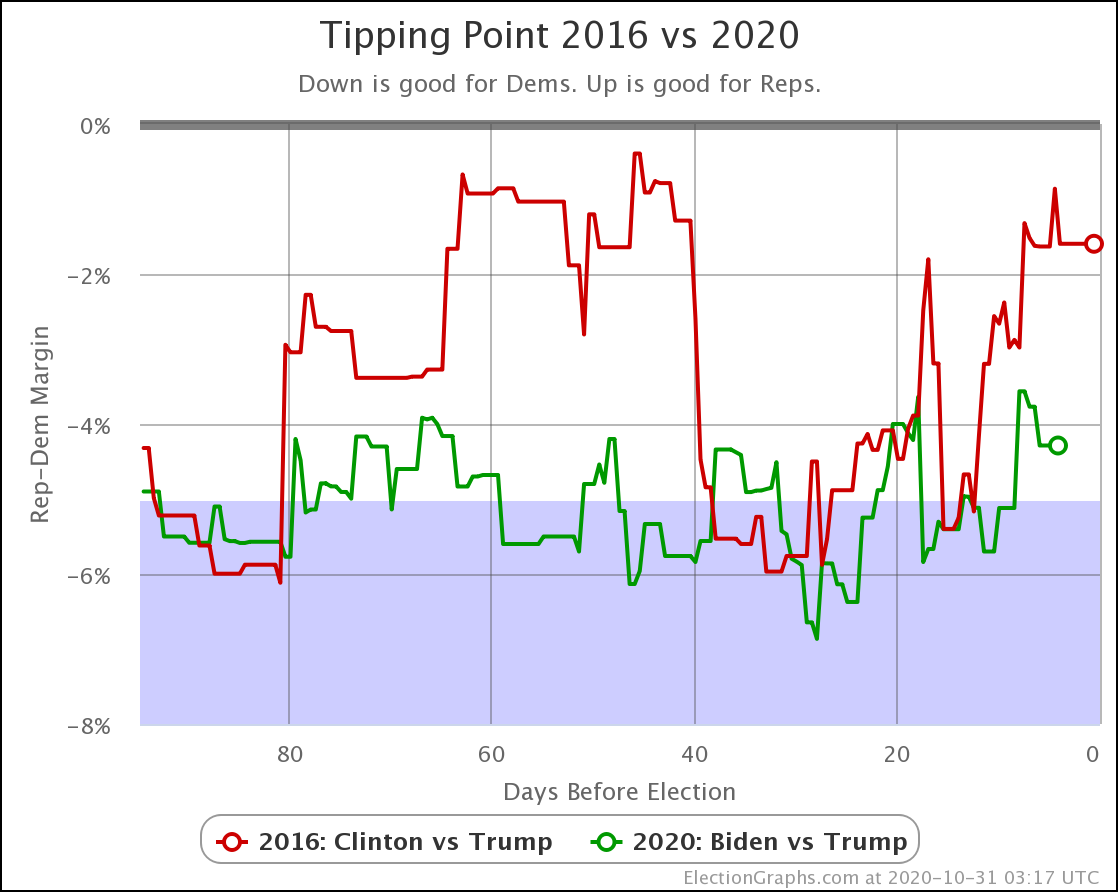
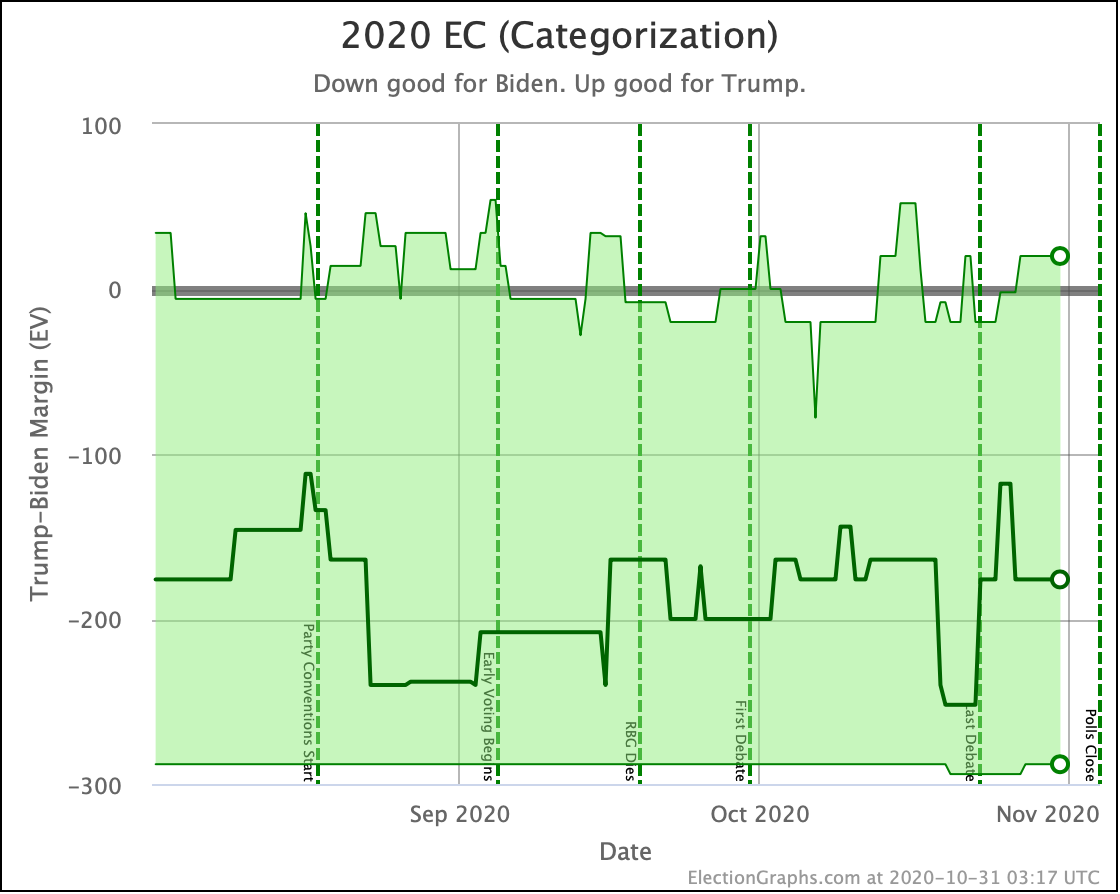
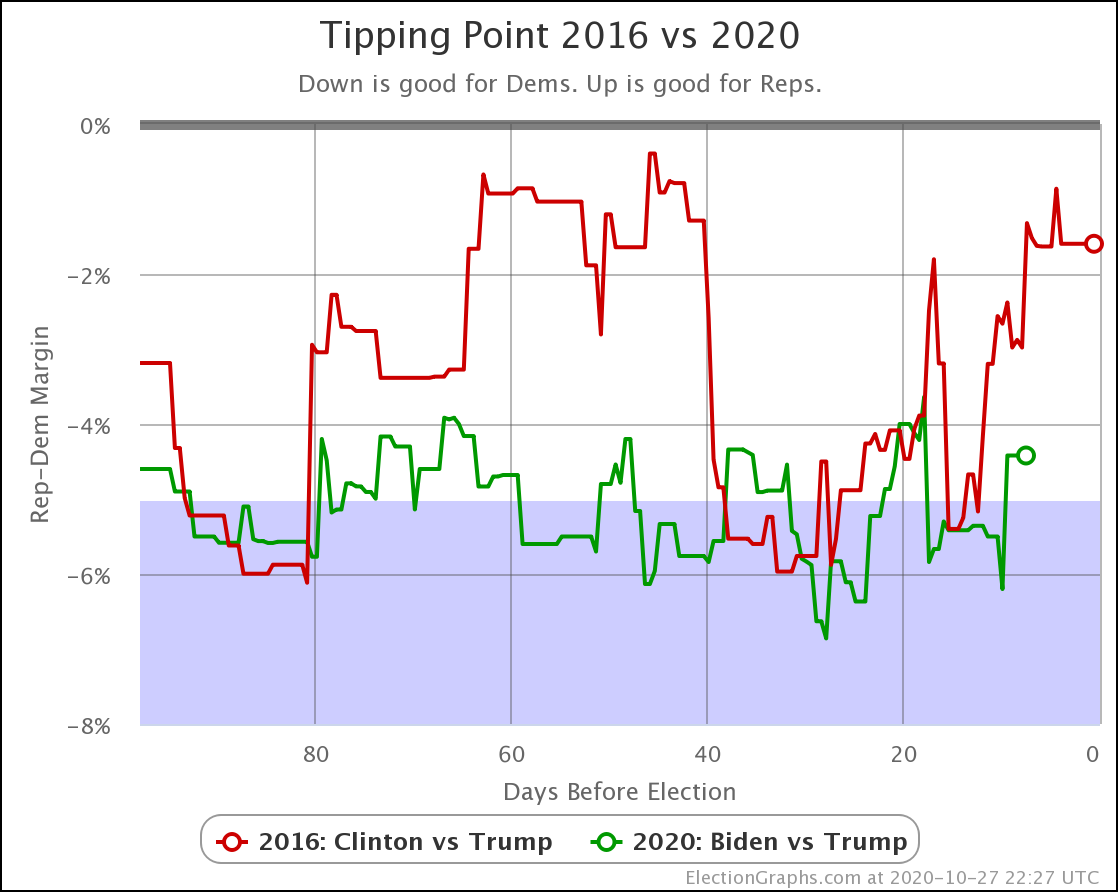
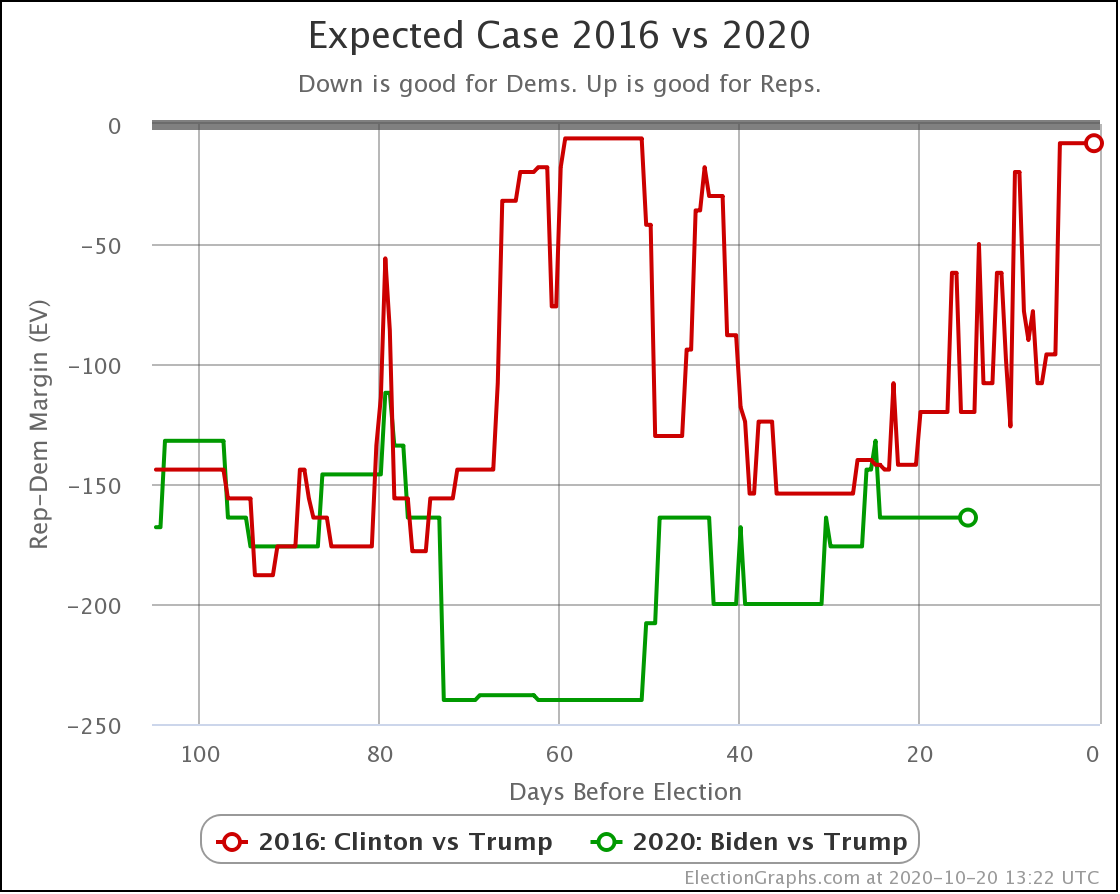
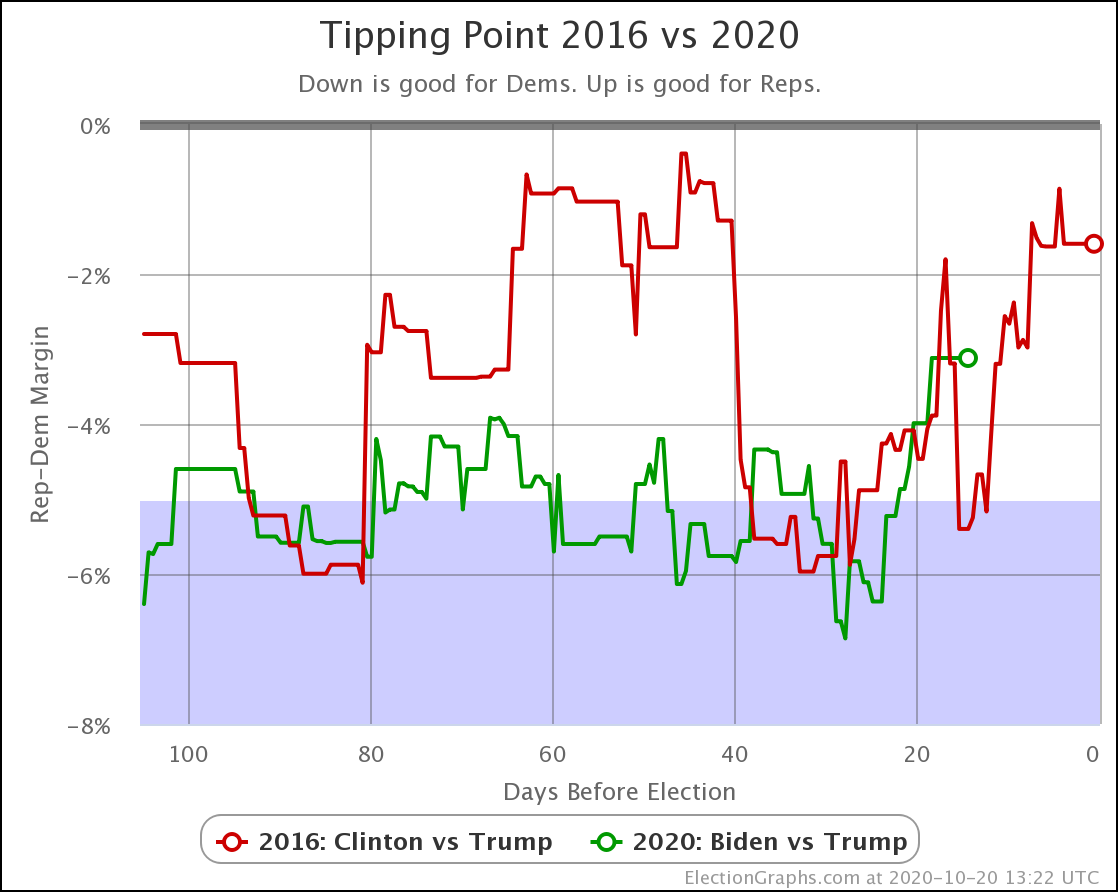
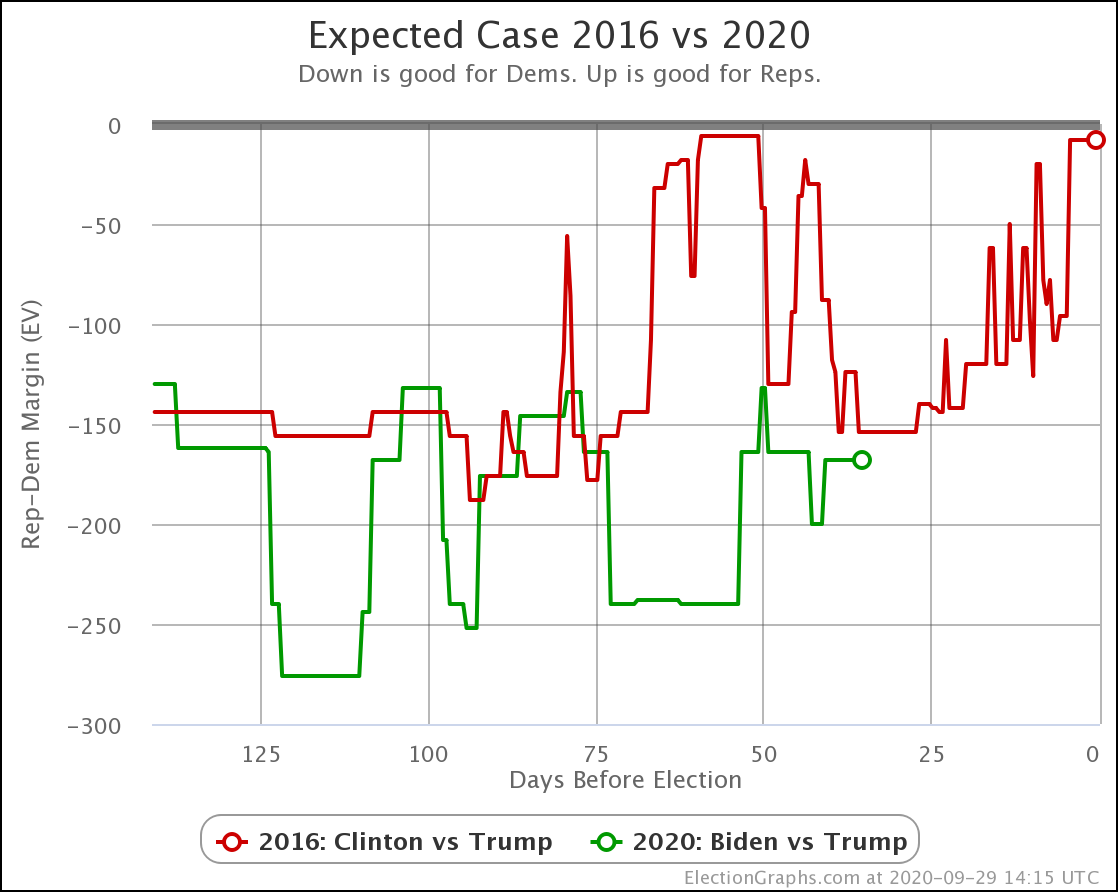
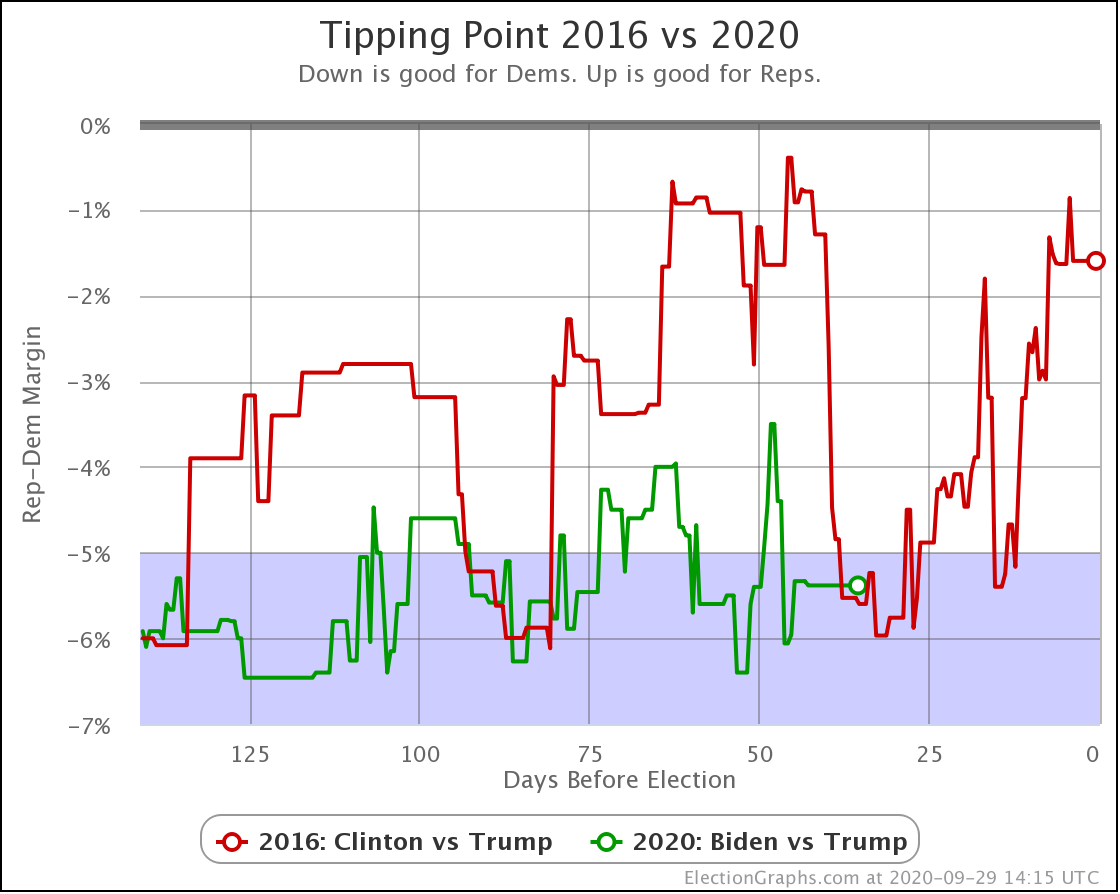
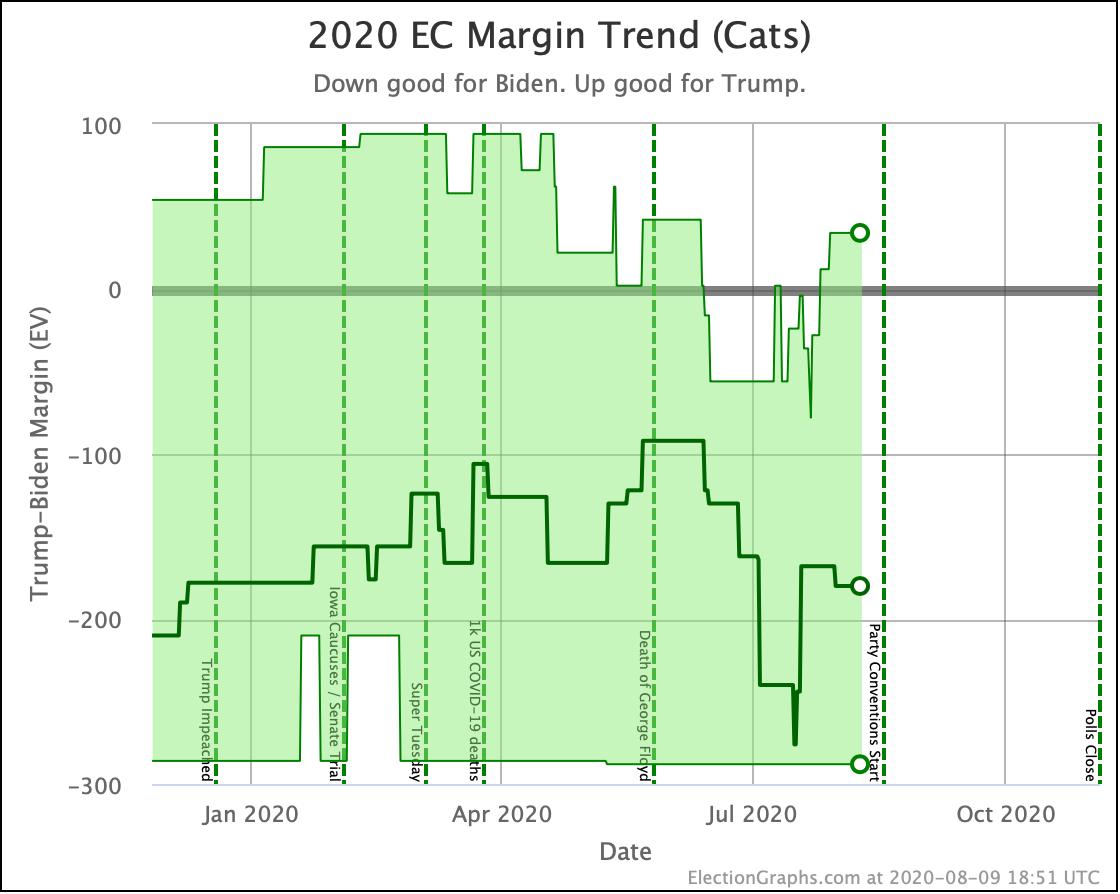
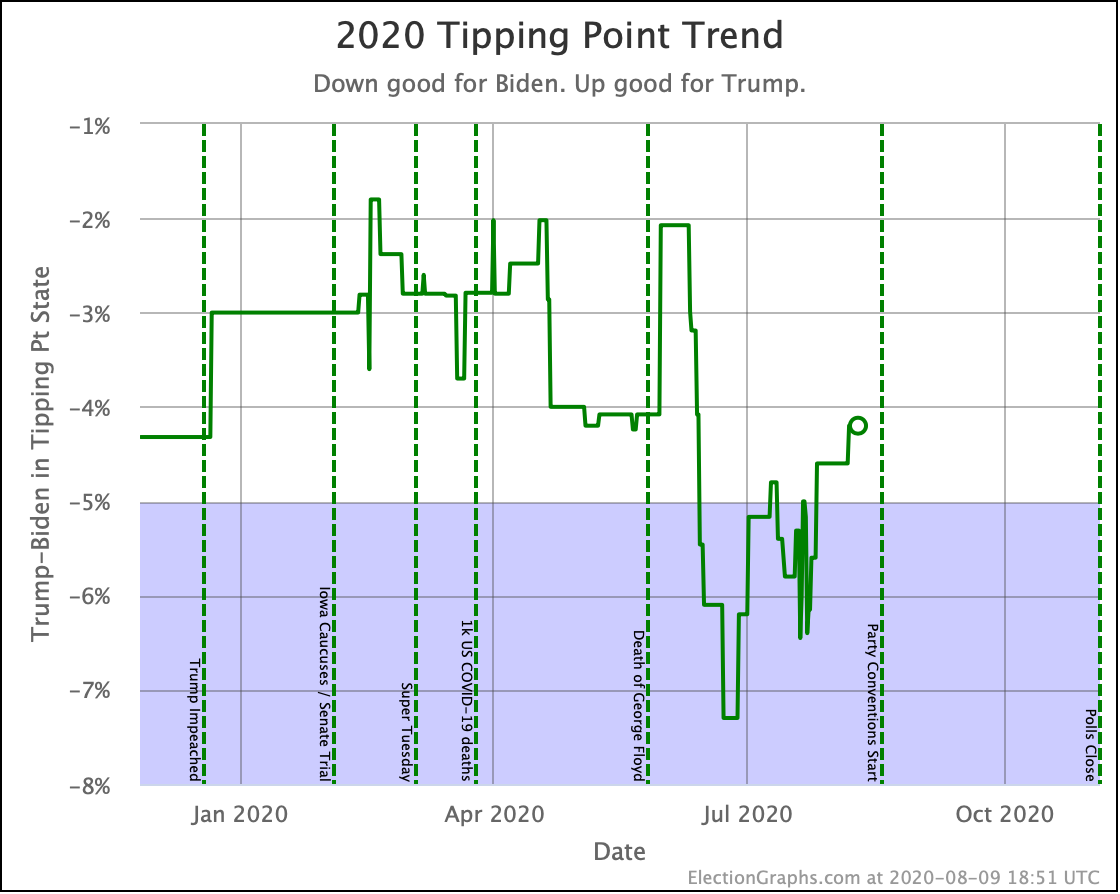
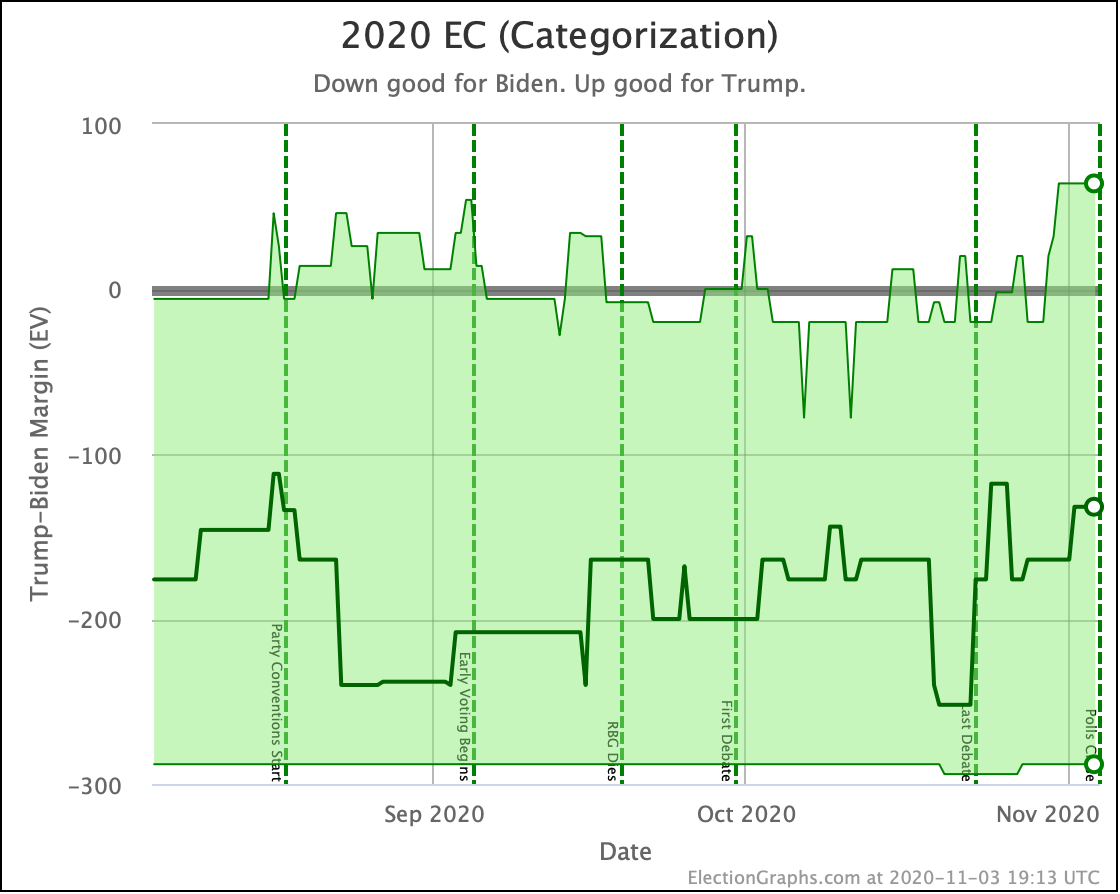
First of all, the comparison with 2016:
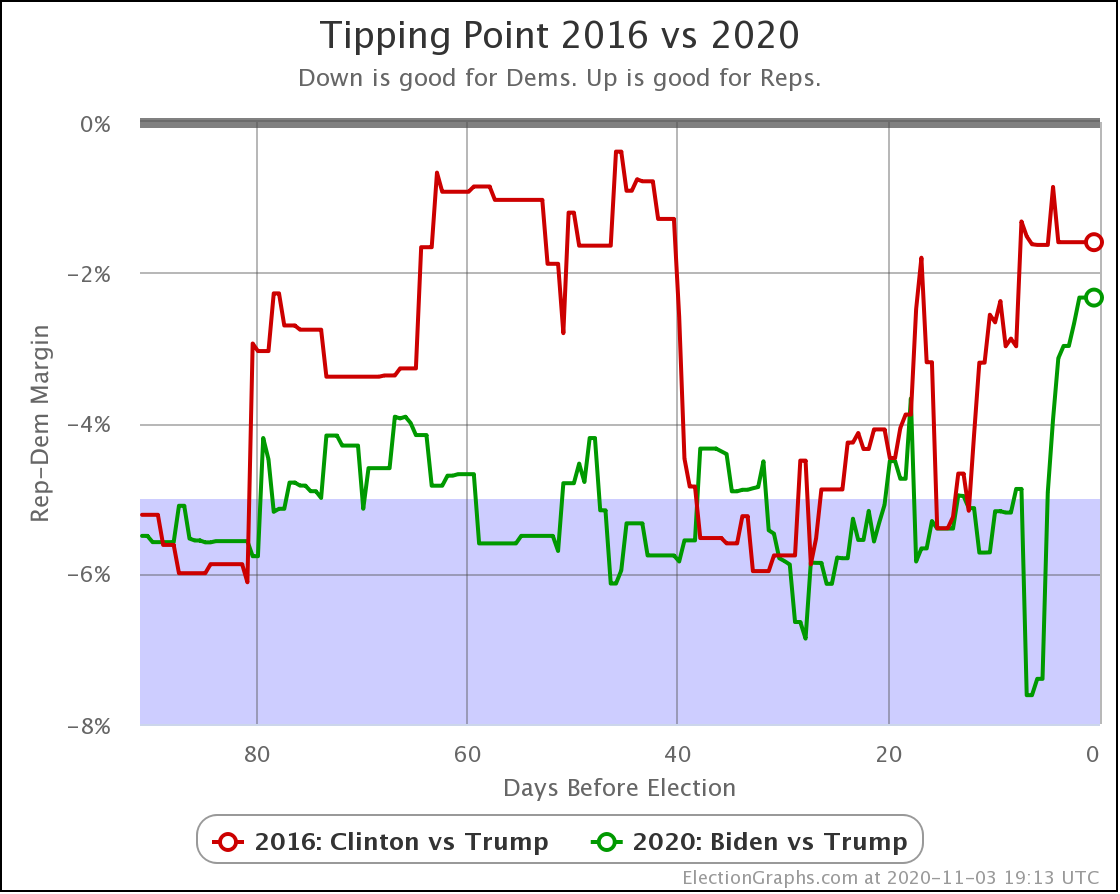
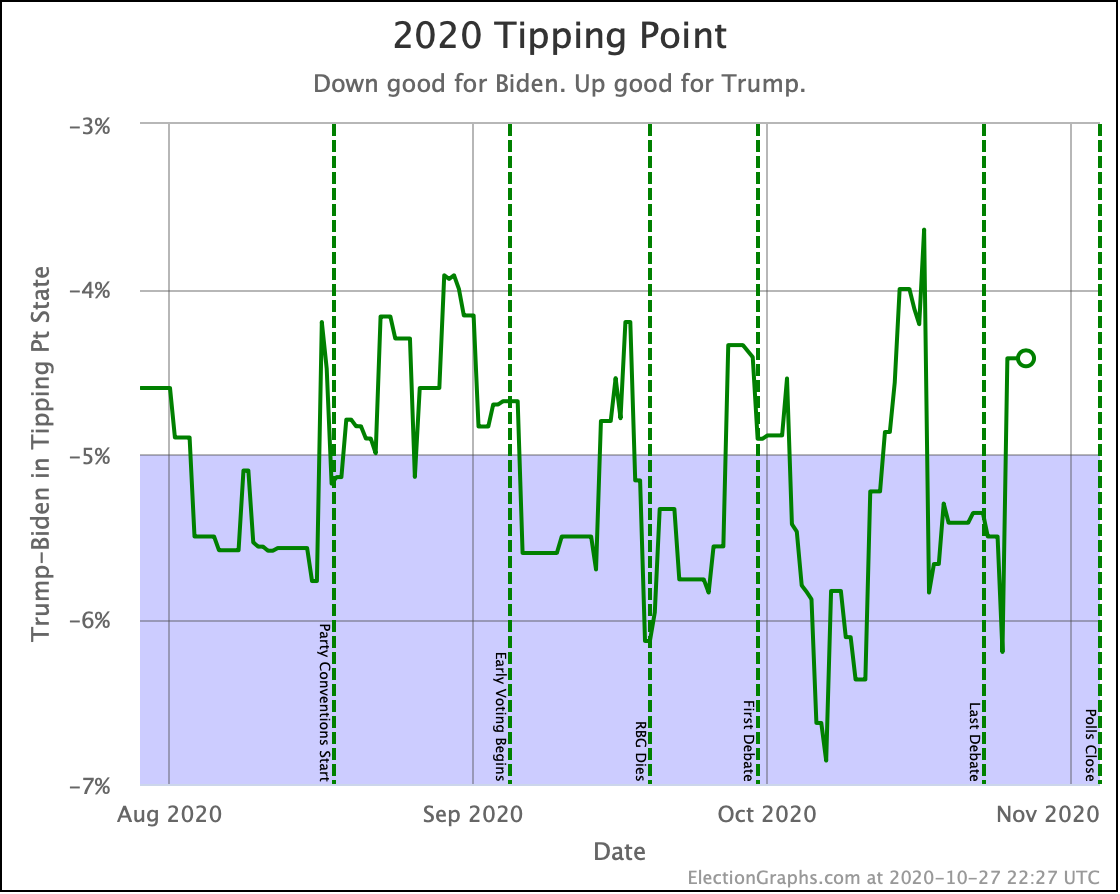
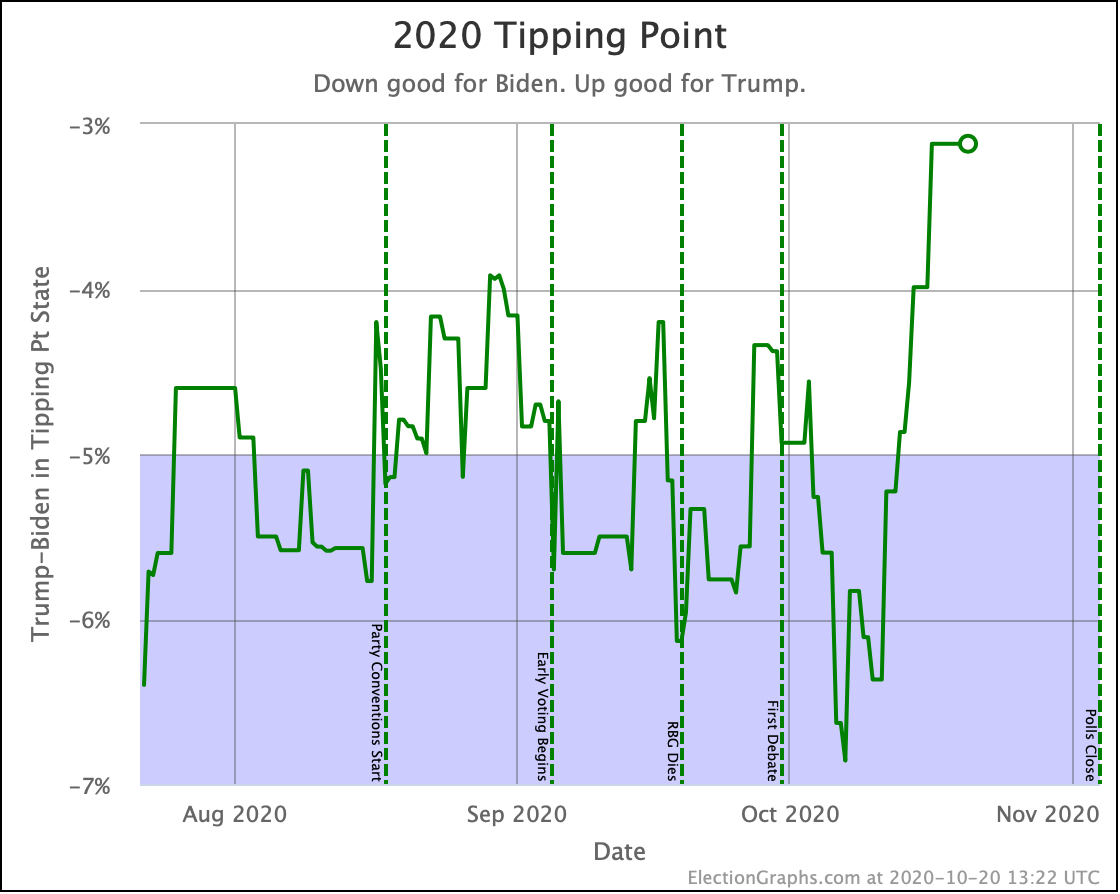
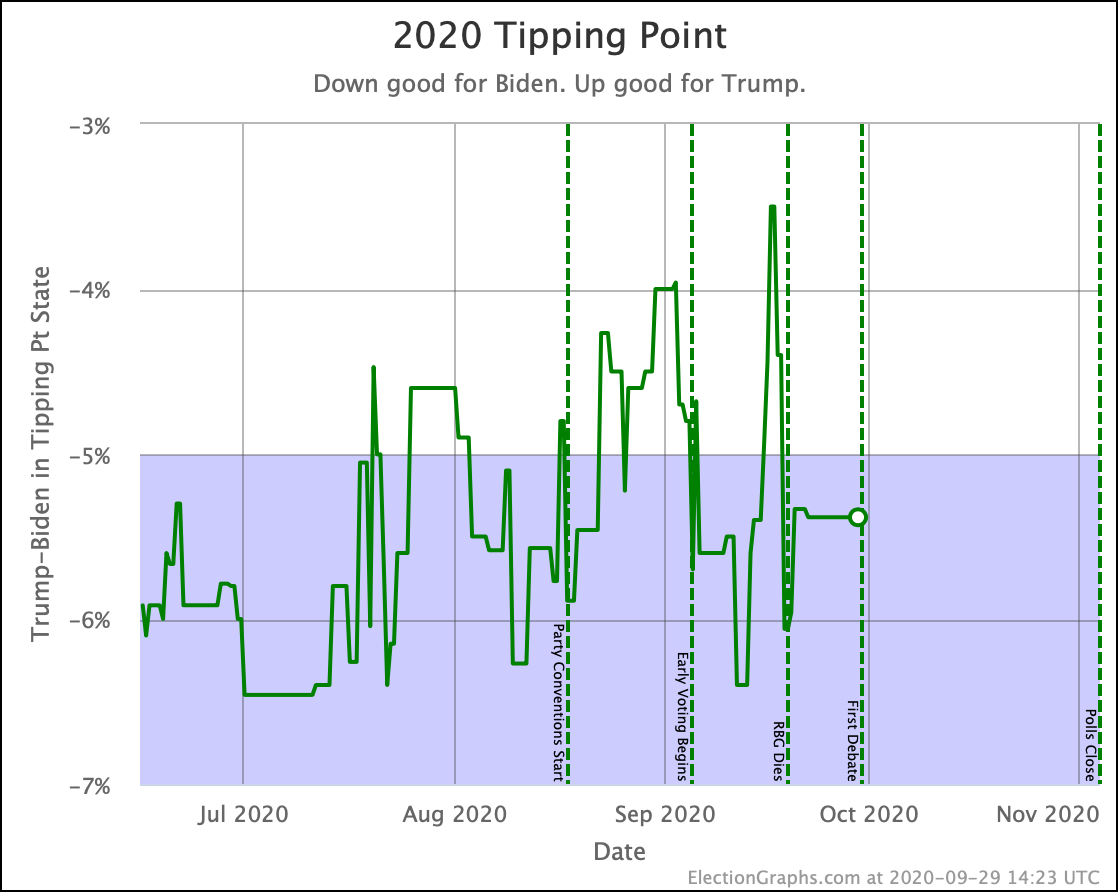
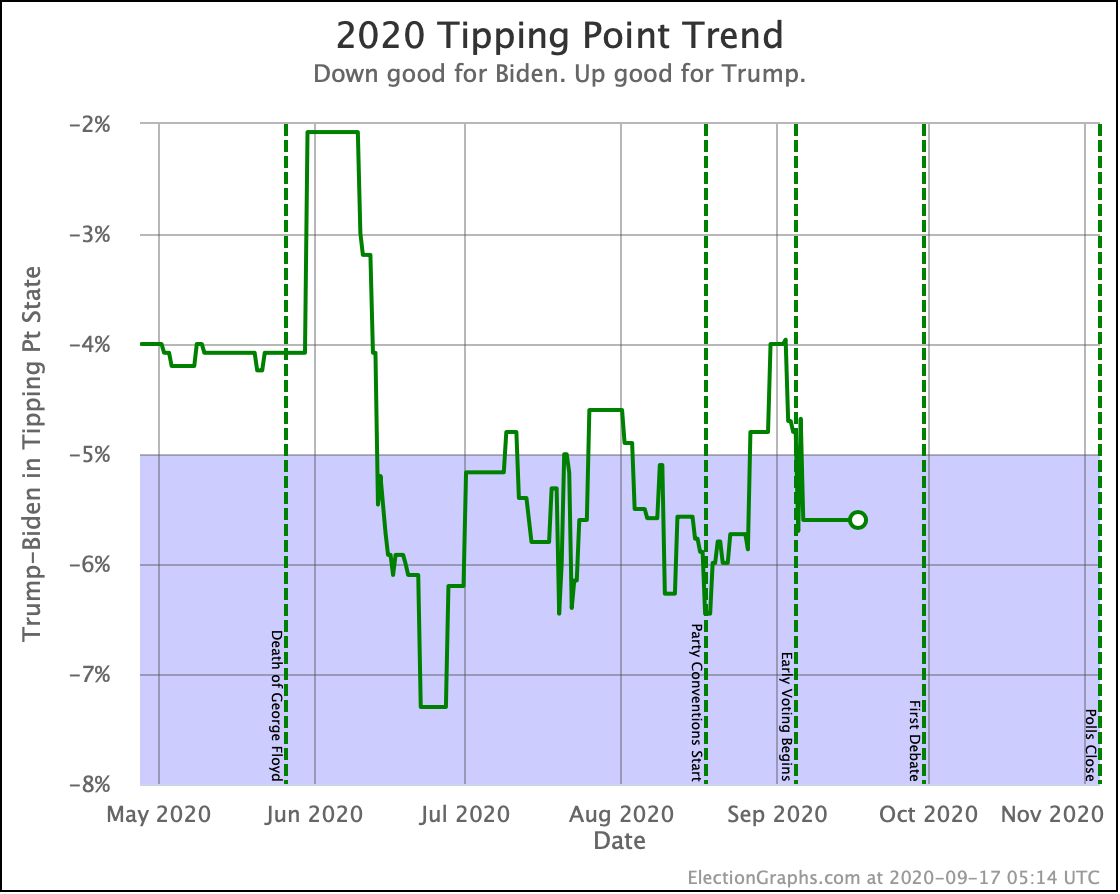
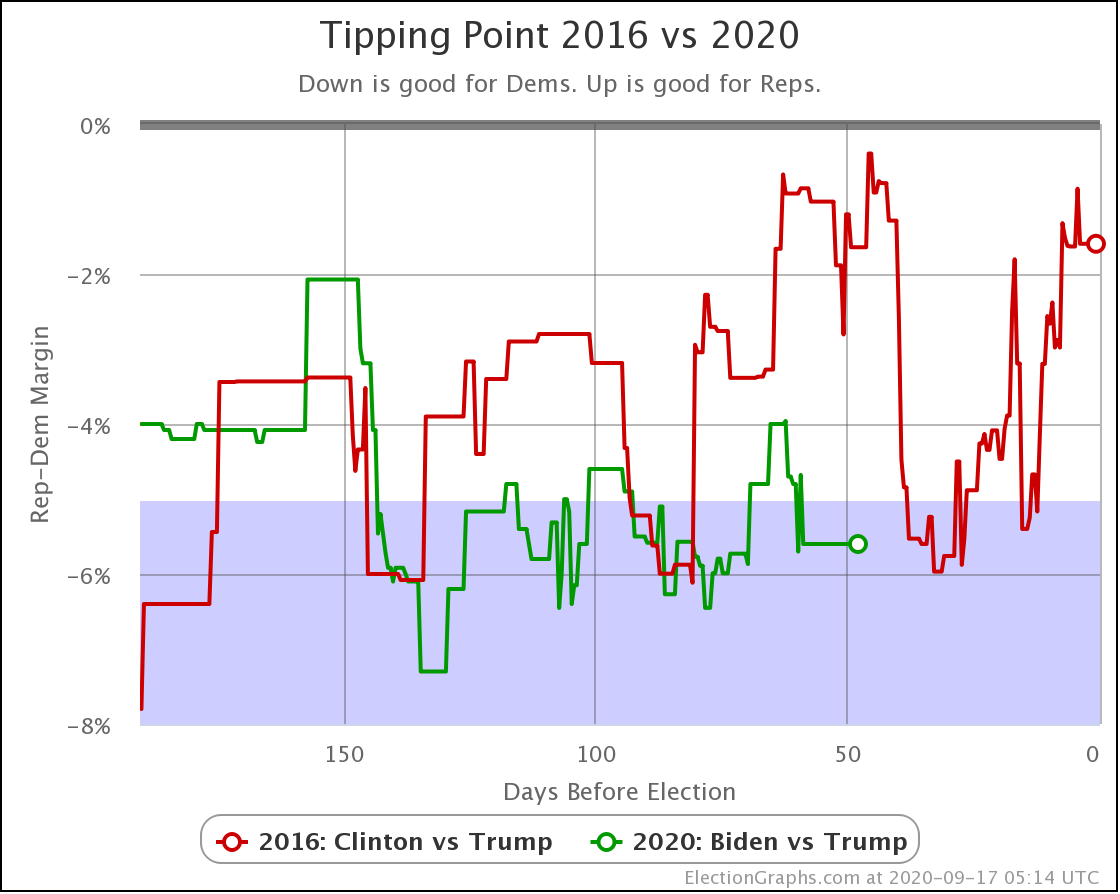
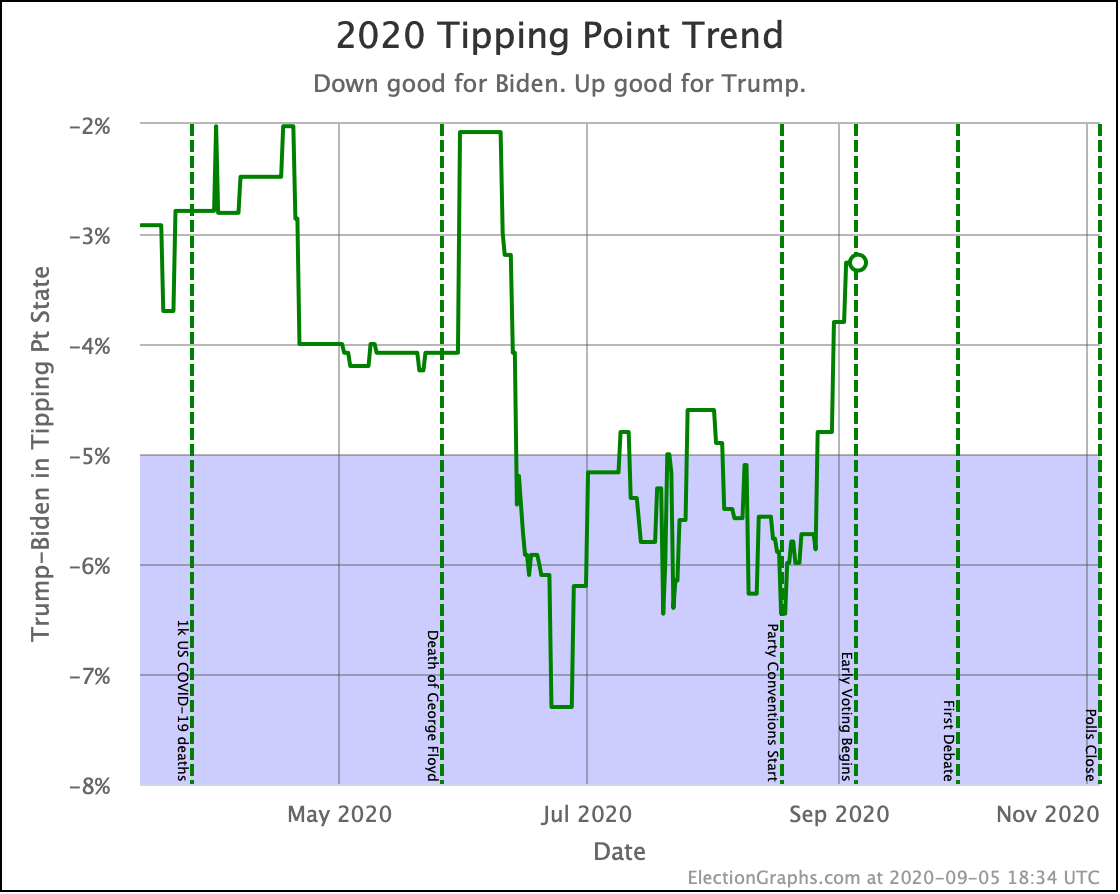
After a brief spike toward a stronger position for Biden, the collapse we have been talking about happened. The final tipping point was only a 2.3% Biden lead. Biden had seen worse tipping points, but not since early June.
Even at this level though, Biden is stronger than the 1.6% that Clinton ended with. So he is still in a better position.
However, the difference between the Election Graphs final tipping point and the actual election results in 2016 was 2.36%. So the same size error in the correct direction would make Trump the winner.
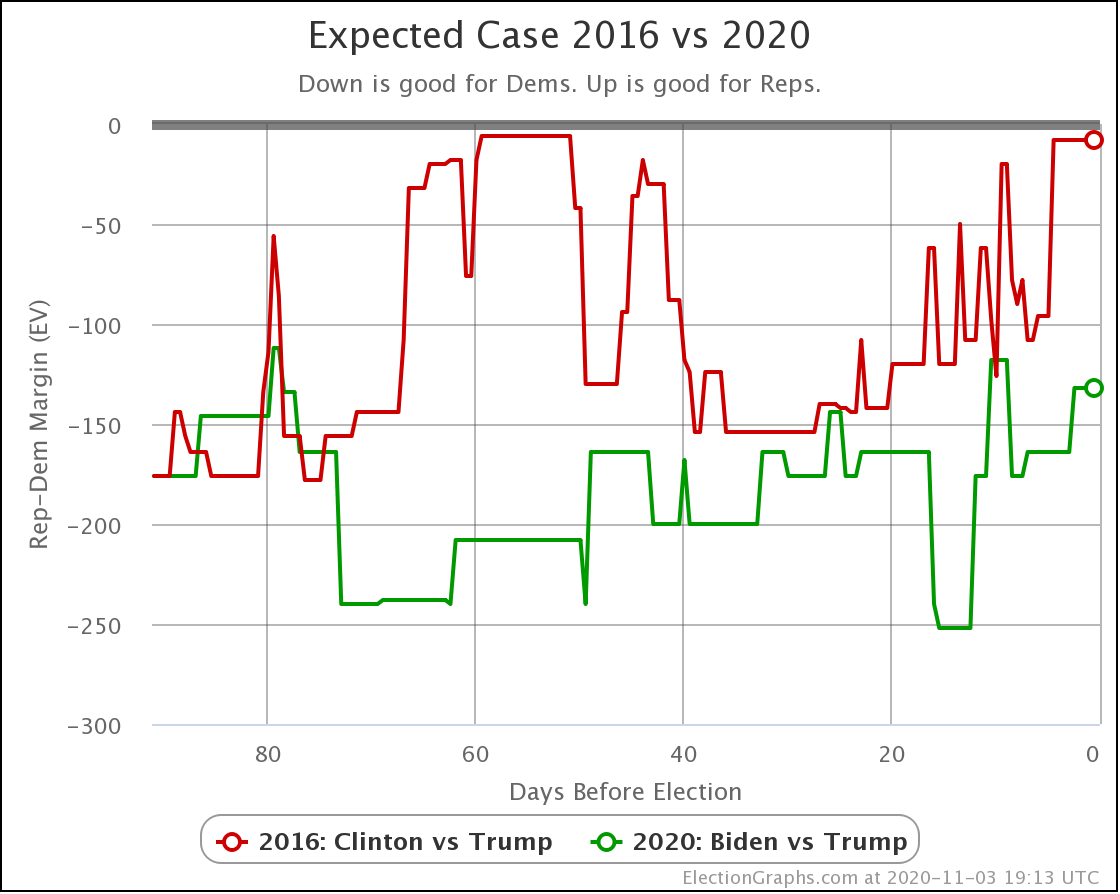
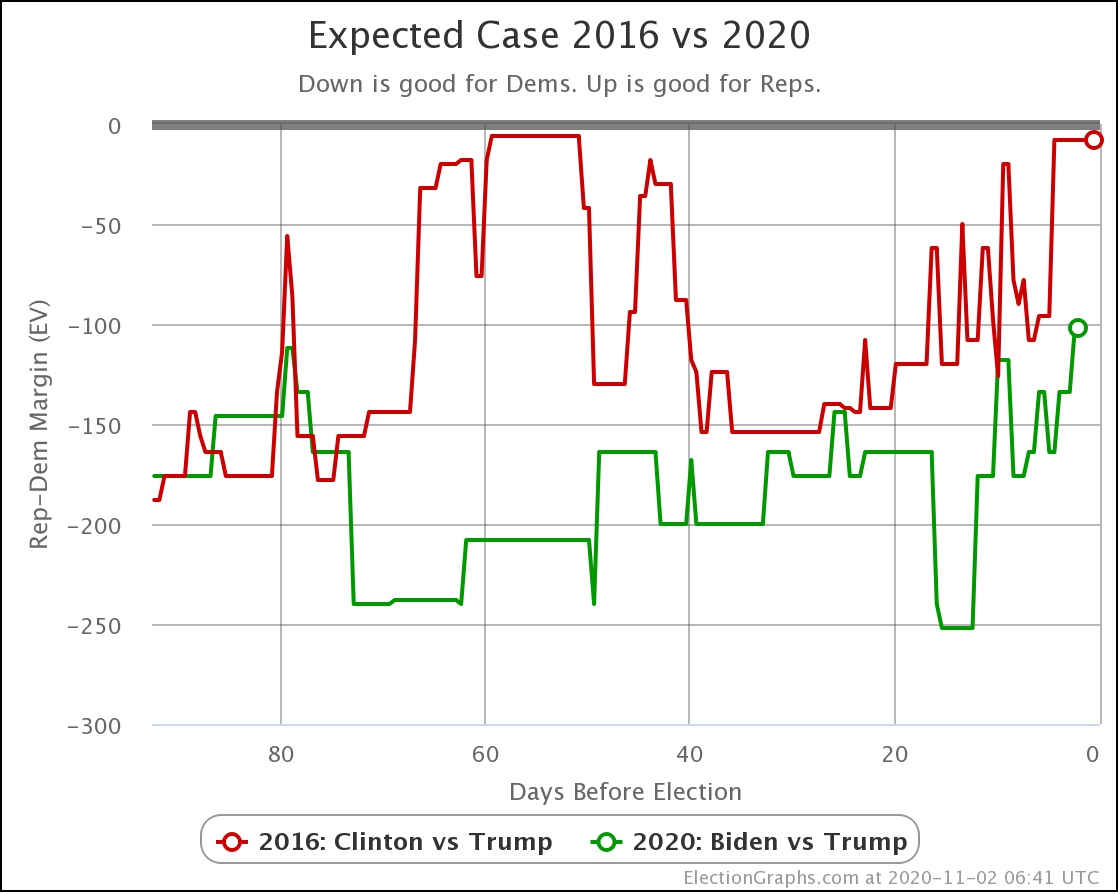
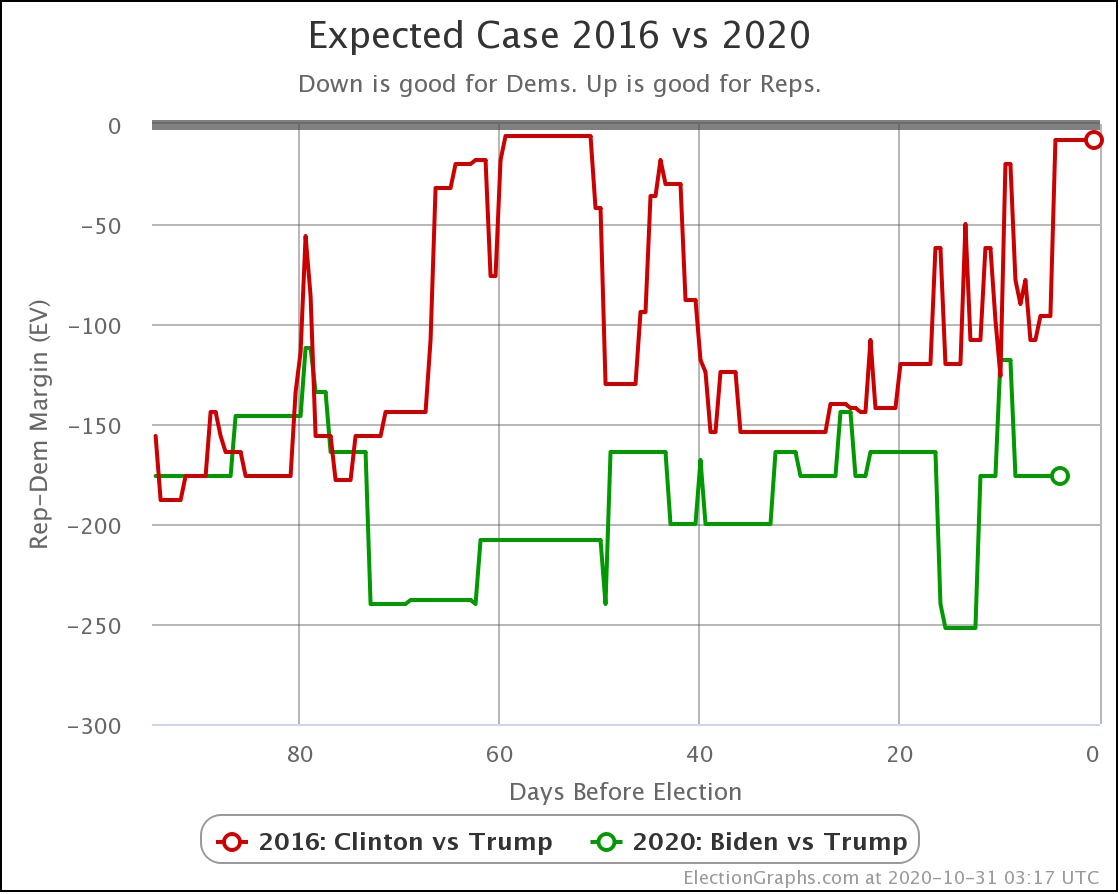
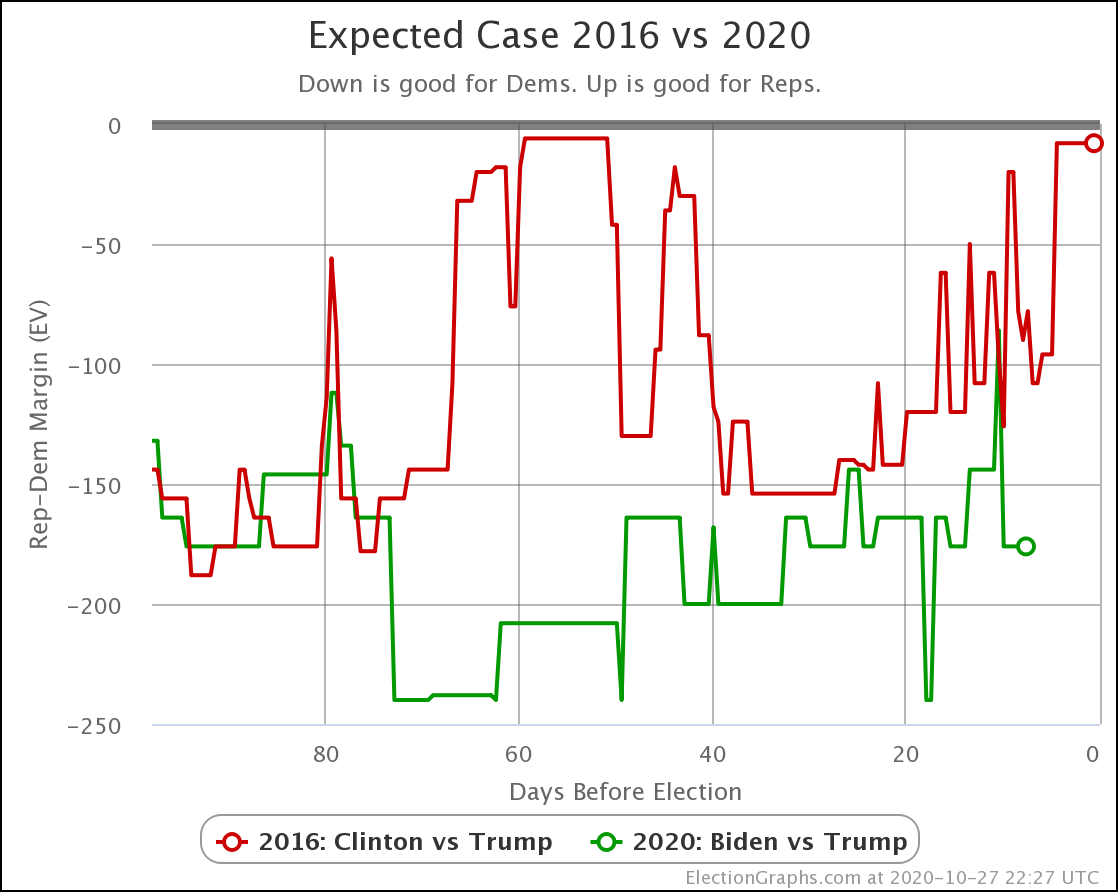
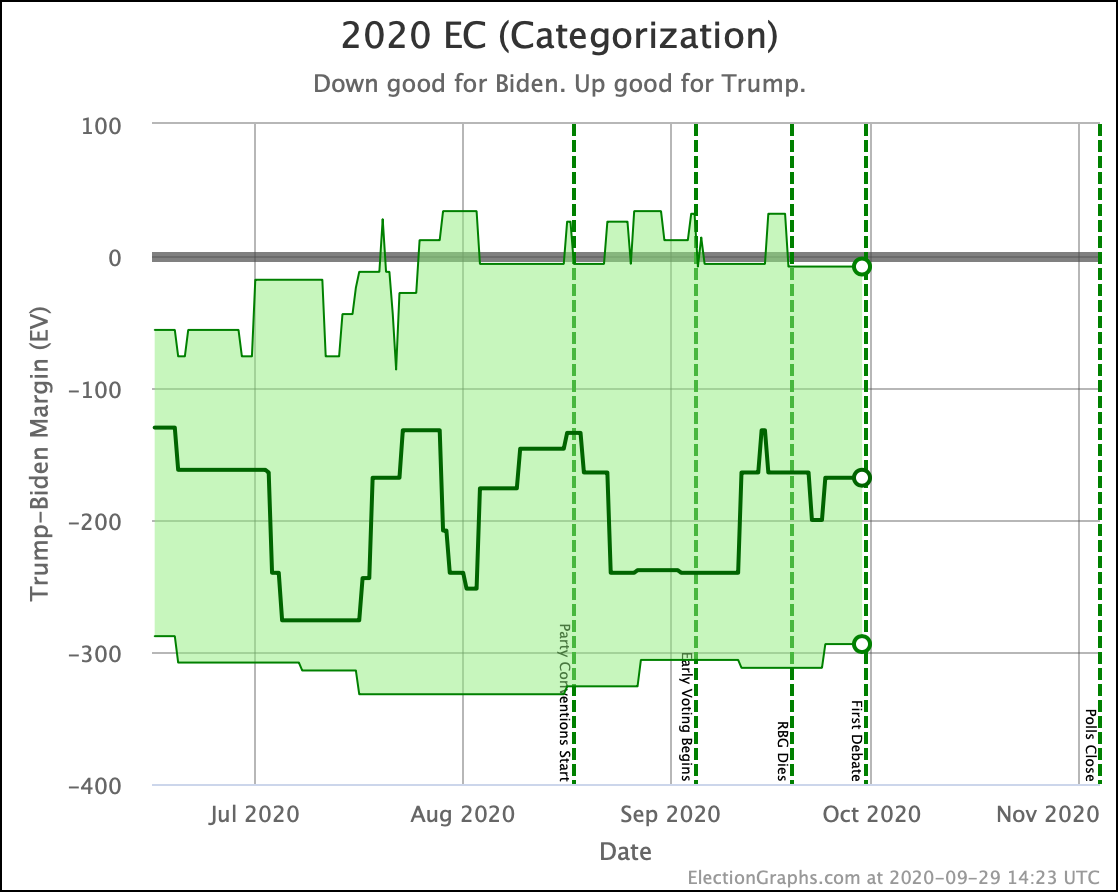
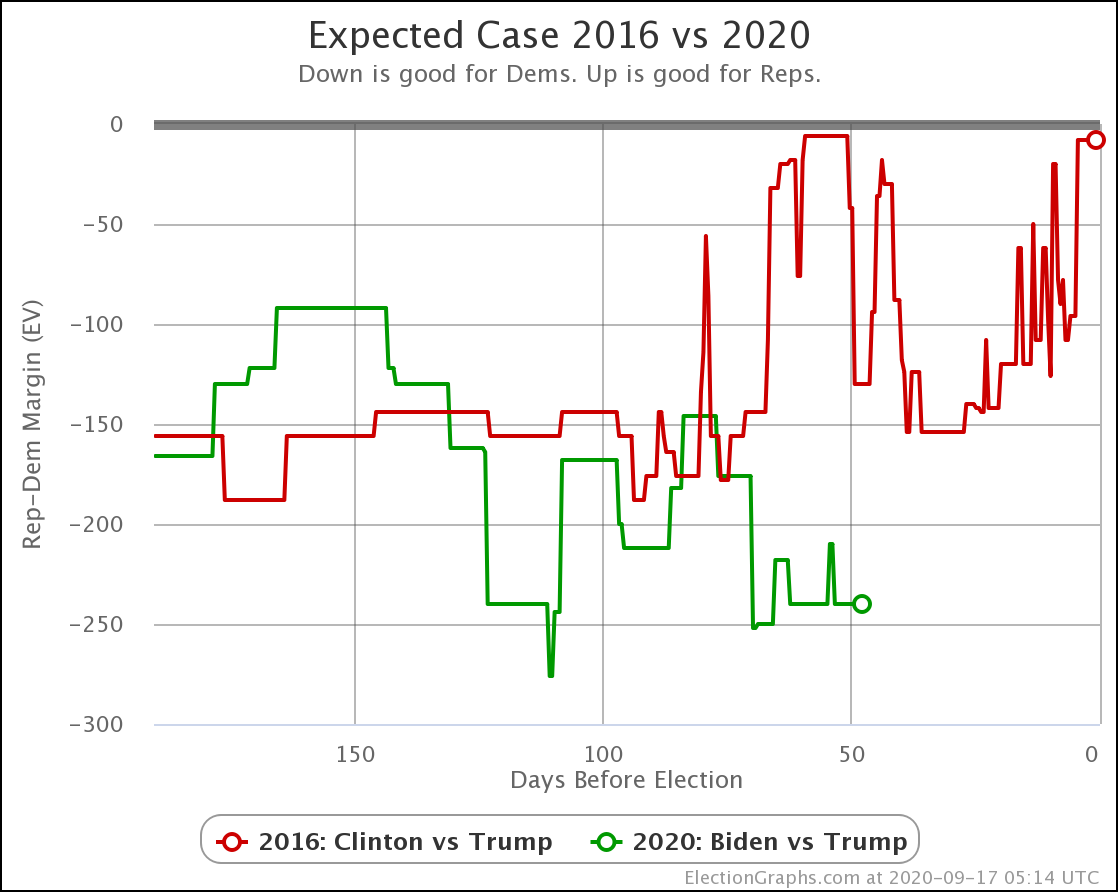
In terms of the expected case, where each candidate wins every state where they lead the Election Graphs average, Biden is in the low end of his recent range, but not any lower, and still significantly ahead of where Clinton was.
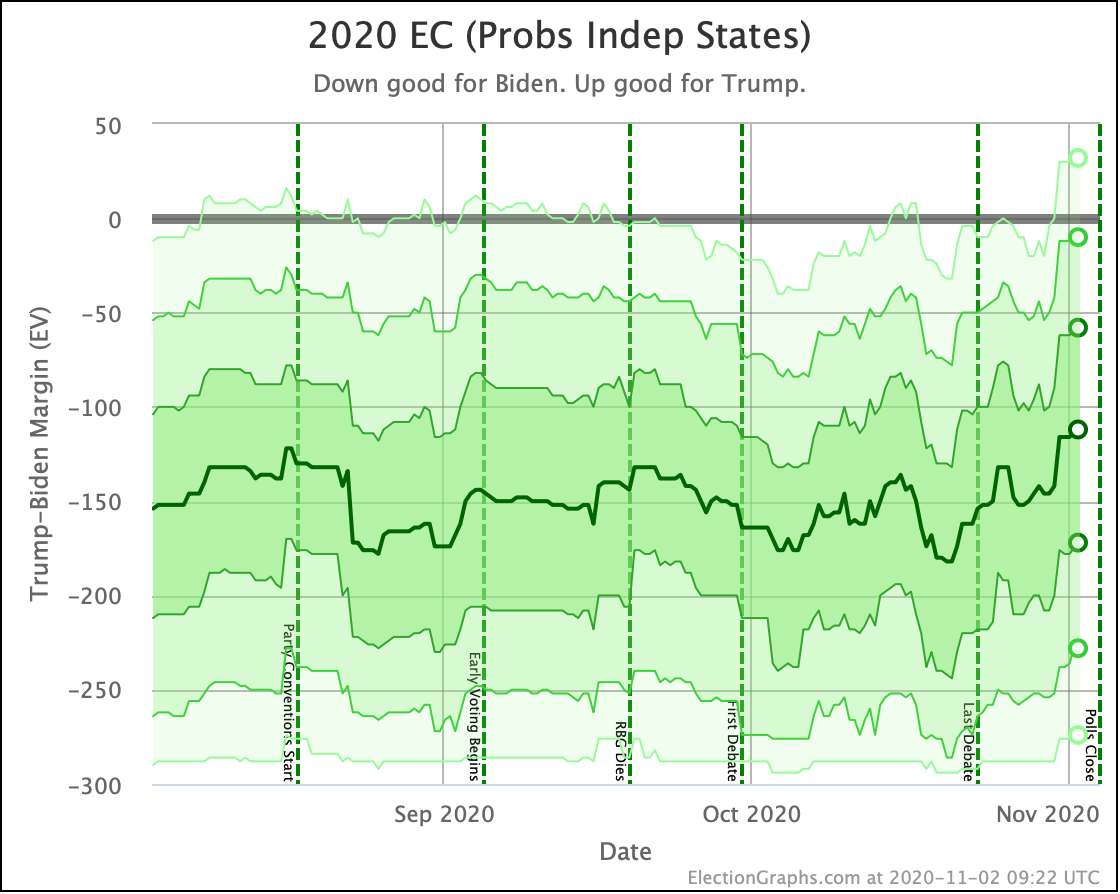
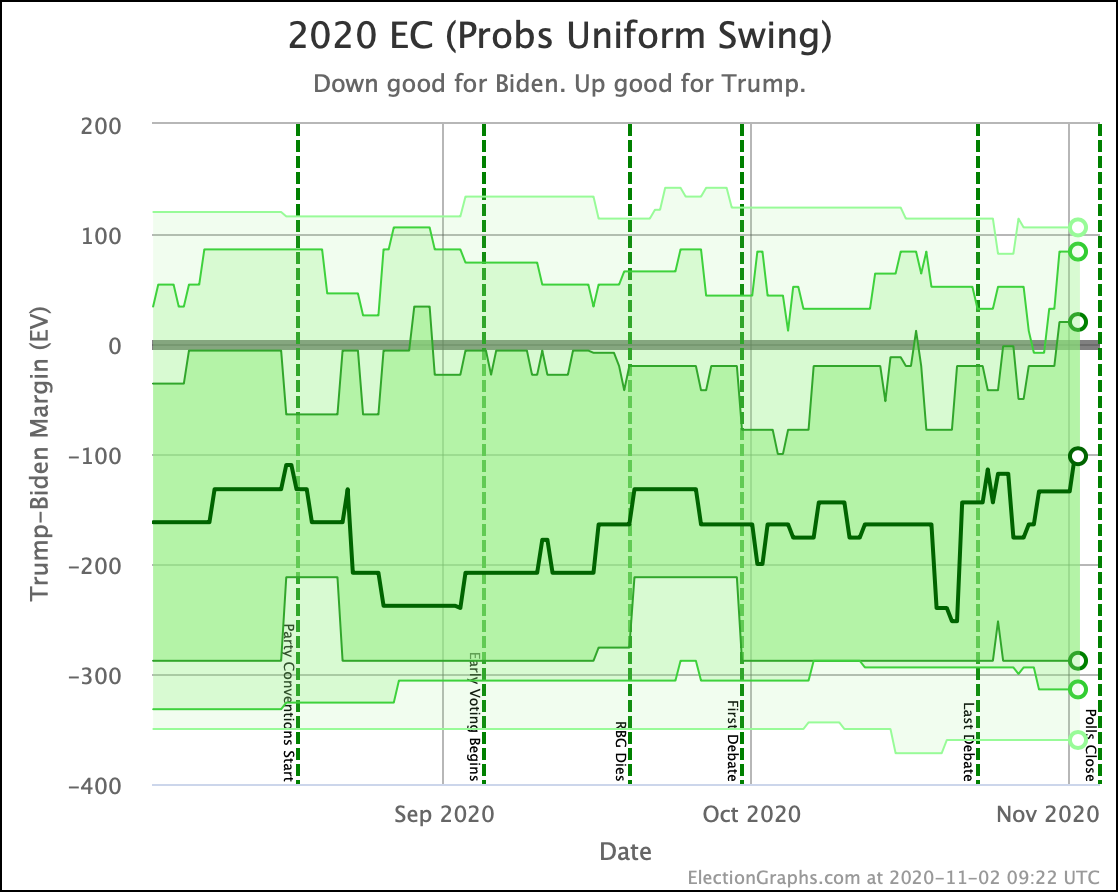
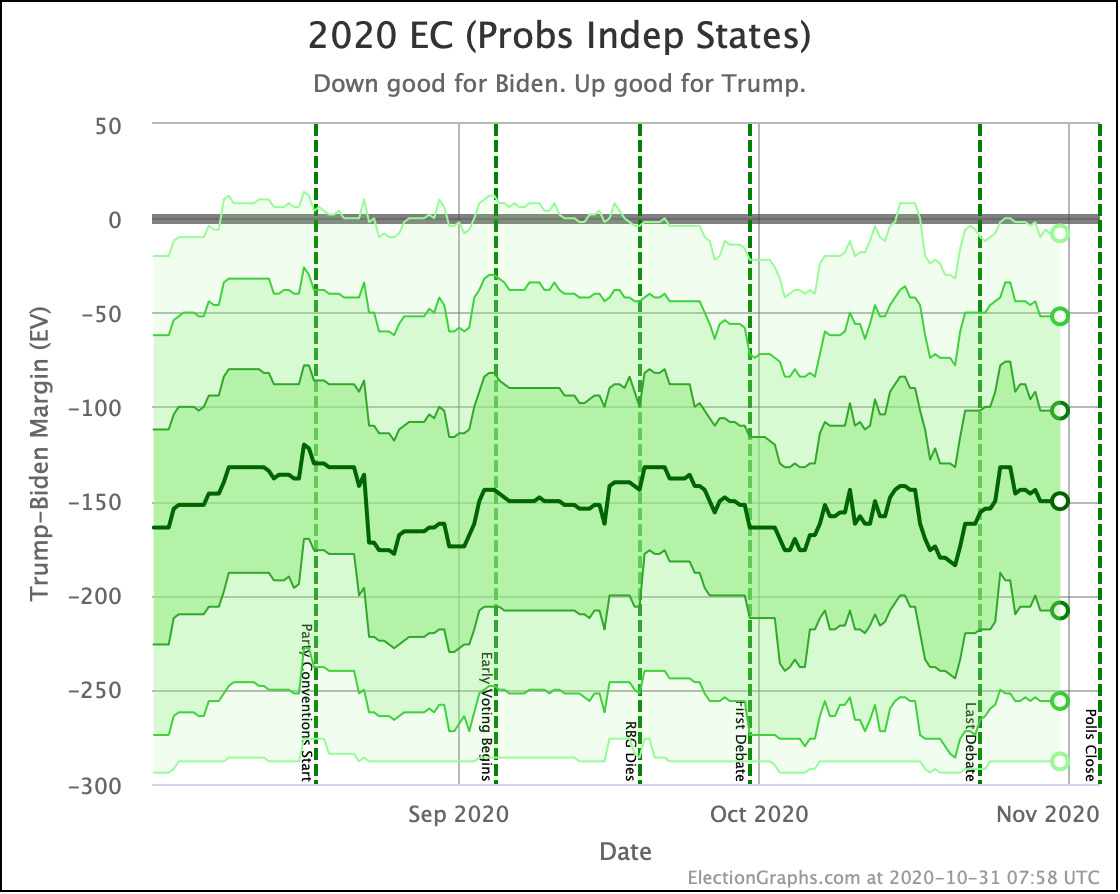
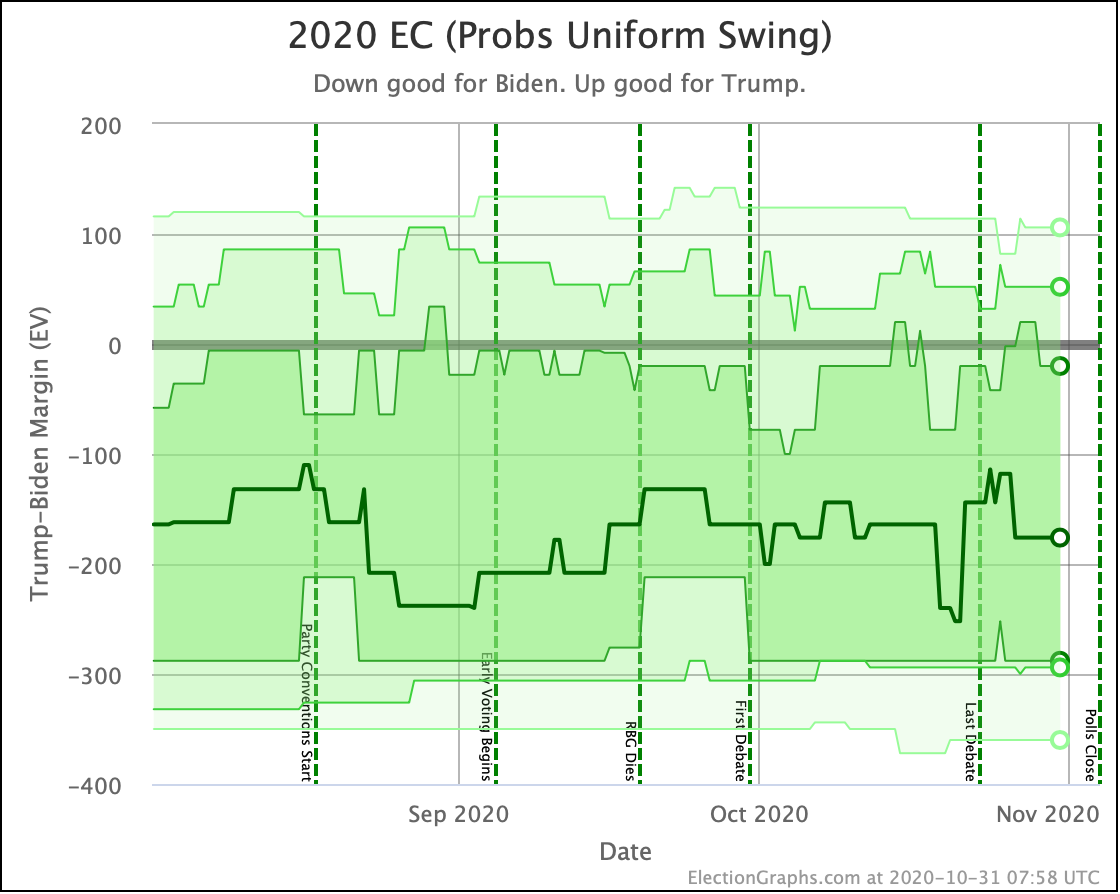
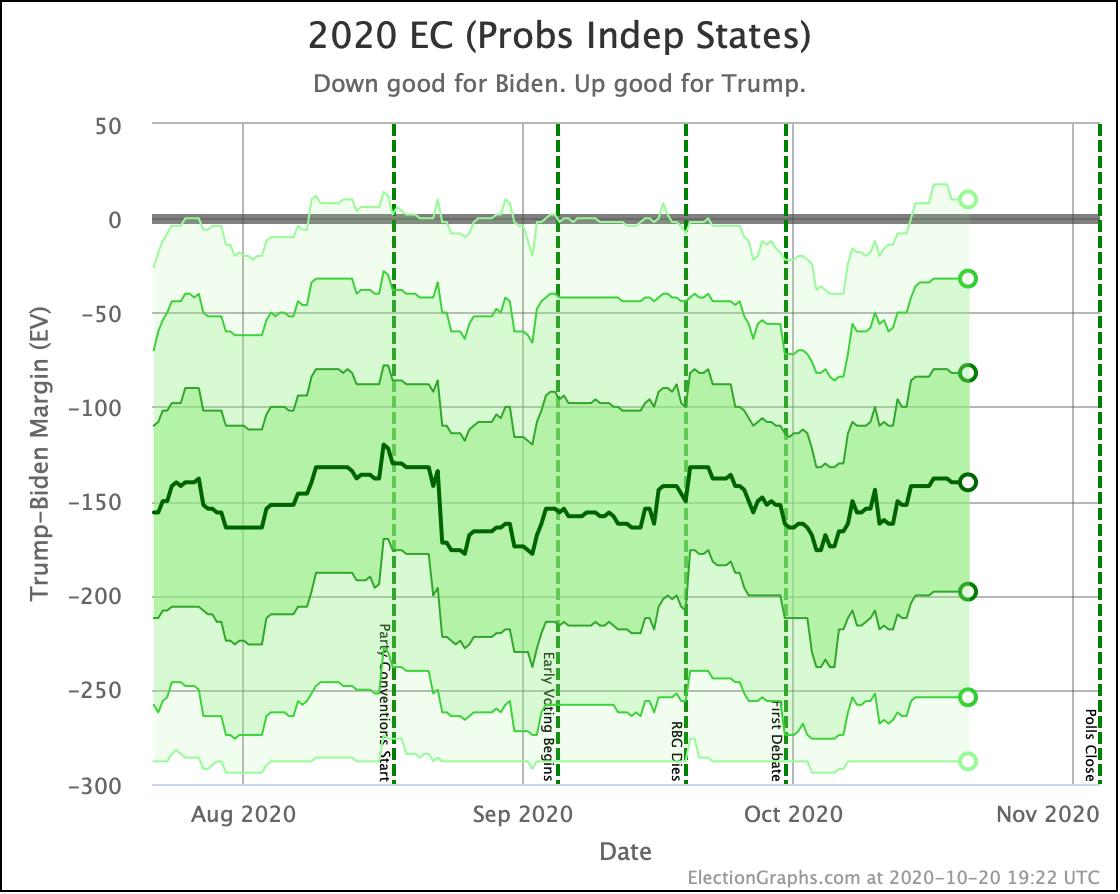
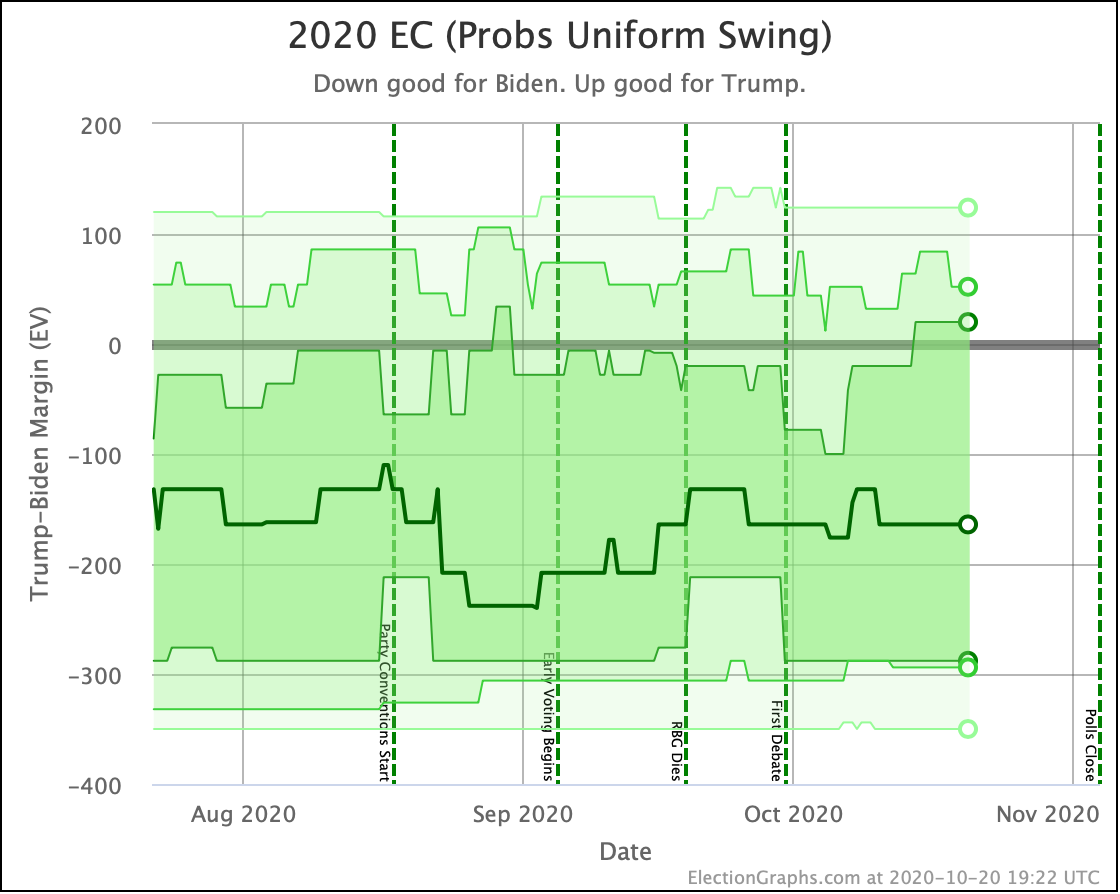
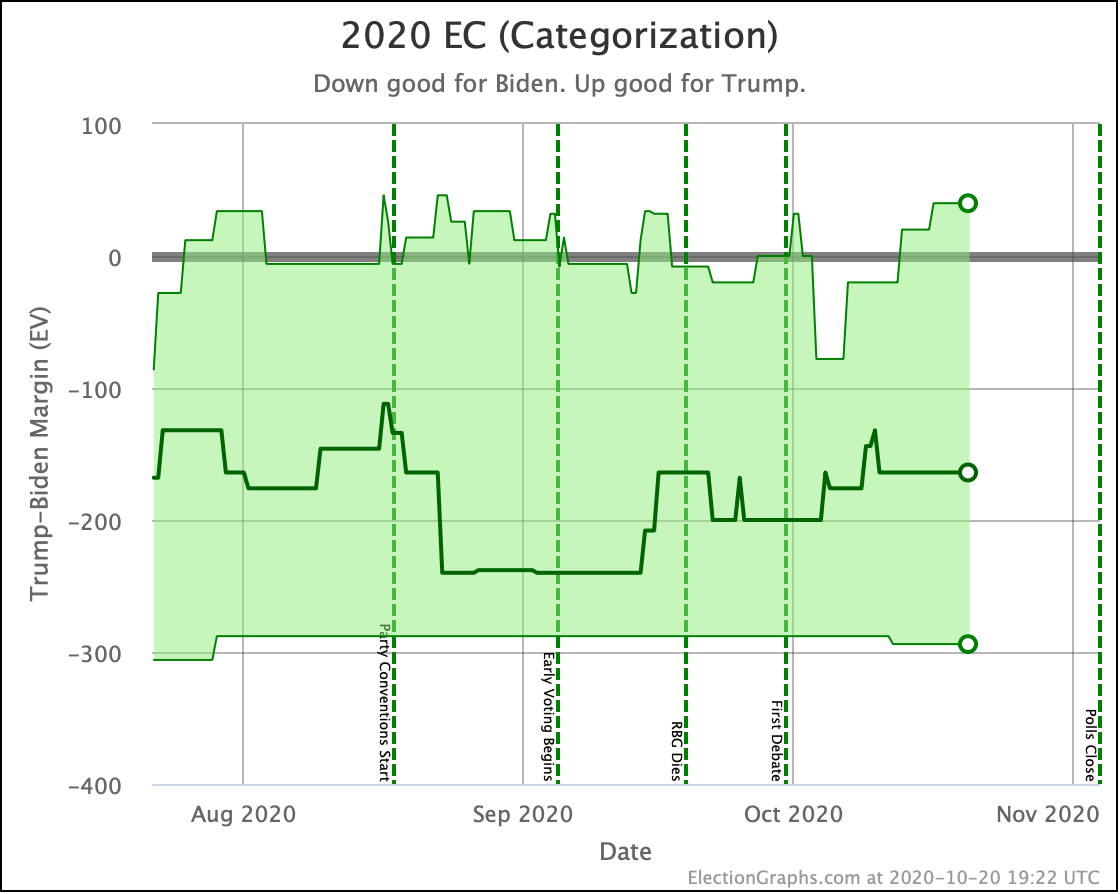
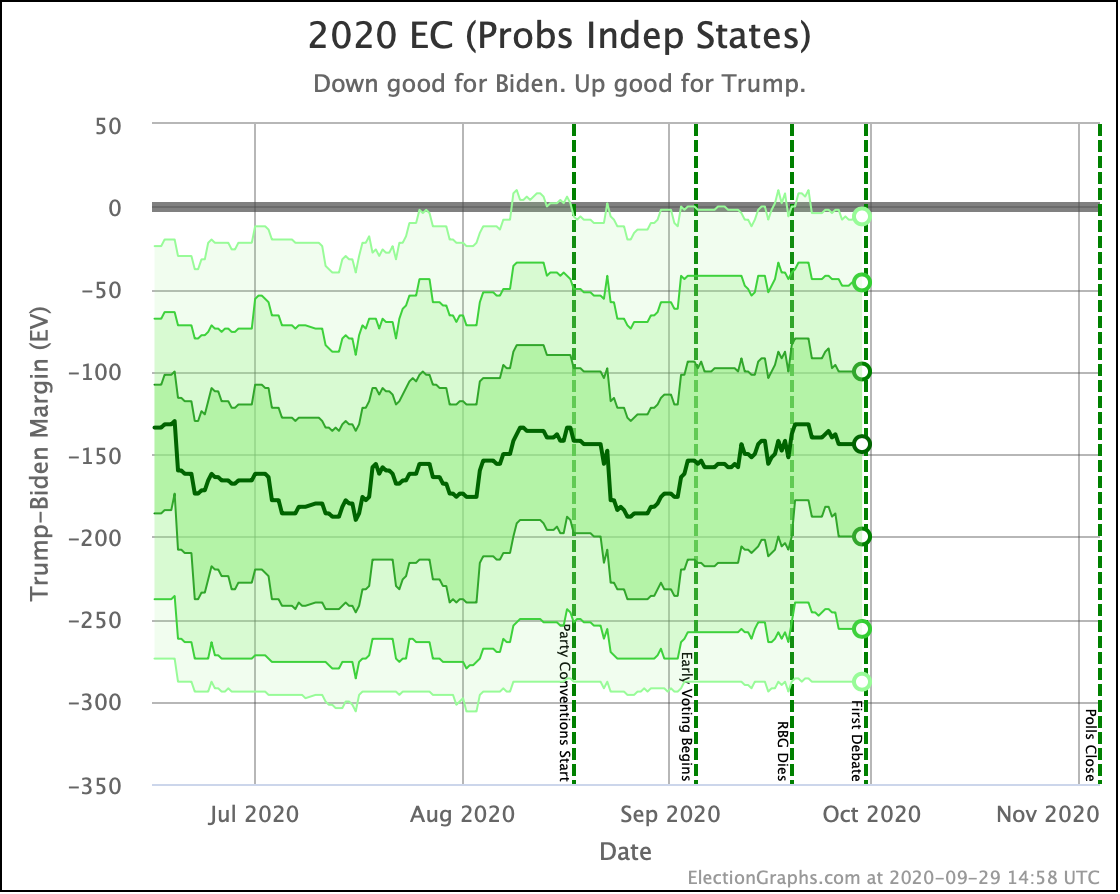
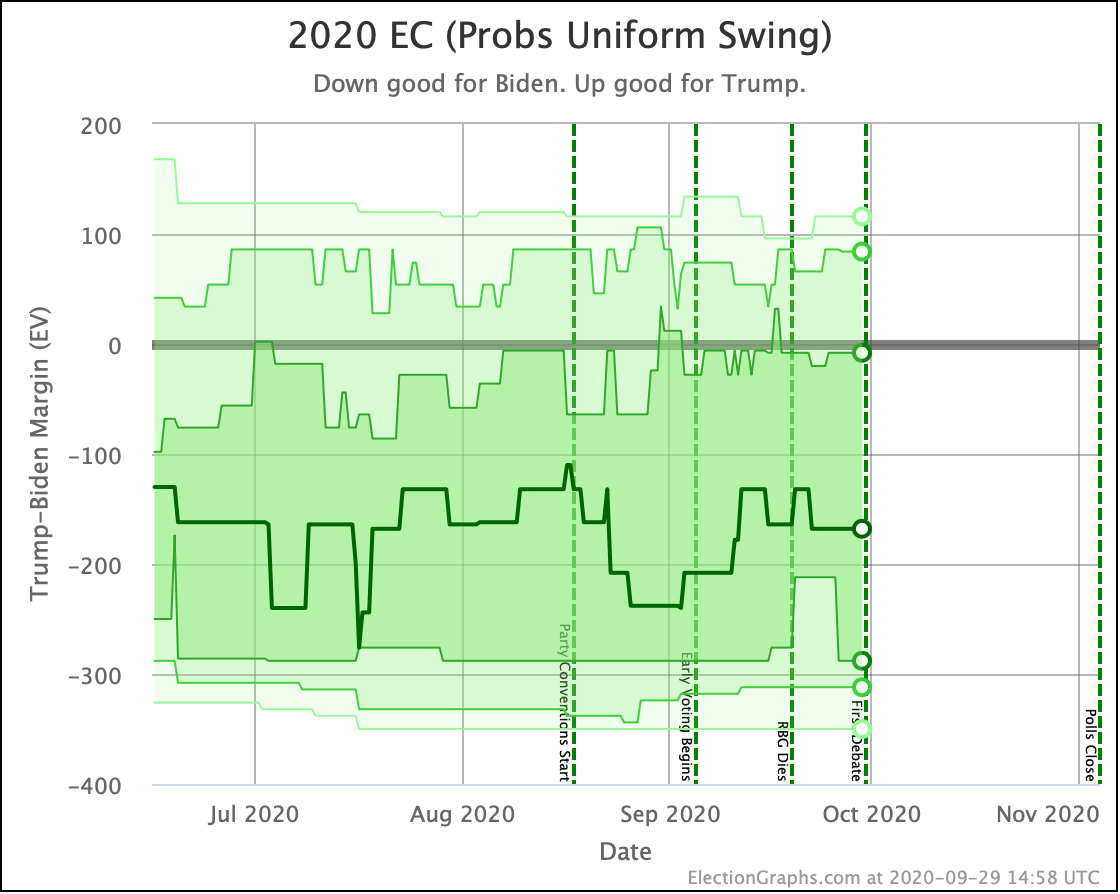
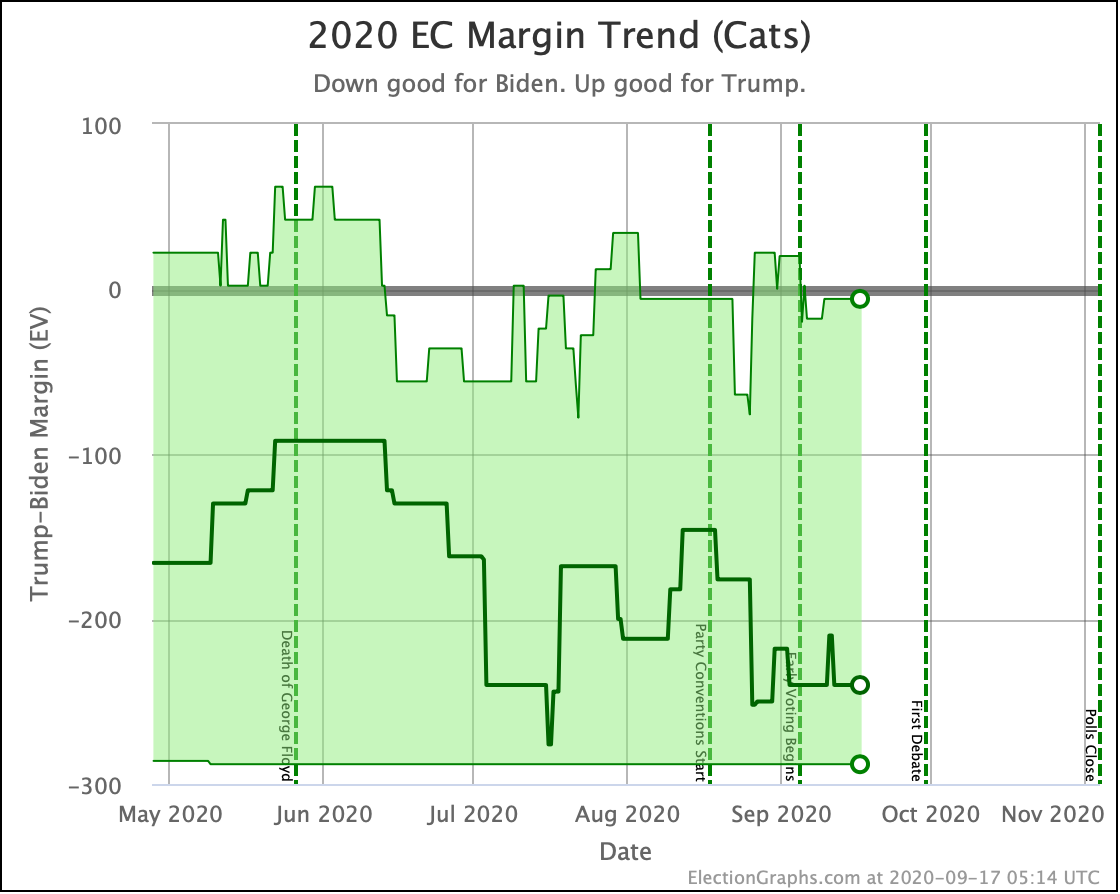
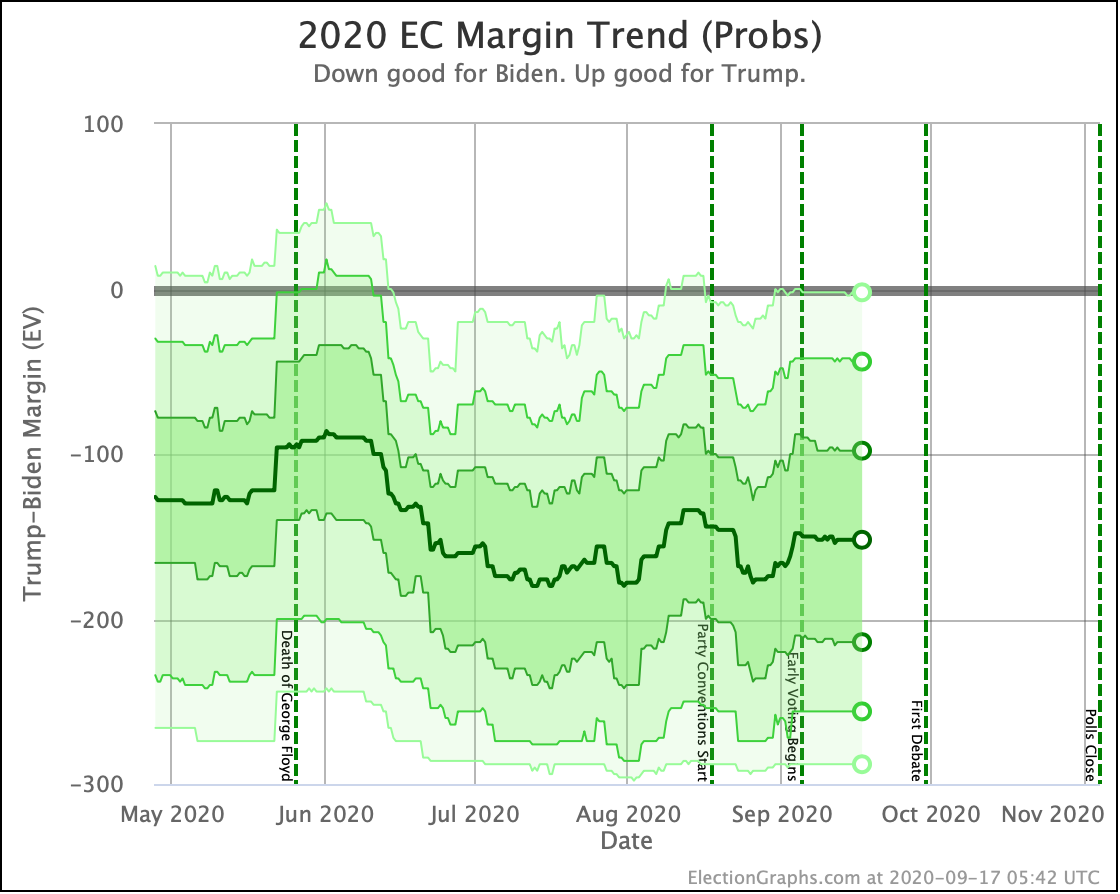
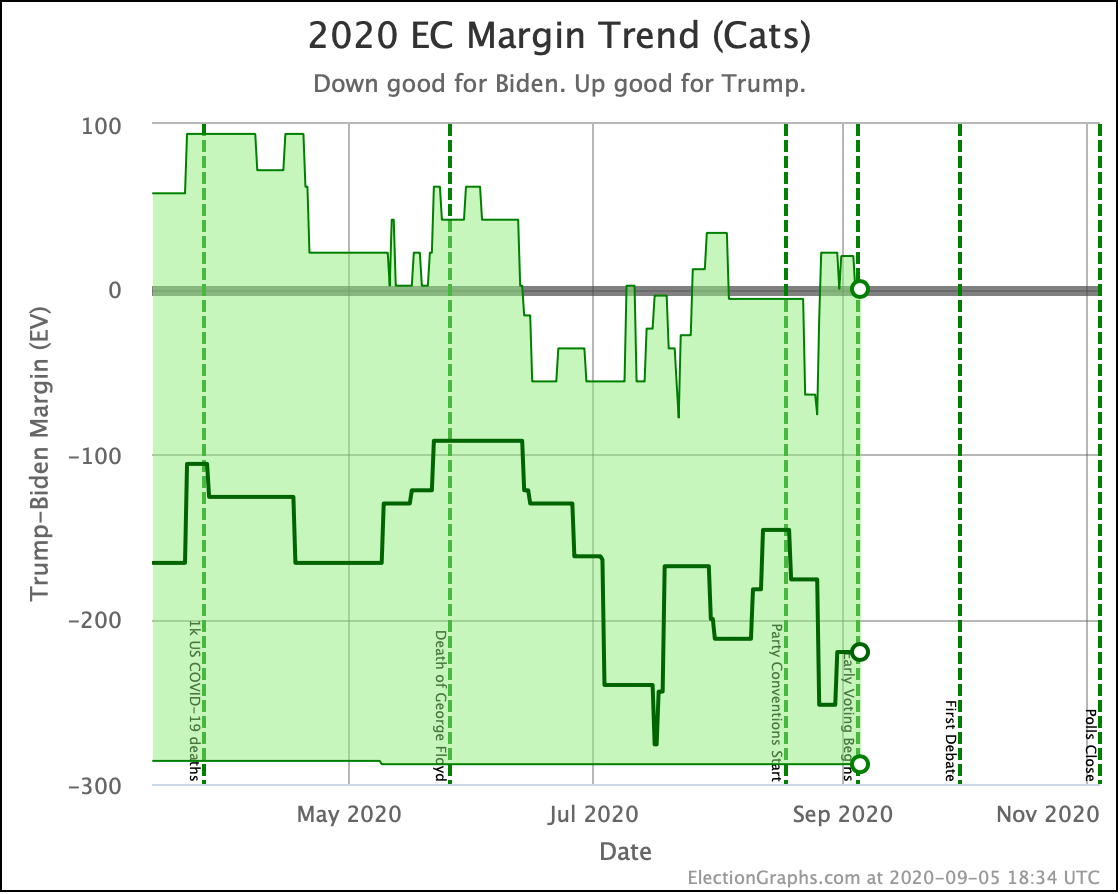
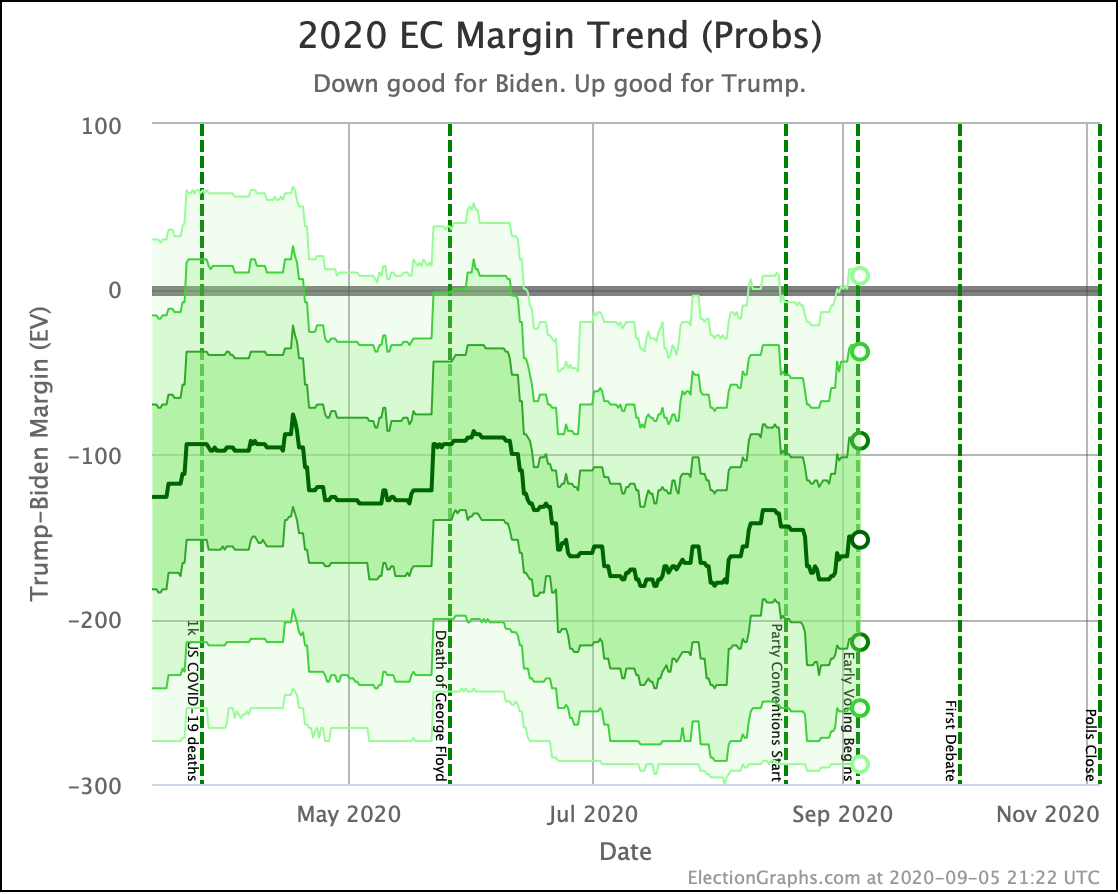
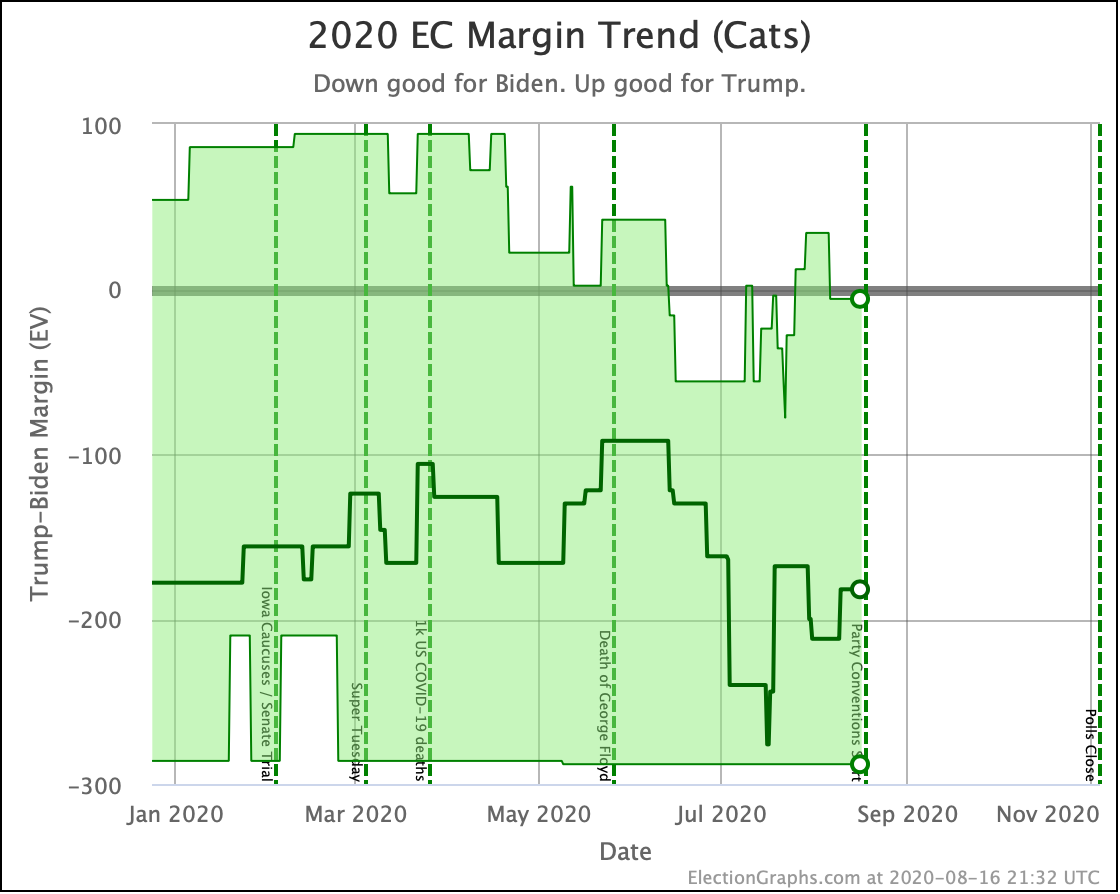
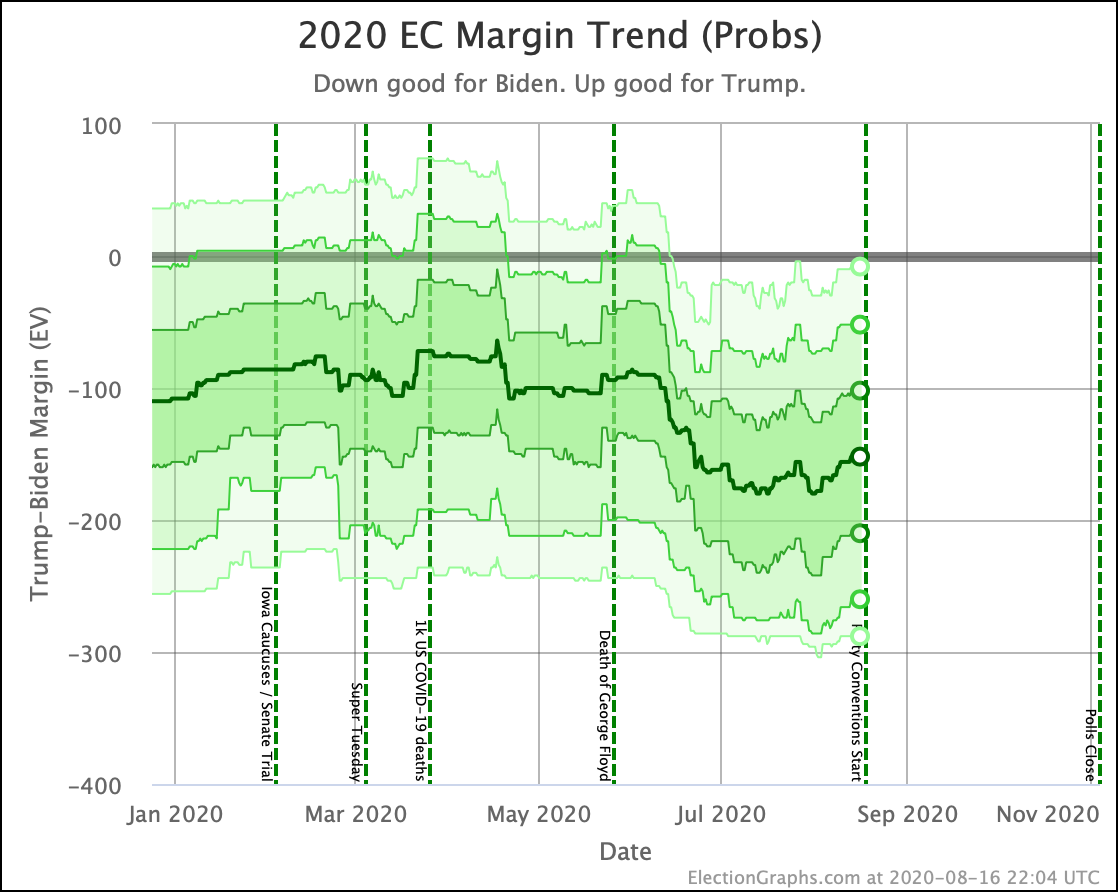
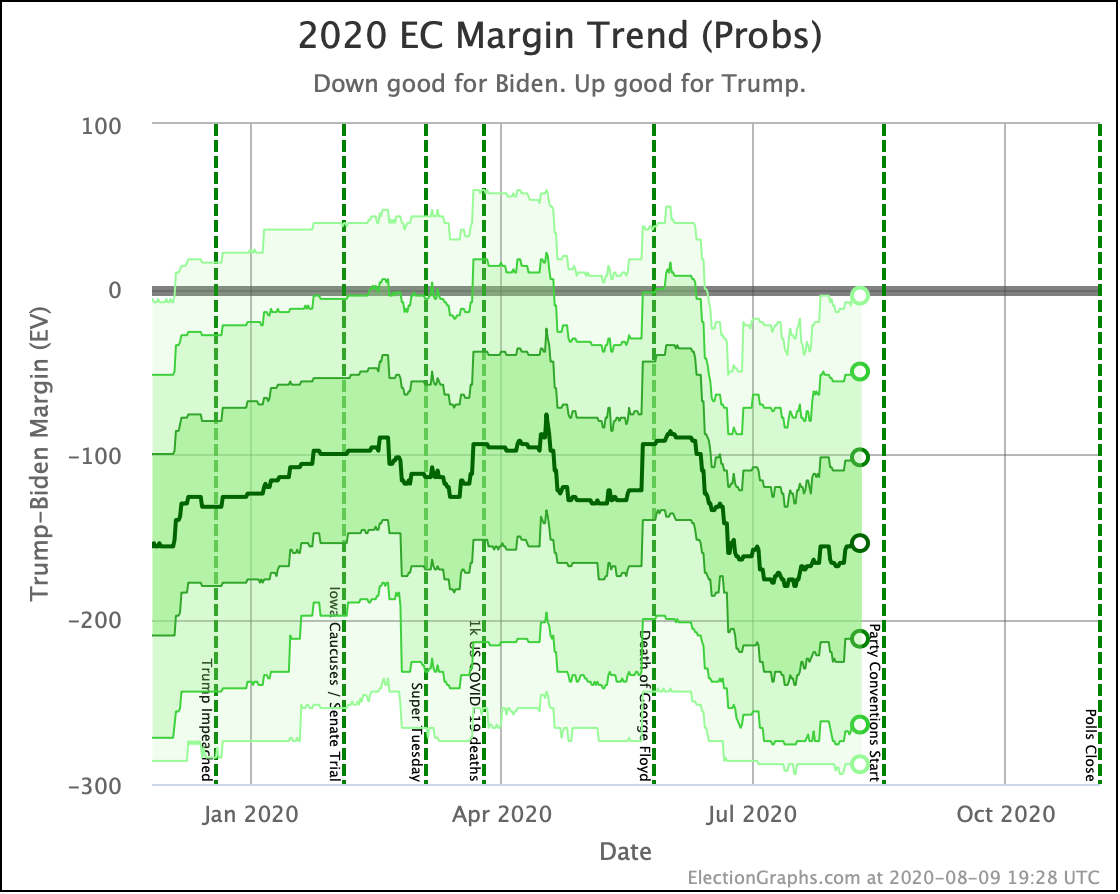
OK. Let's look at the range of margins predicted by our three models:
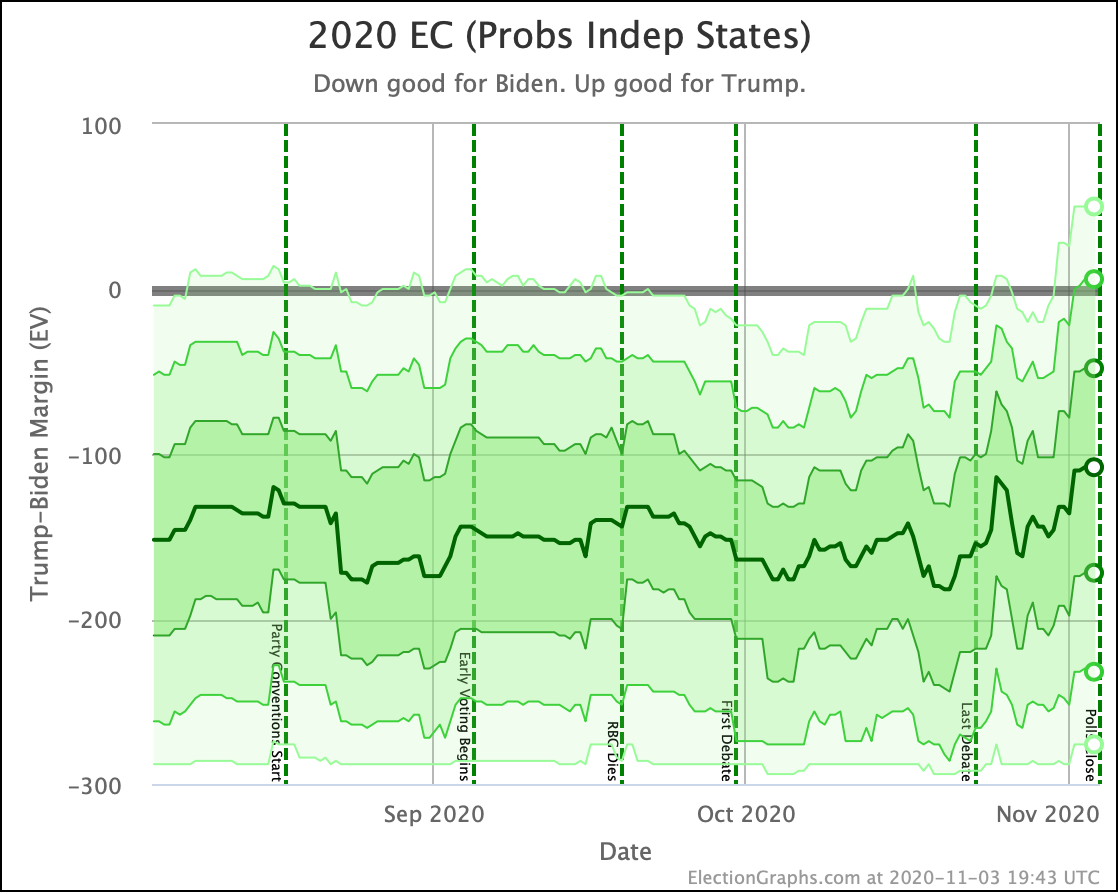
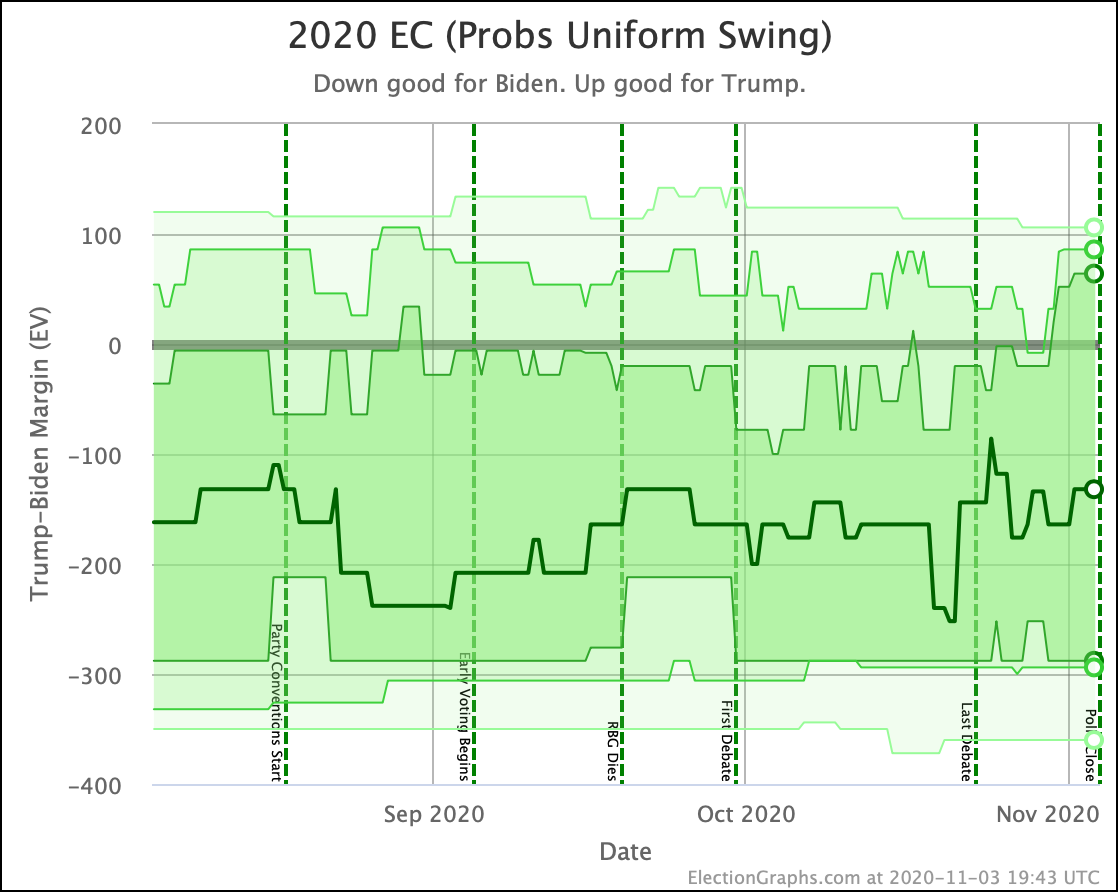
In all three of these cases, the center lines have moved toward Trump, but are either still in their normal ranges, or are just barely out it. What has changed though is that in all cases the upper end of the envelopes, representing Trump's best cases has stretched out significantly further into the Trump wins zone.
This makes sense because most of what we saw was not states actually flipping from Biden to Trump in the averages, just Biden's lead in states being significantly diminished. So the straight-up scenario that happens if the averages are all correct doesn't move much. But the sensitivity to the averages being wrong and therefore states flipping to Trump based on those errors increases significantly.
As a sanity check, let's compare our three centerlines with what other sites are saying at the moment:
- Biden 384 Trump 154 (230 EV margin) – LeanTossup
- Biden 360 Trump 178 (182 EV margin) – HorsesAss
- Biden 356 Trump 182 (174 EV margin) – The Economist
- Biden 351 Trump 187 (164 EV margin) – JHK Forecasts
- Biden 351 Trump 187 (164 EV margin) – Upshot Polling Leads
- Biden 348 Trump 190 (158 EV margin) – FiveThirtyEight
- Biden 335 Trump 203 (132 EV margin) – Upshot 2016 Poll Error
- Biden 335 Trump 203 (132 EV margin) – EG "Expected Case"
- Biden 335 Trump 203 (132 EV margin) – EG "Uniform Swing Median"
- Biden 329 Trump 209 (120 EV margin) – PollyVote
- Biden 323 Trump 215 (108 EV margin) – EG "Indep States Median"
- Biden 321 Trump 217 (104 EV margin) – Sabato's Crystal Ball
- Biden 319 Trump 219 (100 EV margin) – RCP No Toss Up
- Biden 309 Trump 229 (80 EV margin) – Plural Vote
- Biden 290 Trump 248 (42 EV margin) – Election Betting Odds
So I'm in the zone. Most of the big folks have Biden doing better than I do, but there are a few places that have him doing worse.
And the Election Graphs "expected case" exactly matches what the Upshot says would be the result if the polling error in 2020 was the same magnitude and direction as the error in 2016. Which is interesting.
I note of course that nobody has Trump winning in their "expected case".
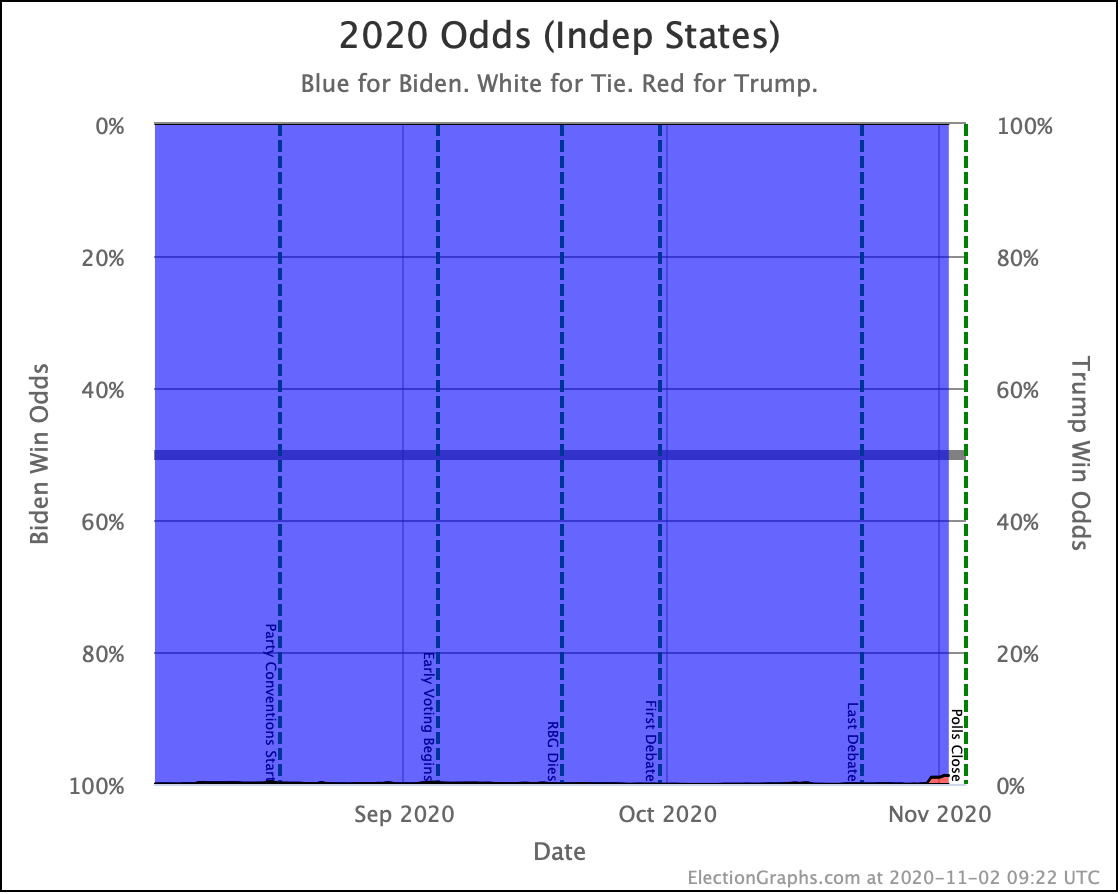
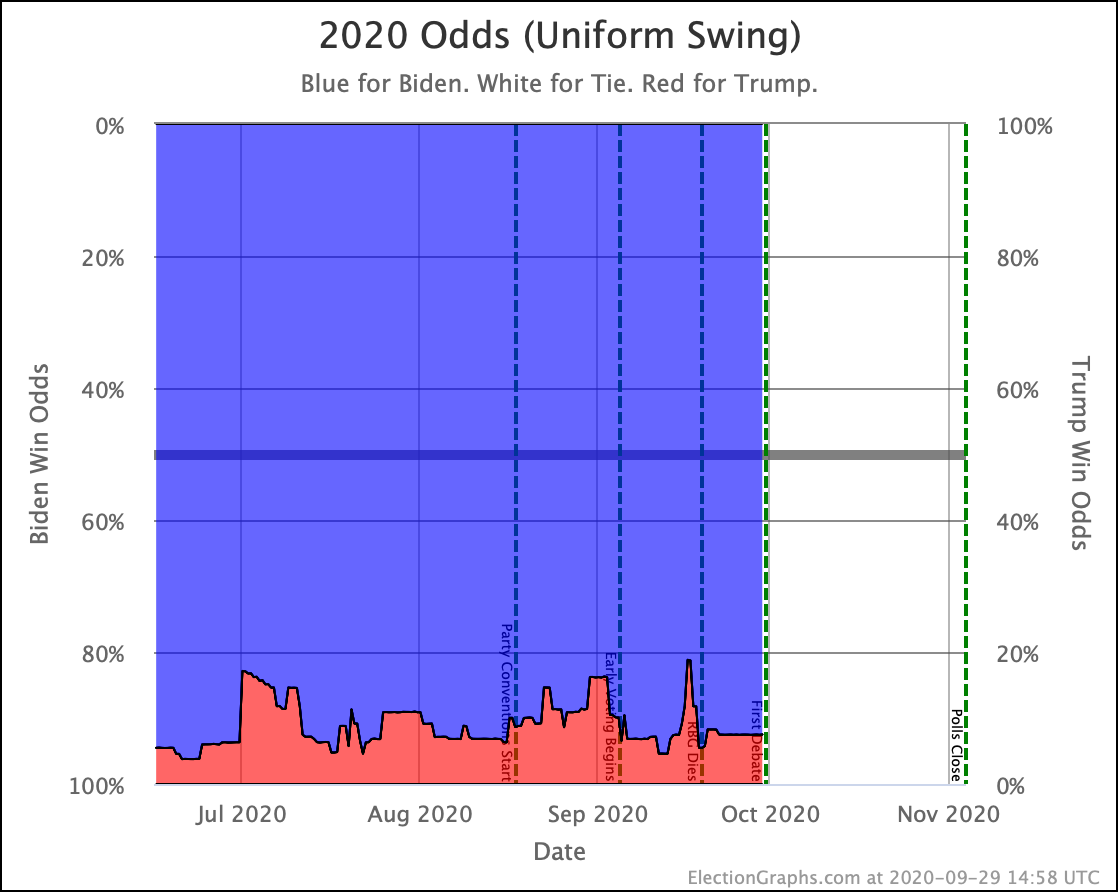
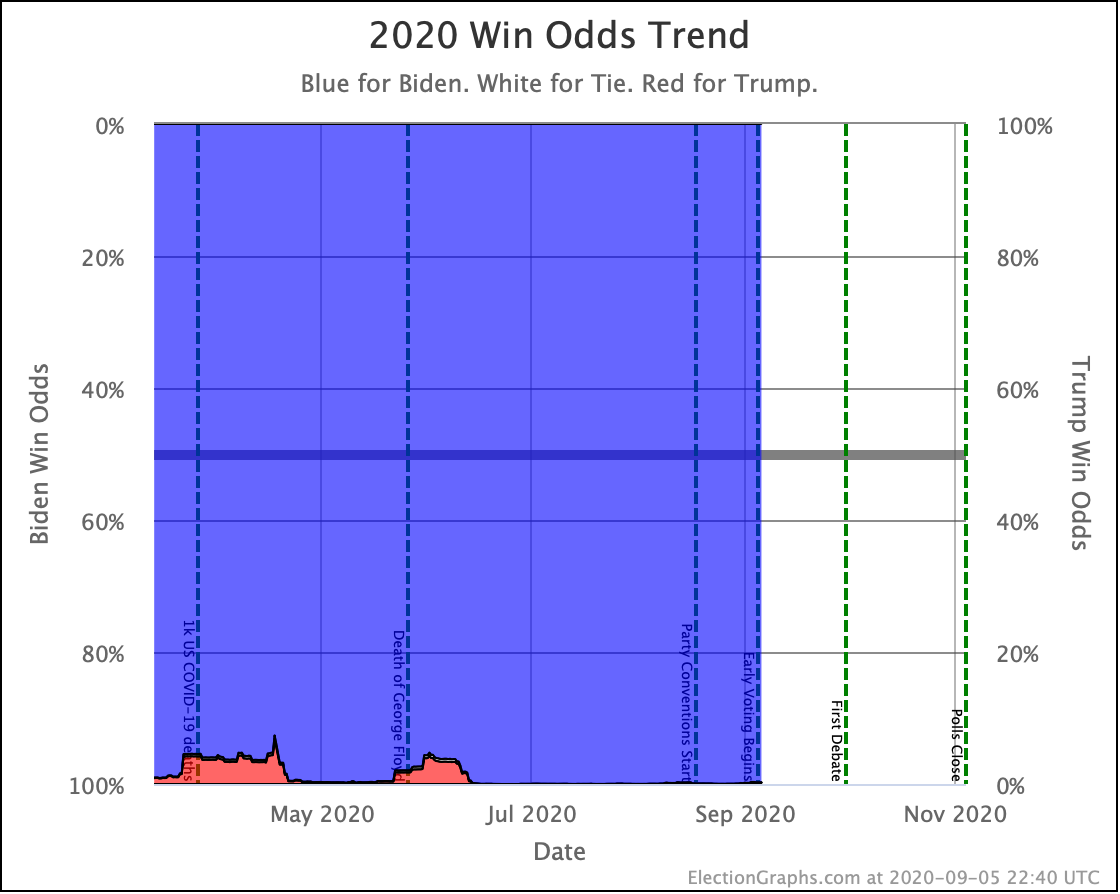
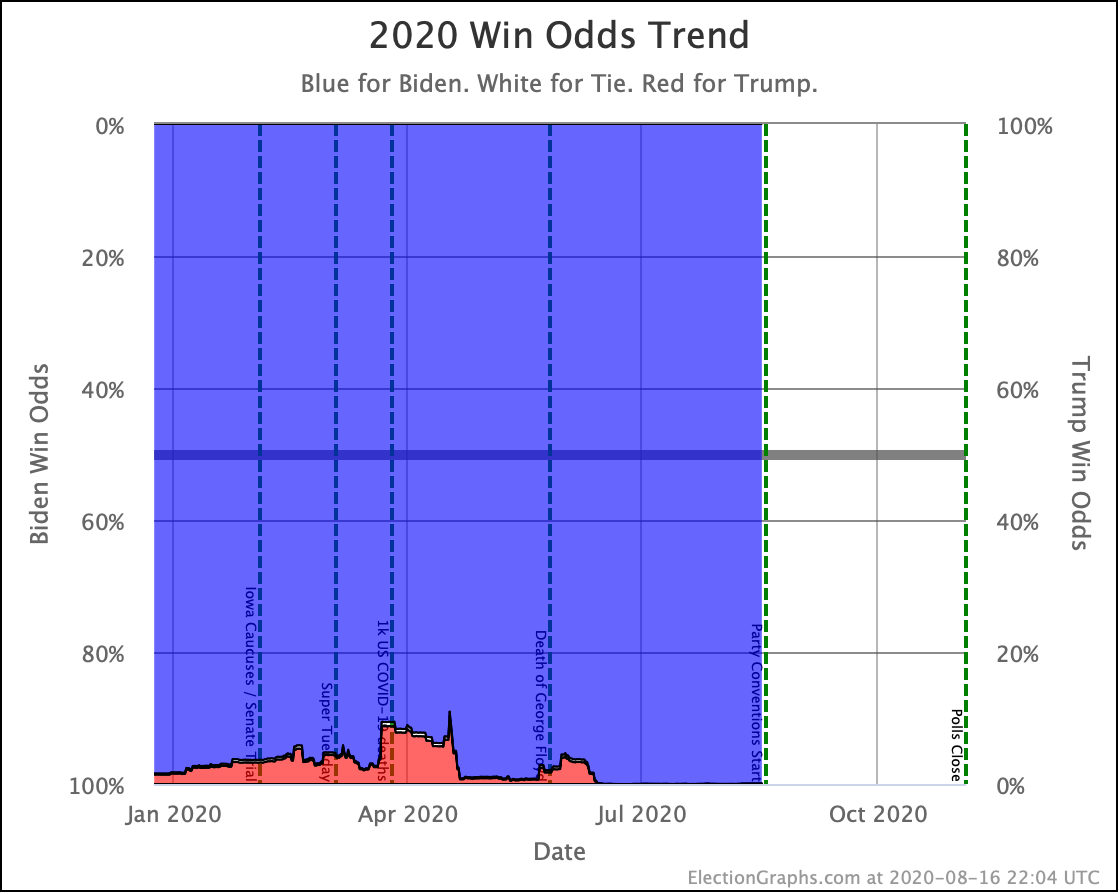
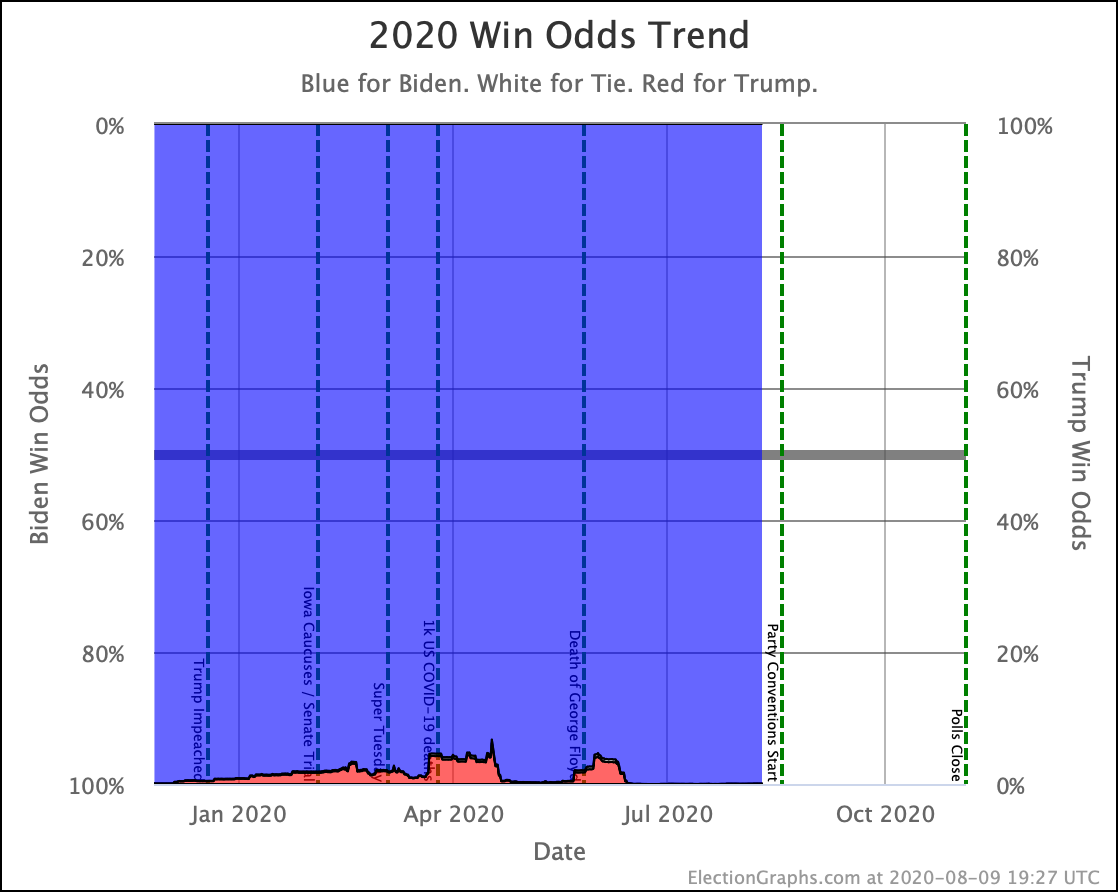
OK, with that done, let's look at odds.
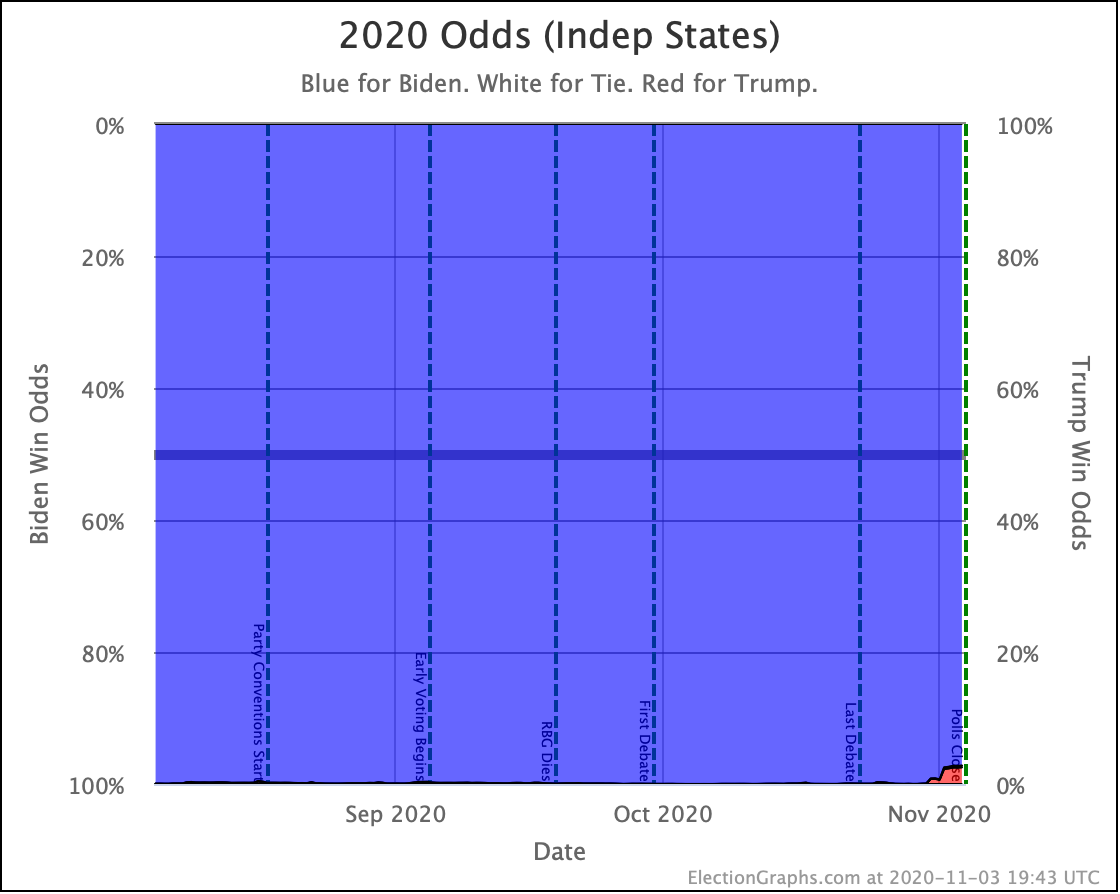
While still small, the red zone in the Independent States odds view is now significantly larger, with Trump's chances now at 2.5%.
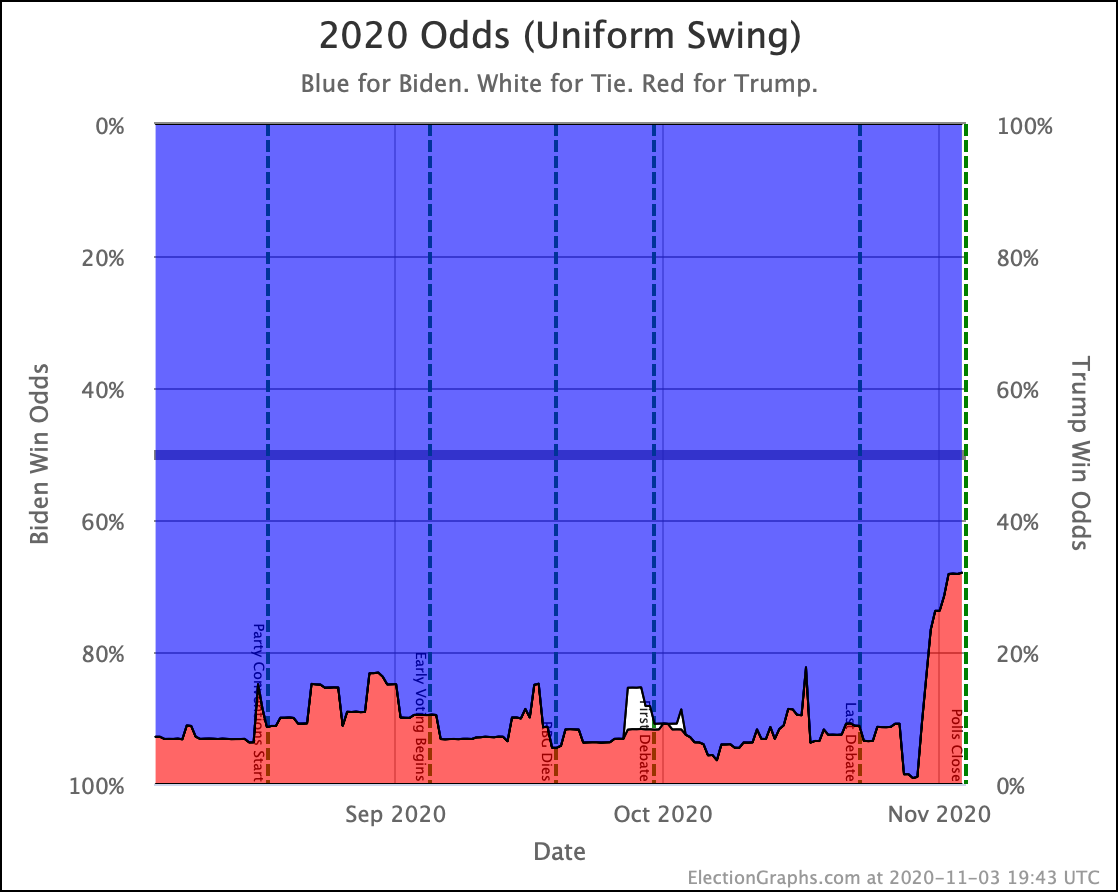
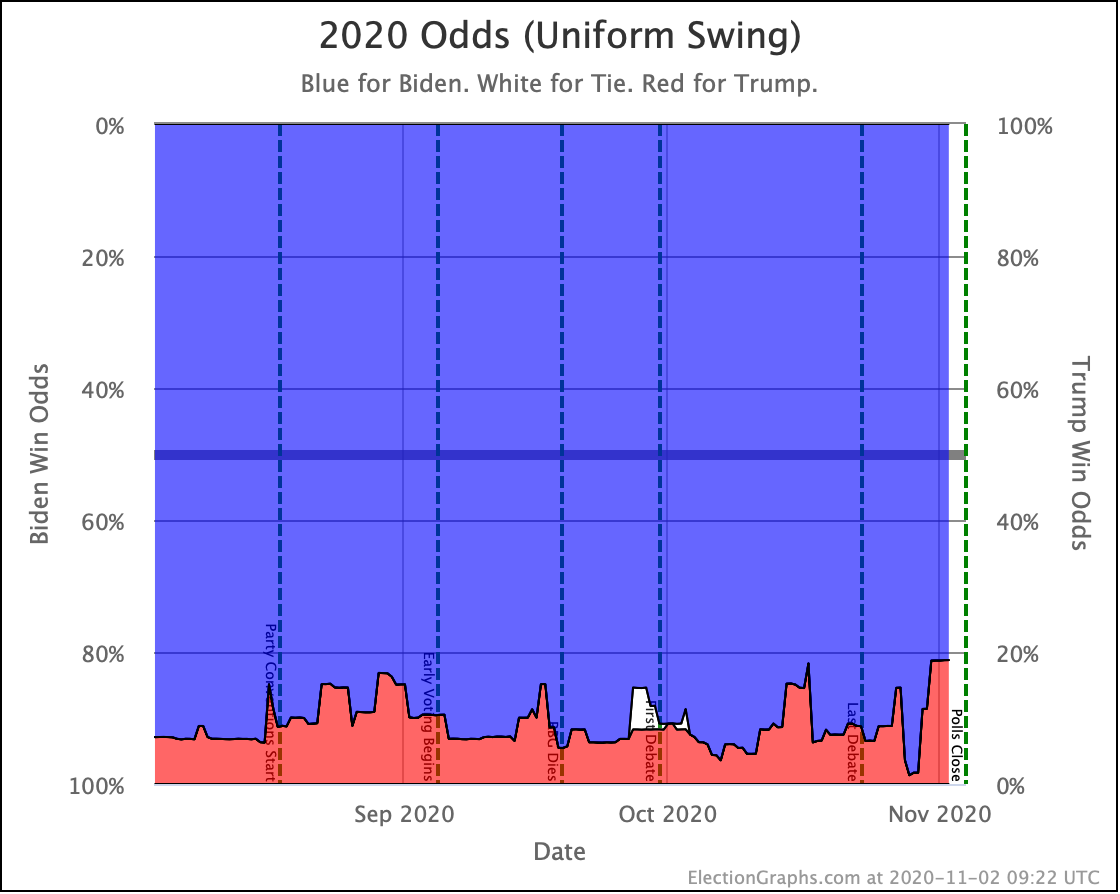
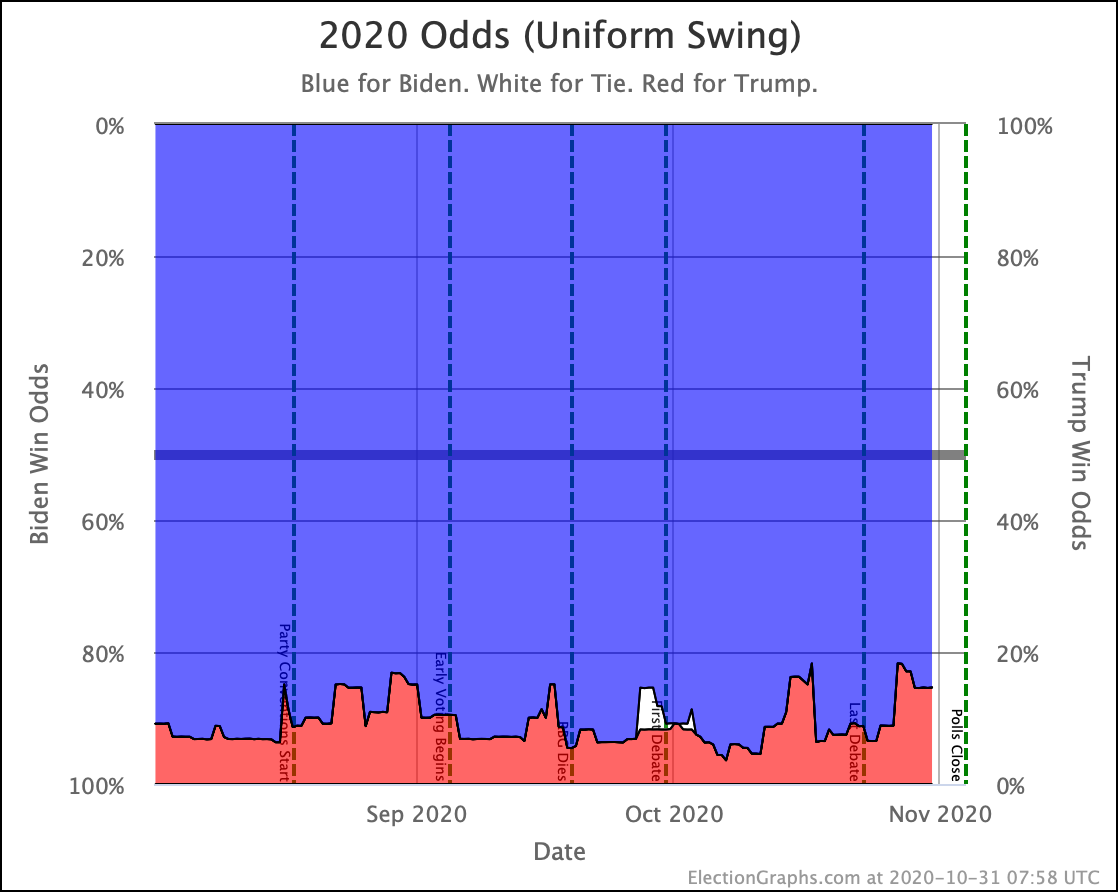
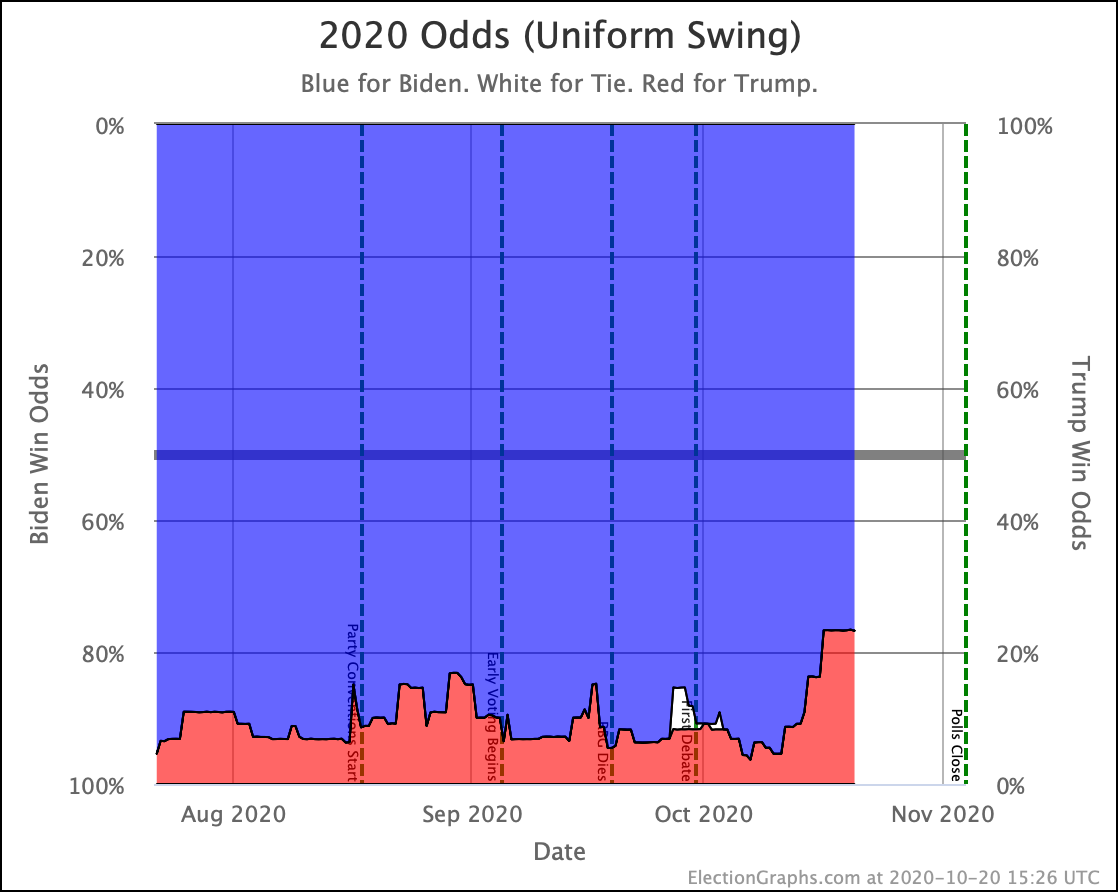
Trump's odds in the uniform swing model are massive now though, at 31.9%.
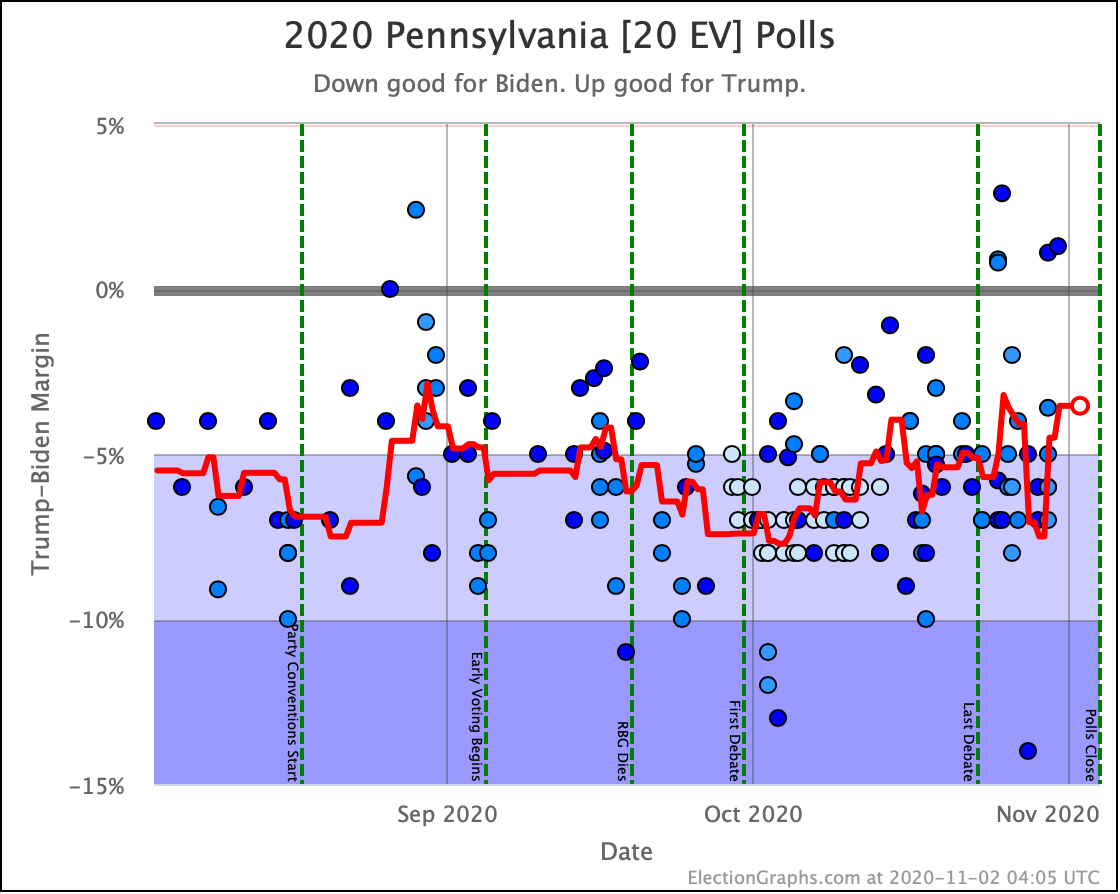
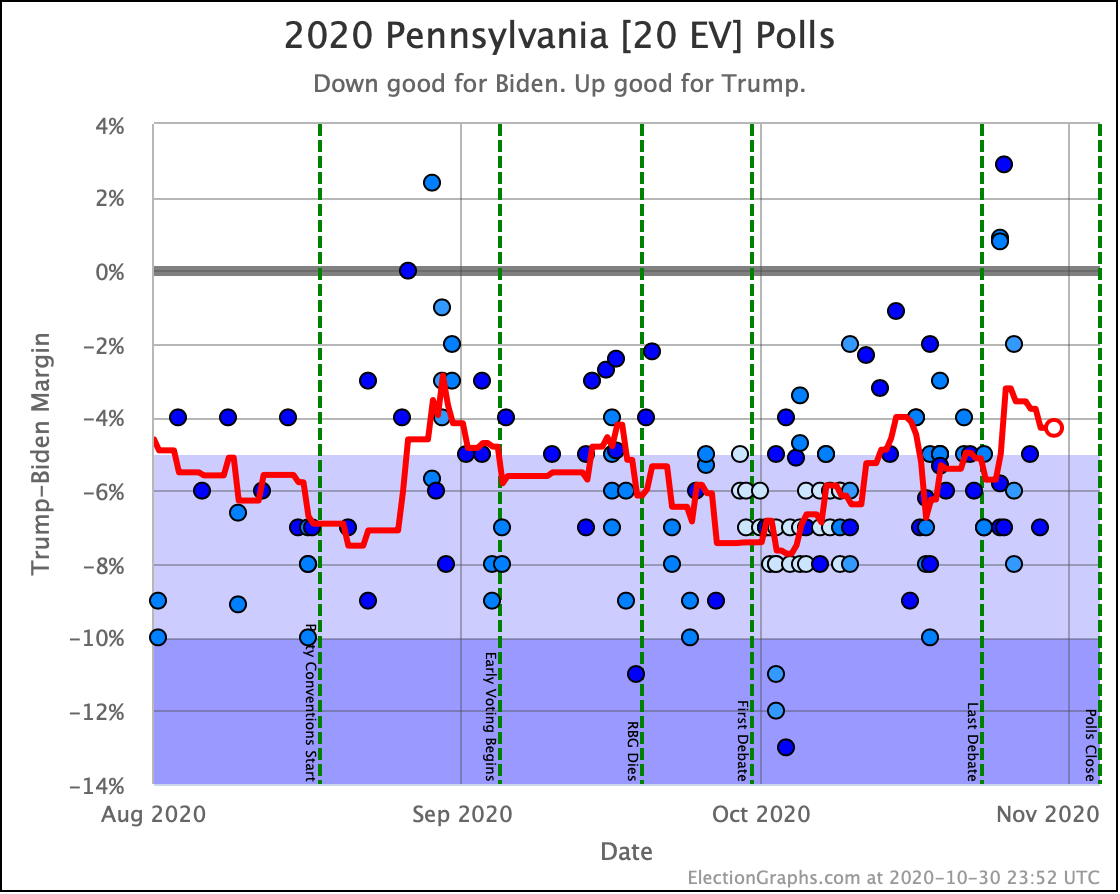
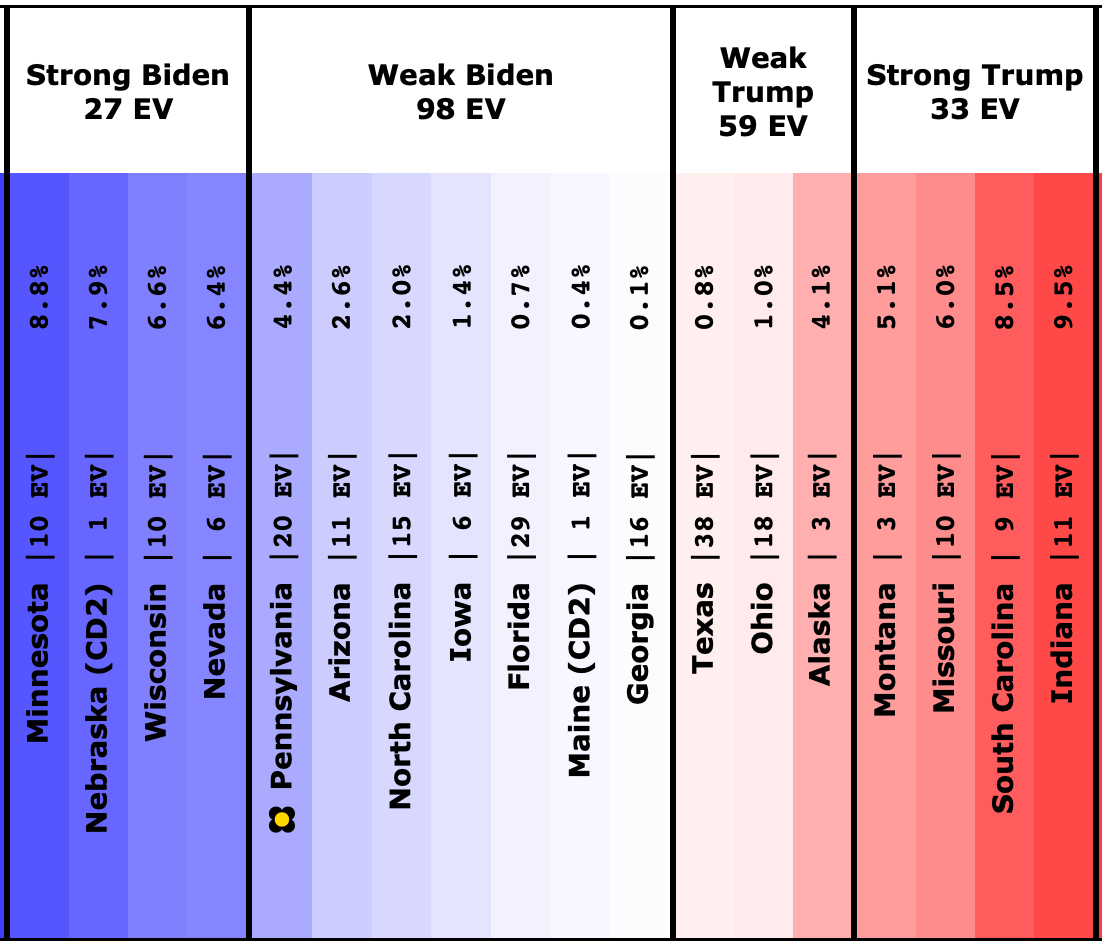
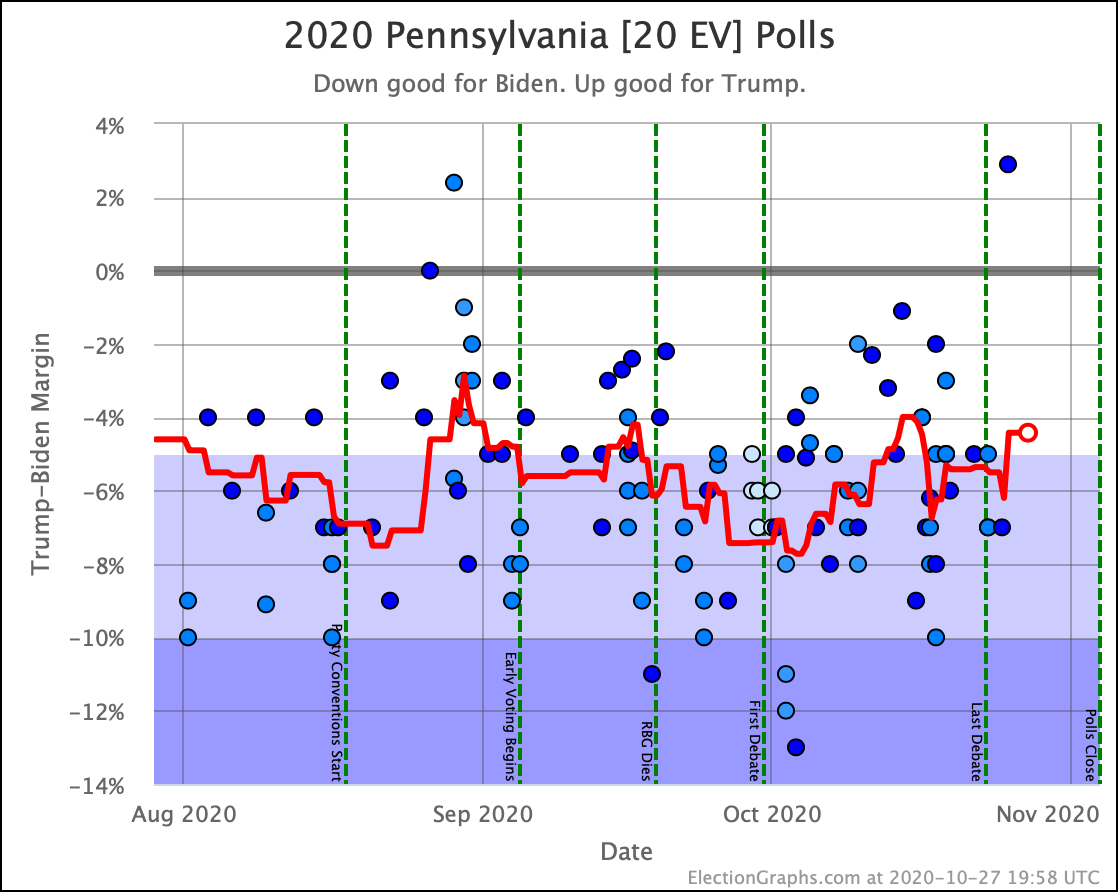
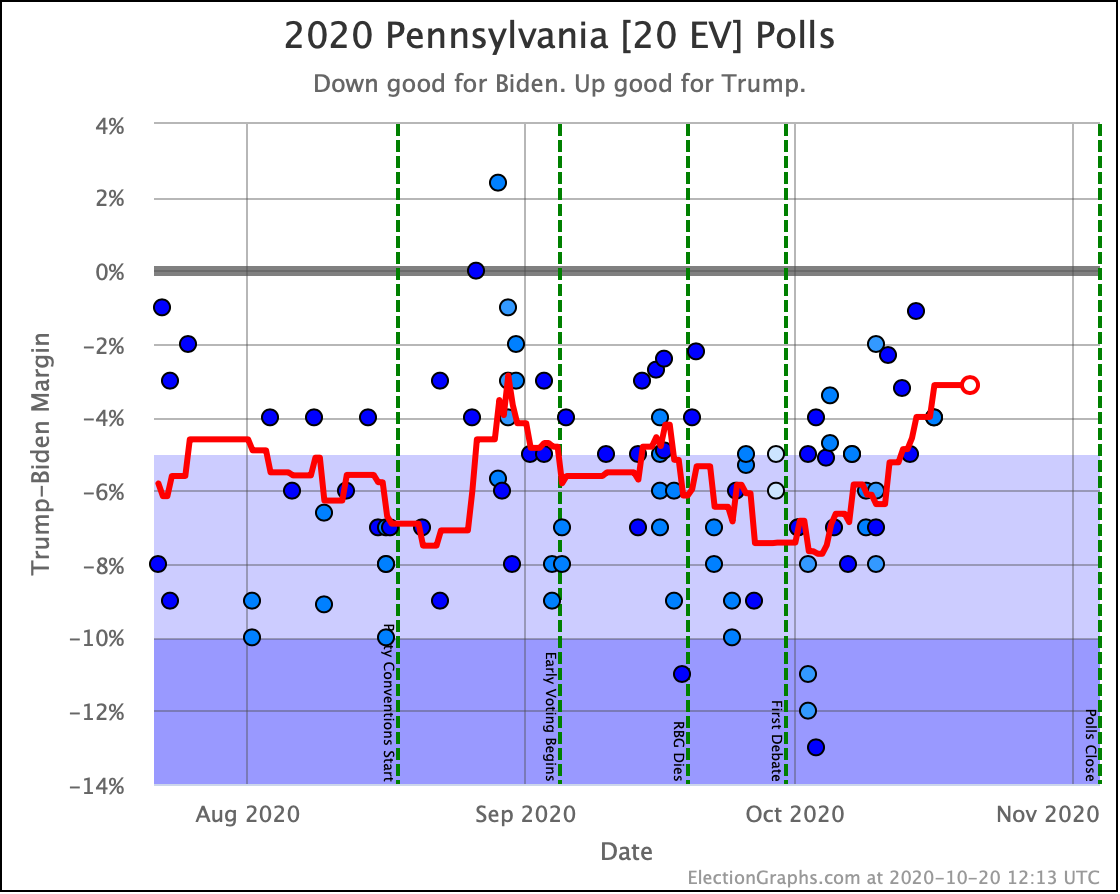
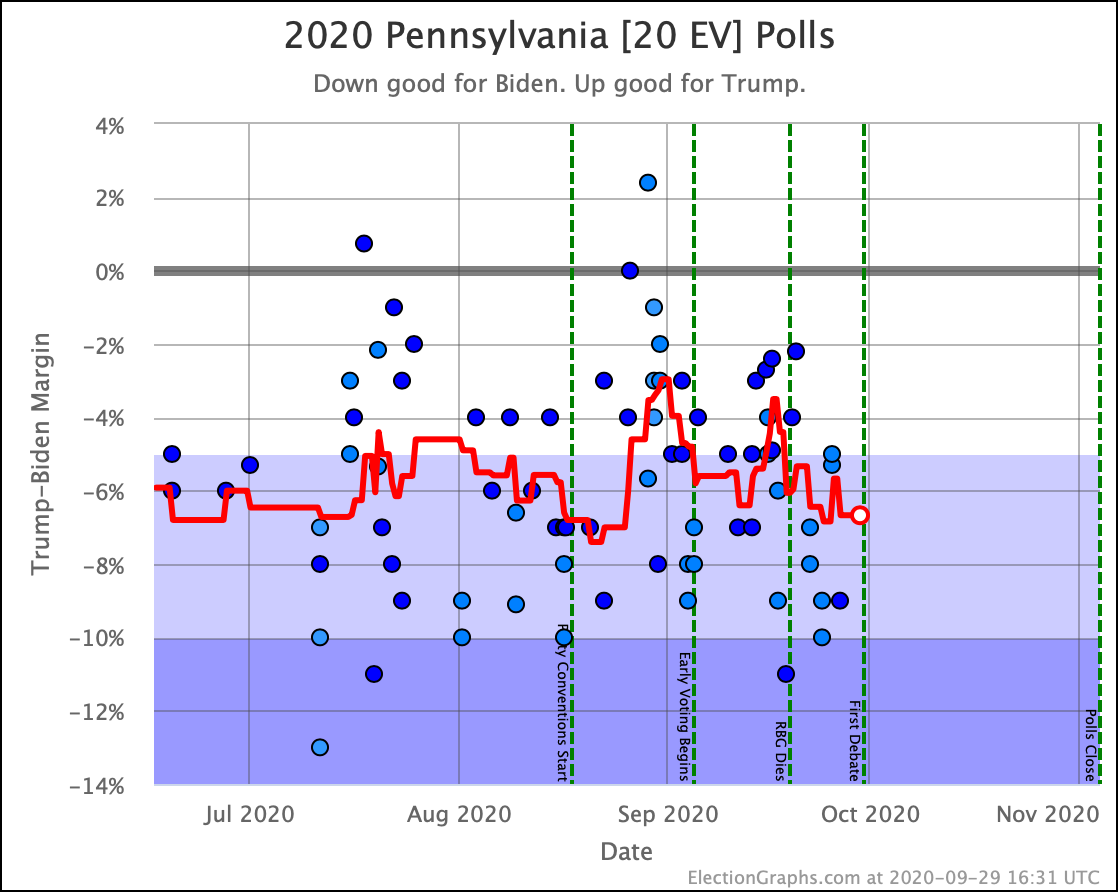
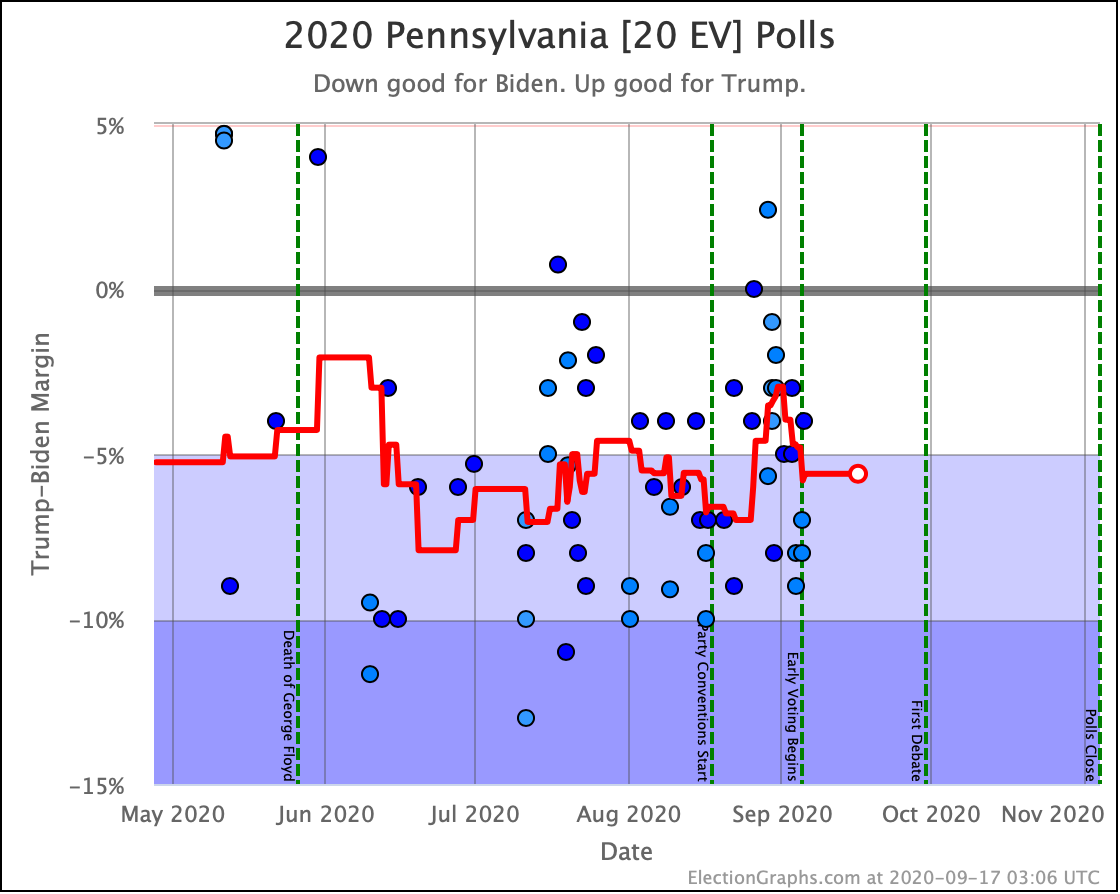
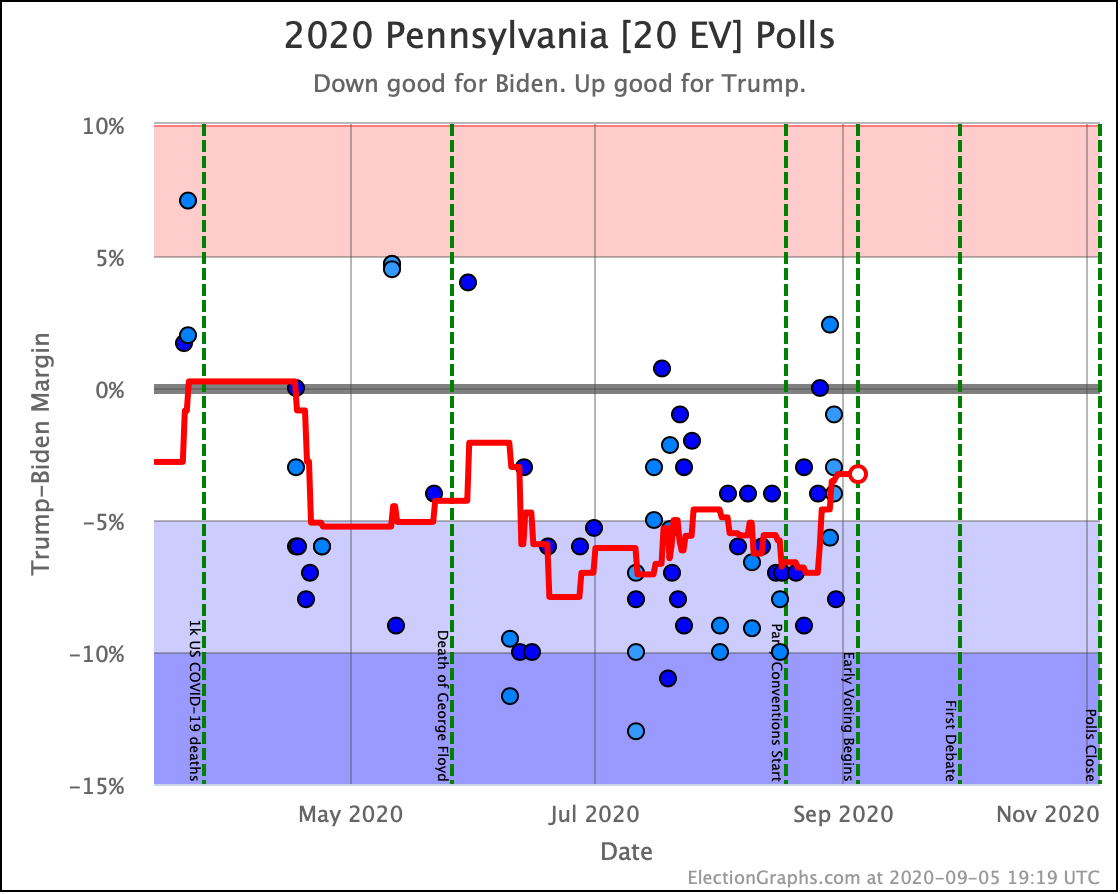
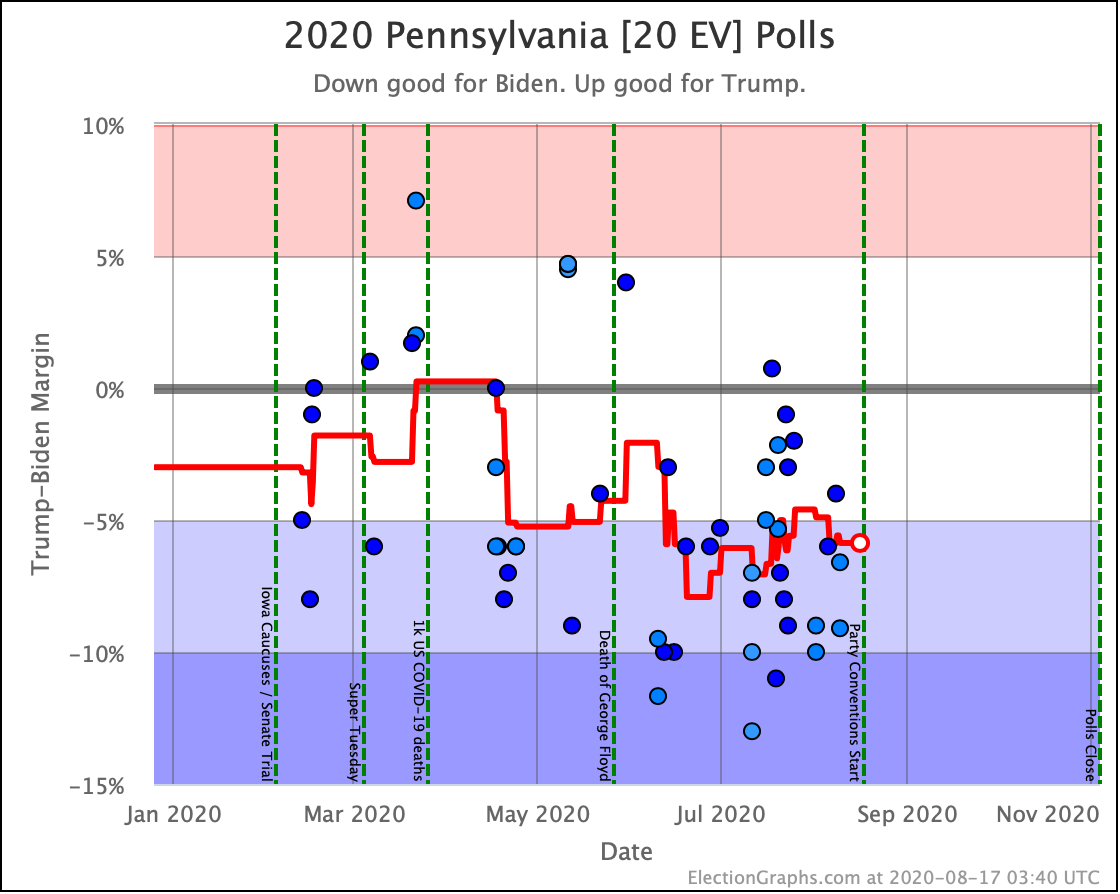
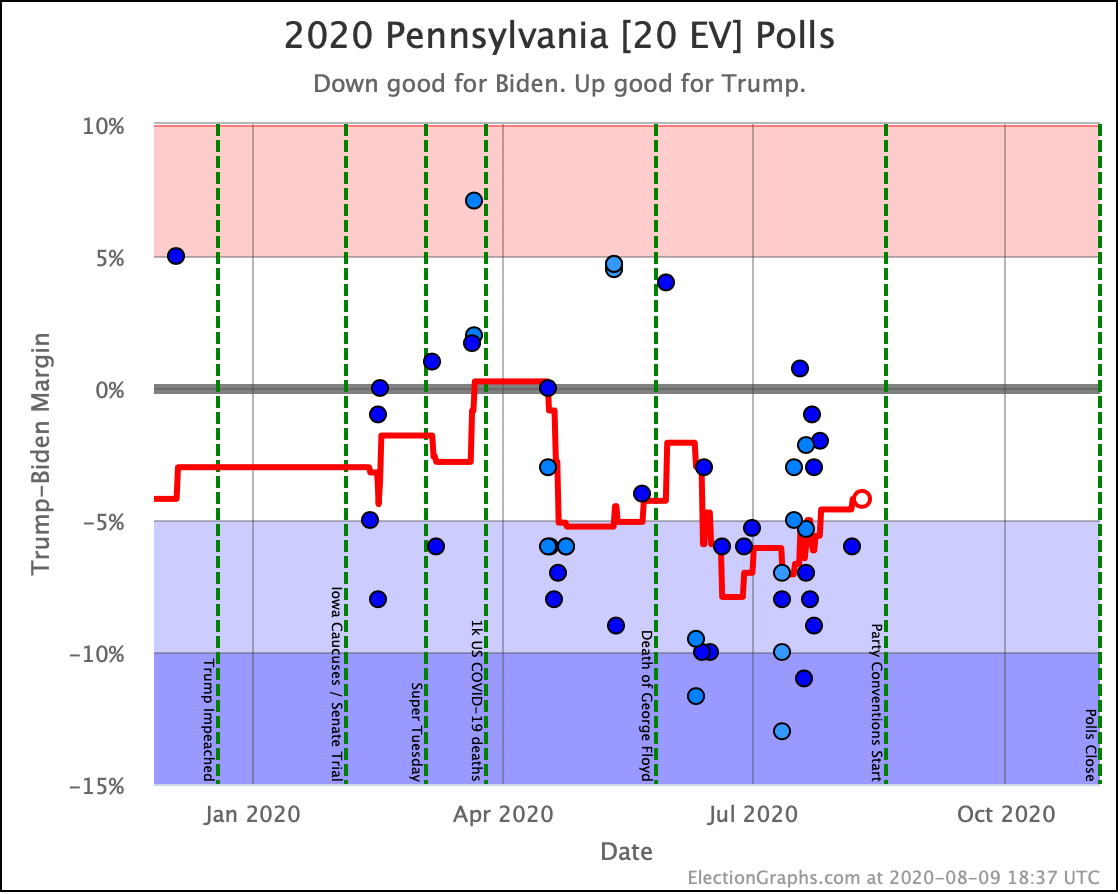
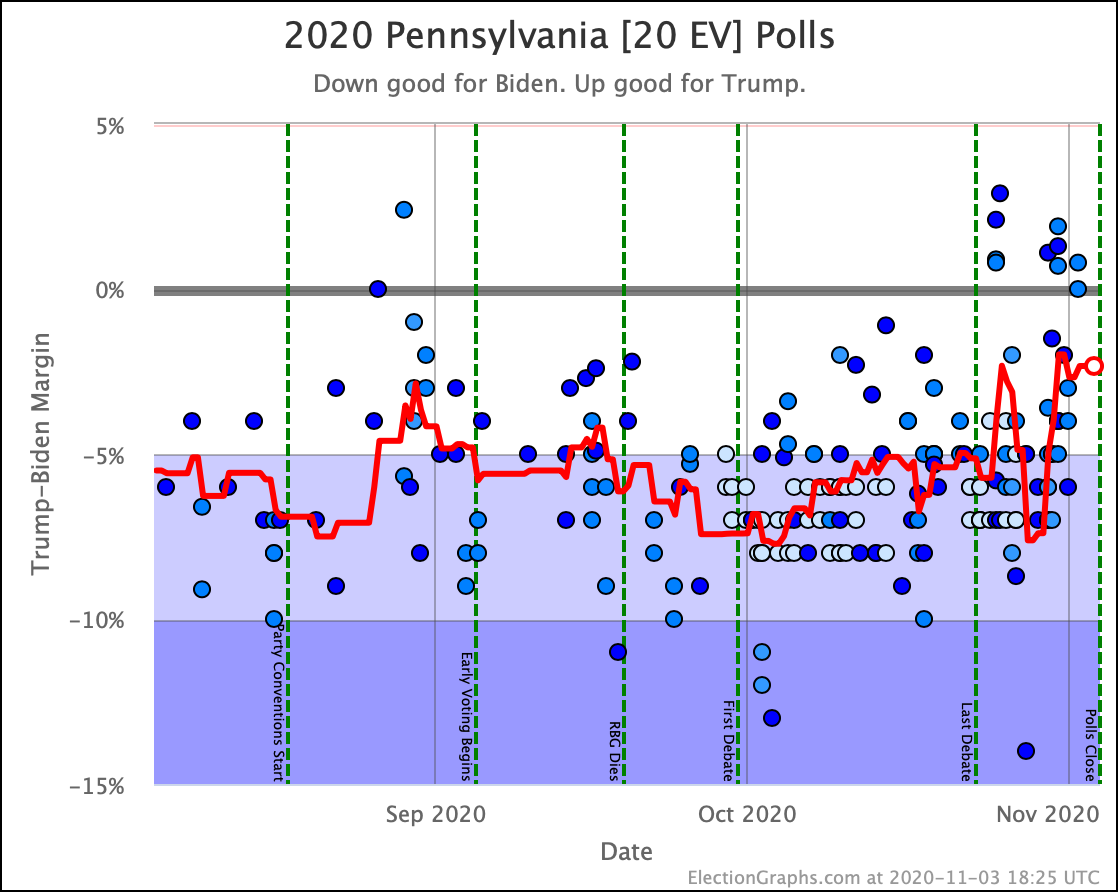
Fundamentally, since this imagines the extreme case where all the states move in a completely synchronous way, the only thing that matters is the odds in the tipping point state. And as of the final situation, the tipping point is Pennsylvania, and our average has Biden leading Pennsylvania by only 2.3%.
And in our analysis of our results from 2008 to 2016, we discovered that when we have a Democrat leading by 2.3%, that translates into a 68.1% chance of the Democrat winning, and a 31.9% chance of the Republican winning.
So Trump's chance of winning Pennsylvania is 31.9%, and if all the states are locked together, that means his odds of winning the whole election would be 31.9% too.
Since both of these models are extremes, and the truth is somewhere in between, the official Election Graphs statement on Trump's chances at this point is "between 2.5% and 31.9%". Election Graphs doesn't actually model where the right spot is within this range, but the middle is as good a spot to look at as any. That would be a 17.2% chance of a Trump win at the moment.
Once again, let's compare with the other folks:
- >99.9% Biden, <0.1% Trump – HorsesAss
- 97.2% Biden, 2.5% Trump – EG "Indep States Odds"
- 97.0% Biden, 3.0% Trump – The Economist
- 96.0% Biden, 3.8% Trump – LeanTossup
- 91.4% Biden, 8.6% Trump – JHK Forecasts
- 89.0% Biden, 10.0% Trump – FiveThirtyEight
- 82.8% Biden, 17.2% Trump – EG "The Middle"
- 77.0% Biden, 23.0% Trump – PollyVote
- 68.9% Biden, 31.1% Trump – EG "Uniform Swing Odds"
- 65.1% Biden, 34.5% Trump – Plural Vote
- 64.9% Biden, 34.6% Trump – Election Betting Odds
My two extreme models are unsurprisingly near the extremes. "The middle" puts me lower than most of the "big" outlets. So maybe they think which there is some correlation between the states, their models still think they are more independent than not.
In any case, Biden is a favorite in all of these views. But in some, the chances of an upset are much more than others.
Not including the three from me, the median is a 9.3% chance of a Trump win. Including all three of mine, the median is 10.0%.
So as usual I make the statement that people tend to be bad at interpreting odds. 10% is not 0%. 10% happens all the time. Biden is favored, but a Trump win is still very possible.
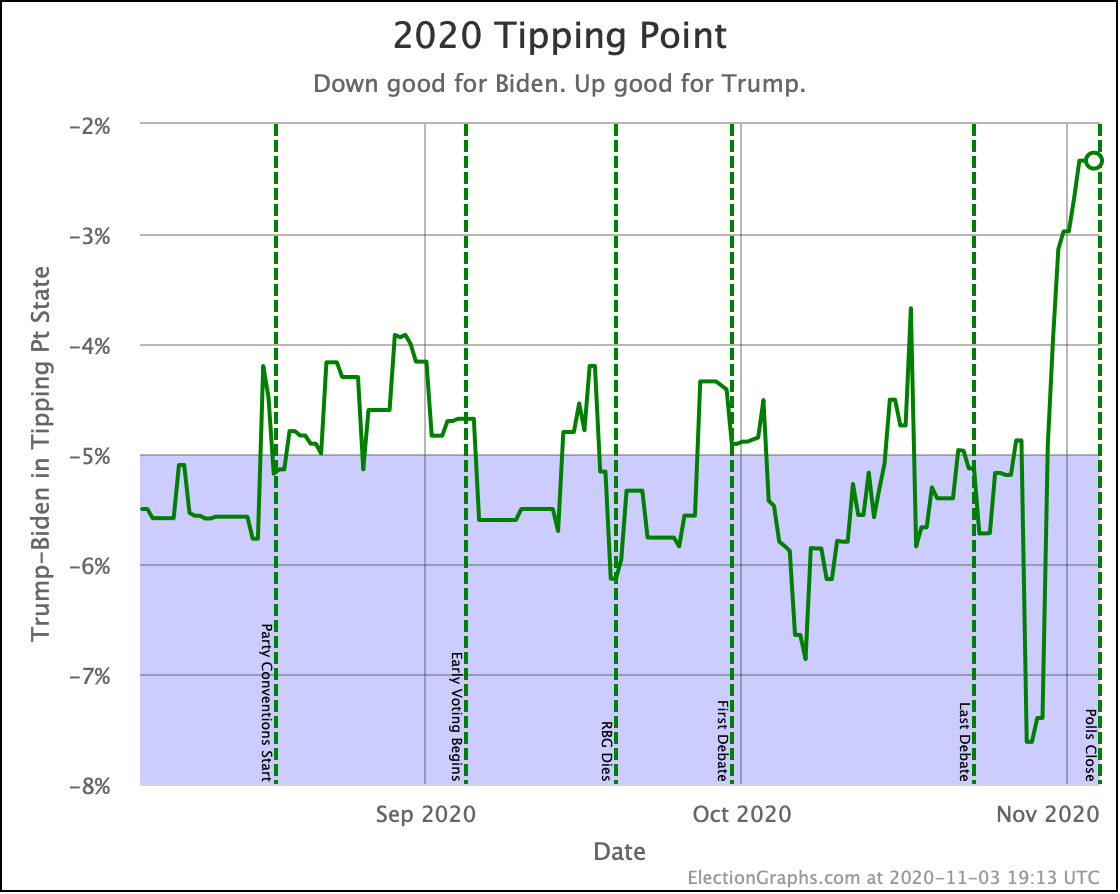
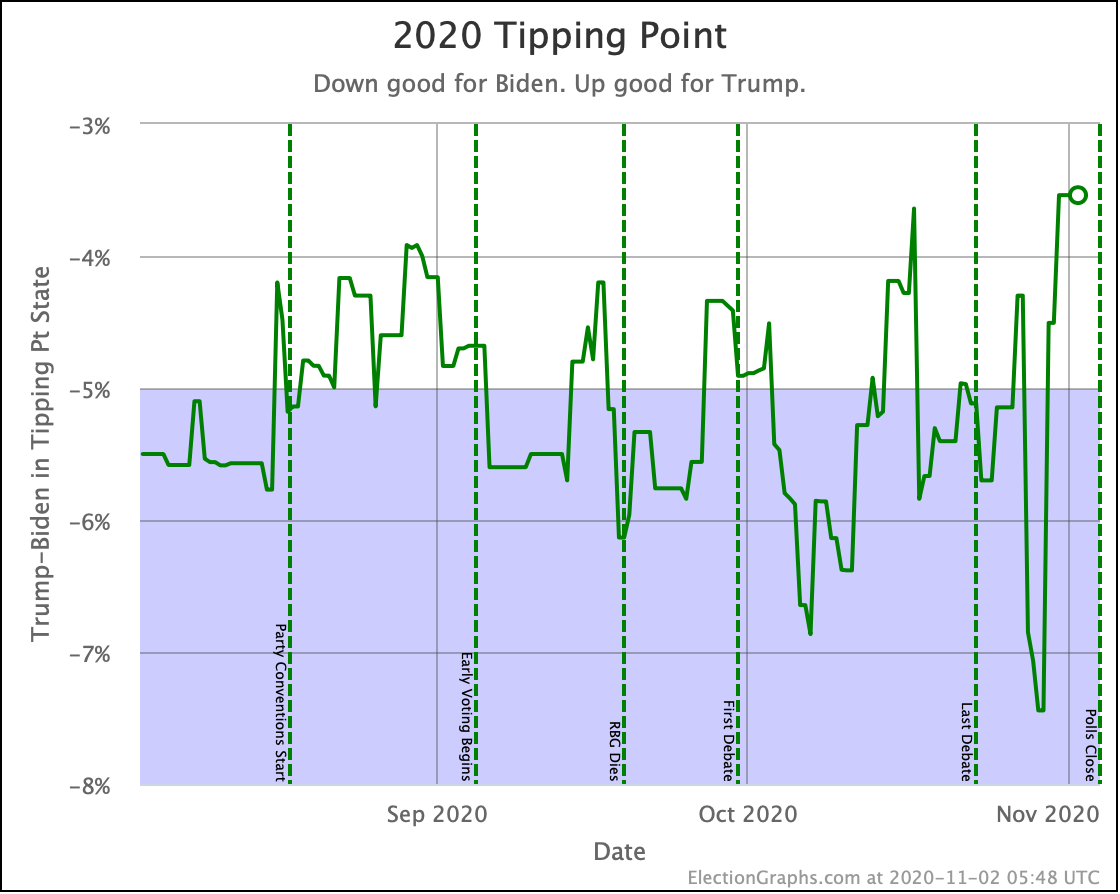
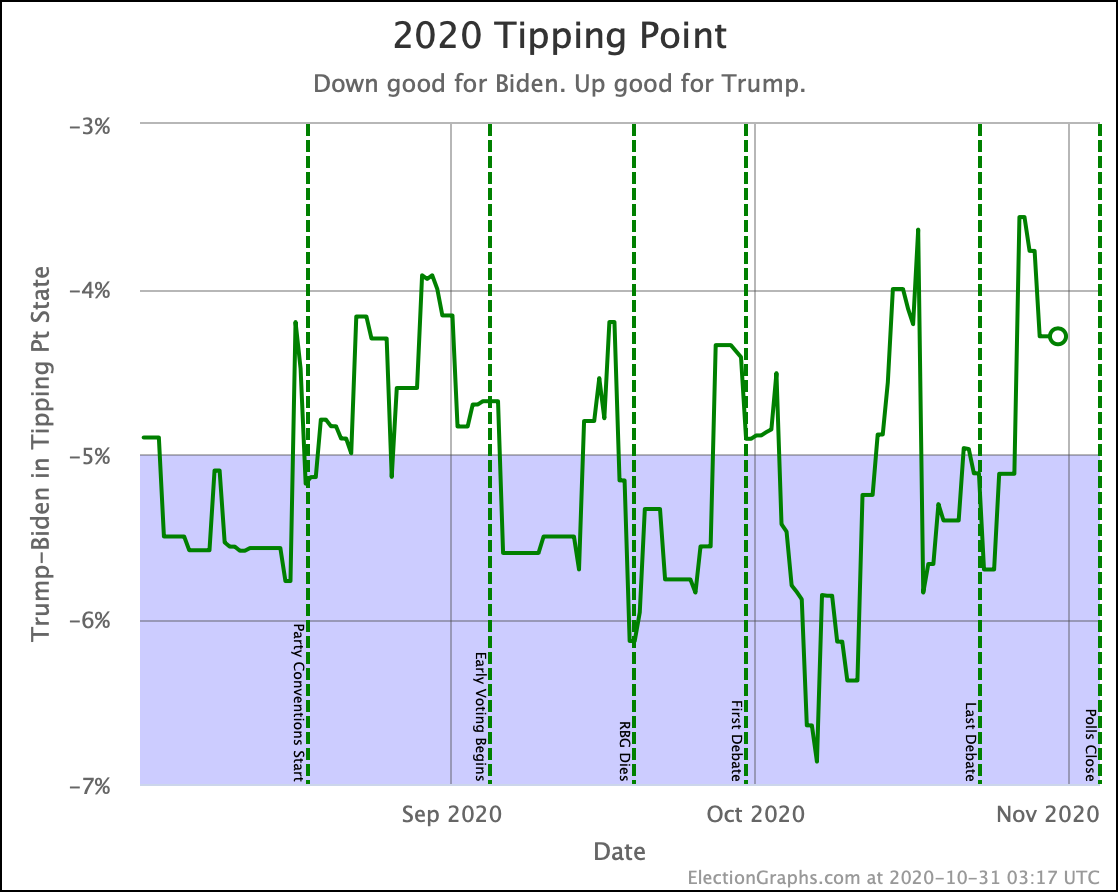
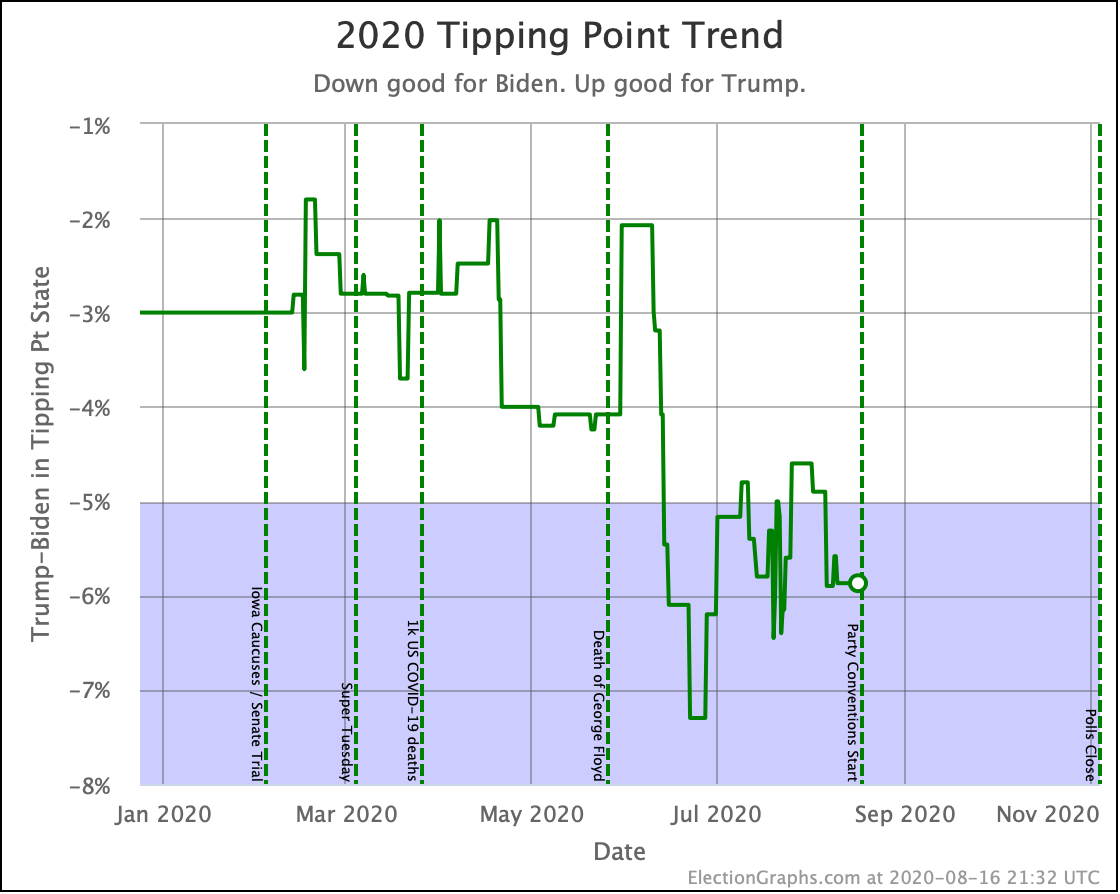
Looking at the tipping point without the 2016 comparison, the main thing to notice is the huge volatility at the end. Swinging first in favor of Biden, then against him. This is an indication that perhaps for 2024, I should look into ways to make this a little LESS sensitive to short term changes in the last weeks.
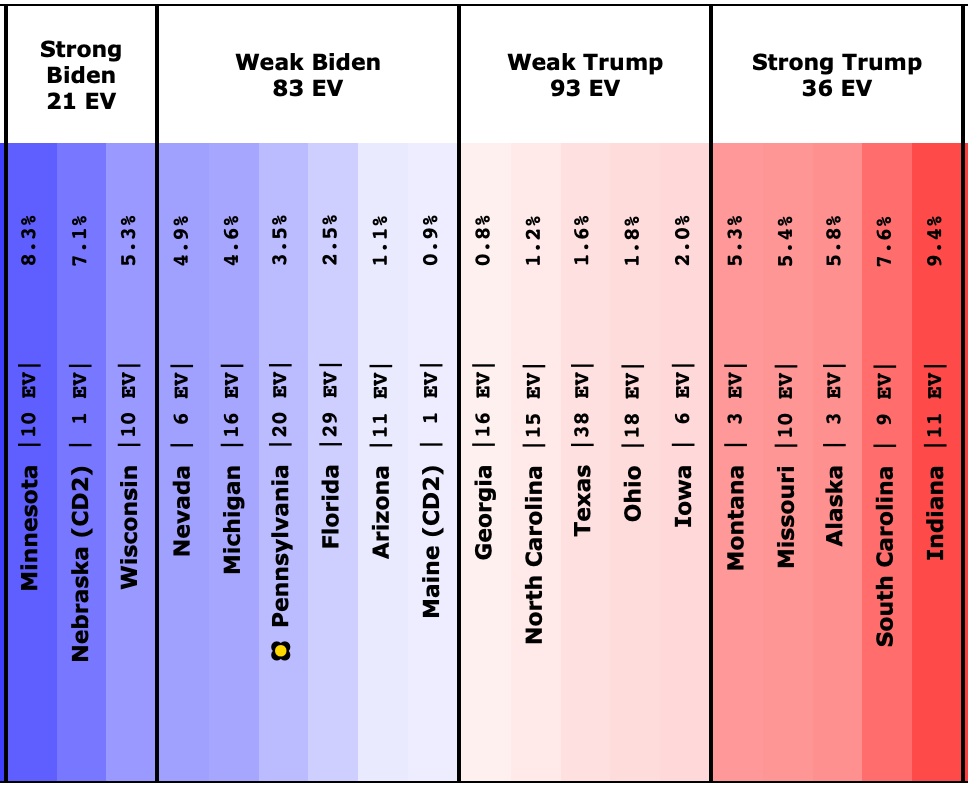
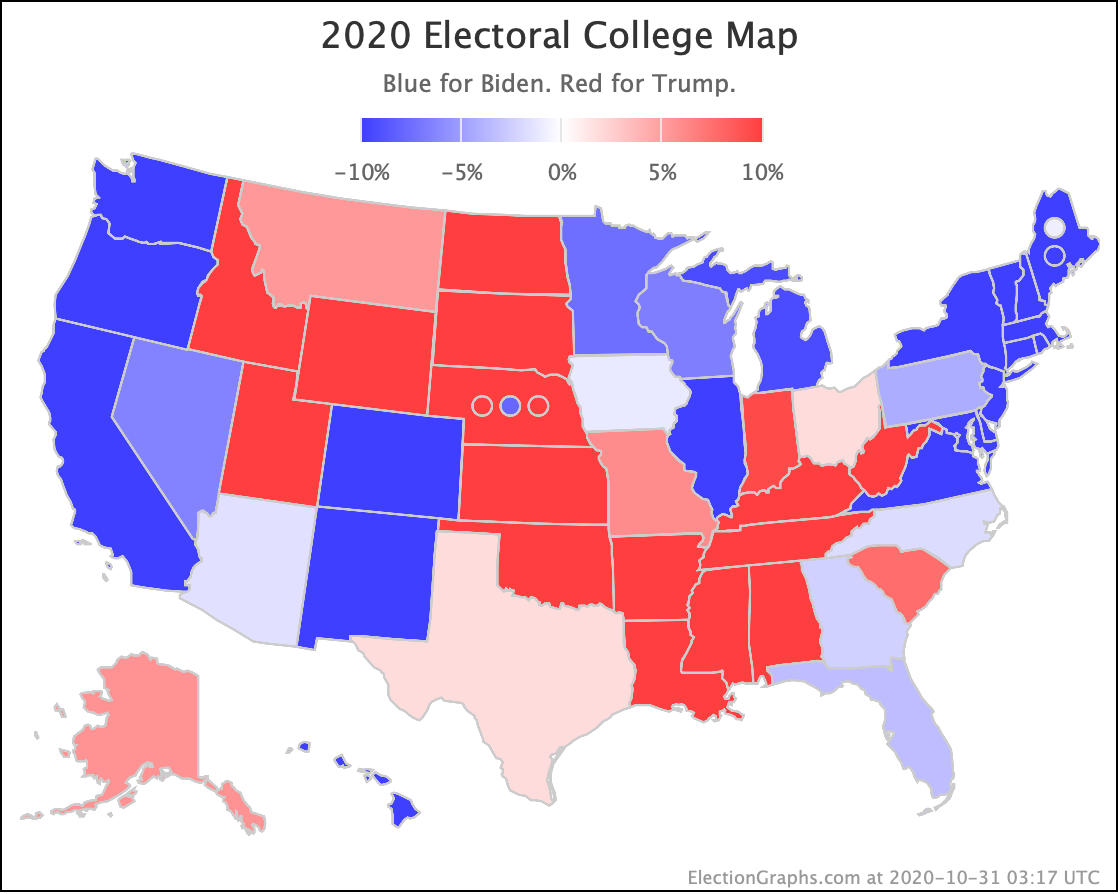
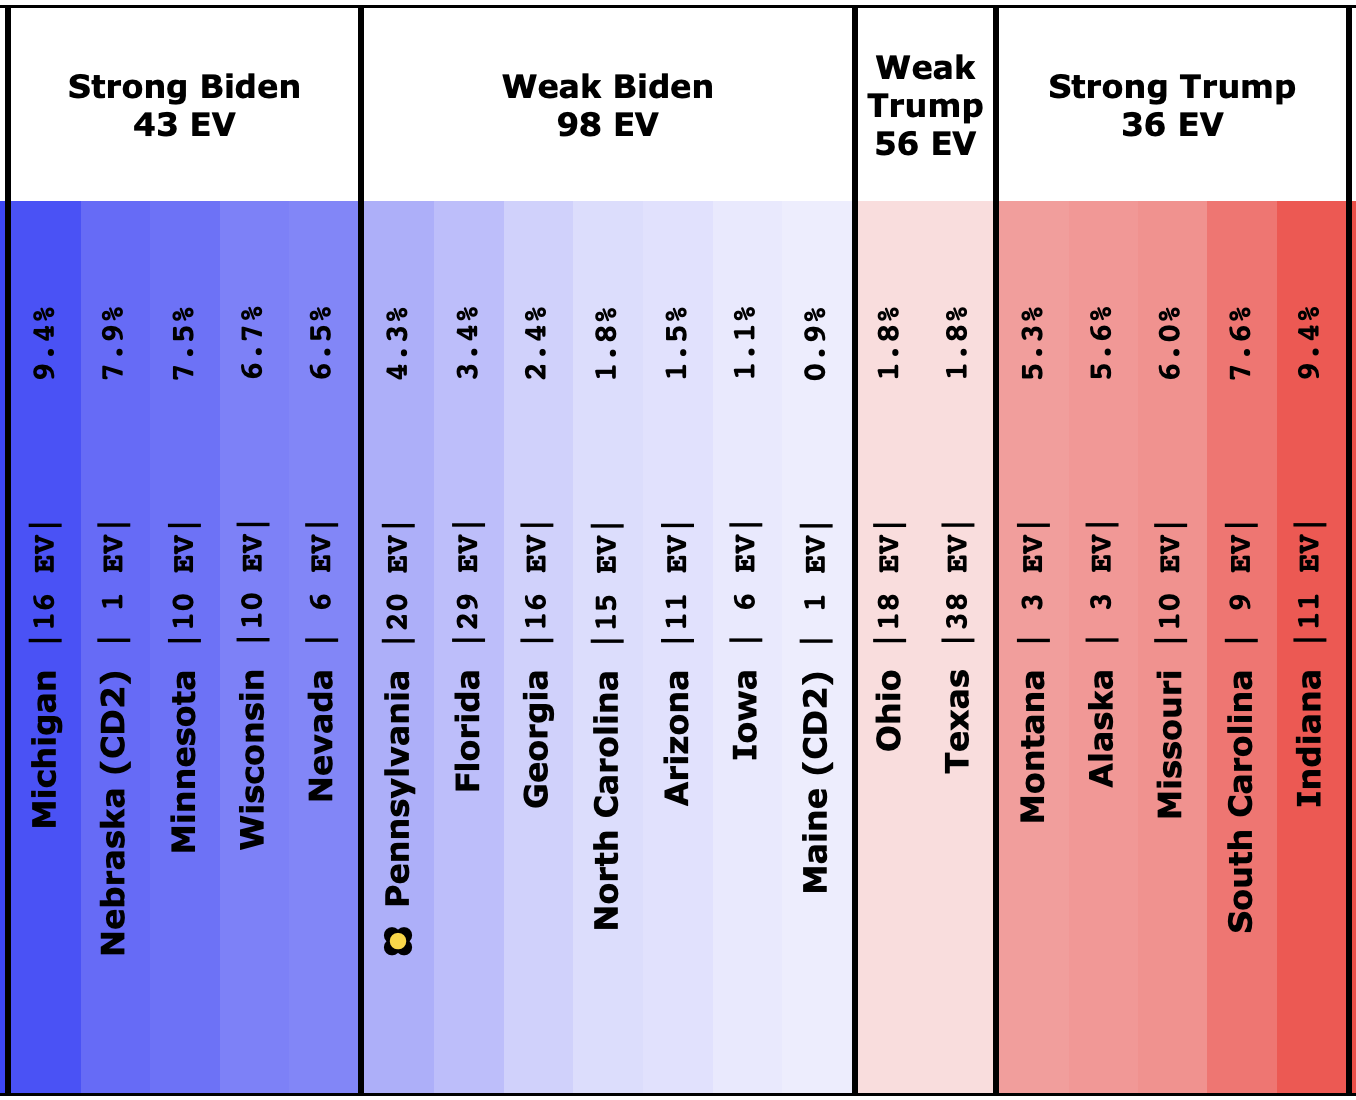
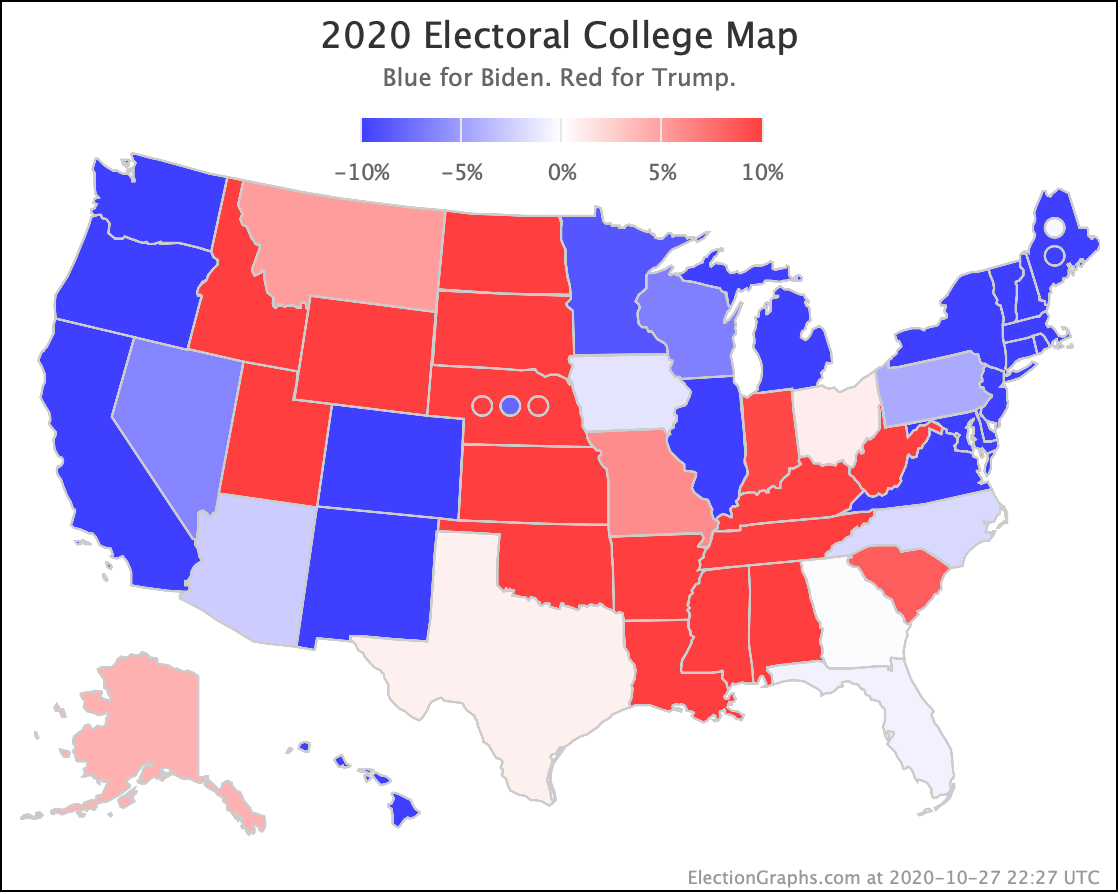
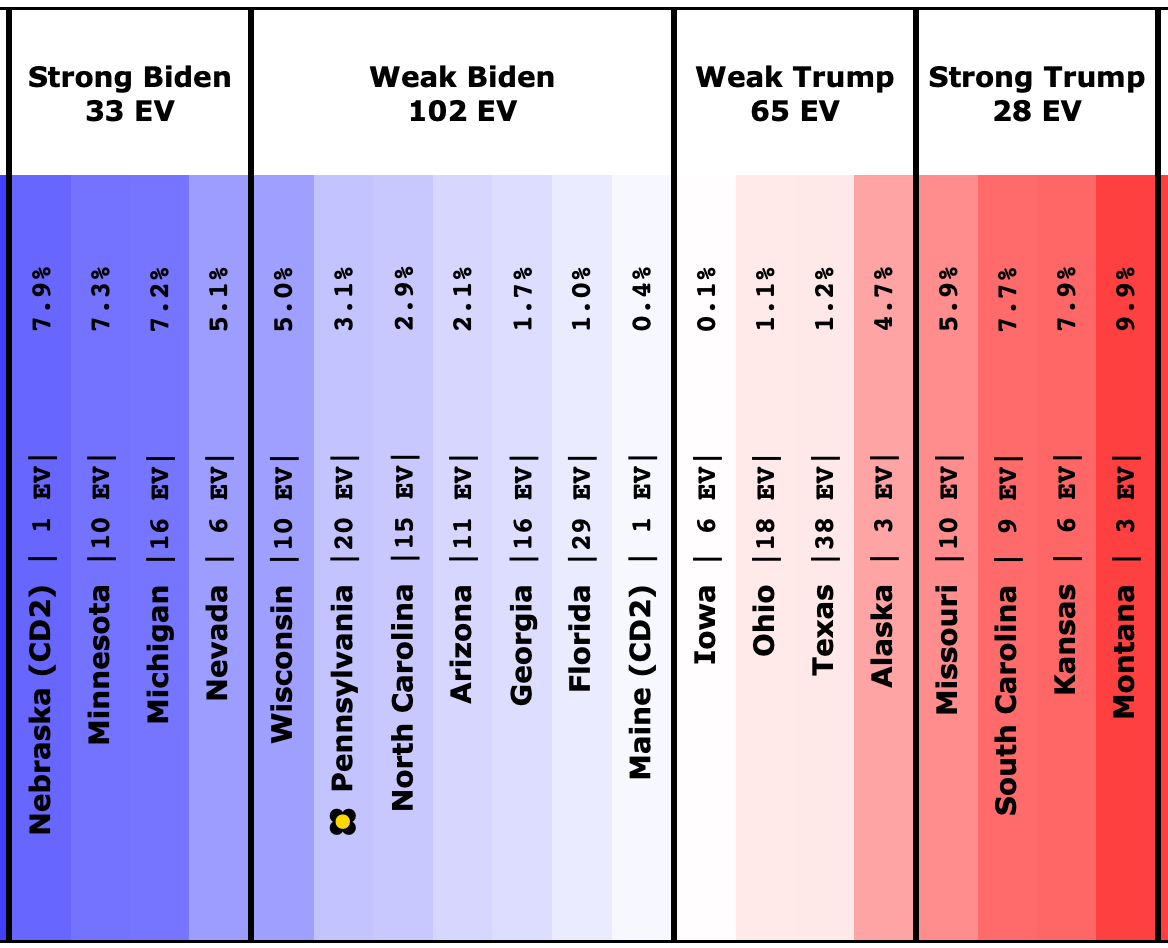
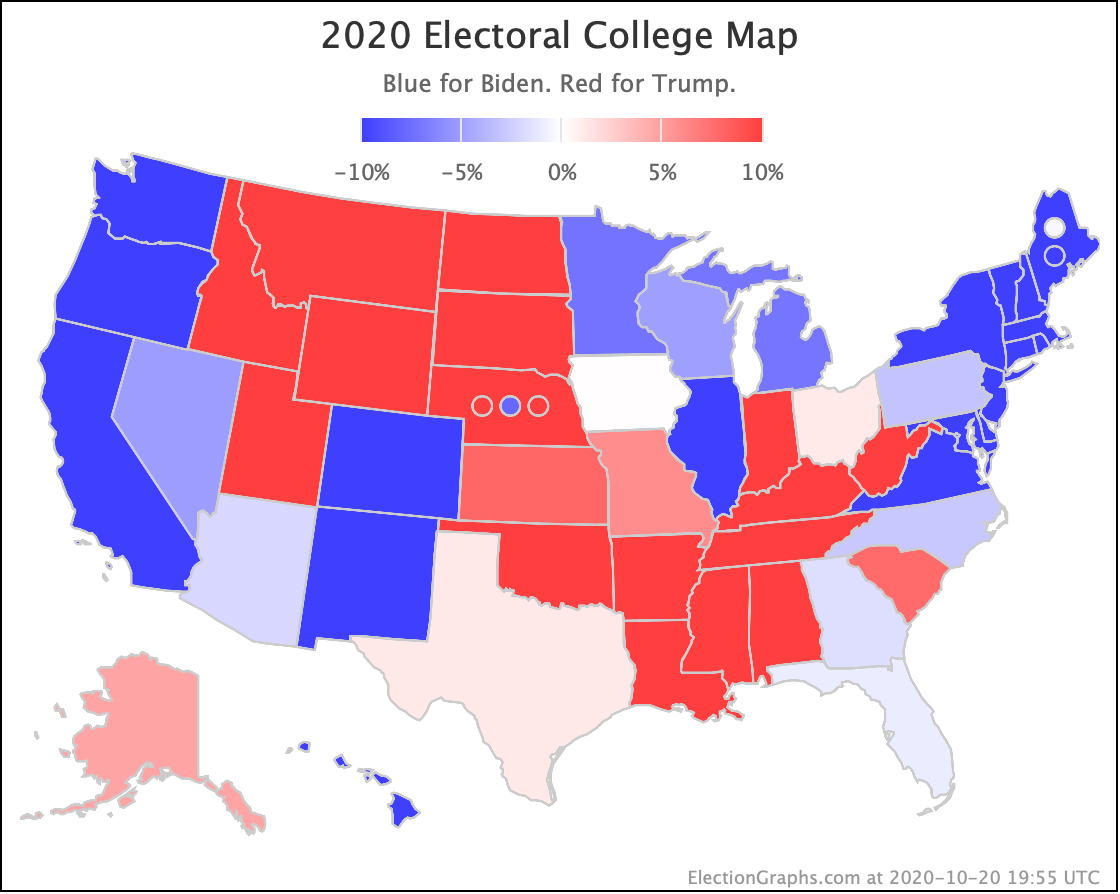
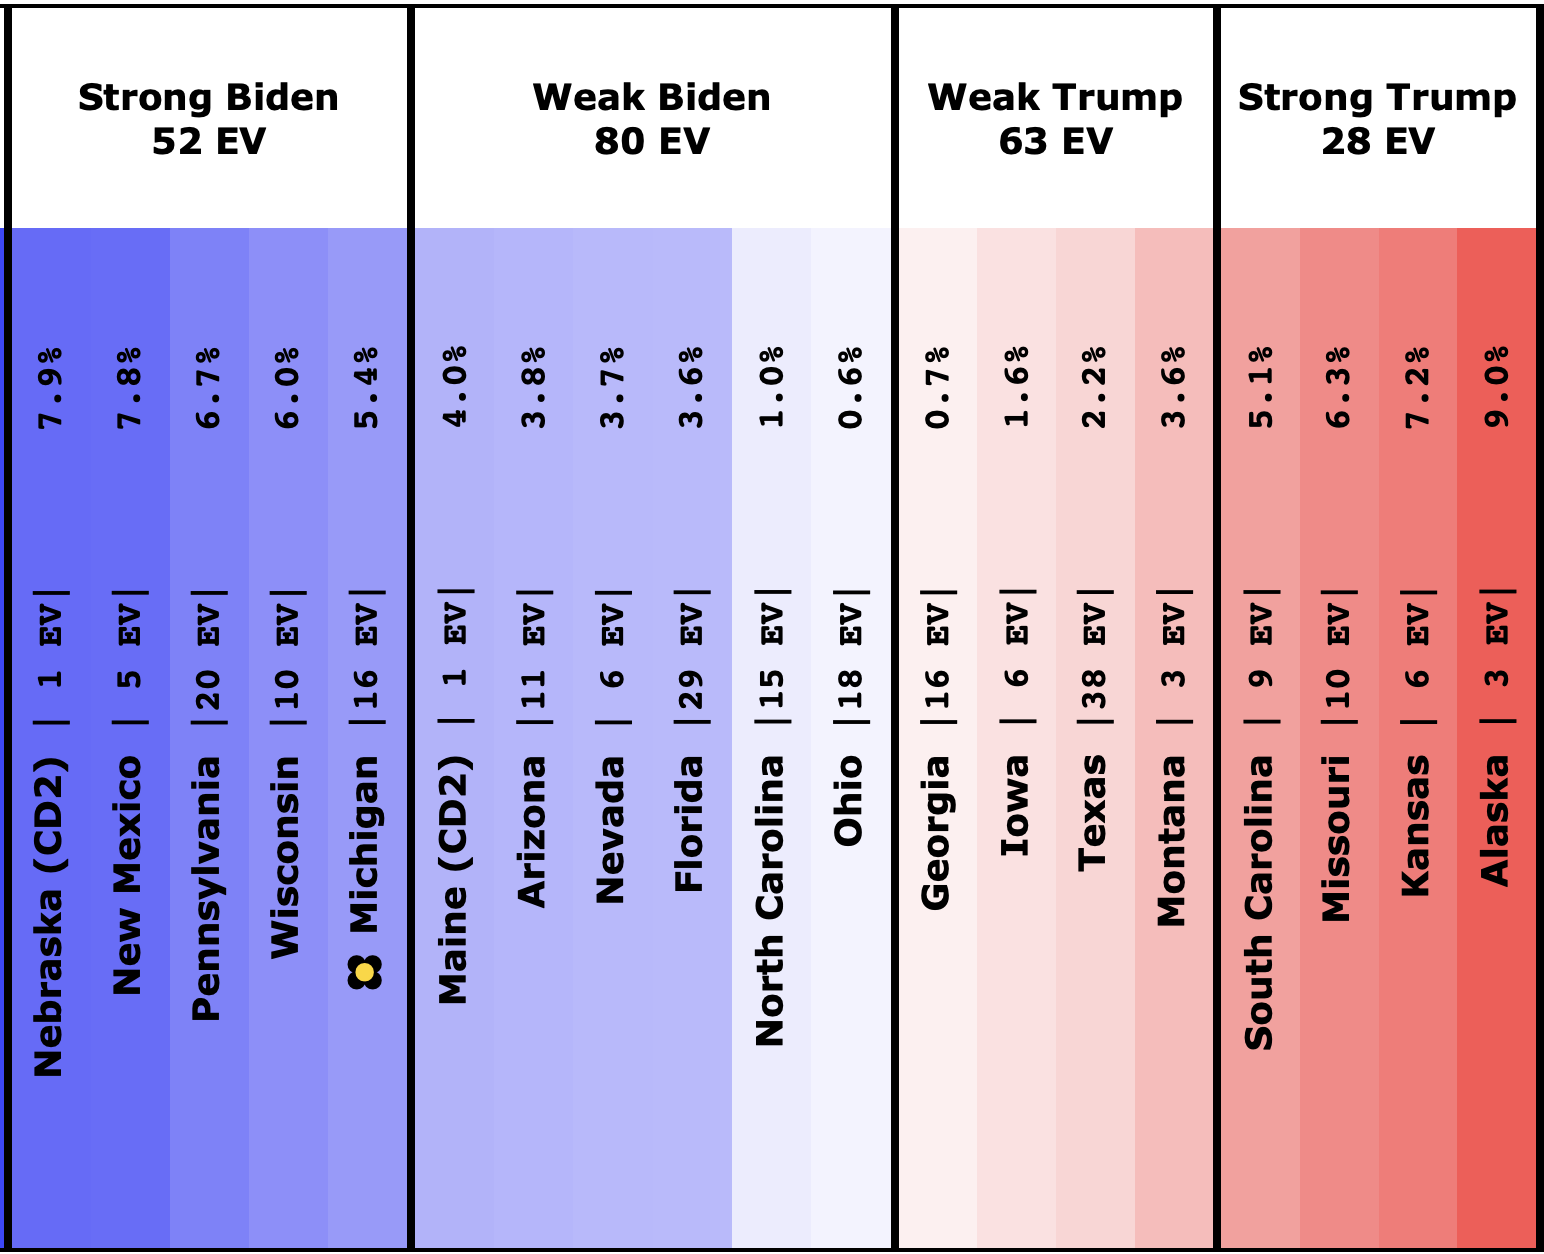
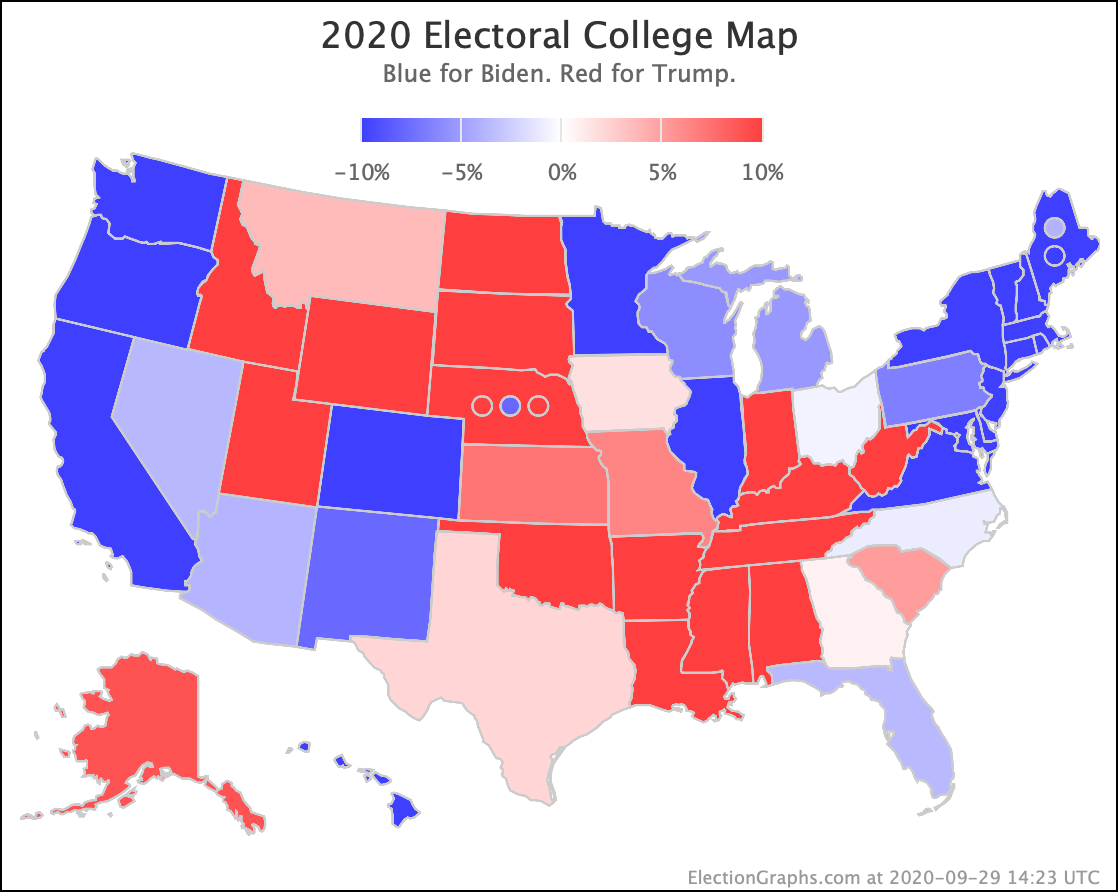
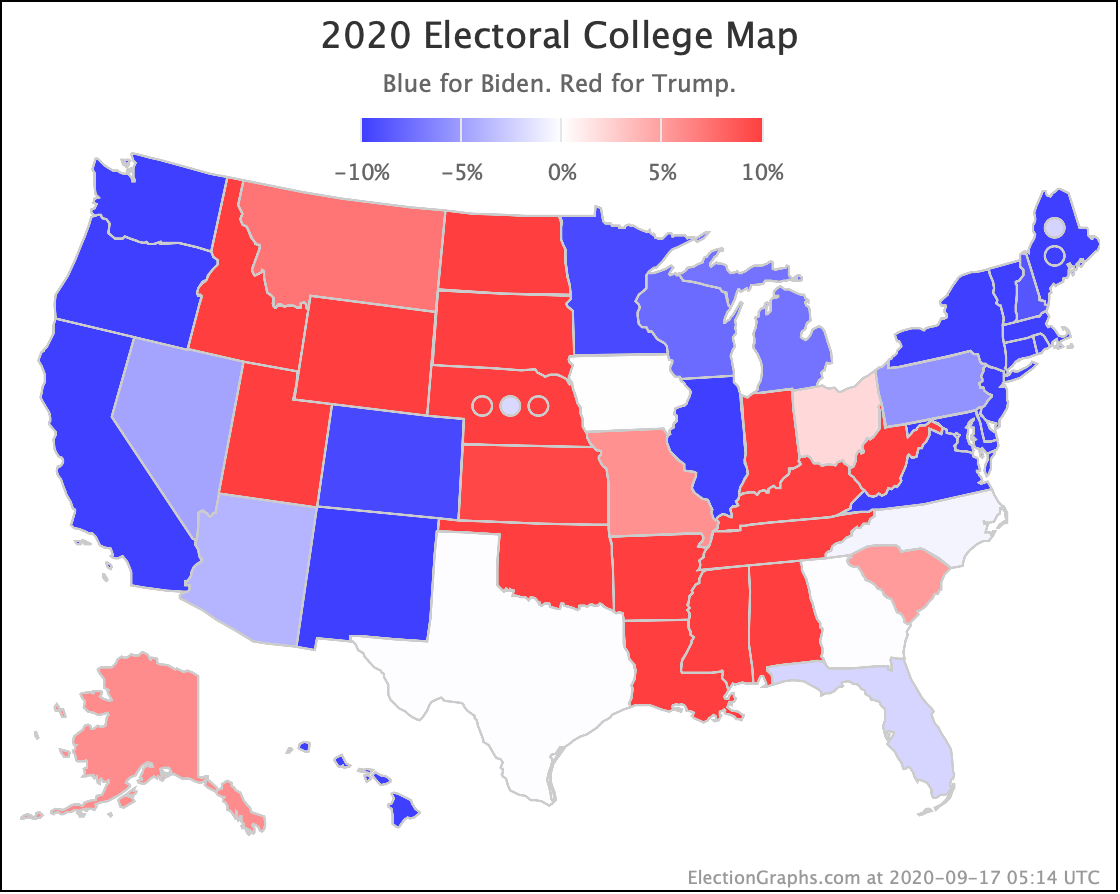
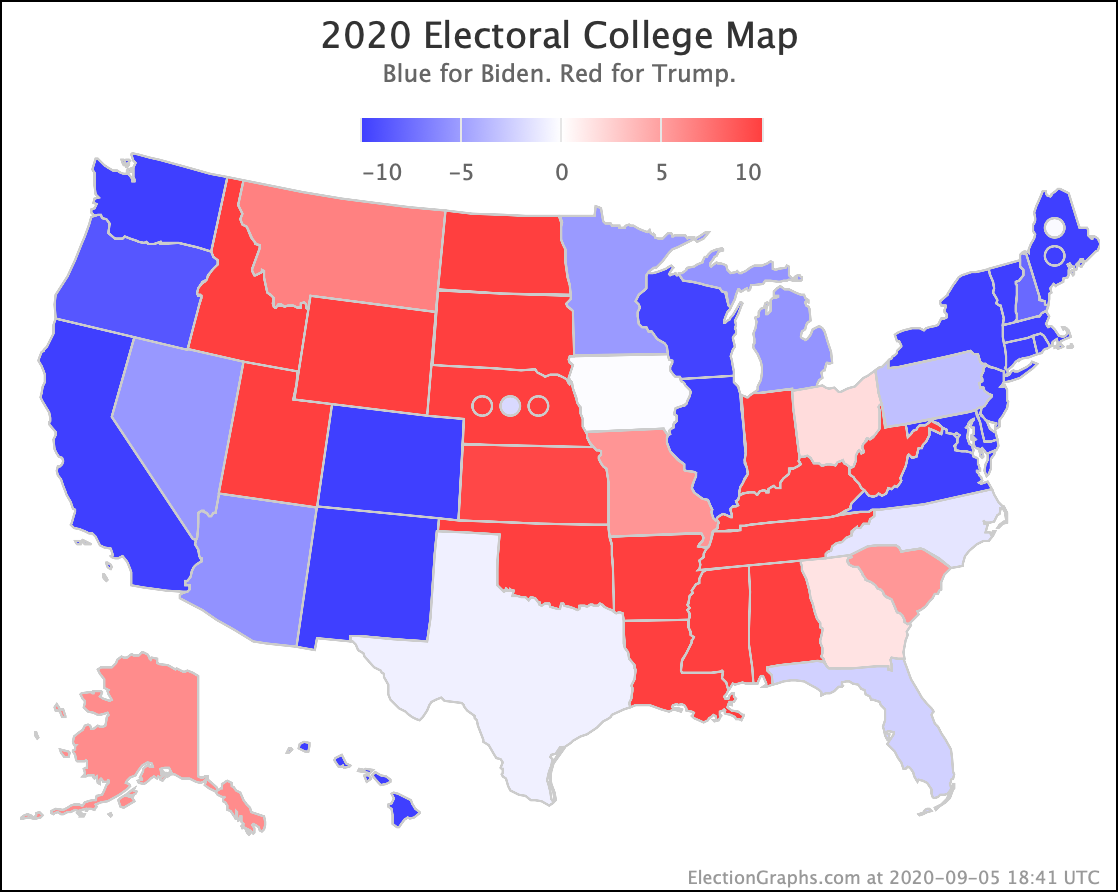
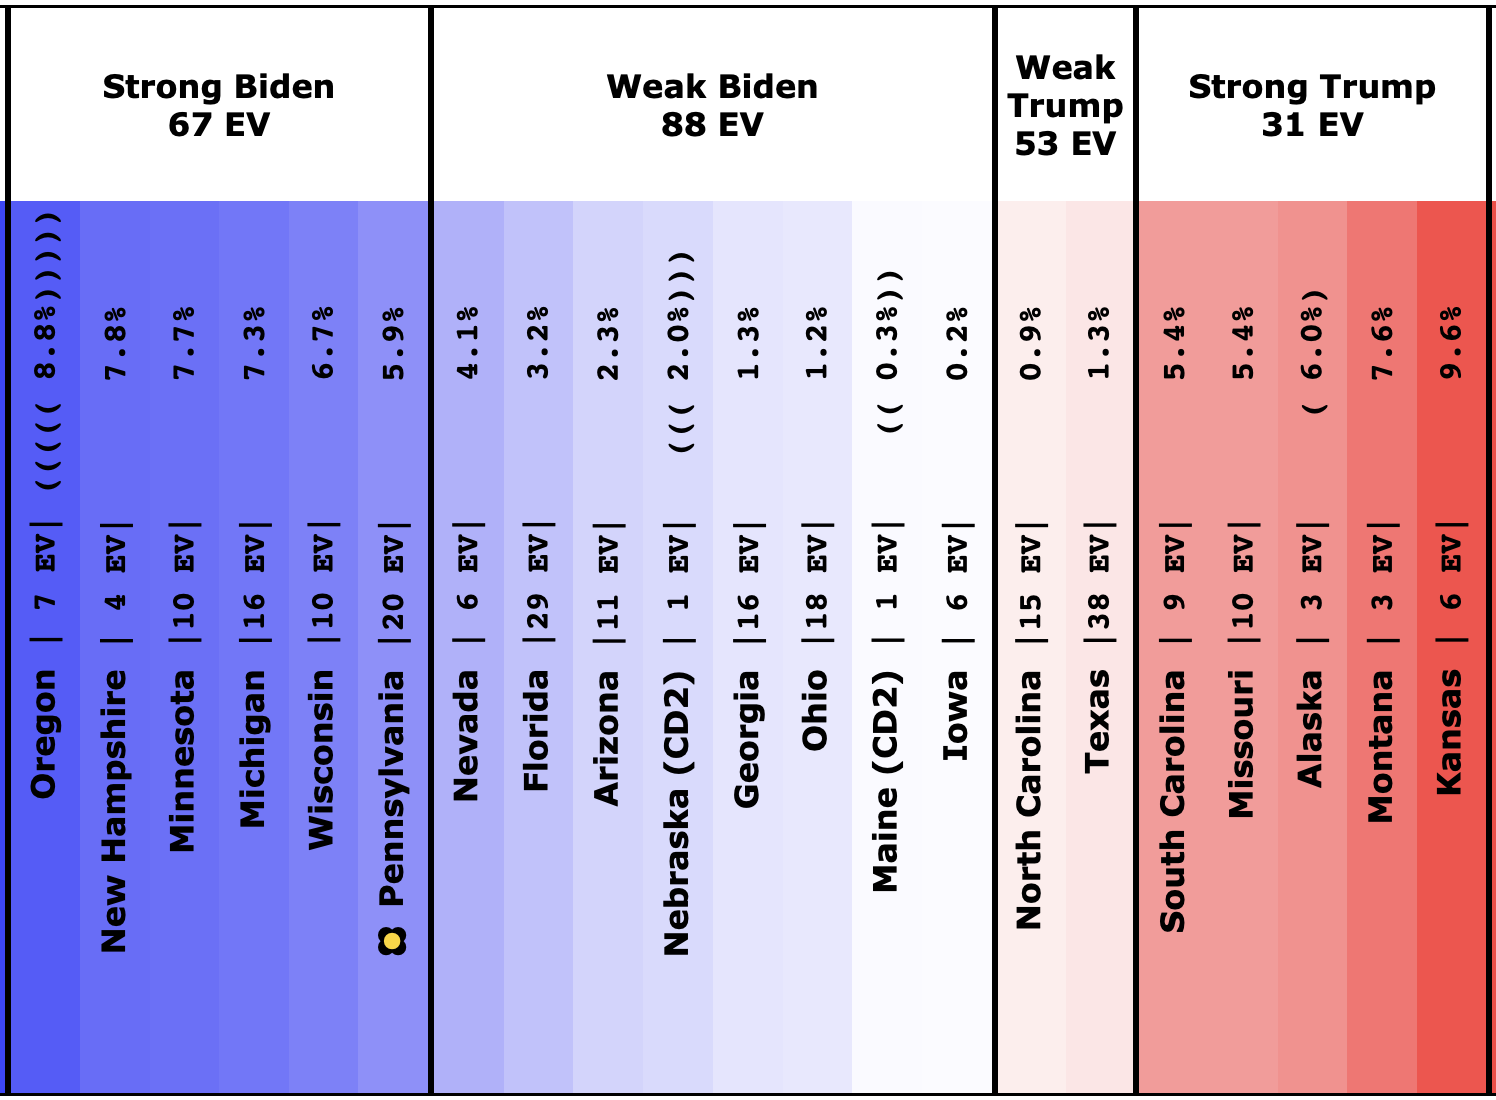
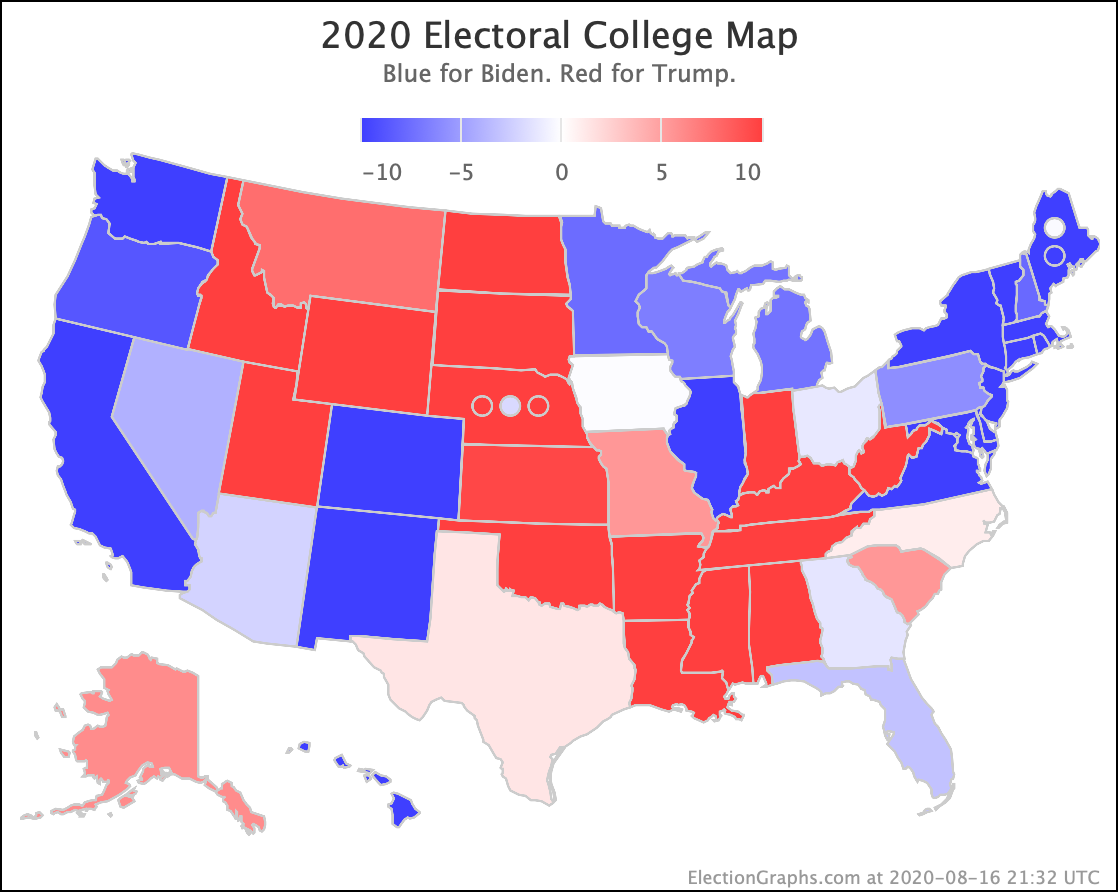
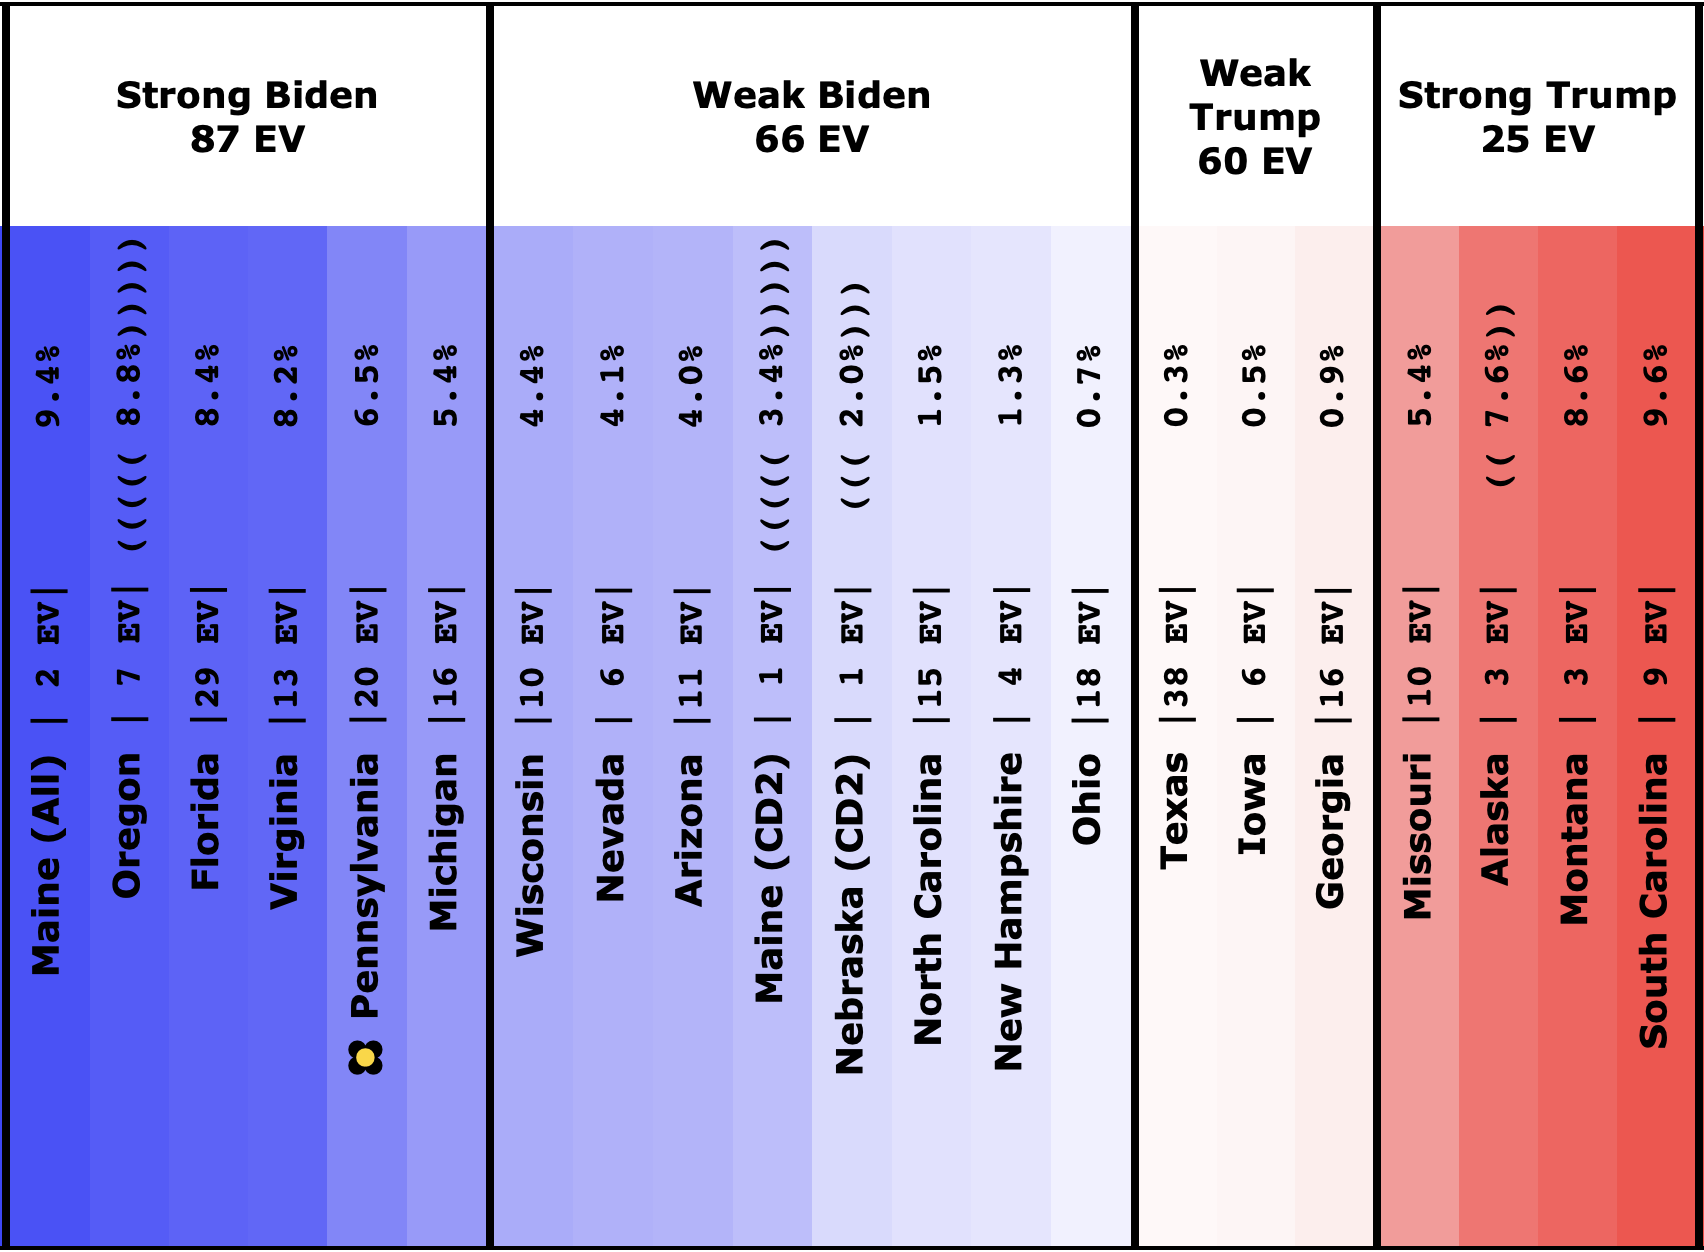
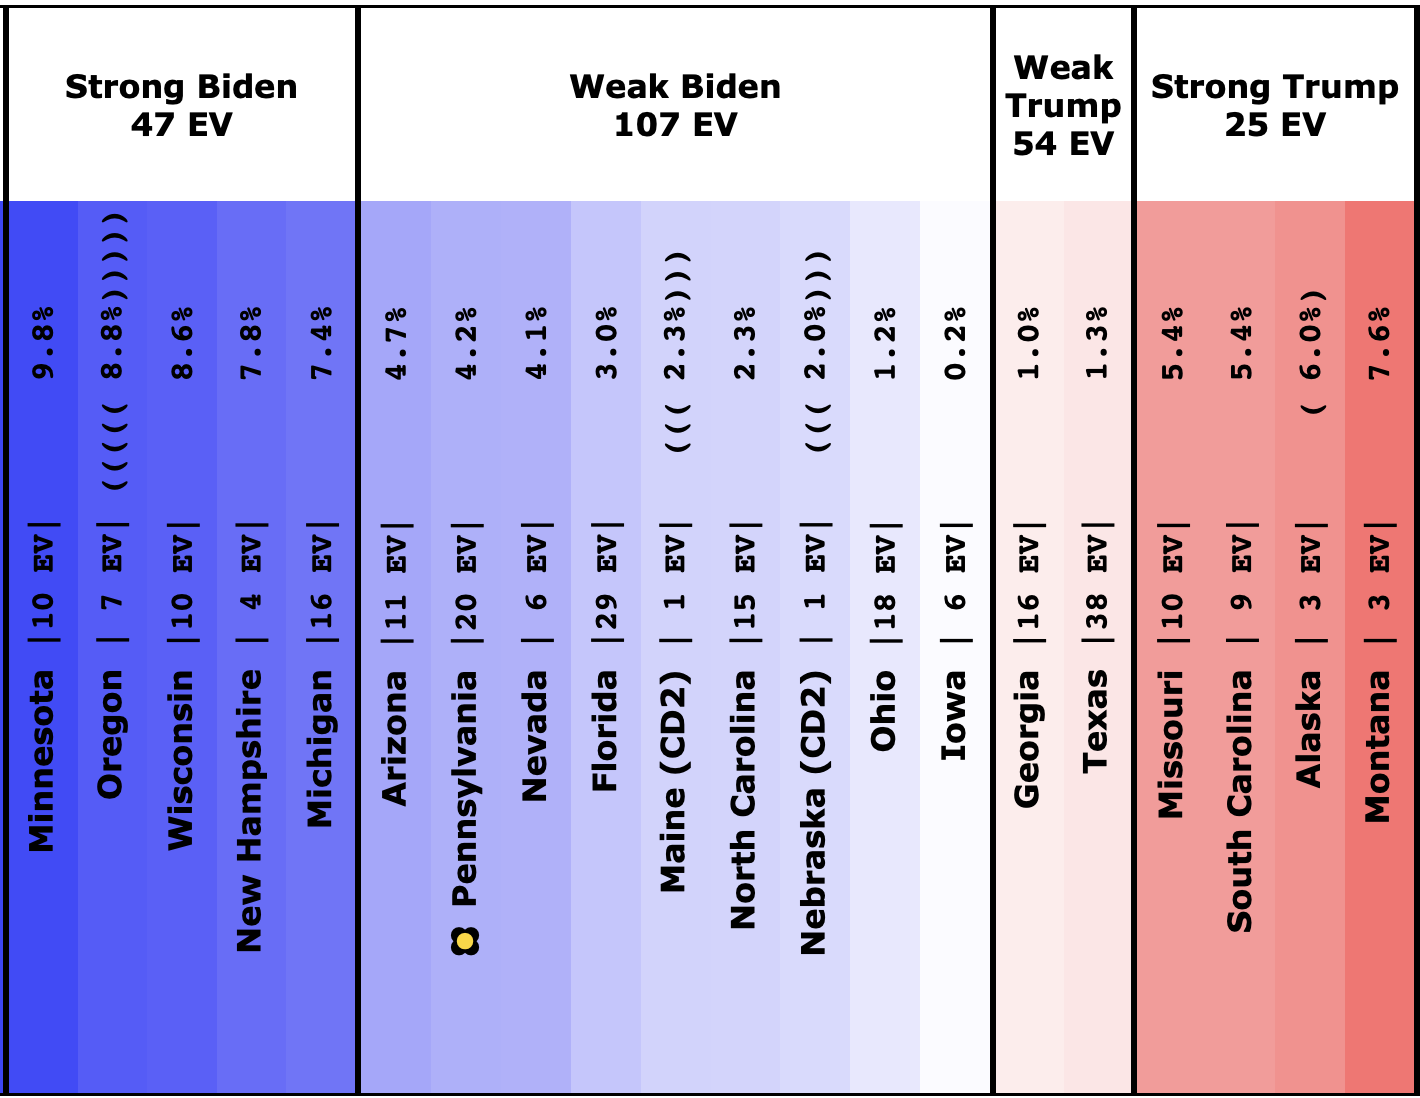
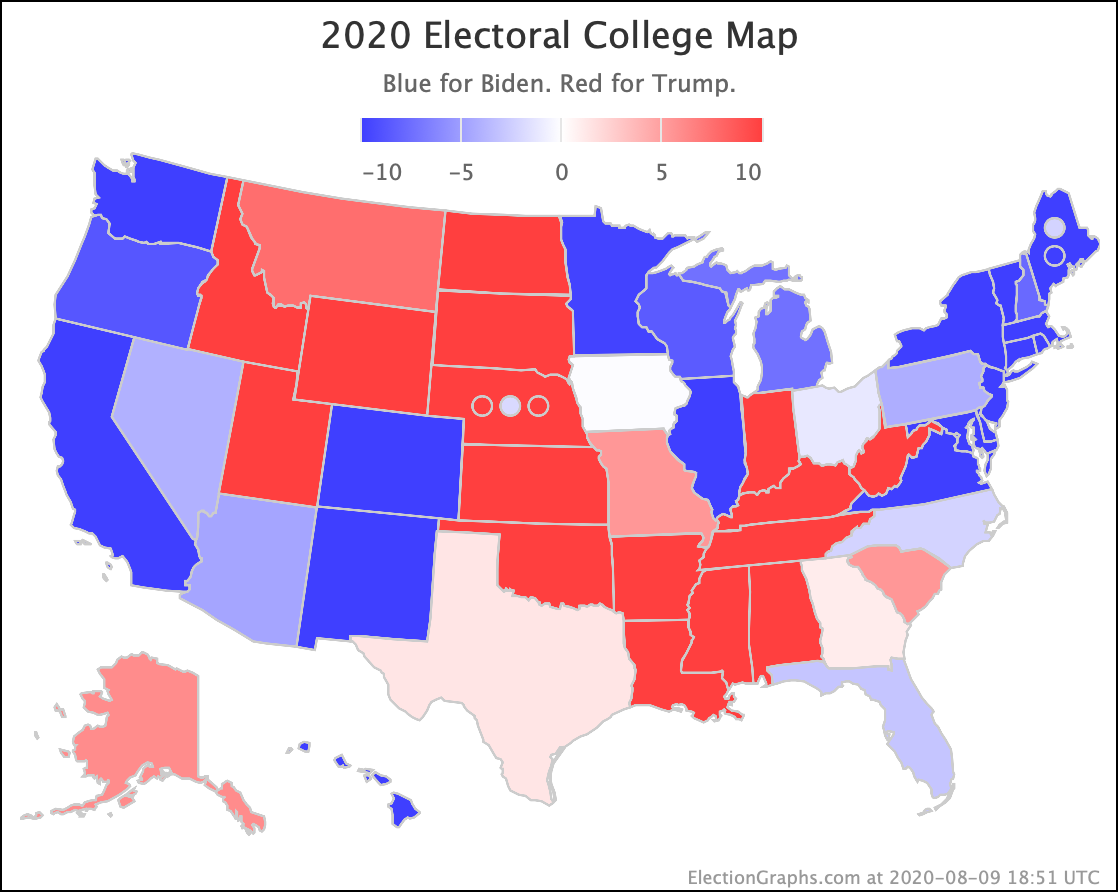
OK. Time for the map and spectrum:
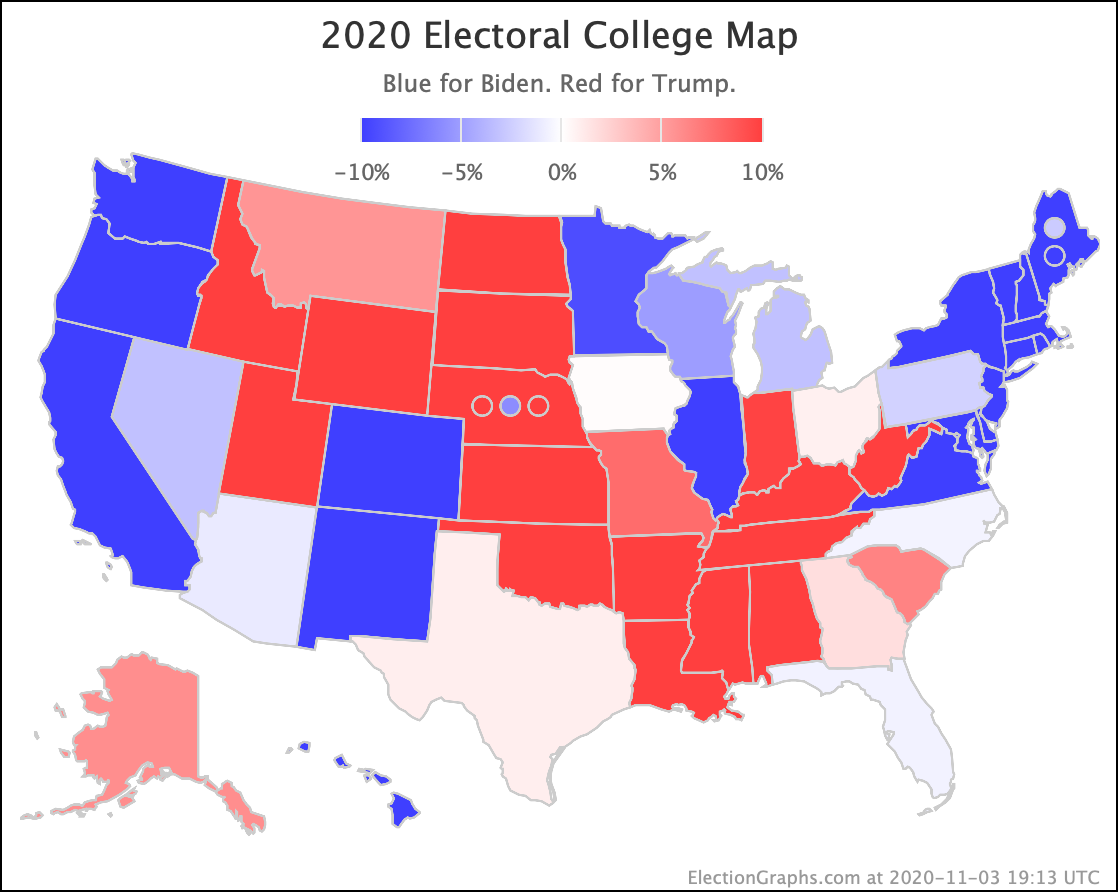
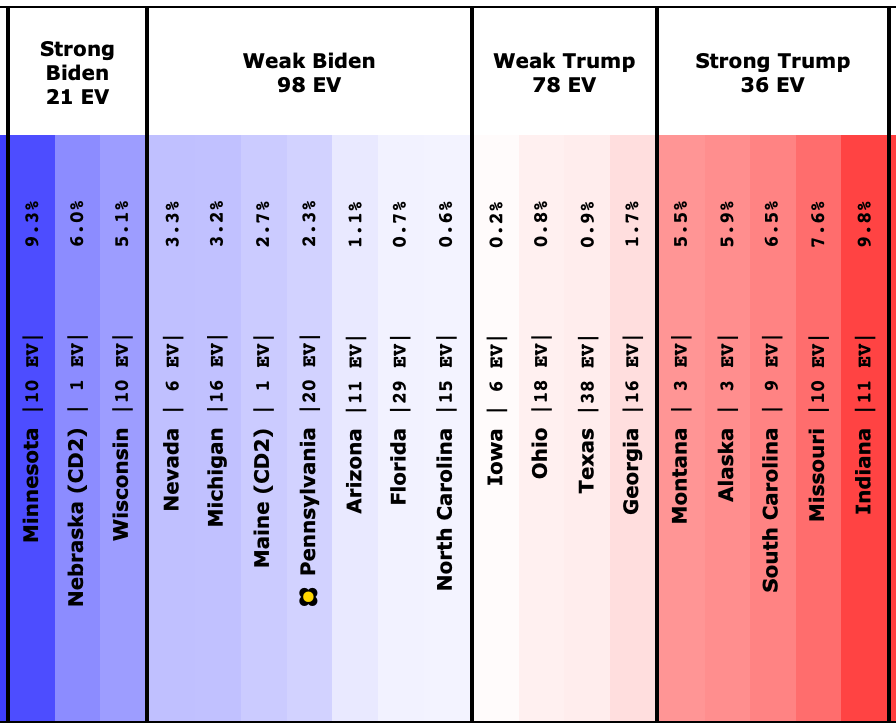
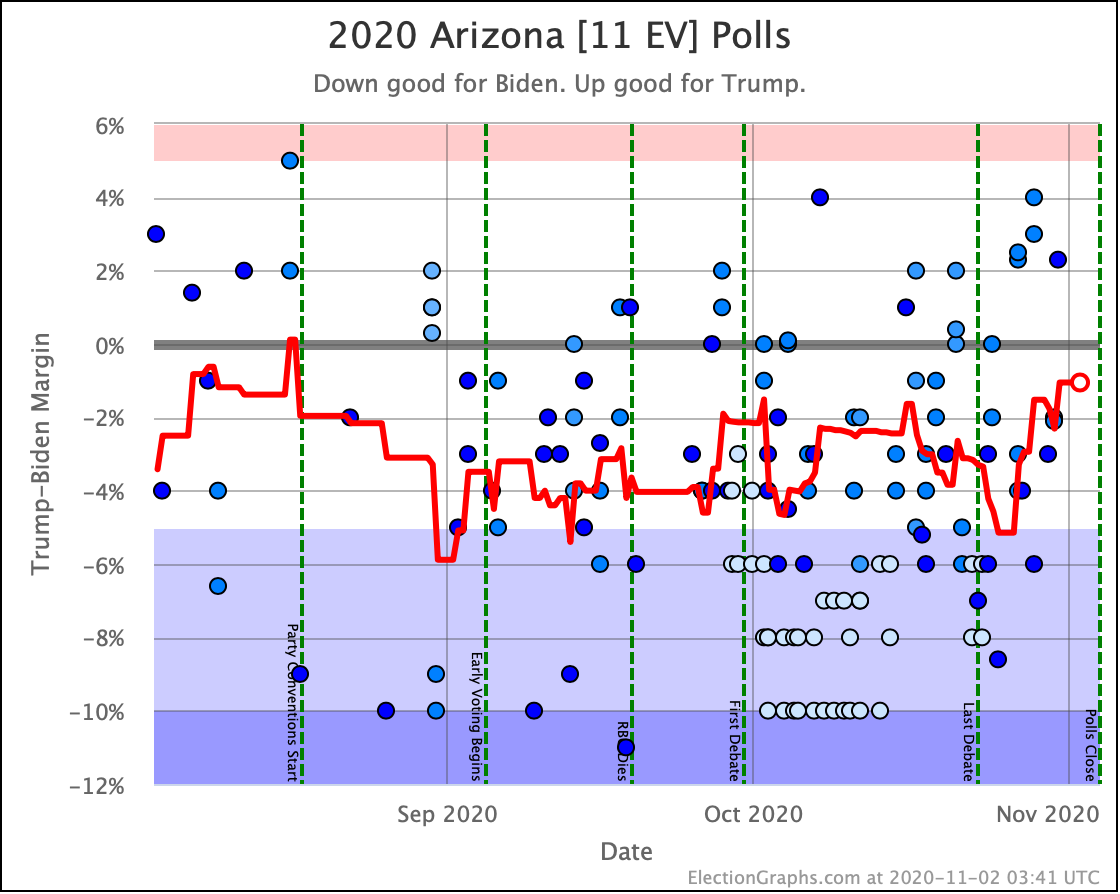
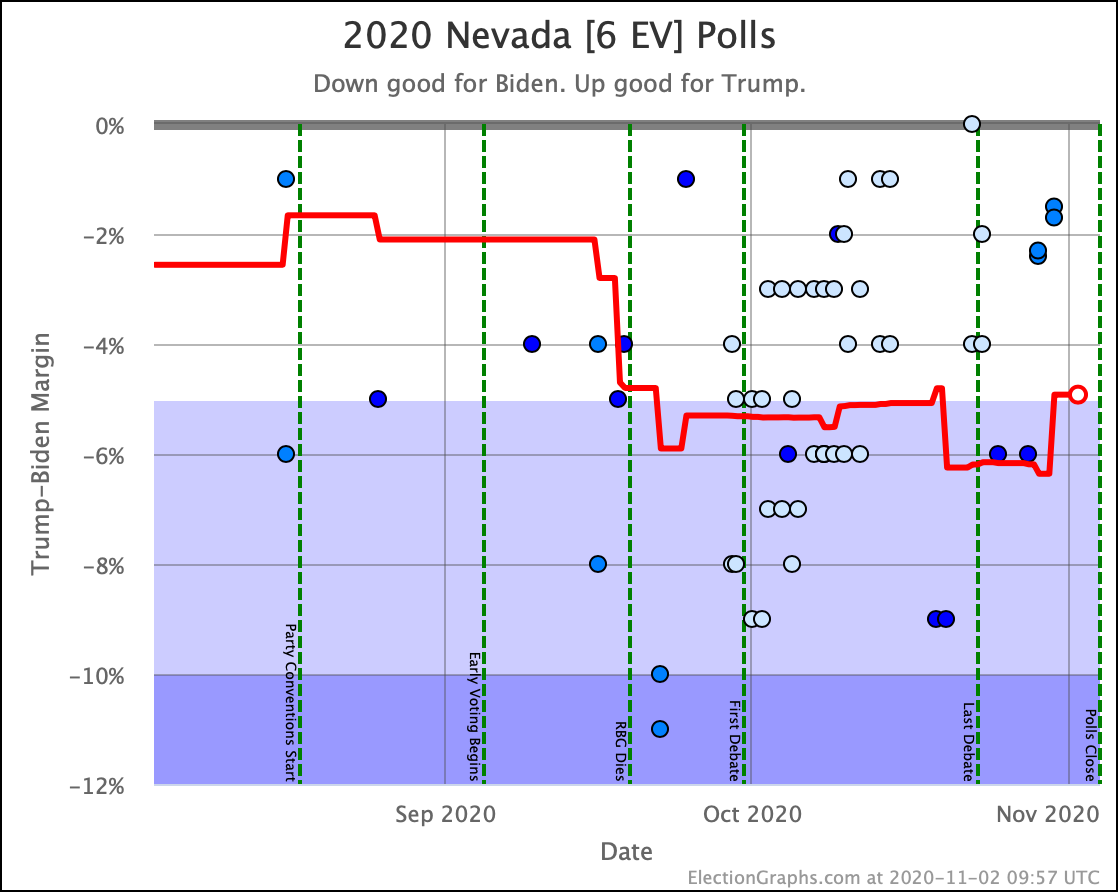
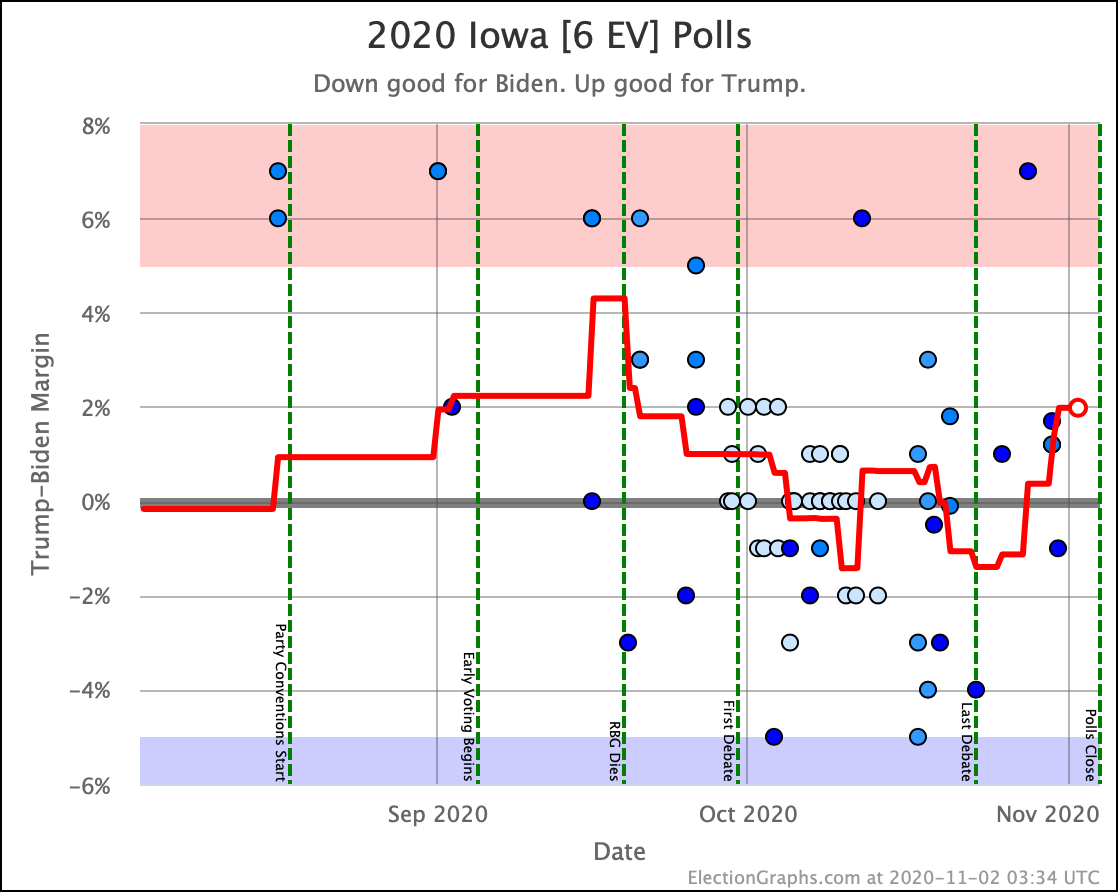
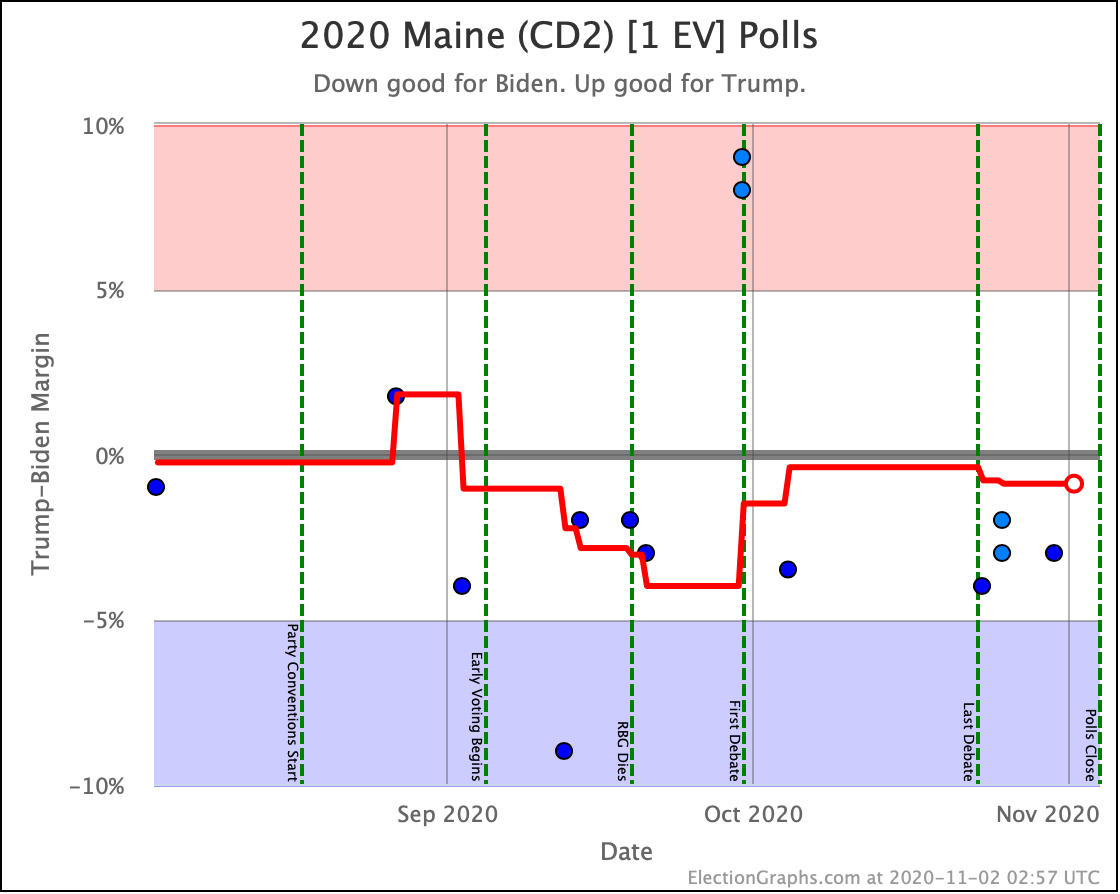
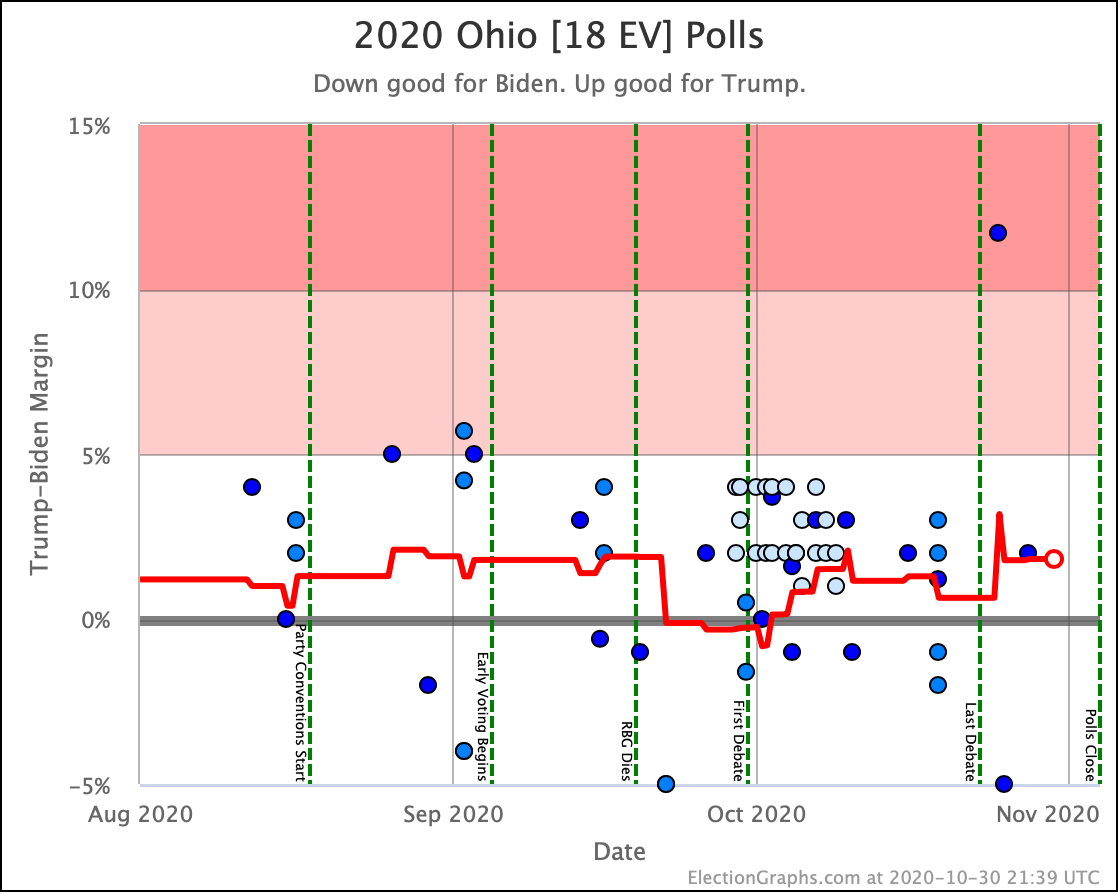
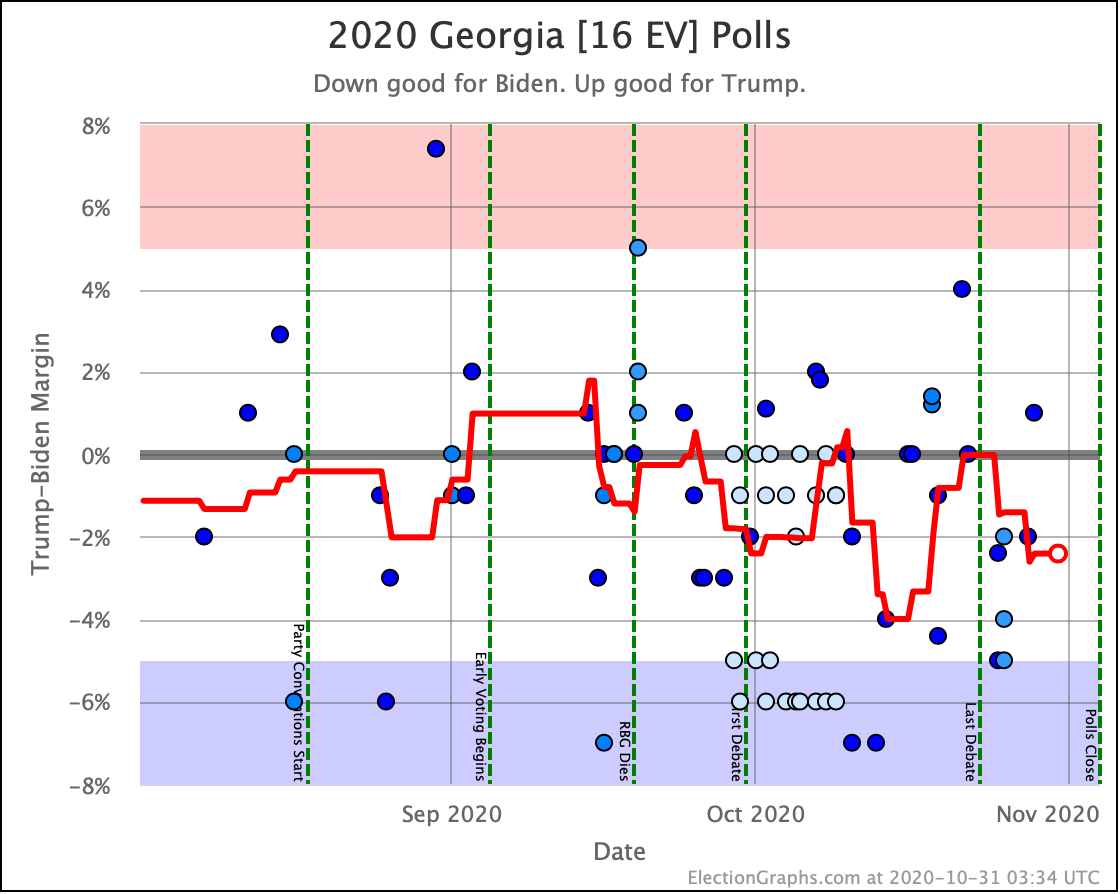
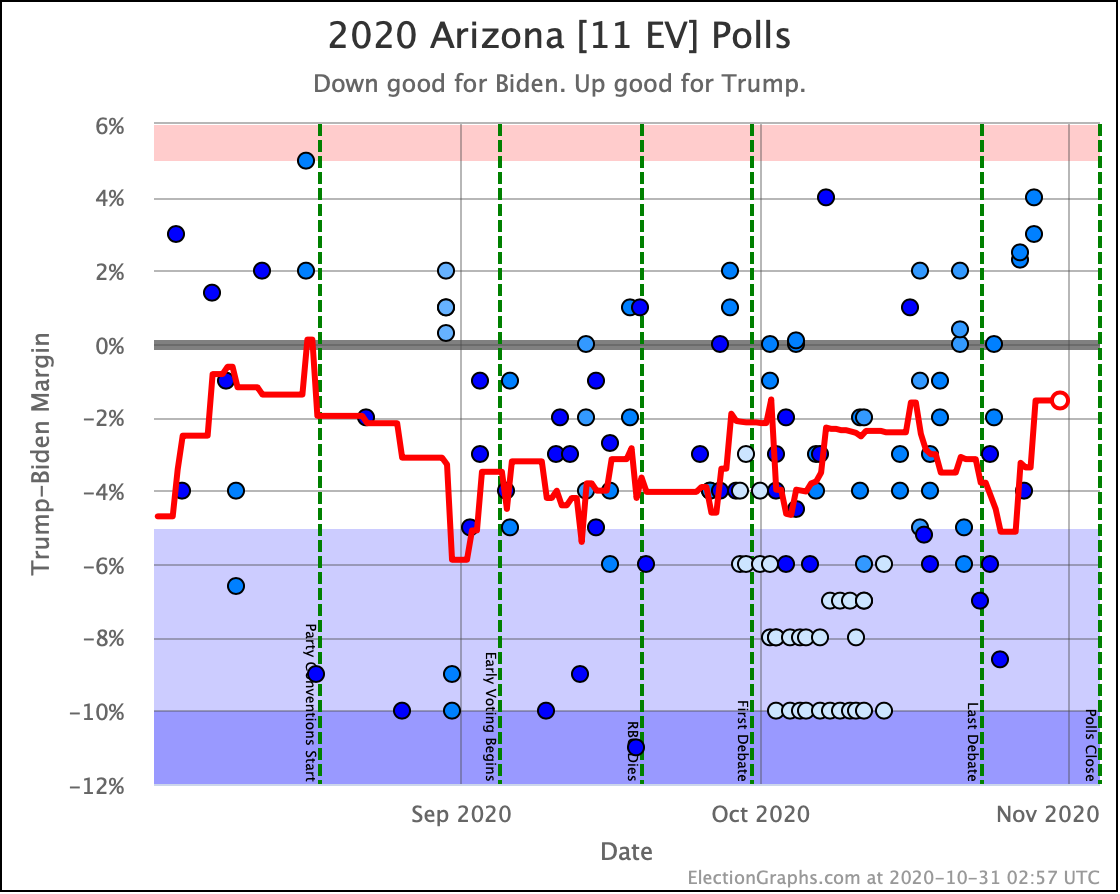
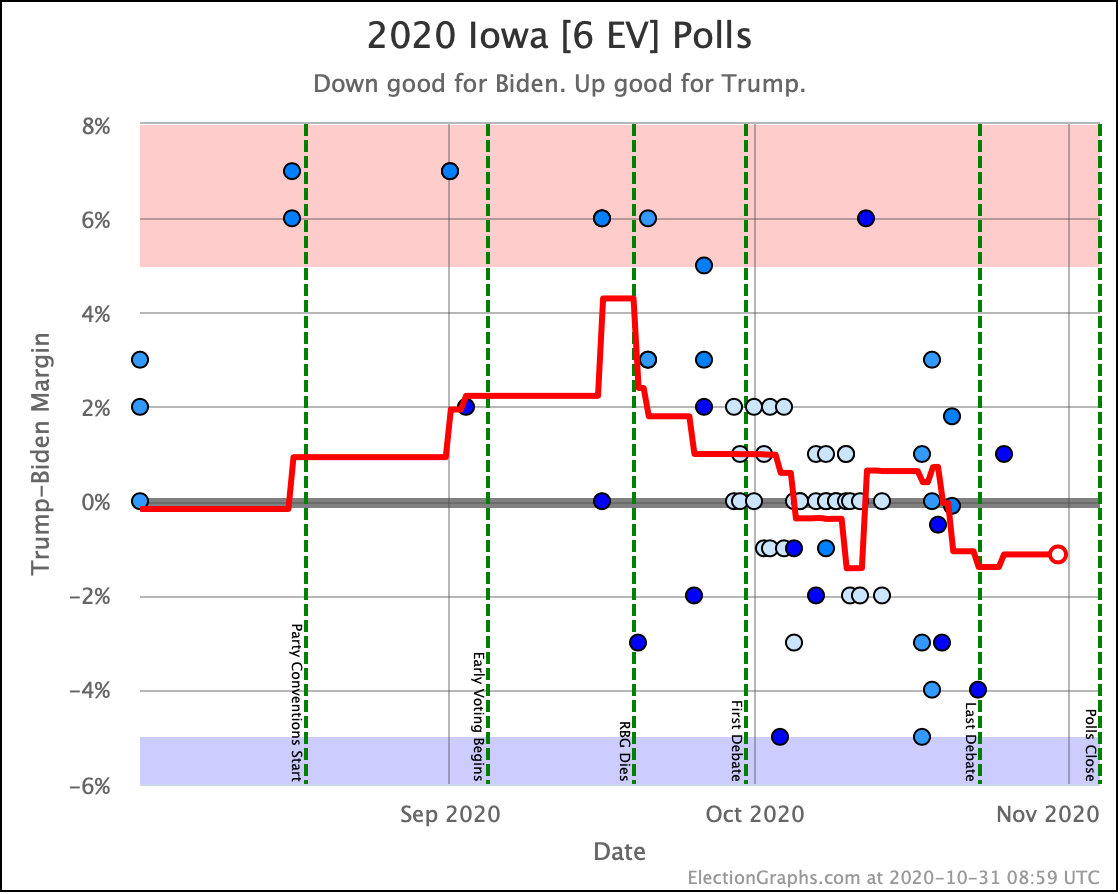
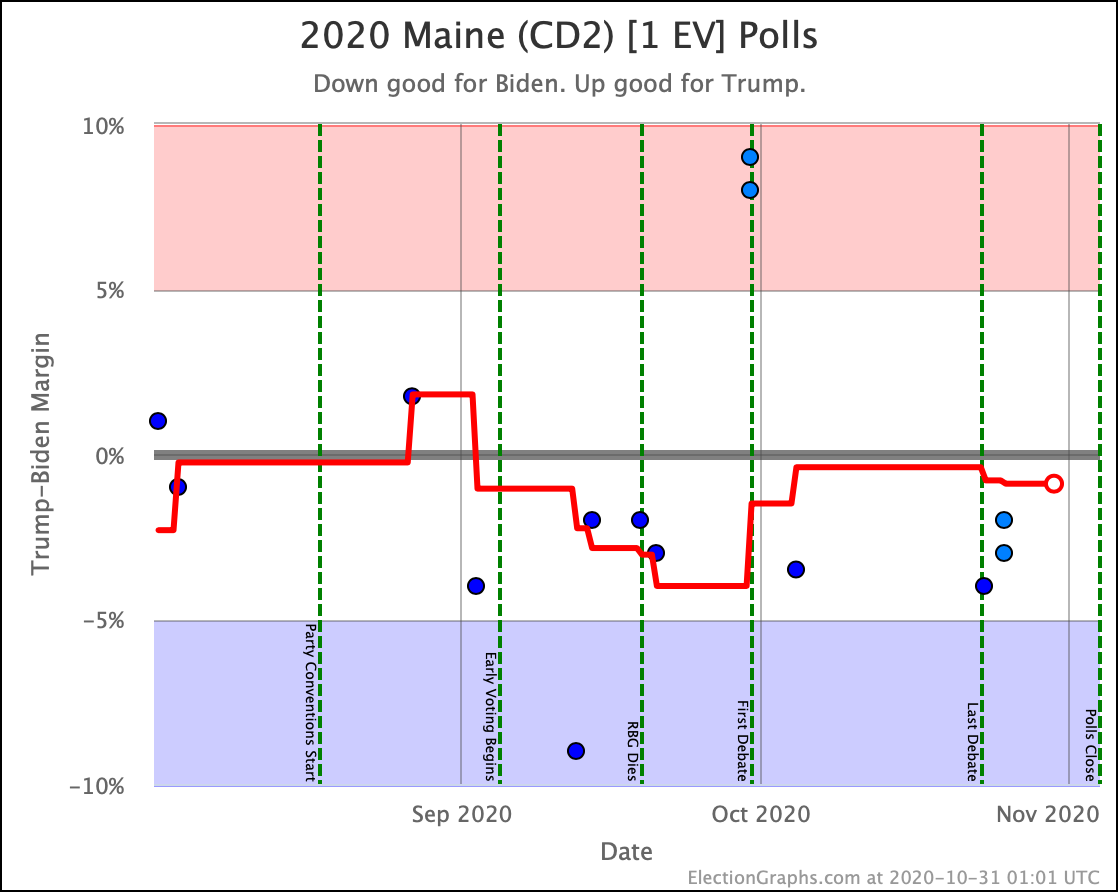
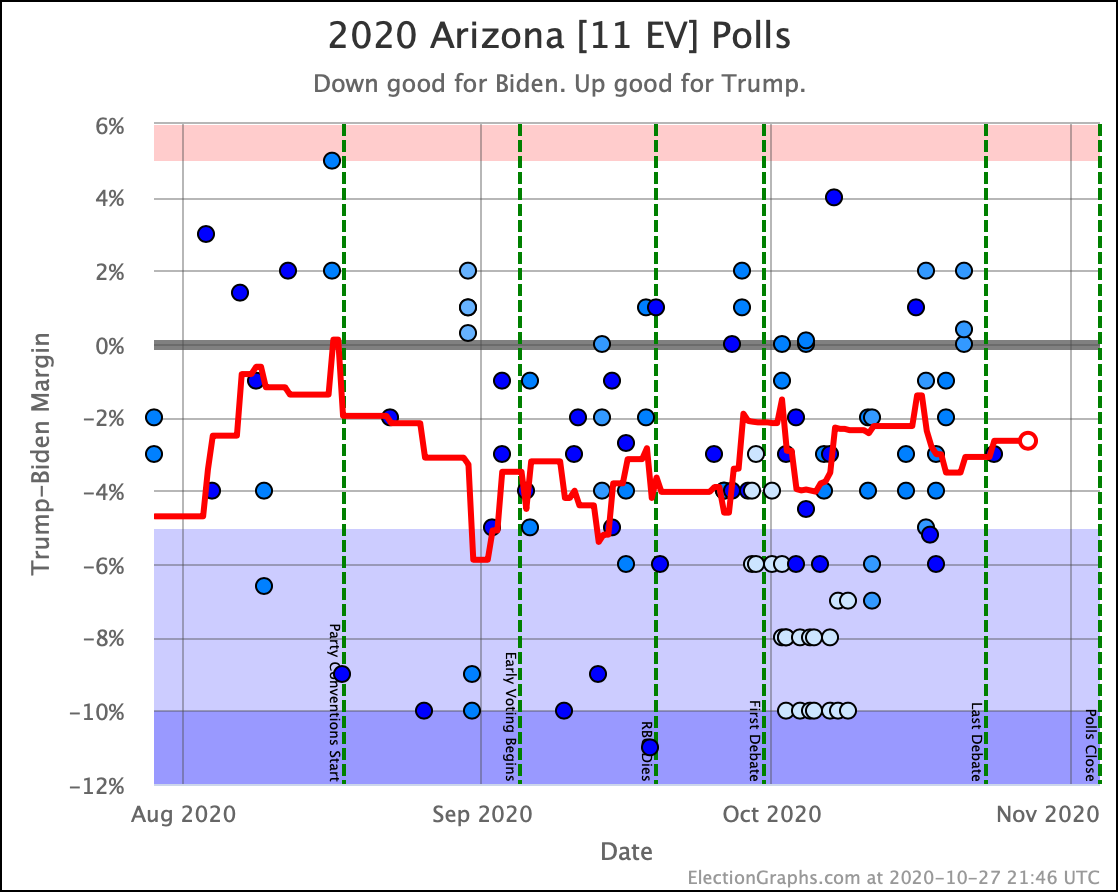
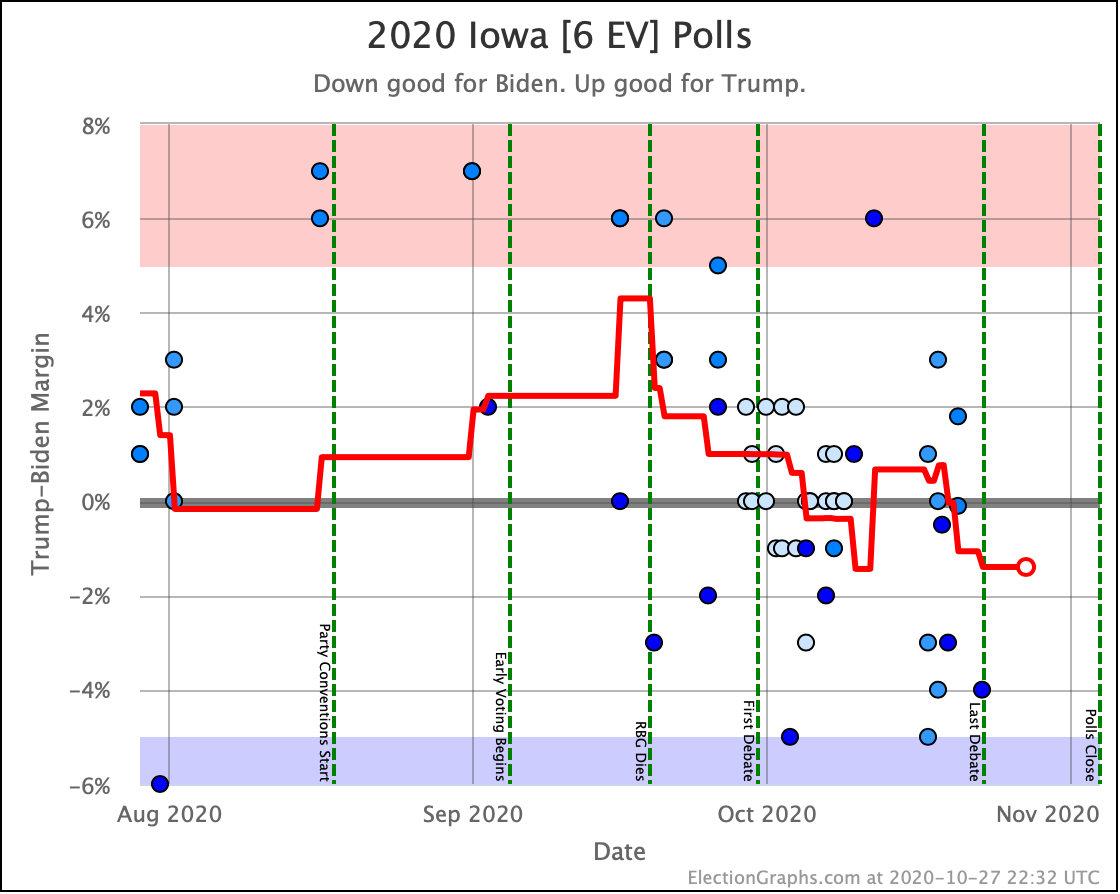
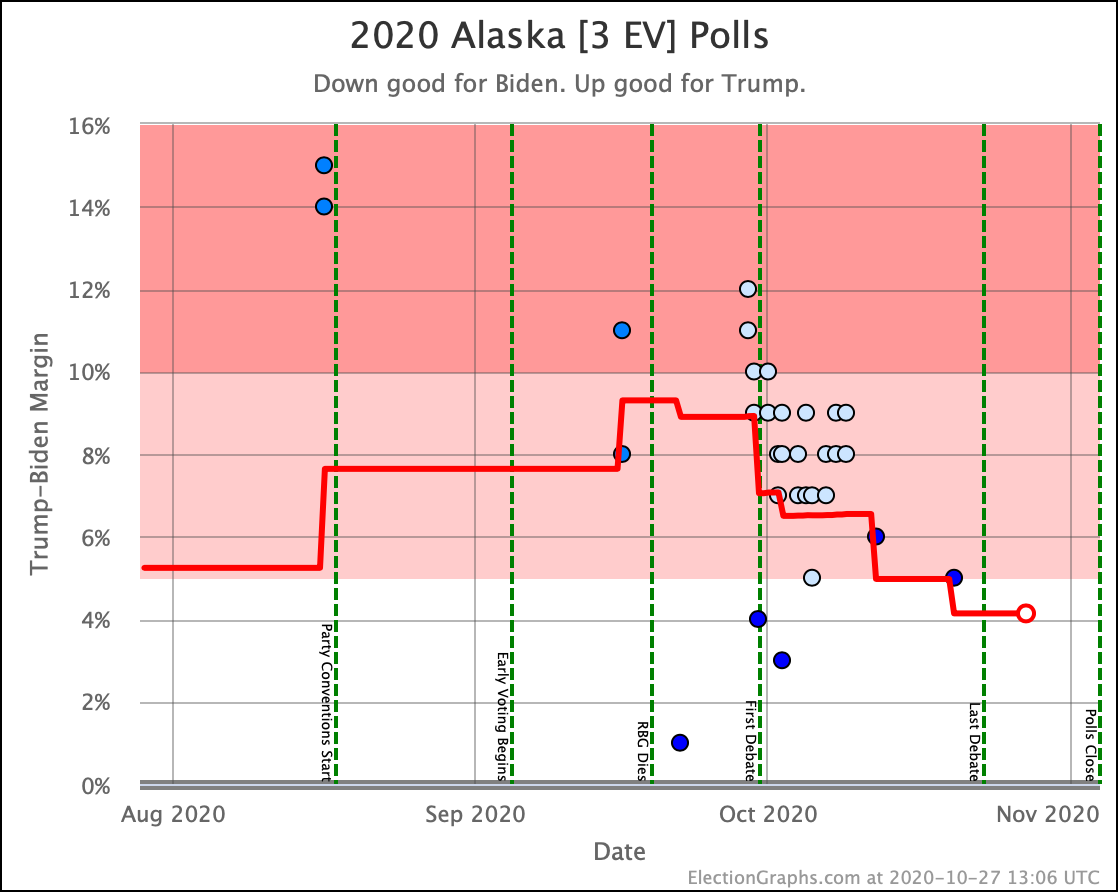
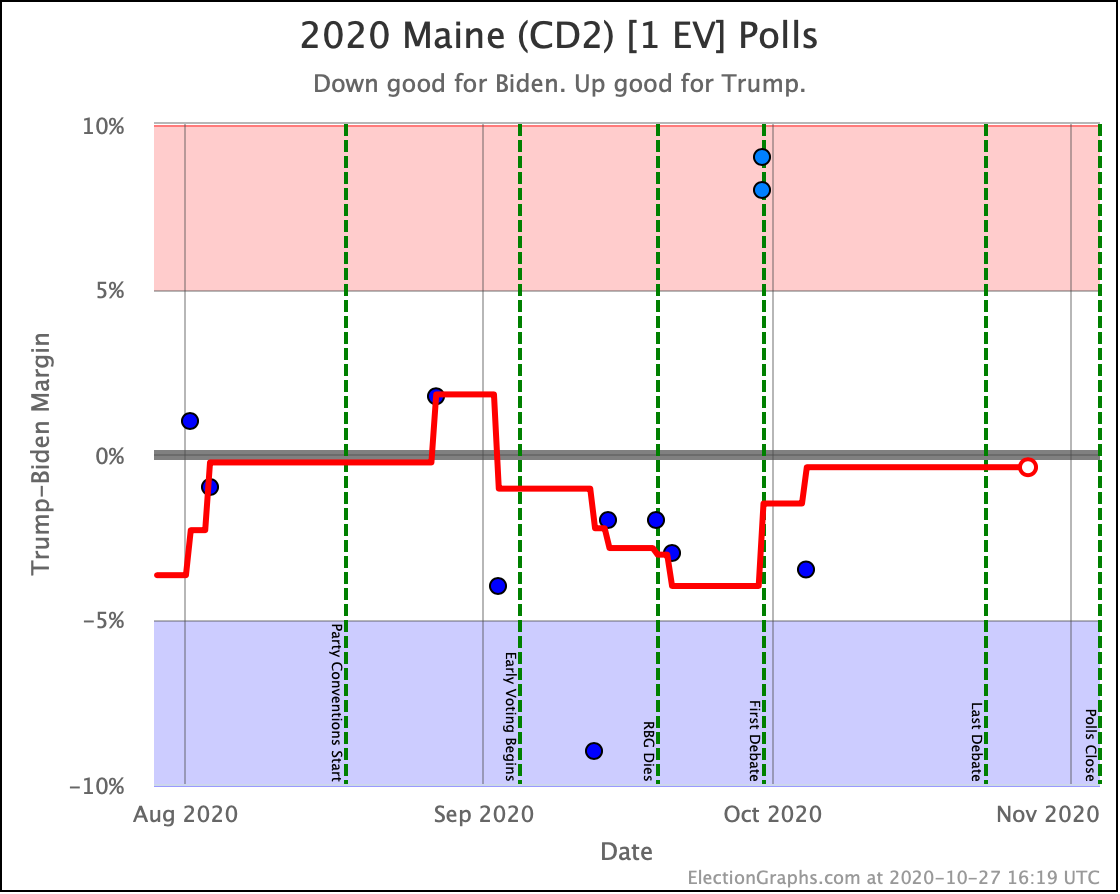
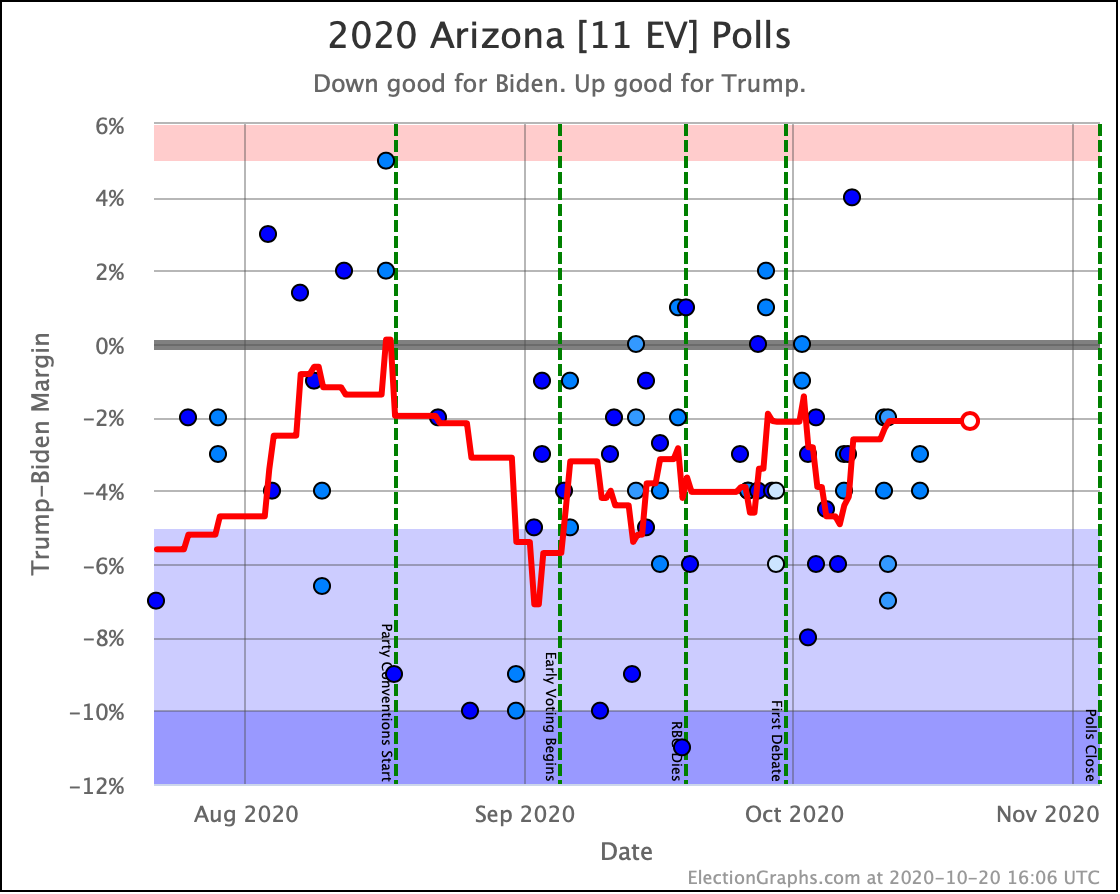
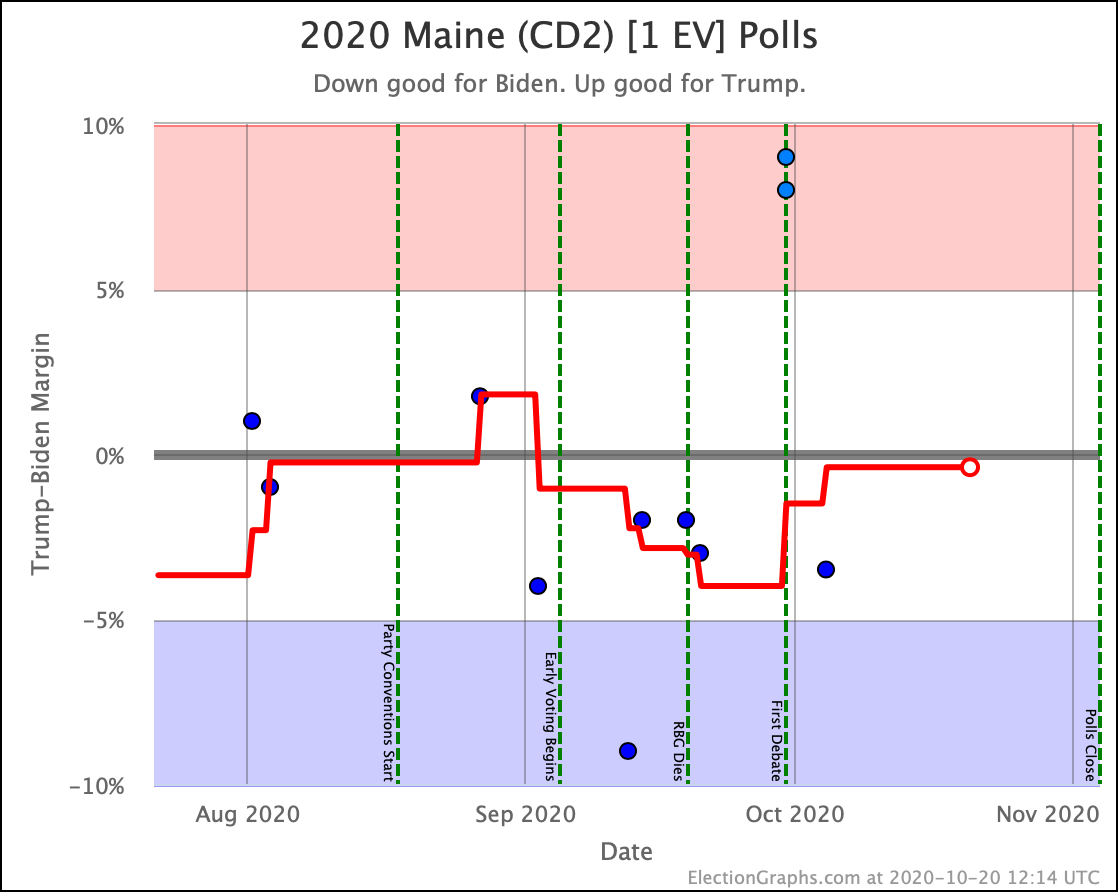
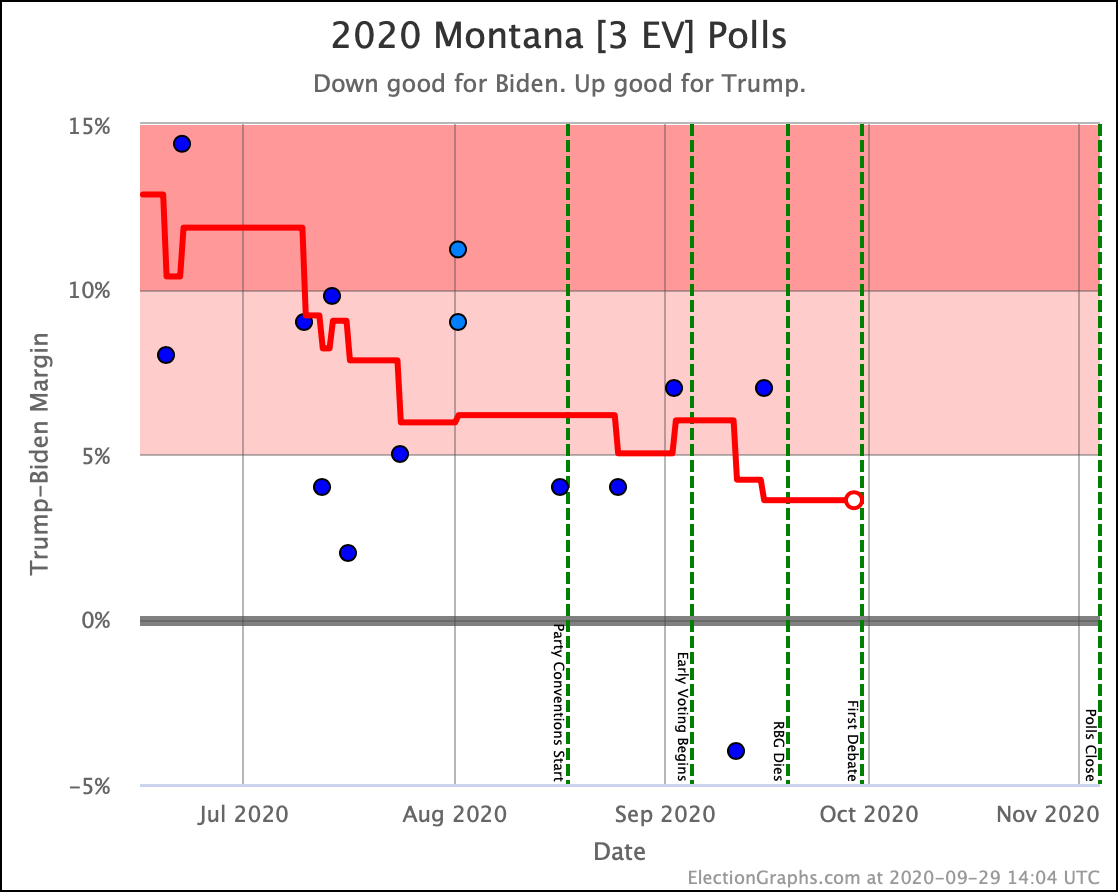
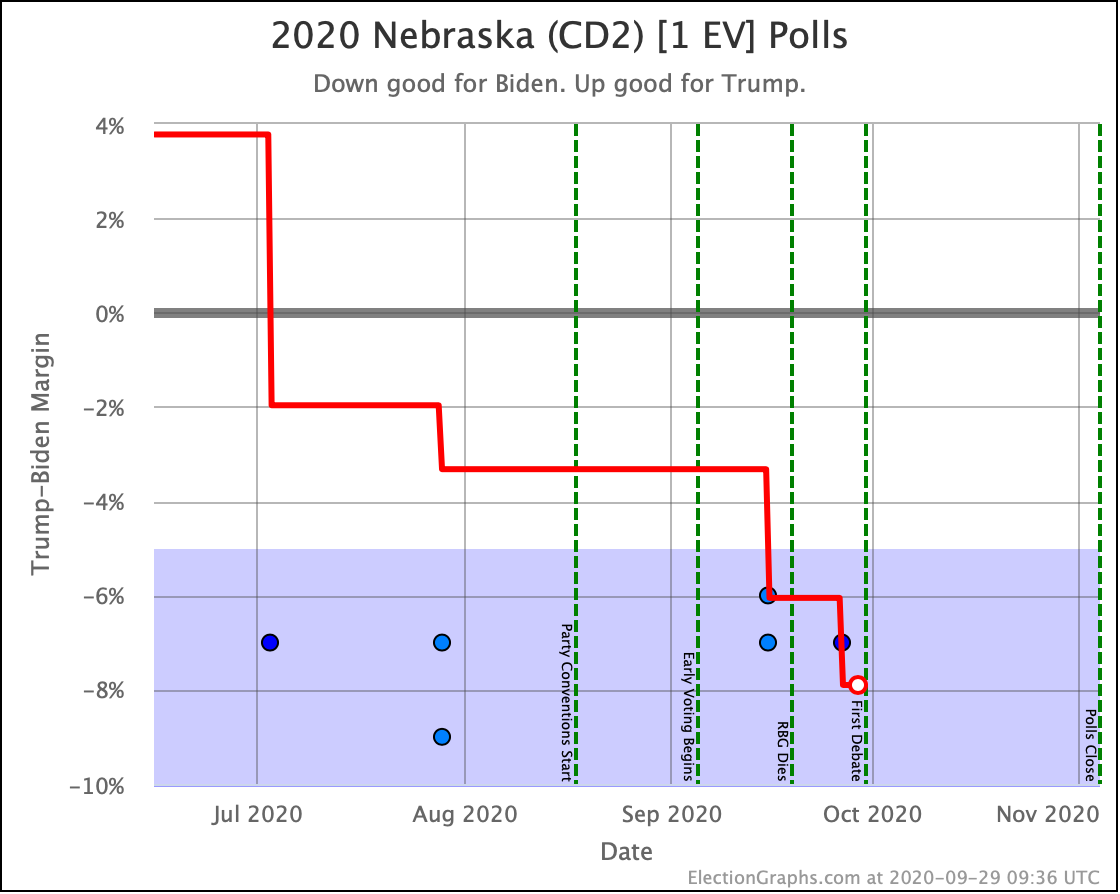
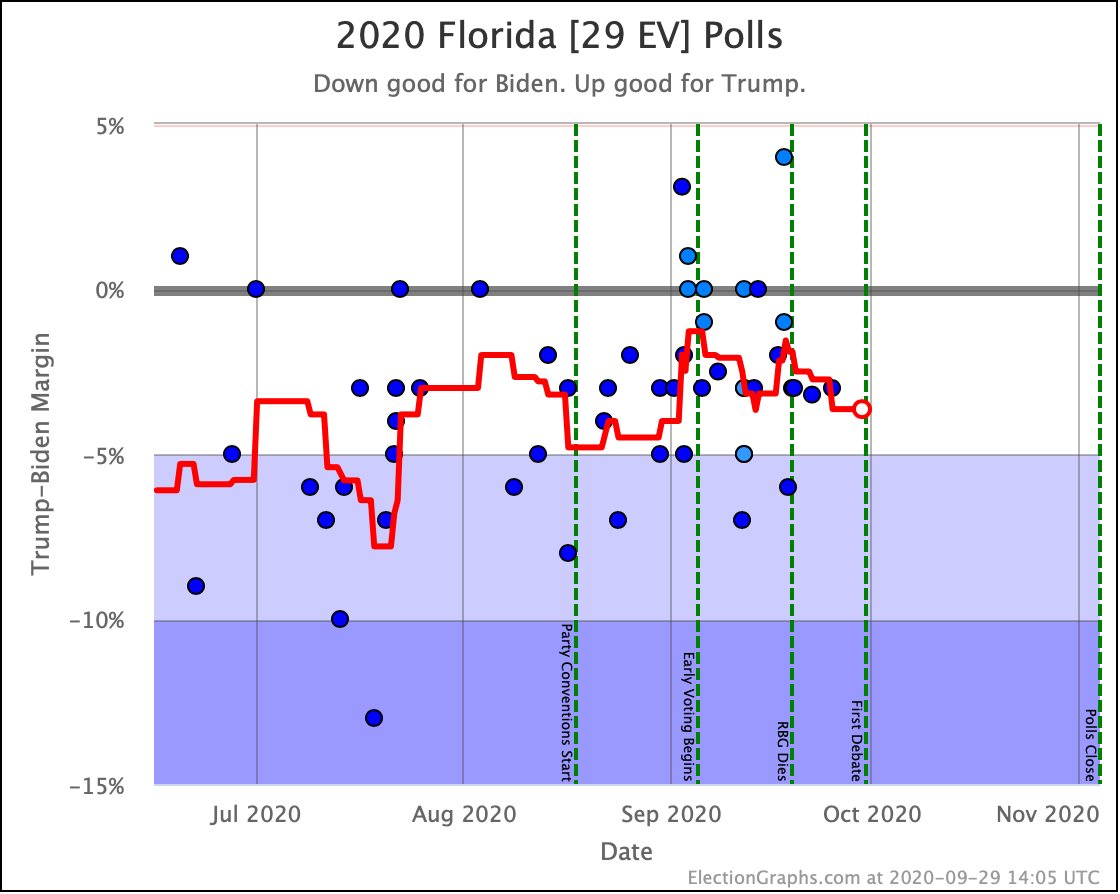
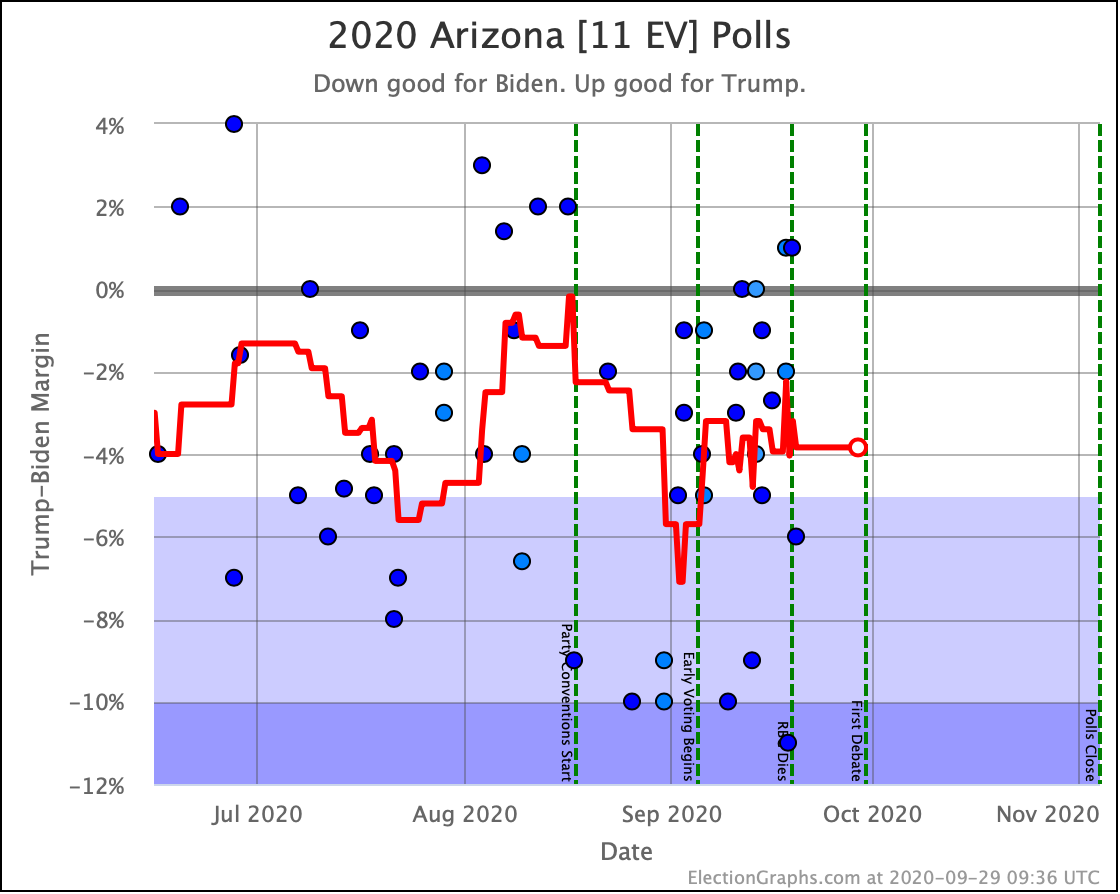
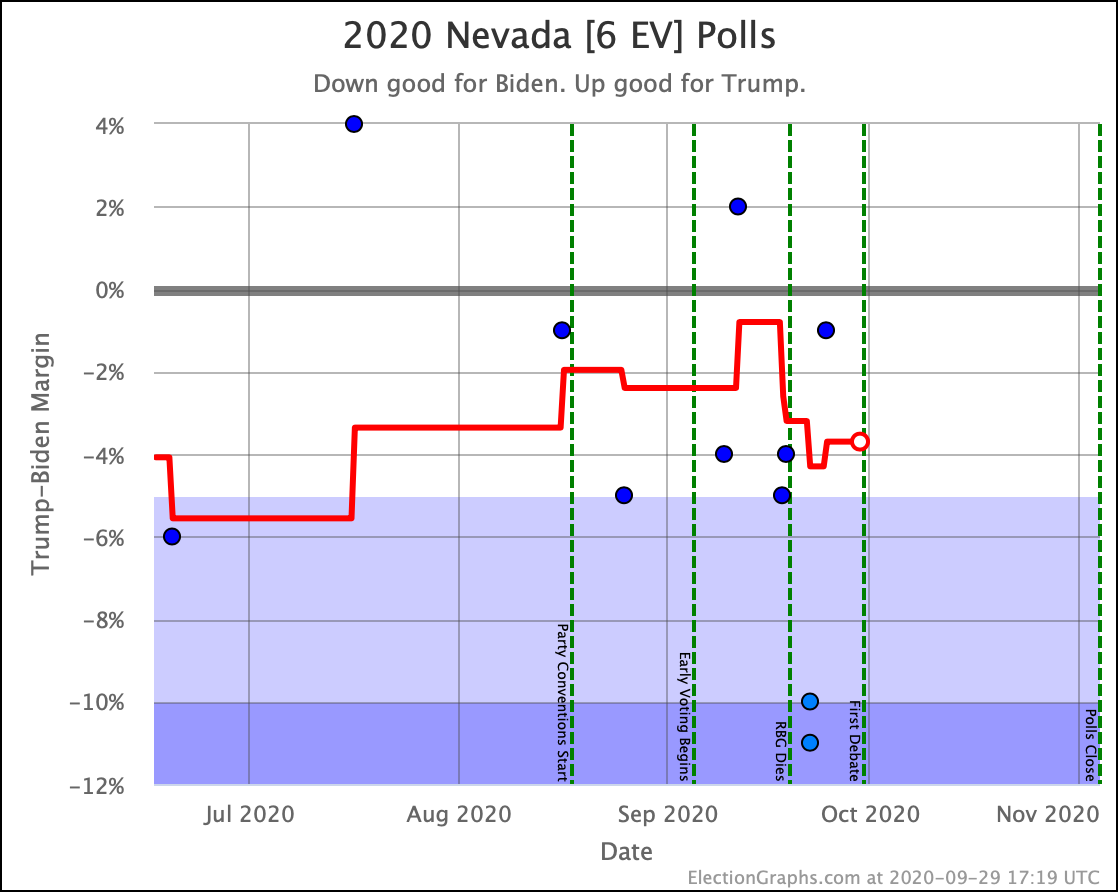
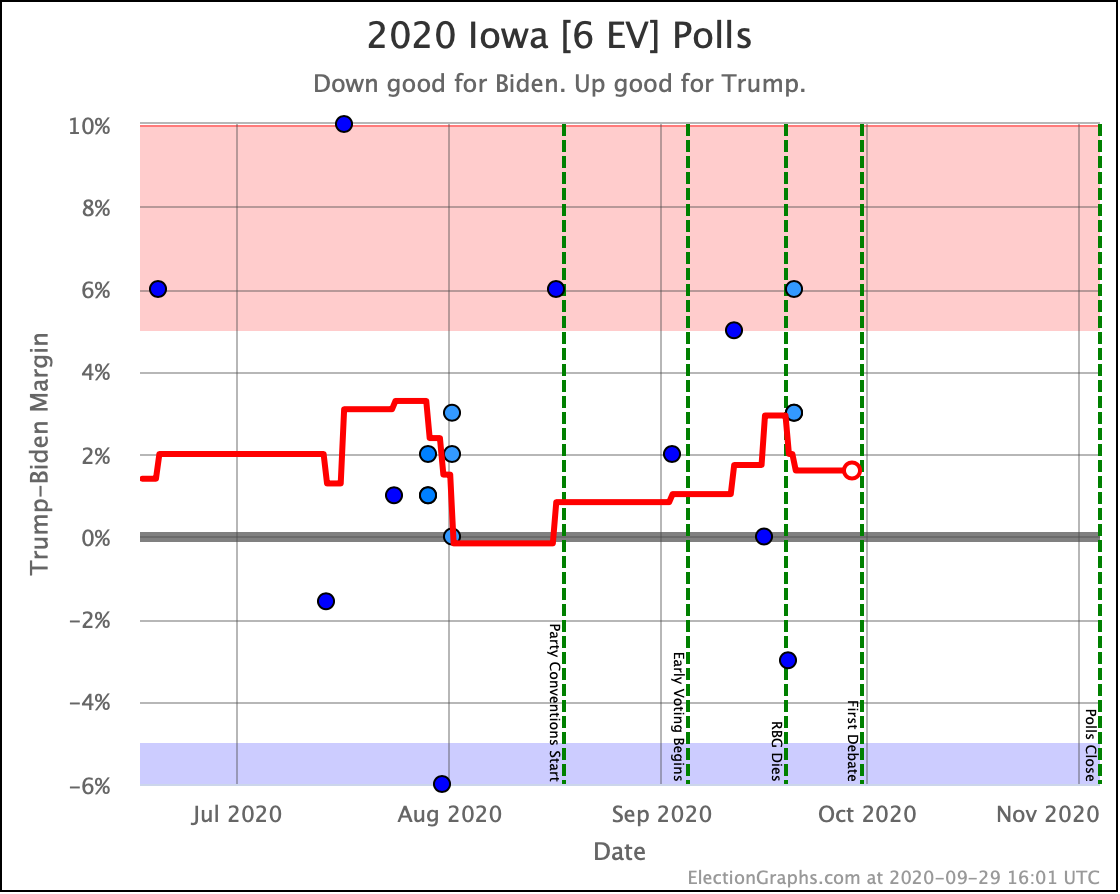
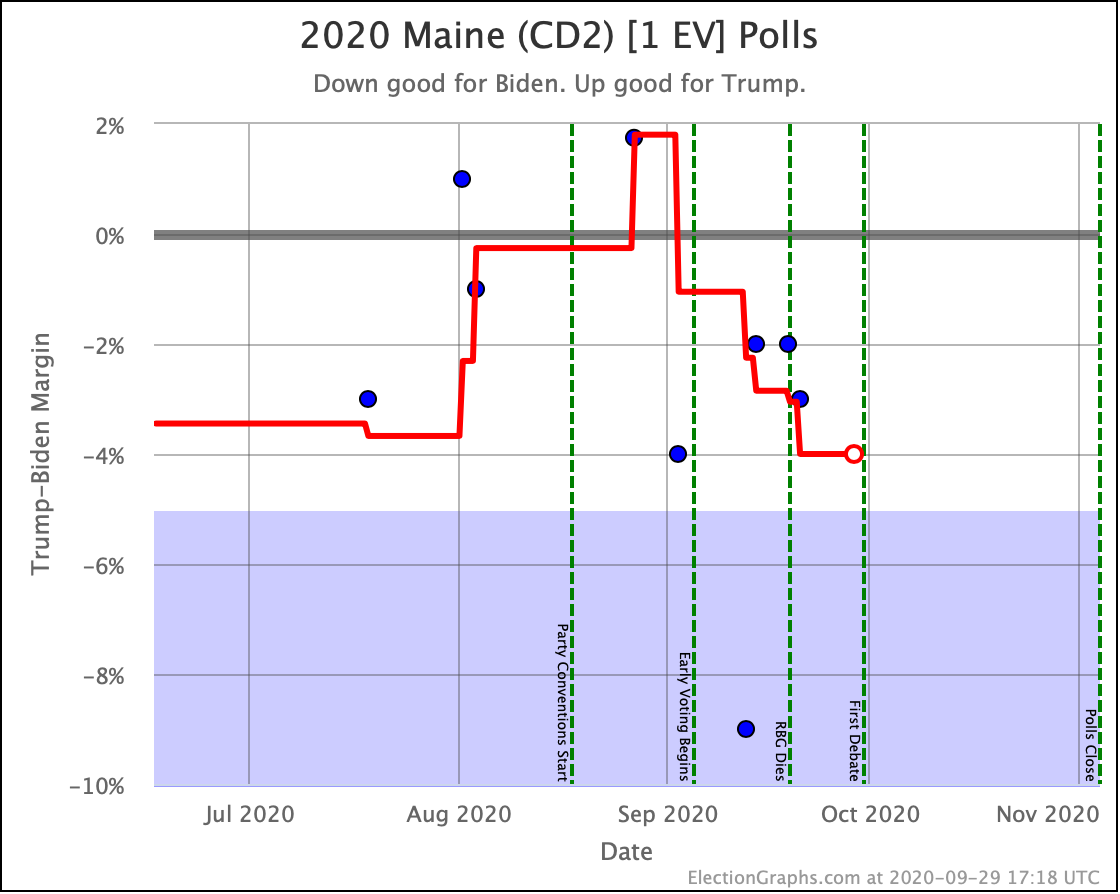
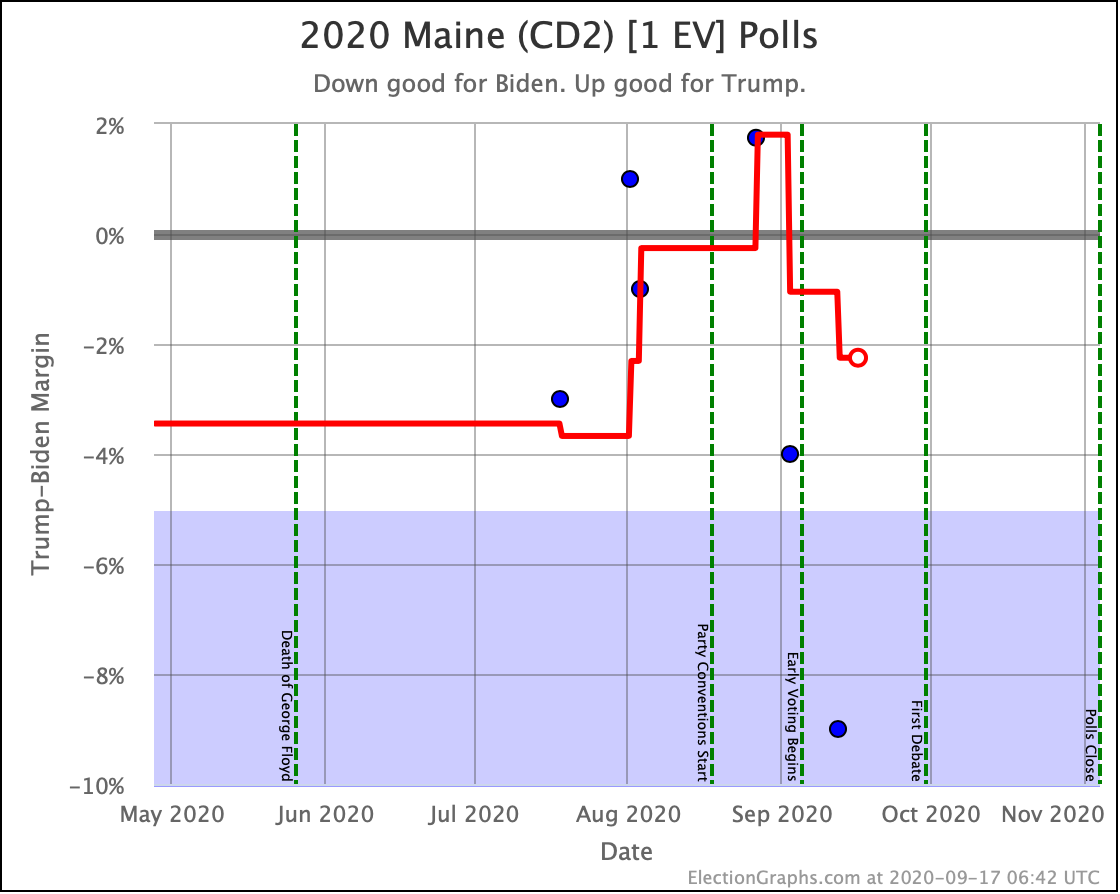
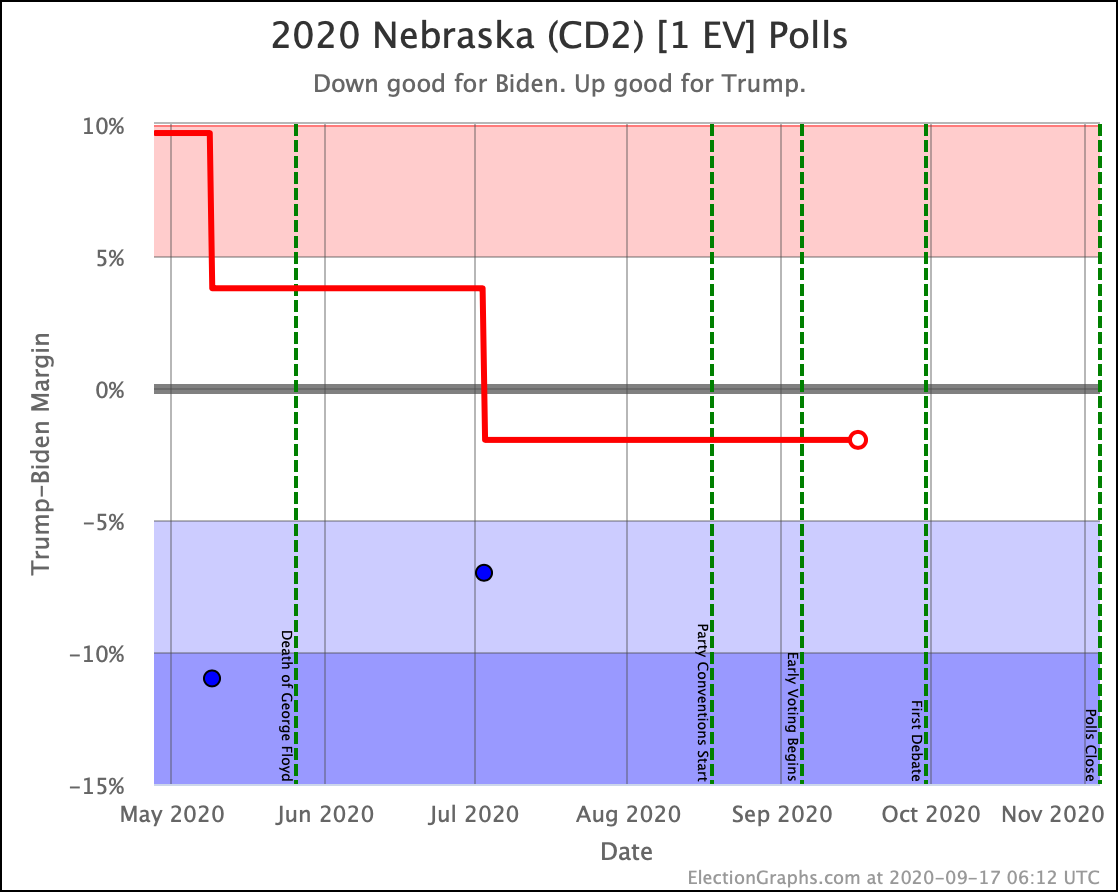
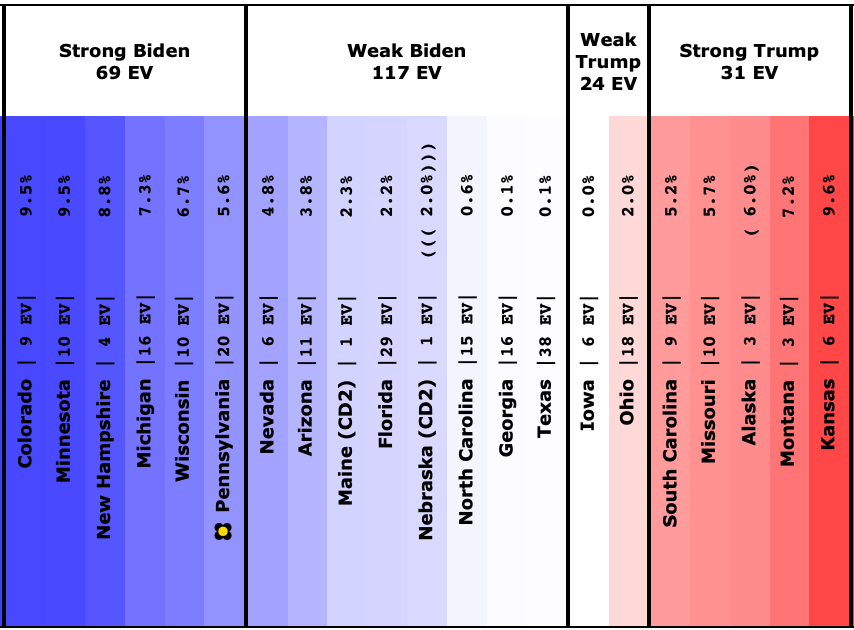
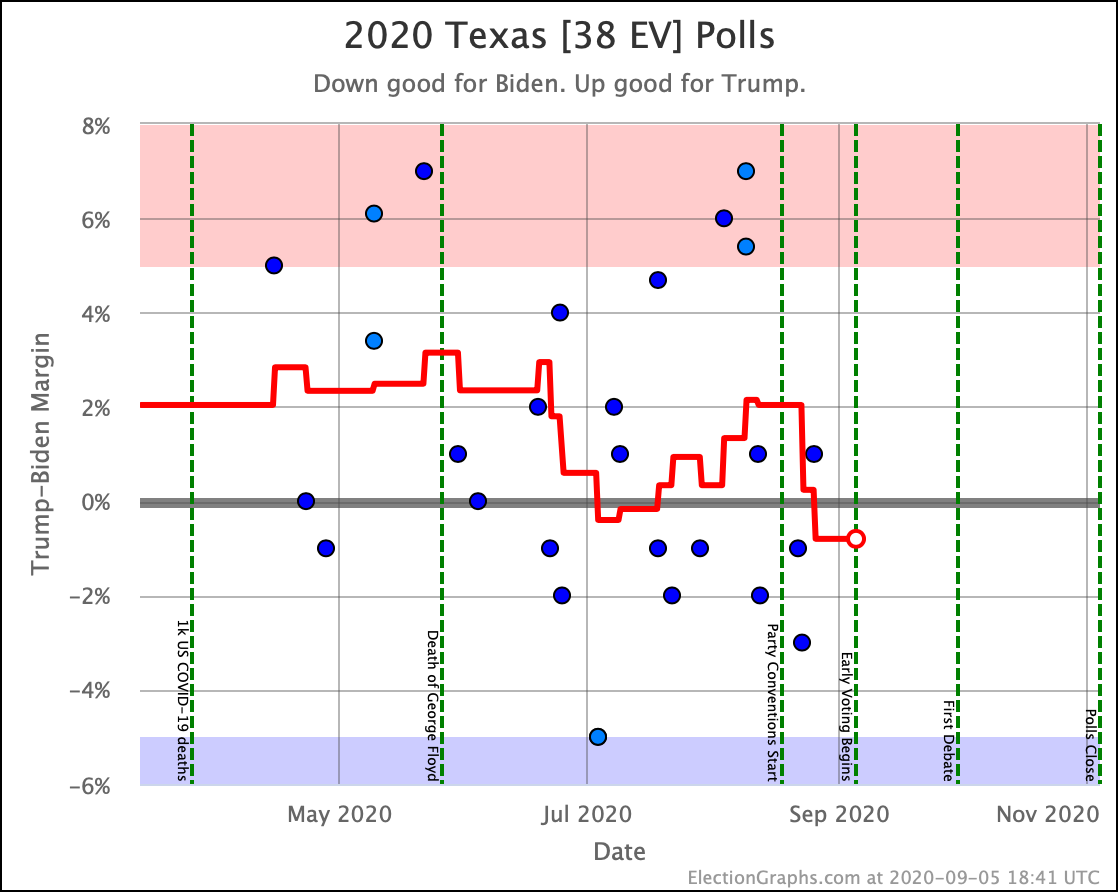
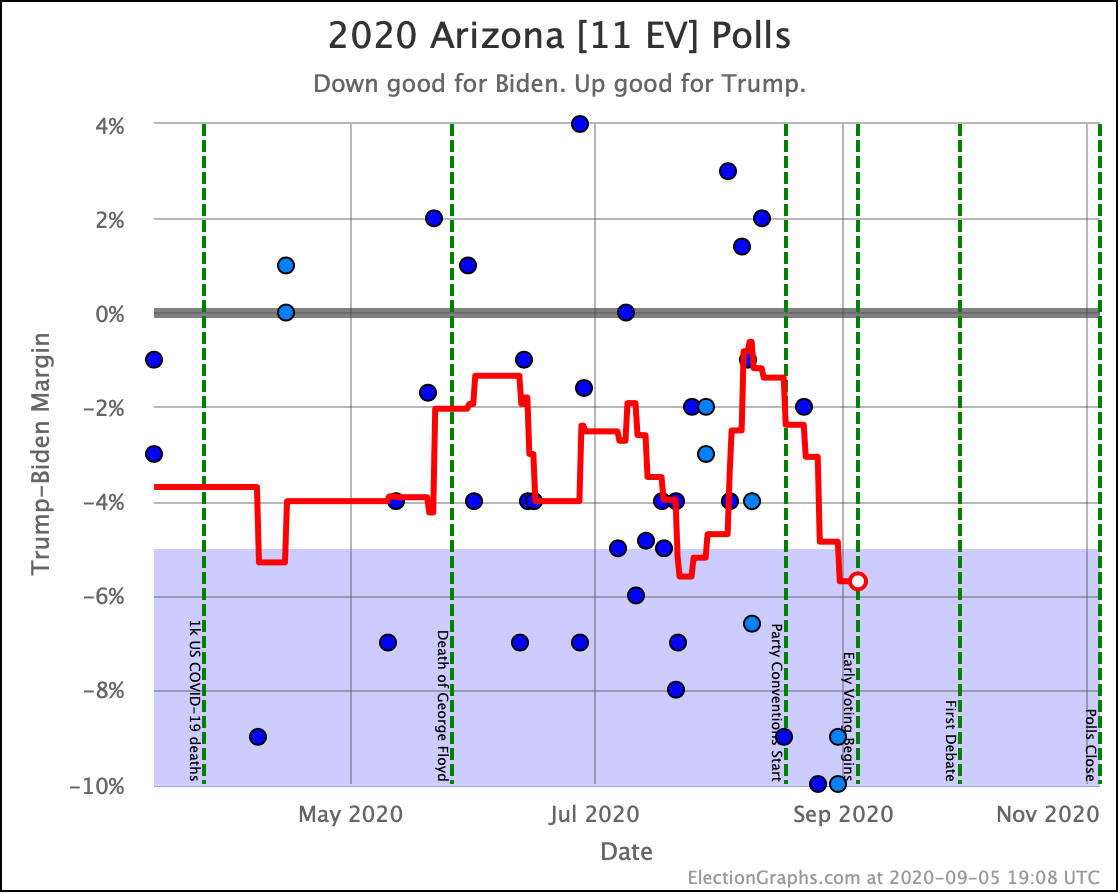
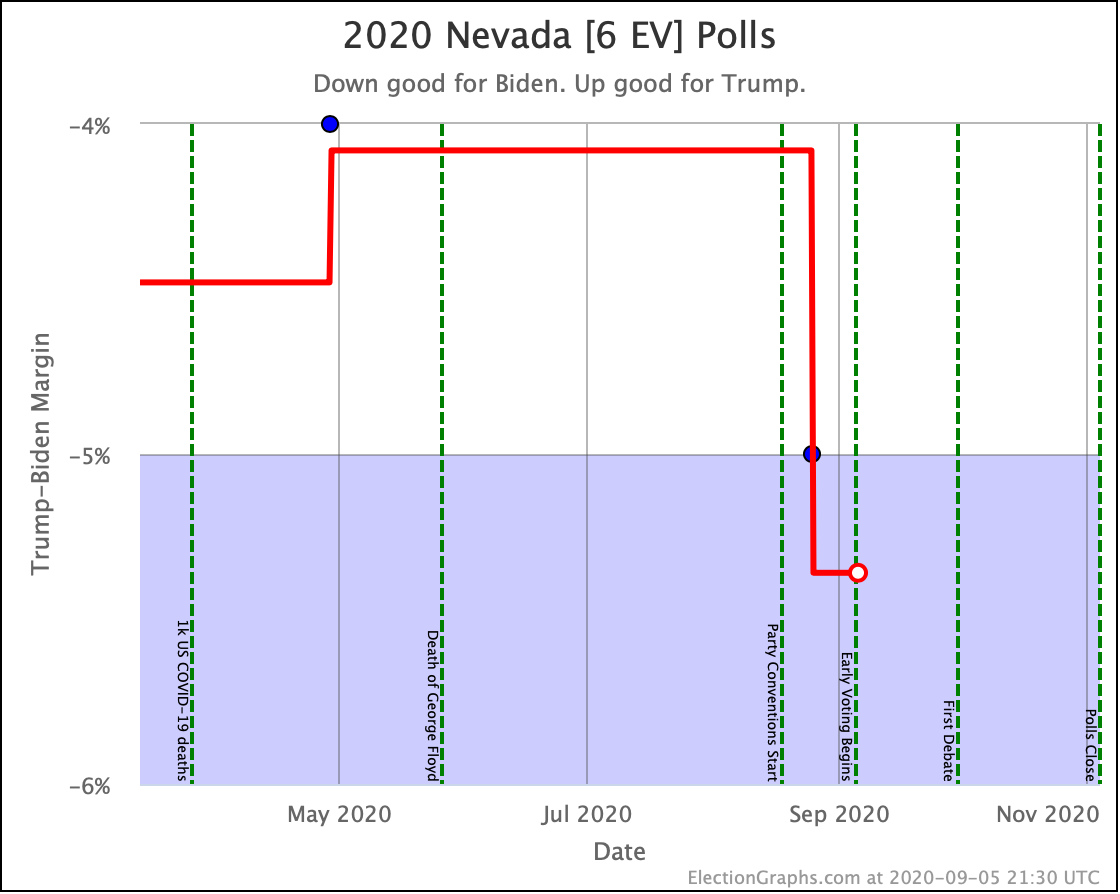
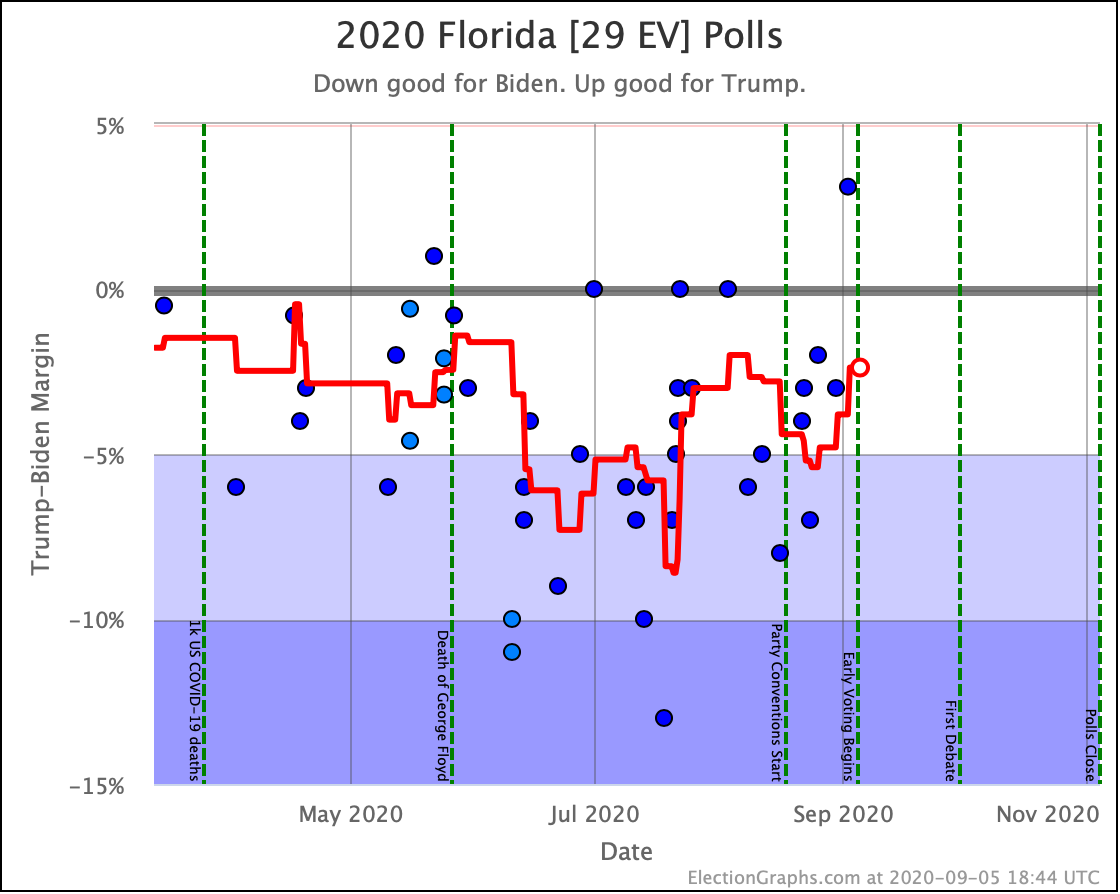
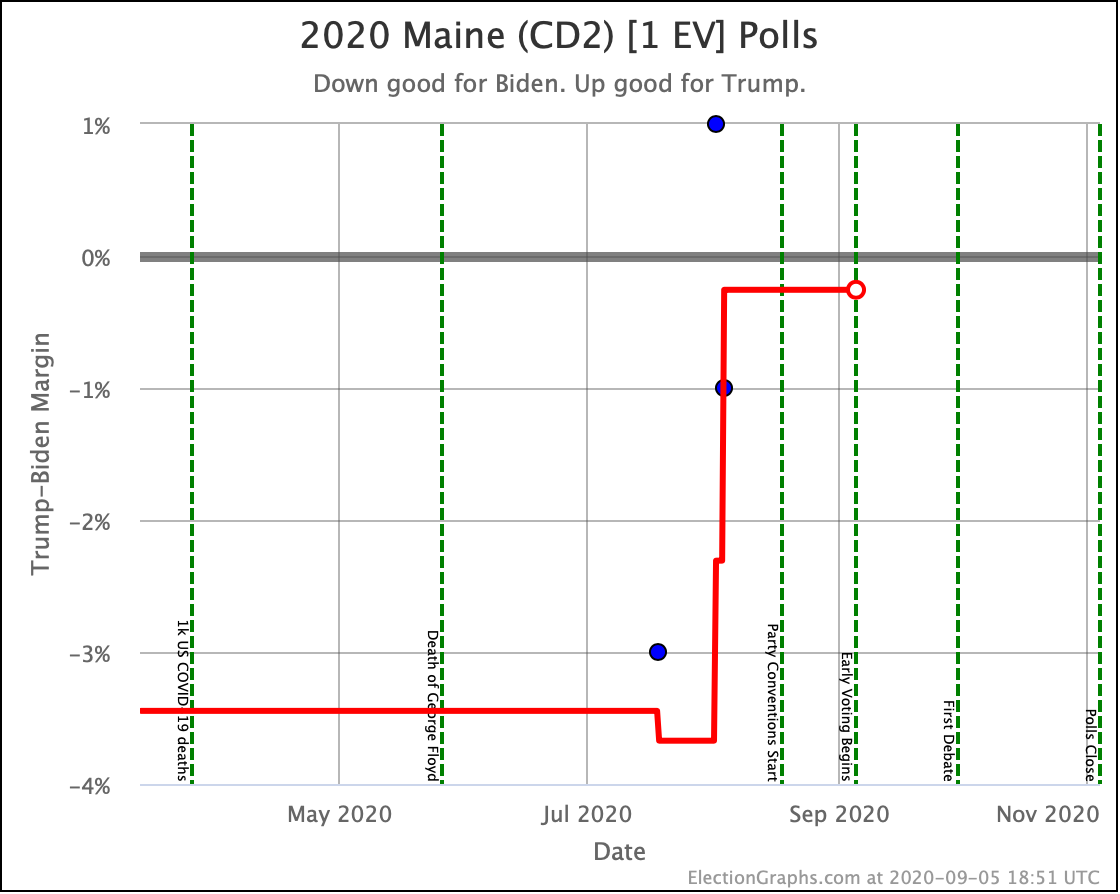
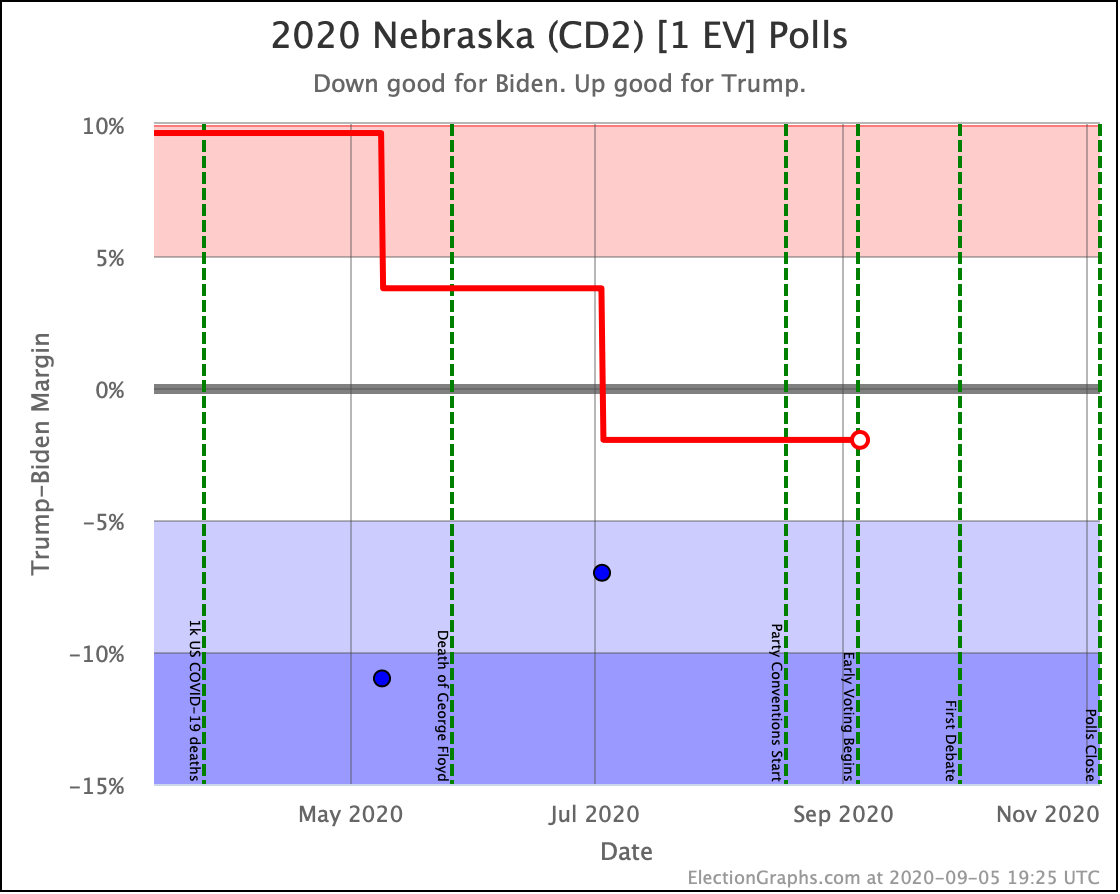
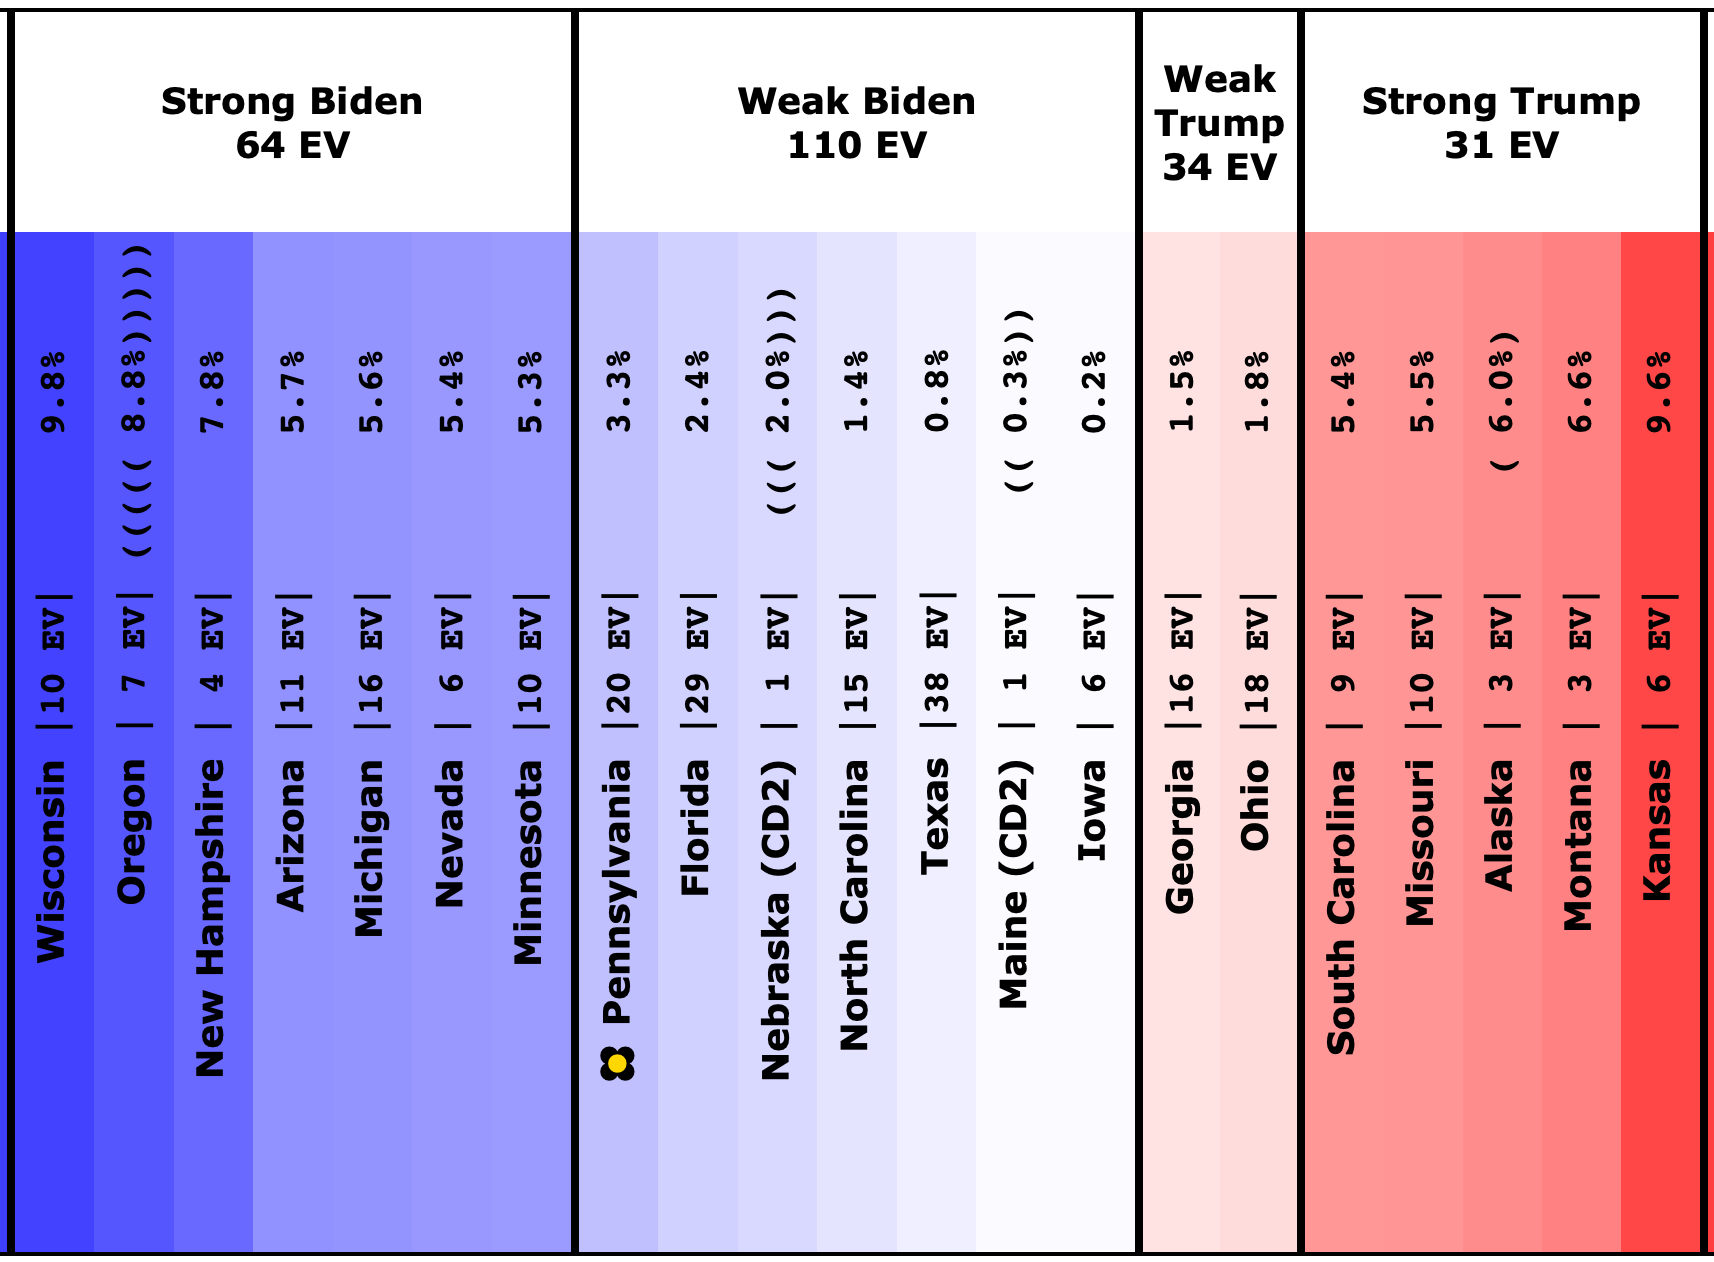
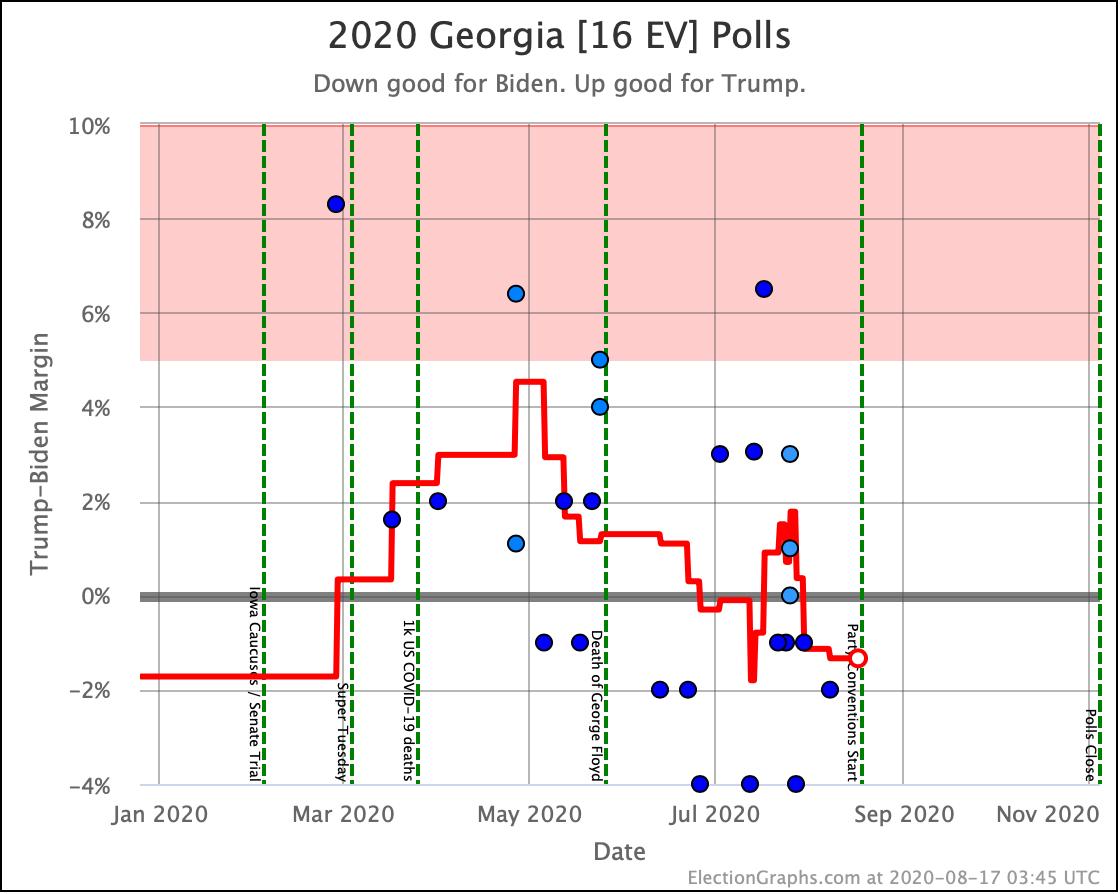
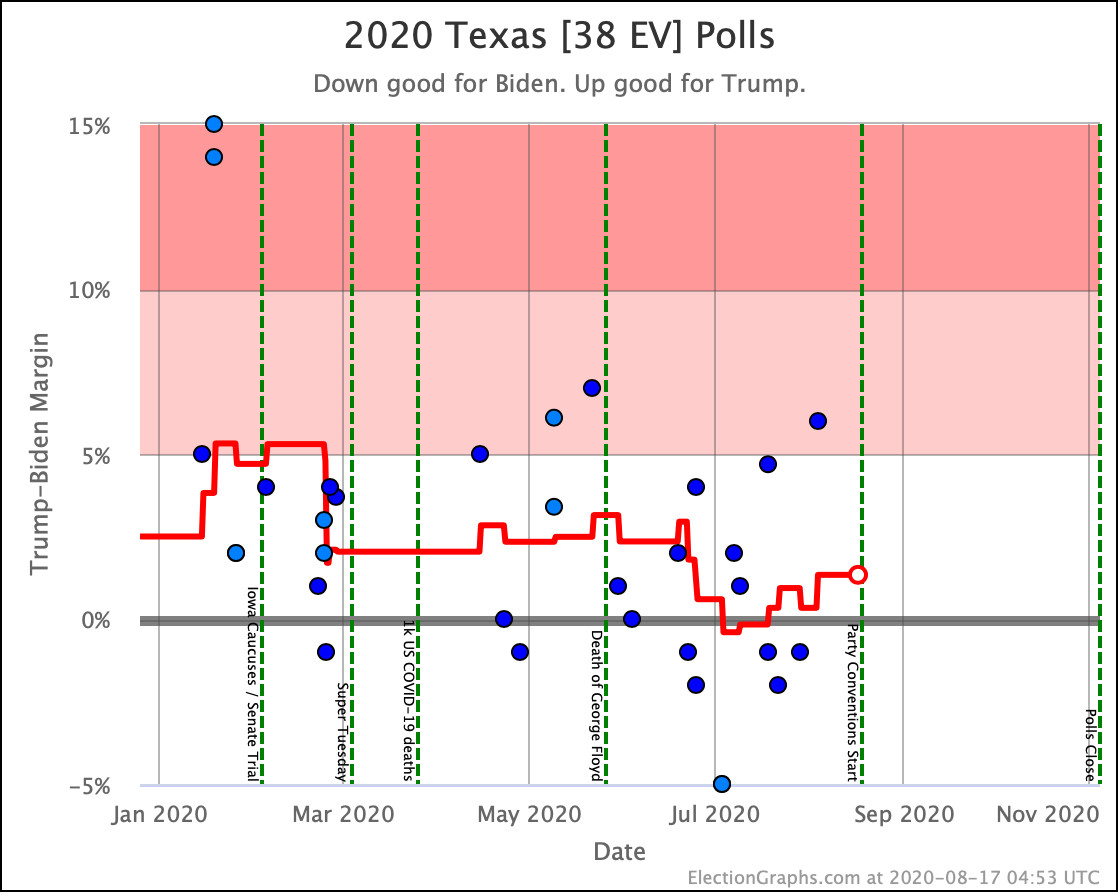
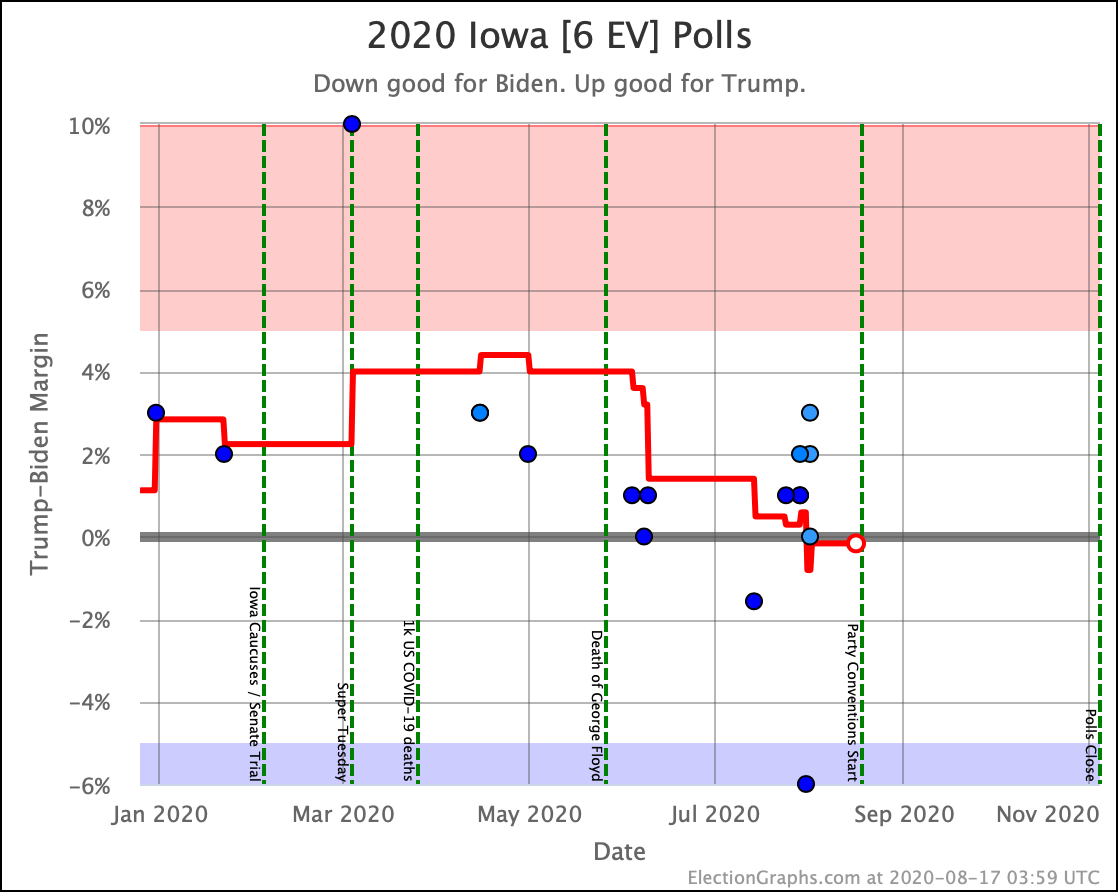
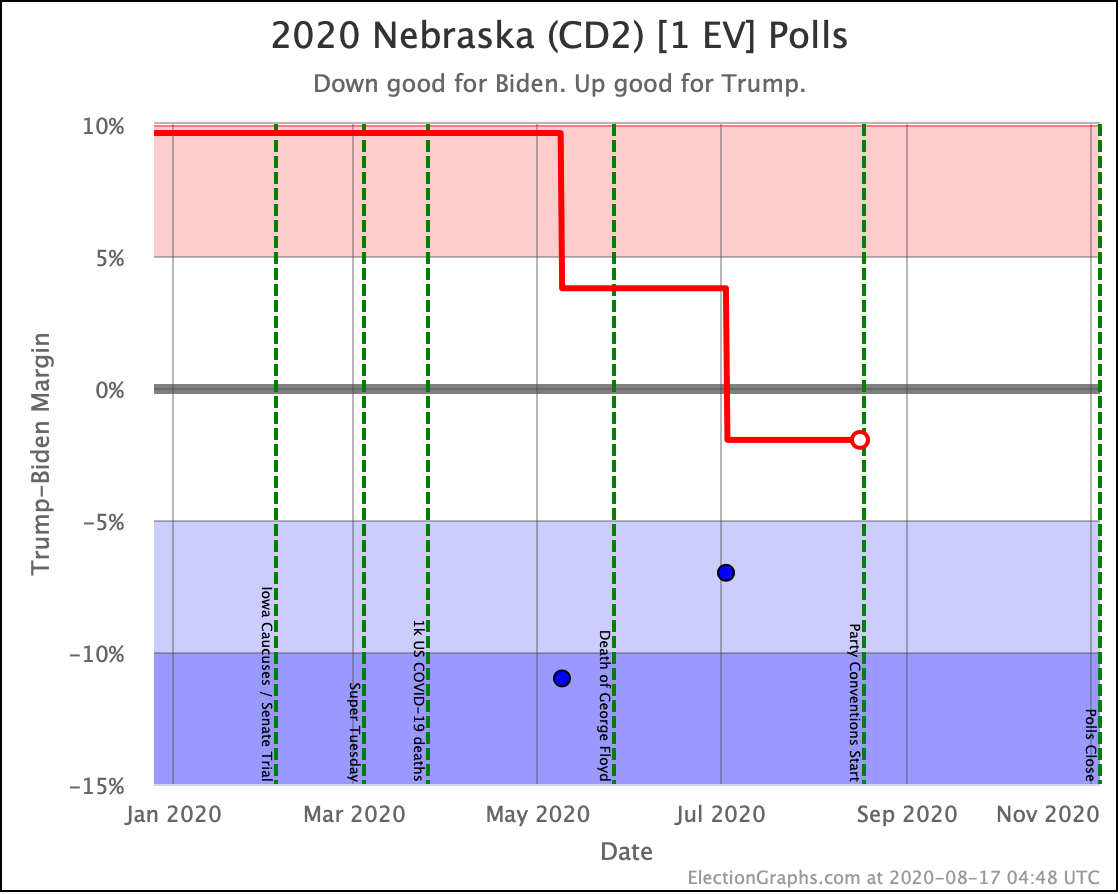
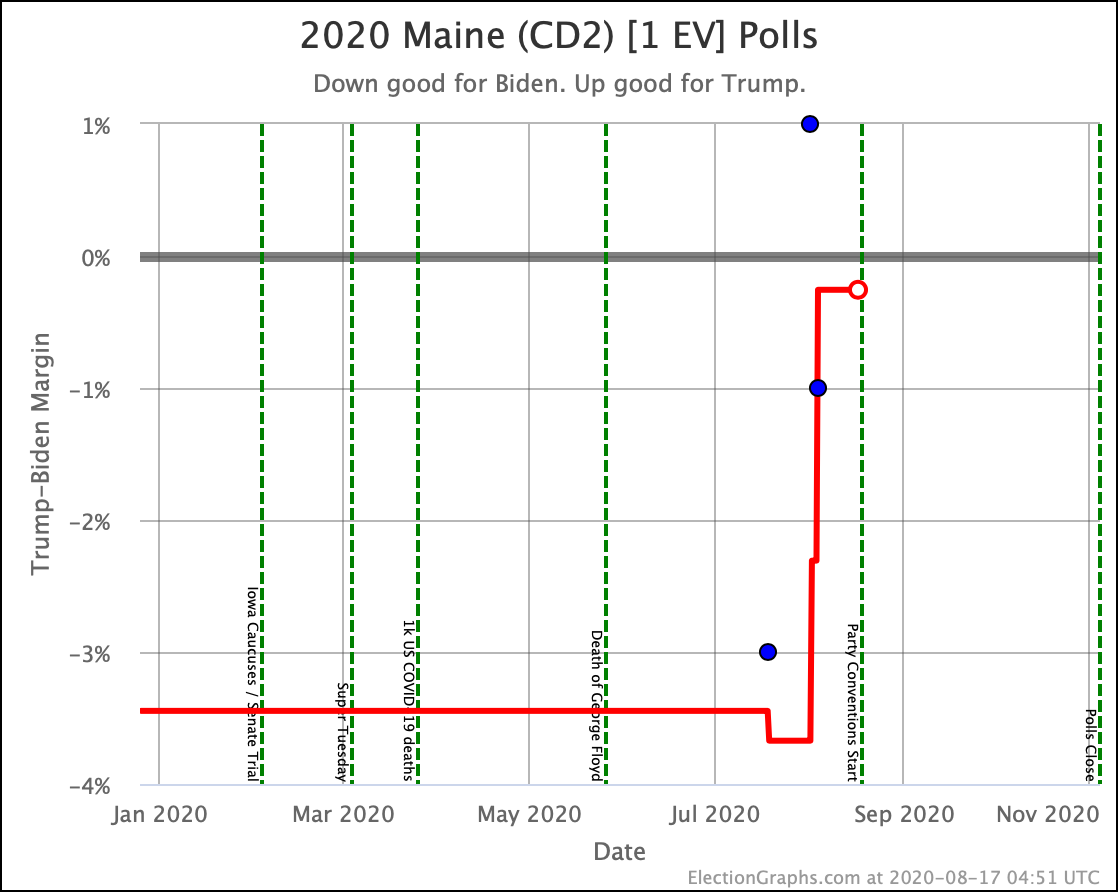
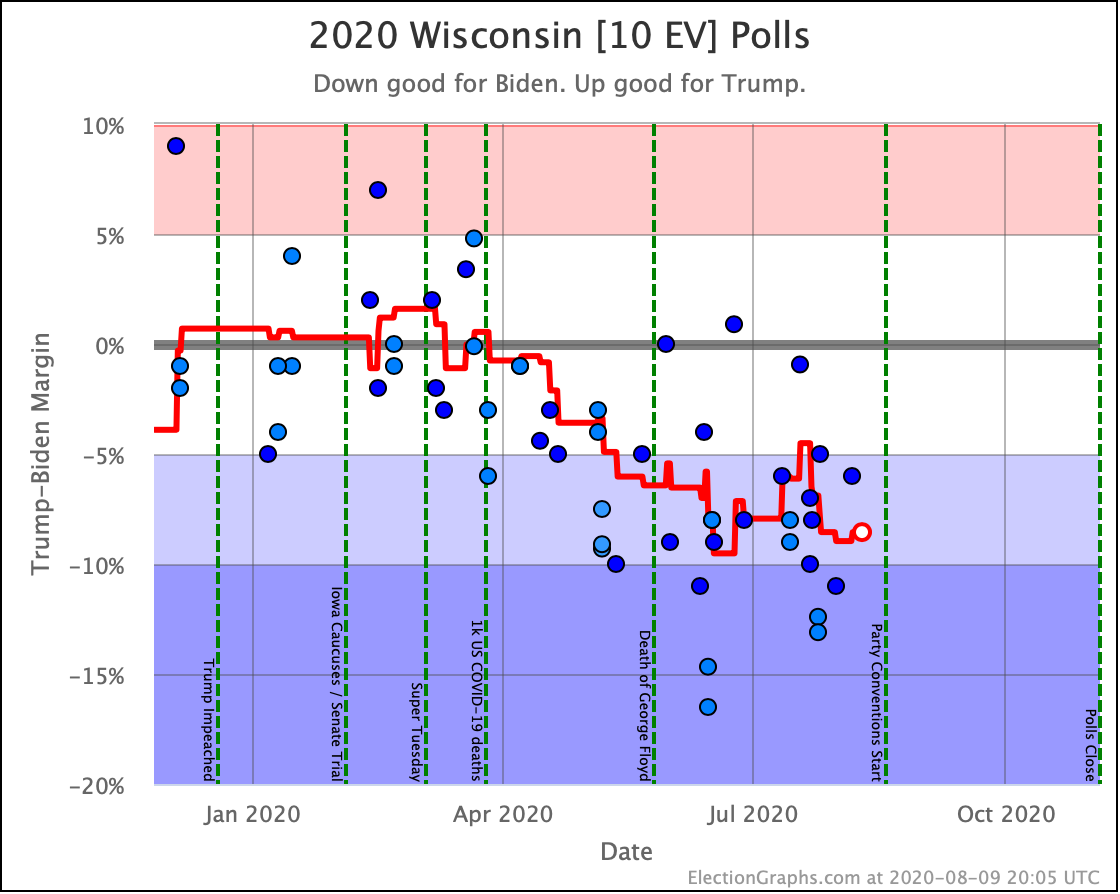
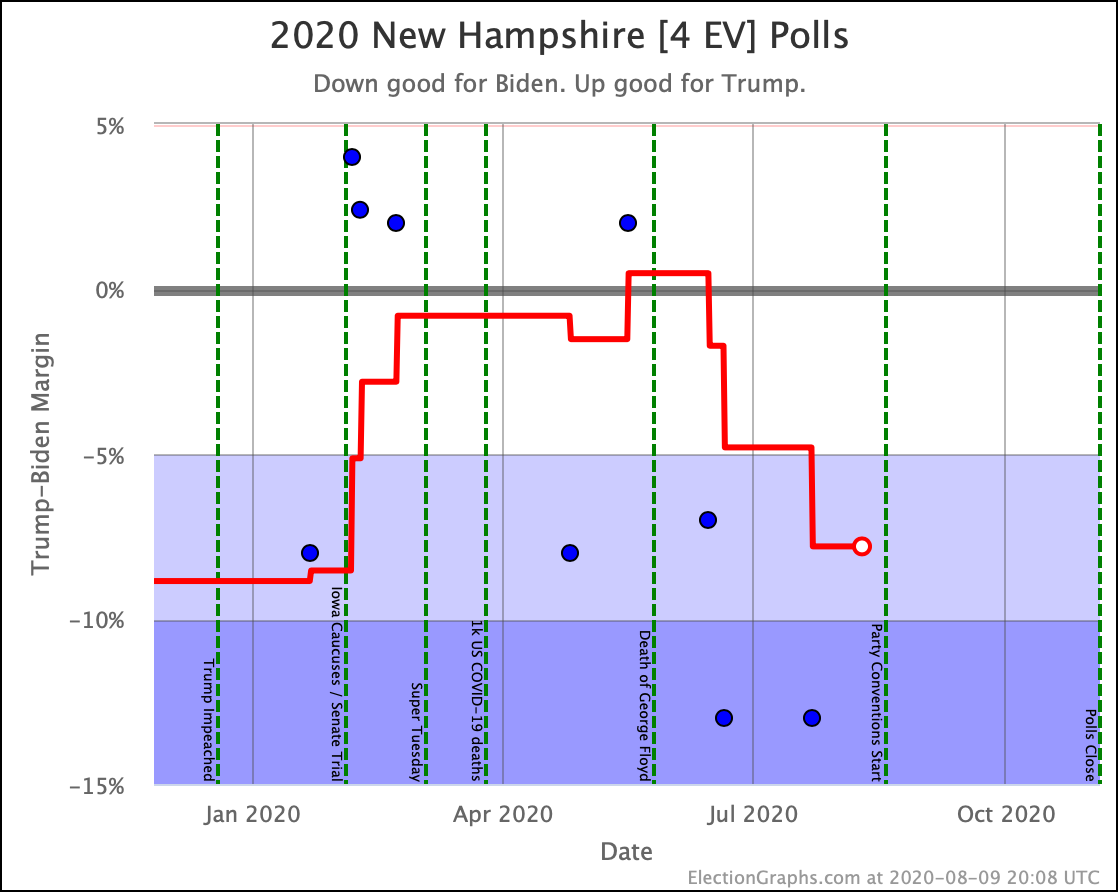
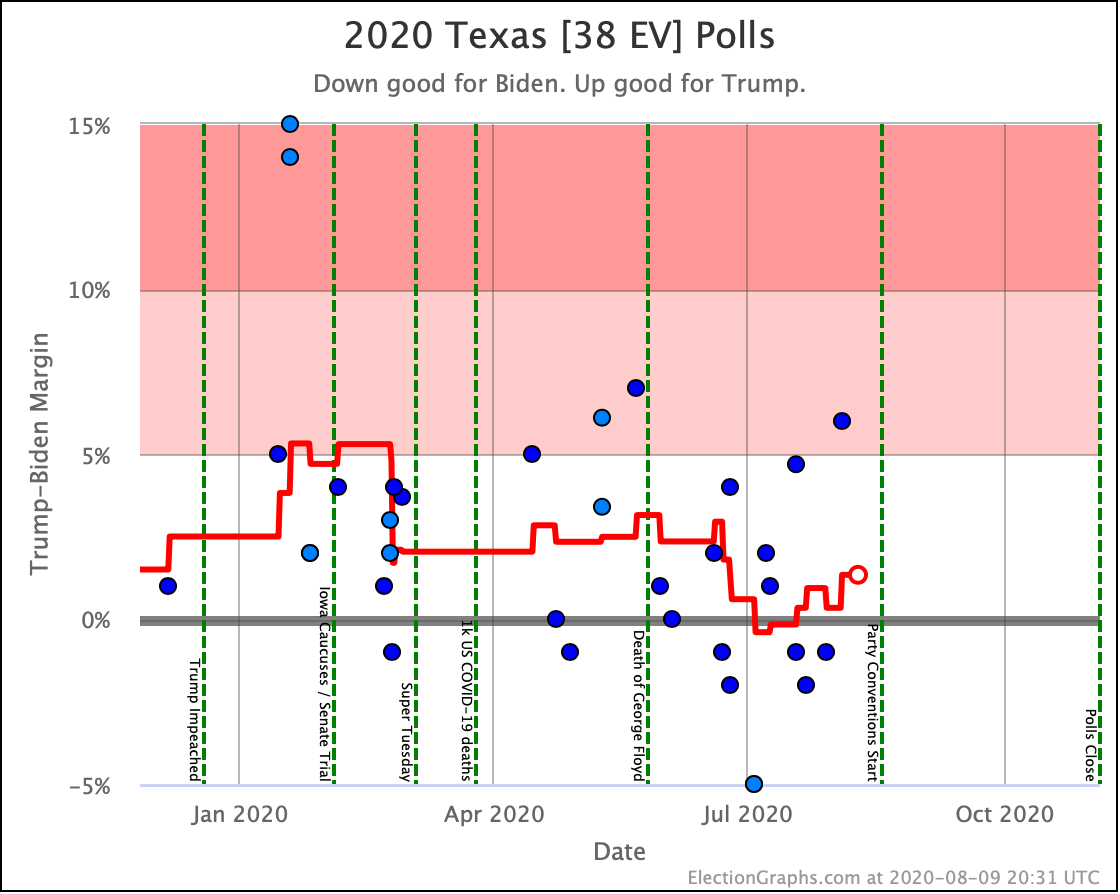
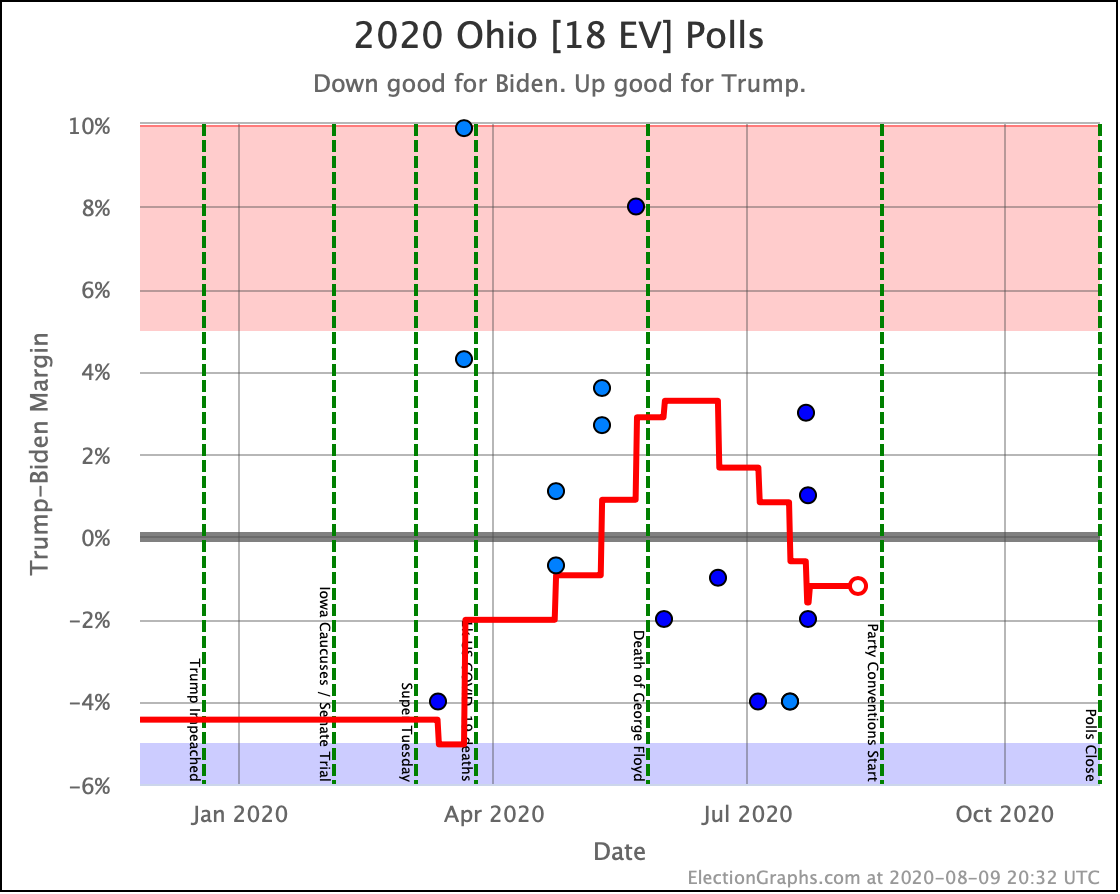
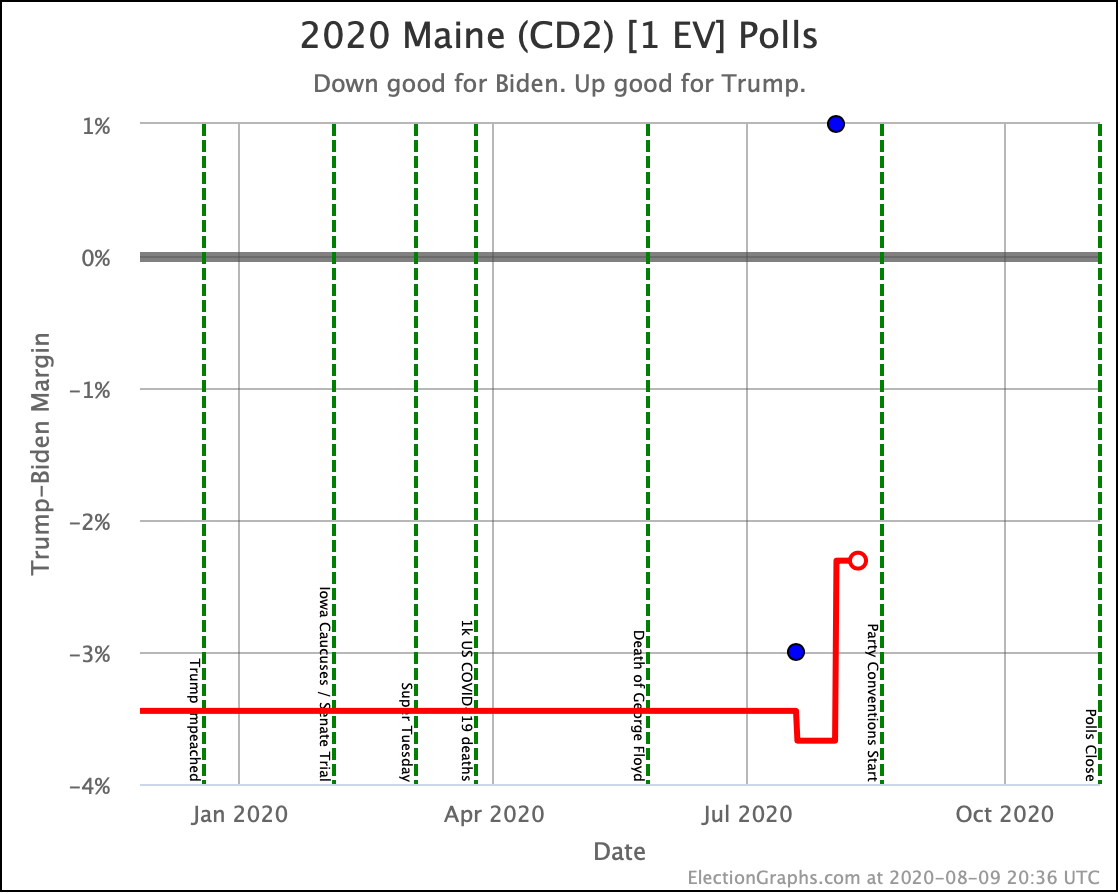
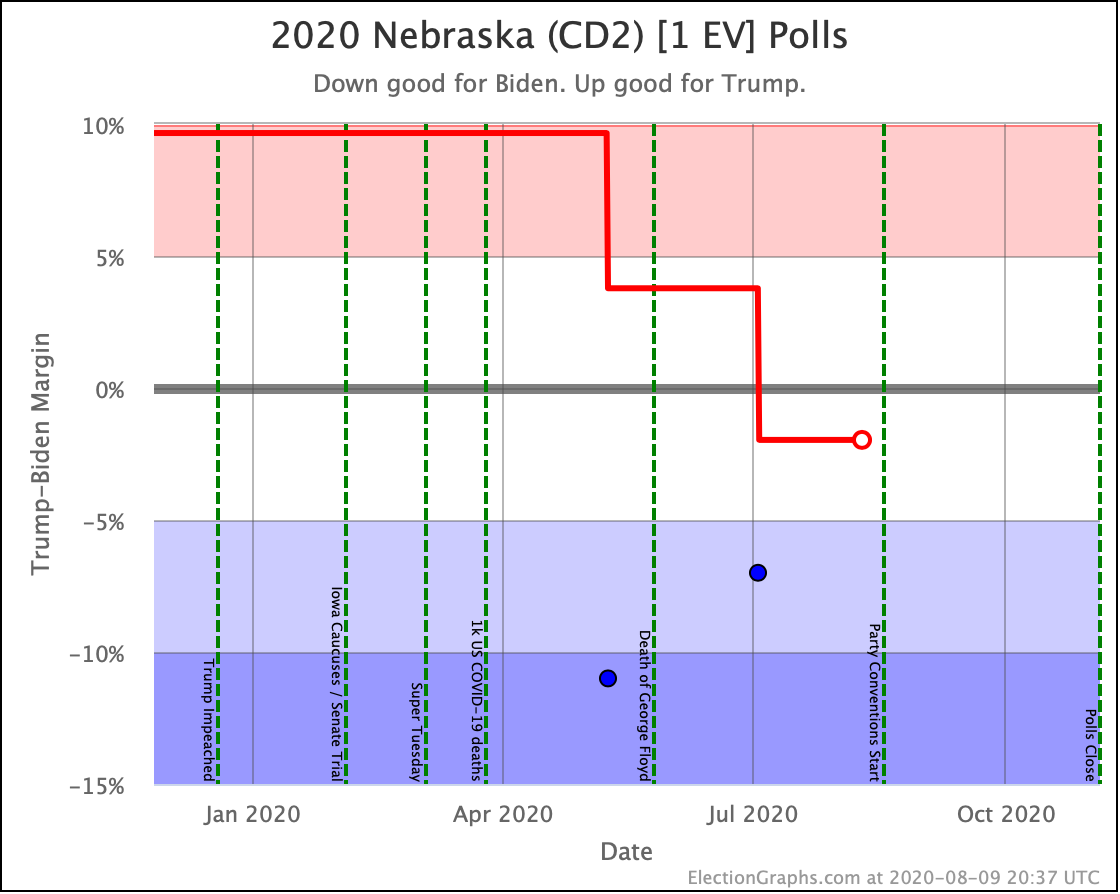
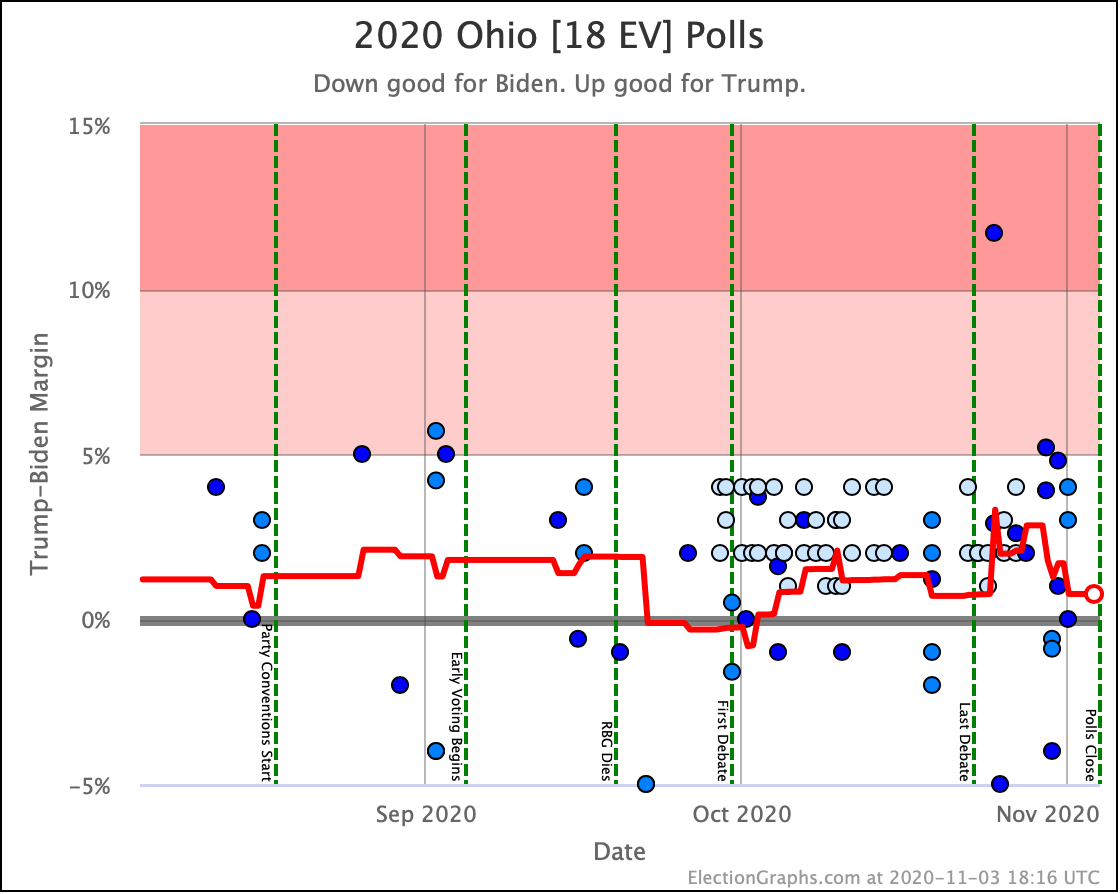
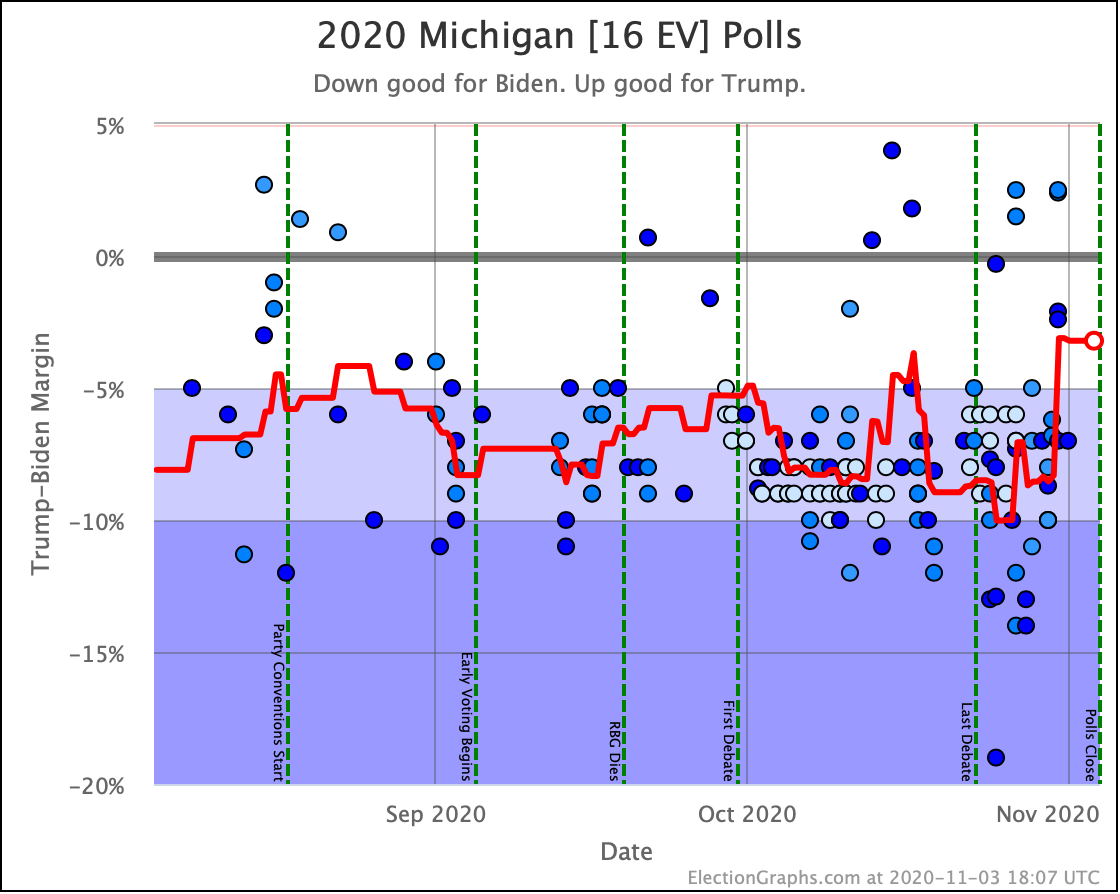
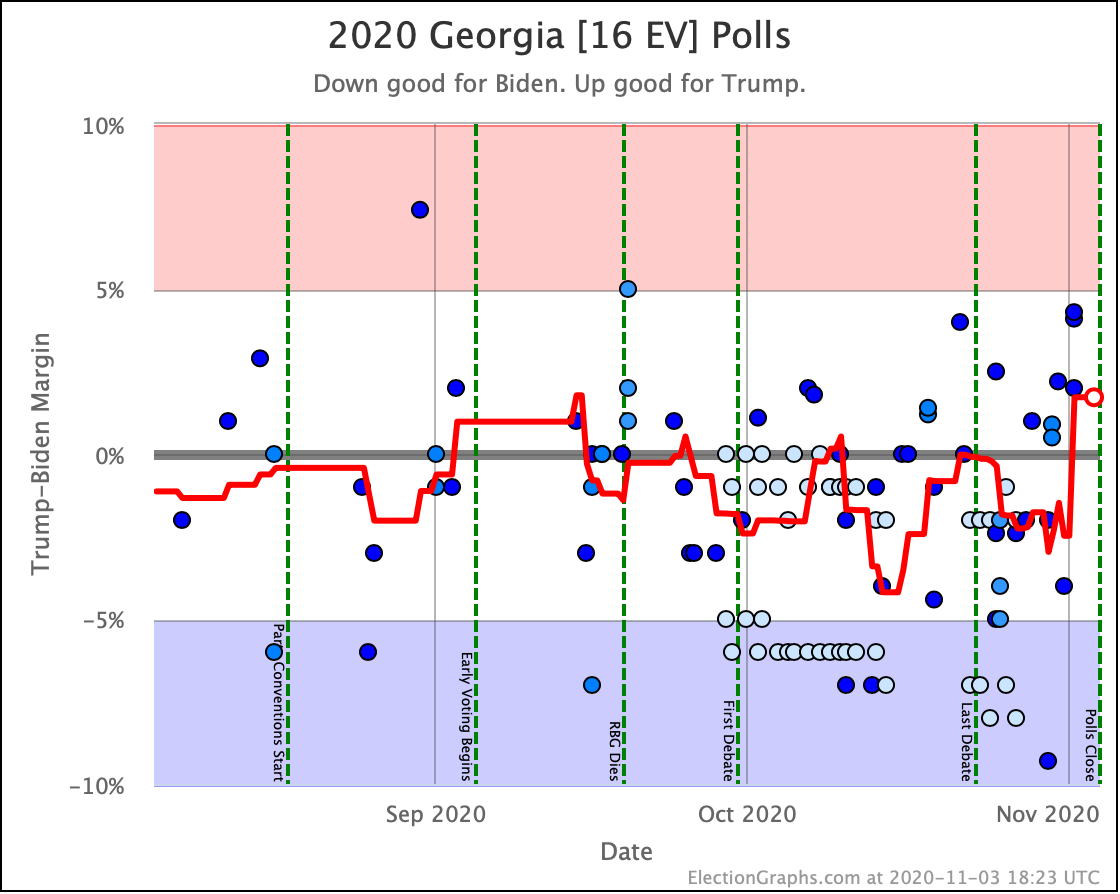
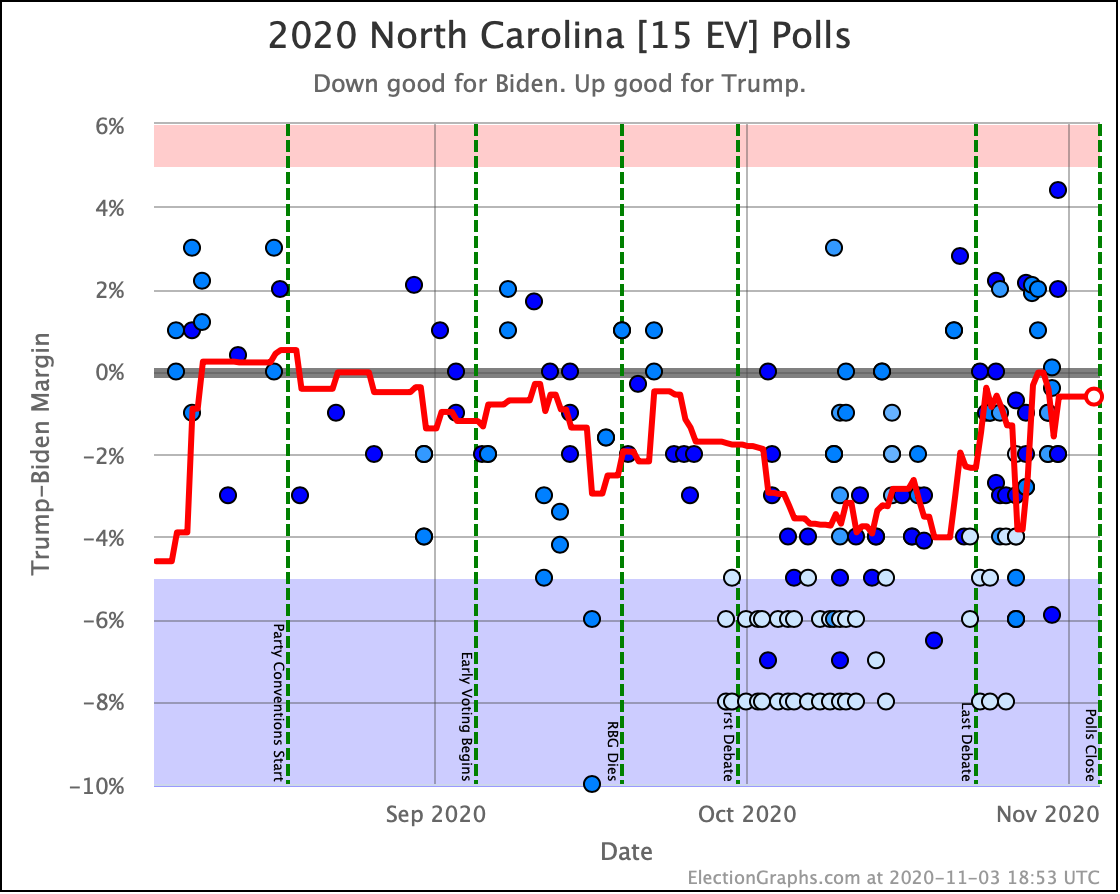
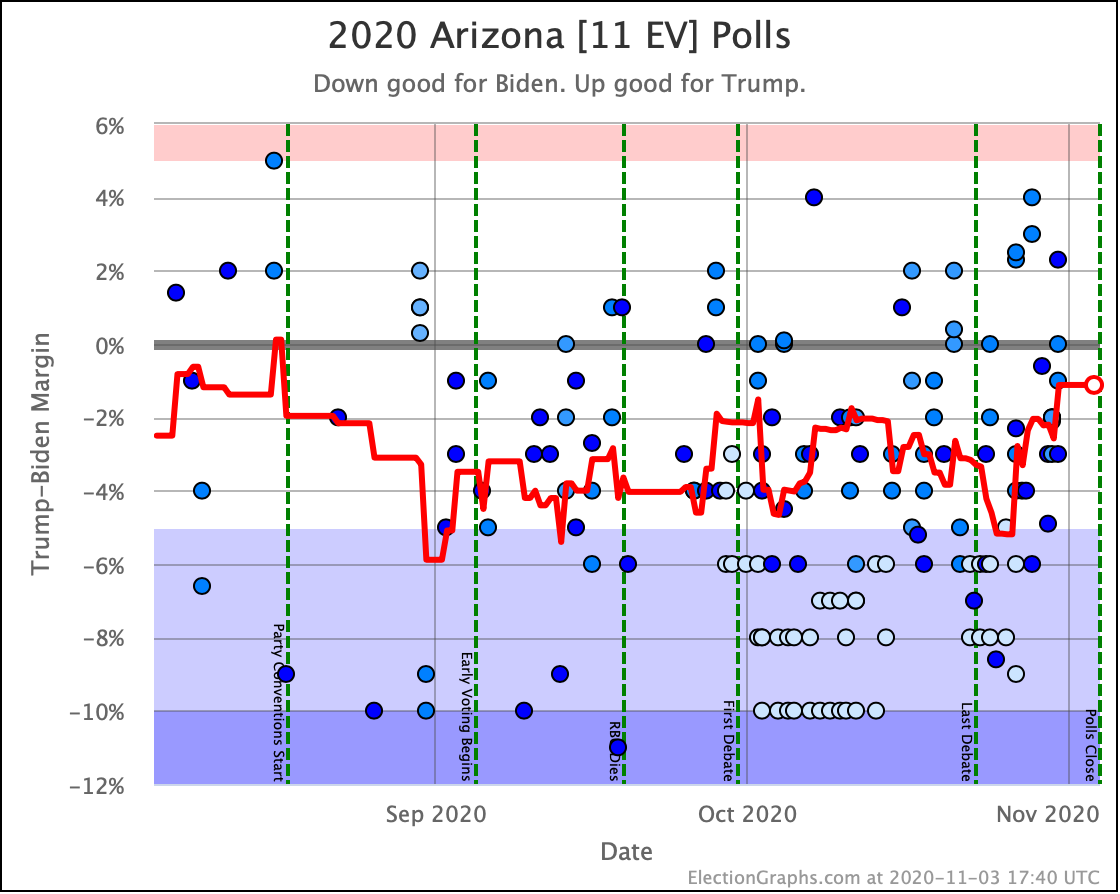
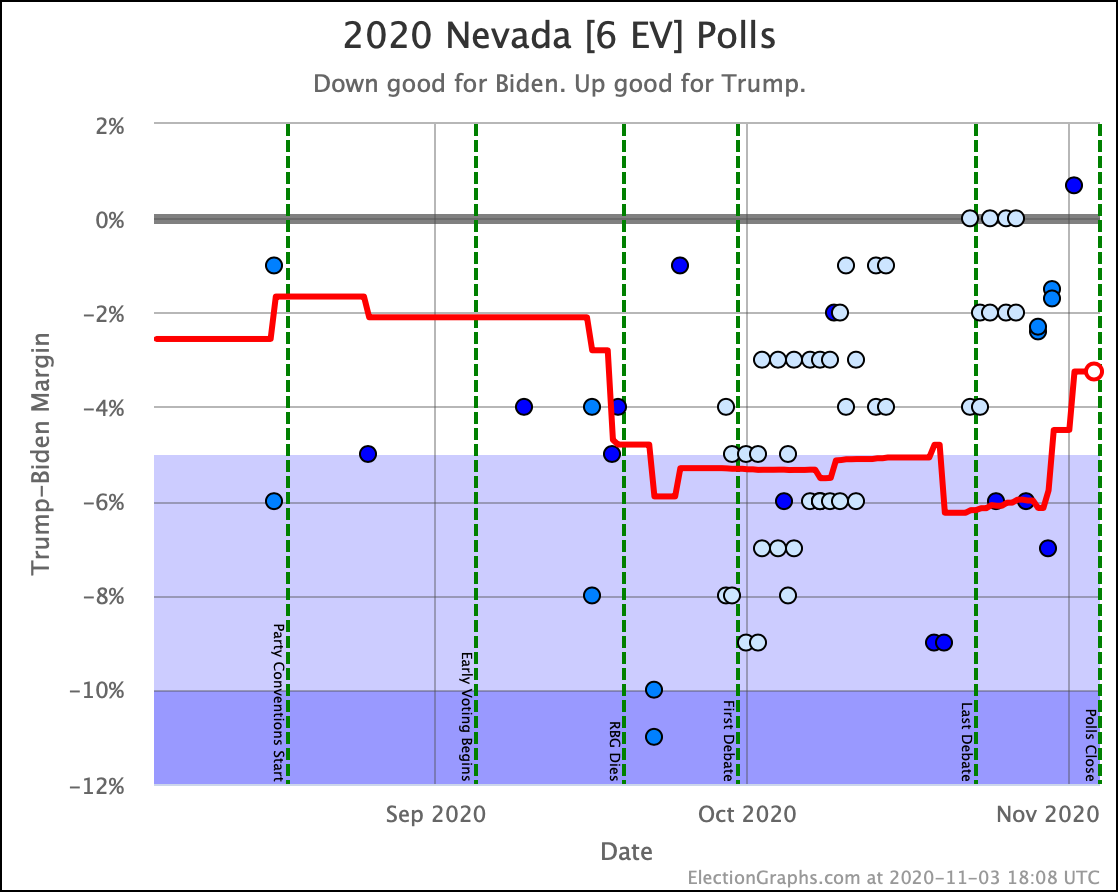
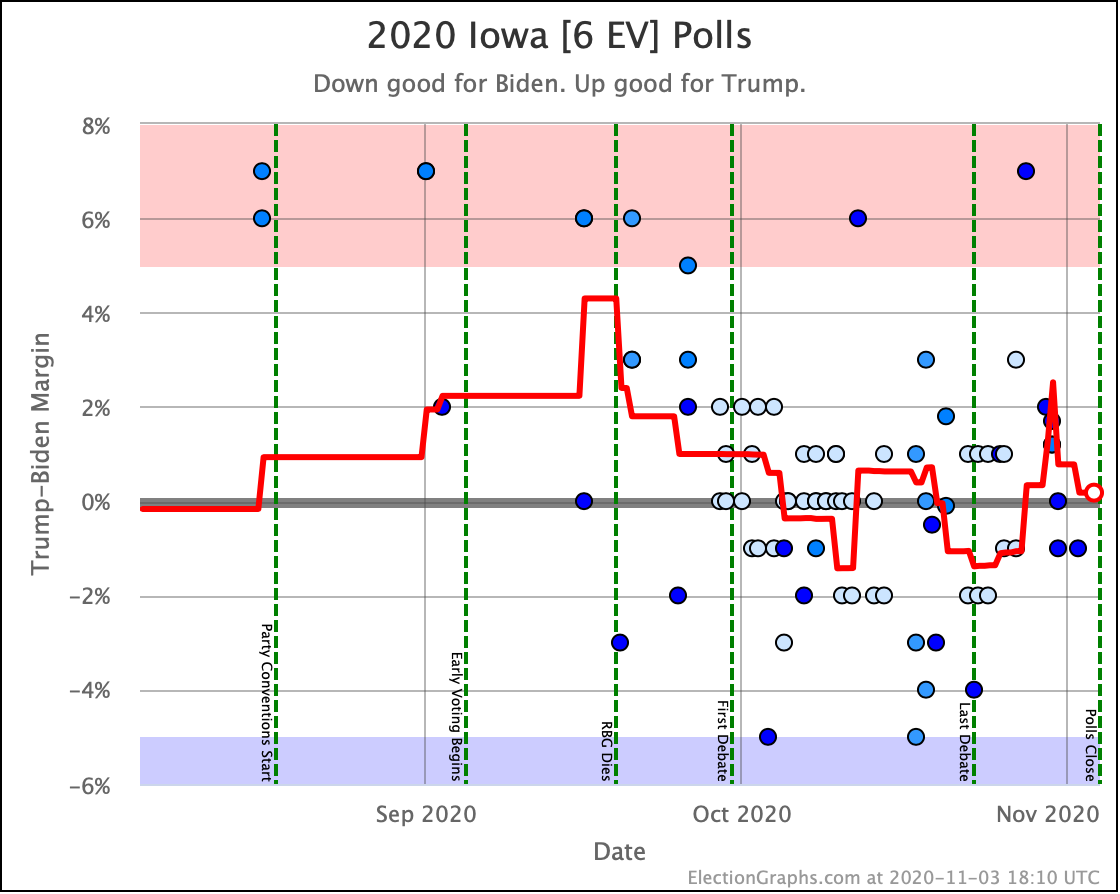
This view makes the volatility of the race clear. There are 10 states (and Maine CD2) with margins less than 5%.
The polling error in 2016 was 2.36%. There are 8 states closer to the centerline than that, including the tipping-point state.
If we get a 2016 size error favoring Trump, we get a very narrow win for Trump, squeaking past the post with an 18 EV margin.
If we get a 2016 size error favoring Biden, Biden wins by 288 EV, the largest winning margin since 1988.
More likely than either extreme of course is that we just get a solid but not extraordinary Biden win.
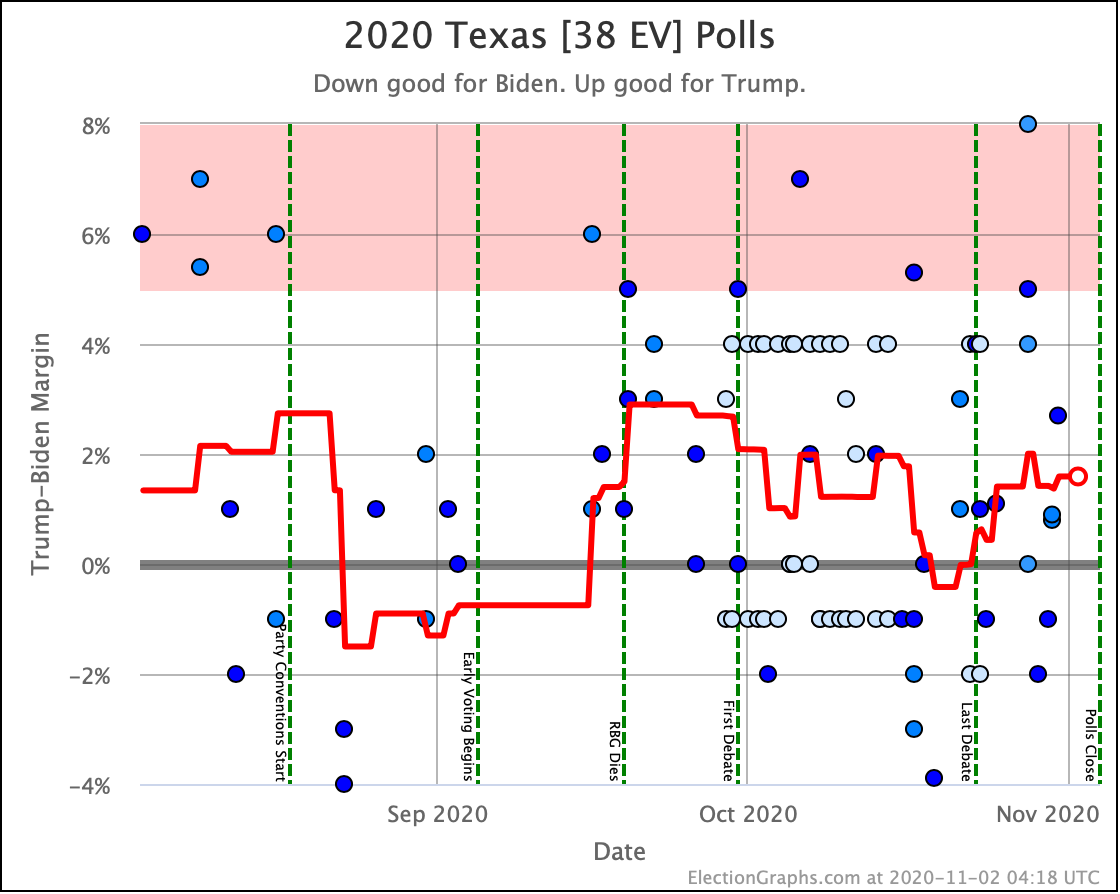
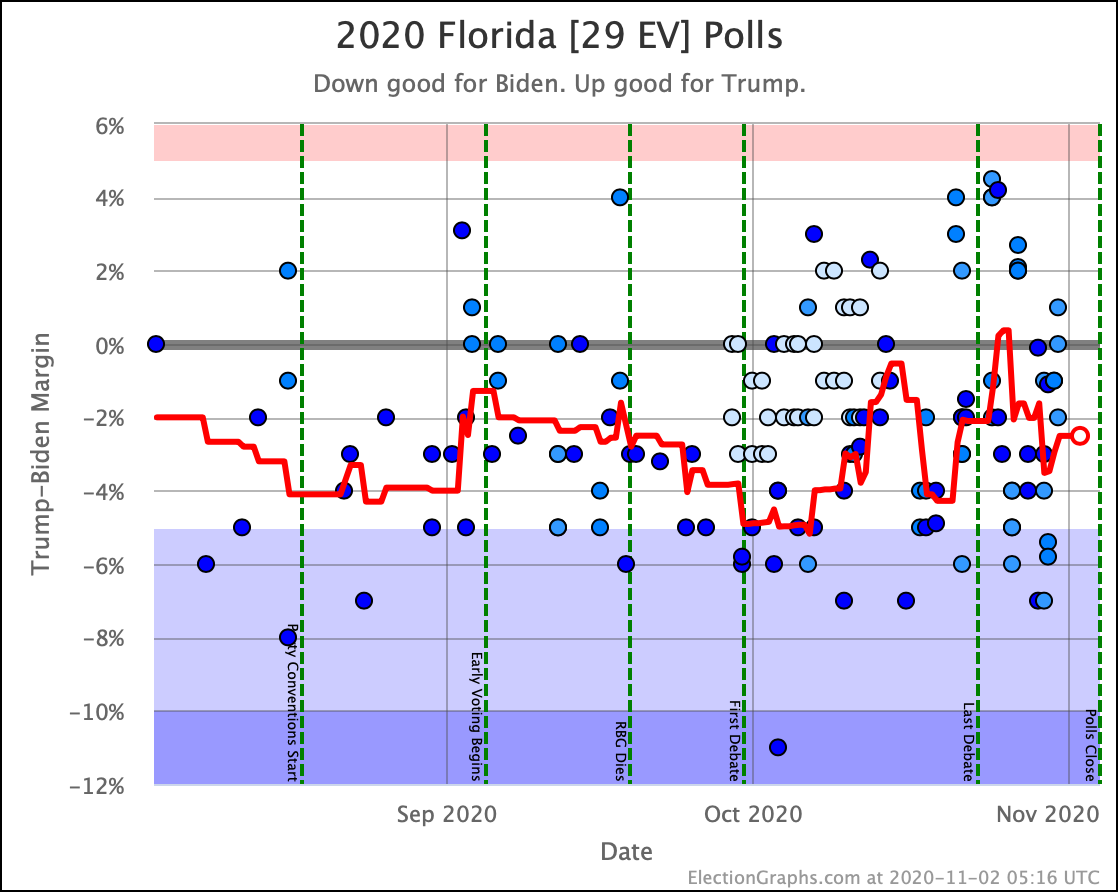
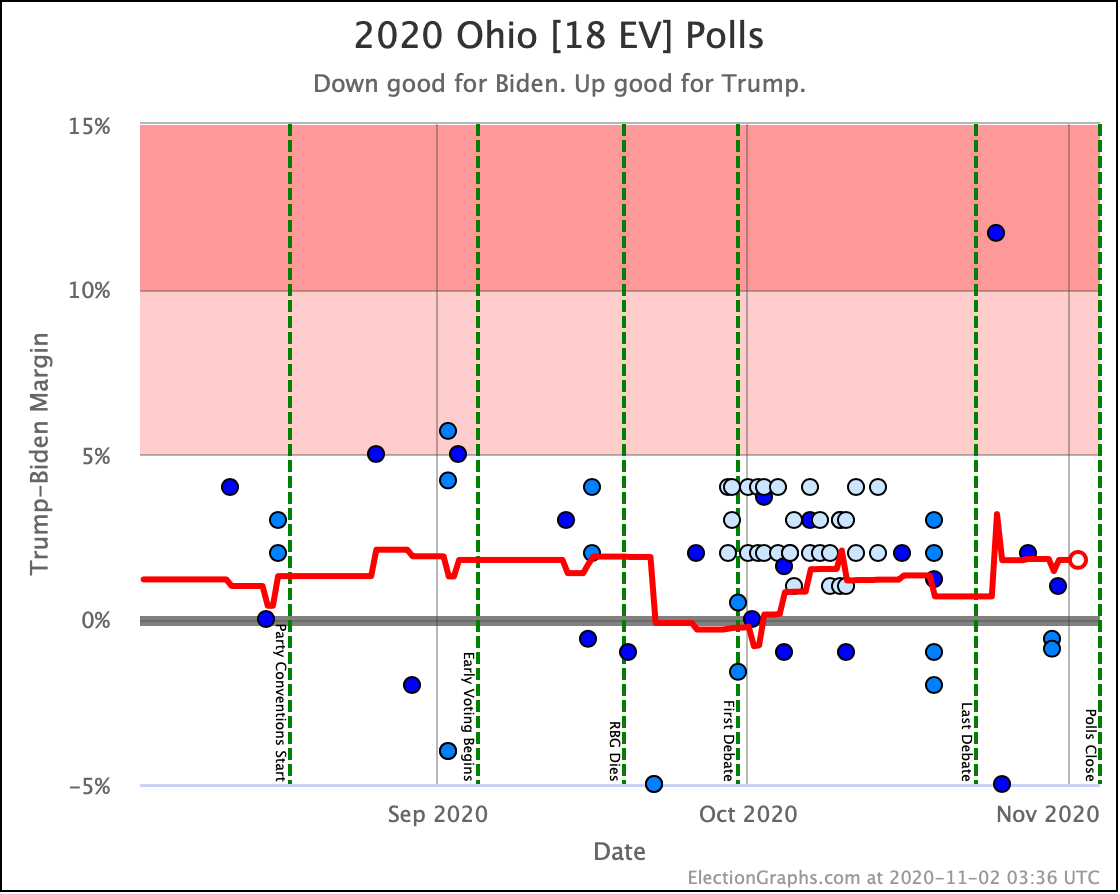
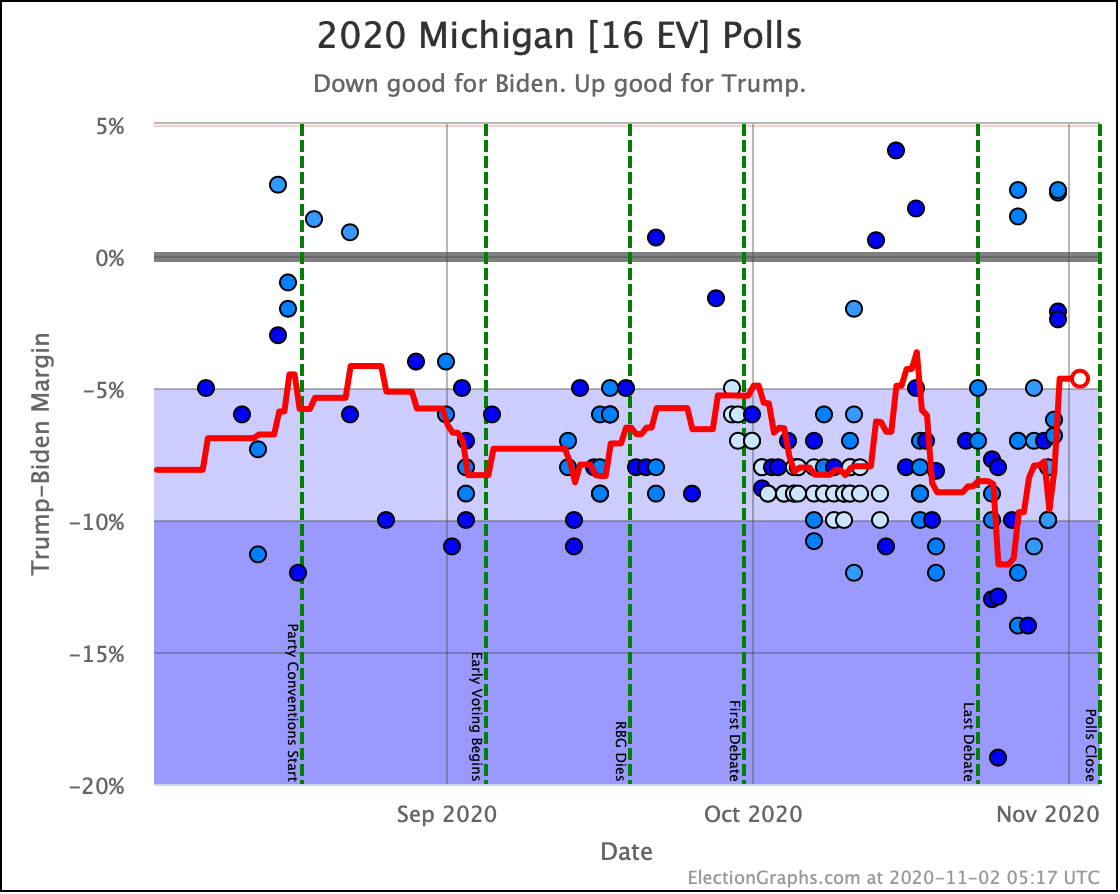
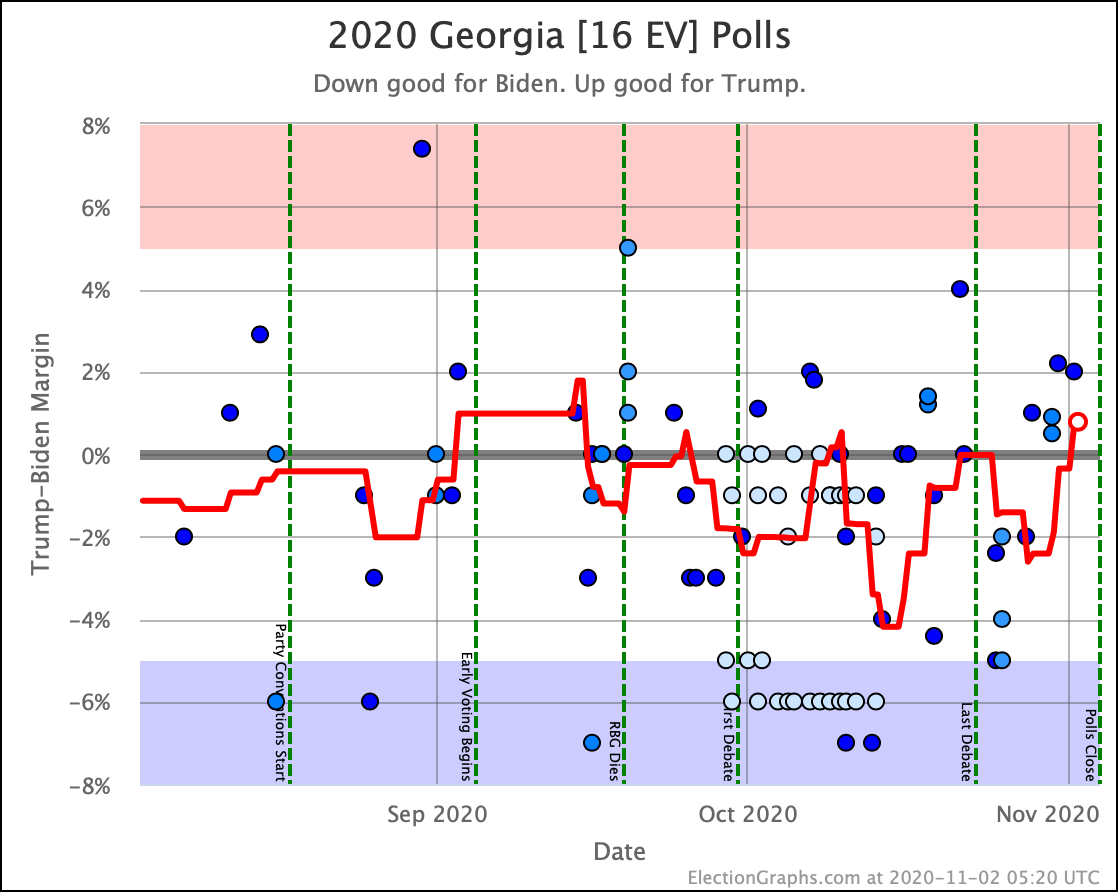
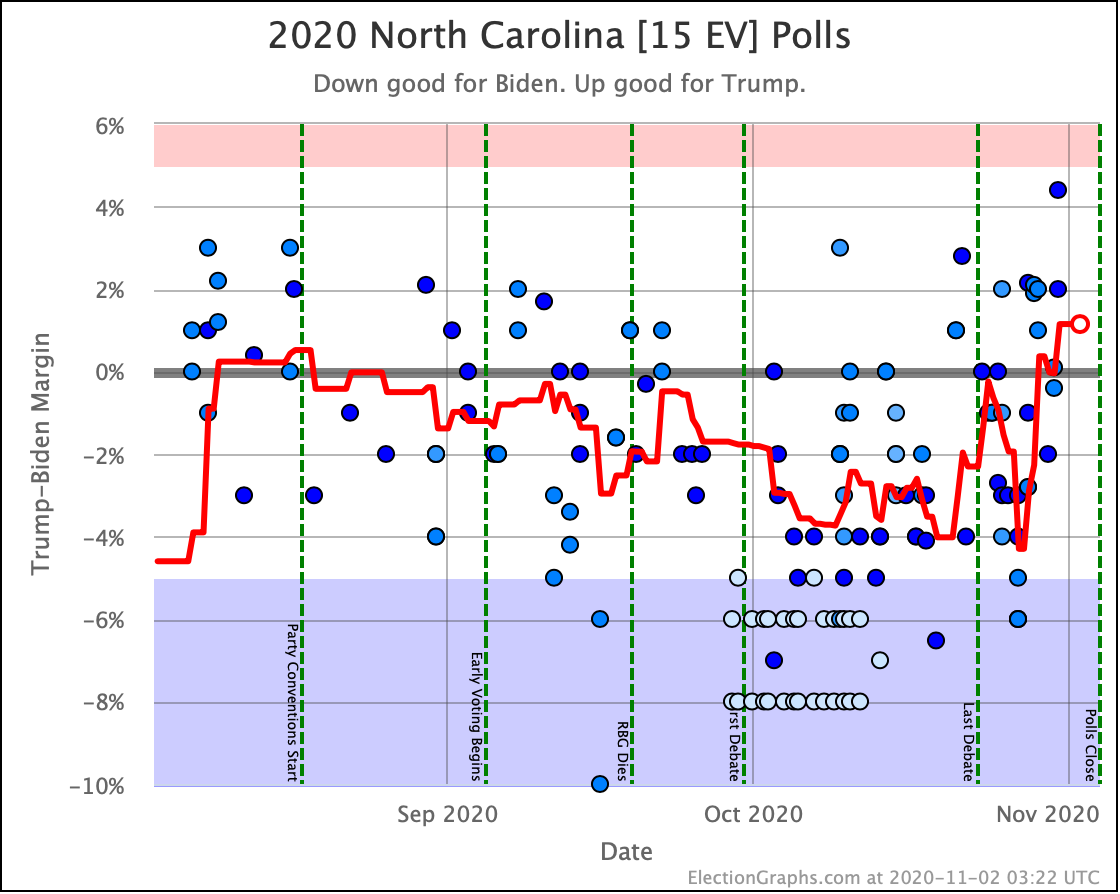
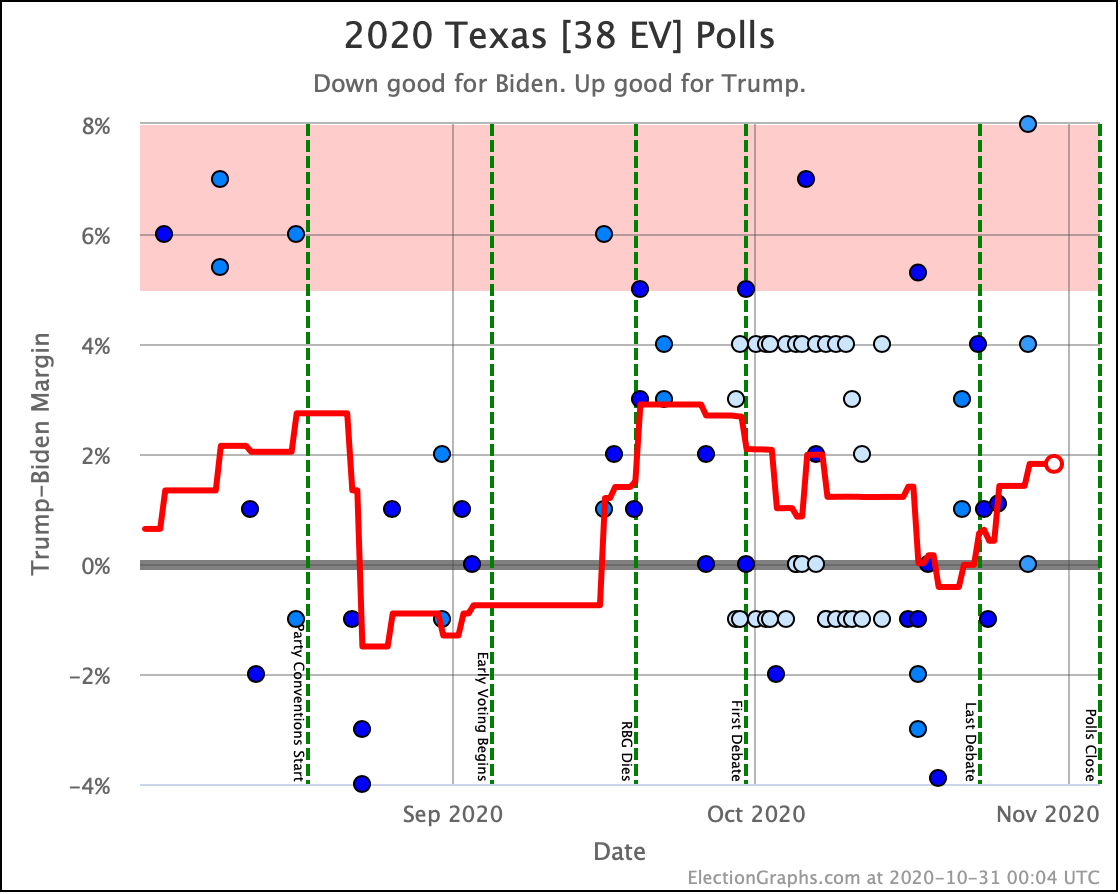
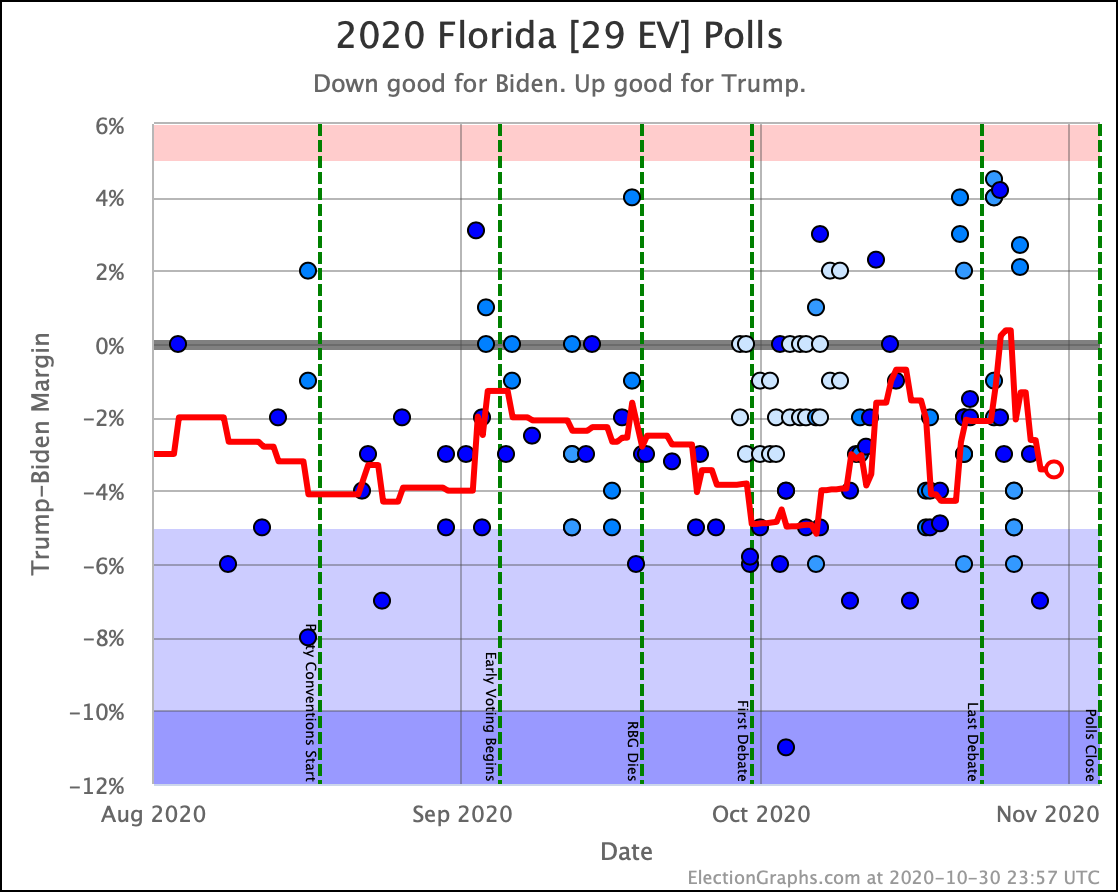
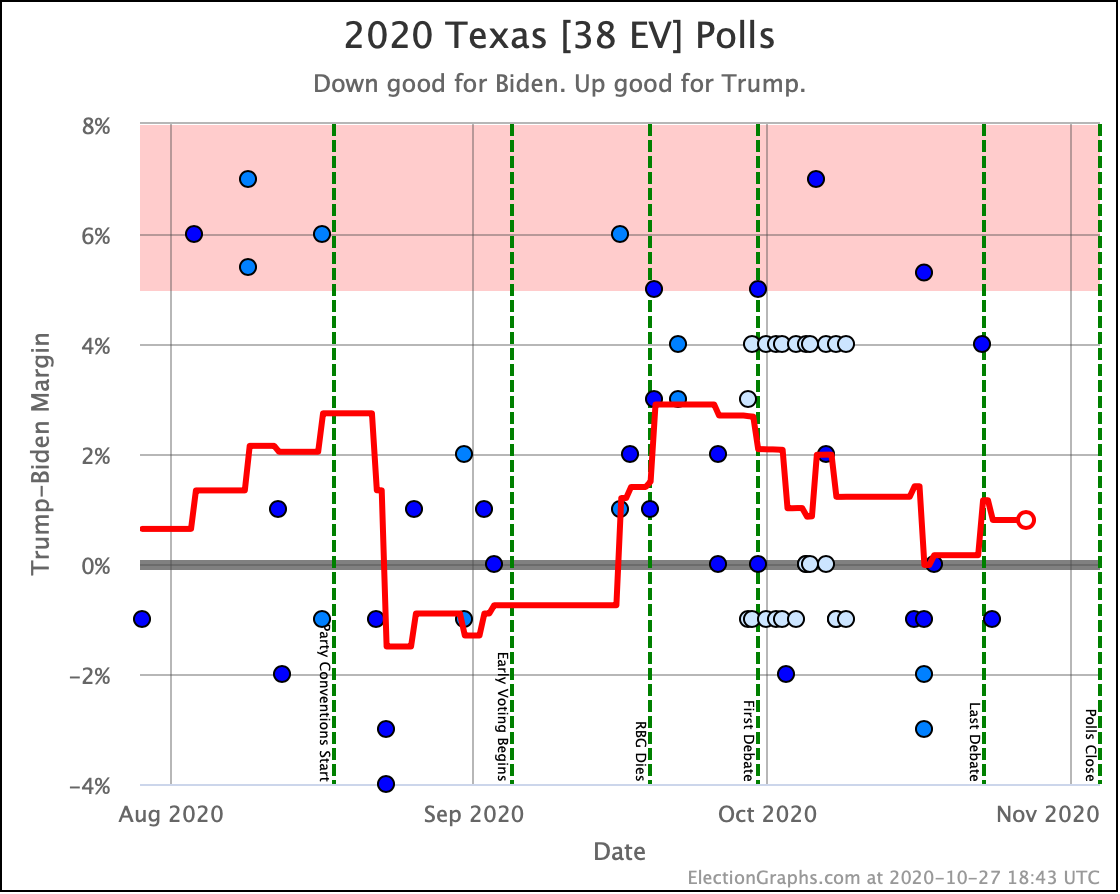
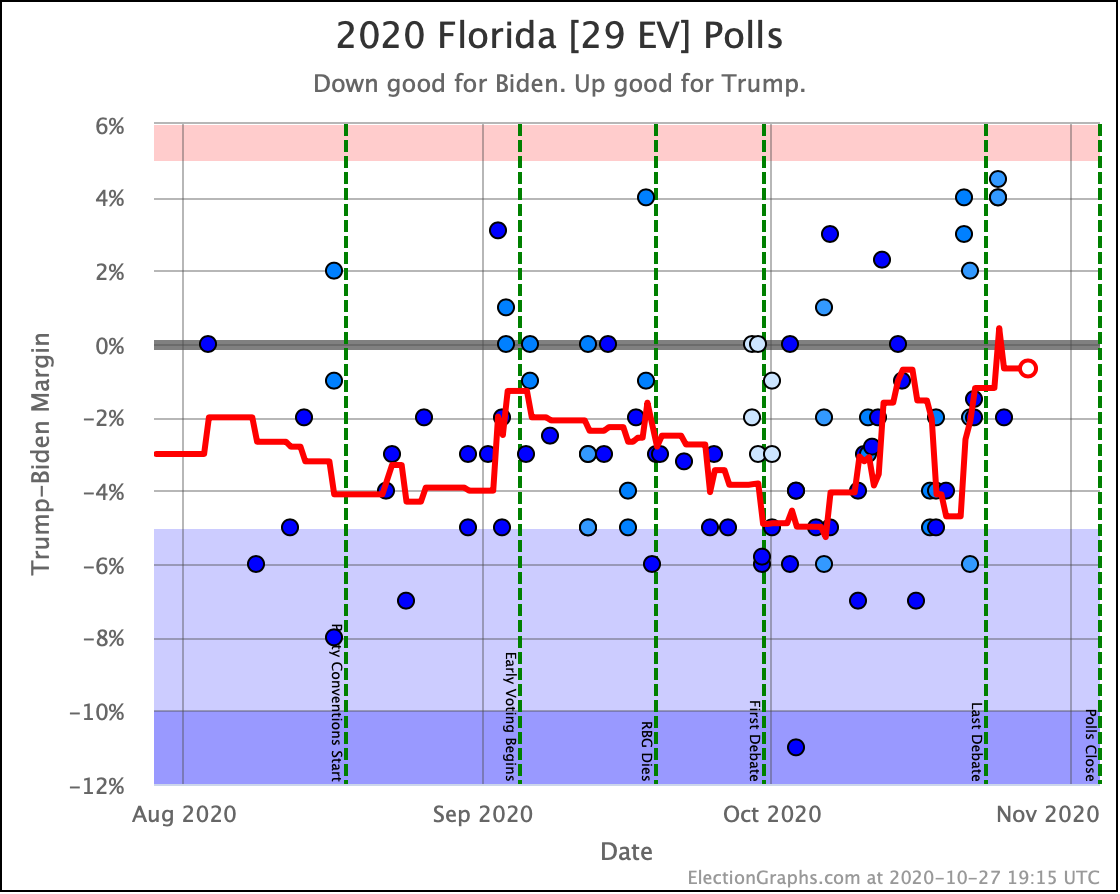
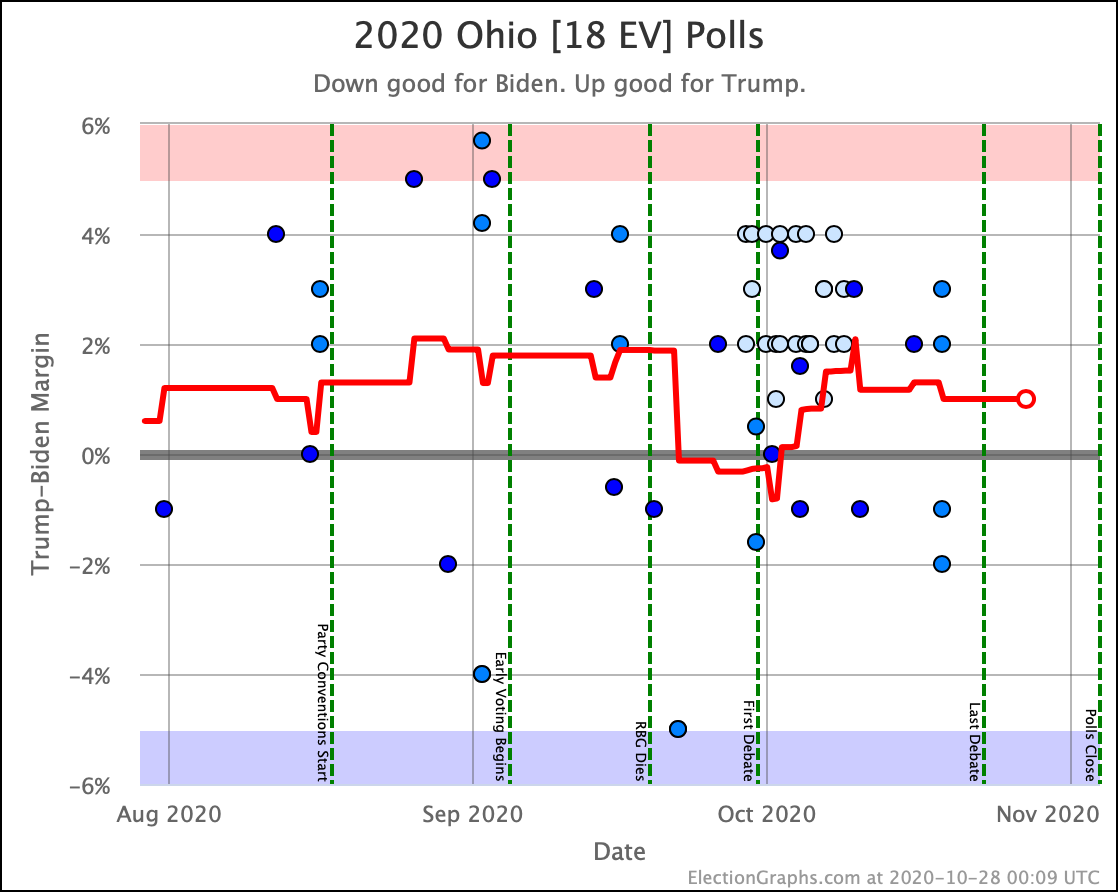
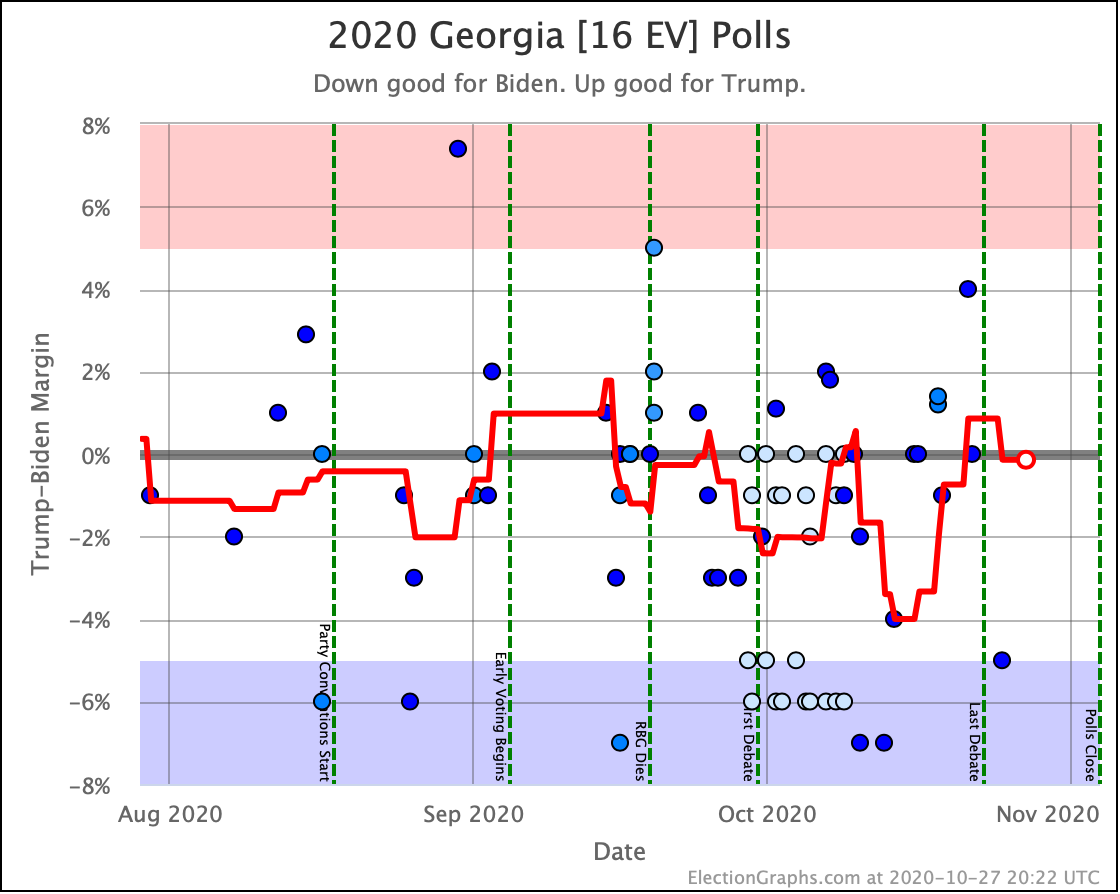
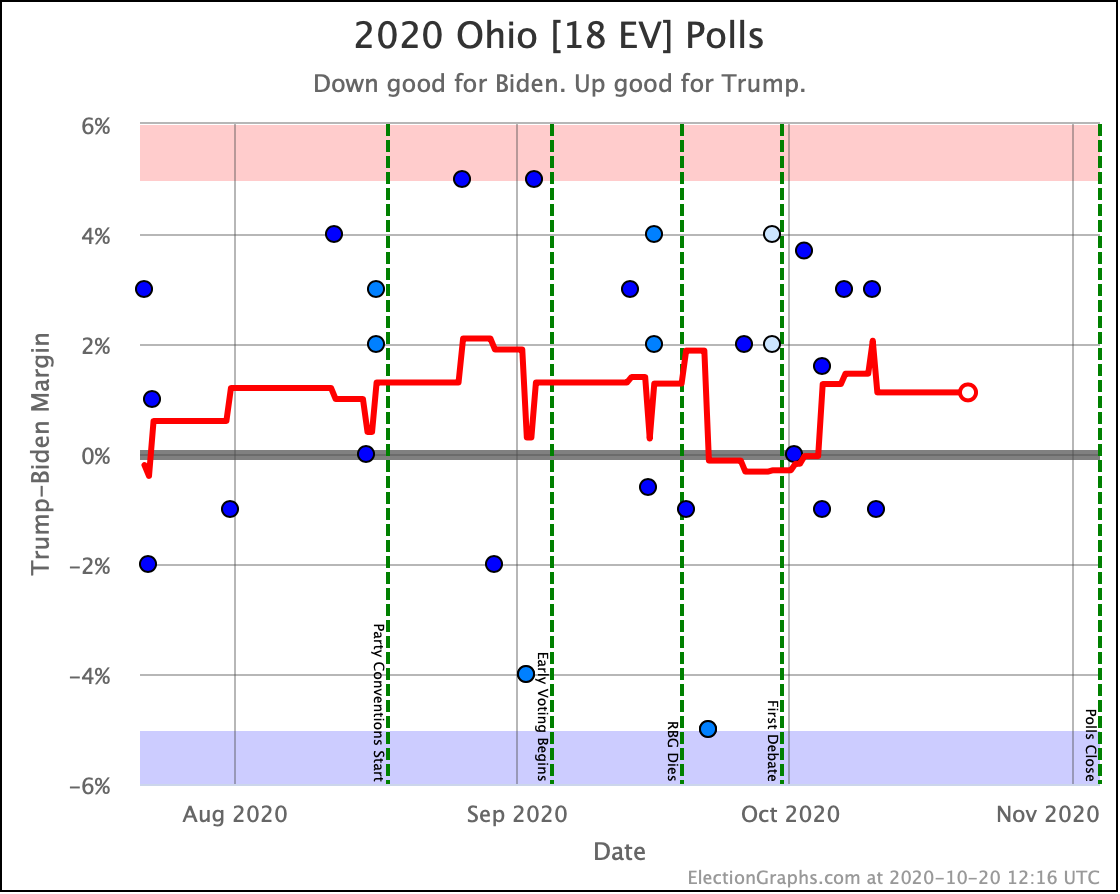
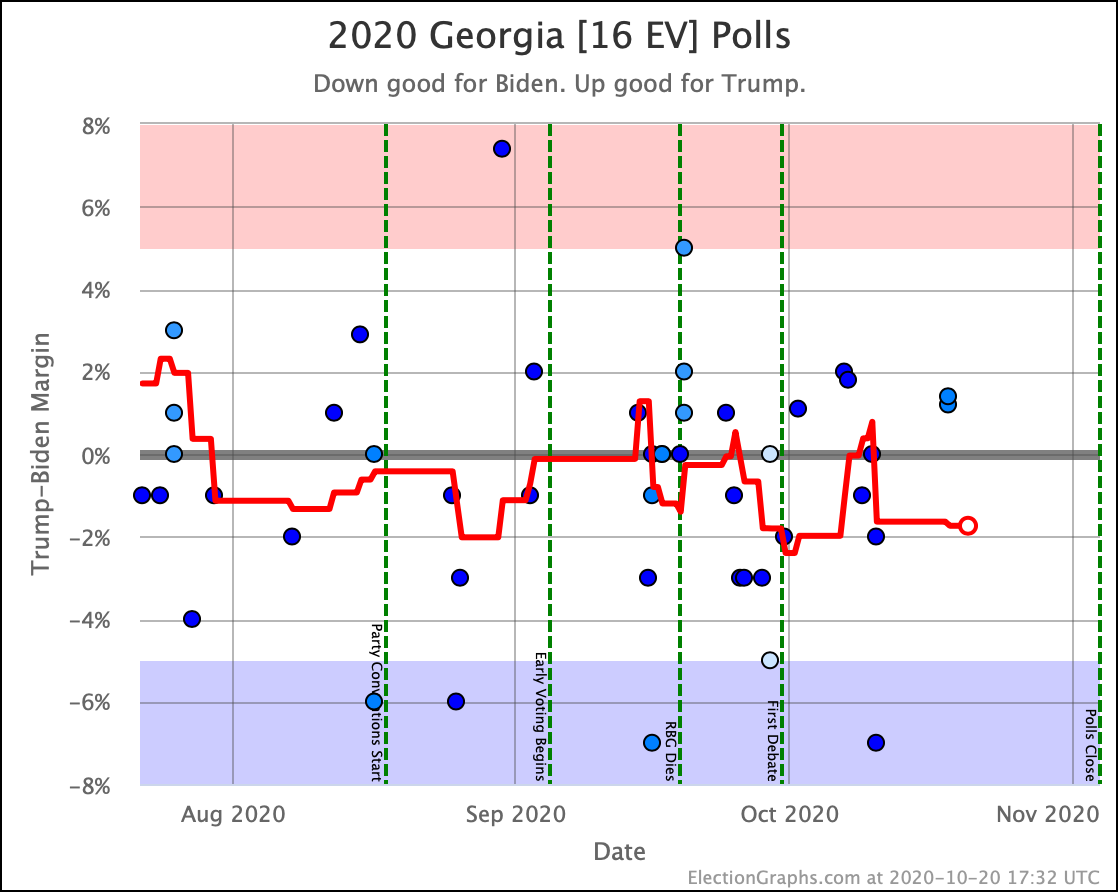
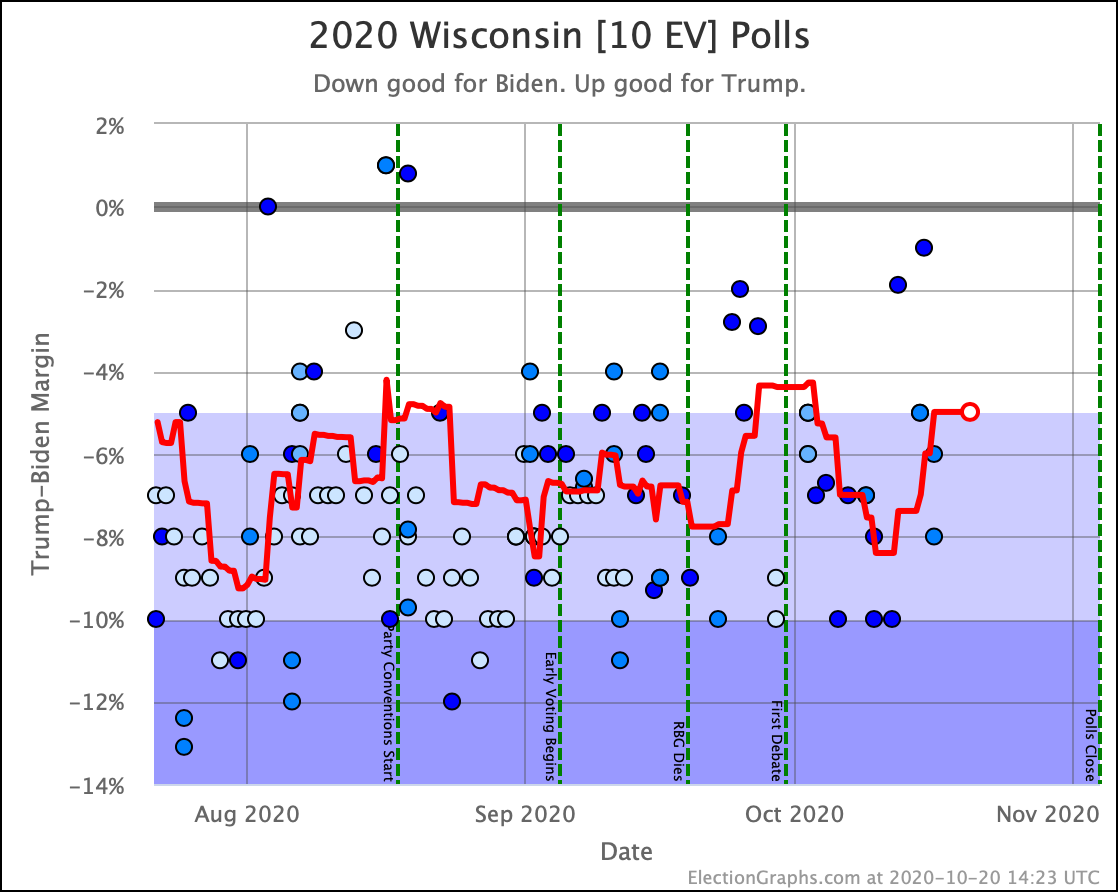
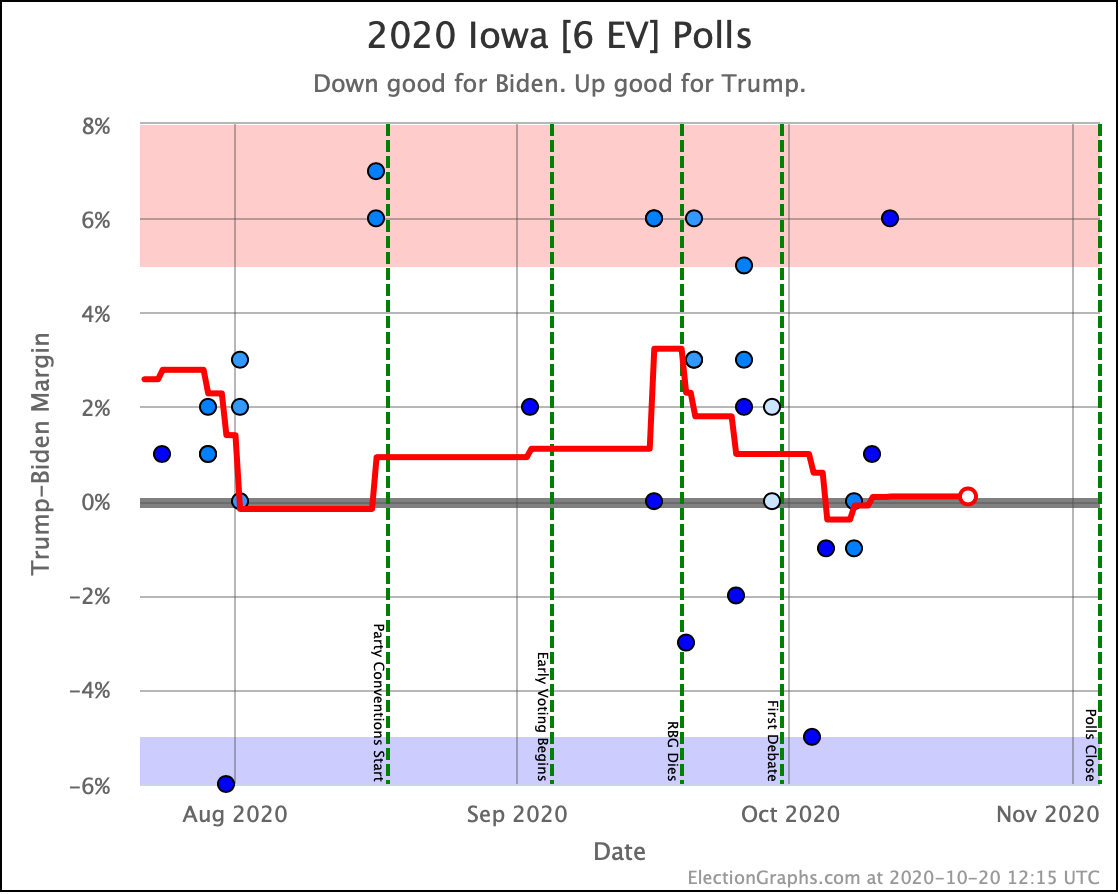
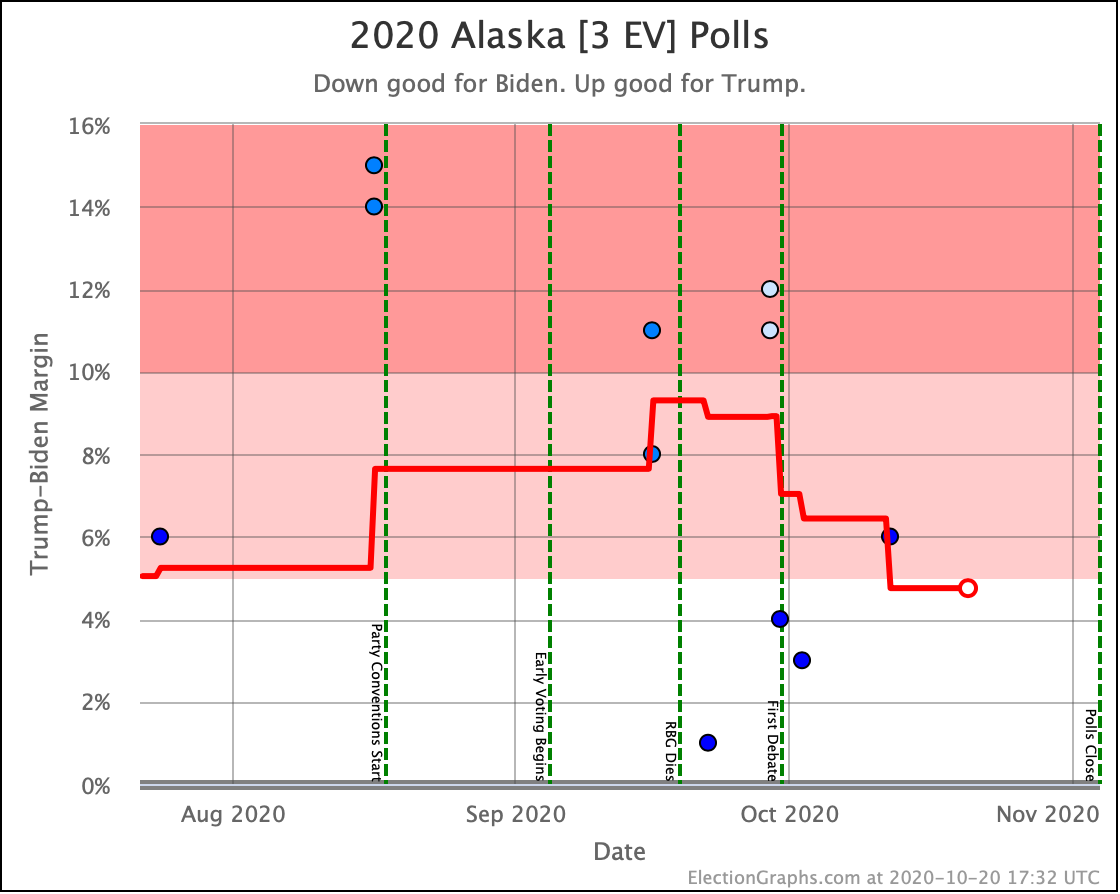
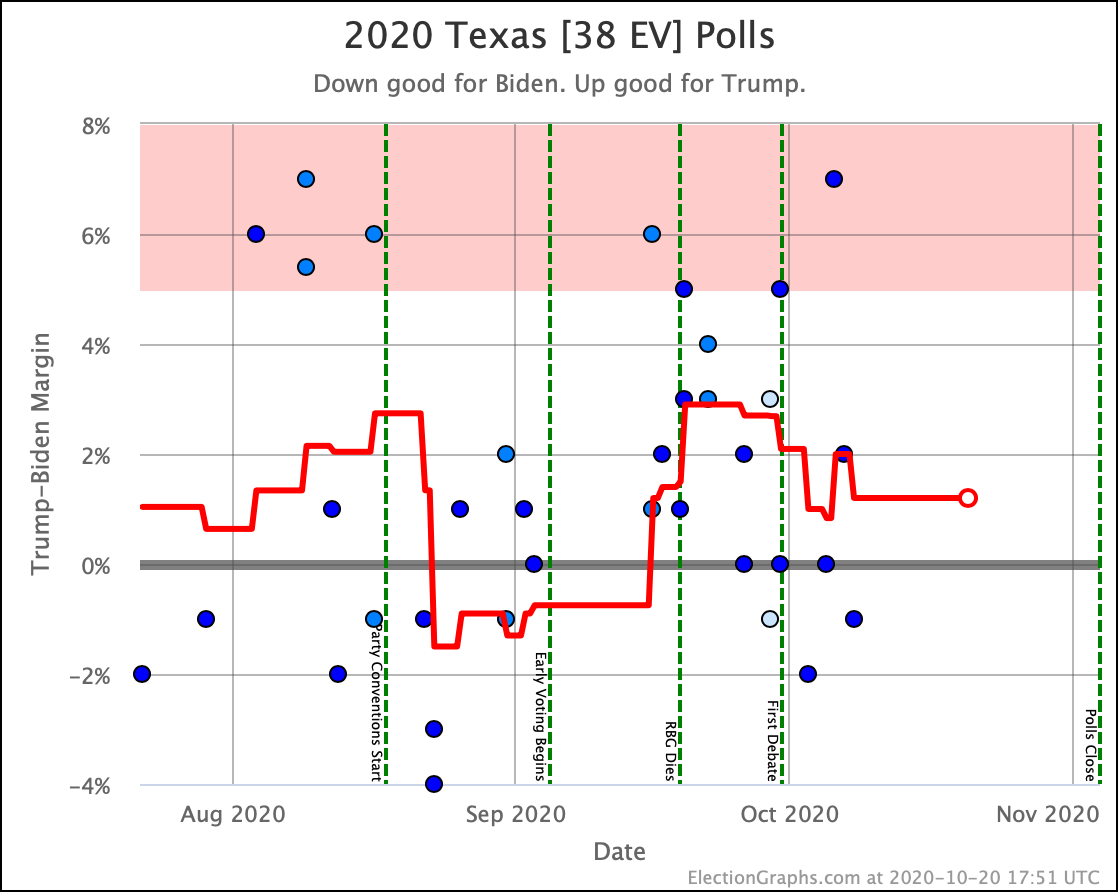
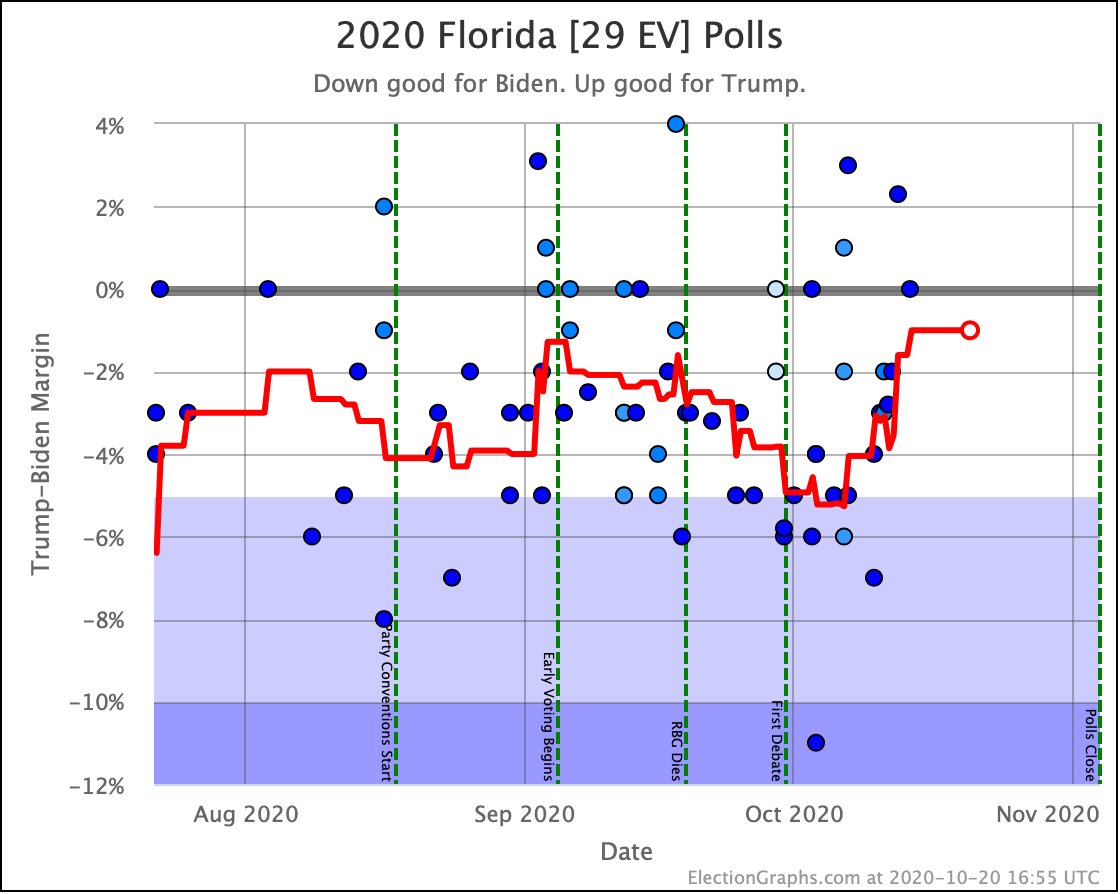
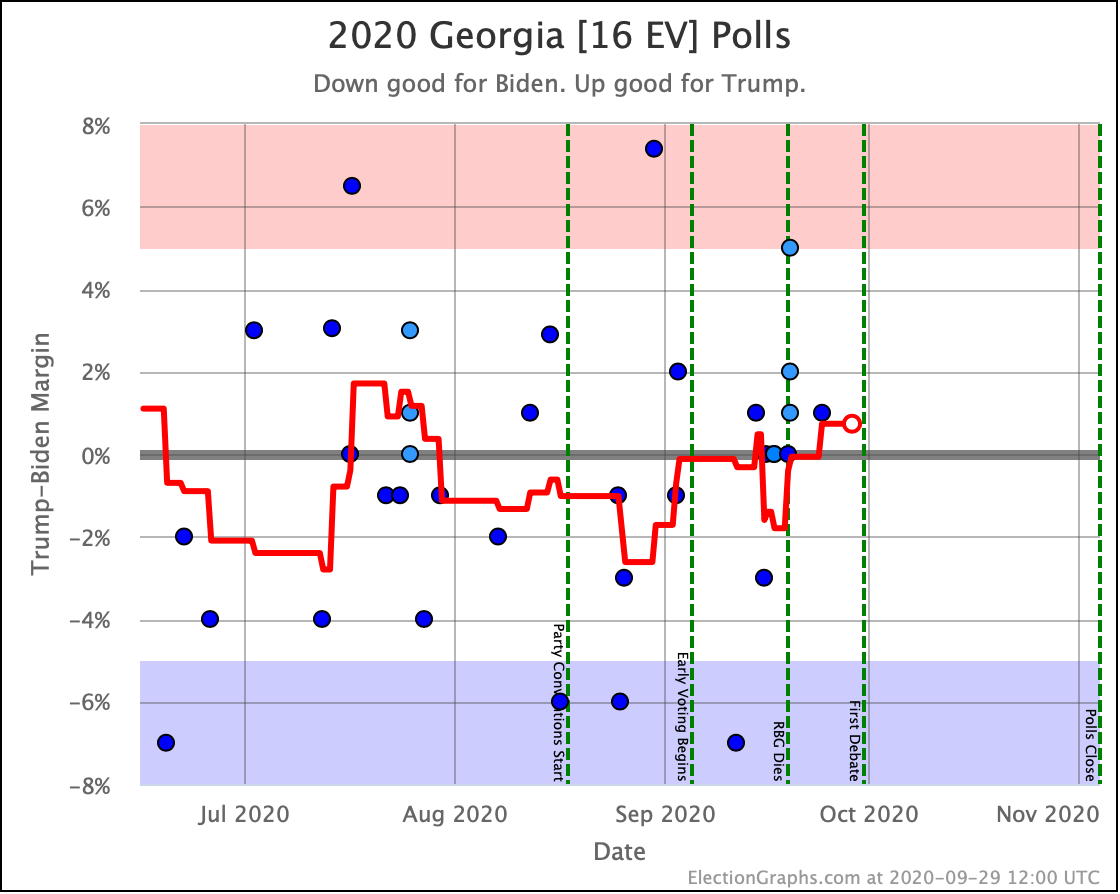
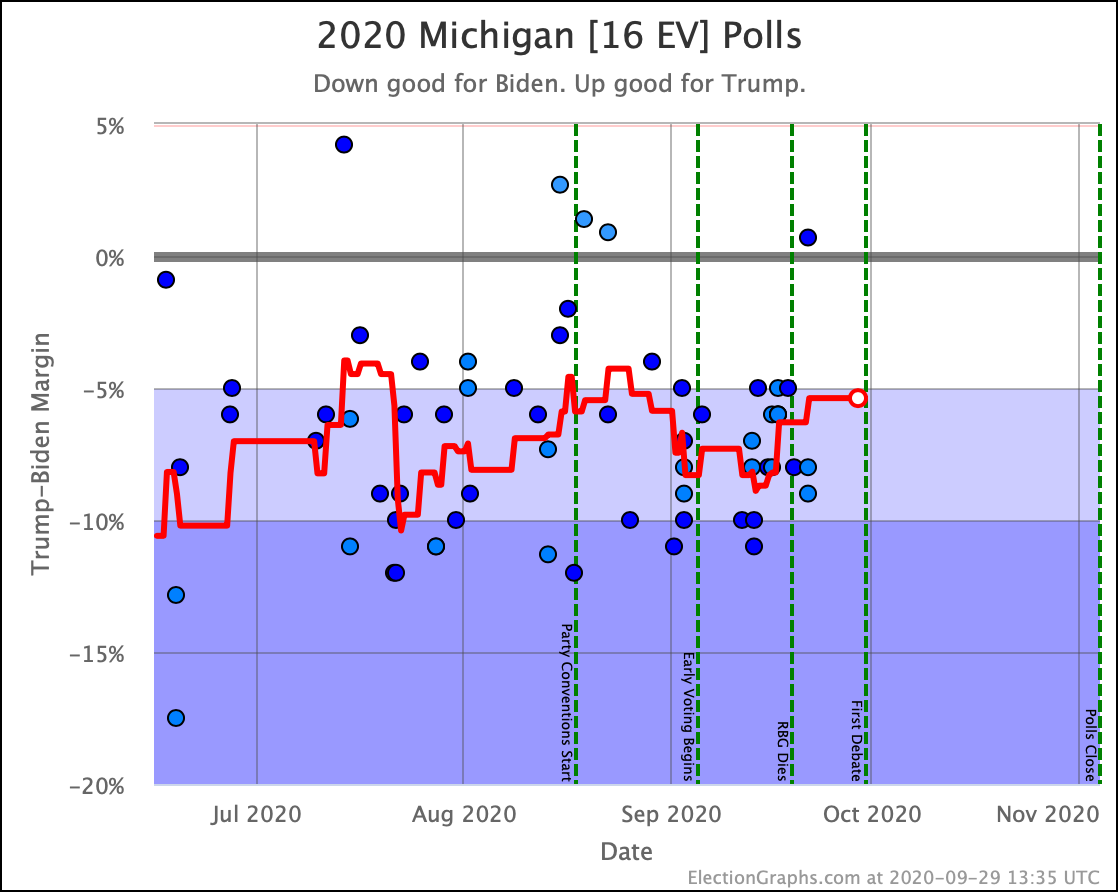
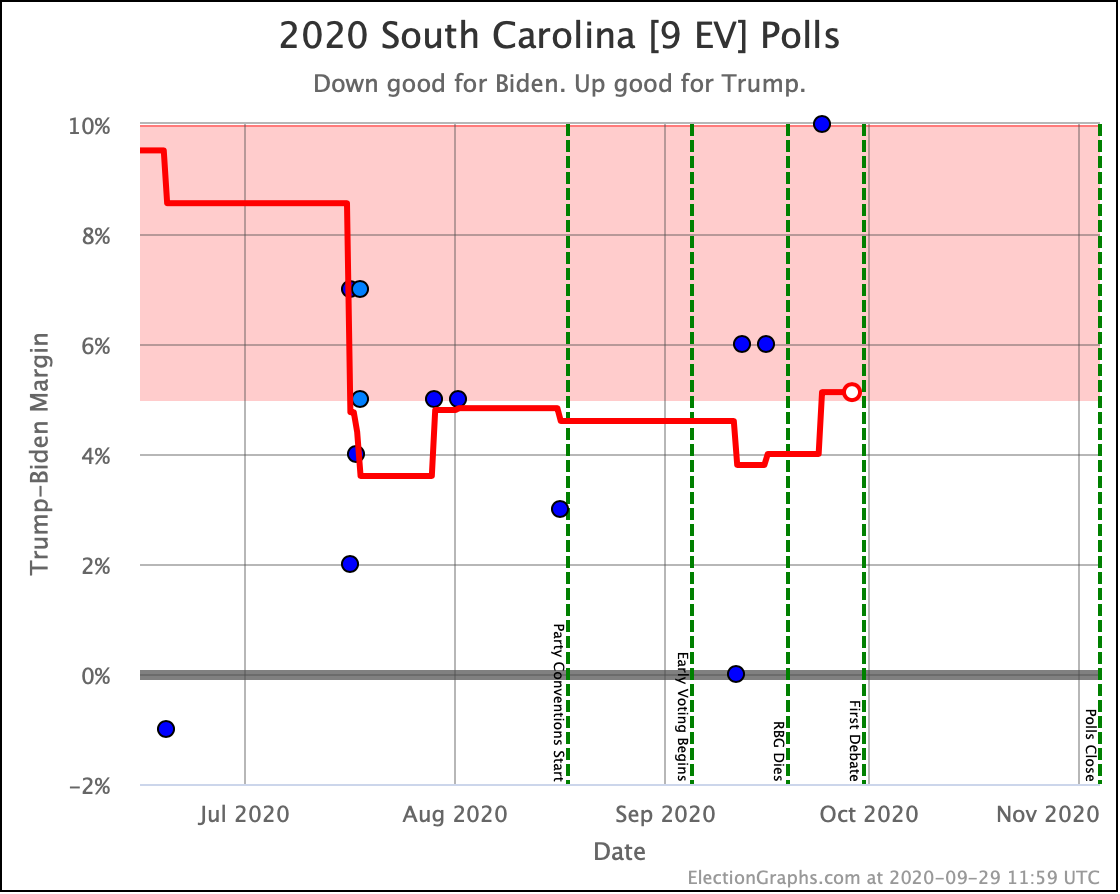
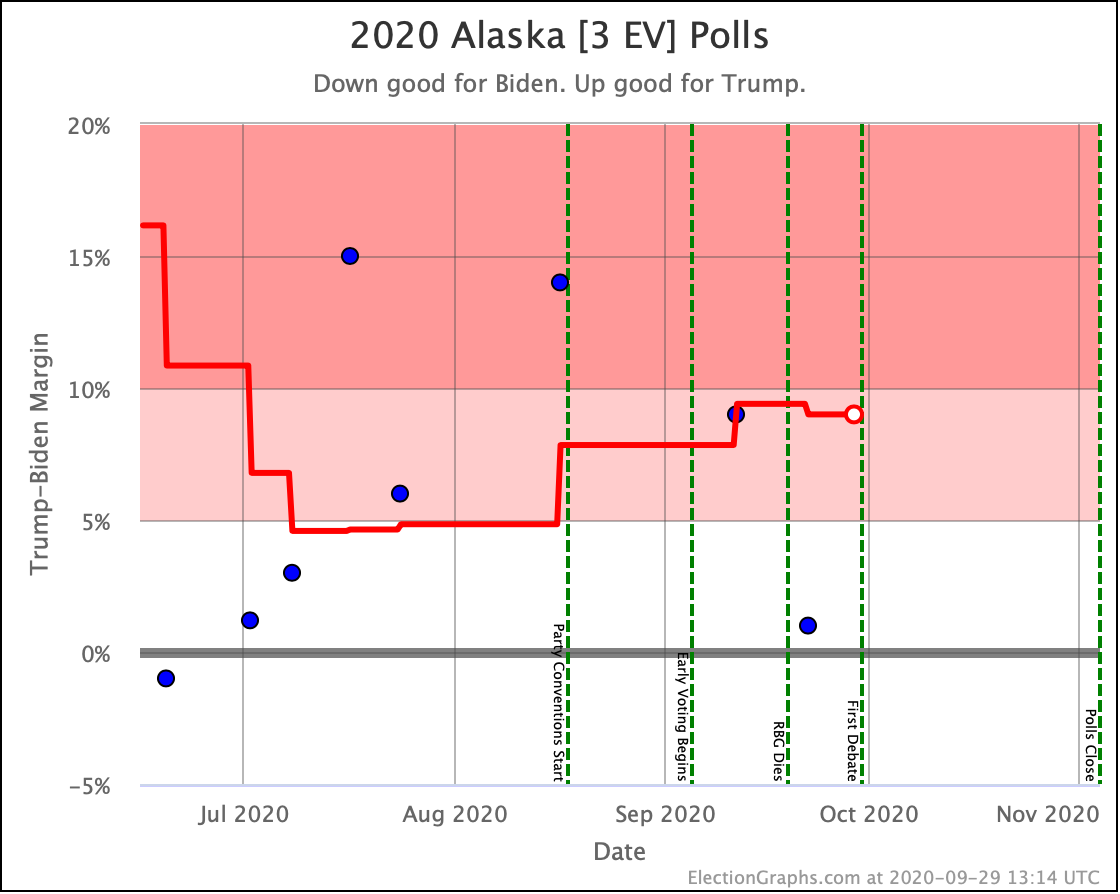
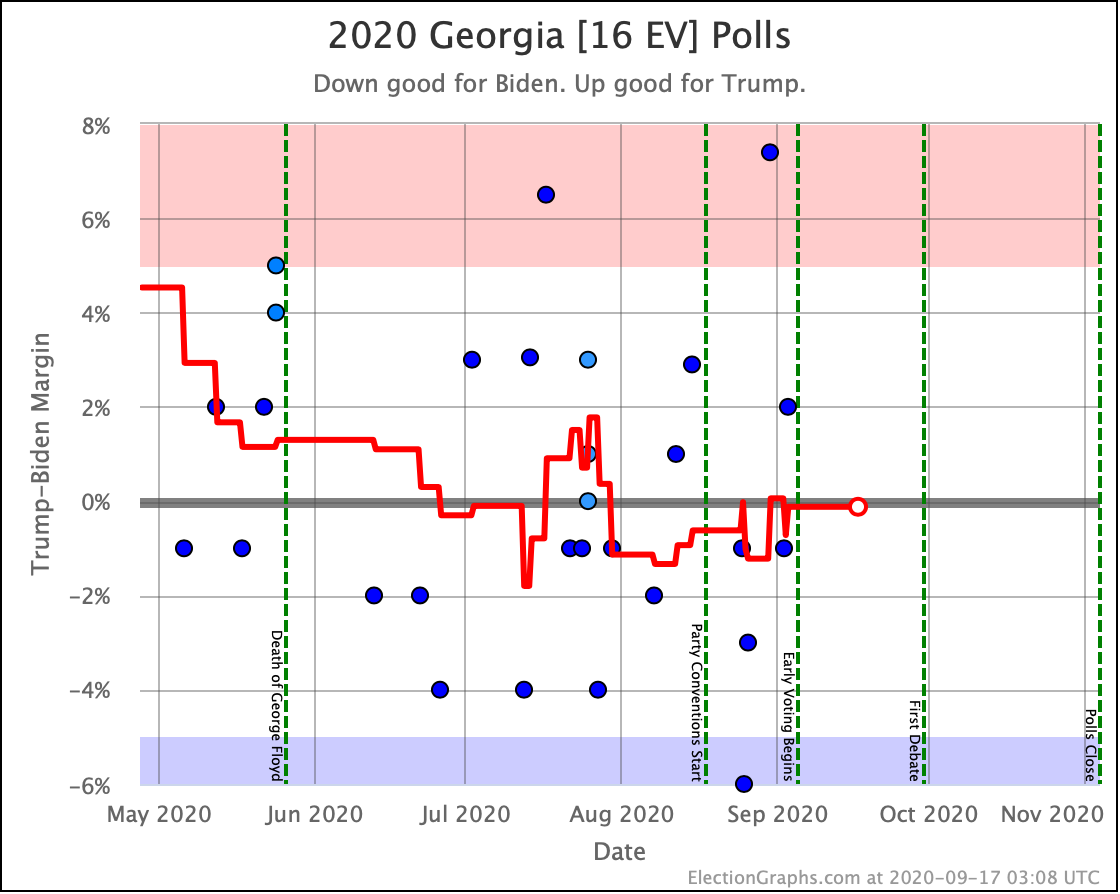
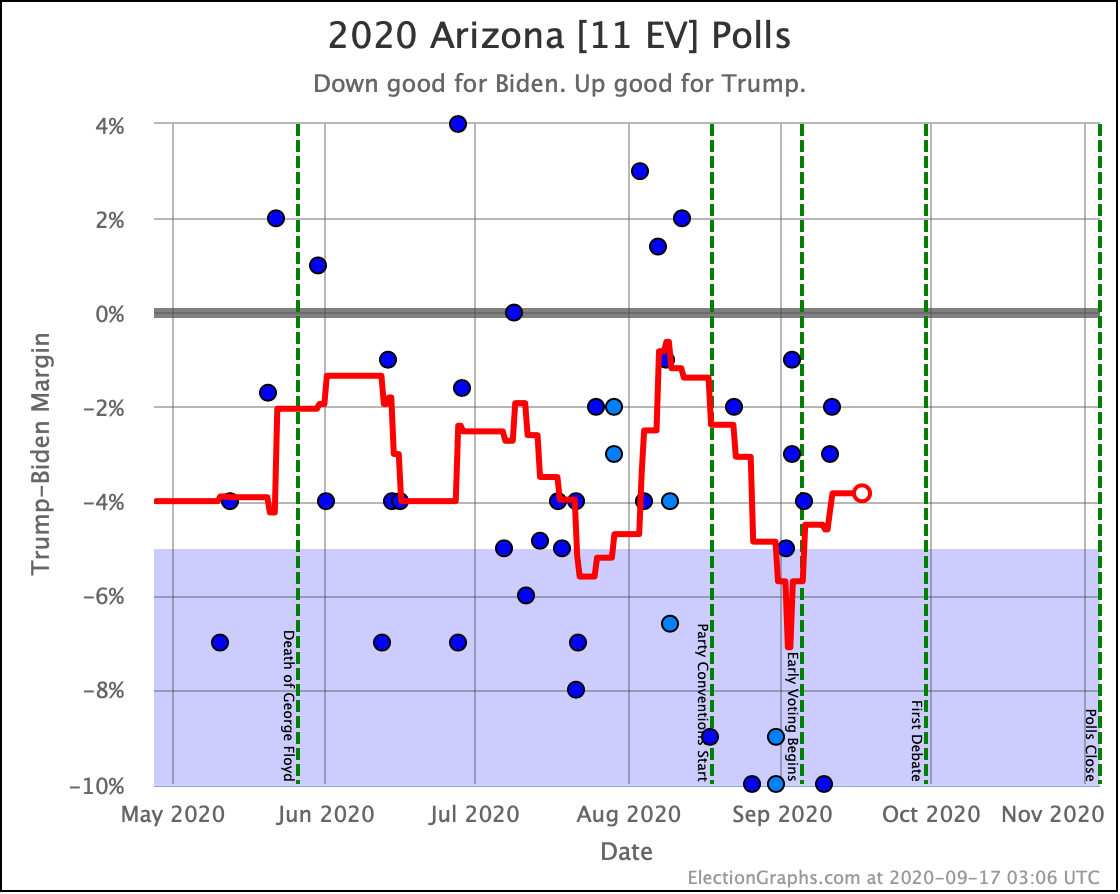
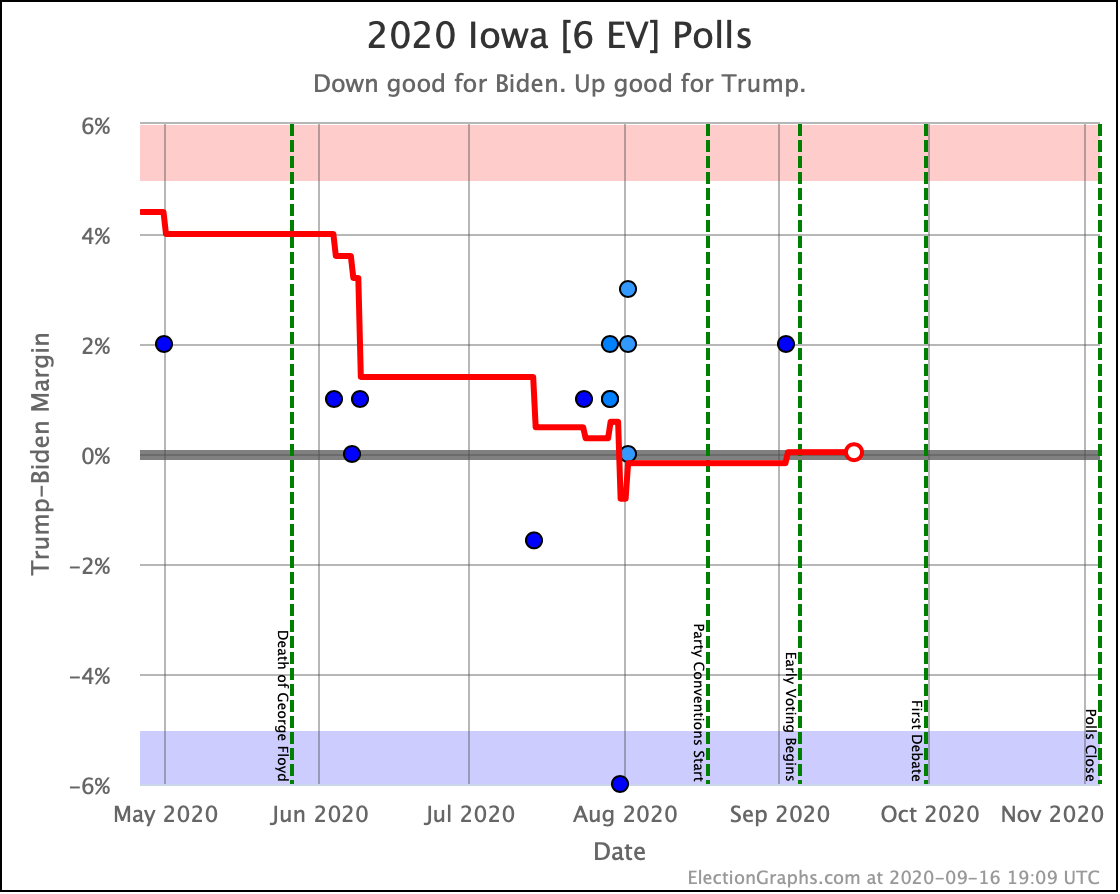
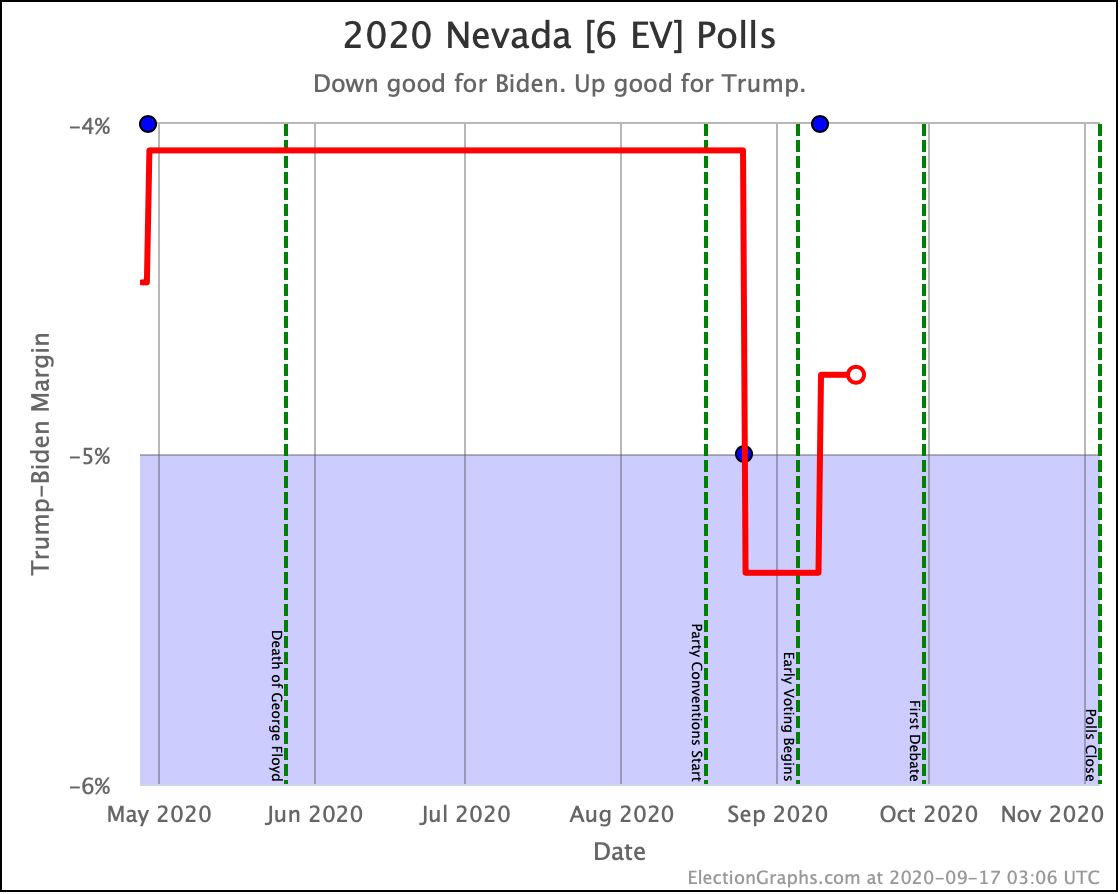
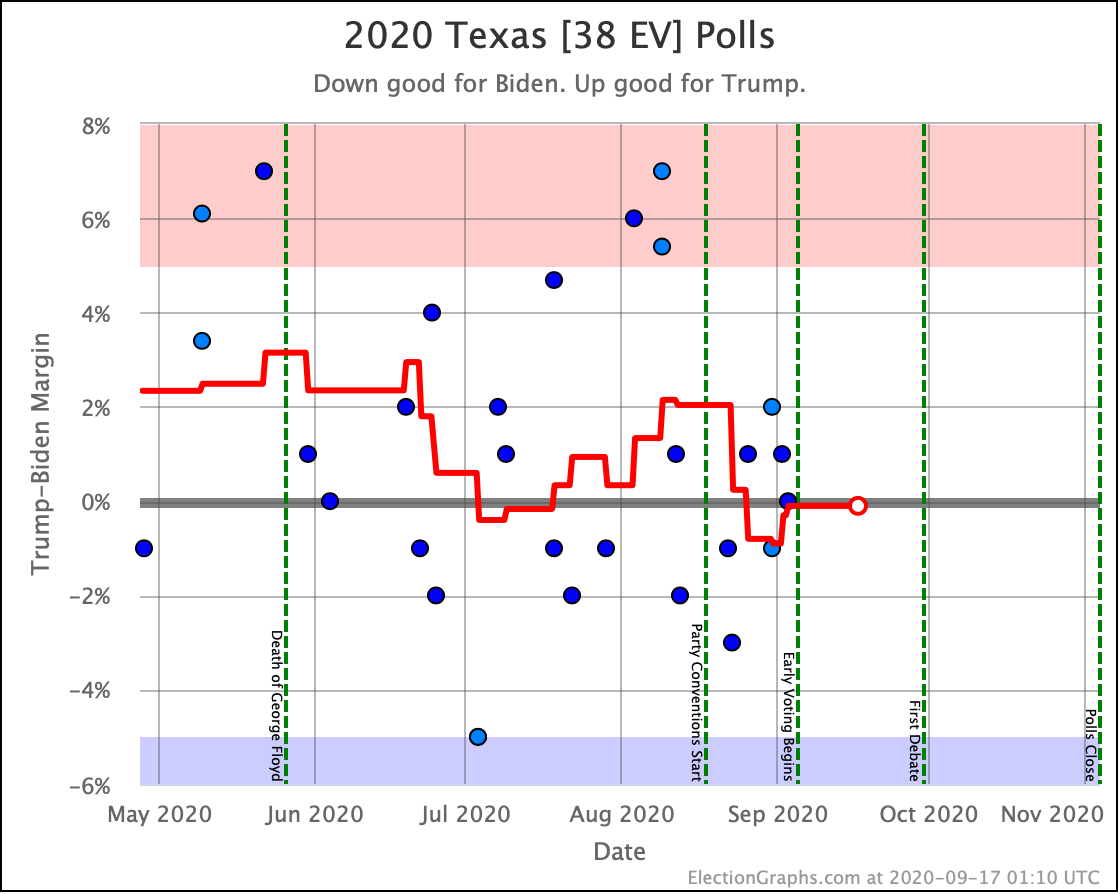
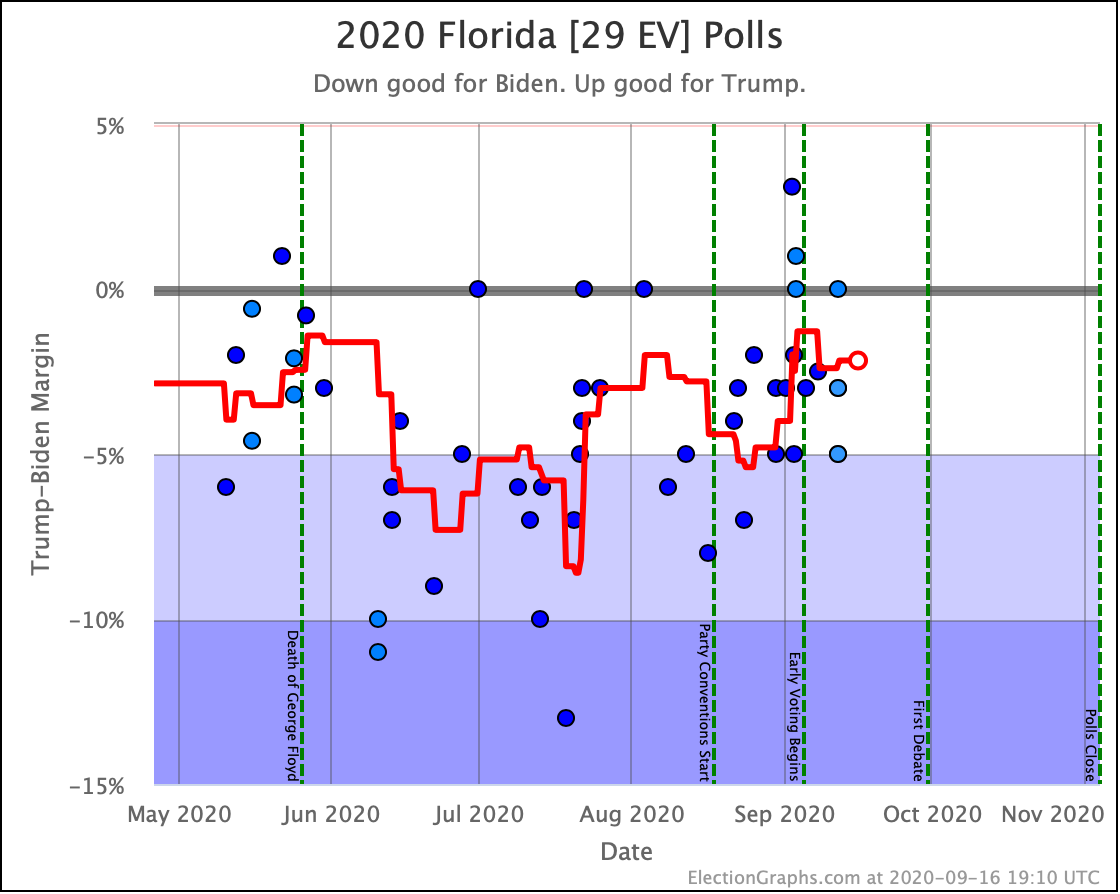
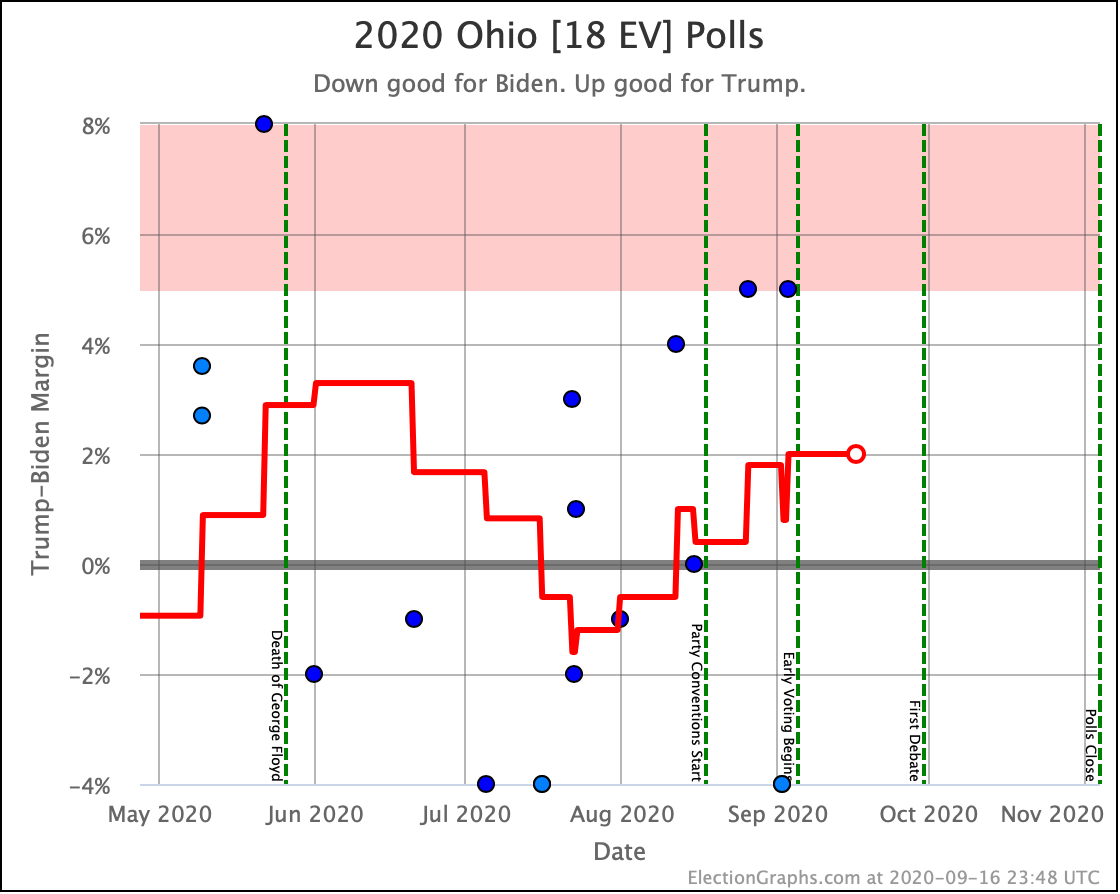
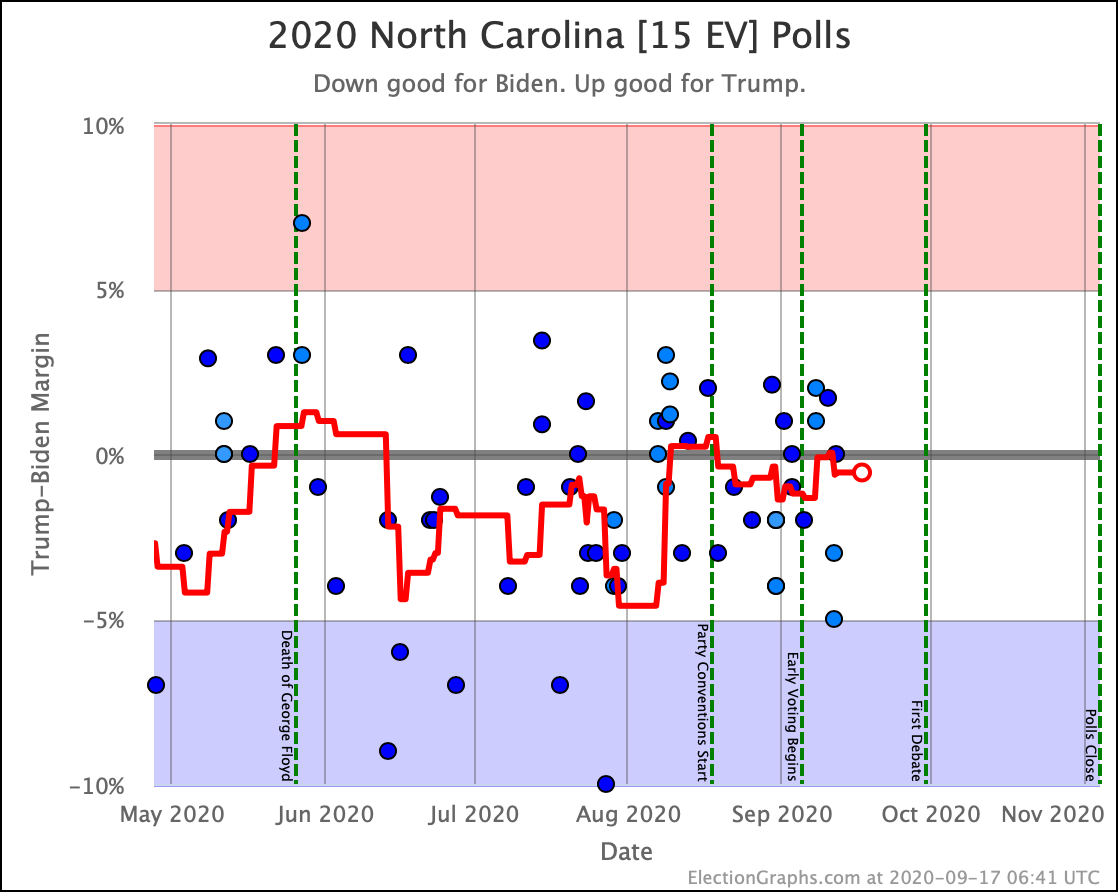
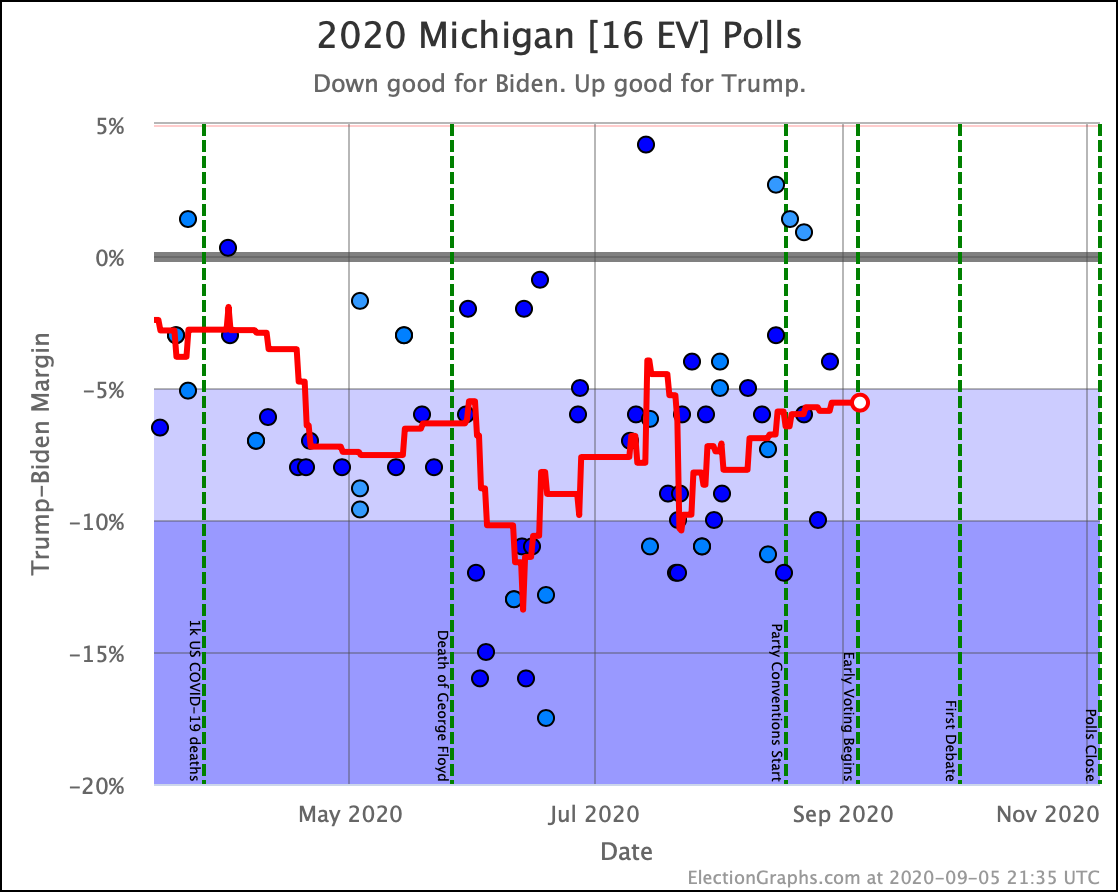
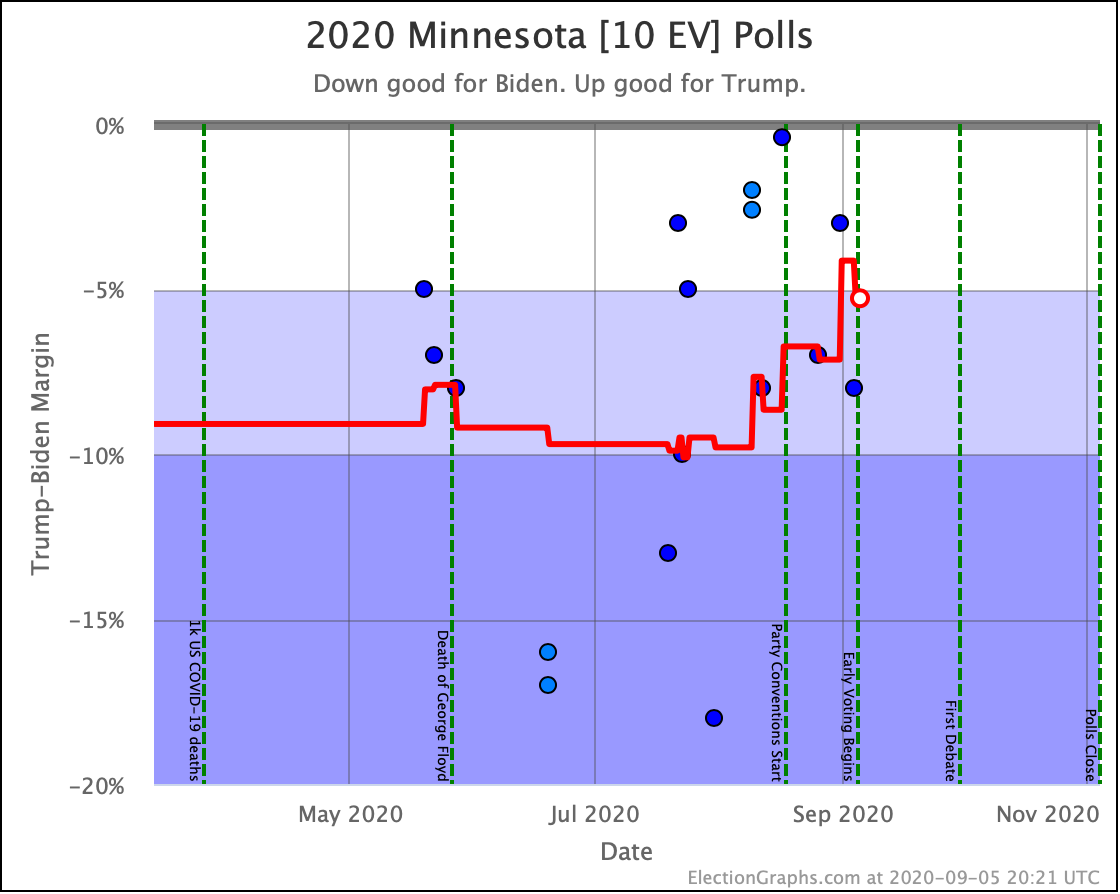
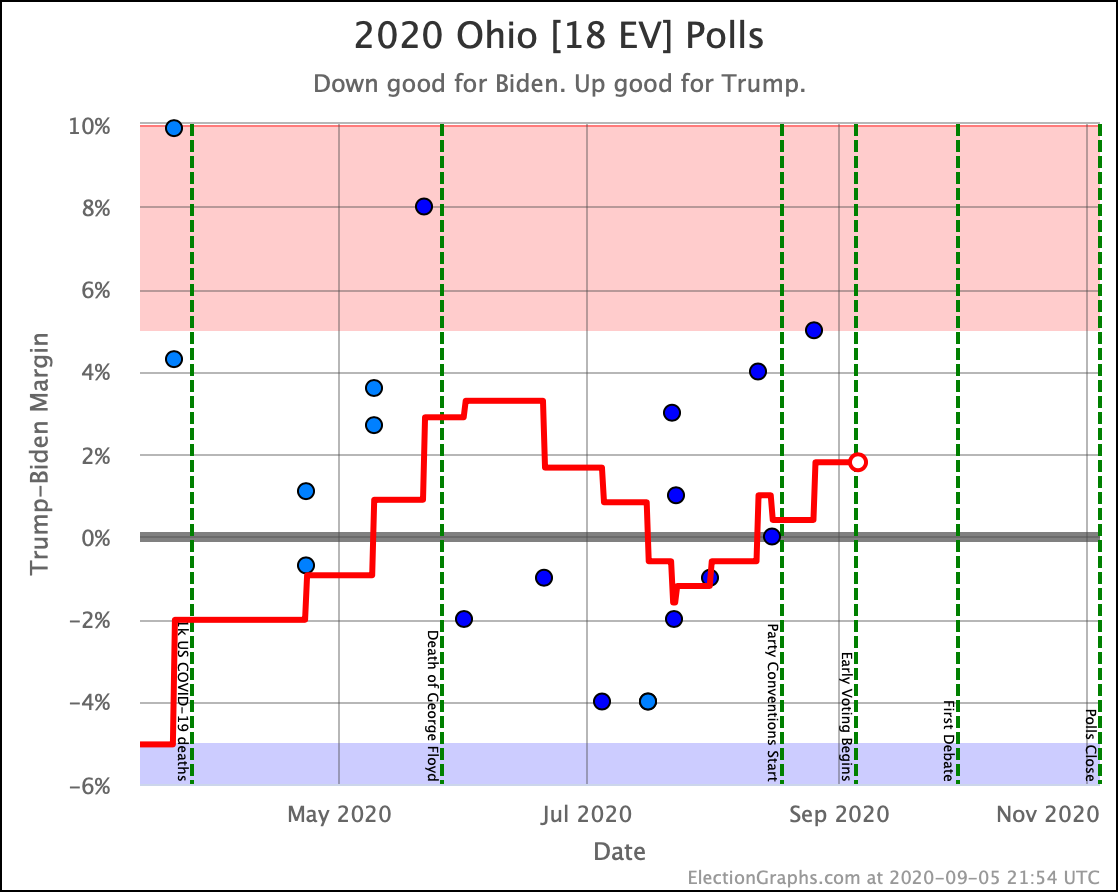
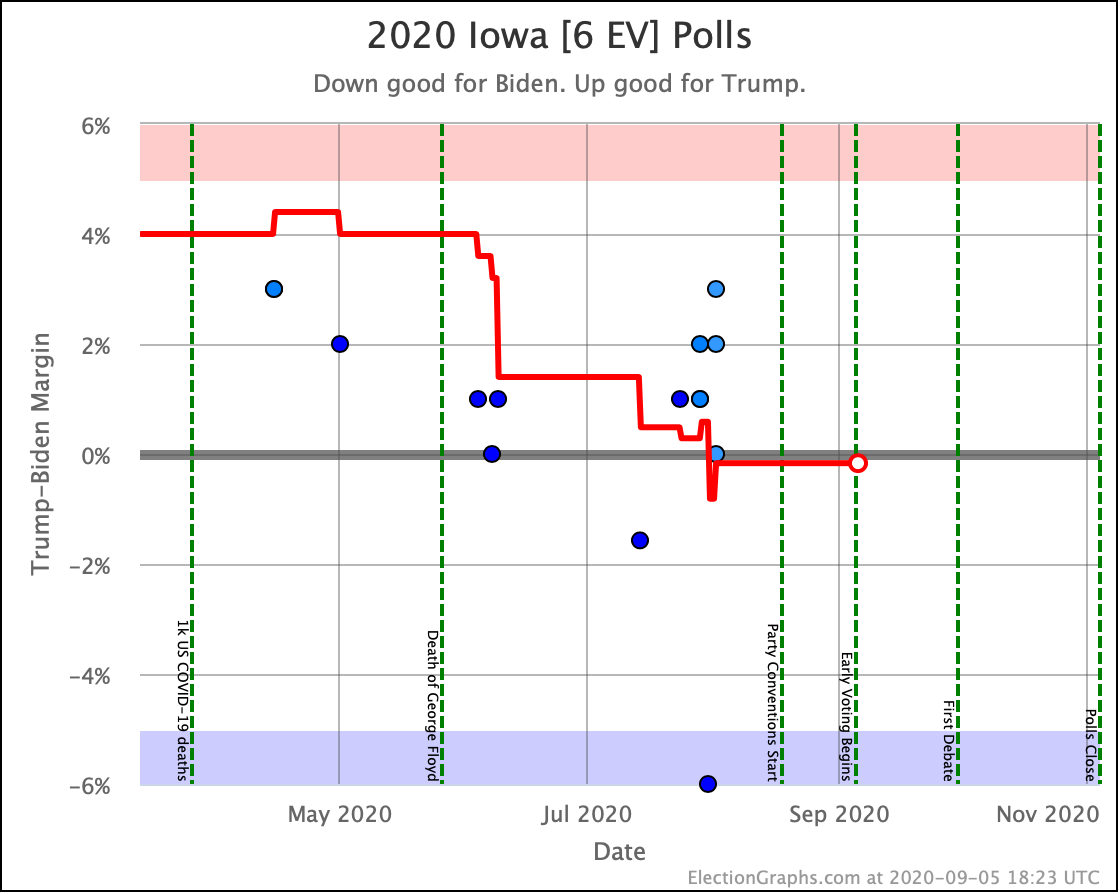
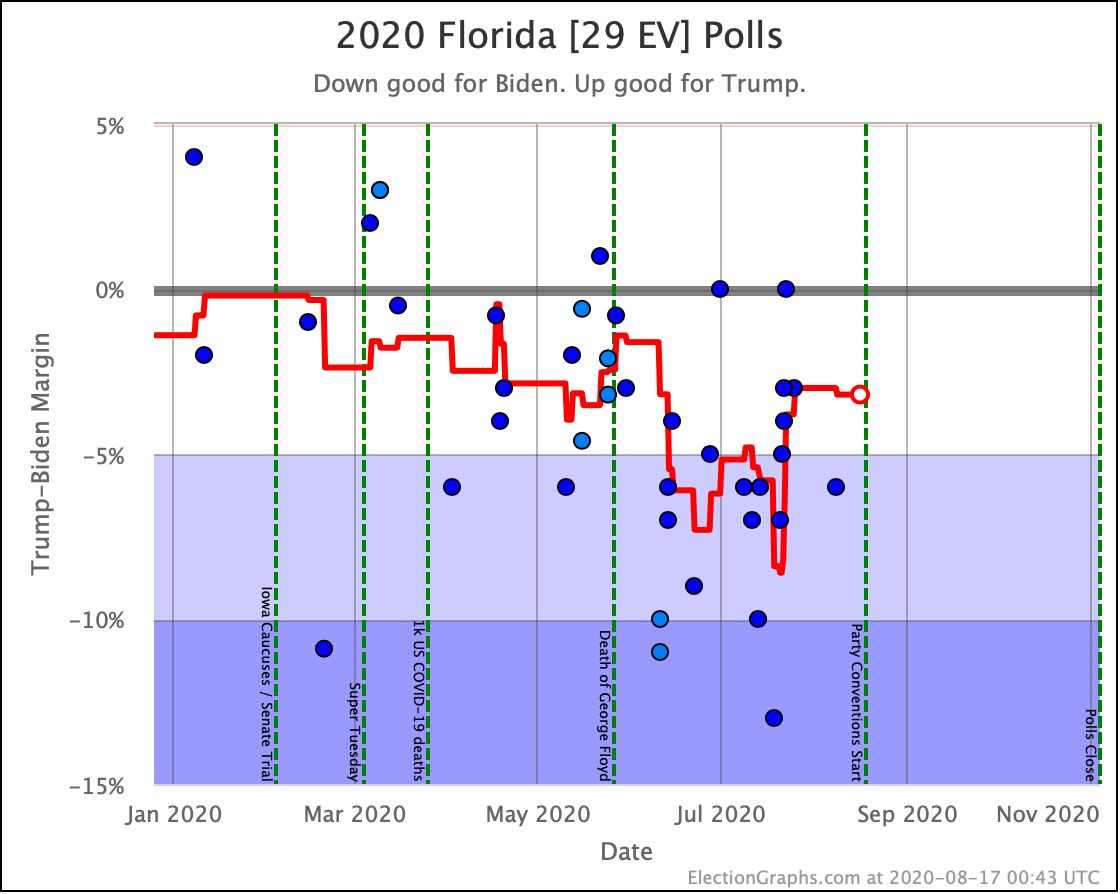
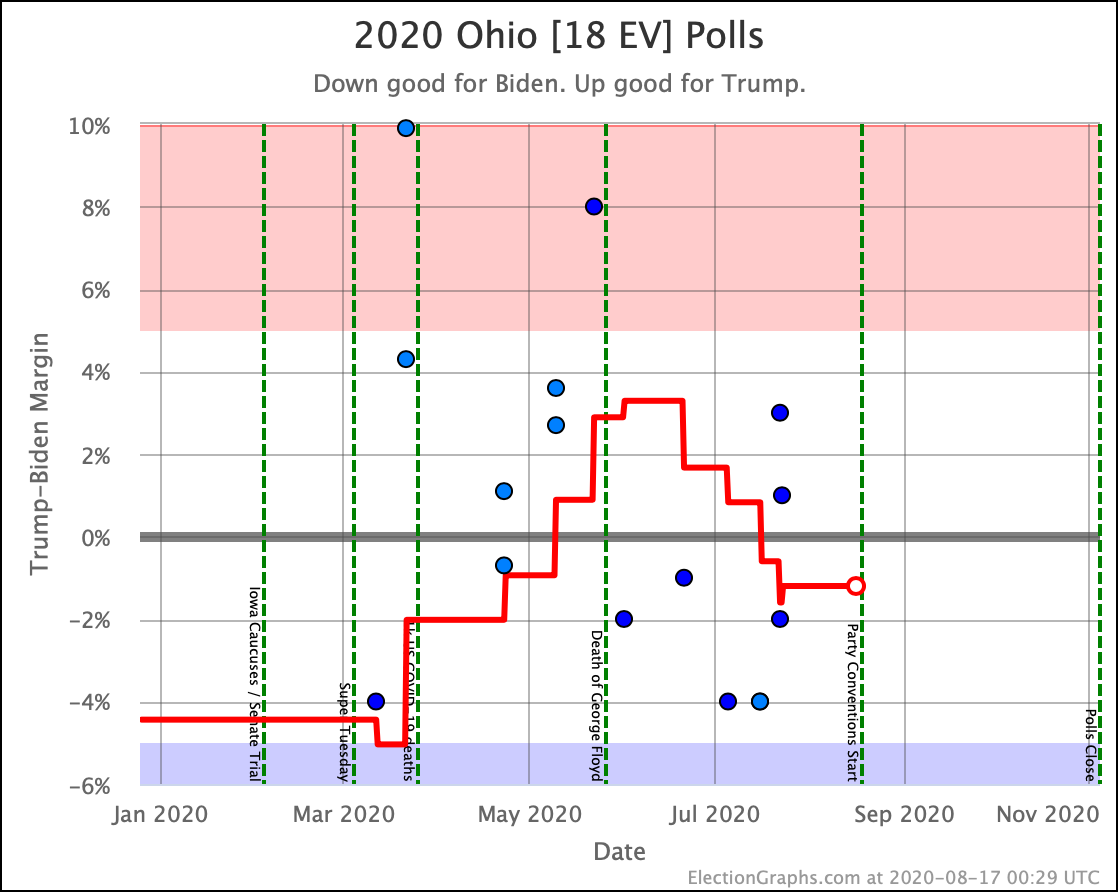
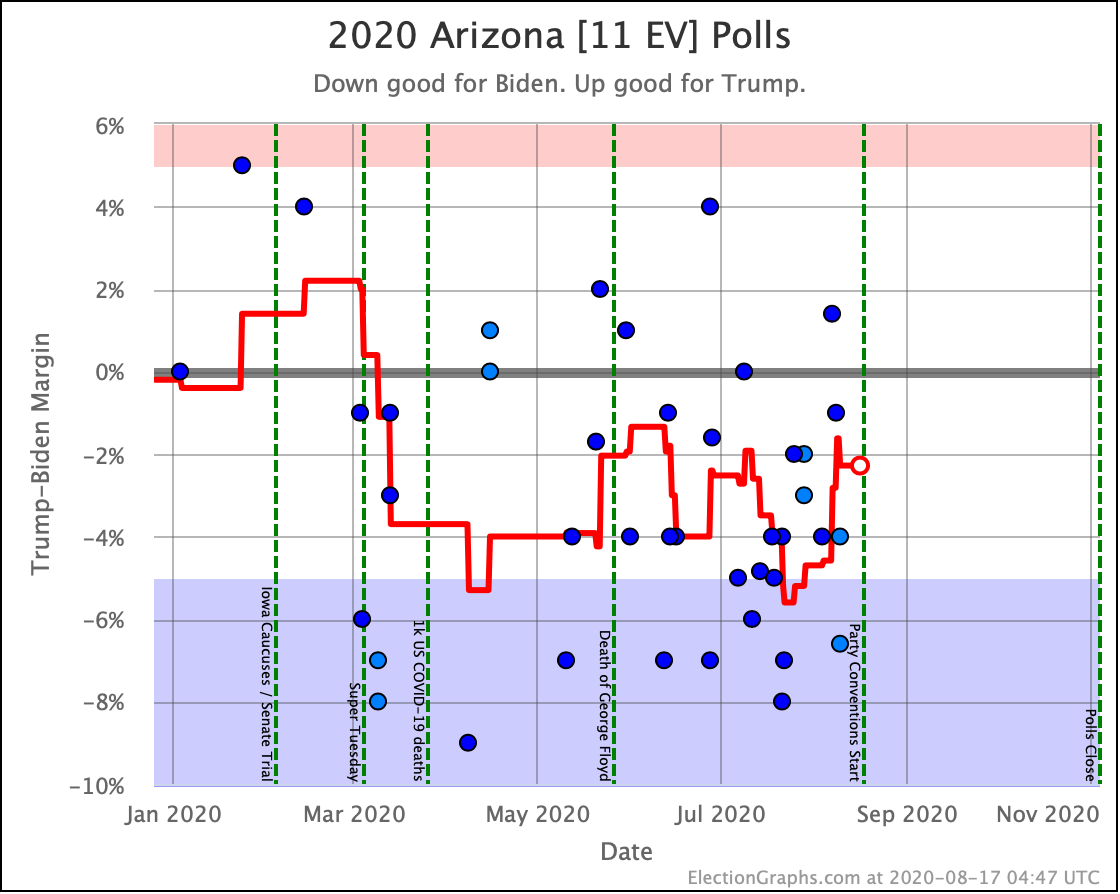
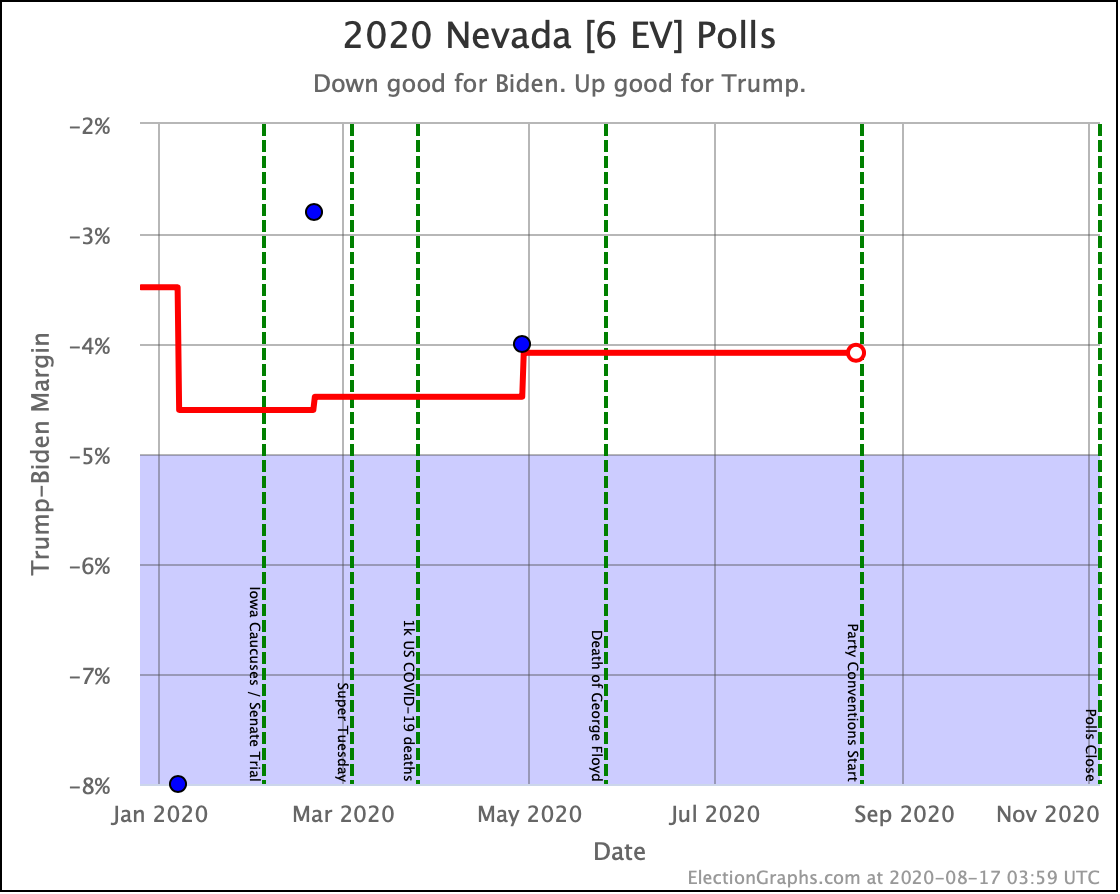
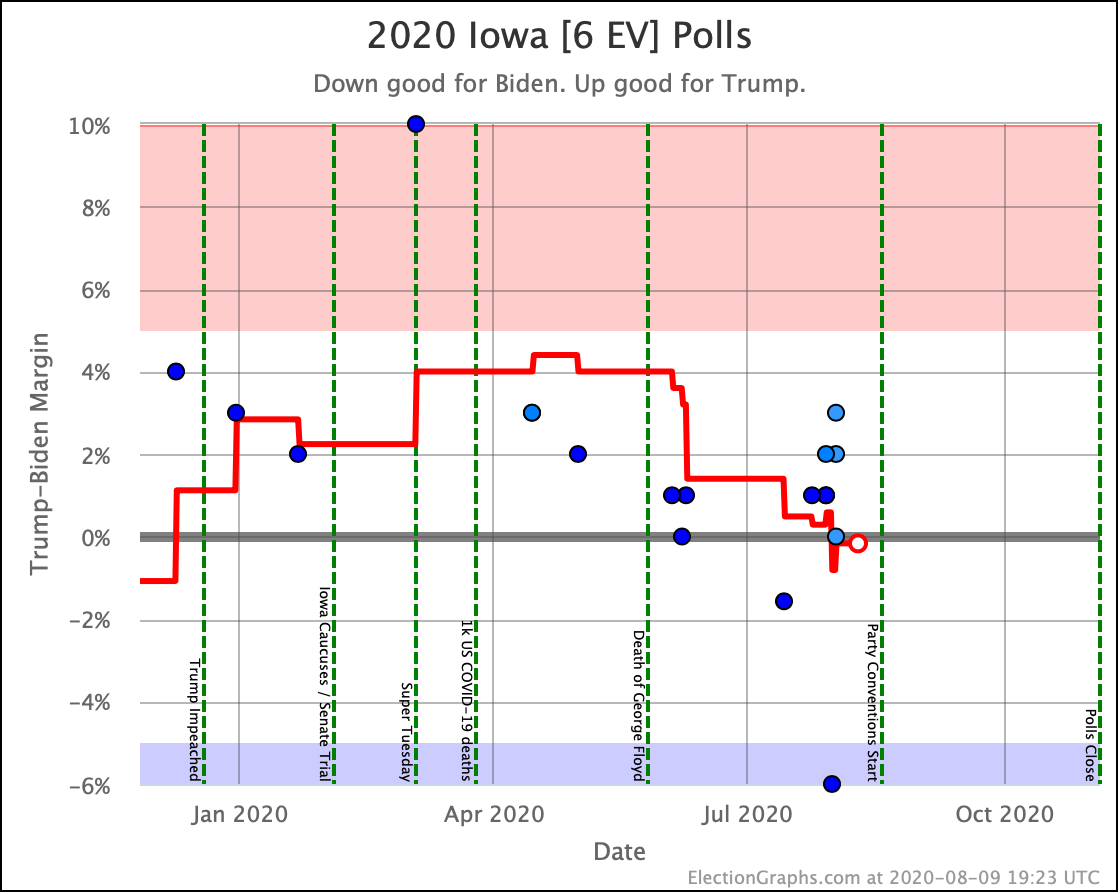
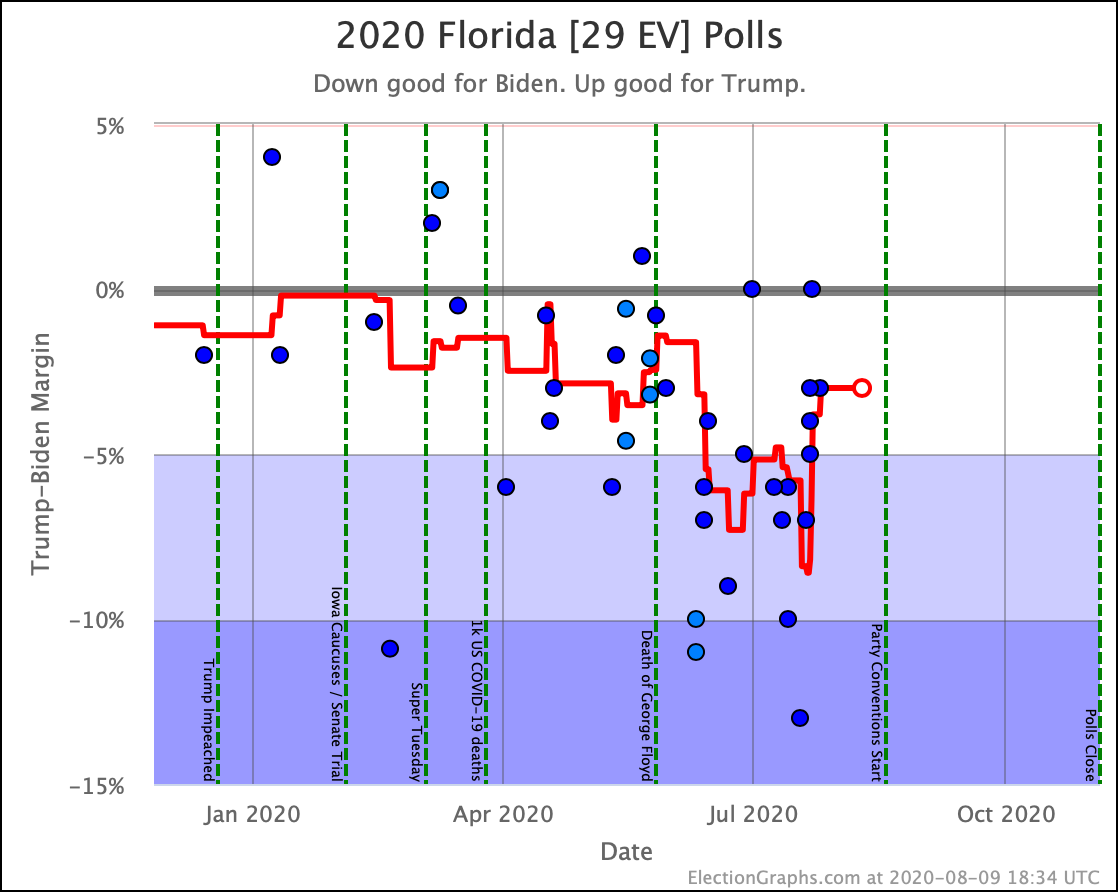
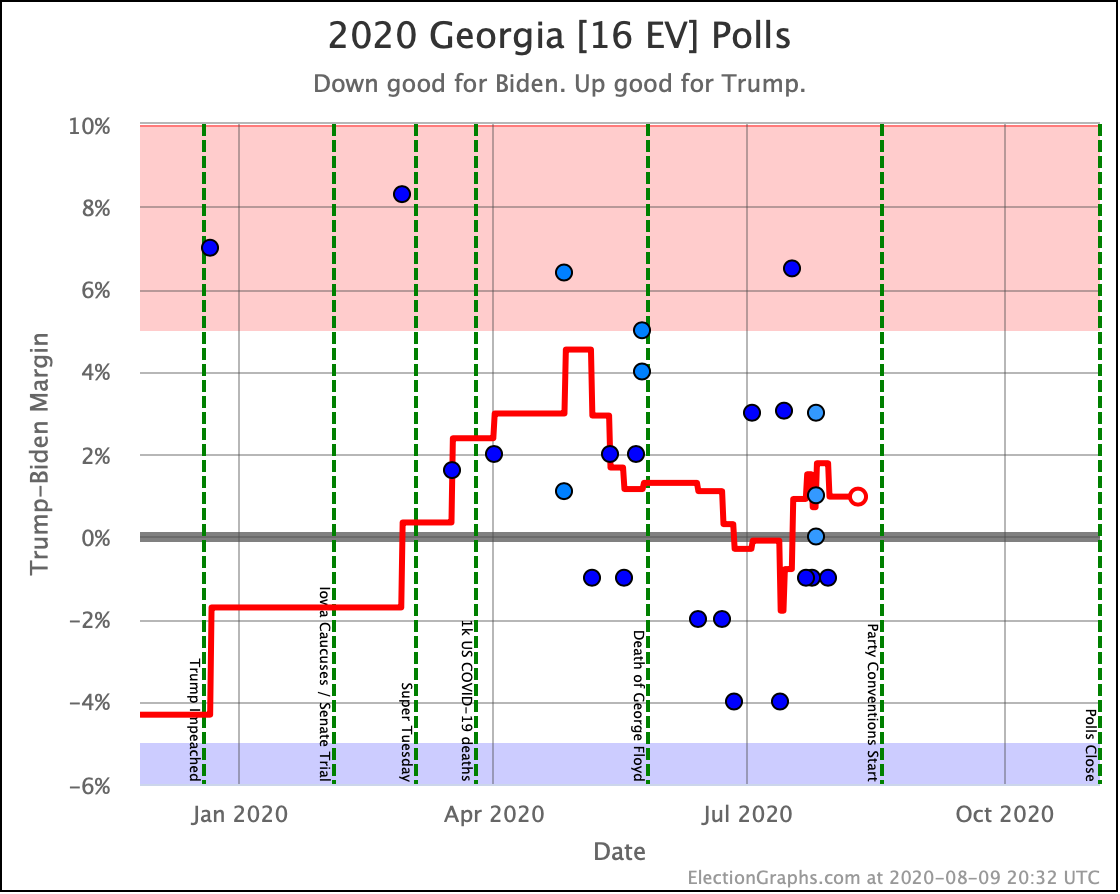
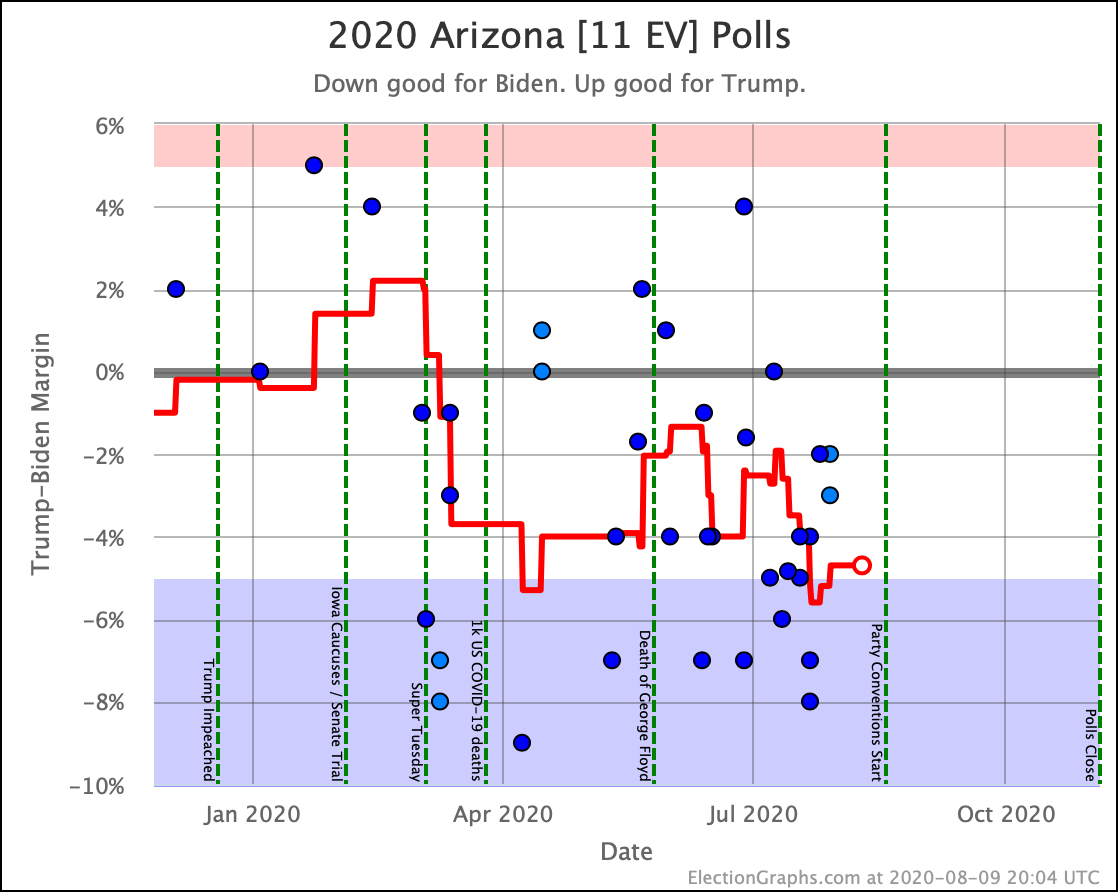
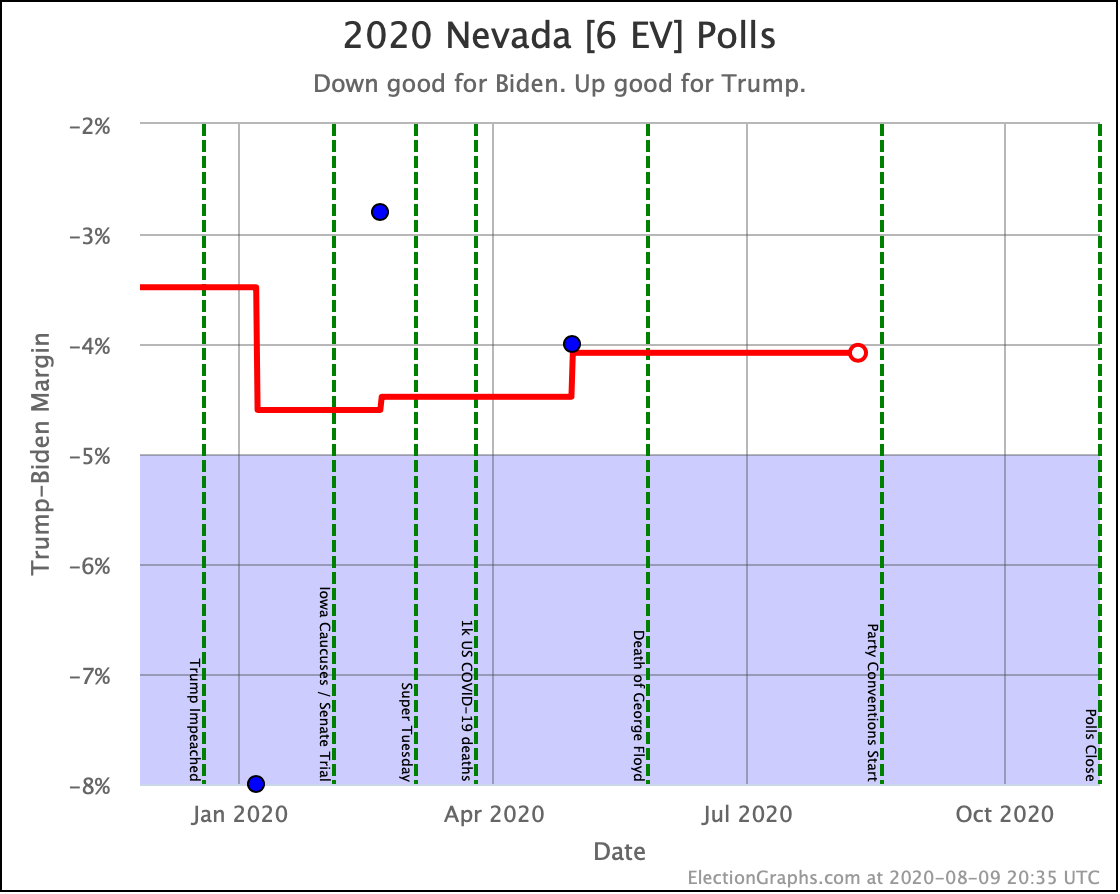
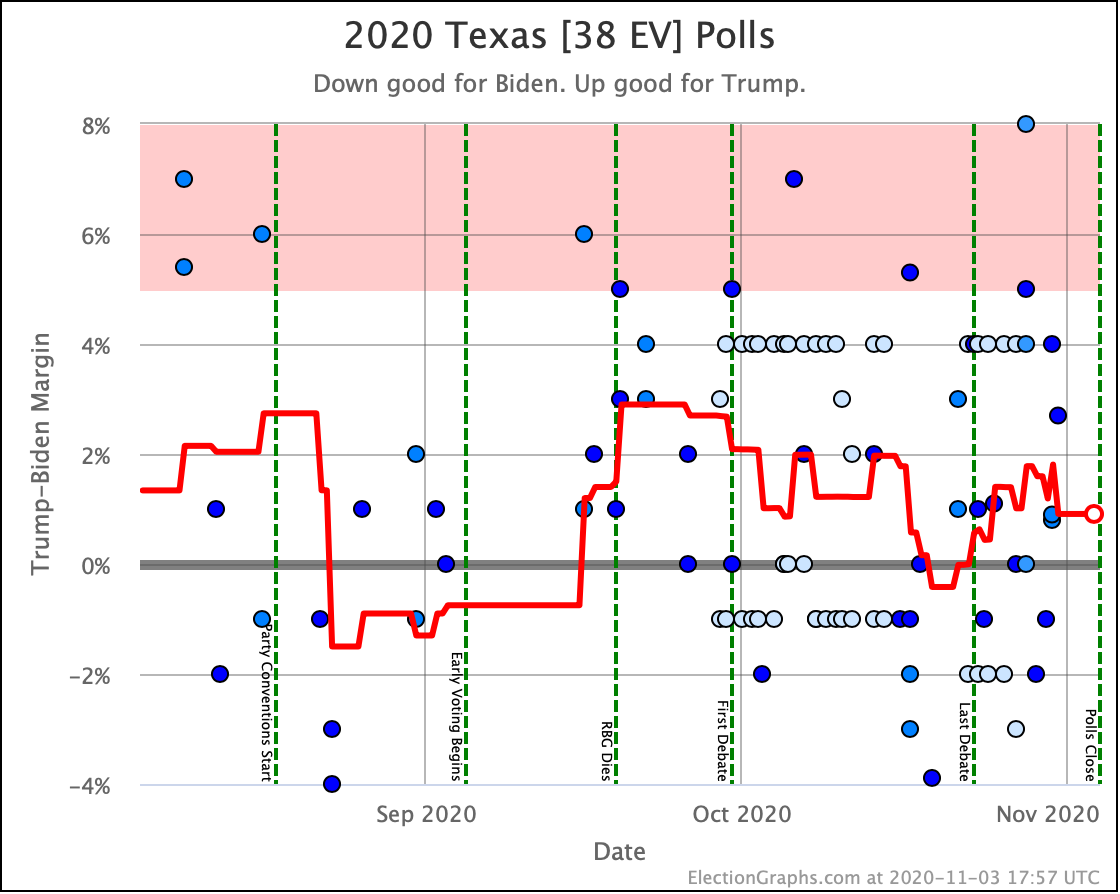
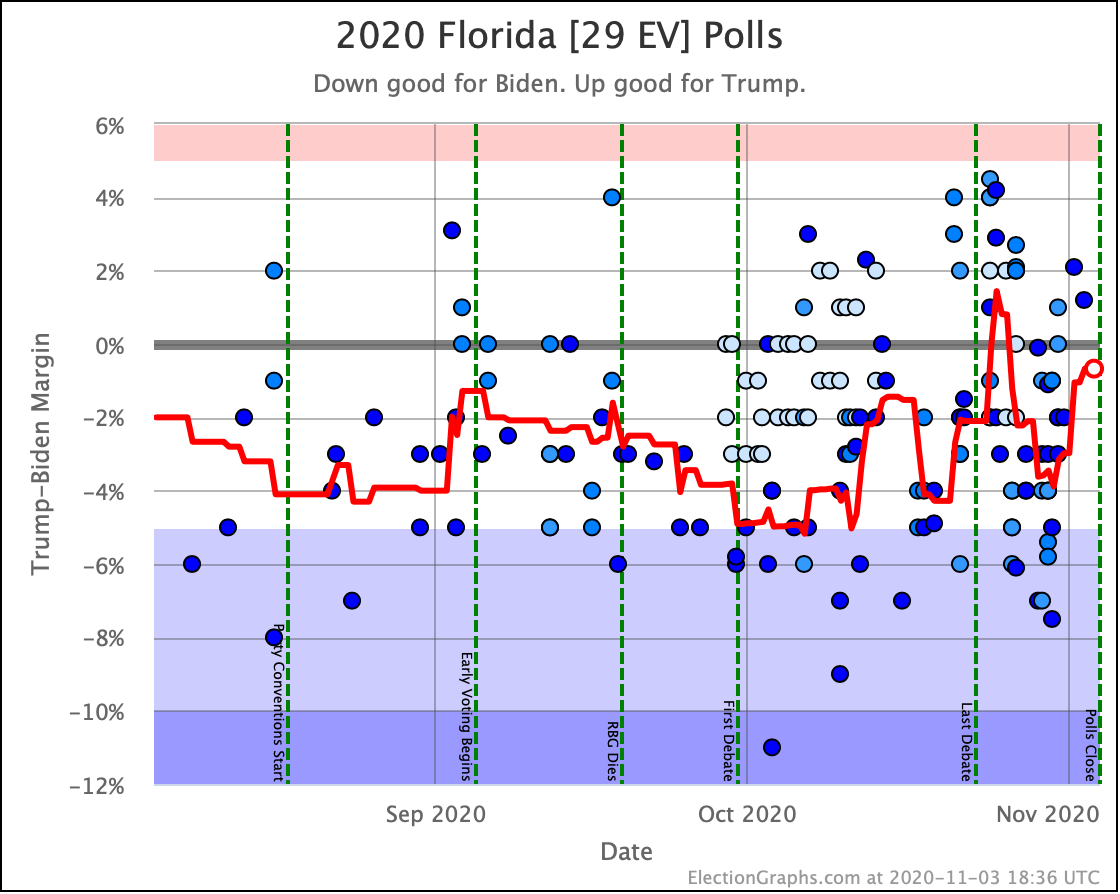
And now the trends in all the close states:

And that is that.
It is election night. The first results will be coming out within a couple of hours. We may or may not end up knowing who wins tonight, but we'll still learn a lot. And soon enough, we will indeed have a winner.
I hope you have enjoyed Election Graphs and found it useful this year. Aside from seeing how things turn out and how we did, we are done.
It was fun. Thanks everyone!
For more information:
This post is an update based on the data on the Election Graphs Electoral College 2020 page. Election Graphs tracks a poll-based estimate of the Electoral College. The charts, graphs, and maps in the post above are all as of the time of this post. Click through on any image for current interactive versions of the chart, along with additional details.
Follow @ElectionGraphs on Twitter or Election Graphs on Facebook to see announcements of updates. For those interested in individual poll updates, follow @ElecCollPolls on Twitter for all the polls as I add them. If you find the information in these posts informative or useful, please consider visiting the donation page.