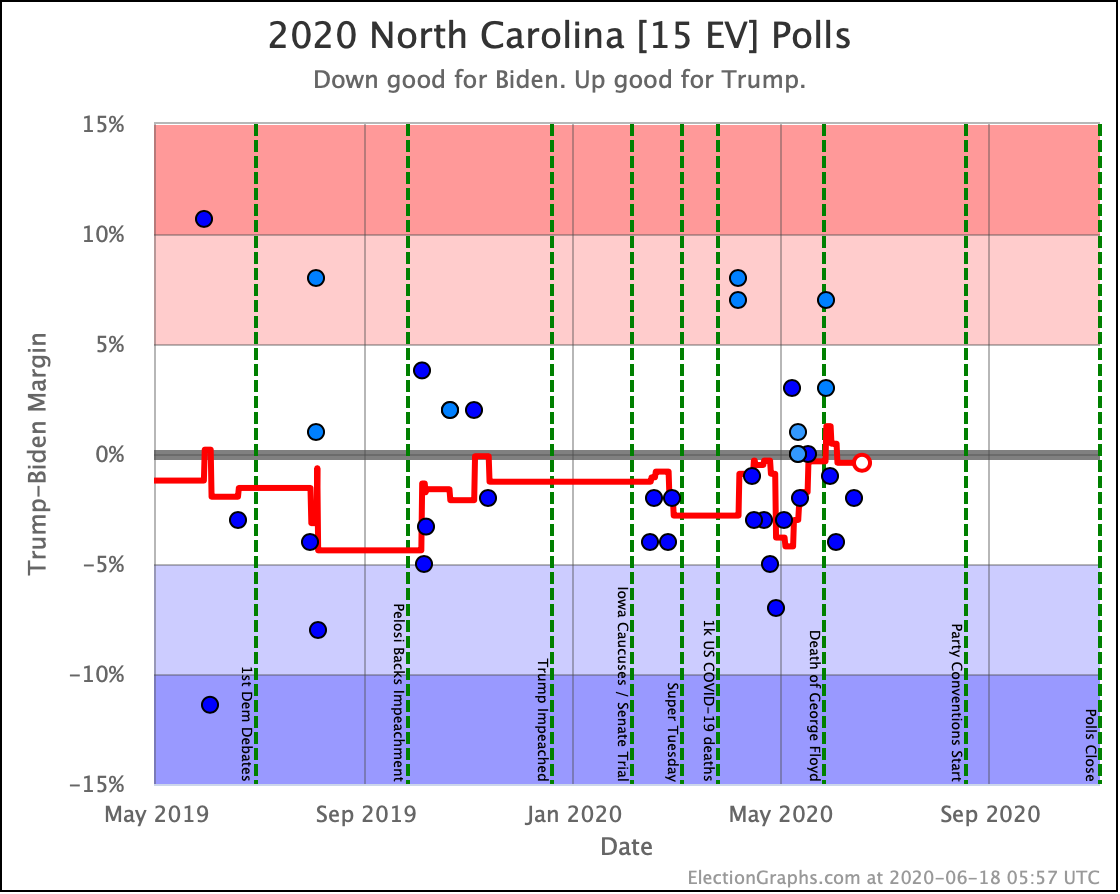
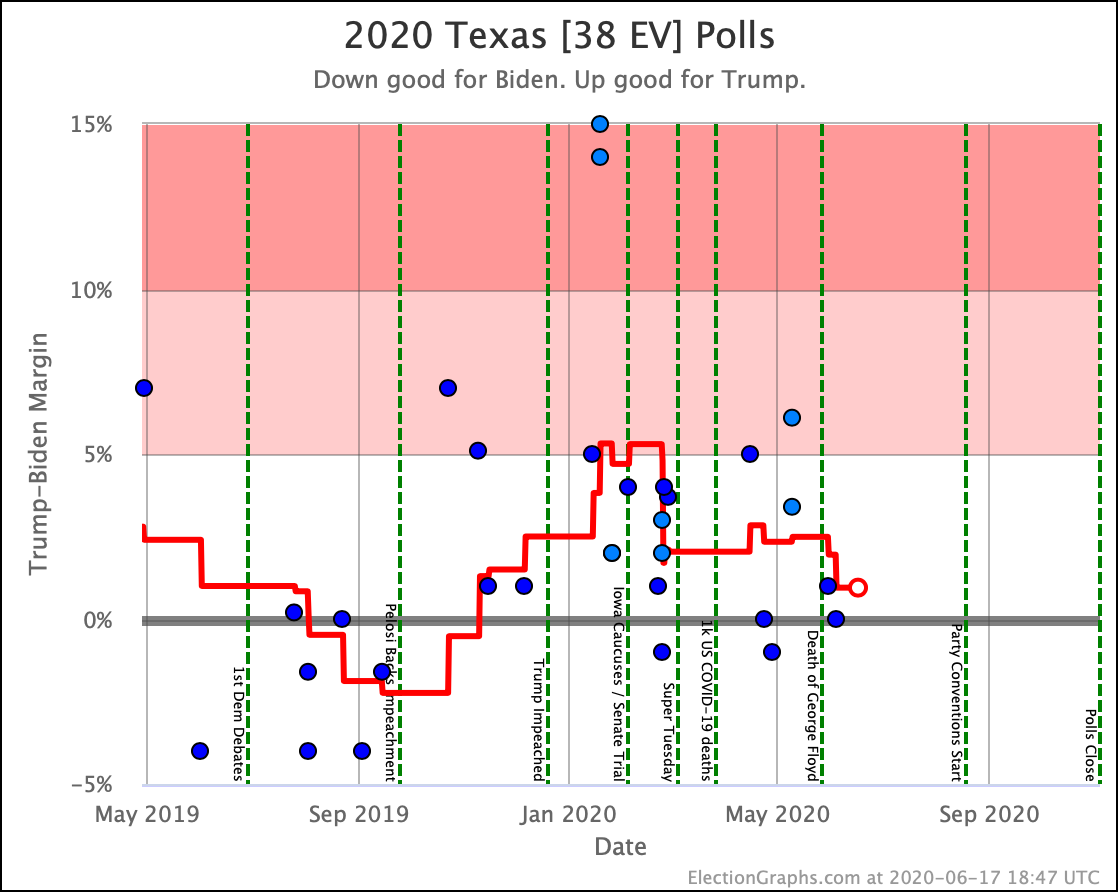
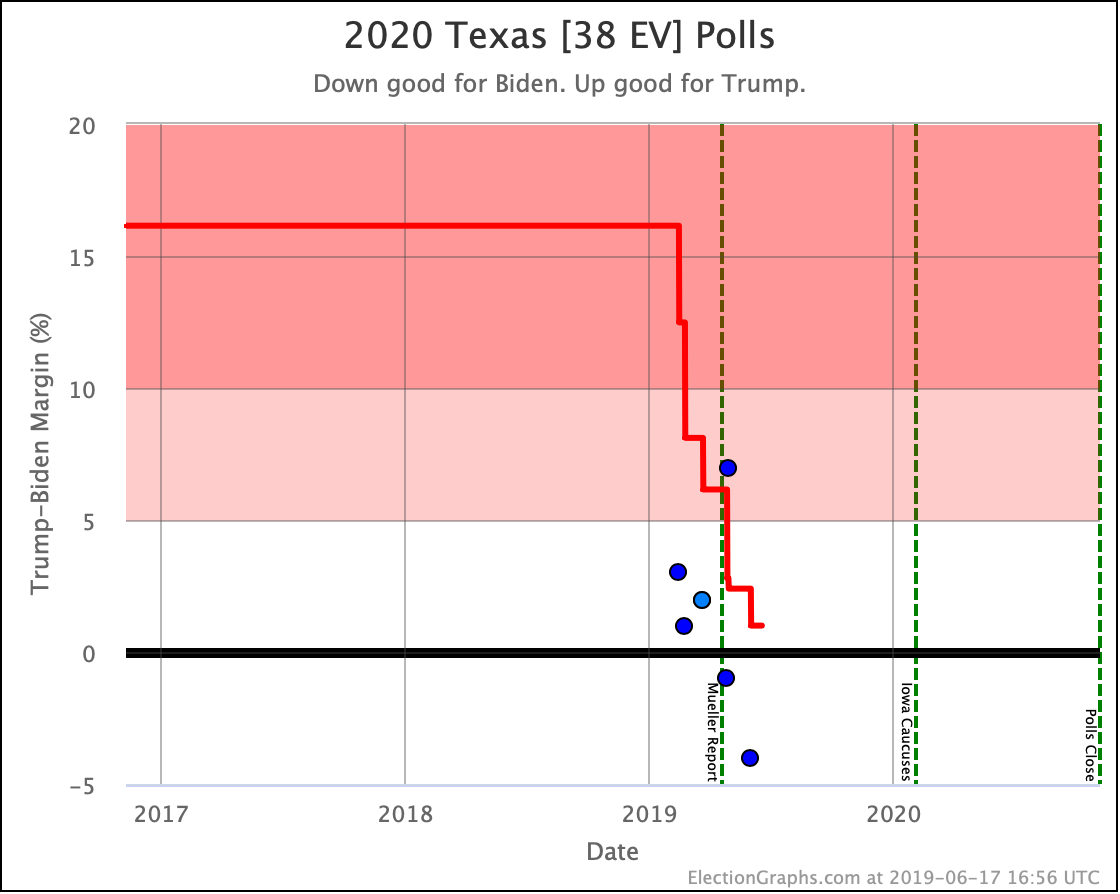
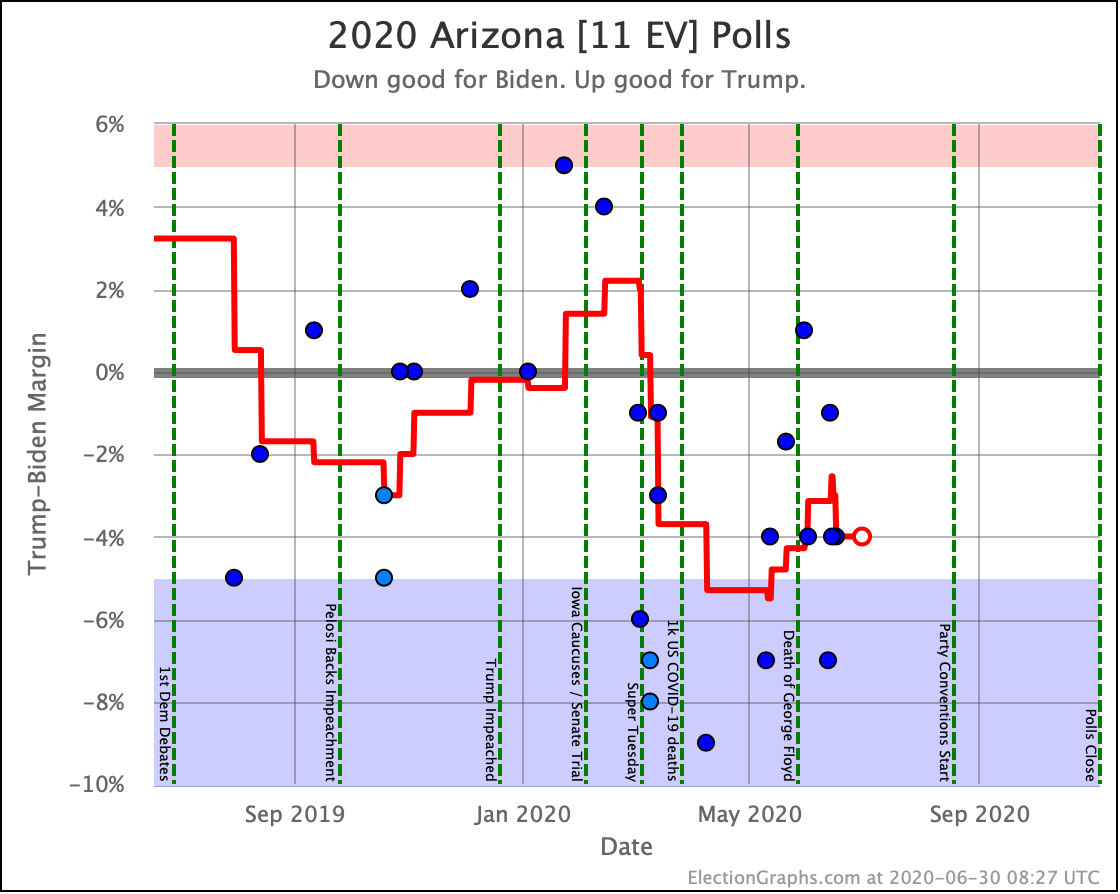
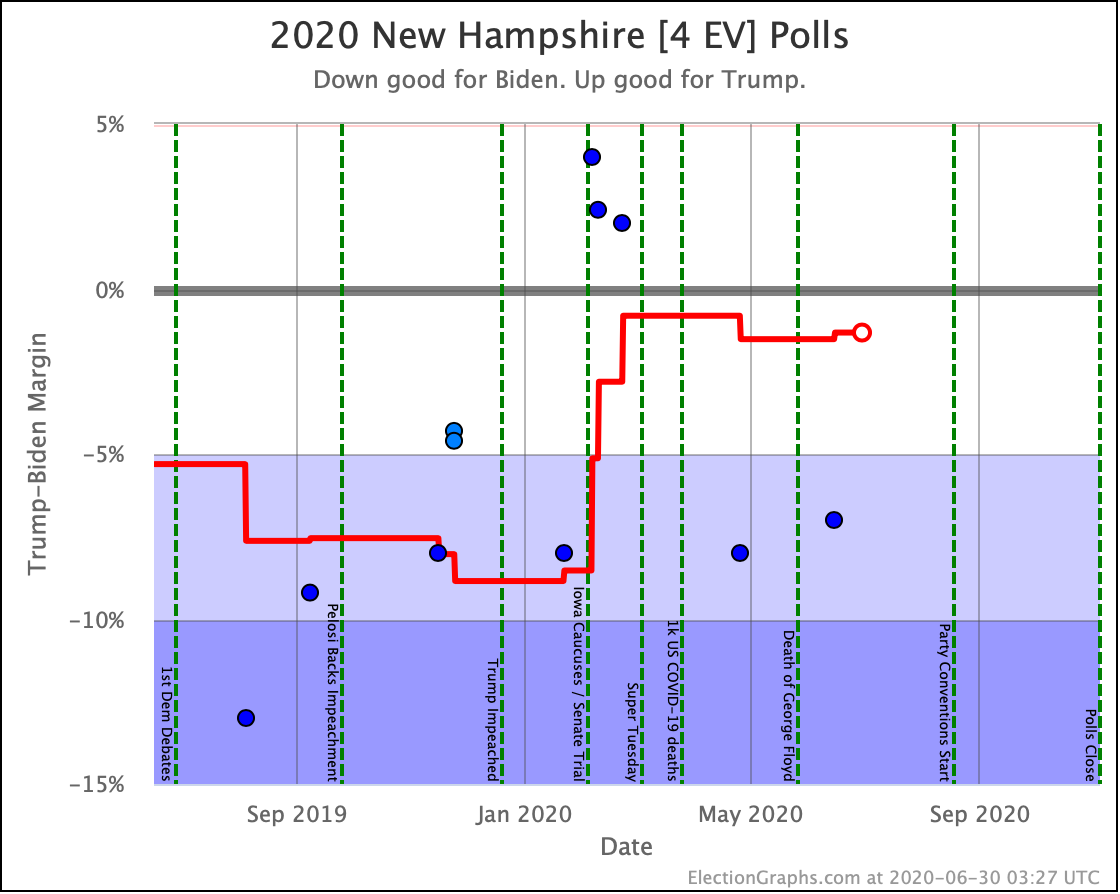
Since the last update on June 18th, there have been new state polls in Utah, Kentucky, New Hampshire, North Carolina (x5), Minnesota, Alabama, Michigan (x3), Wisconsin (x5), Texas (x2), Ohio, Pennsylvania (x3), Florida (x2), Arizona, Georgia (x2), Missouri, and New York.
In our last update, we noted that while national polls were moving rapidly against Trump, the story with state polls was more complicated.
Not this time. With very few exceptions, these polls have been bad for Trump. State polls have caught up with the national polls, and this time around we see a dramatic move away from Trump and toward Biden across metrics.
As usual, let's start with the summary table of changes, then get into the graphs:
| Model | Metric | 18 Jun | 1 Jul | 𝚫 |
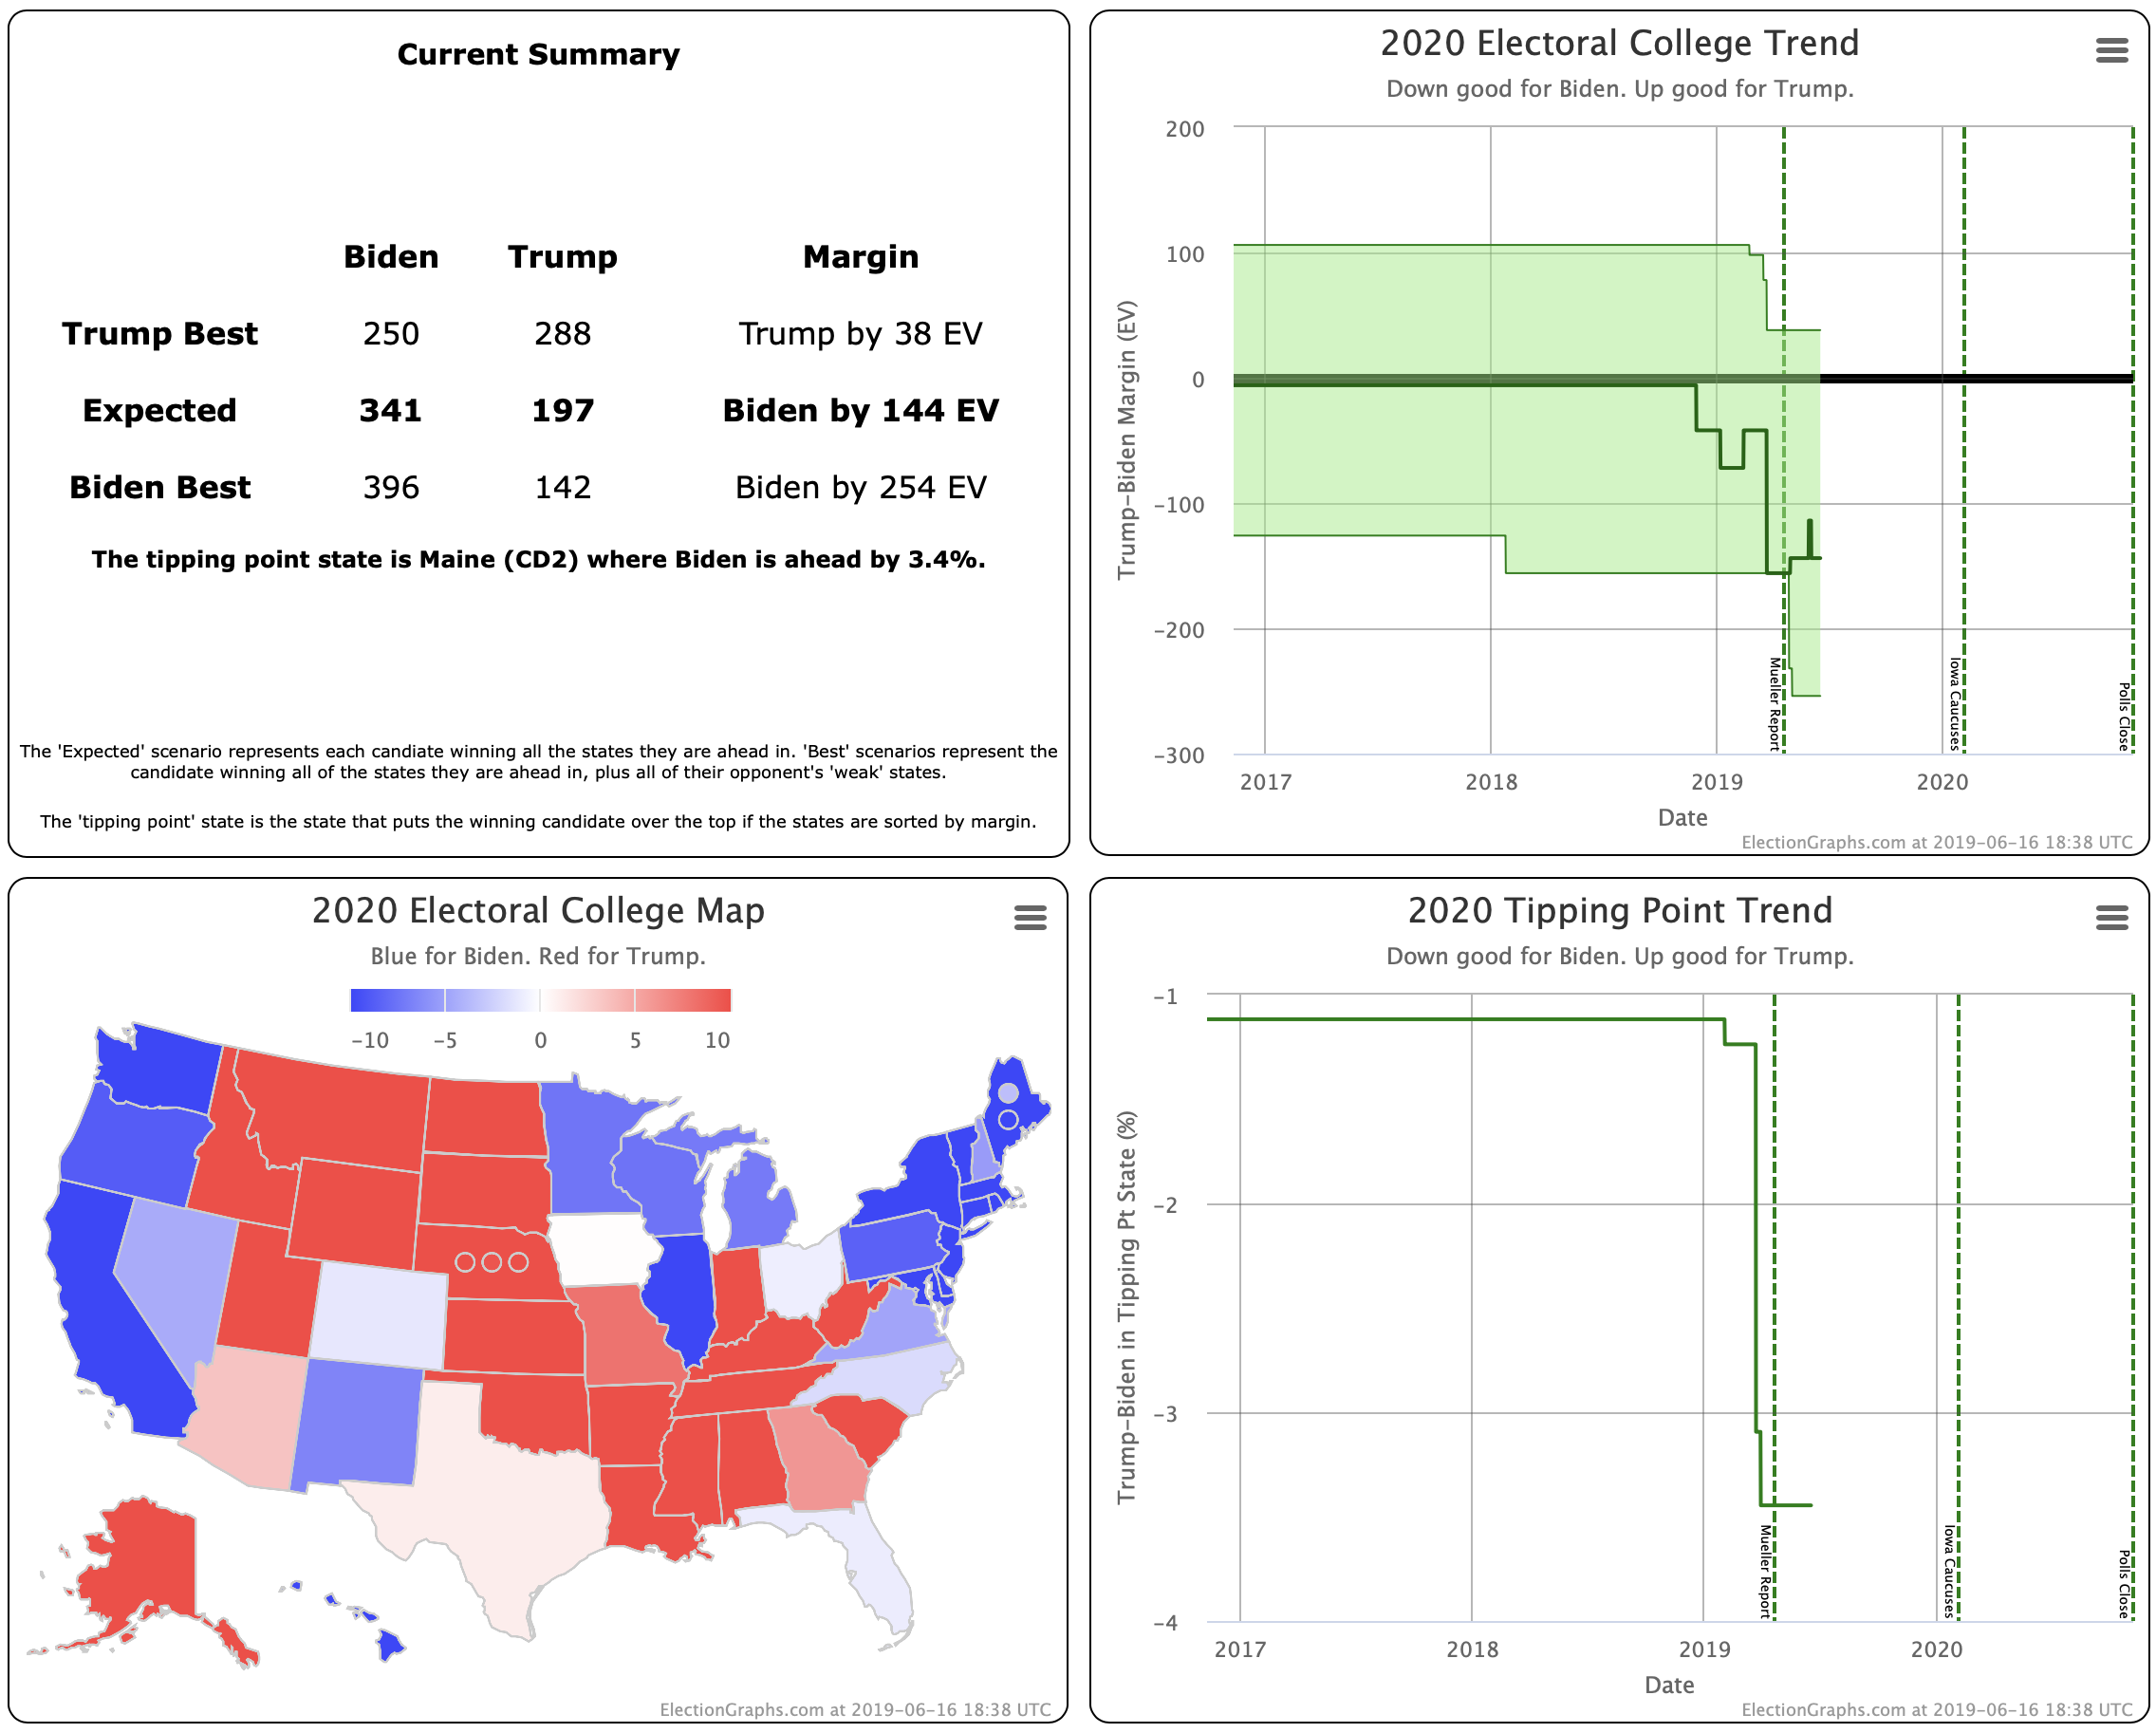
| Categories | Trump Best Expected Biden Best |
Trump +42 Biden +130 Biden +288 |
Biden +56 Biden +162 Biden +288 |
Biden +98 Biden +32 FLAT |
| Tipping Point | Biden +4.8 | Biden +7.3% | Biden +2.5% | |
| Probabilities | Trump 2σ Median Biden 2σ |
Biden +32 Biden +132 Biden +242 |
Biden +82 Biden +158 Biden +262 |
Biden +50 Biden +26 Biden +20 |
| Trump Win Tie Biden Win |
0.3% 0.1% 99.6% |
0.0% 0.0% 100.0% |
-0.3% -0.1% +0.4% |
Not a single one of our national metrics moved toward Trump this time.
Let's start by looking at the states that moved in or out of the "Weak Biden" and "Weak Trump" categories that our categorization model thinks could go either way since the margin is less than 5%.
In order from biggest to smallest:
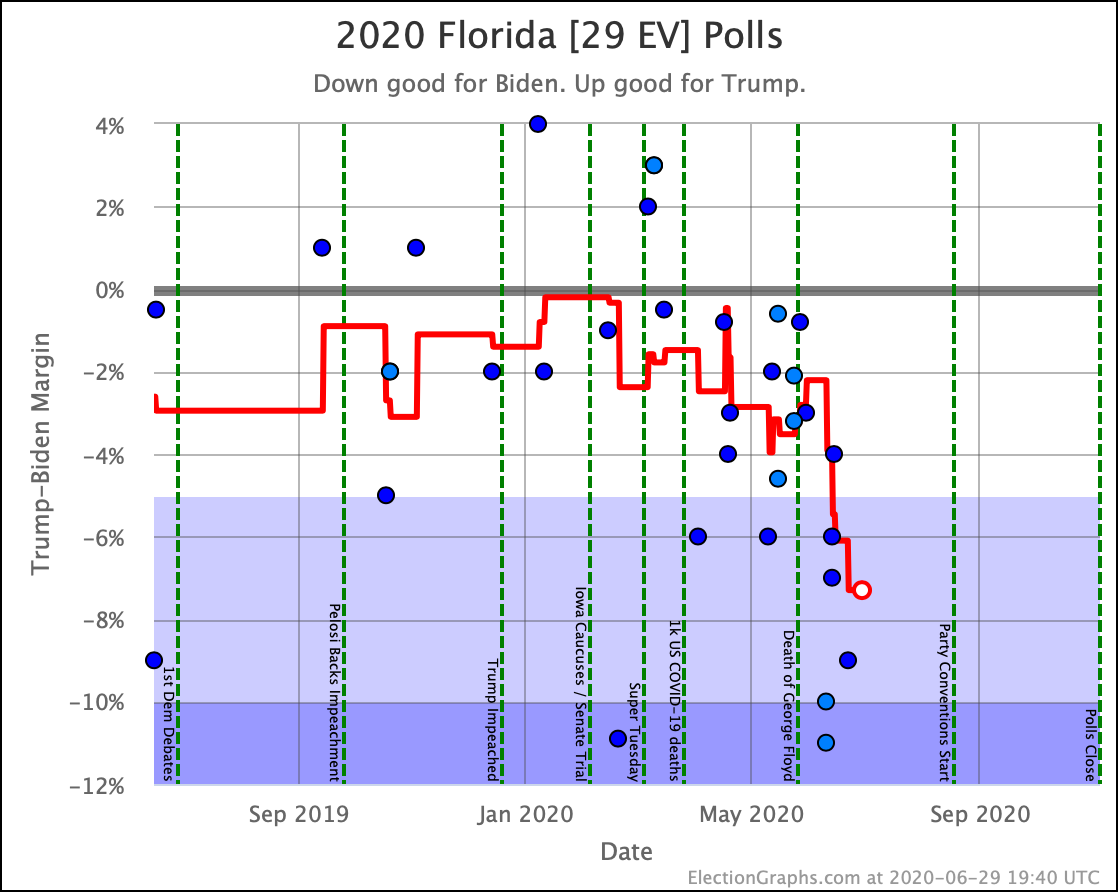
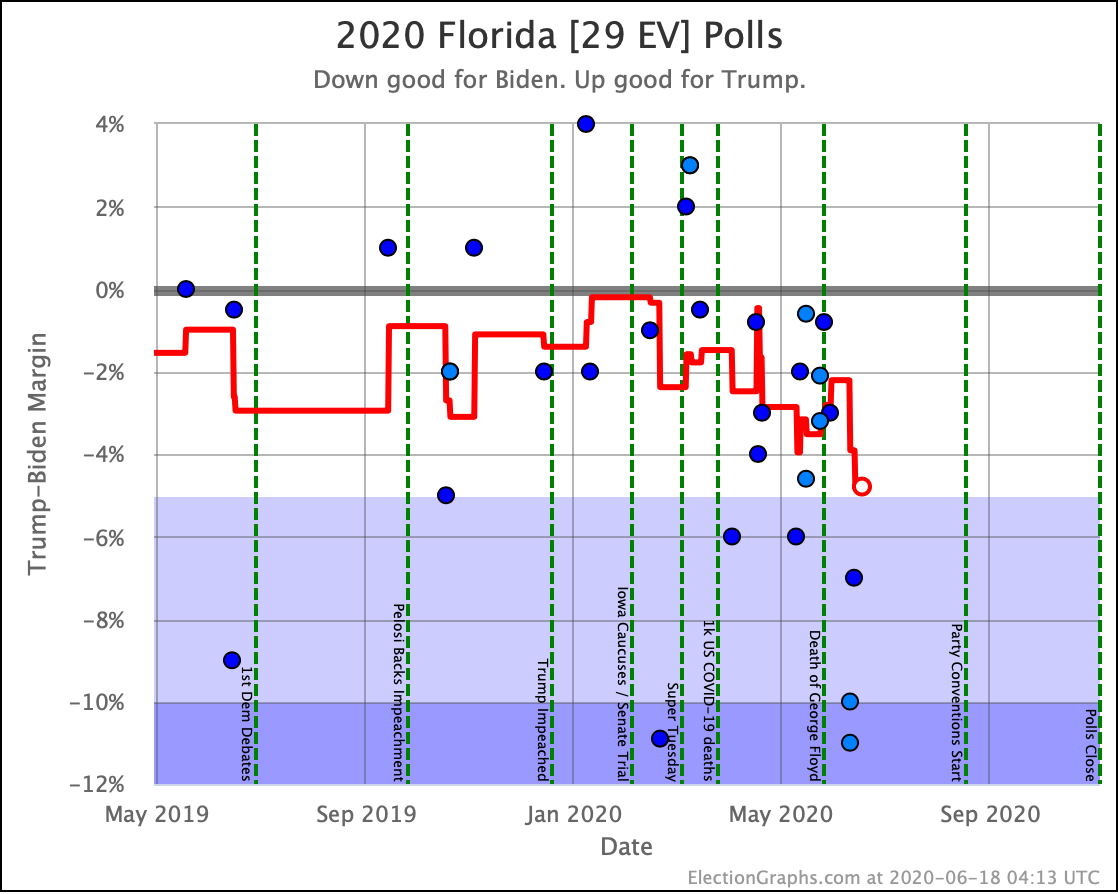
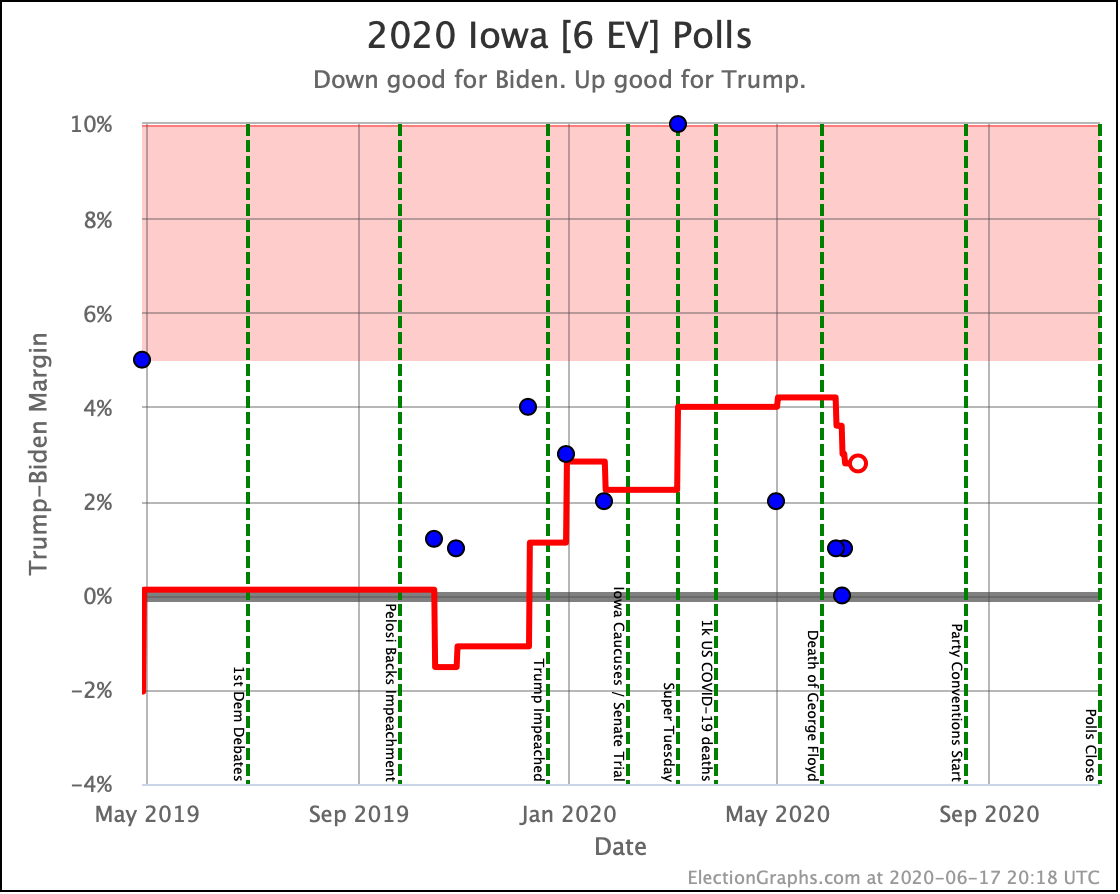
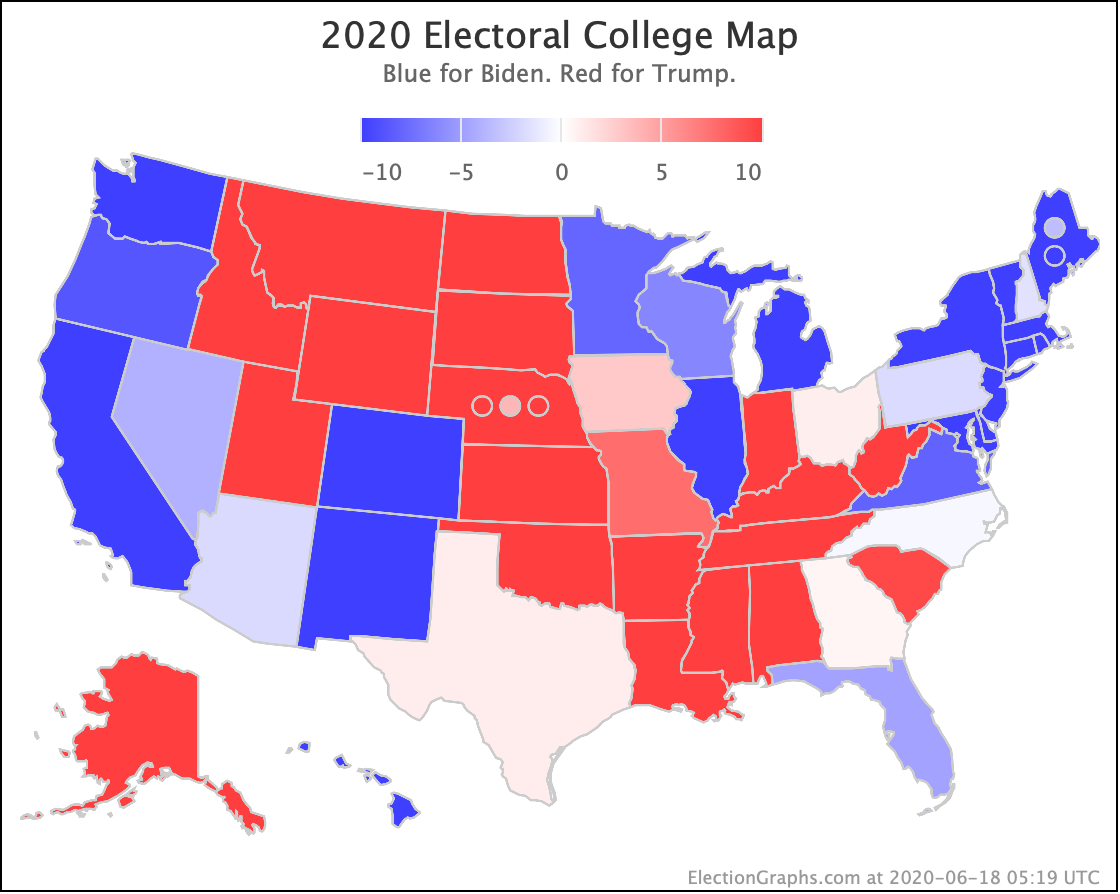
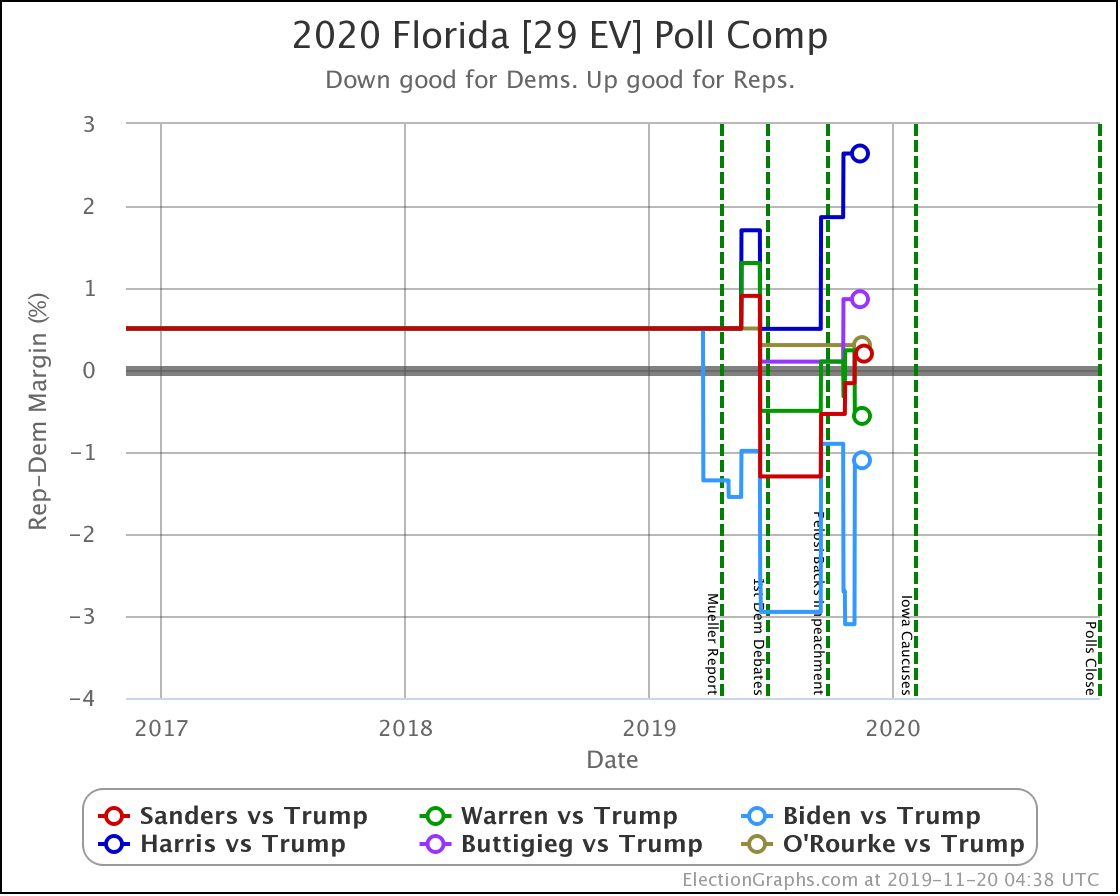
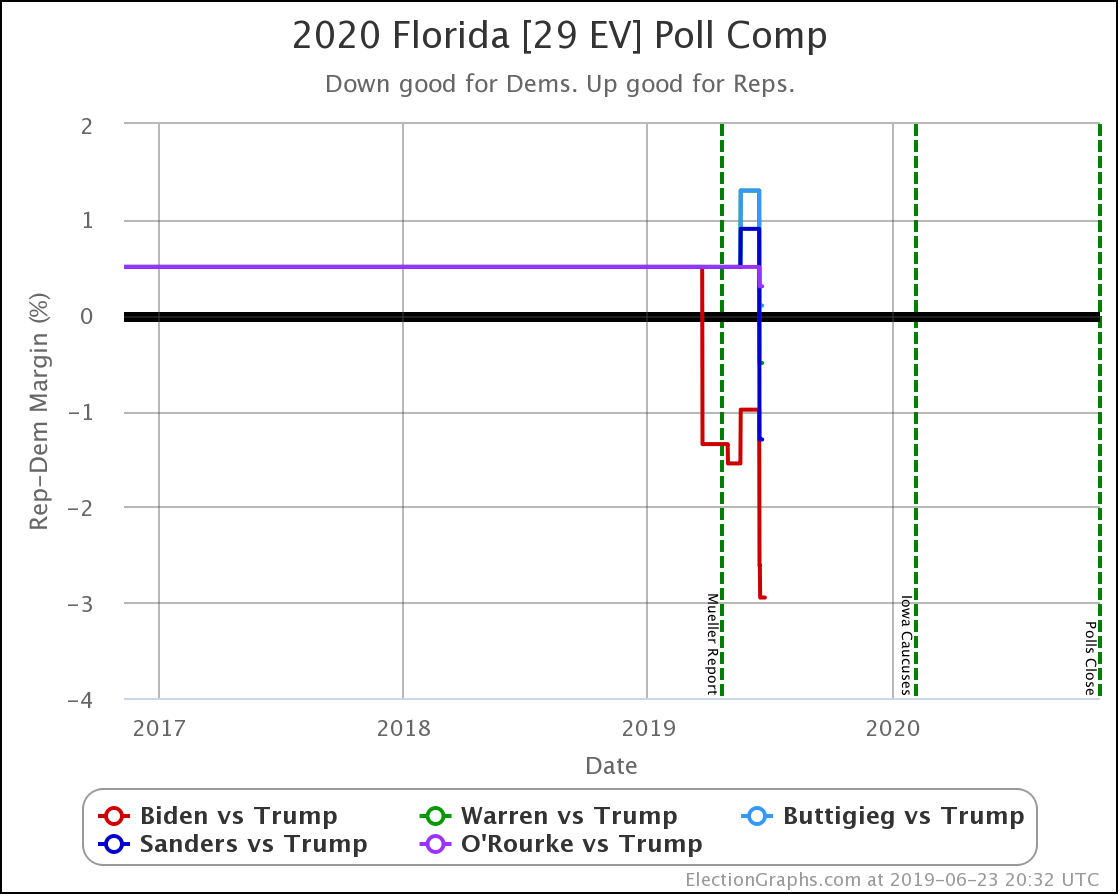
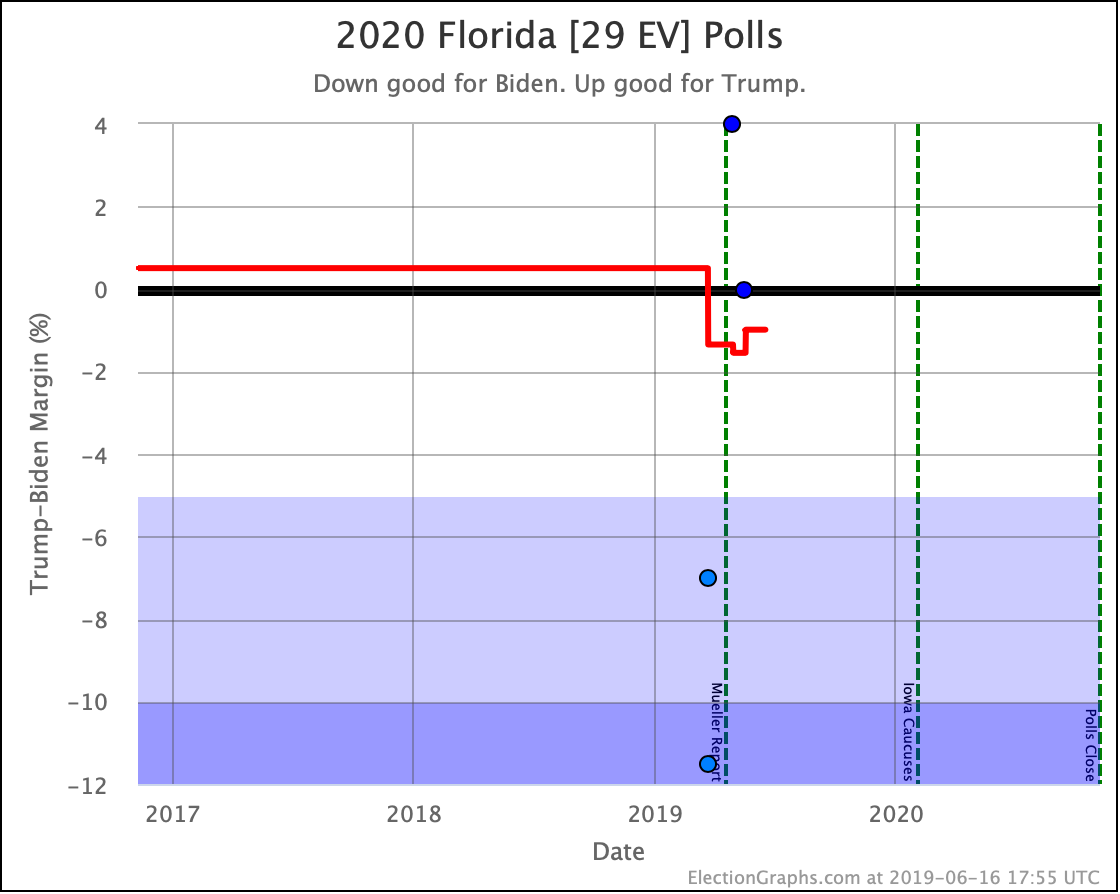
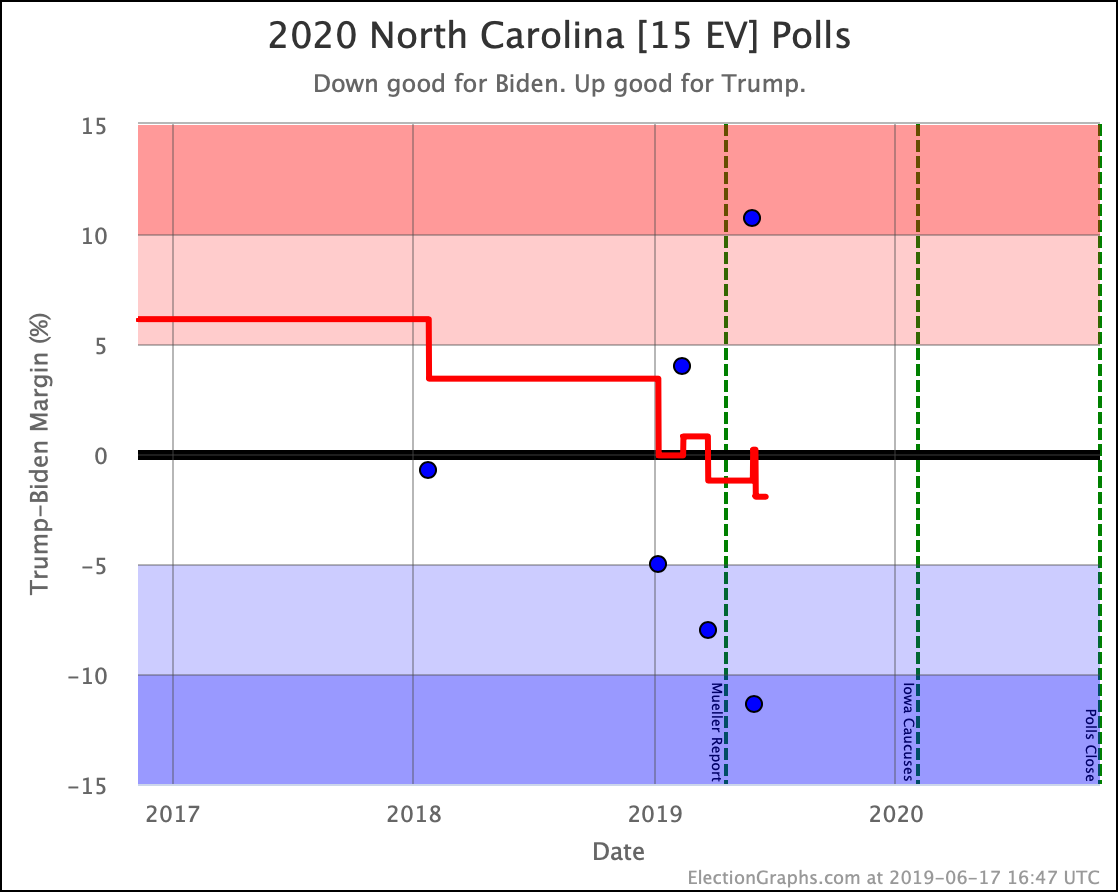
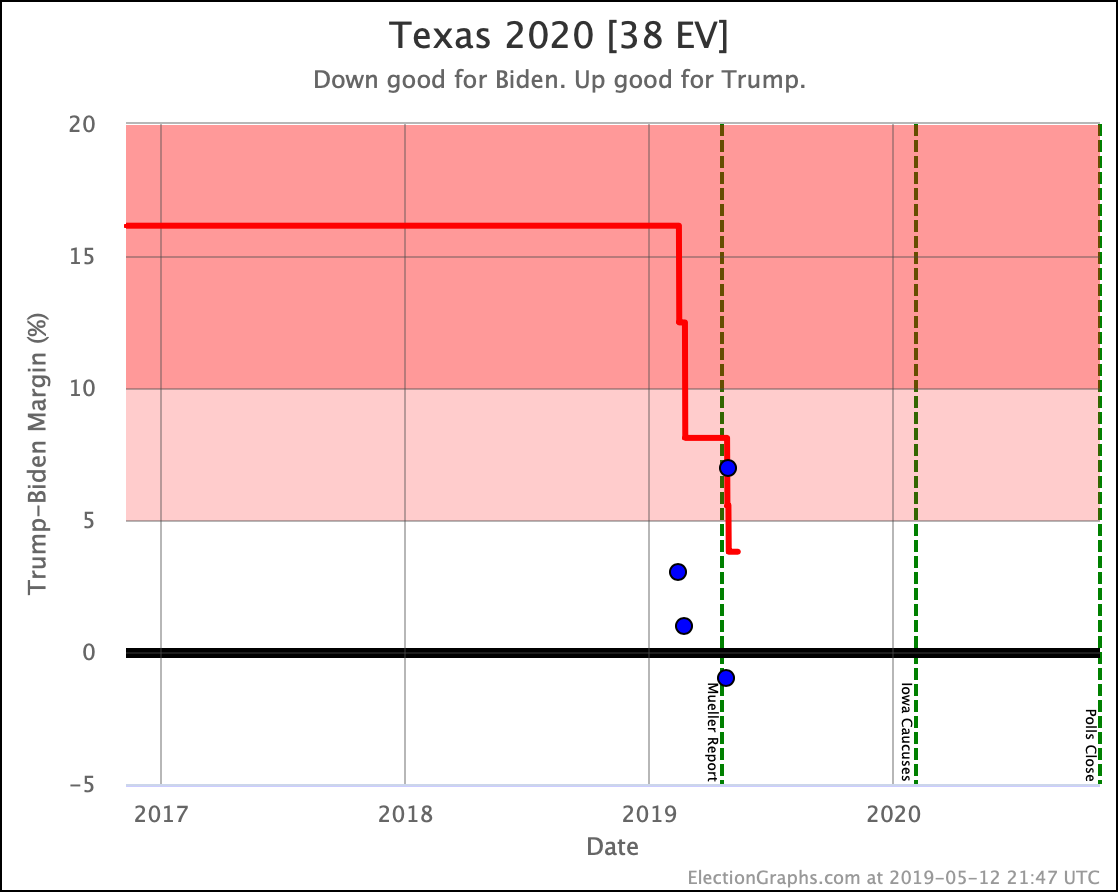
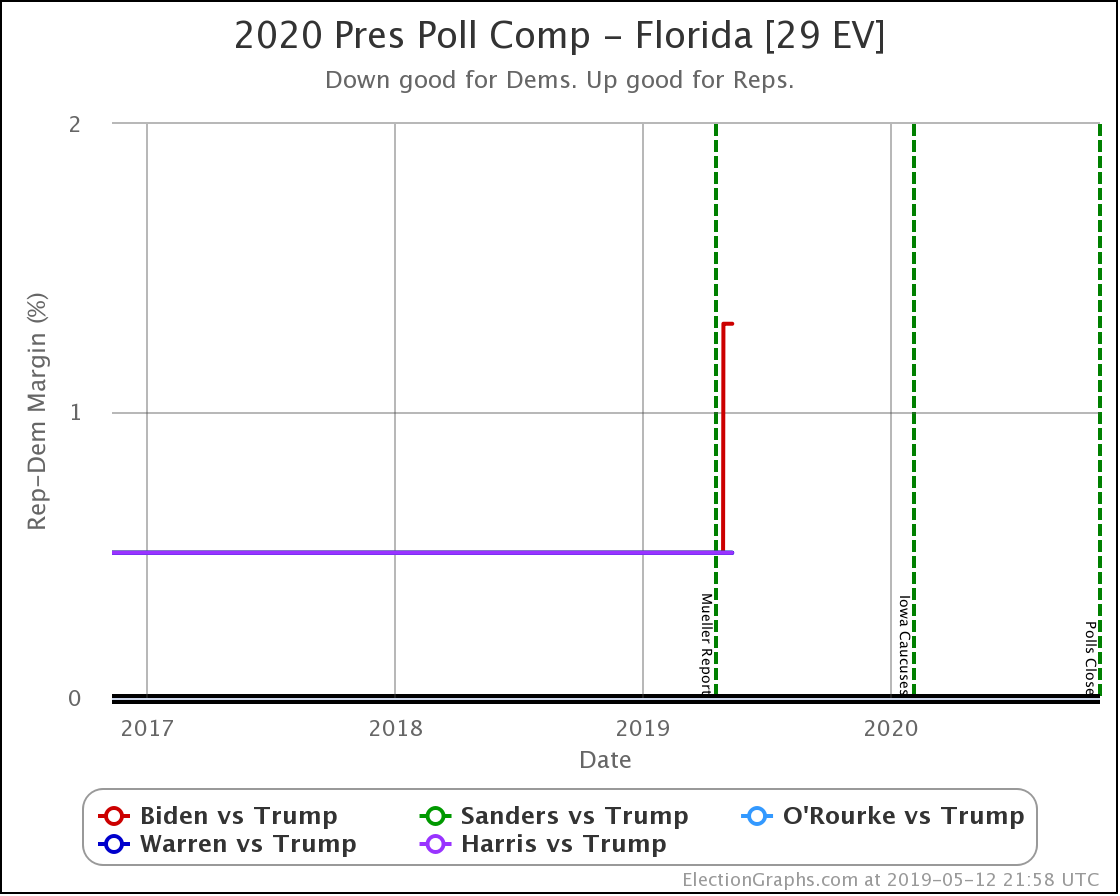
With a series of really strong polls, Trump seems to be collapsing in Florida at the moment. Now, it would be natural for there to be some reversion to the mean at some point, and maybe the poll showing Biden with a 10%+ lead is an outlier. But for the moment, Florida moves from "Weak Biden" to "Strong Biden", meaning the categorization view no longer sees Florida as being in reach for Trump if the election was today. (Spoiler, it isn't.)
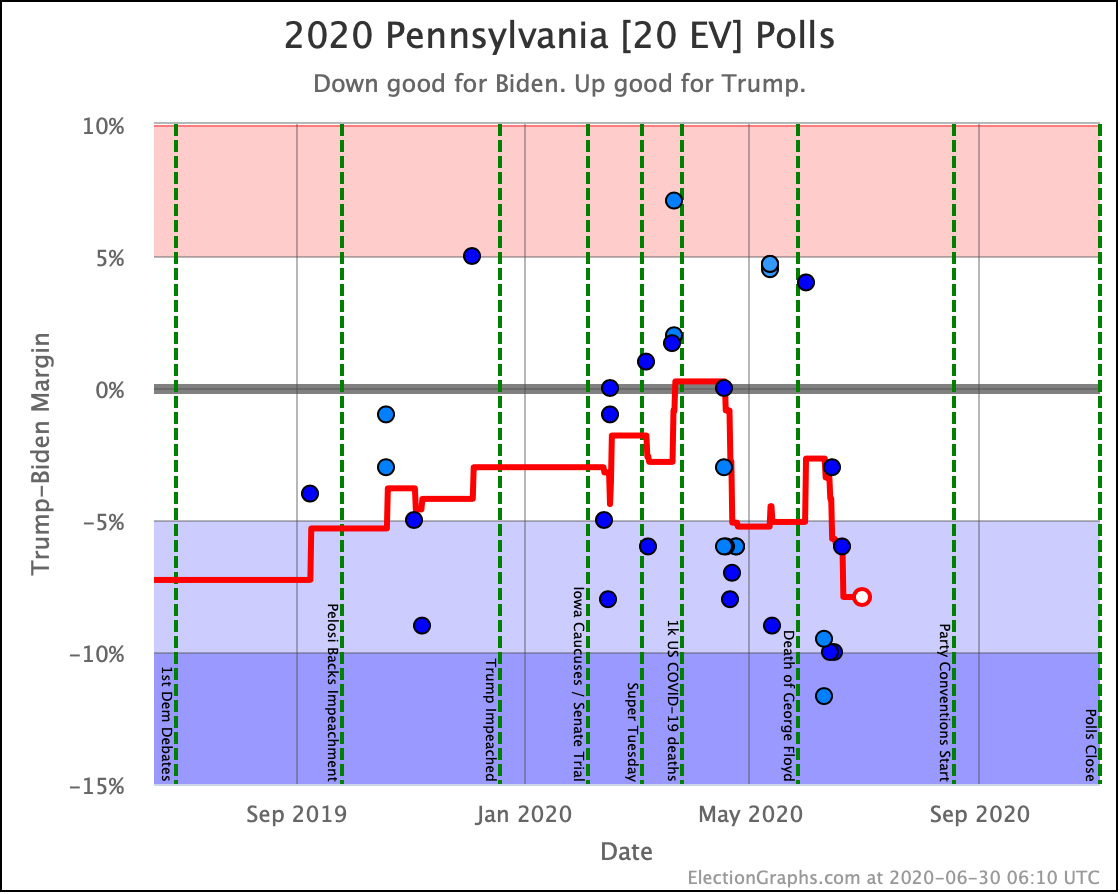
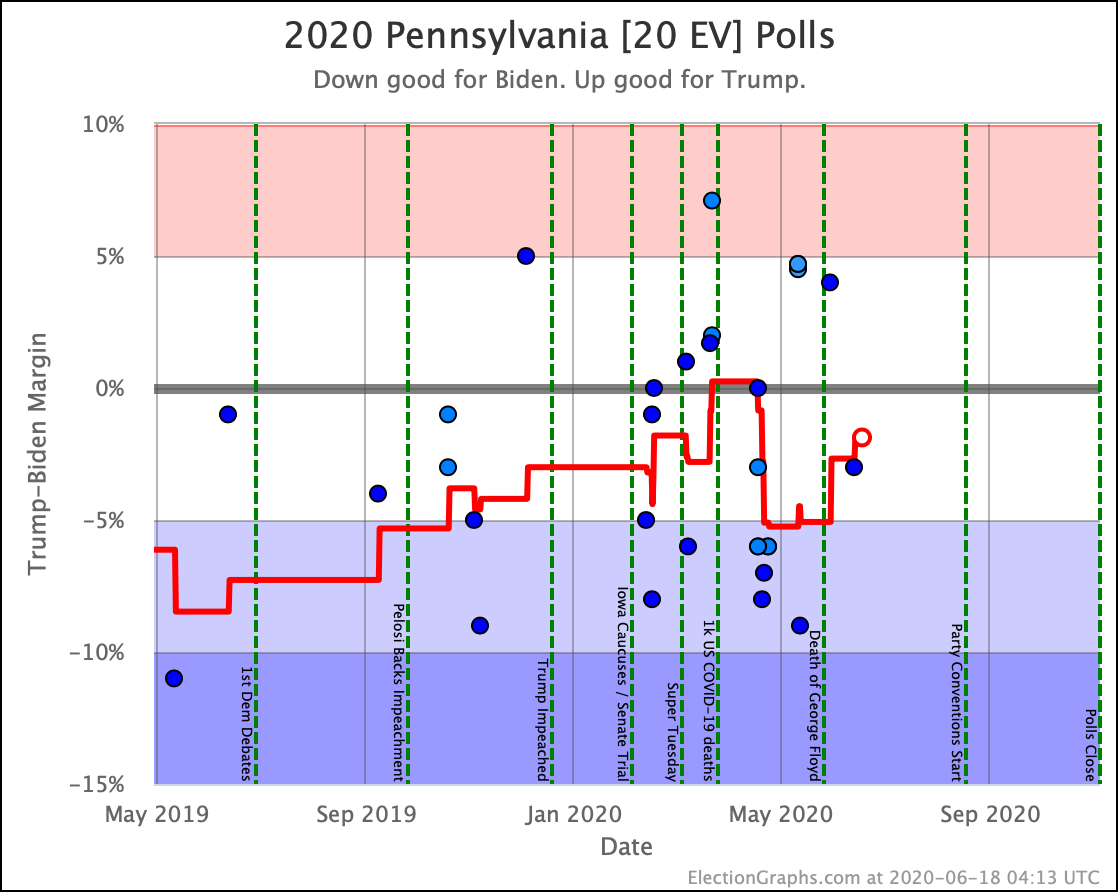
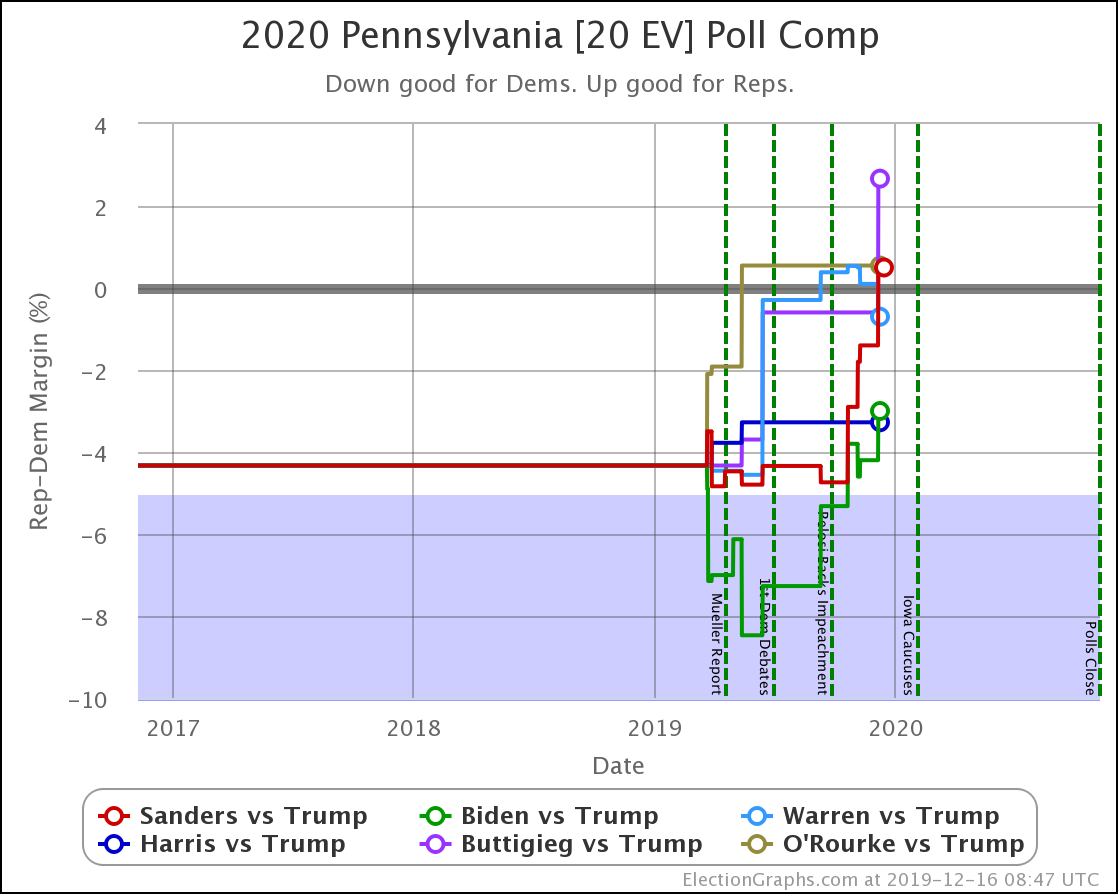
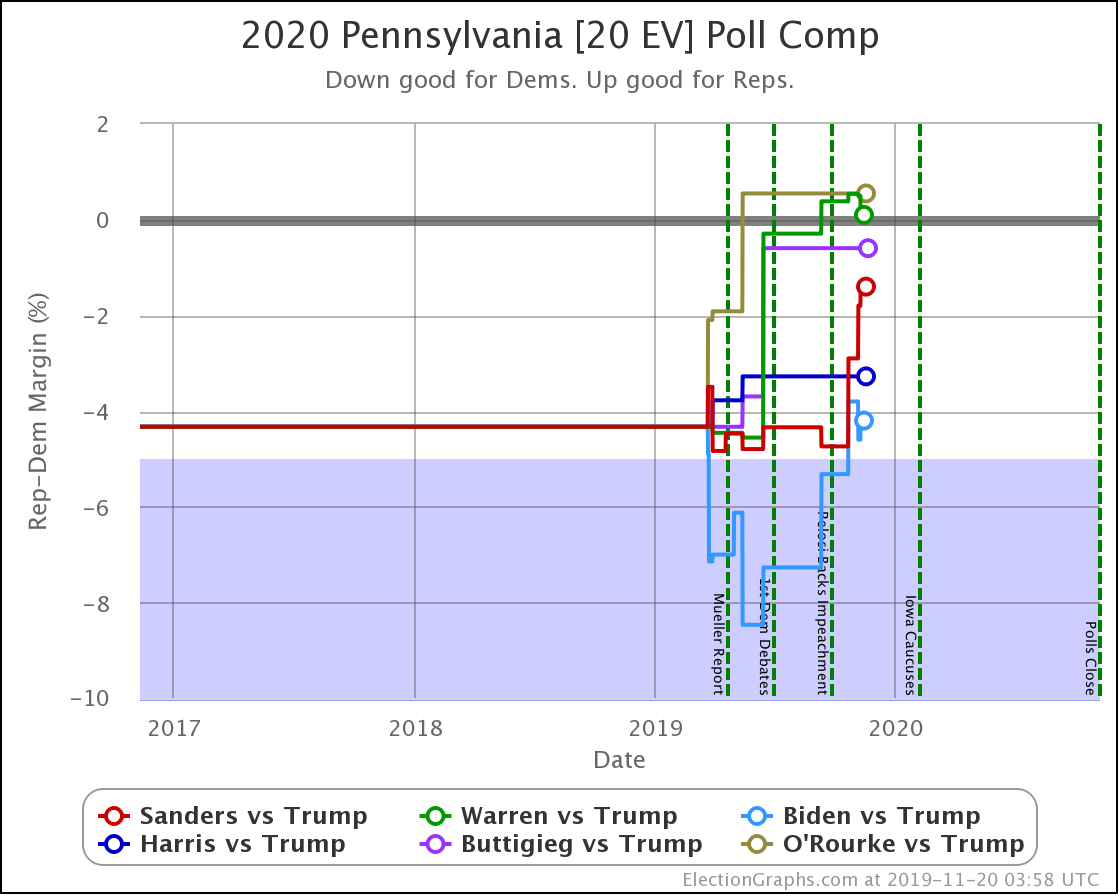
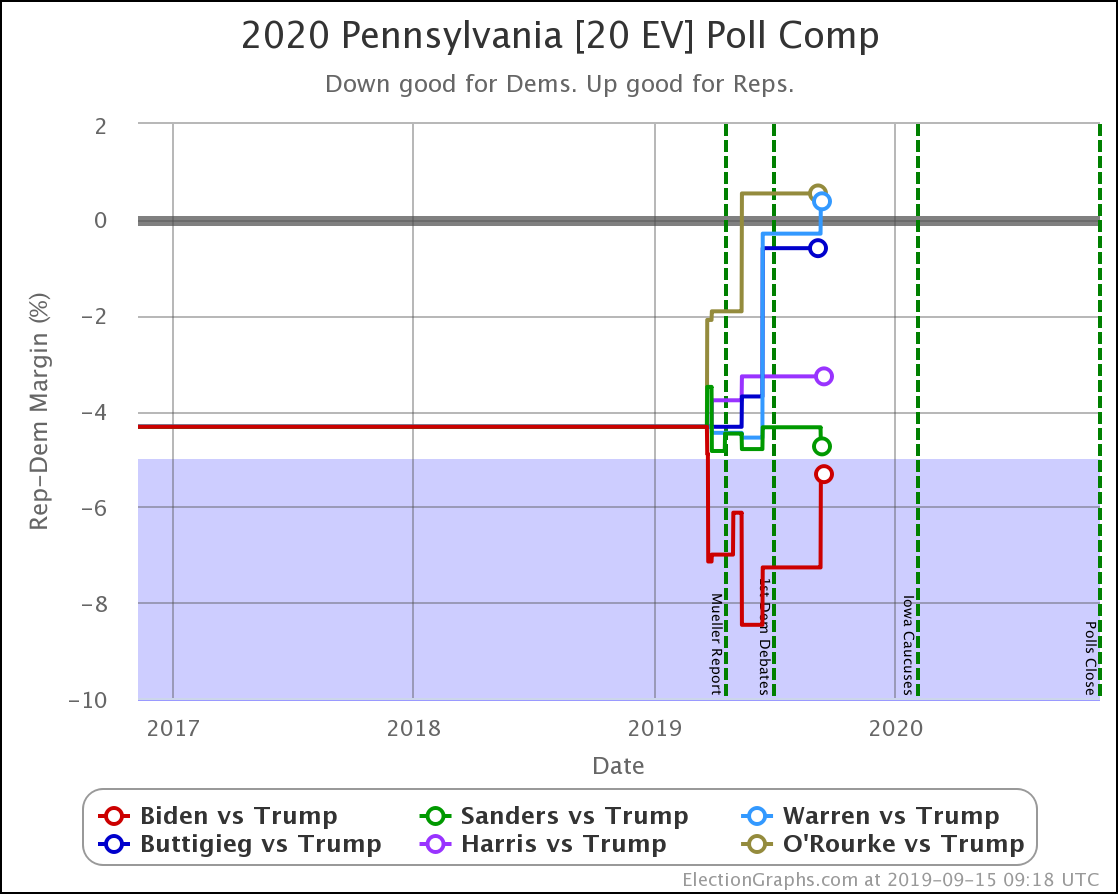
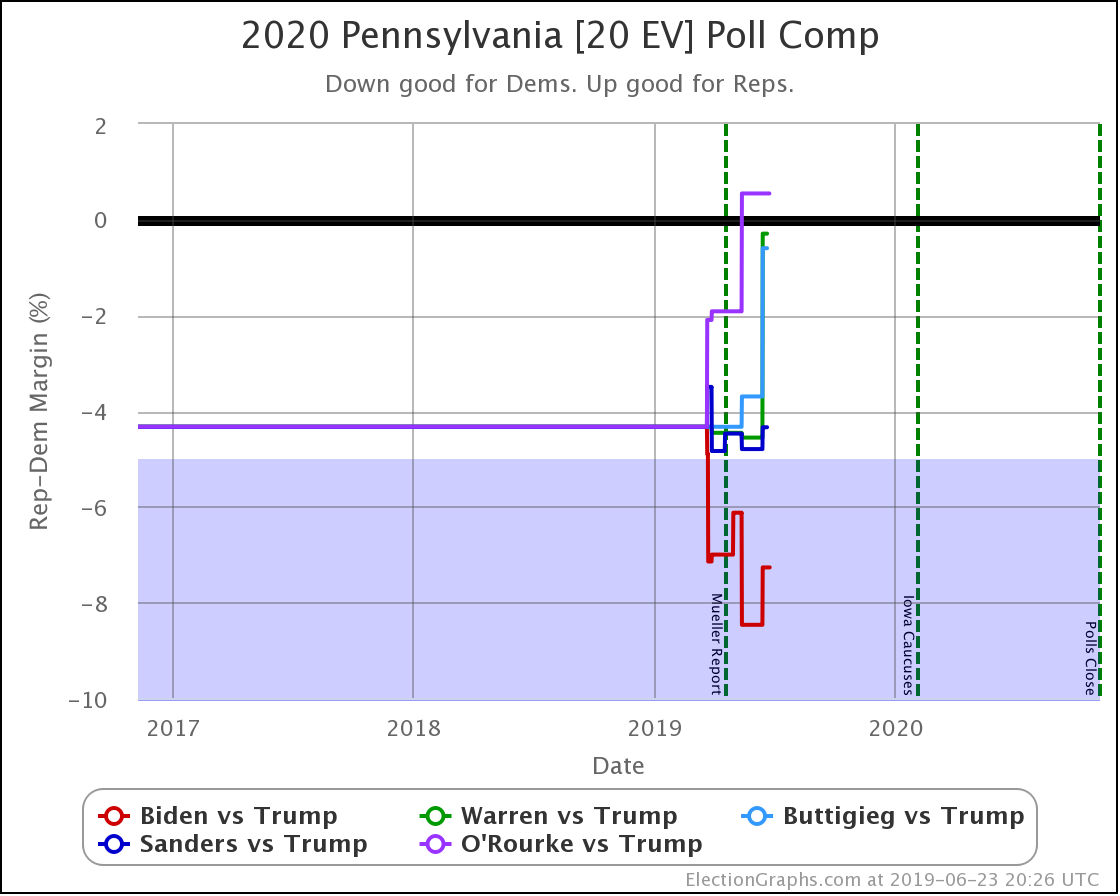
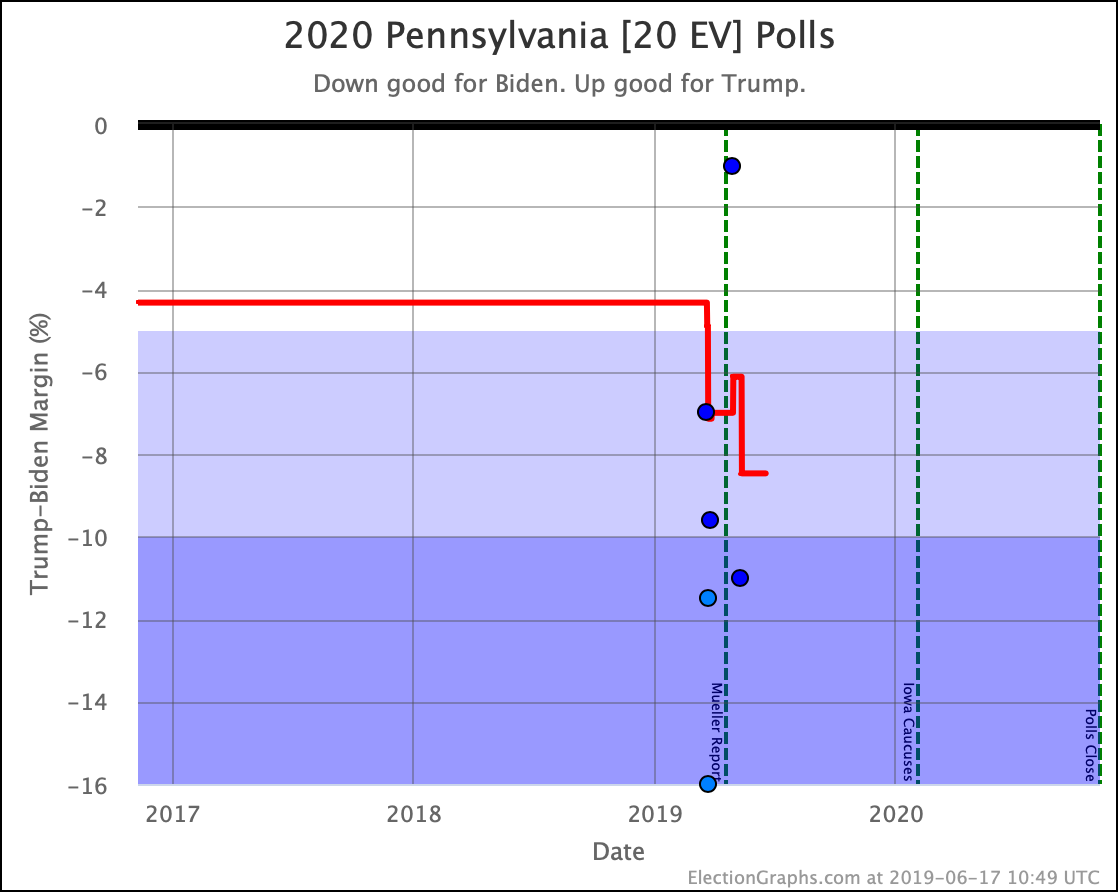
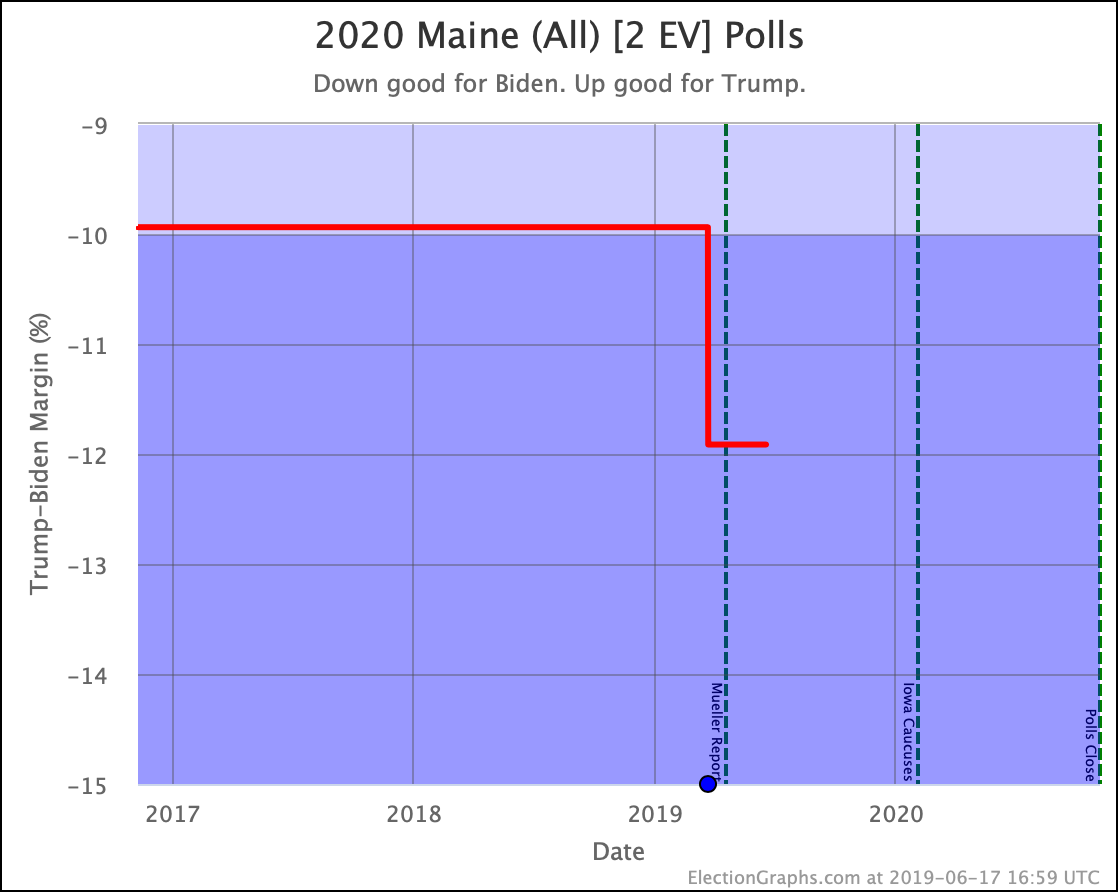
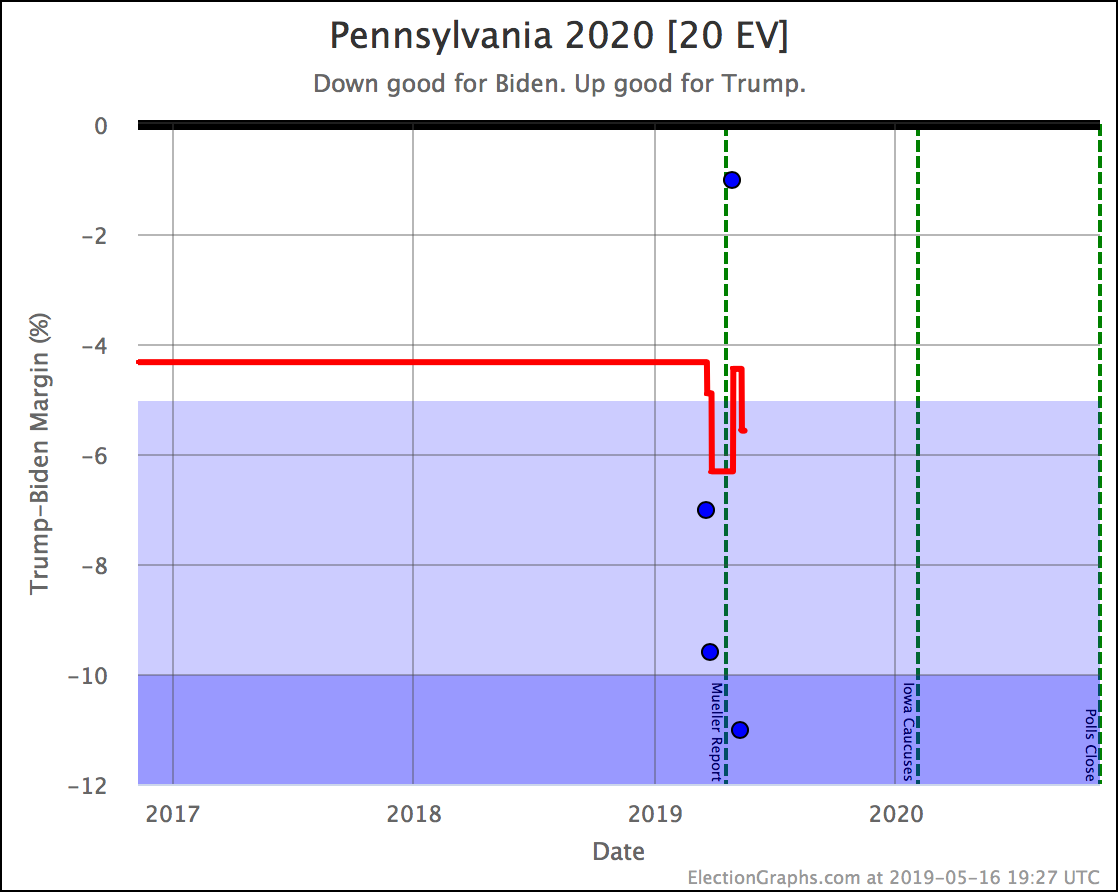
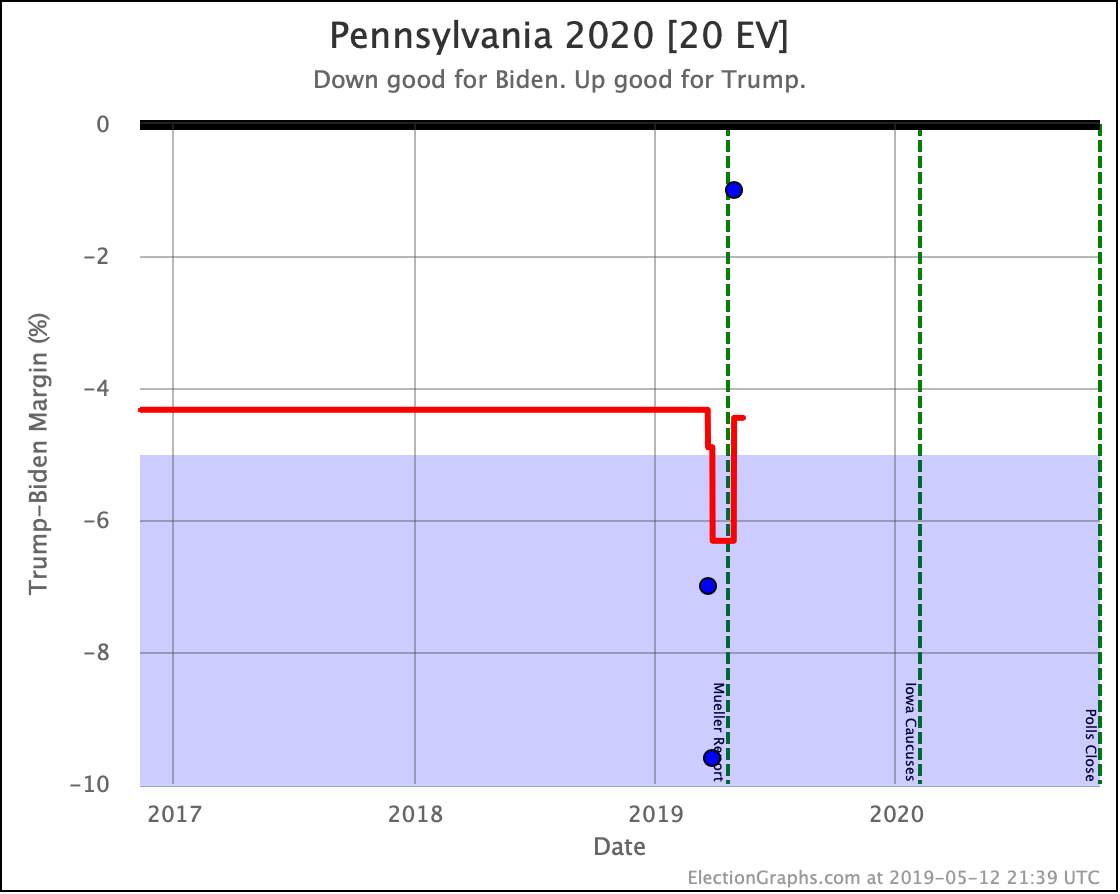
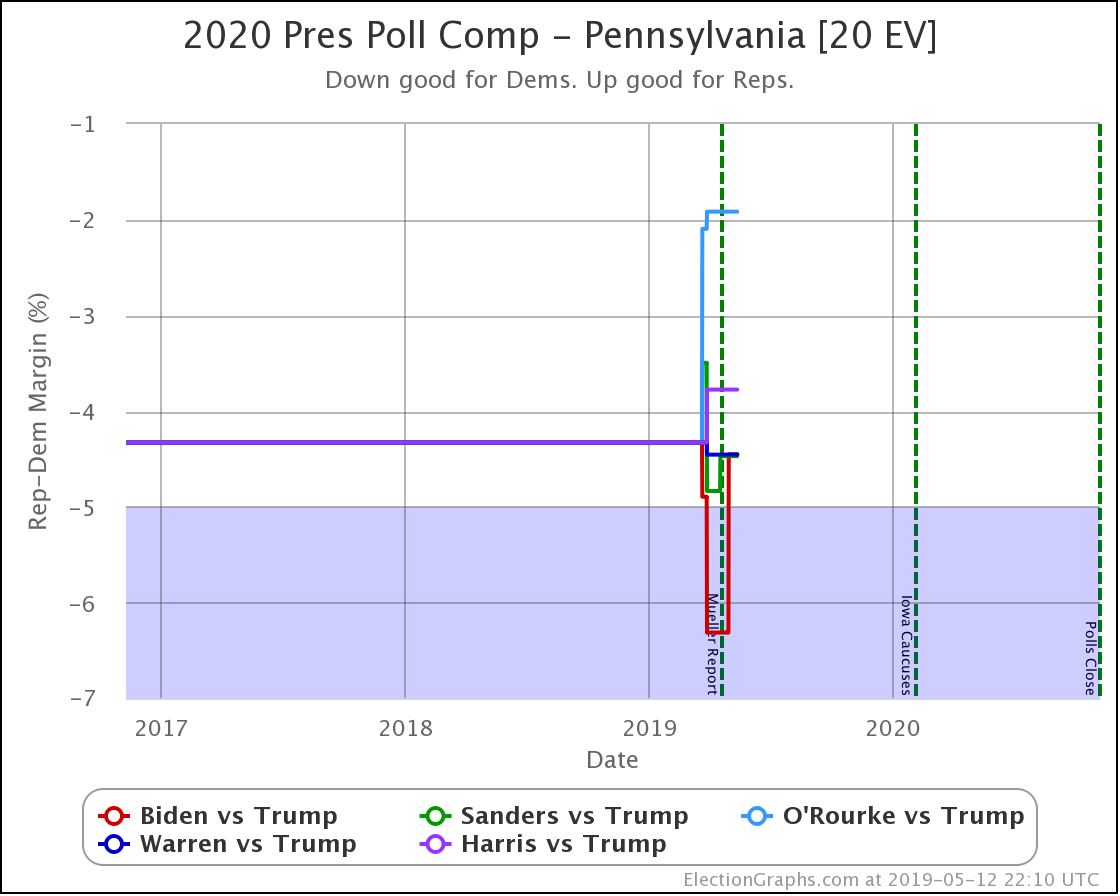
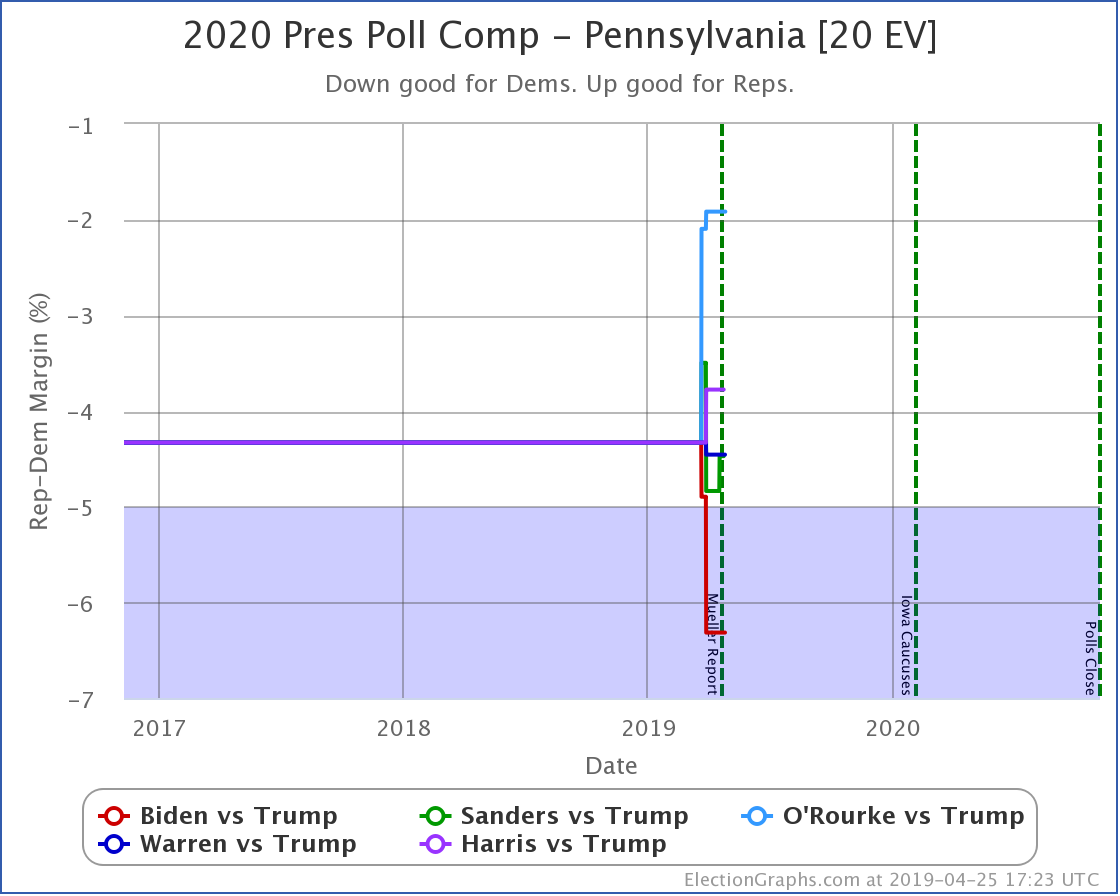
Pennsylvania also moves from "Weak Biden" to "Strong Biden" as a wave of new polls showing him ahead wash the most recent poll showing Trump leading Pennsylvania out of the average.
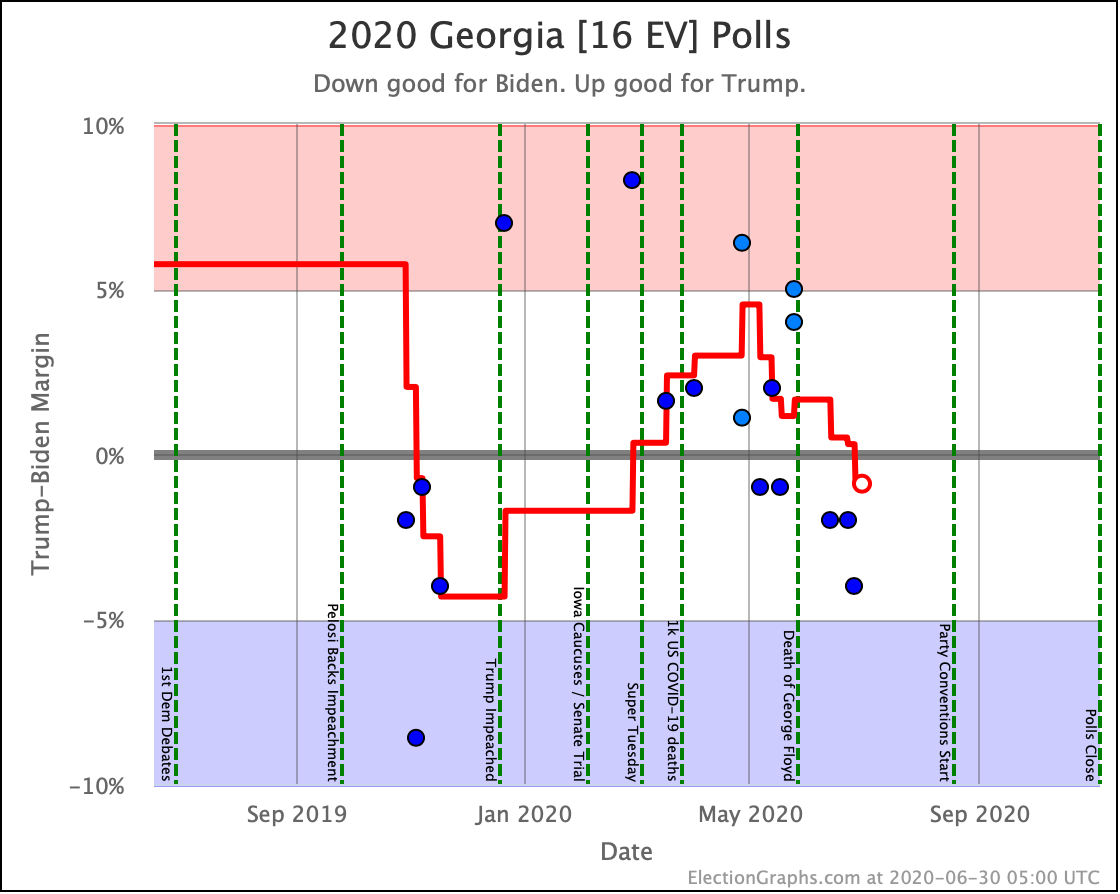
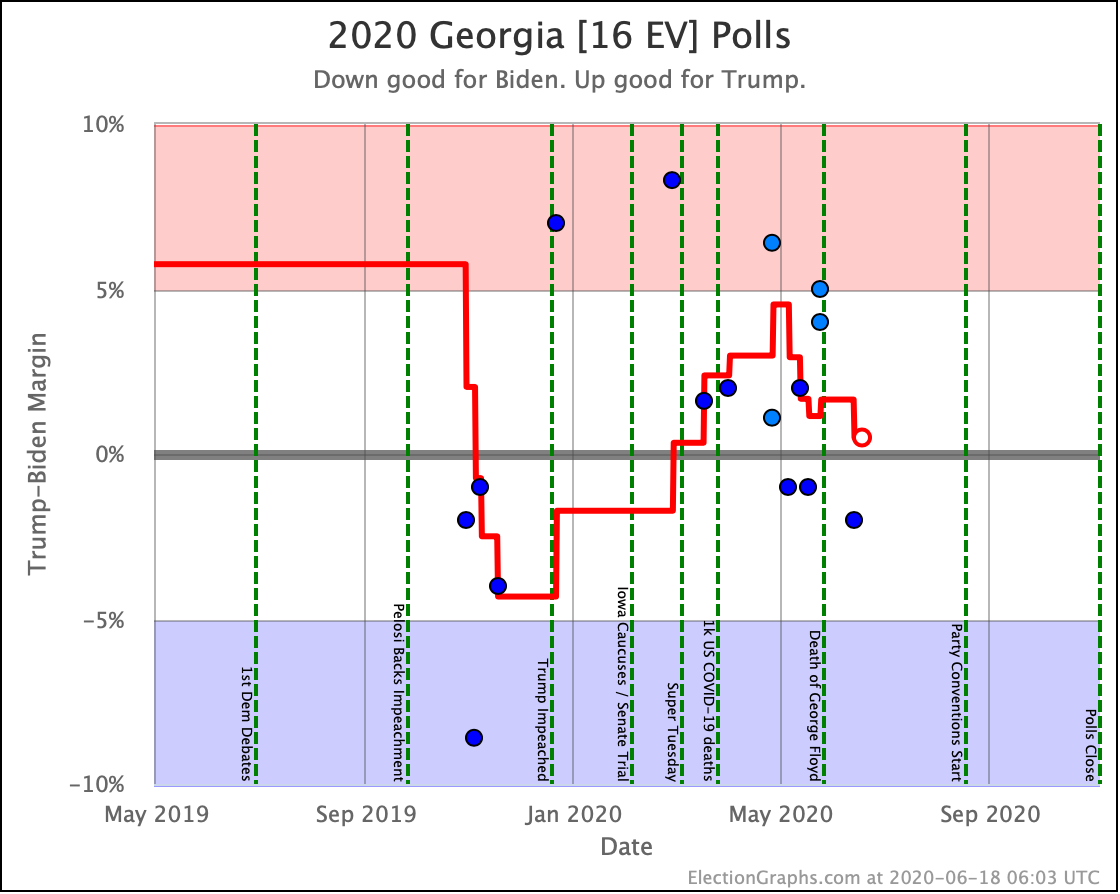
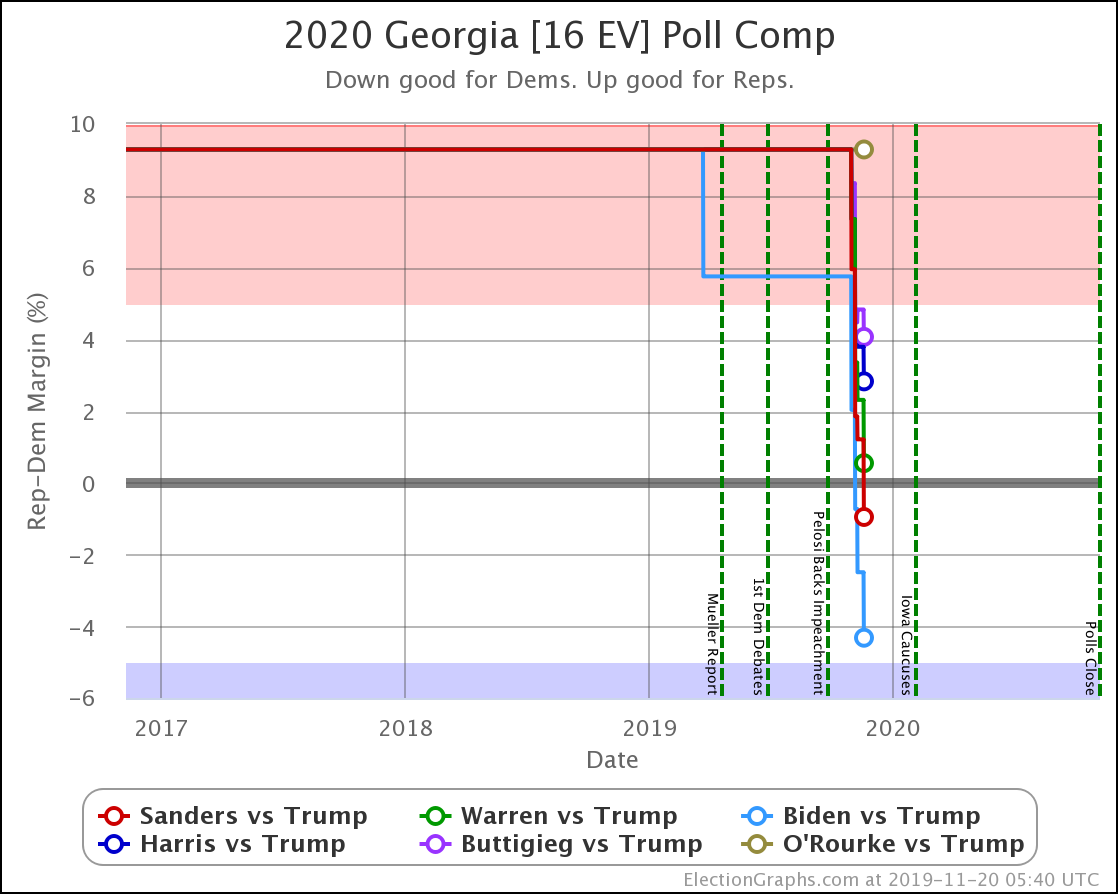
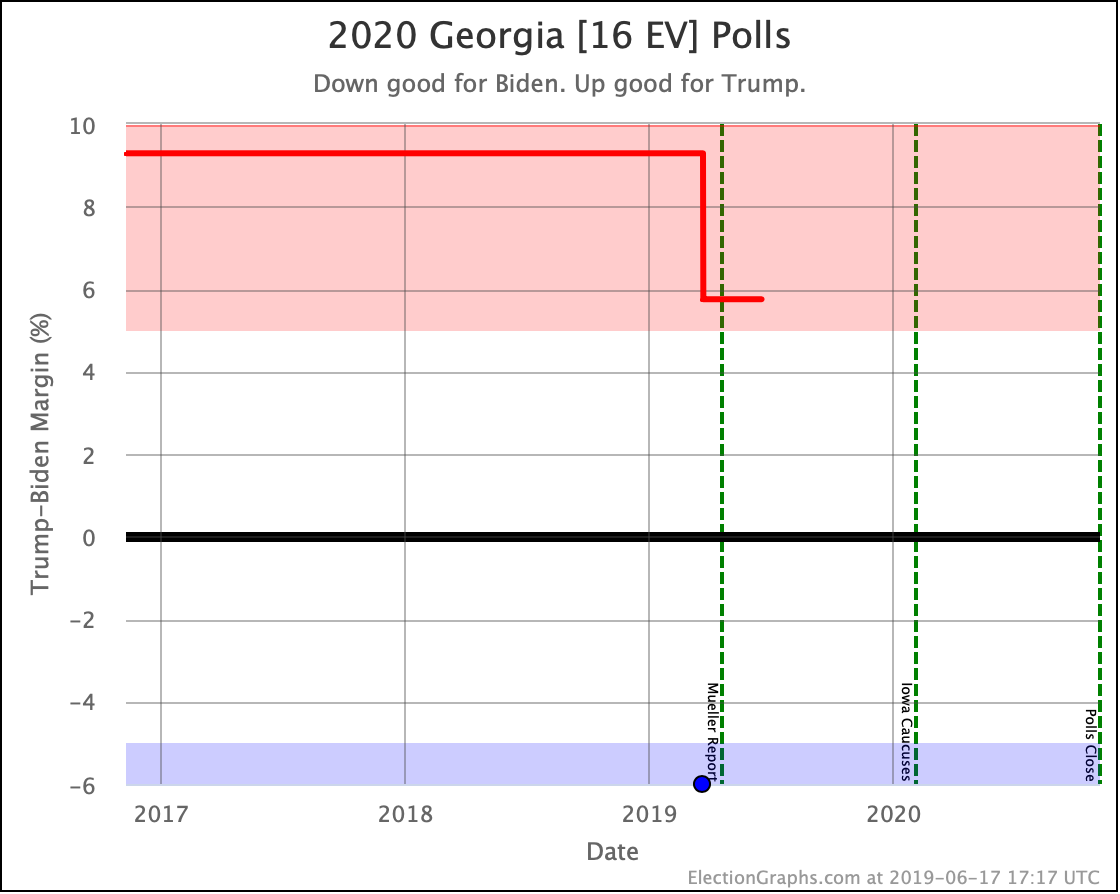
Now, Florida and Pennsylvania moving out of Trump's reach (for now) is big news, but perhaps the even bigger news is Biden retaking the lead in Georgia. Now, this is just barely. He leads by 0.9% in our average at the moment, which means we give Biden about a 55% chance of winning the state.
Georgia is clearly a battleground state at the moment, which is significant in and of itself, no matter which candidate is slightly ahead. In a world where Trump was doing well, you would not expect him to have to be fighting for Georgia, let alone be losing it.
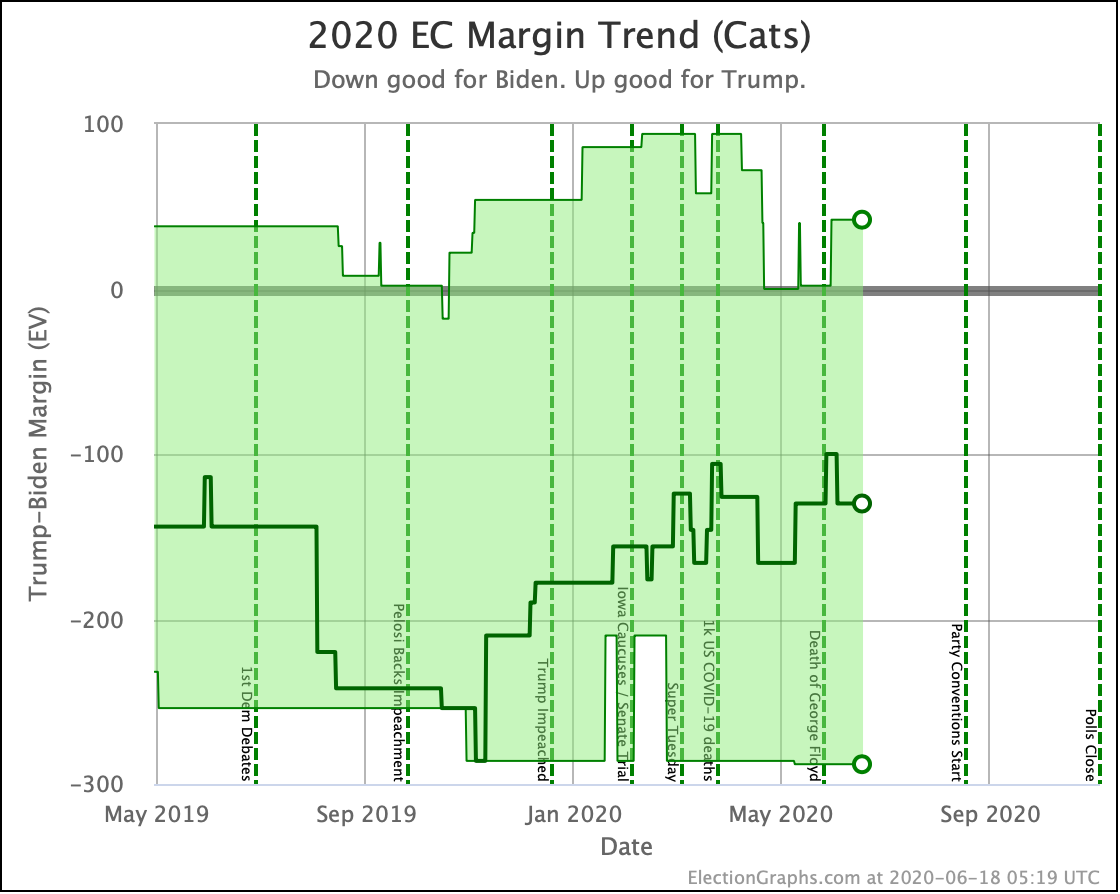
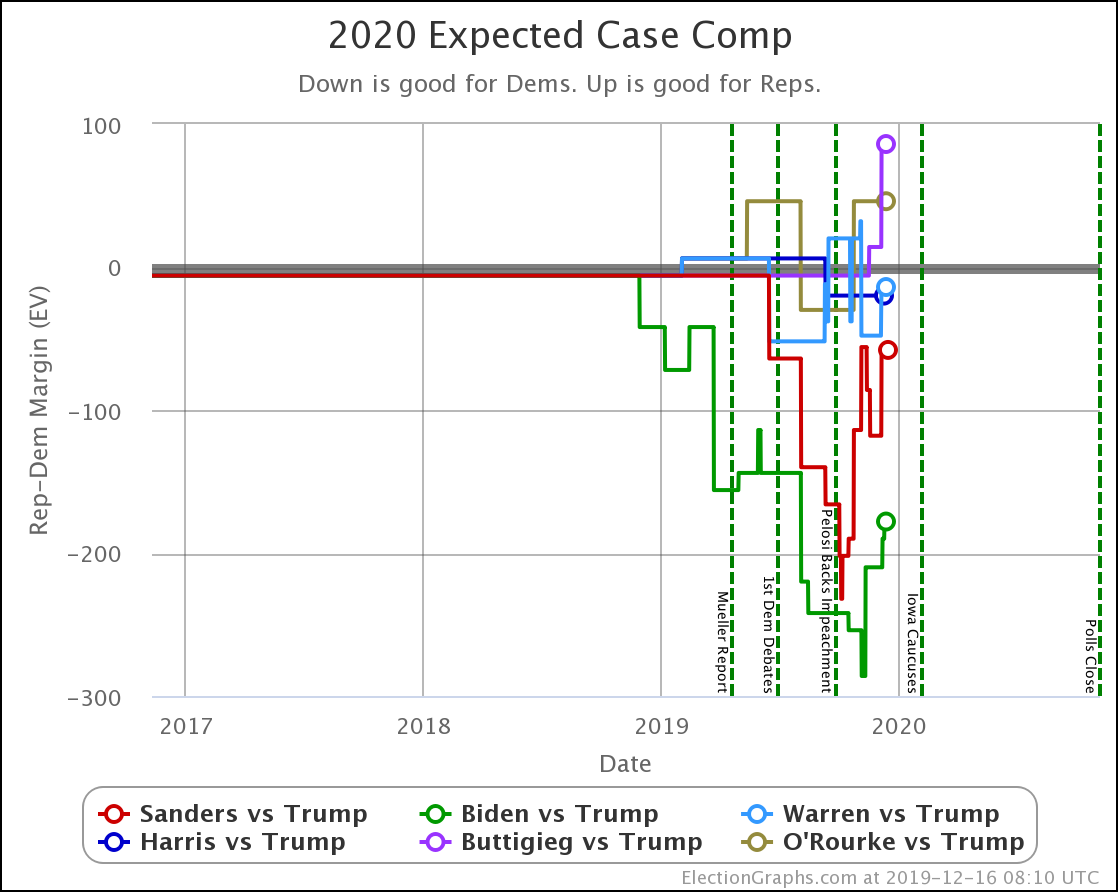
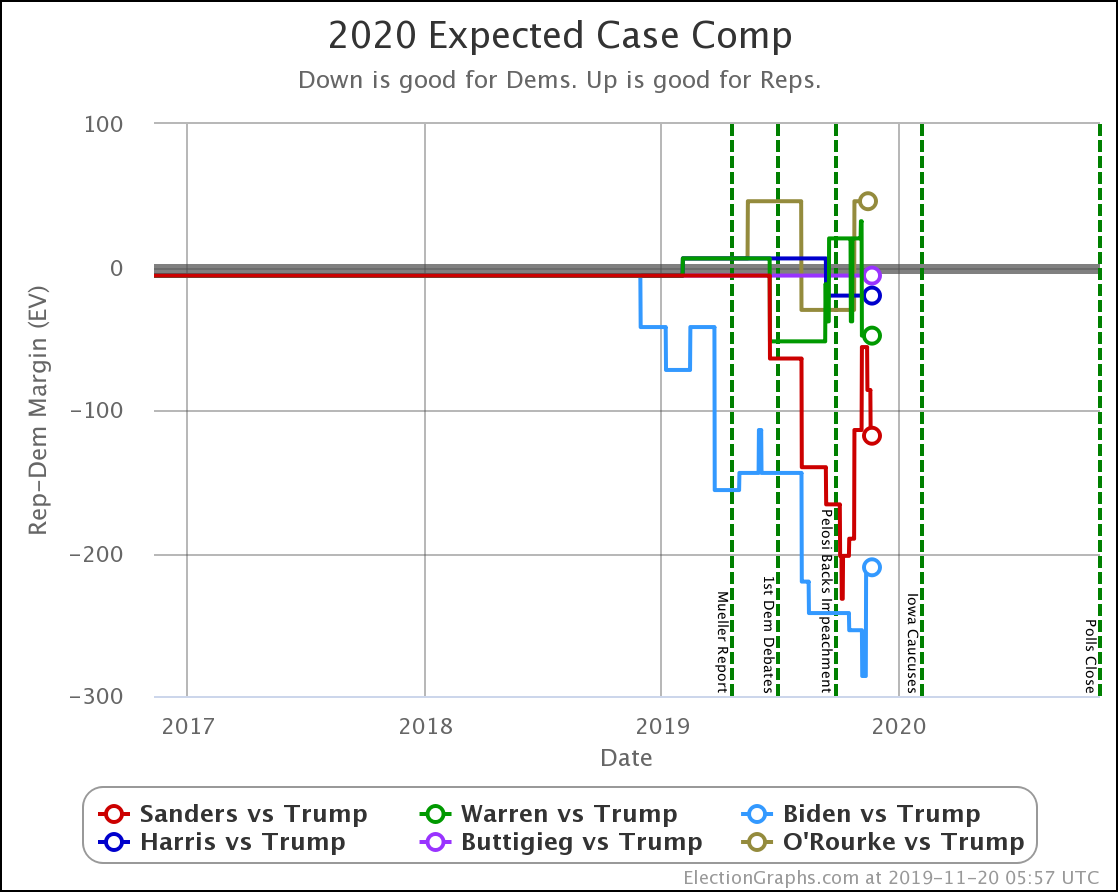
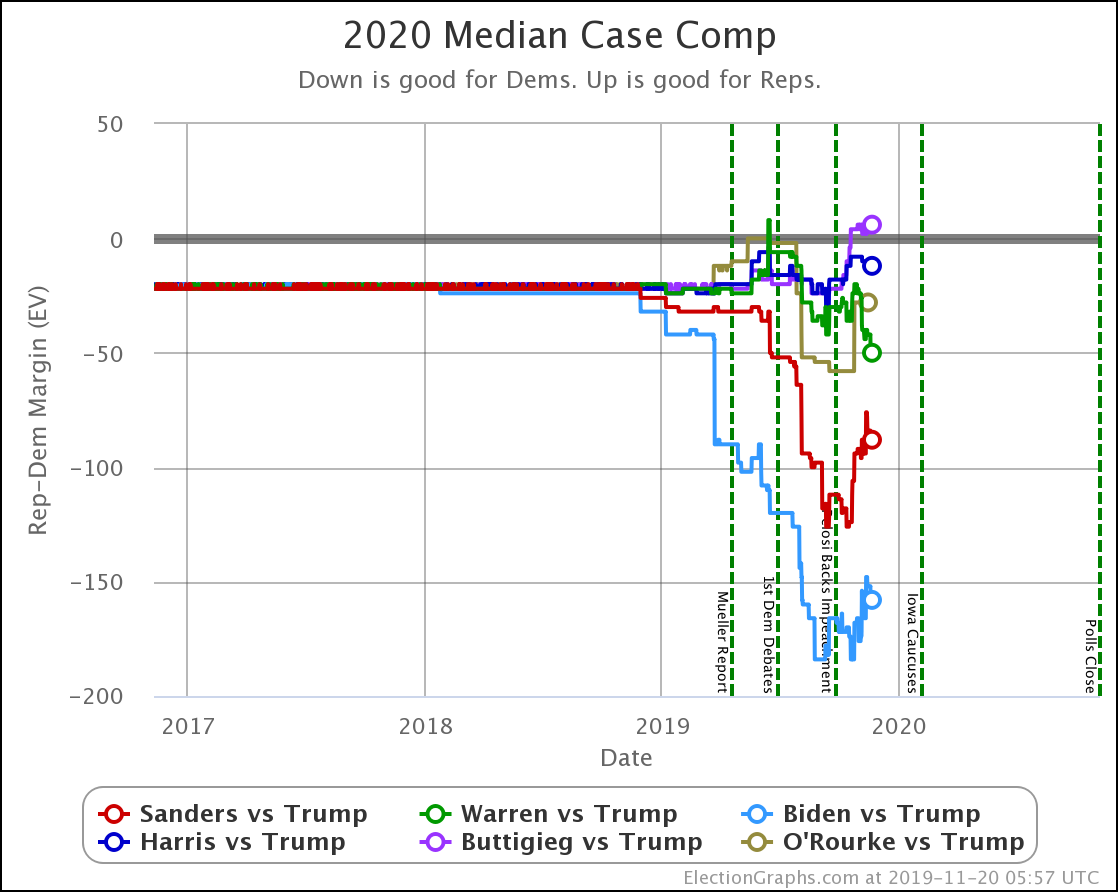
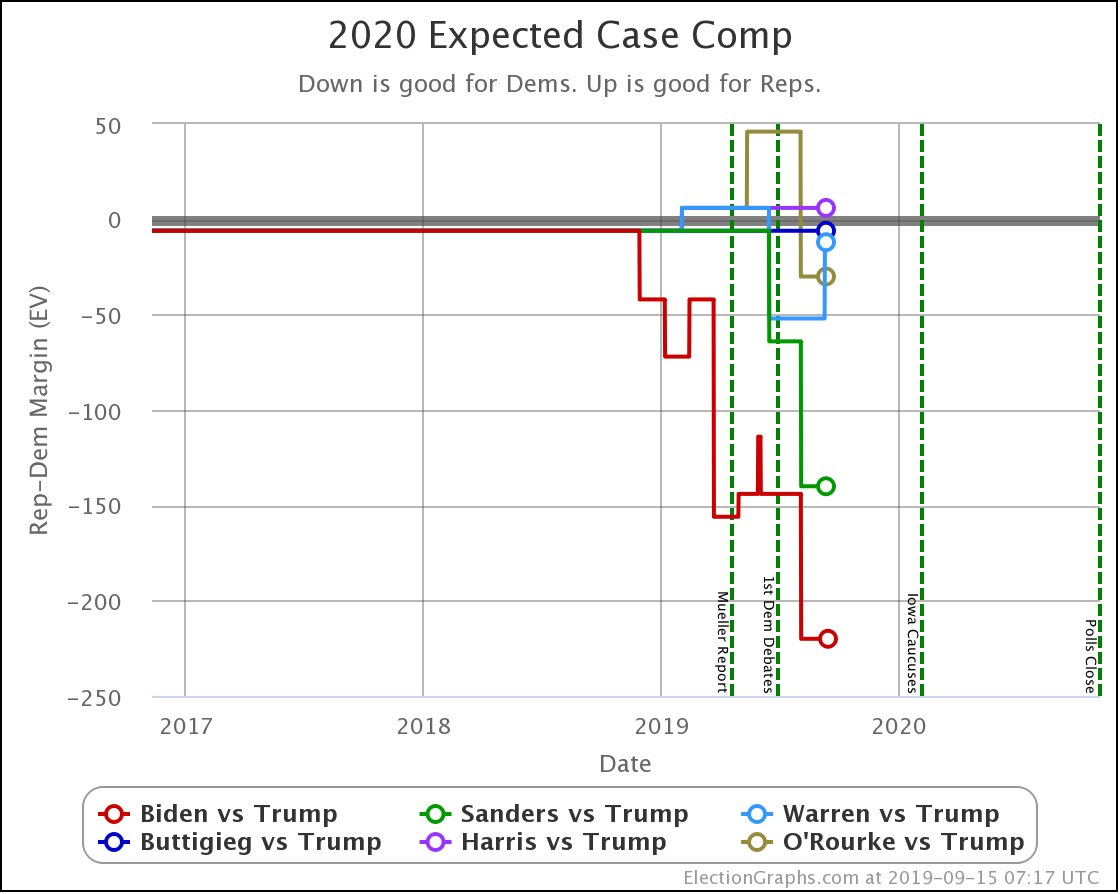
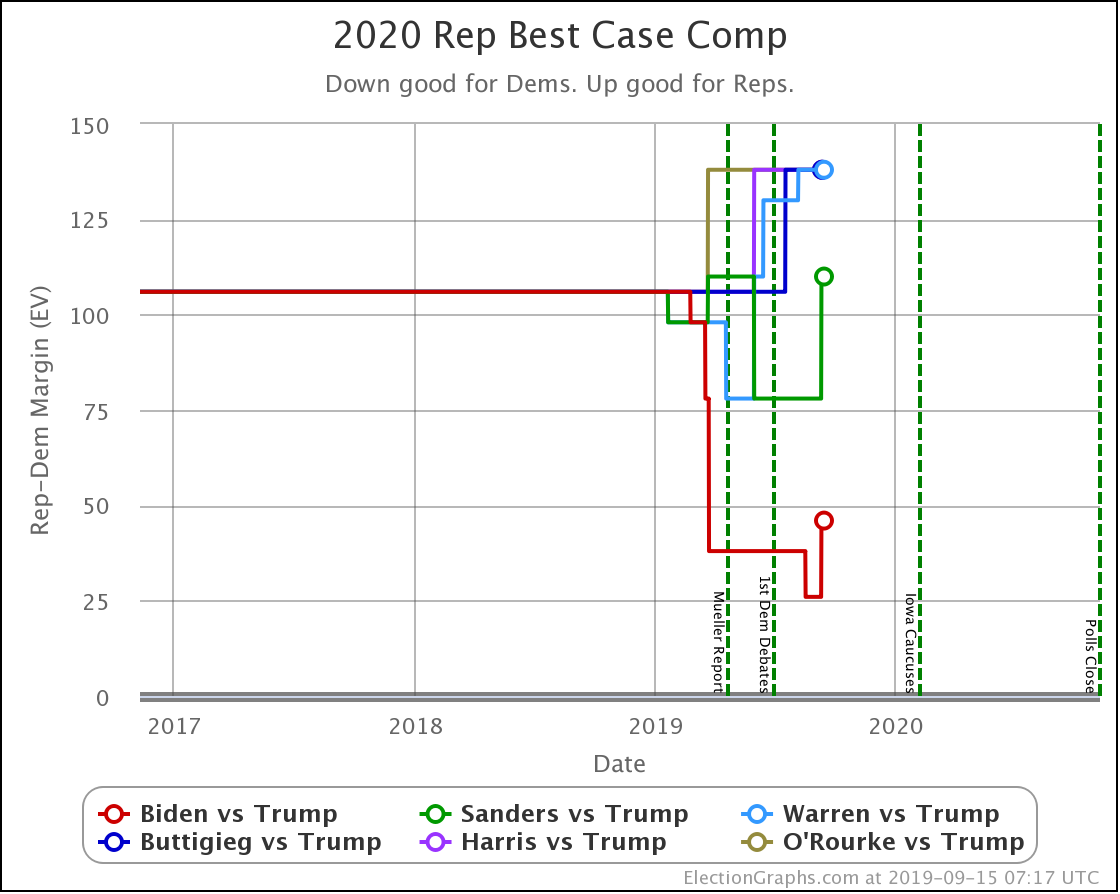
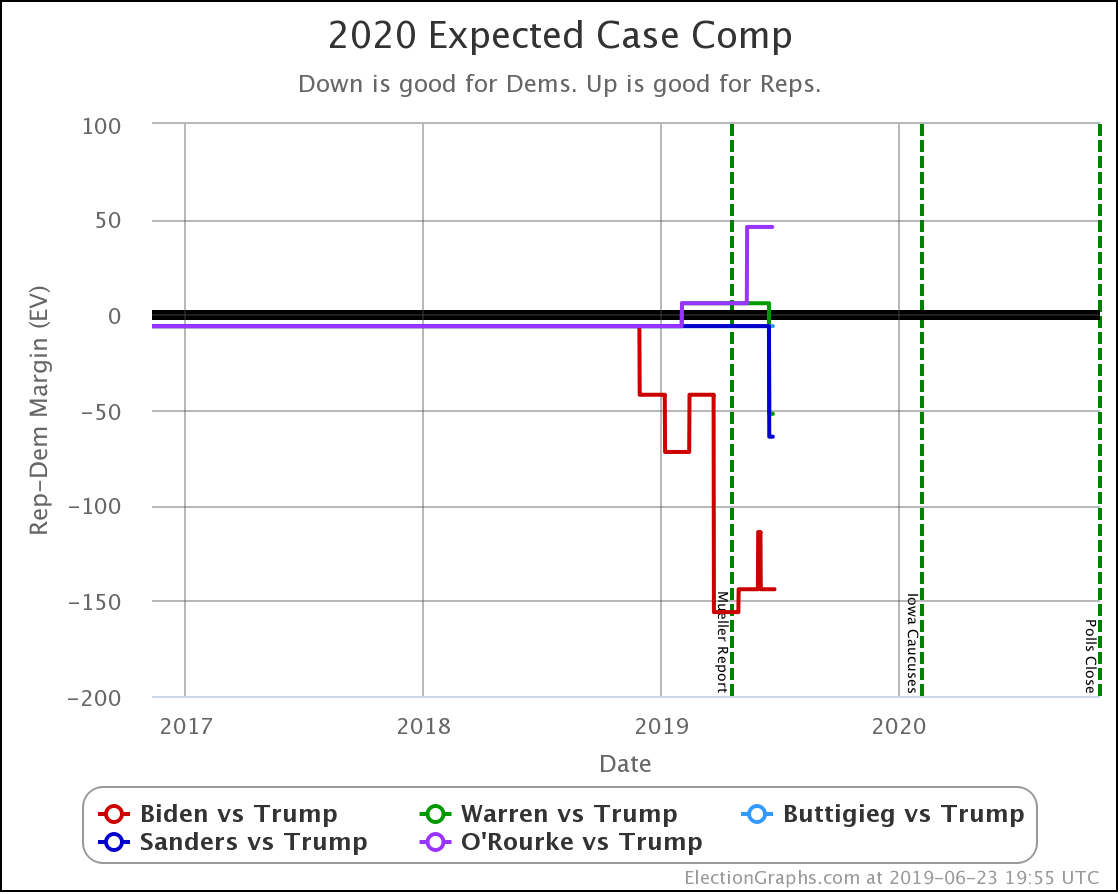
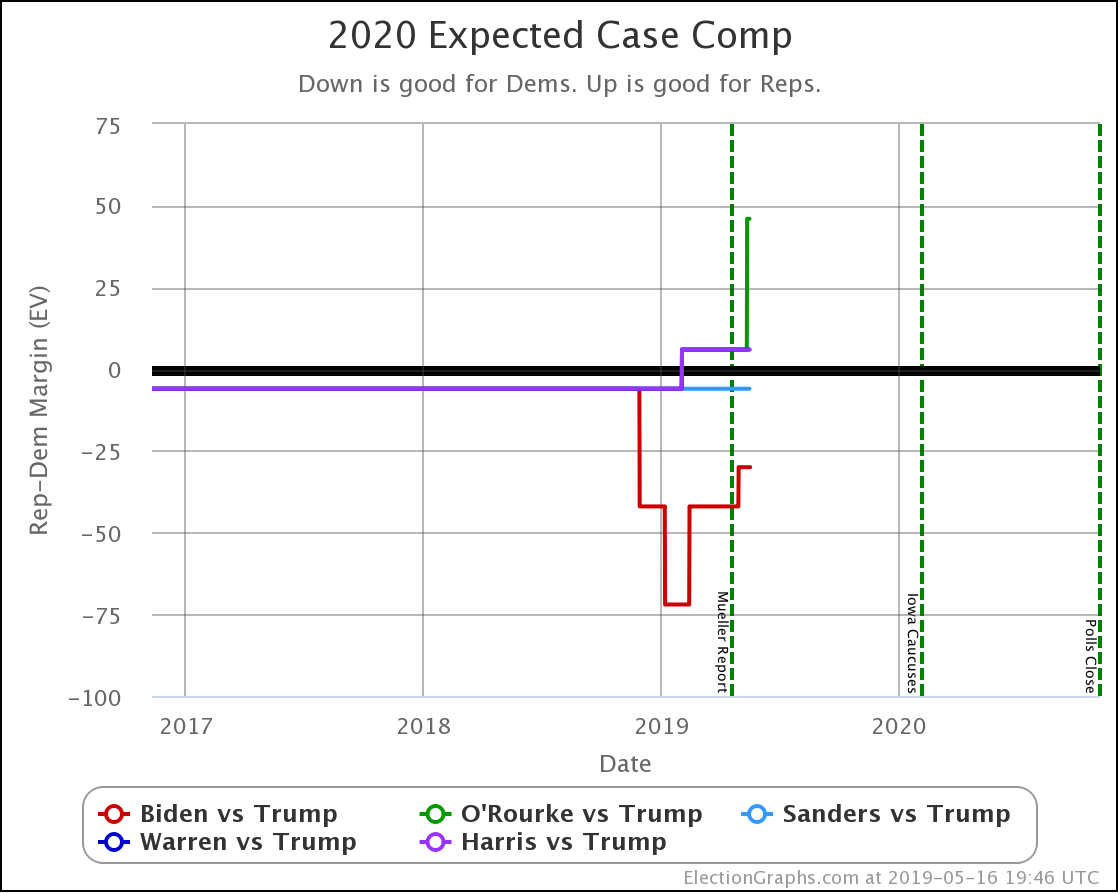
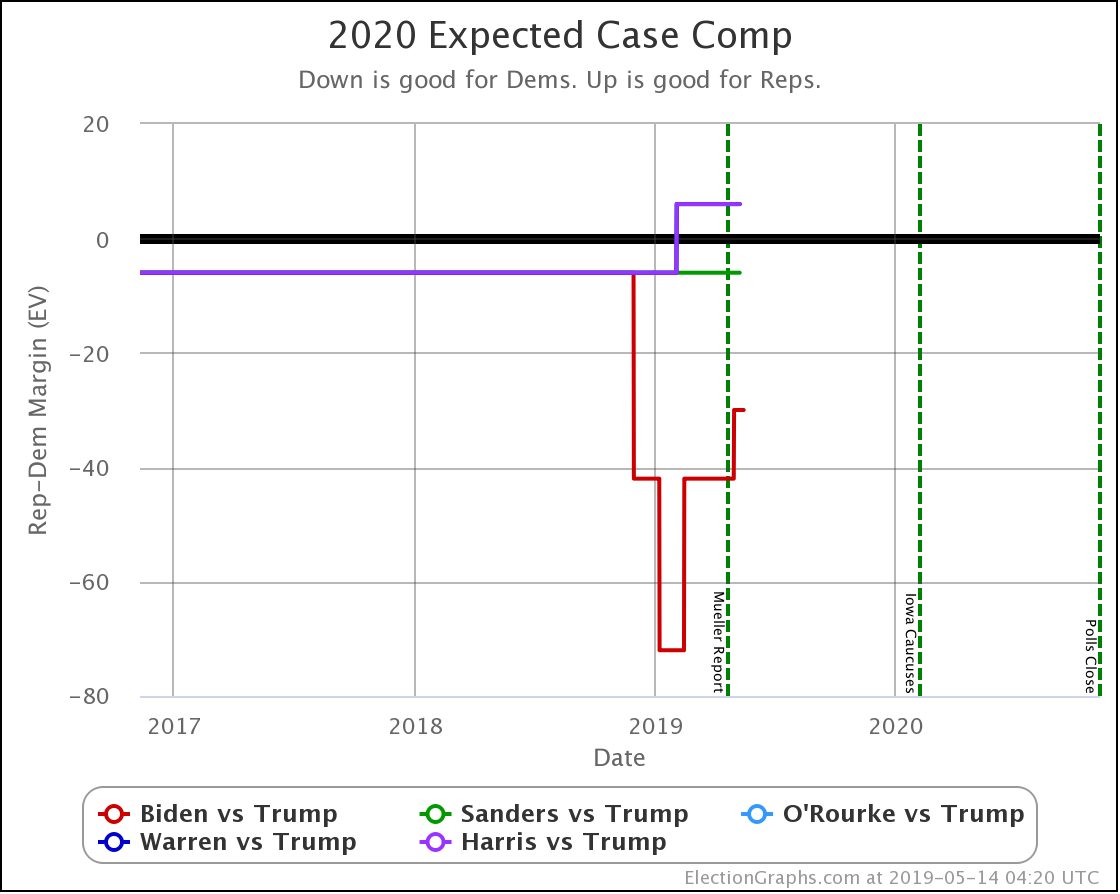
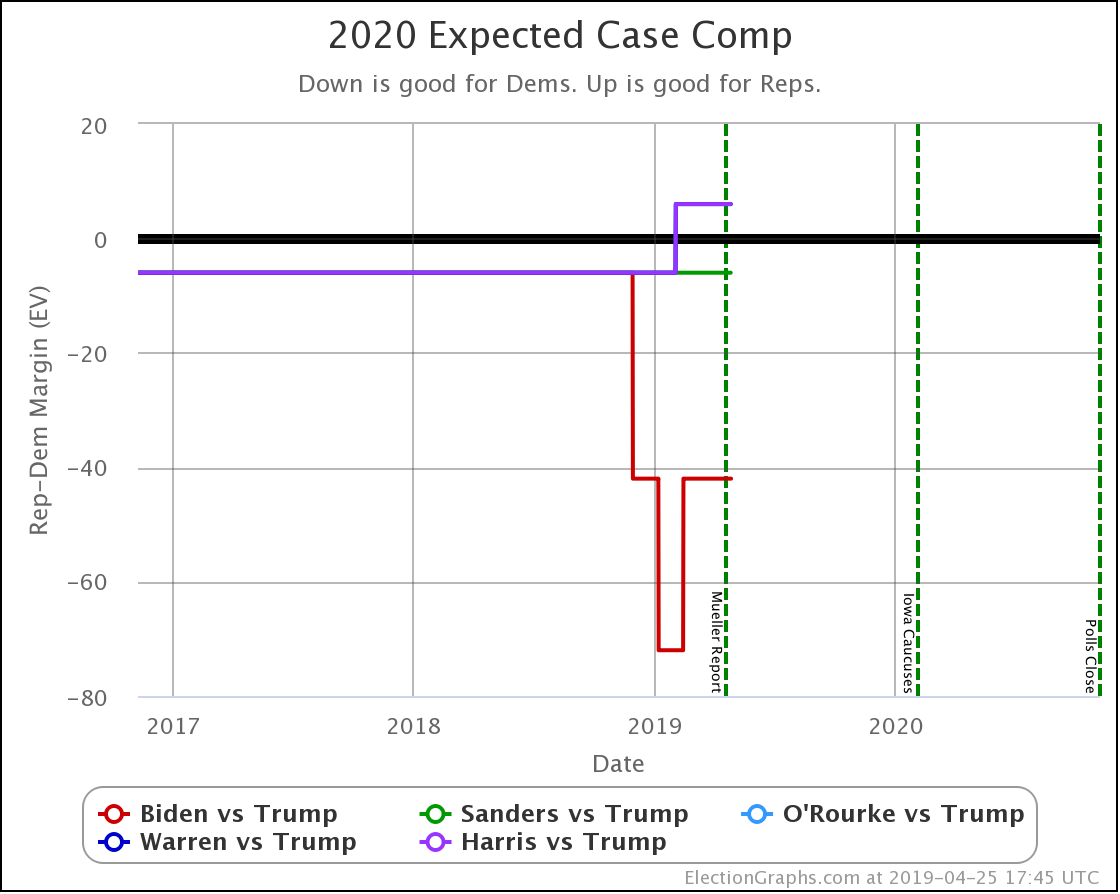
With these categorization changes, you get this chart for the range between the categorization view's best and worst cases for each candidate:
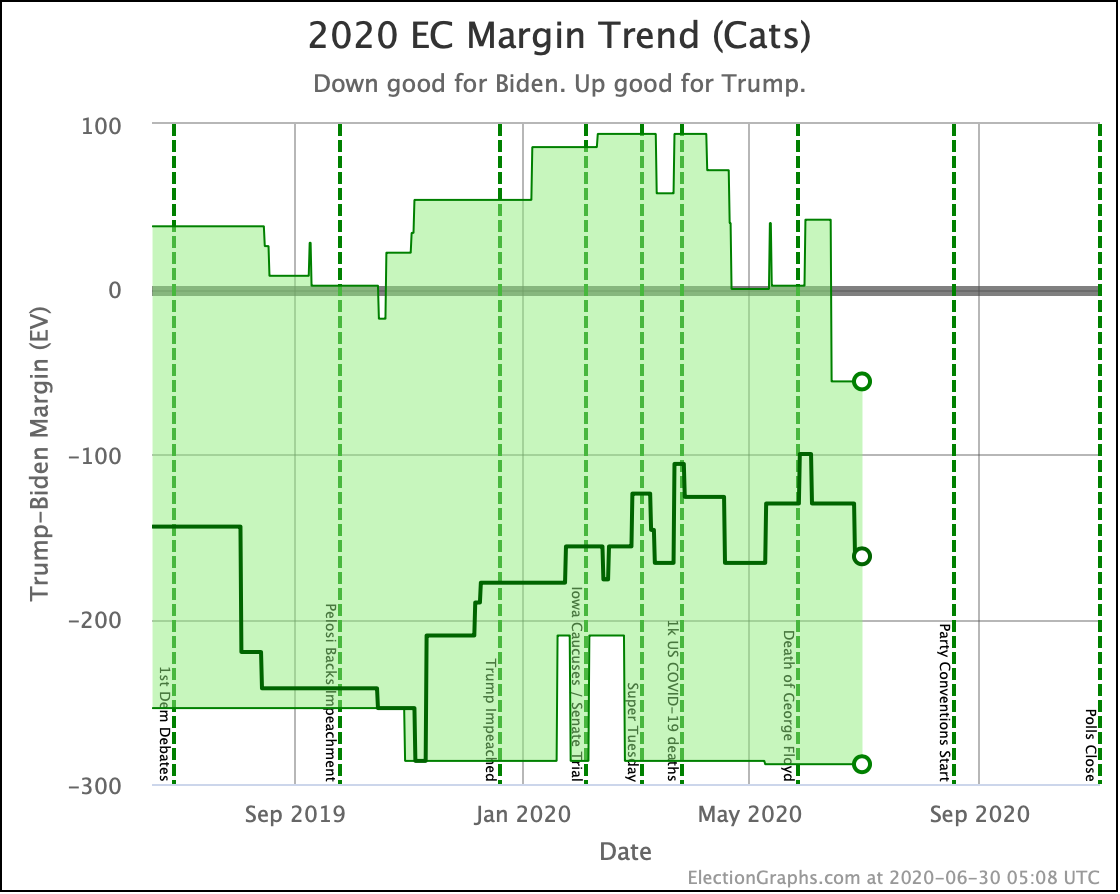
In terms of the central "expected case" line, we are at a 162 EV win for Biden, which is almost, but not quite back to the 166 EV win we had for him in early May.
But Trump's best case is not only a loss for the first time since last October, but it is also the worst it has ever been in the Biden vs. Trump matchups. At this moment, if Trump were to win EVERY close state, he would still lose to Biden by 56 electoral votes.
Of course, the categorization model is very coarse. Let's look now at the rest of the close states that had new polling since our last update and see how those change the probabilistic model.
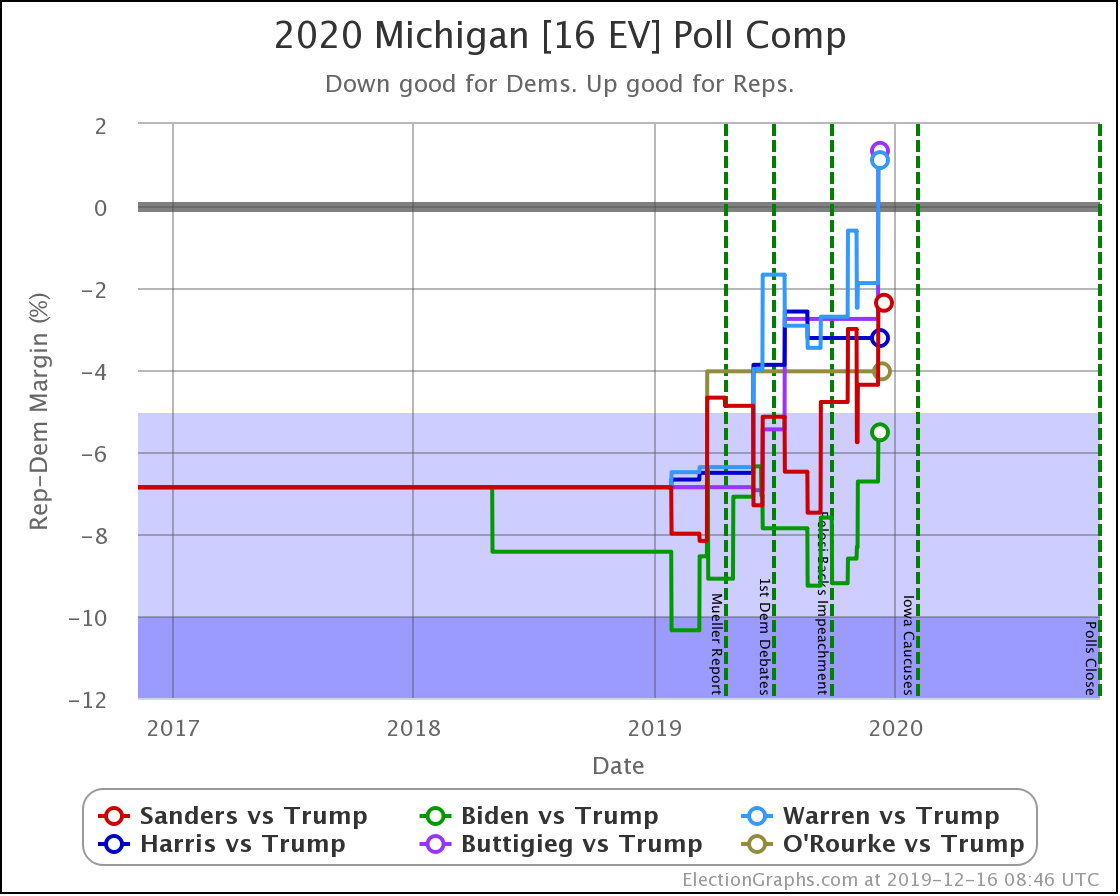
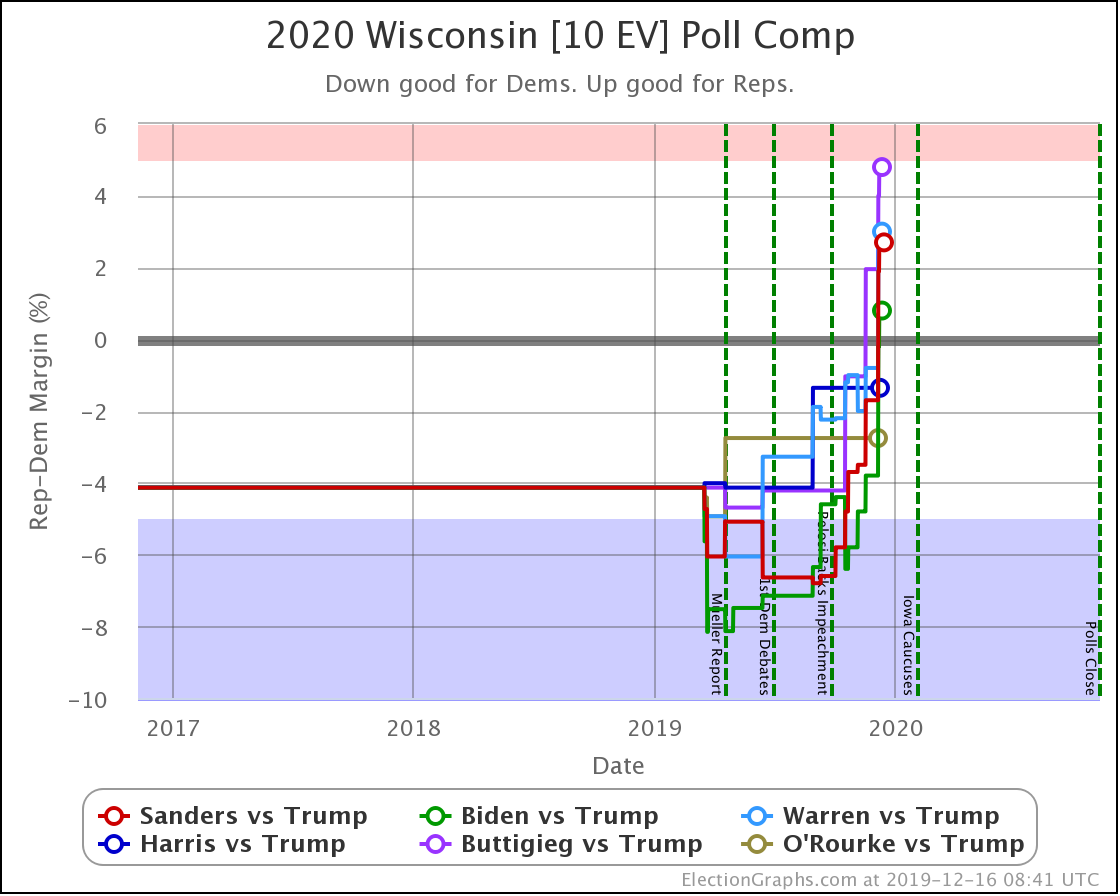
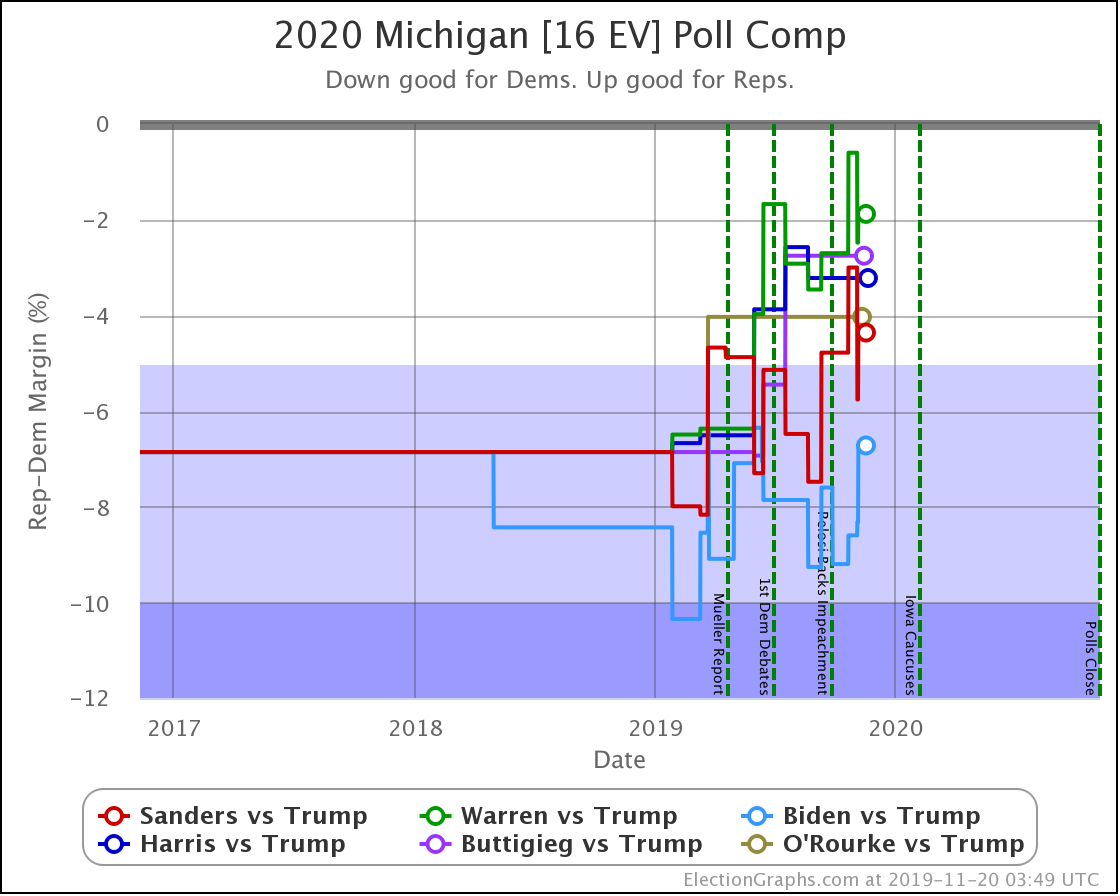
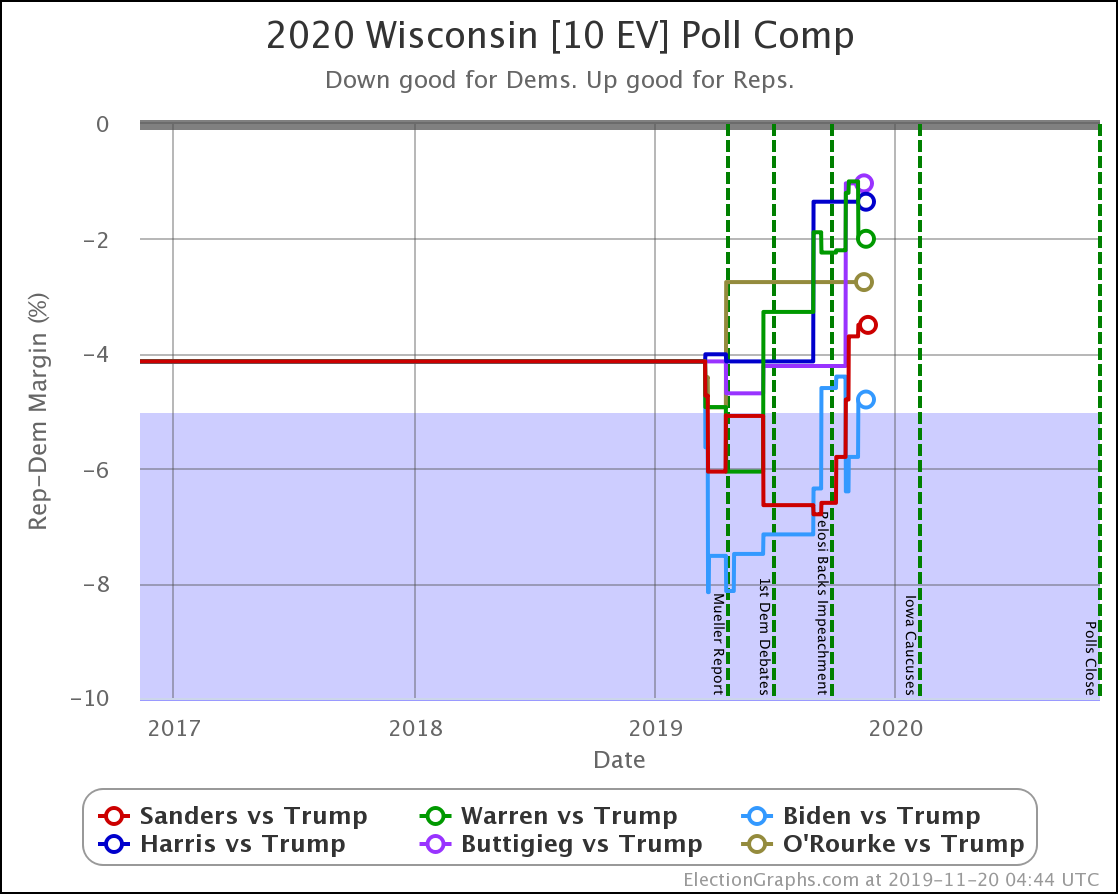
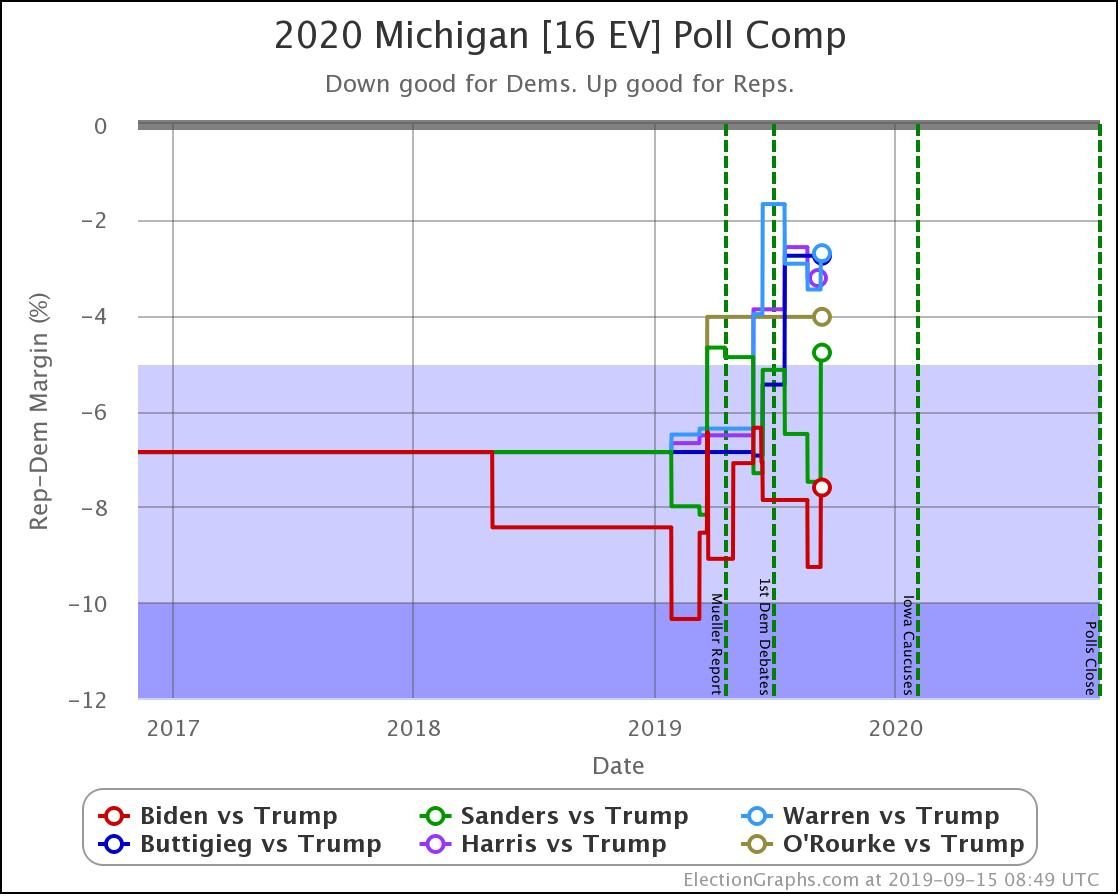
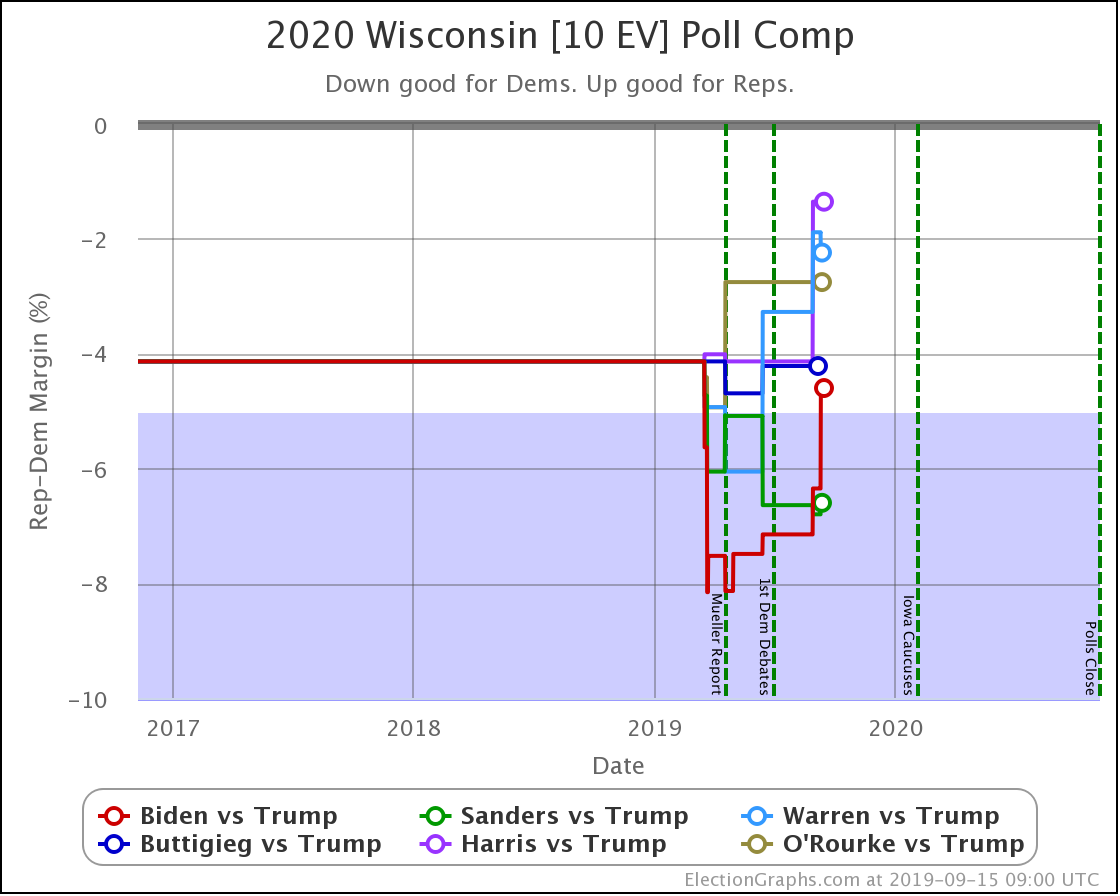
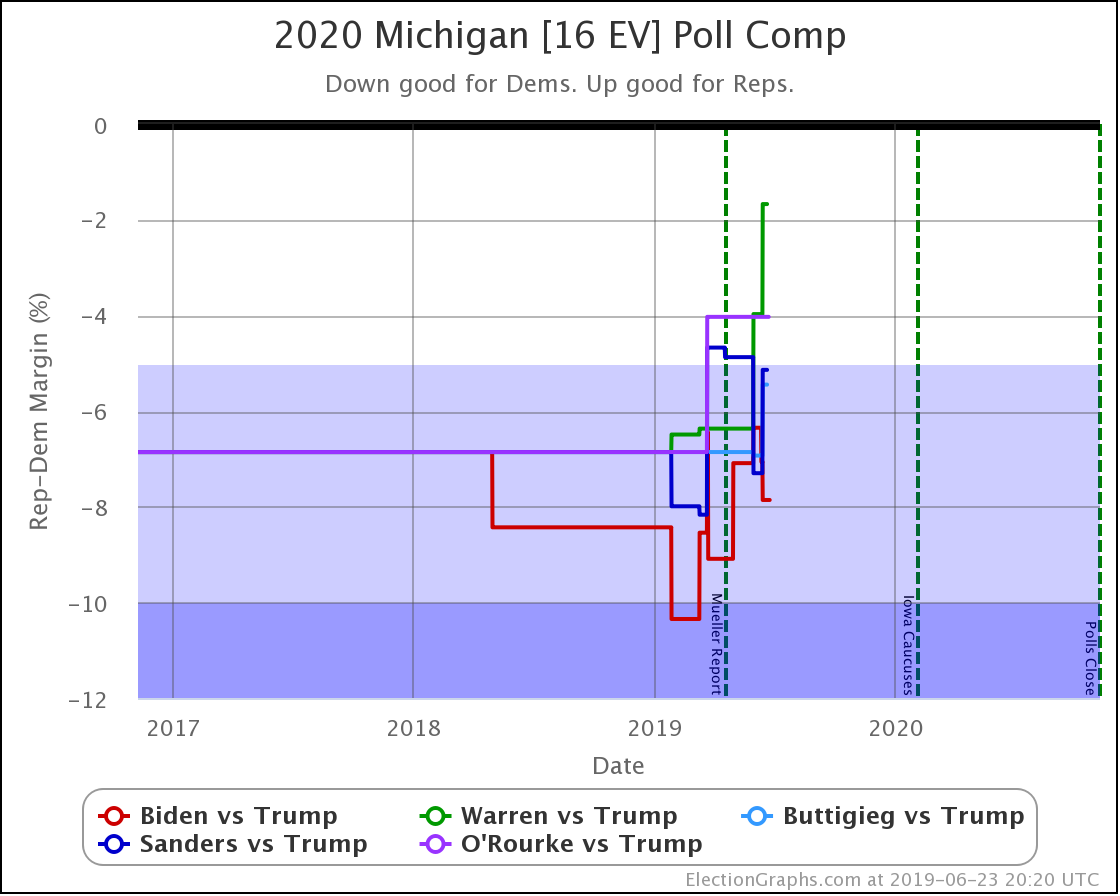
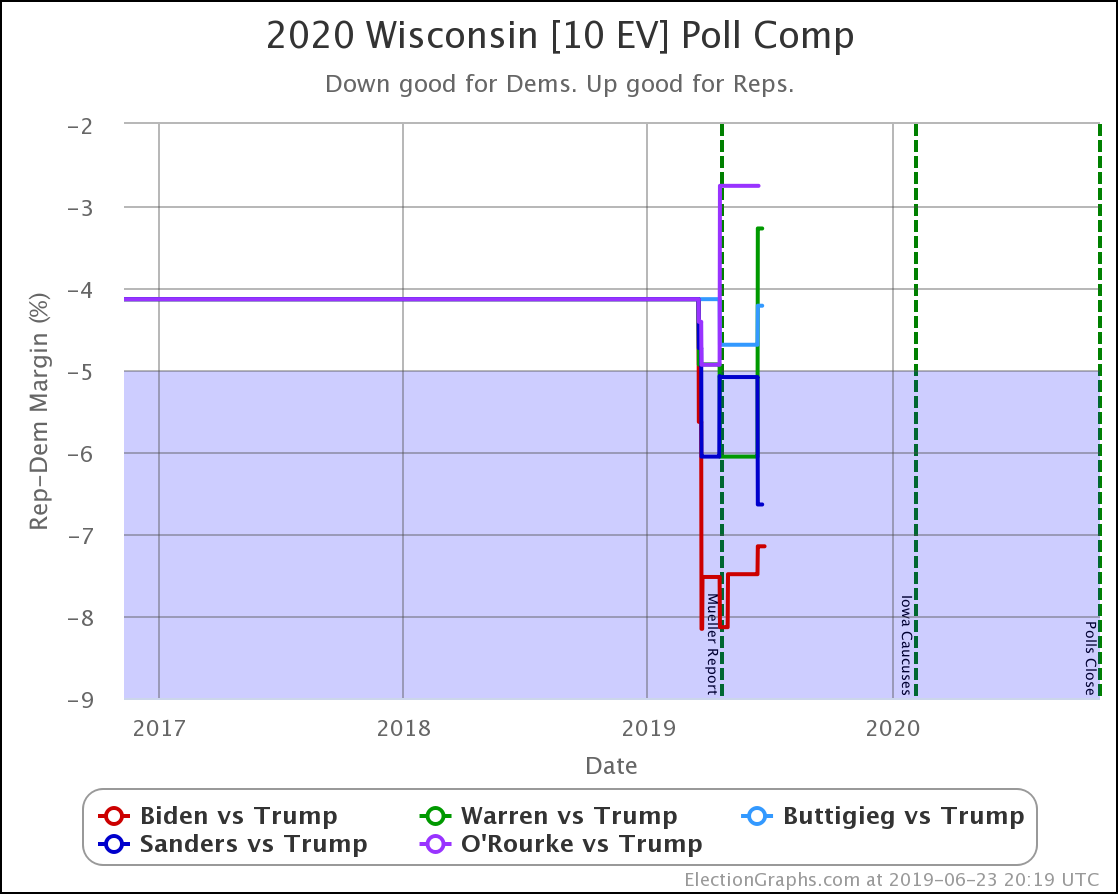
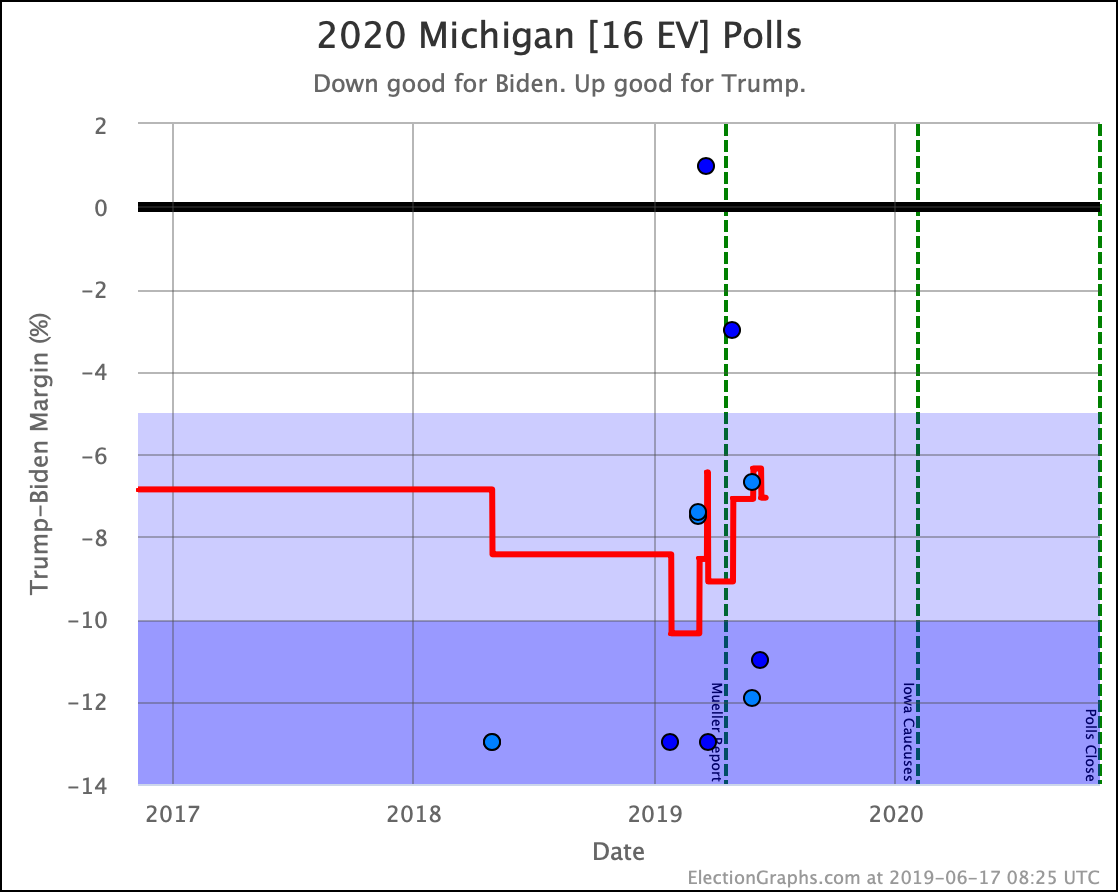
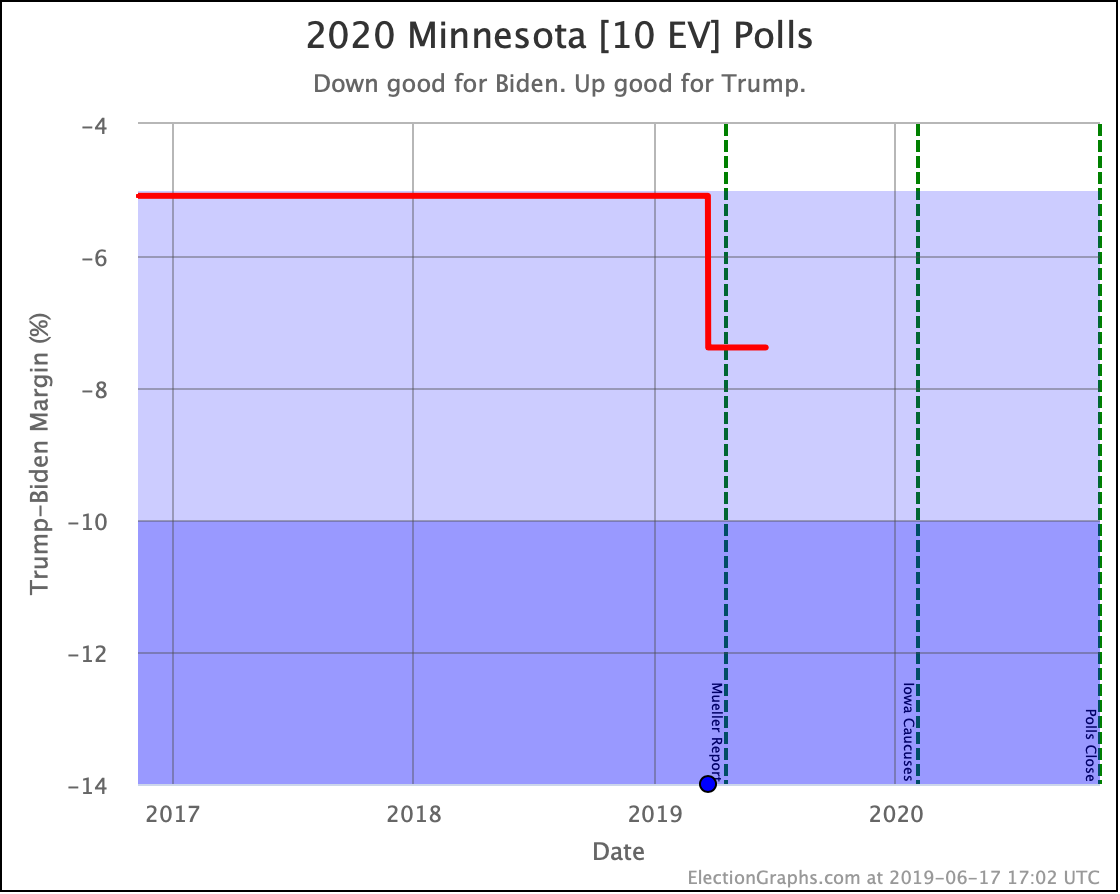
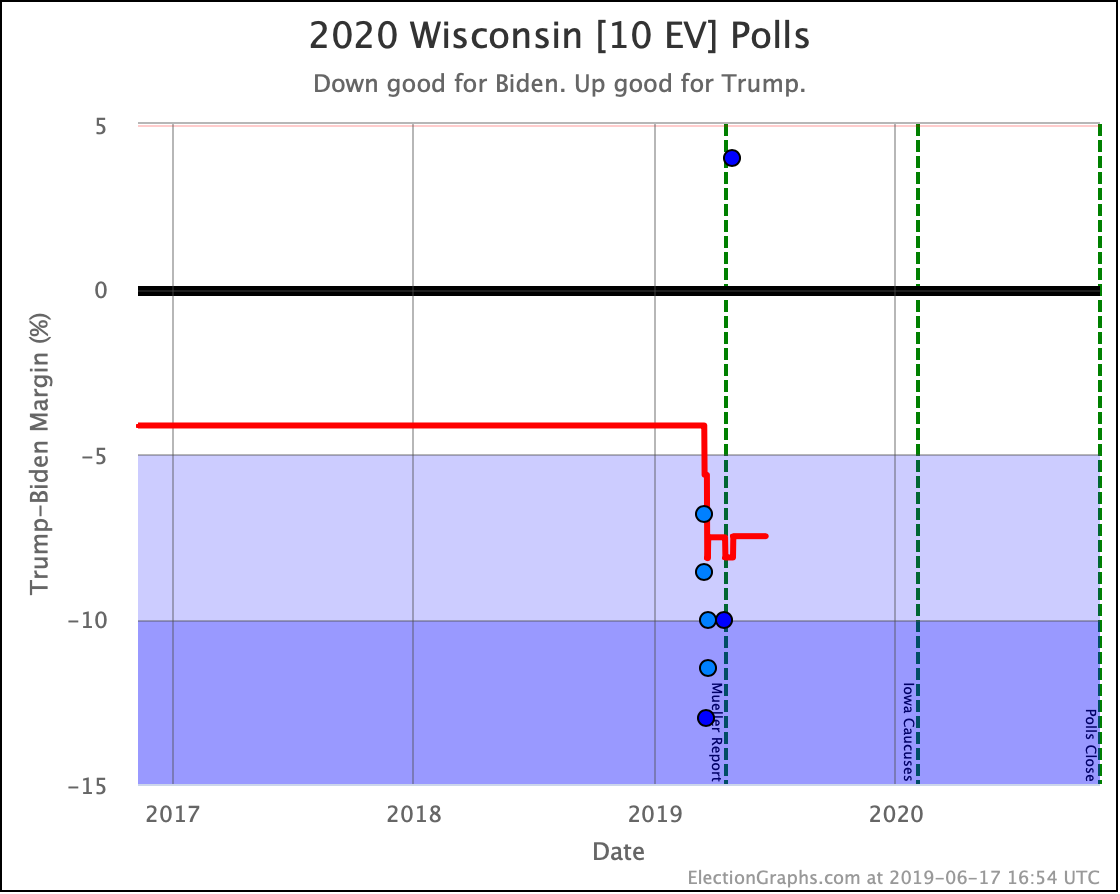
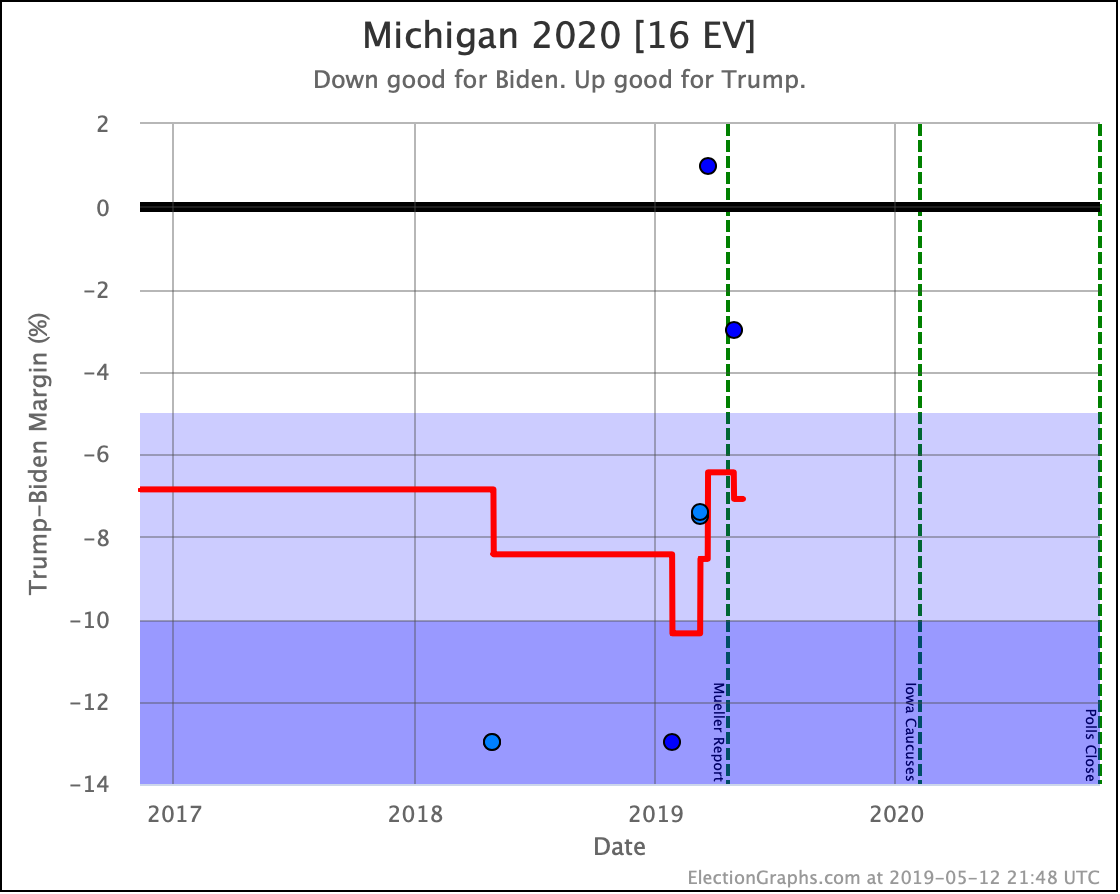
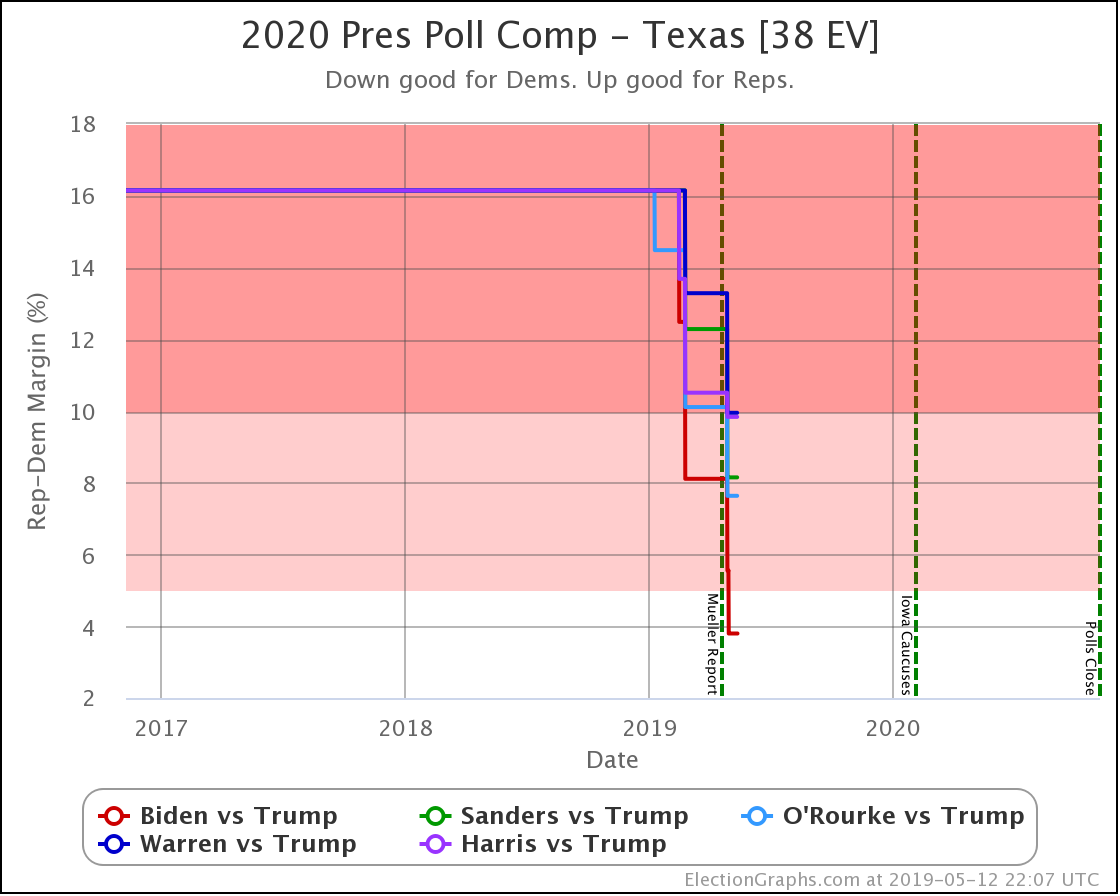
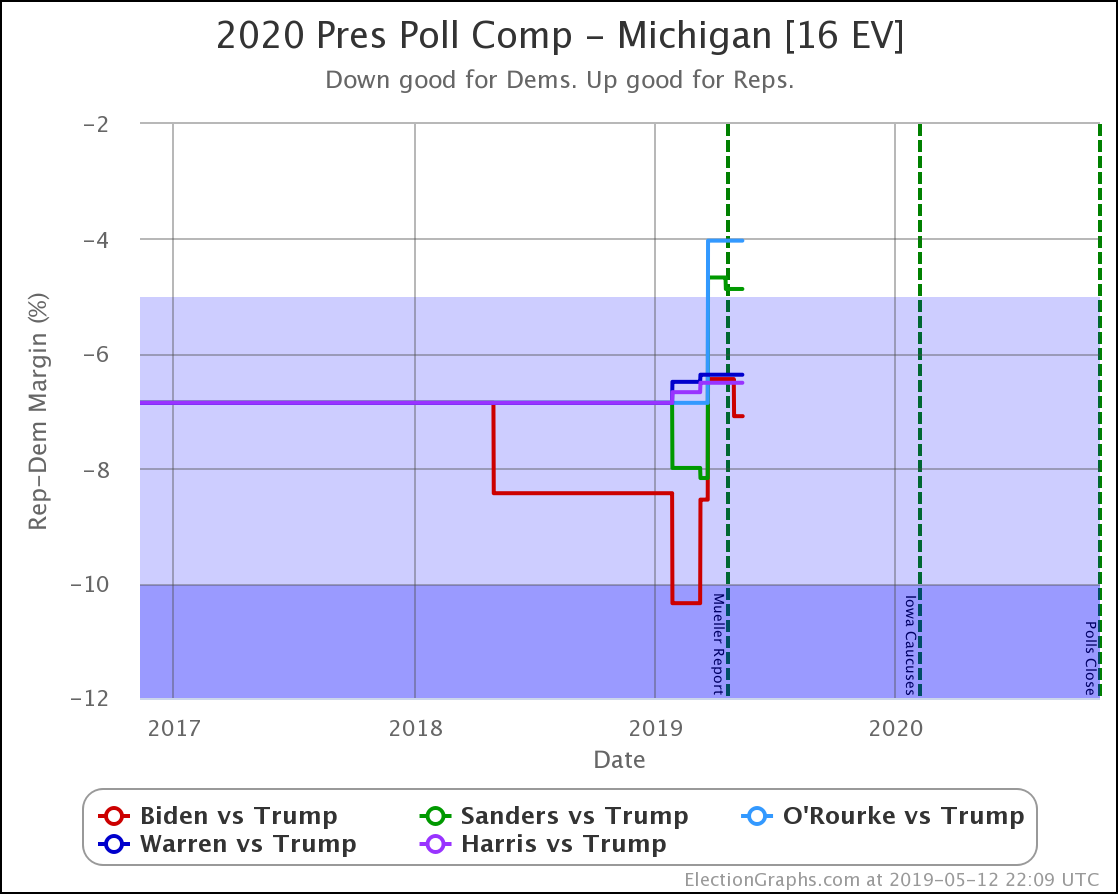
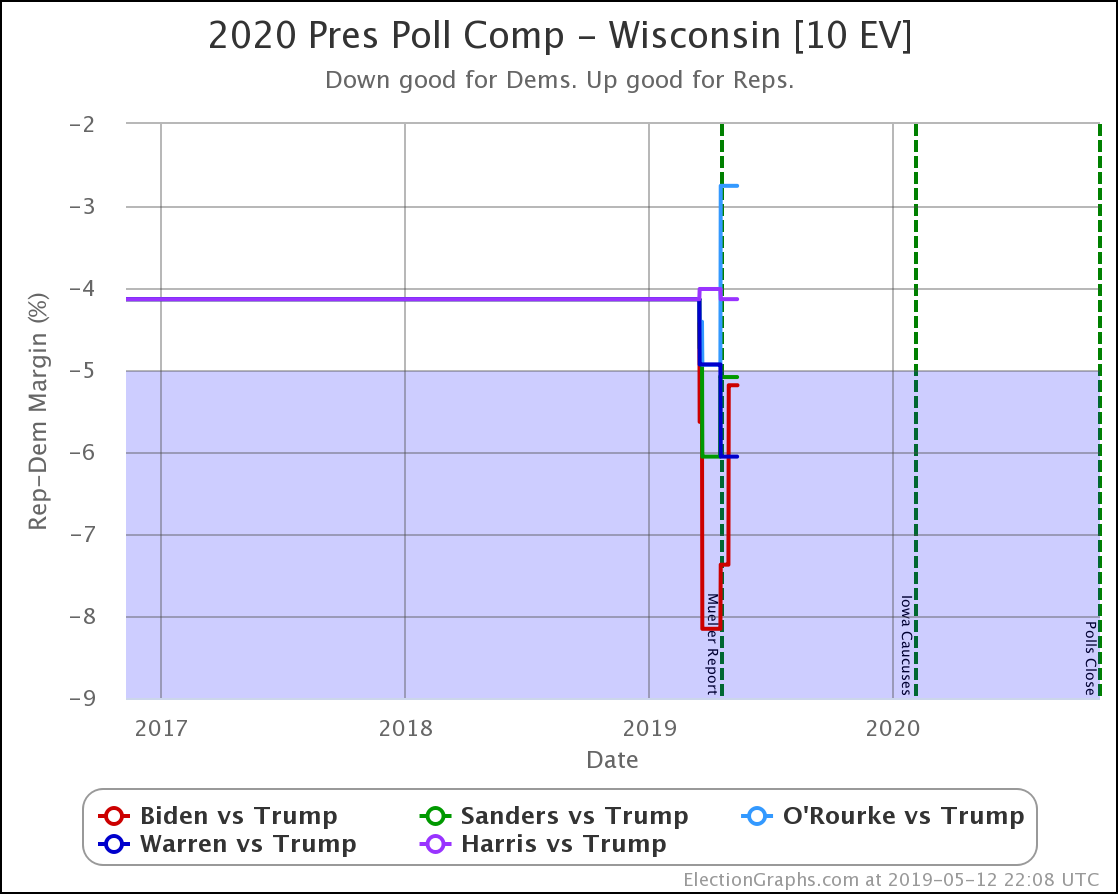
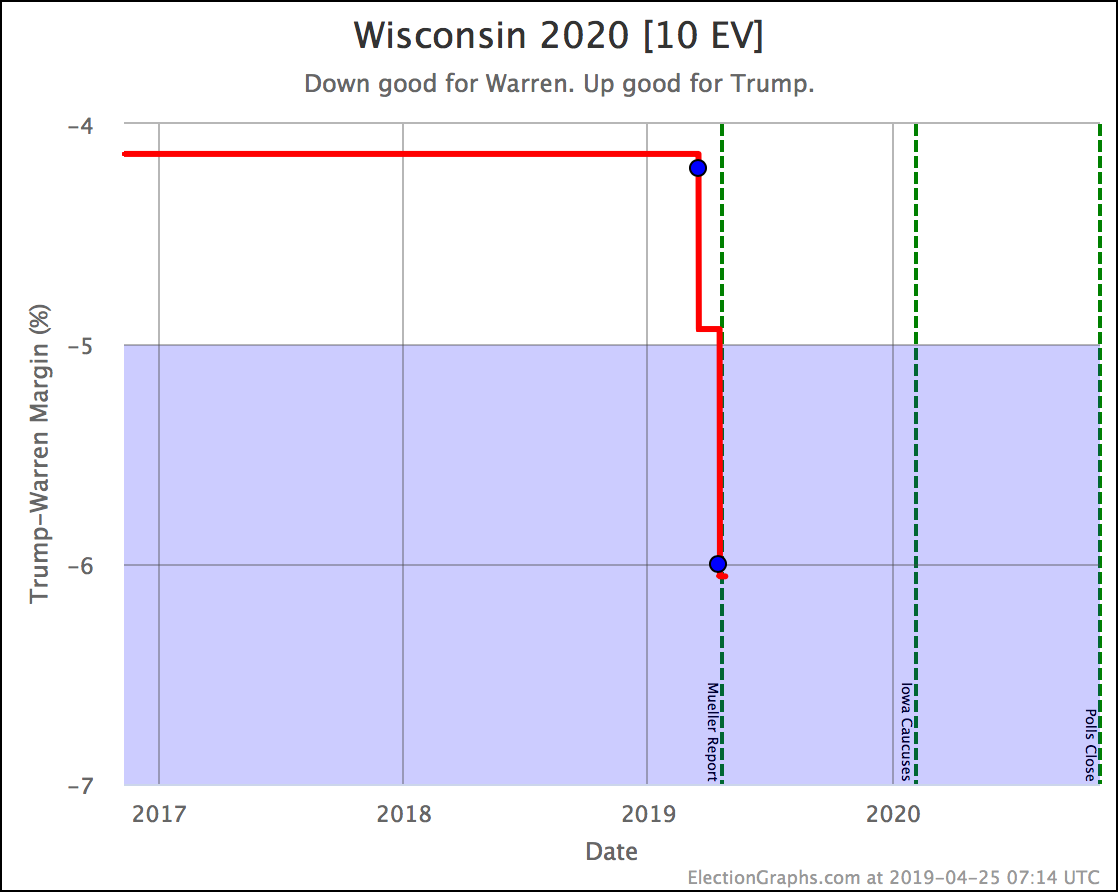
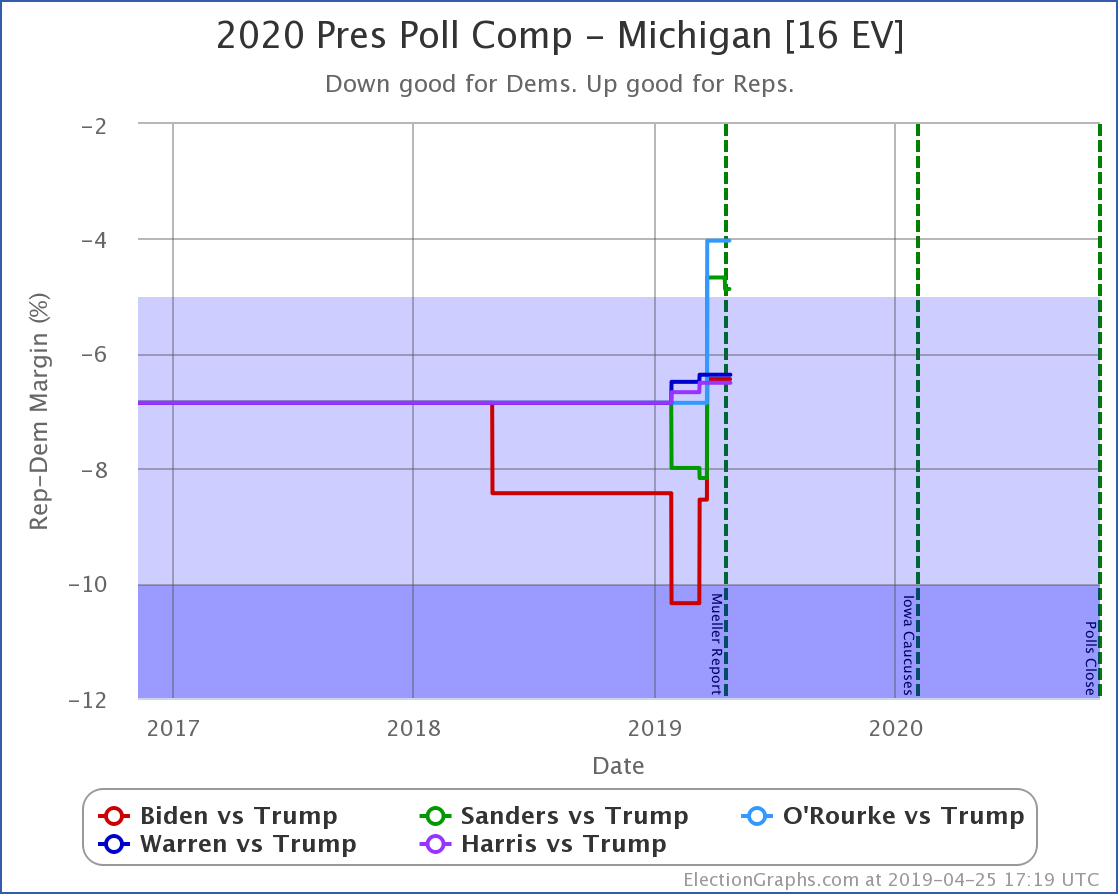
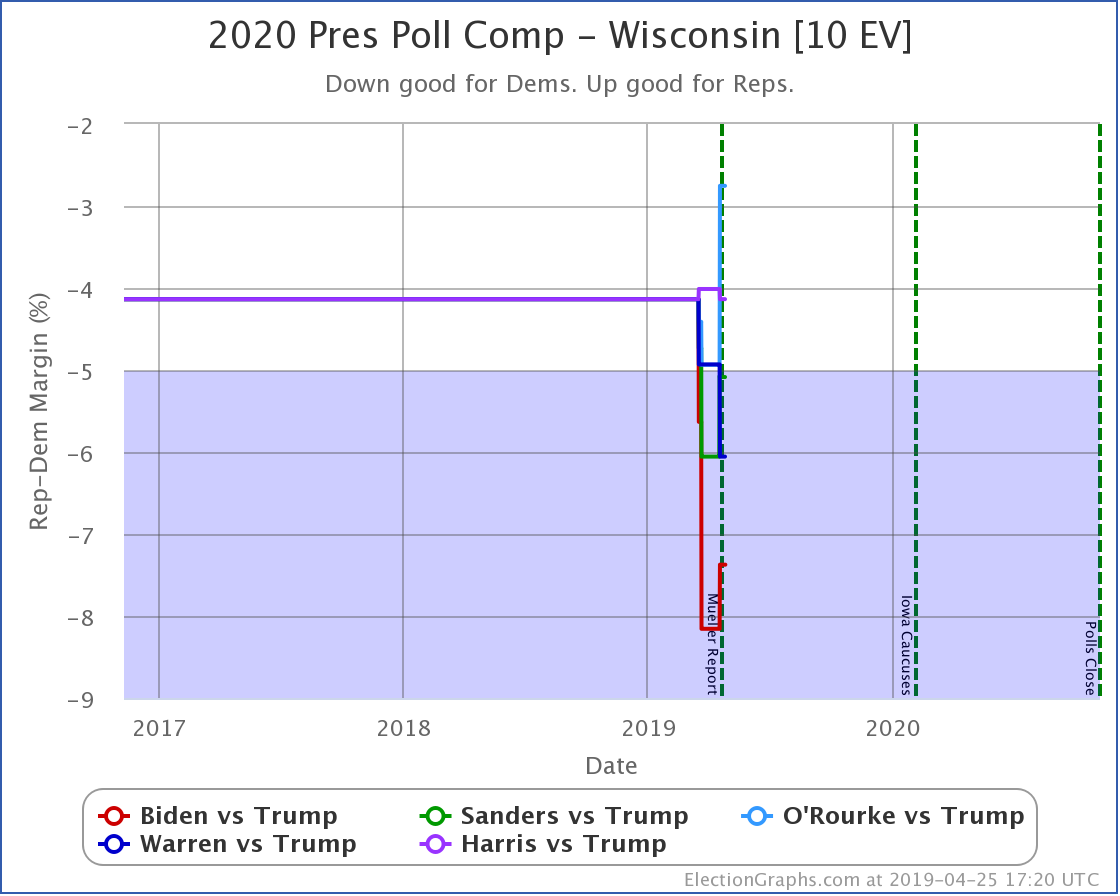
Where are Wisconsin and Michigan? Aren't they key swing states? Well, maybe. But at the moment they are not CLOSE states. Biden leads Wisconsin by 7.1% and Michigan by 8.0%. That may not stay that way. In both states, Biden's lead is down a bit from its high. But at the moment, Biden has quite a strong lead in both.
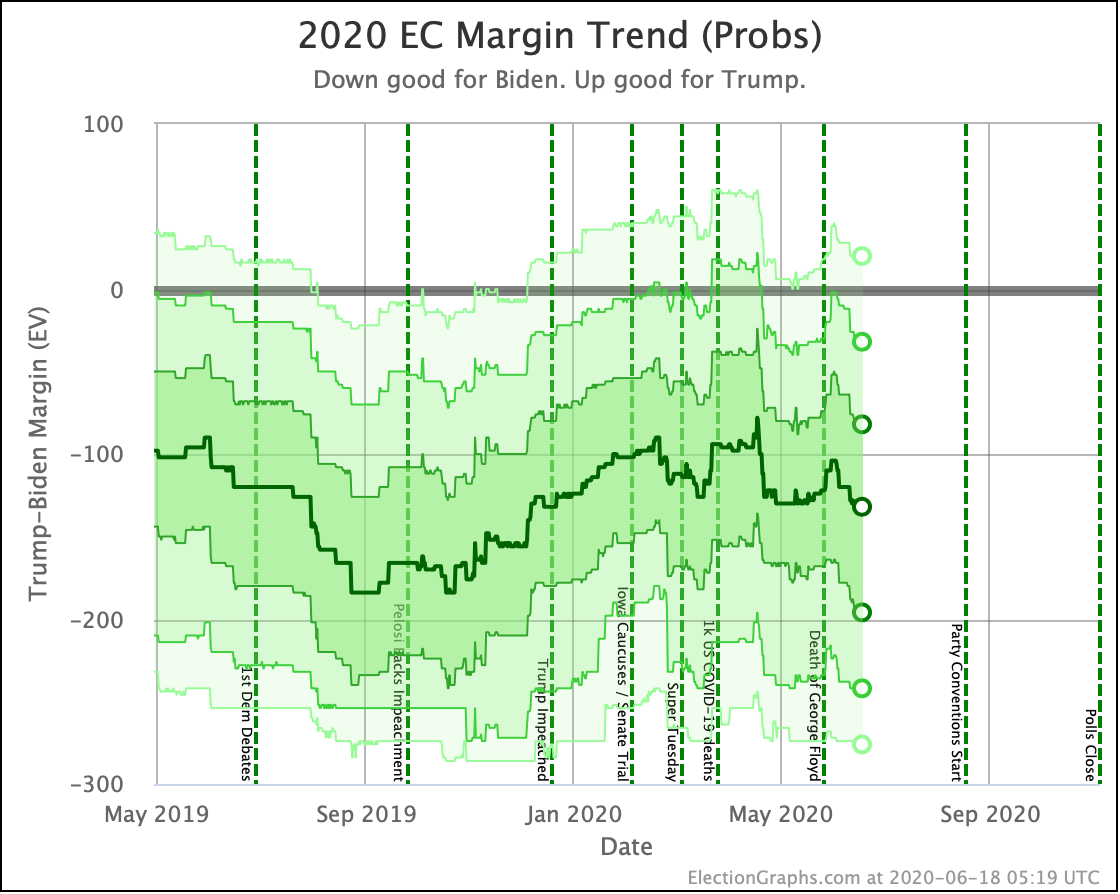
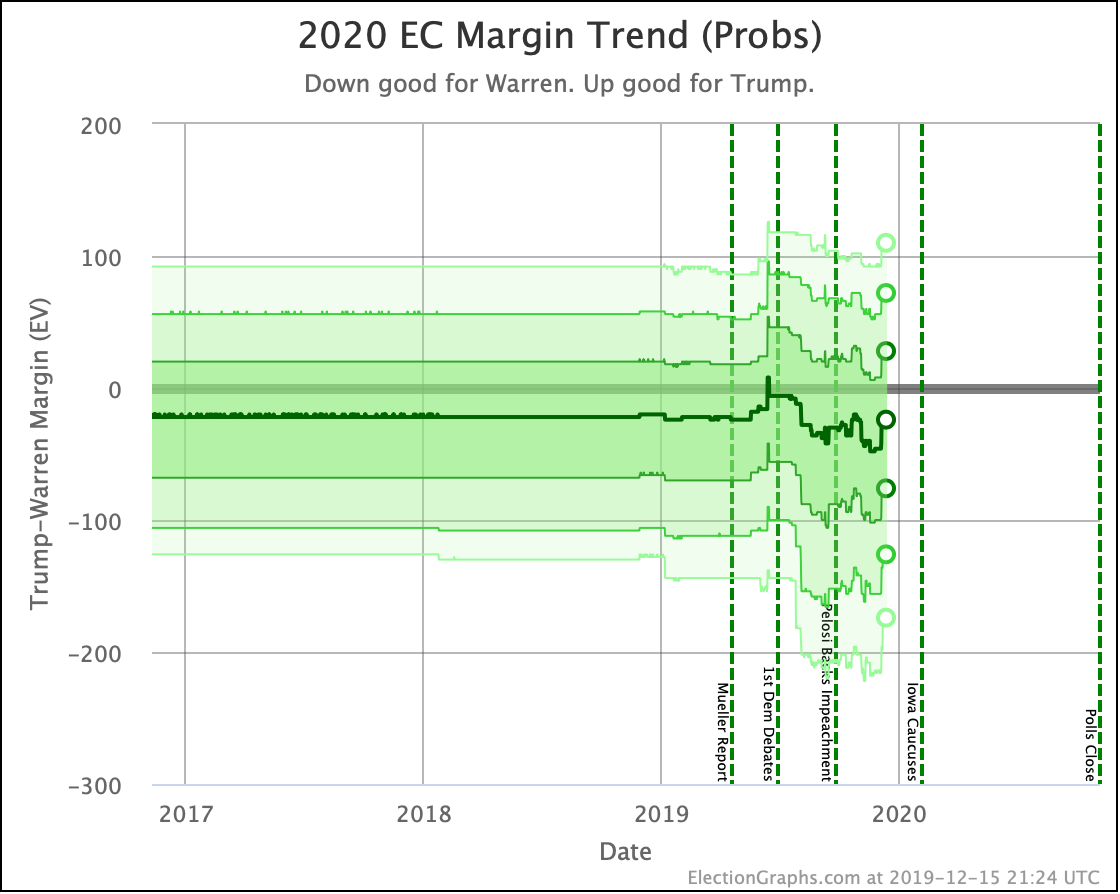
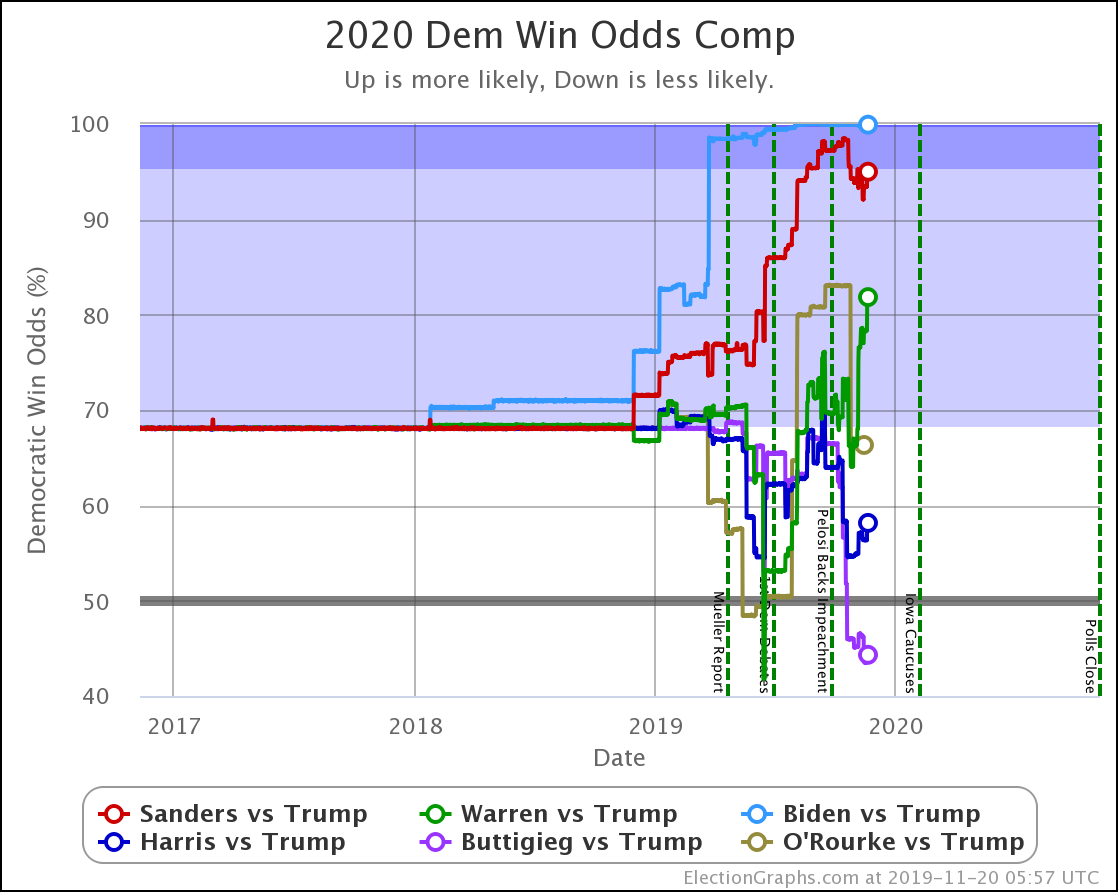
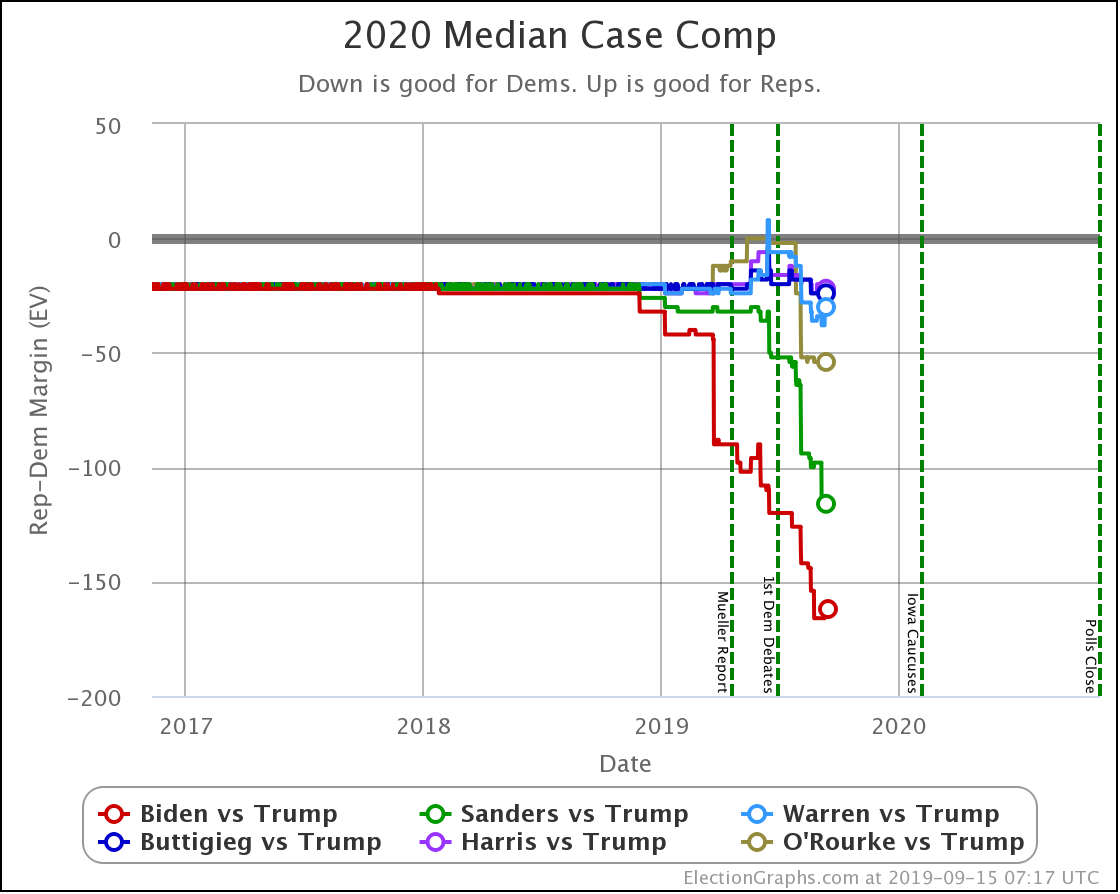
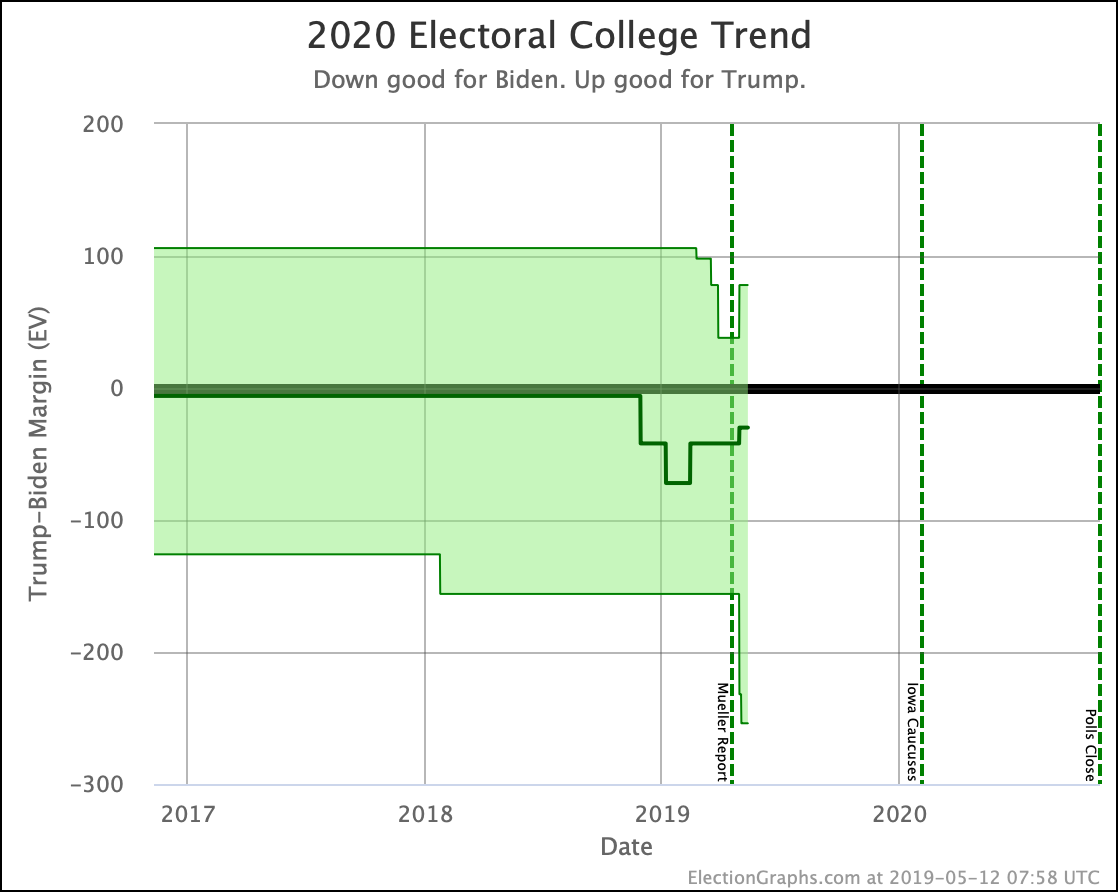
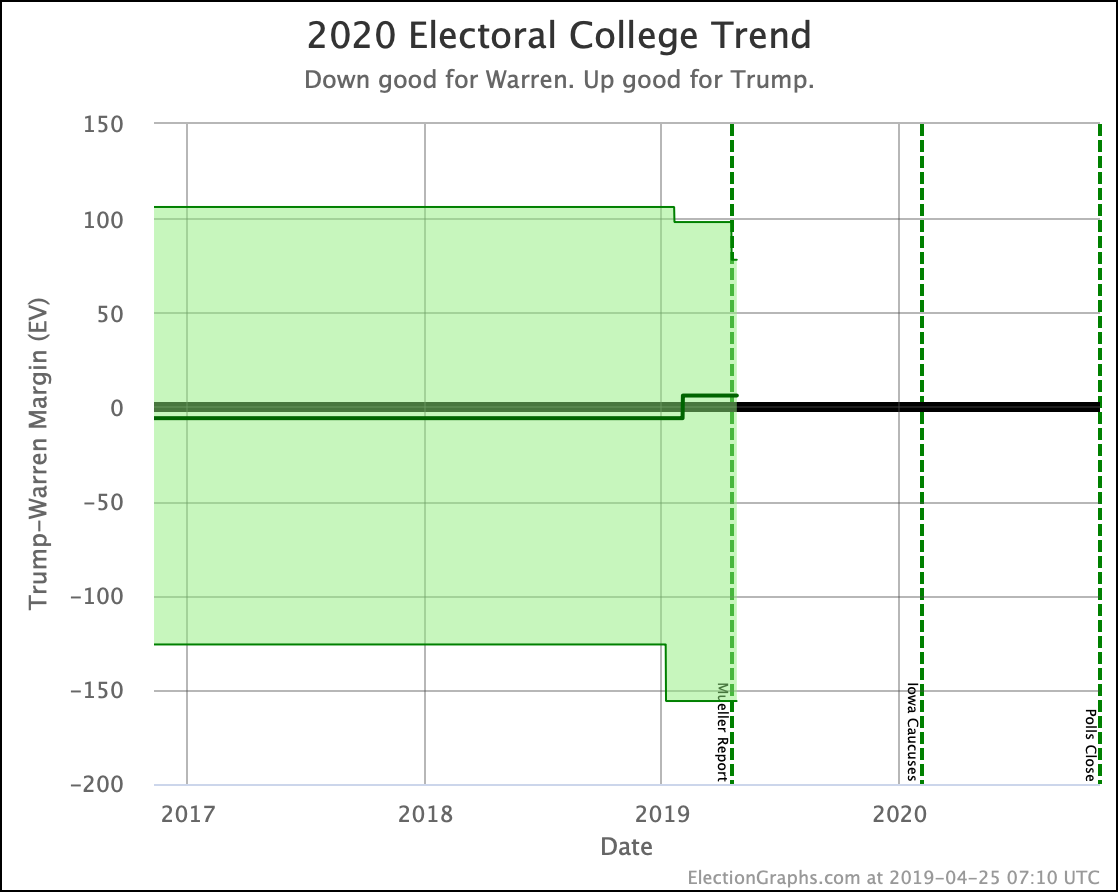
When you mash all of the movements in all of the states with new polls together into our probabilistic model, you get this:
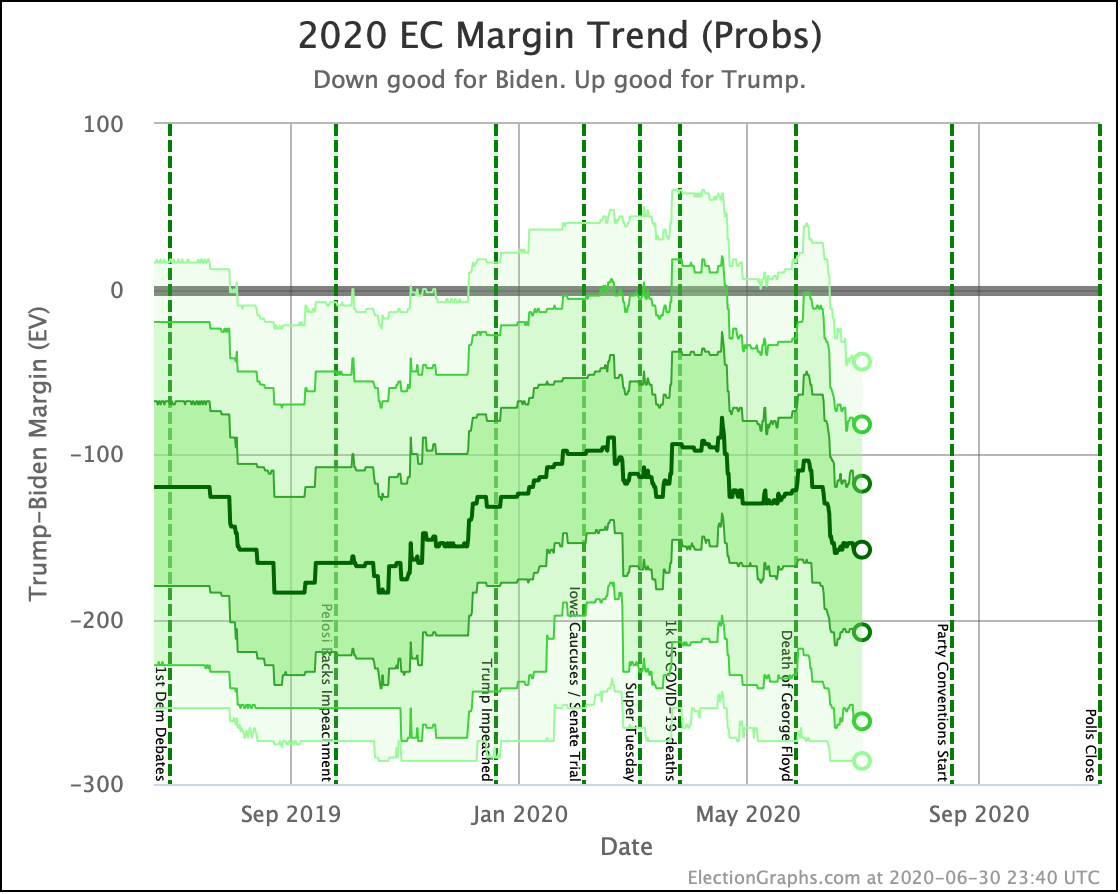
Trump peaked in the middle of April in our simulations, dropped quickly, then plateaued, increasing to a second peak right around the beginning of June before falling again. Then things started to flatten out again, but that most recent bit of the chart is still subject to change as new polls covering that time period come in.
In terms of the median case of our simulations, Biden is now winning by 158 EV, almost at his recent best of 160 EV. His all-time best was 184 EV back in October.
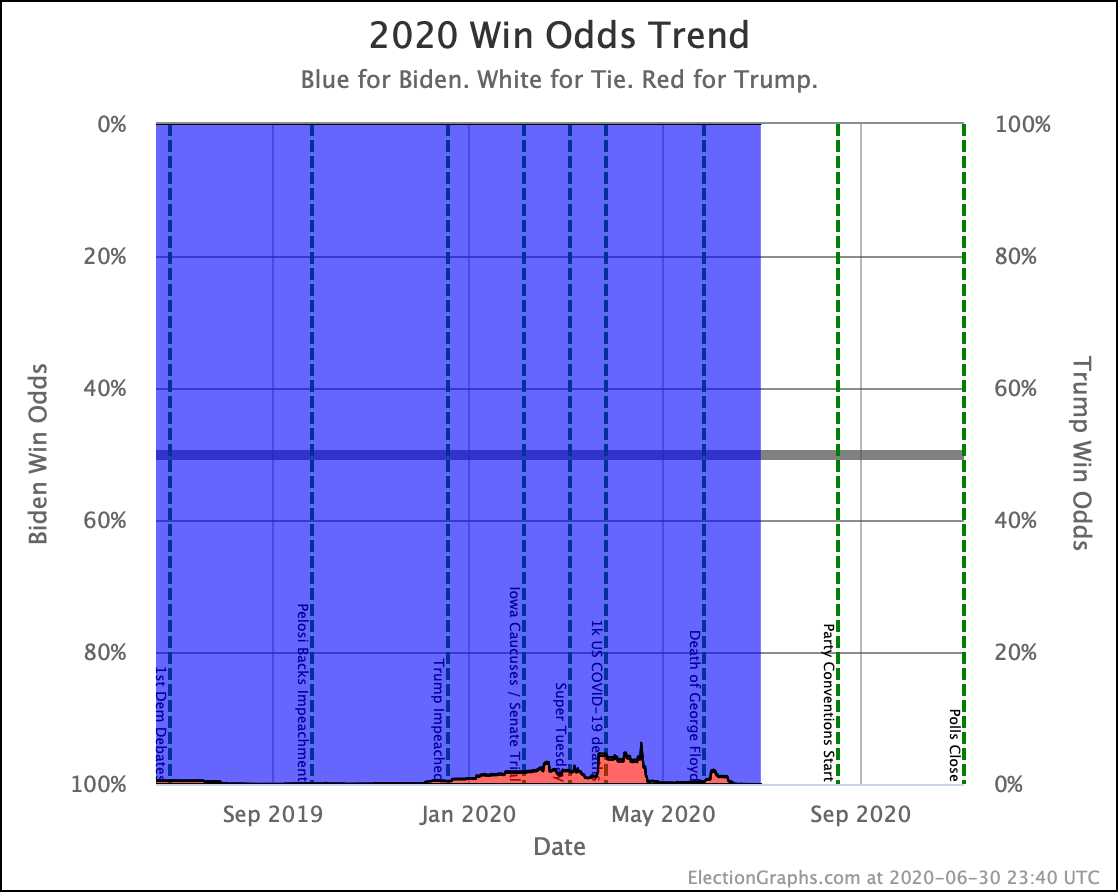
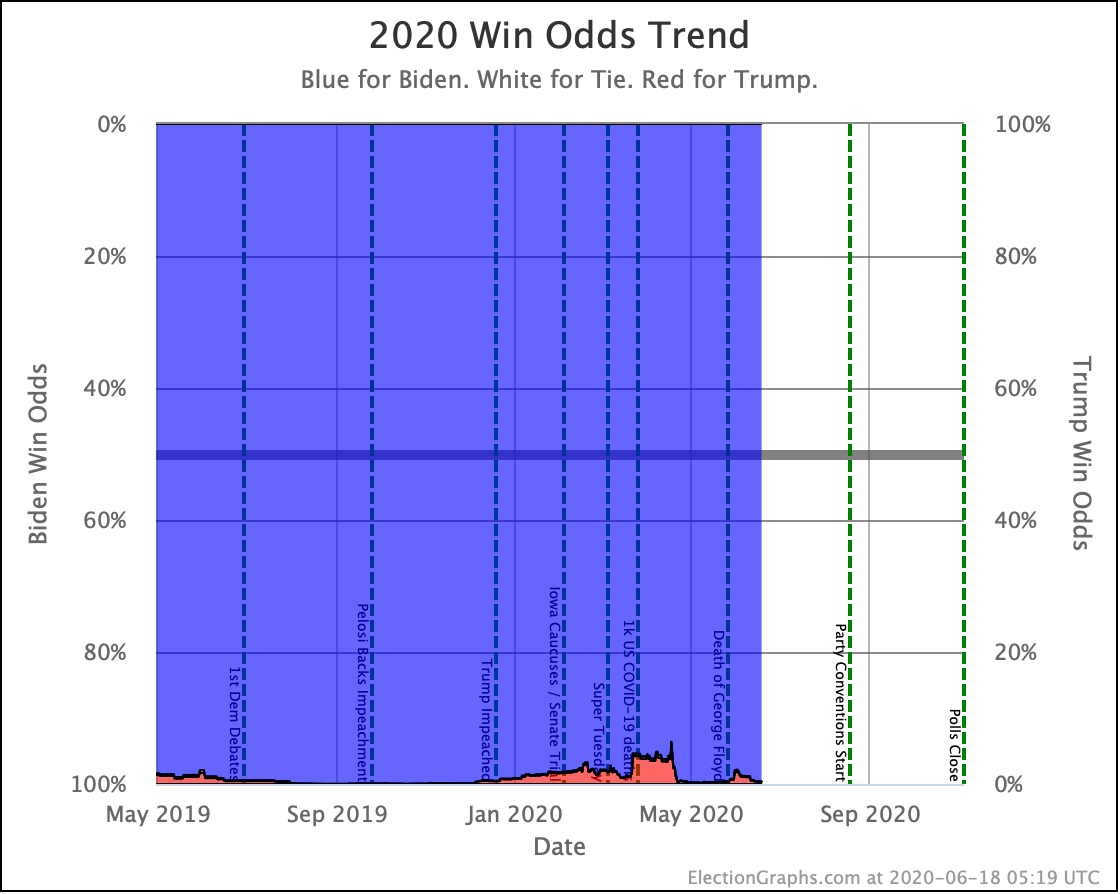
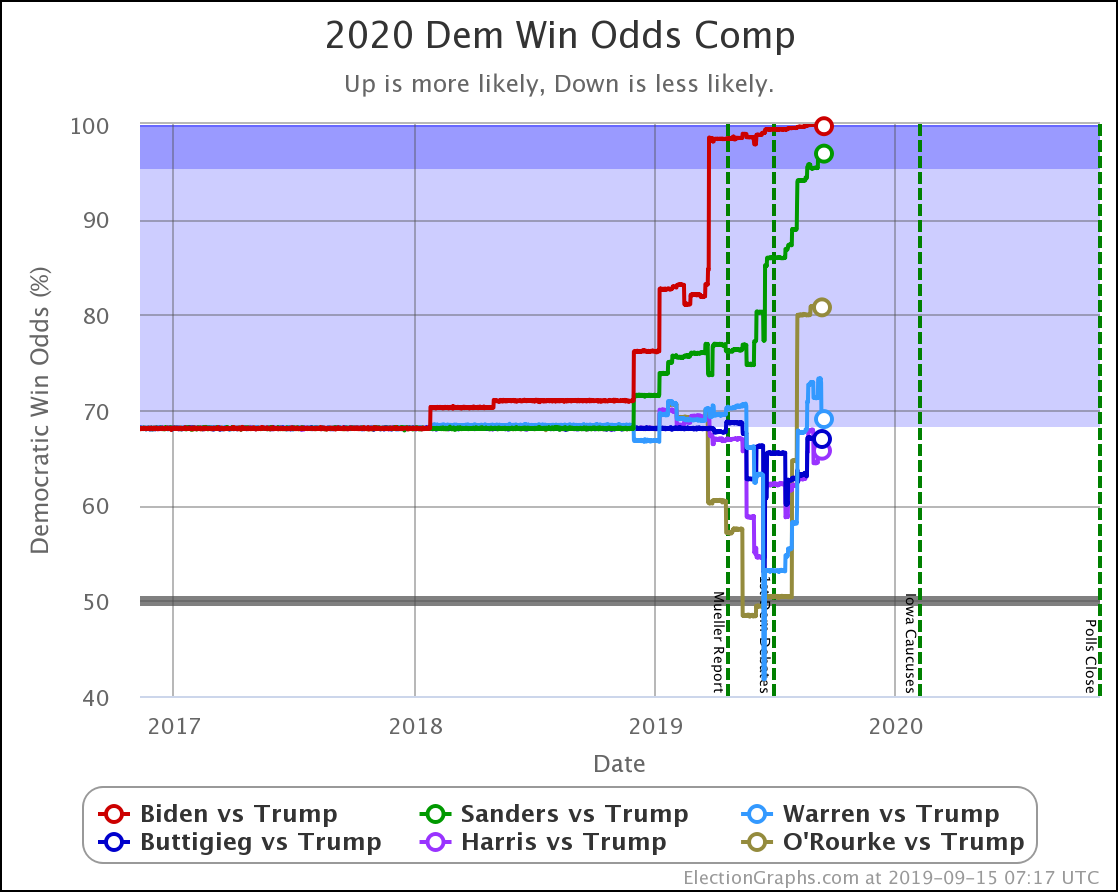
In terms of probability of winning our site now shows Biden at 100.0%. That is rounded though of course. Looking at the unrounded numbers, it is actually 99.9977% at the moment.
This is the time for the usual "if the election was held today" warning. If Biden's polls end up looking like this on election eve, he would almost certainly win. But we have almost 126 days to go. And things can change.
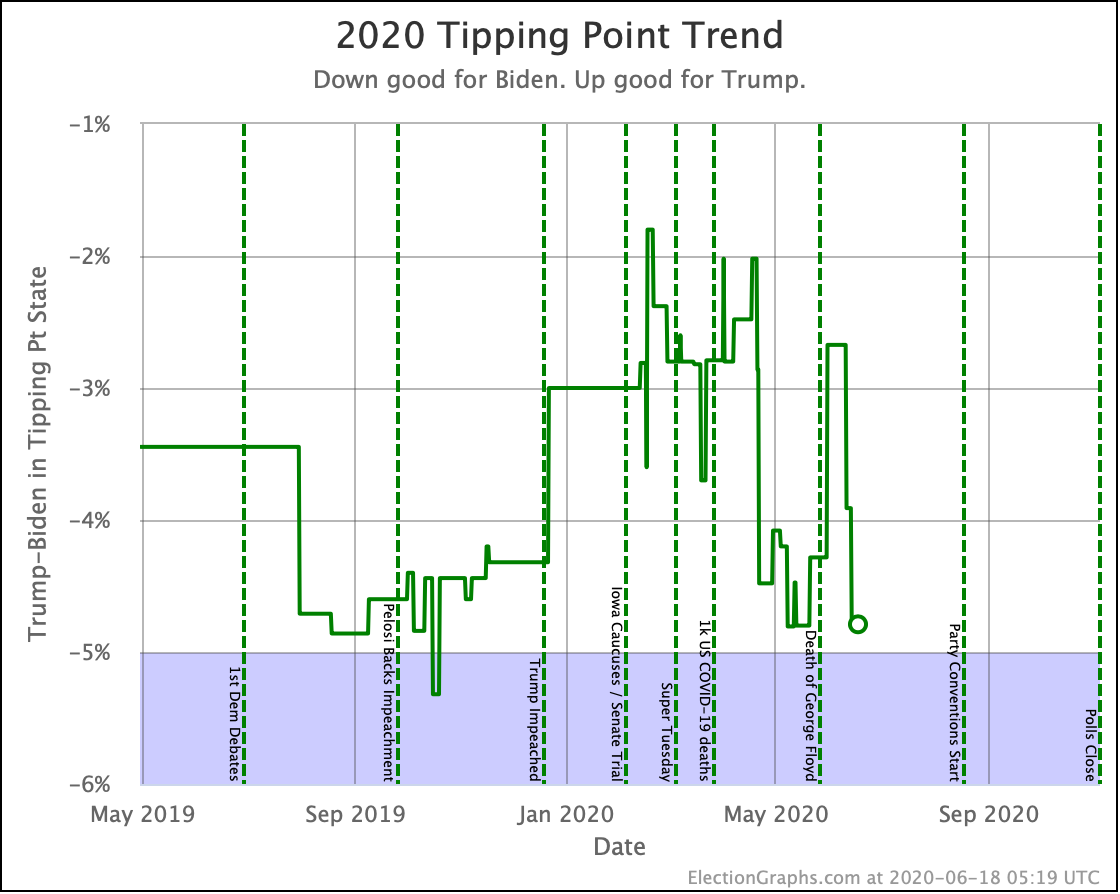
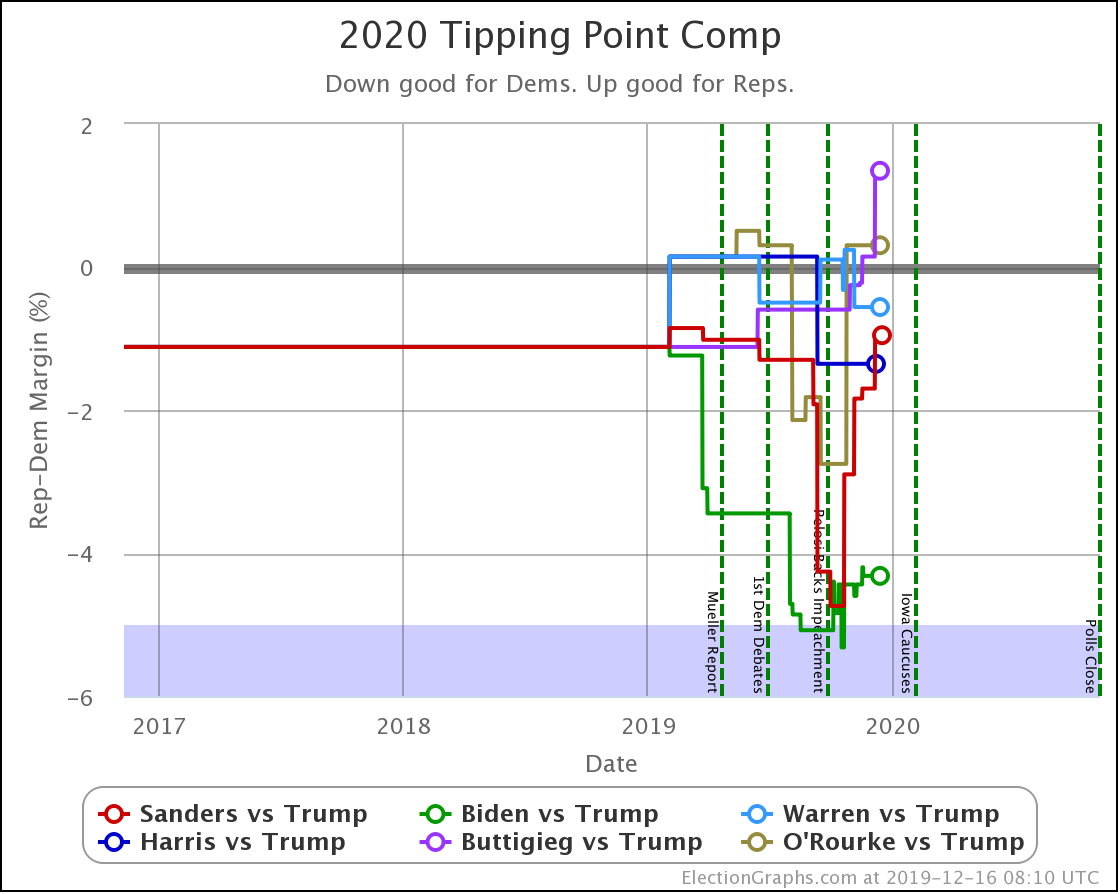
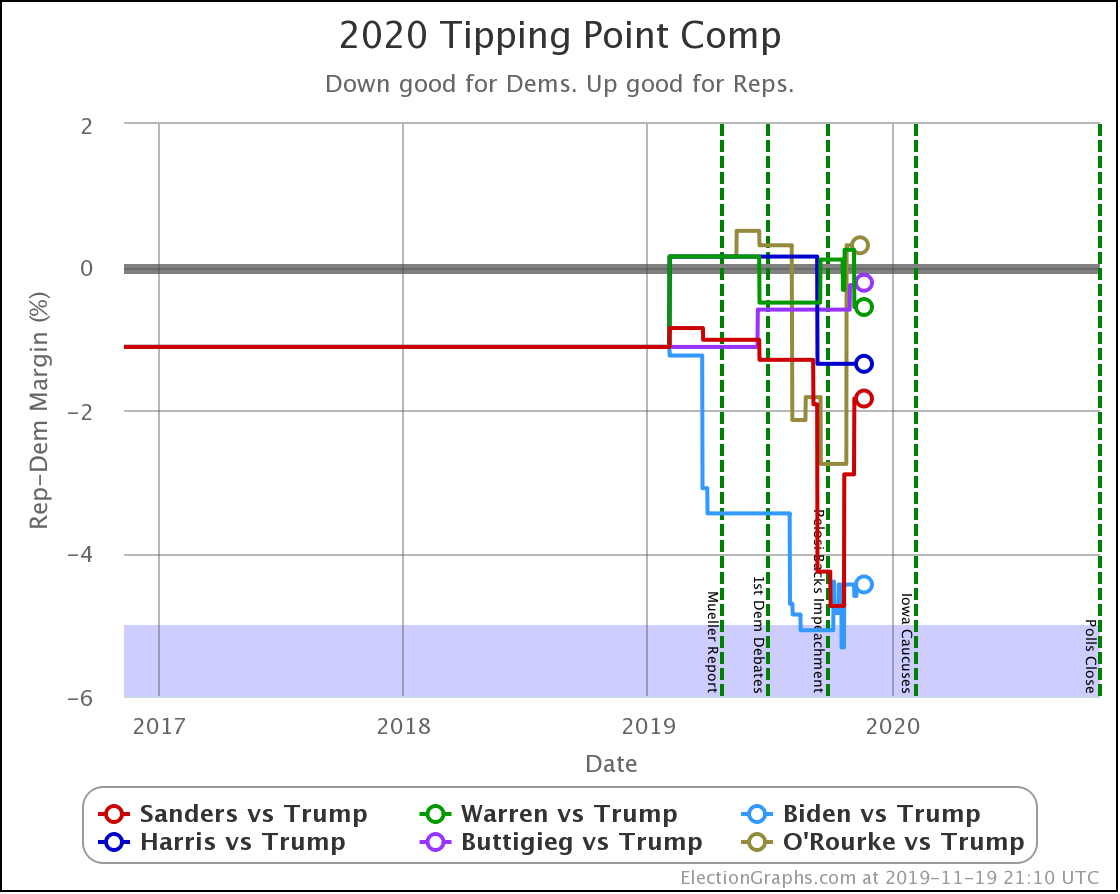
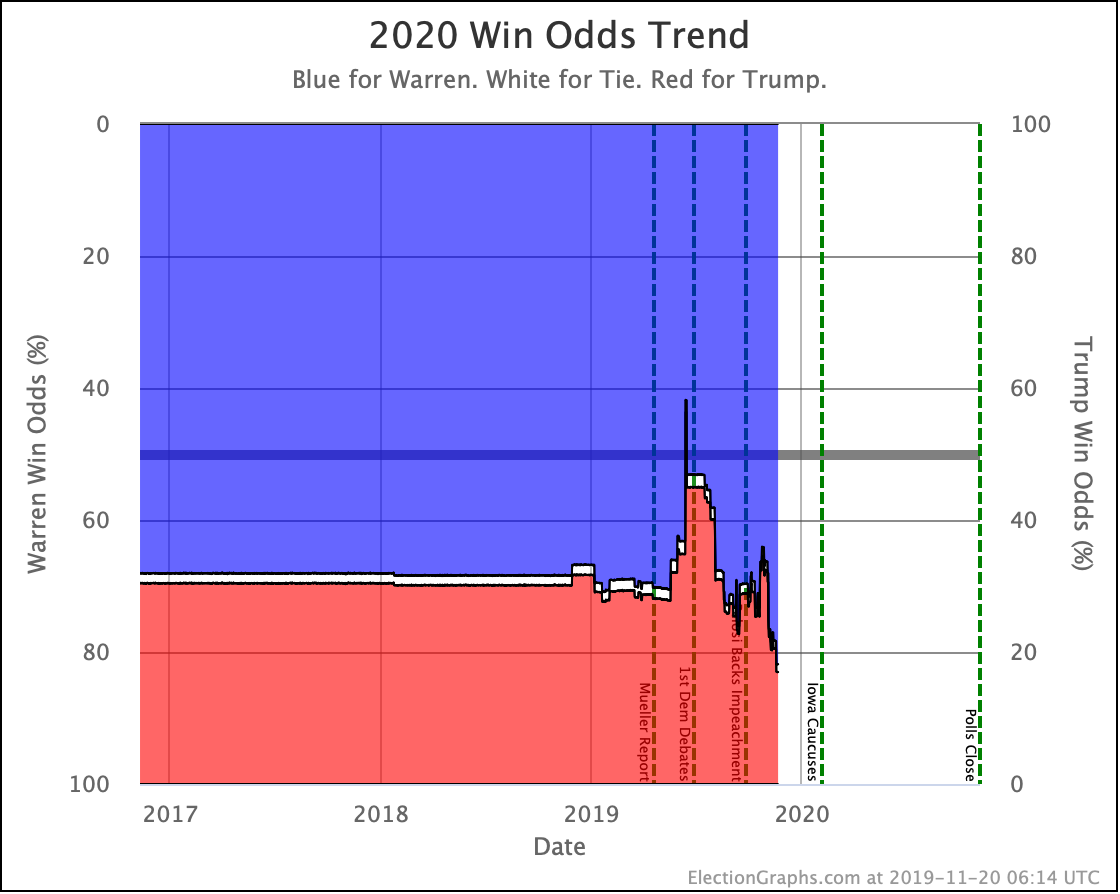
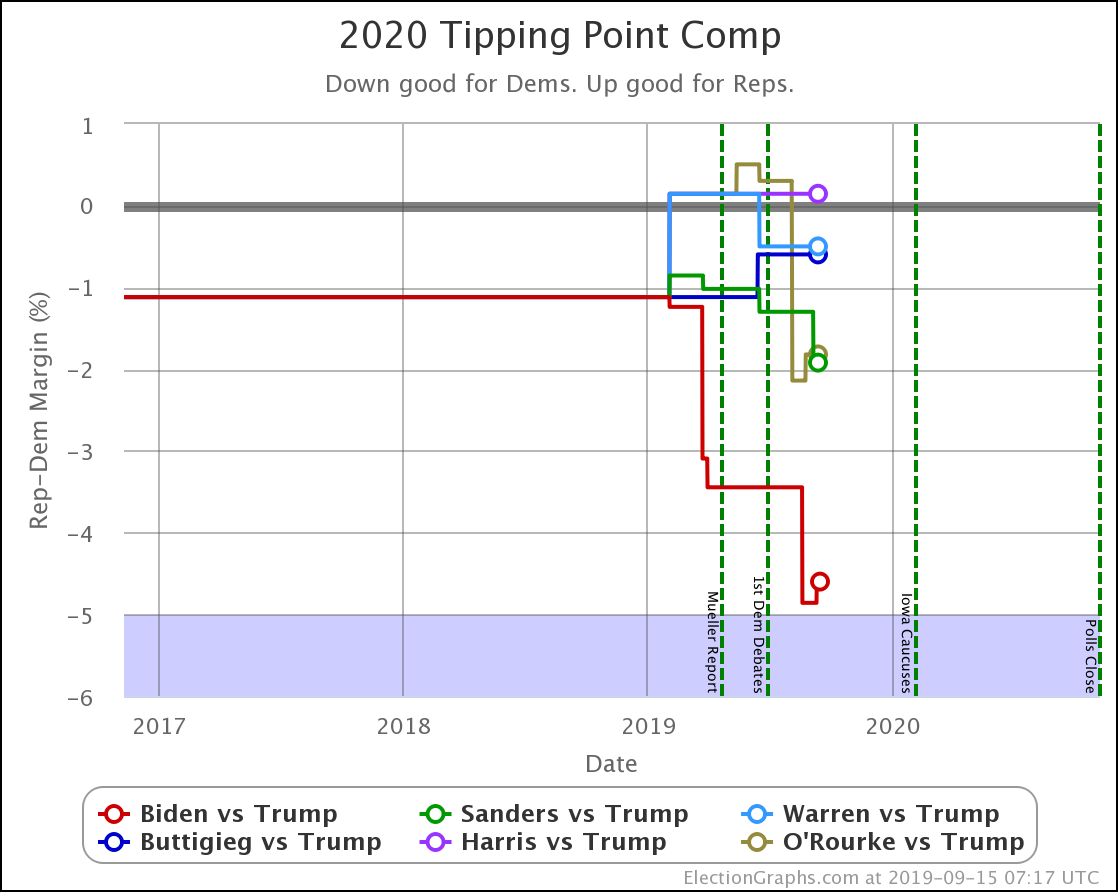
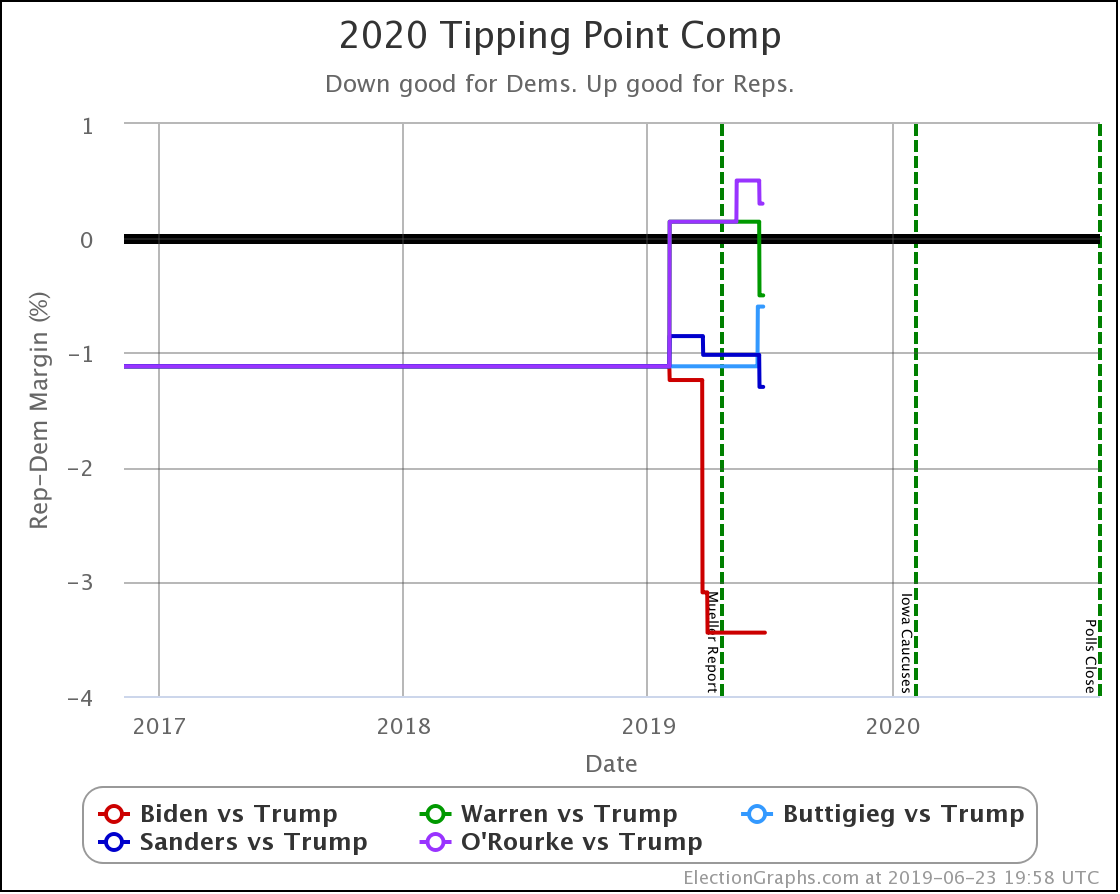
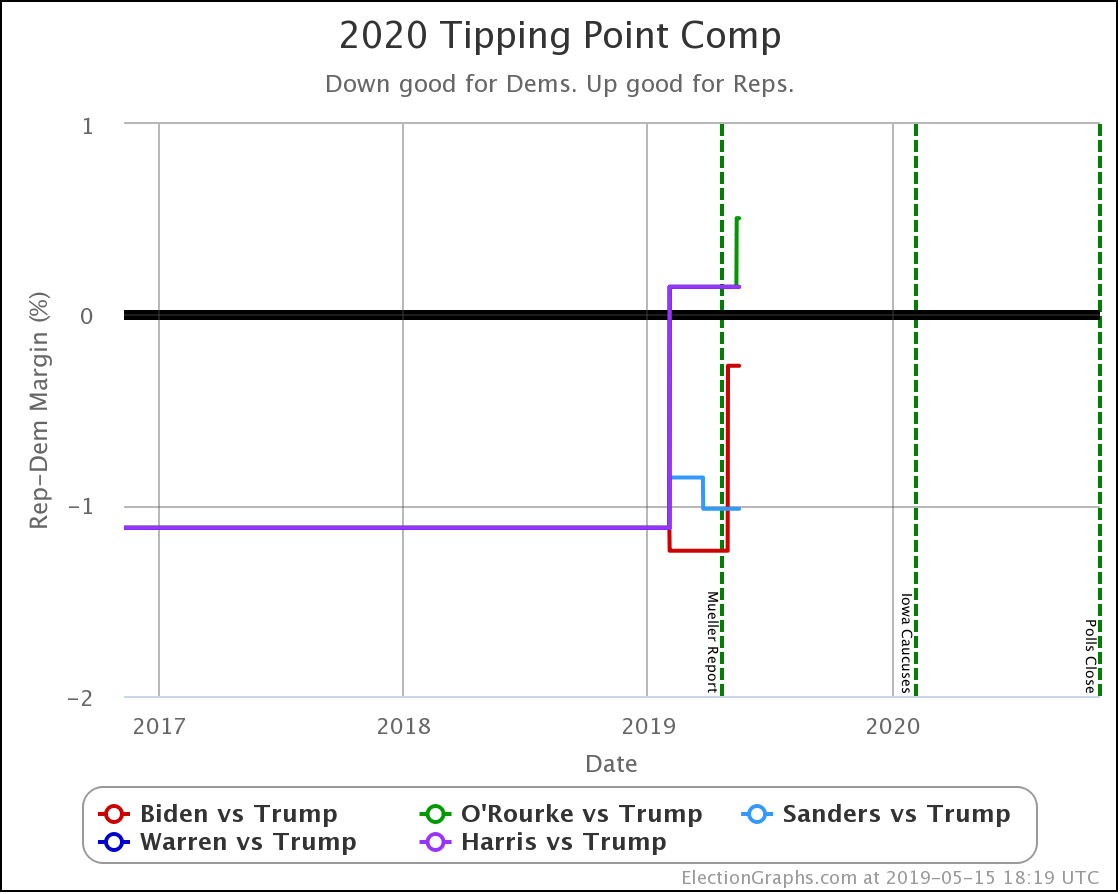
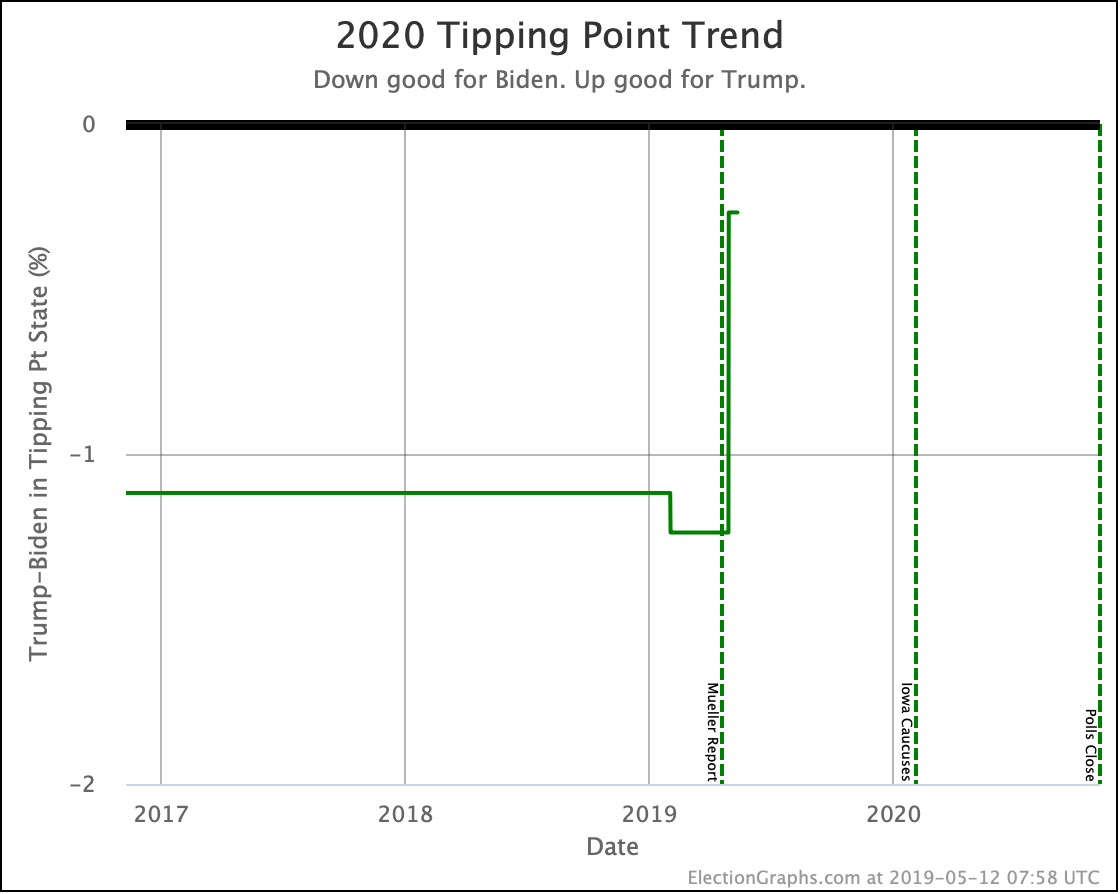
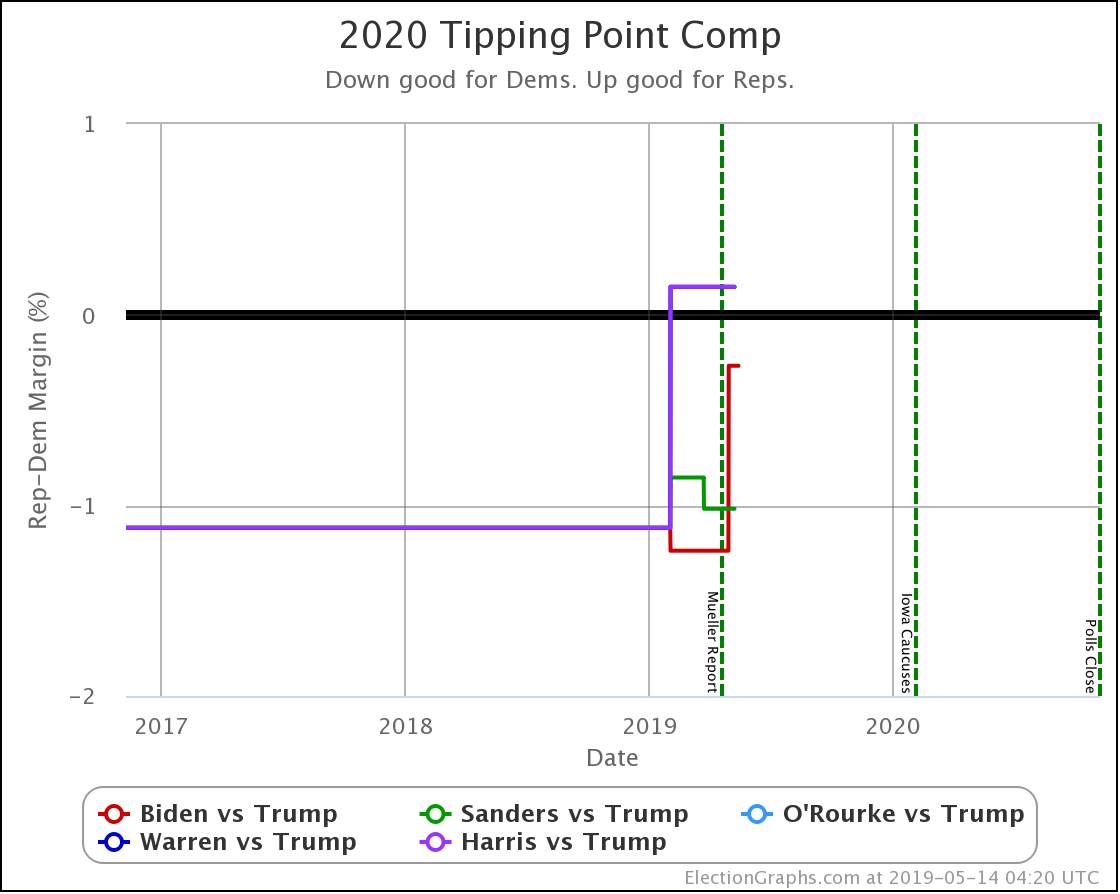
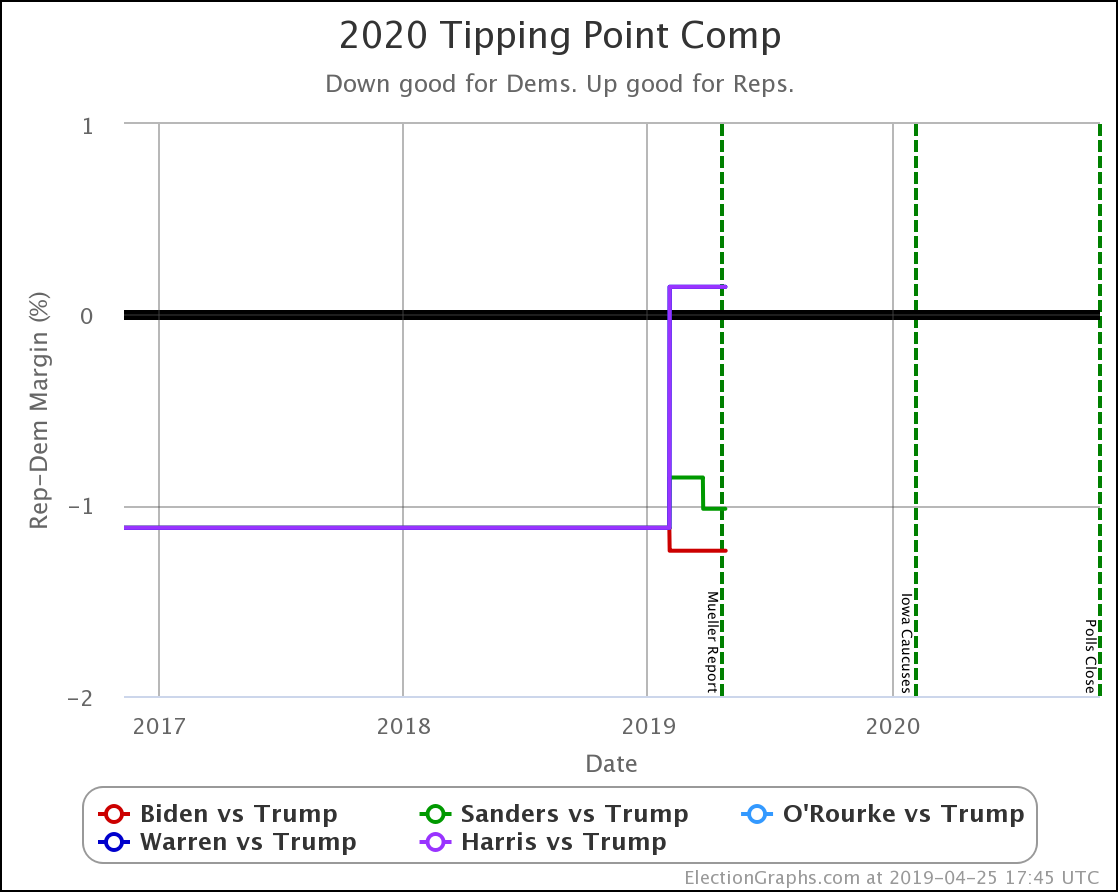
So let's look at the tipping point, which measures just how much things have to change in order to flip the winner.
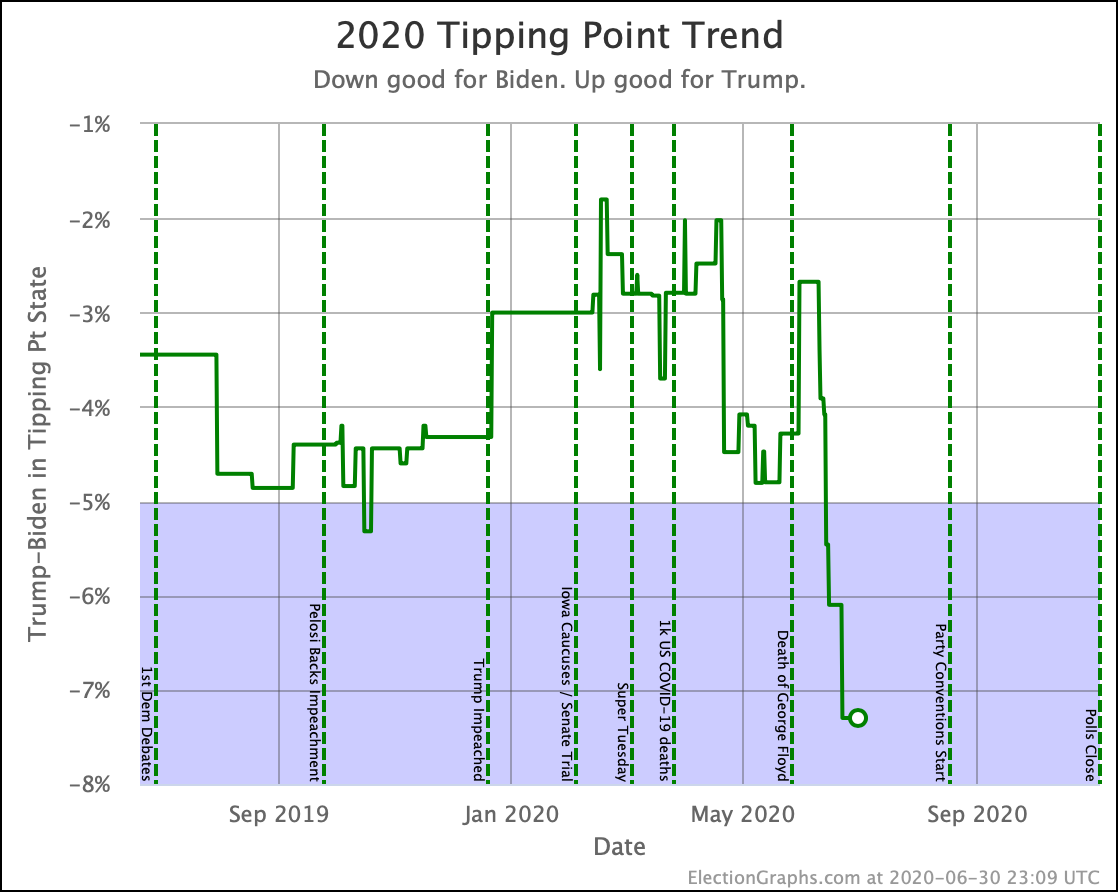
The tipping point has moved dramatically toward Biden. Between June 9th and June 22nd, it moved from Biden by 2.7% to Biden by 7.3%. That's 4.6% in less than 2 weeks.
On the one hand, that is a dramatic collapse for Trump. But on the other, it shows just how quickly things can move. Something that can go down quickly can potentially go up quickly too.
So for the two metrics we had in 2016 as well as today, how does Biden stack up to Clinton at the same time period?
| <126 Days Out> | 2016 | 2020 |
|---|---|---|
| Expected Case | Clinton by 144 | Biden by 162 |
| Tipping Point | Clinton by 3.2% | Biden by 7.3% |
So yes, Biden is doing better on both metrics than Clinton was at this same time in 2016.
From this point, Clinton would improve a bit. In August 2016 she got up to a 188 EV lead in the expected case and a 6.1% lead in the tipping point. This, of course, did not last all the way until the election. By the time we got to the election, Election Graphs had Clinton leading, but just barely.
Other analysts looking at the internals of various polls, both at the state and national level are saying that Biden's support is more solid than Clinton's was. That she had weaknesses that Biden does not.
Maybe, maybe not. In any case, he is doing better at this time in the race than she was. A 7.3% tipping point is a SUBSTANTIAL lead.
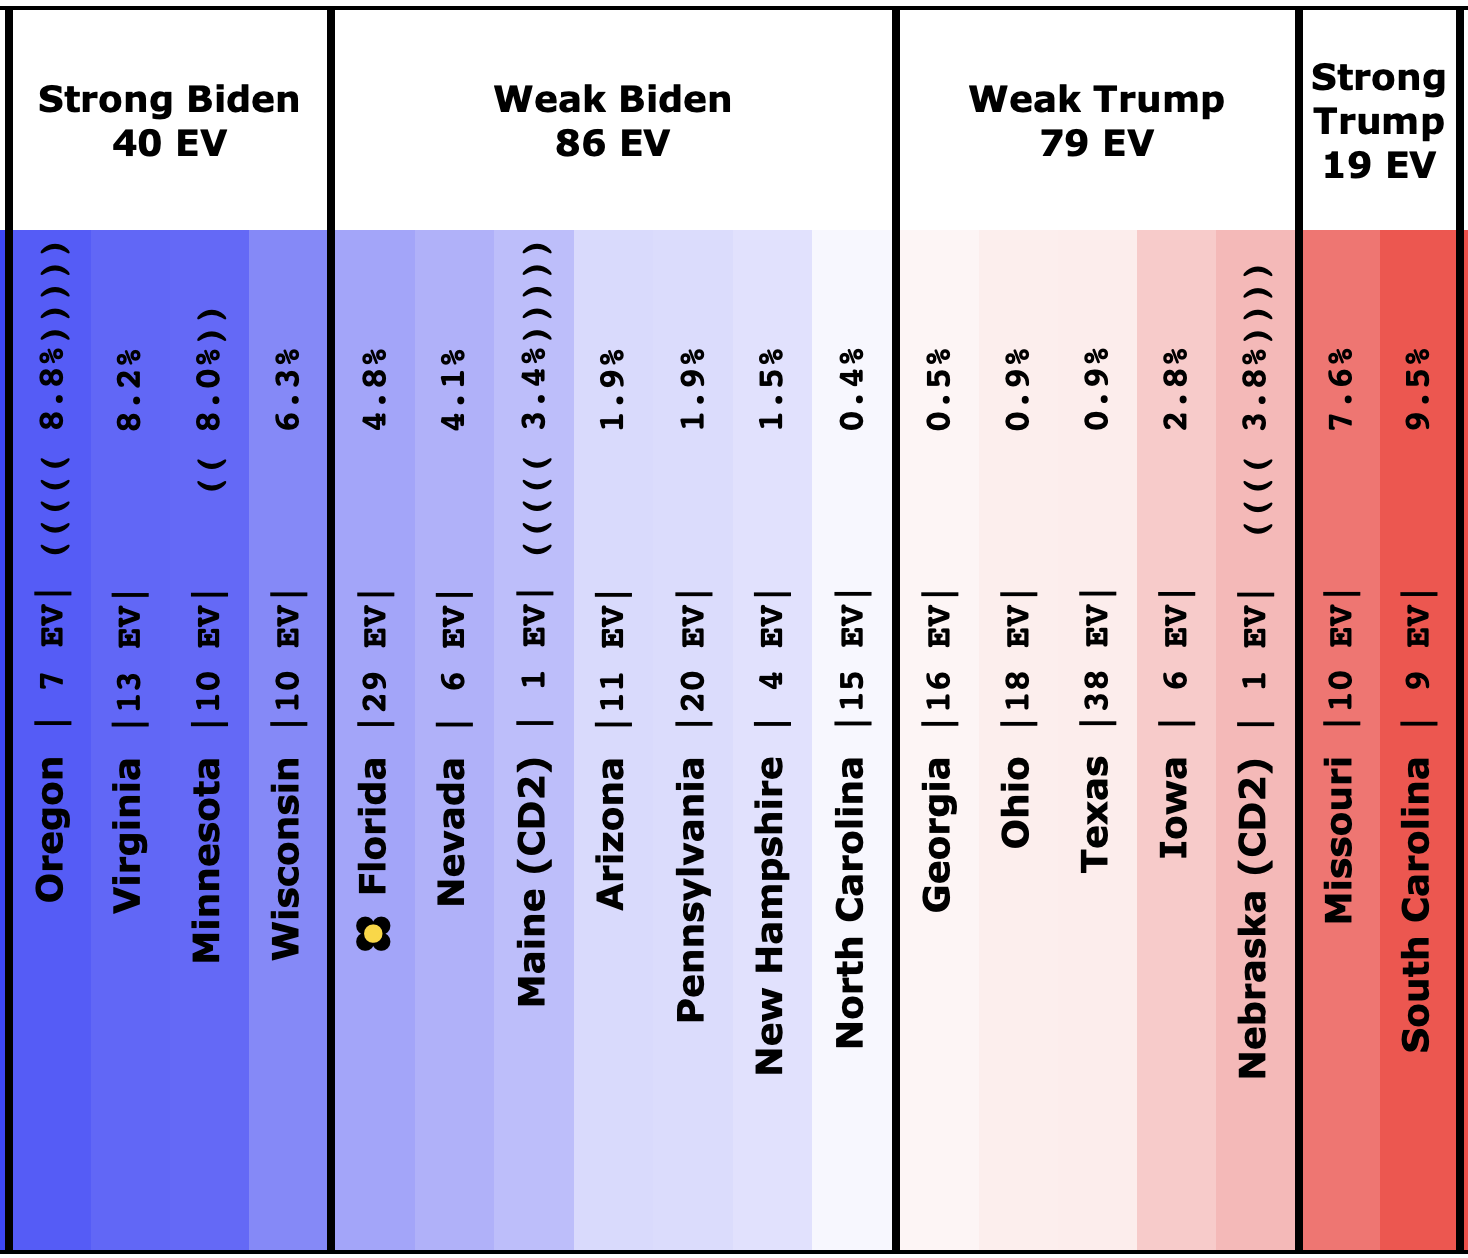
Another way to look at the change since the last update on June 18th is to look at how the center portion of the spectrum of states changed.
Here is what it looked like in our last update:
And here is how it looks today:
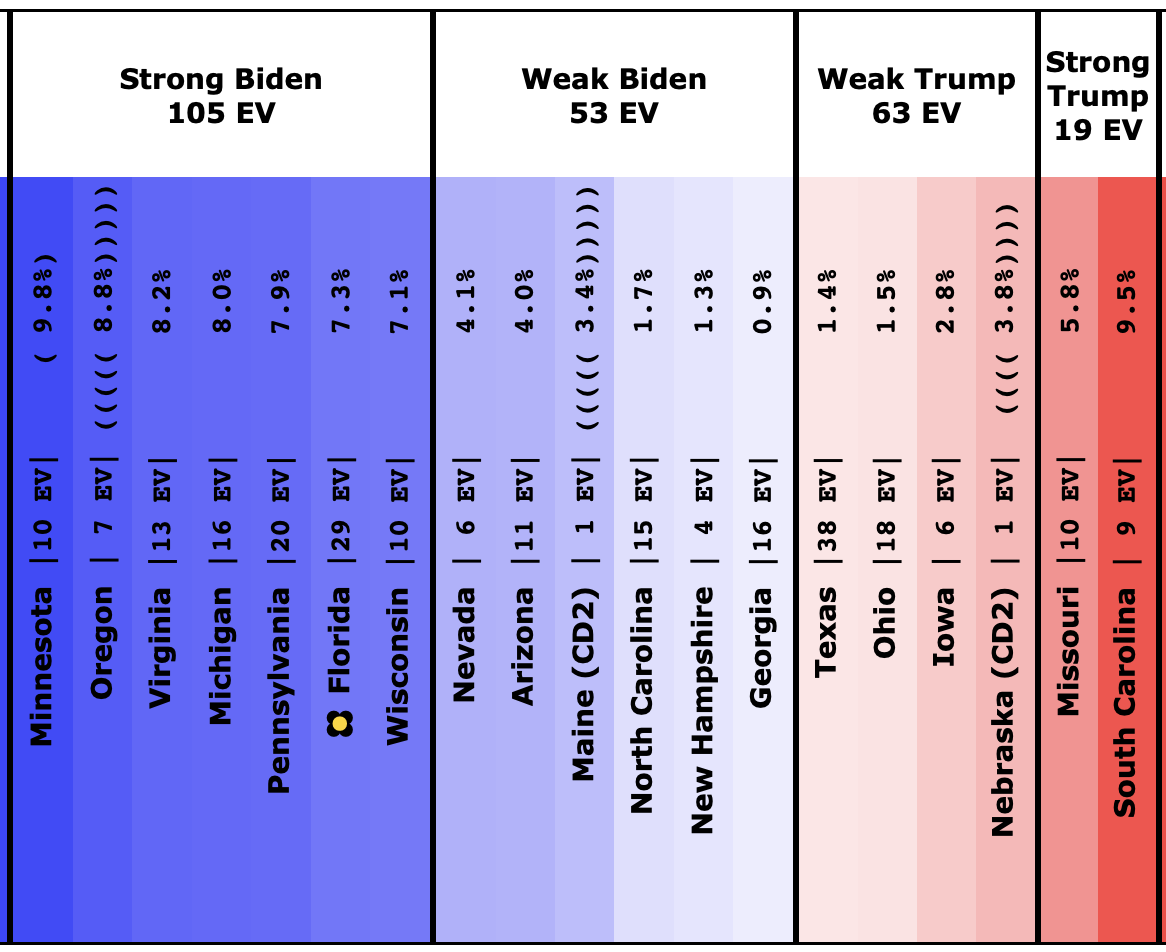
Things are getting bluer.
To close things out, the current map:
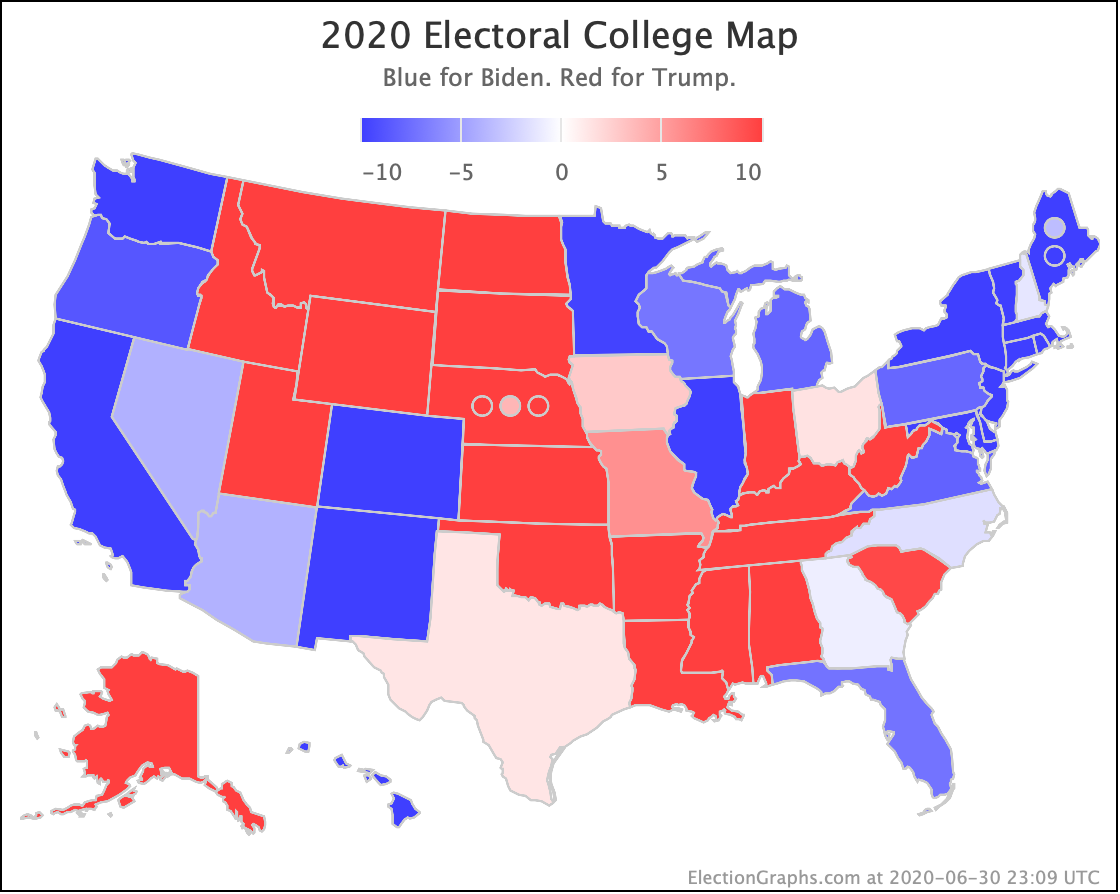
And that is where we are.
But it is only July. Time to watch what happens over the summer.
125.7 days until polls start to close.
For more information:
This post is an update based on the data on the Election Graphs Electoral College 2020 page. Election Graphs tracks a poll-based estimate of the Electoral College. The charts, graphs, and maps in the post above are all as of the time of this post. Click through on any image for current interactive versions of the chart, along with additional details.
Follow @ElectionGraphs on Twitter or Election Graphs on Facebook to see announcements of updates. For those interested in individual poll updates, follow @ElecCollPolls on Twitter for all the polls as I add them. If you find the information in these posts informative or useful, please consider visiting the donation page.