
Since last week's update, there was only one new state-level general election poll. The addition this week was a Marquette poll of Wisconsin.
There were no category changes based on these results.
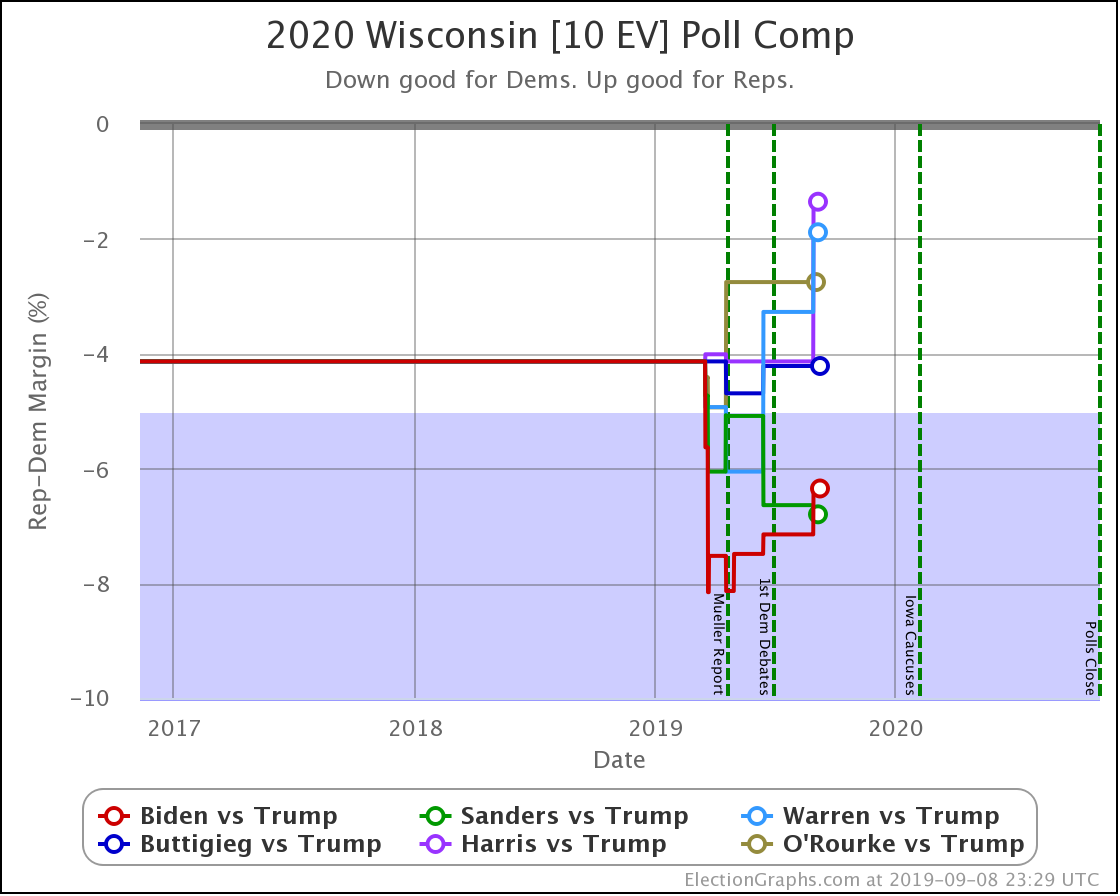
Biden and Sanders continue to have strong leads in Wisconsin (more than a 5% margin but less than a 10% margin).
Meanwhile, Warren, Buttigieg, Harris, and O'Rourke have weak leads (less than a 5% margin).
There has been some movement within the broader categories though, so let's take a look:
Marquette did not poll Buttigieg or O'Rourke, so their averages do not change.
Of the rest, only Sanders improved their Election Graphs average in Wisconsin, going from a 6.6% lead to a 6.8% lead.
Everybody else weakens.
Biden drops from a 7.2% lead to 6.4%.
Warren goes from a 3.3% lead to only 1.9%.
Harris goes from a 4.1% lead to just 1.4%.
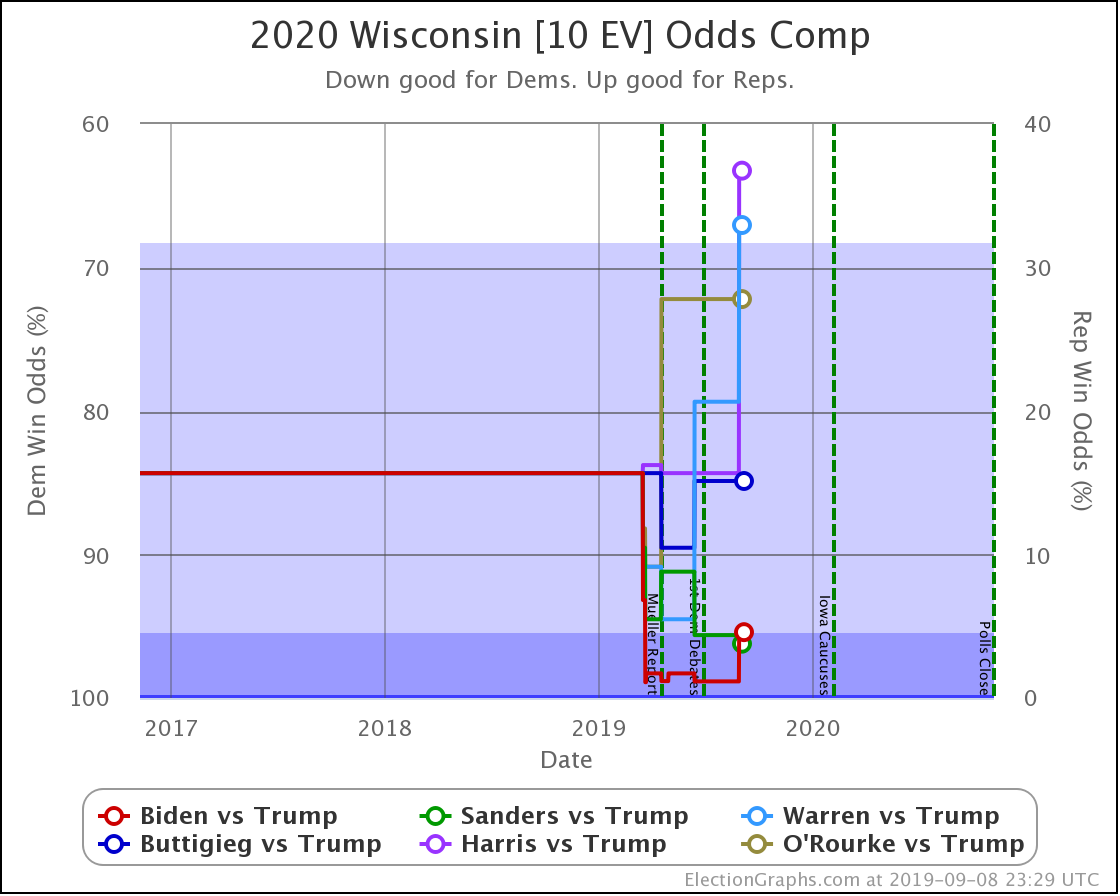
In terms of winning odds, while every Democrat here is favored to win, we have a vast range.
Sanders is now best off with a 96.2% chance of winning Wisconsin.
Harris is weakest, with only a 62.3% chance of winning the state.
So, how does this change the national picture?
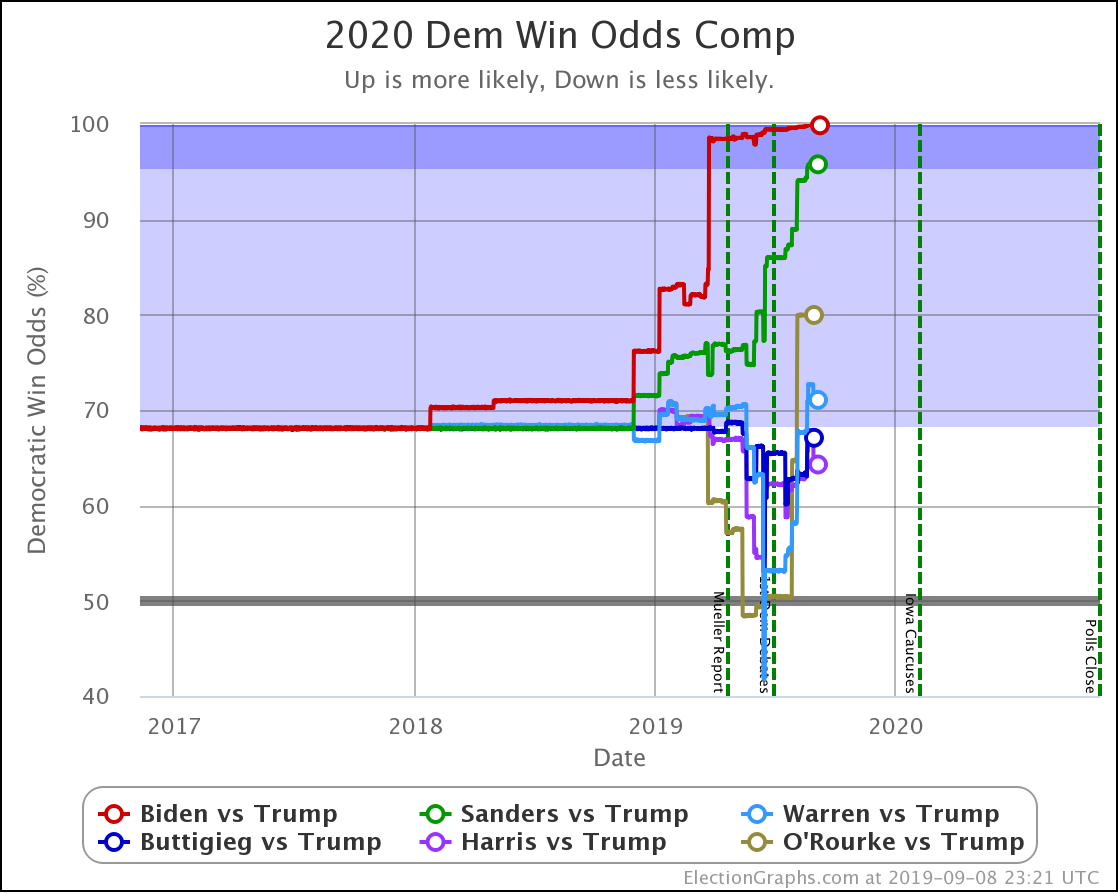
| Dem | 1 Sep | 8 Sep | 𝚫 |
| Biden | 99.9% | 99.9% | Flat |
| Sanders | 95.7% | 95.8% | +0.1% |
| O'Rourke | 80.0% | 80.0% | Flat |
| Warren | 72.6% | 71.1% | -1.5% |
| Buttigieg | 67.1% | 67.1% | Flat |
| Harris | 67.9% | 64.3% | -3.6% |
Even though Biden weakened a bit in Wisconsin, his overall position is strong enough that things look flat when rounding to the nearest 0.1%. But if you must know an additional digit after the decimal point, his national win chance in the Election Graphs simulation moves from about 99.89% to approximately 99.86%. But we don't deserve that additional digit. That is false precision. So it is flat.
Sanders, of course, has a small gain, while Warren and Harris both drop.
Harris is hurt the most by this week's polling and takes over from Buttigieg as the weakest of these six Democrats against Trump.
And that's it for this week.
422.0 days until polls start to close.
For more information:
This post is an update based on the data on the Election Graphs Electoral College 2020 page. Election Graphs tracks a poll-based estimate of the Electoral College. The charts, graphs, and maps in the post above are all as of the time of this post. Click through on any image to go to a page with the current interactive versions of that chart, along with additional details.
Follow @ElectionGraphs on Twitter or Election Graphs on Facebook to see announcements of updates. For those interested in individual poll updates, follow @ElecCollPolls on Twitter for all the polls as I add them. If you find the information in these posts informative or useful, please consider visiting the donation page.
One thought on “Most Democrats Weaken in Wisconsin”