Some other places that count delegates had him there a day or two earlier, but by our count, the Virgin Islands put Biden over the top with Biden getting all 7 delegates there in today's update to the Election Graphs delegate race charts.
Sorry New York, New Jersey, Georgia, Connecticut, Kentucky, Louisiana, Puerto Rico, West Virginia, Delaware, and Guam… your 780 delegates don't make any difference this year.
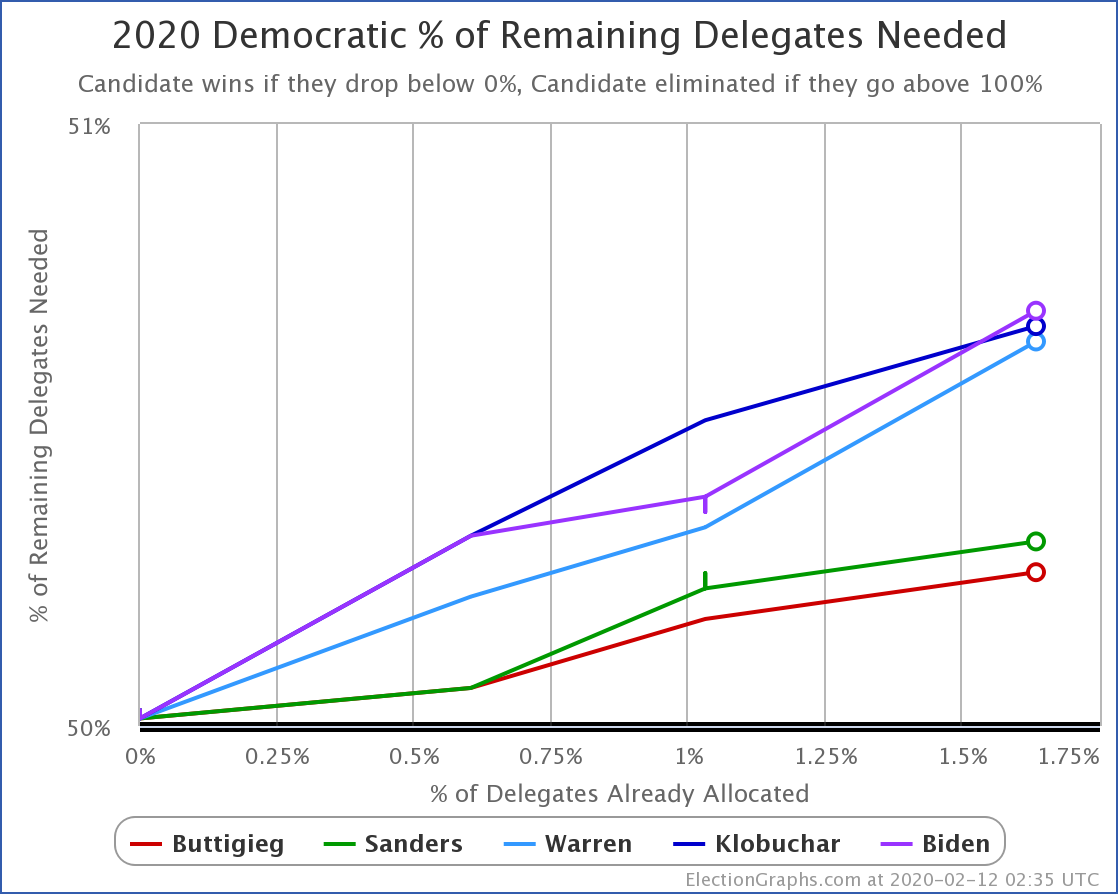
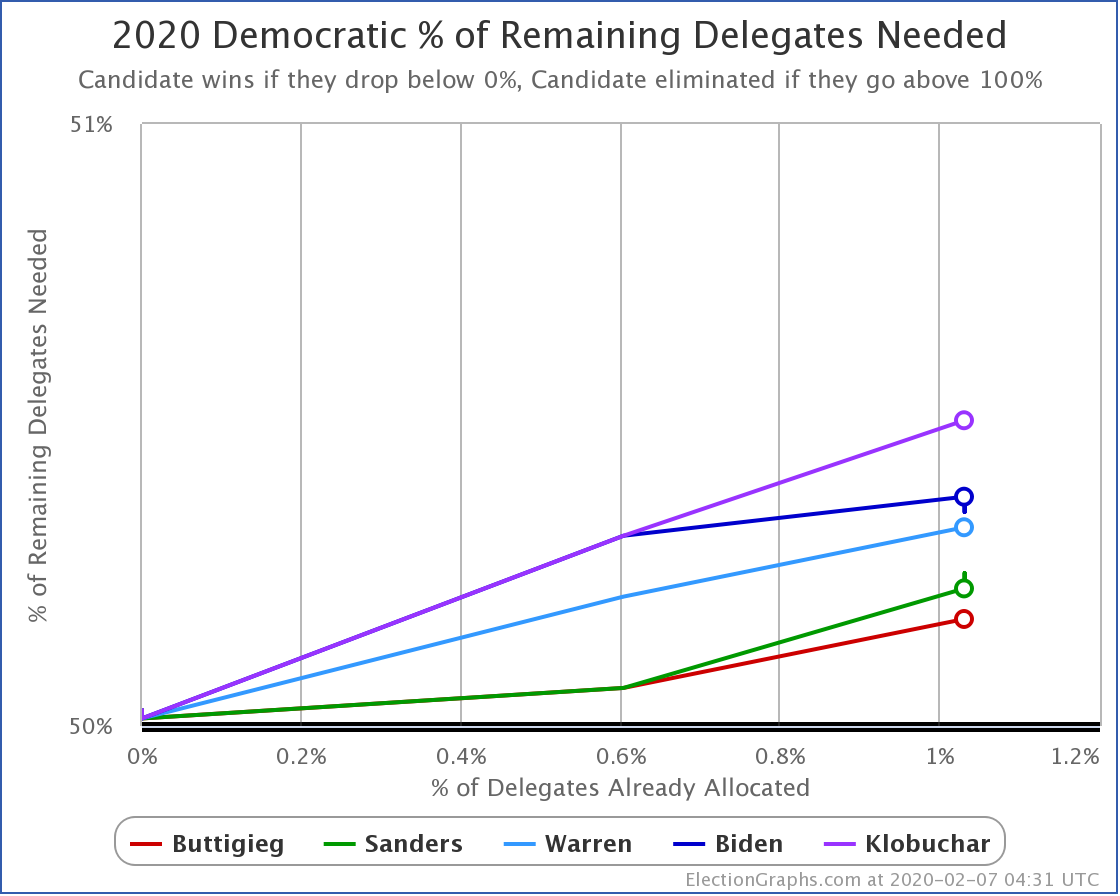
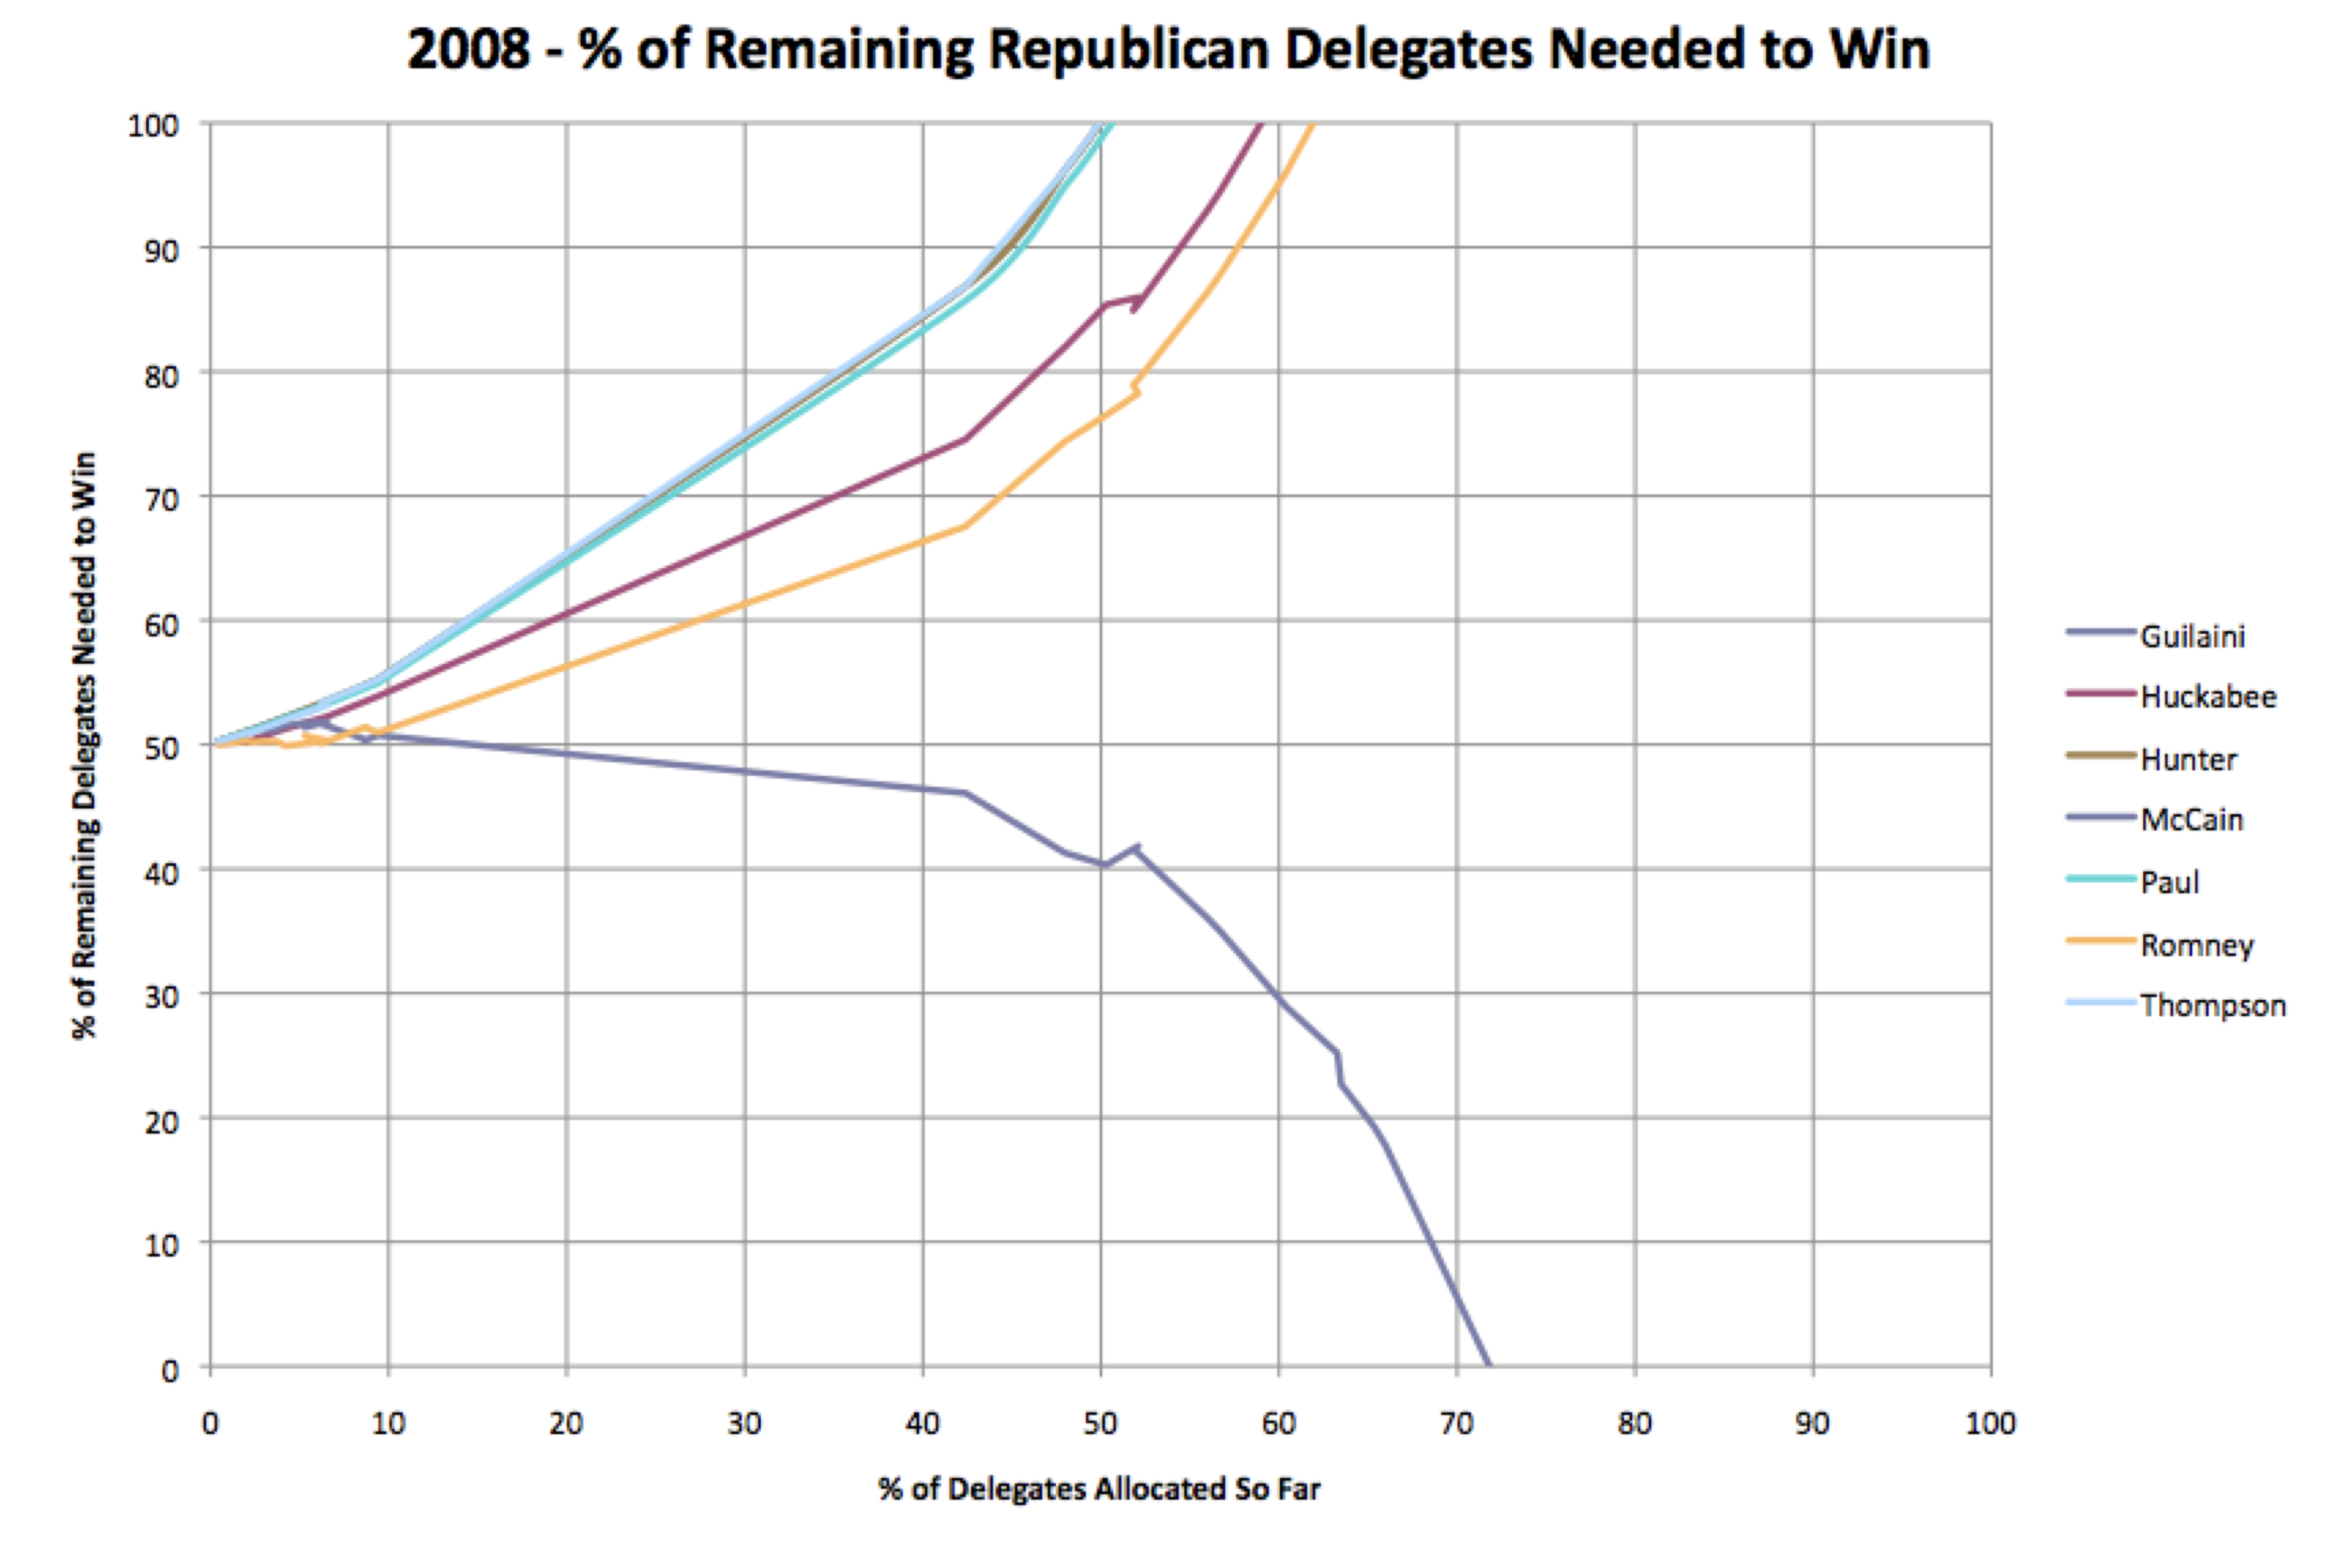
This seems like a good time to look at how the graph of "% of remaining delegates needed to win" ended up, and compare it to some of the previous cycles. So here goes:
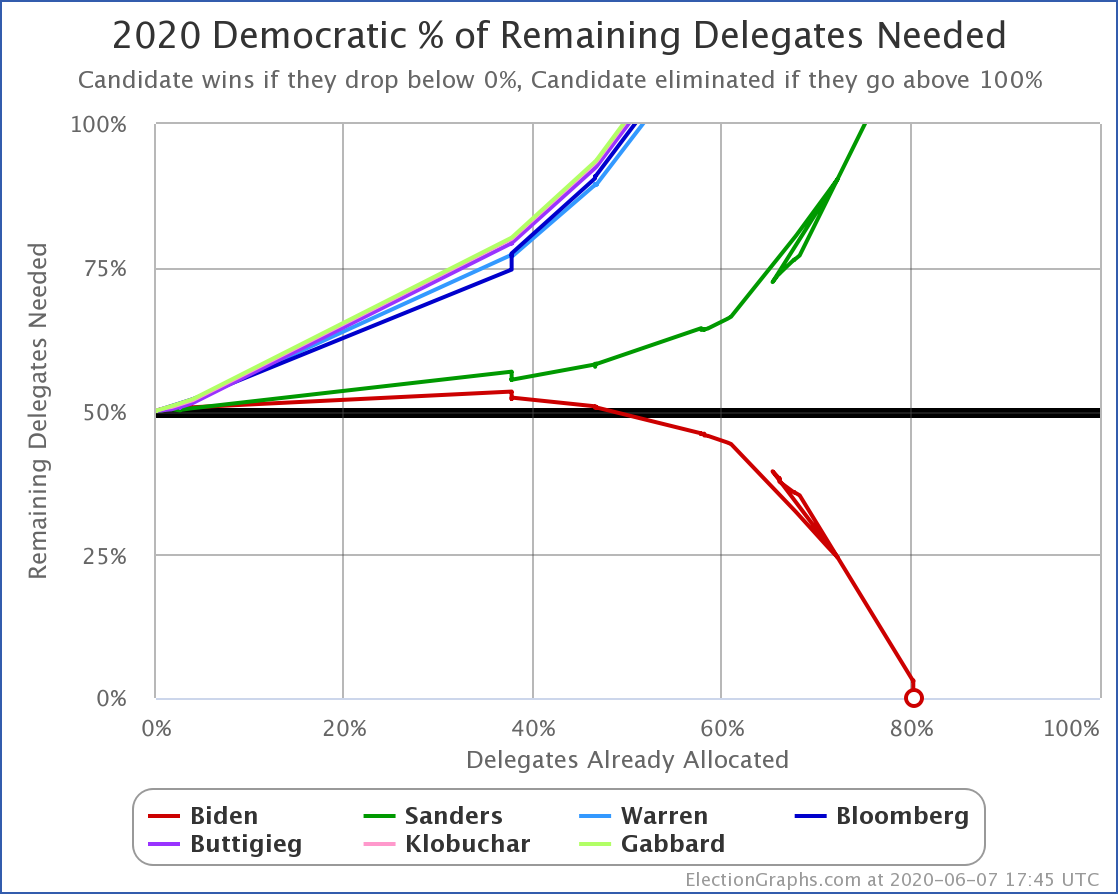
The little loop in the graph there is from when New York gave all their delegates to Biden, but then there was a court battle and the delegates went back to TBD pending the New York primaries which now won't be until June 23rd.
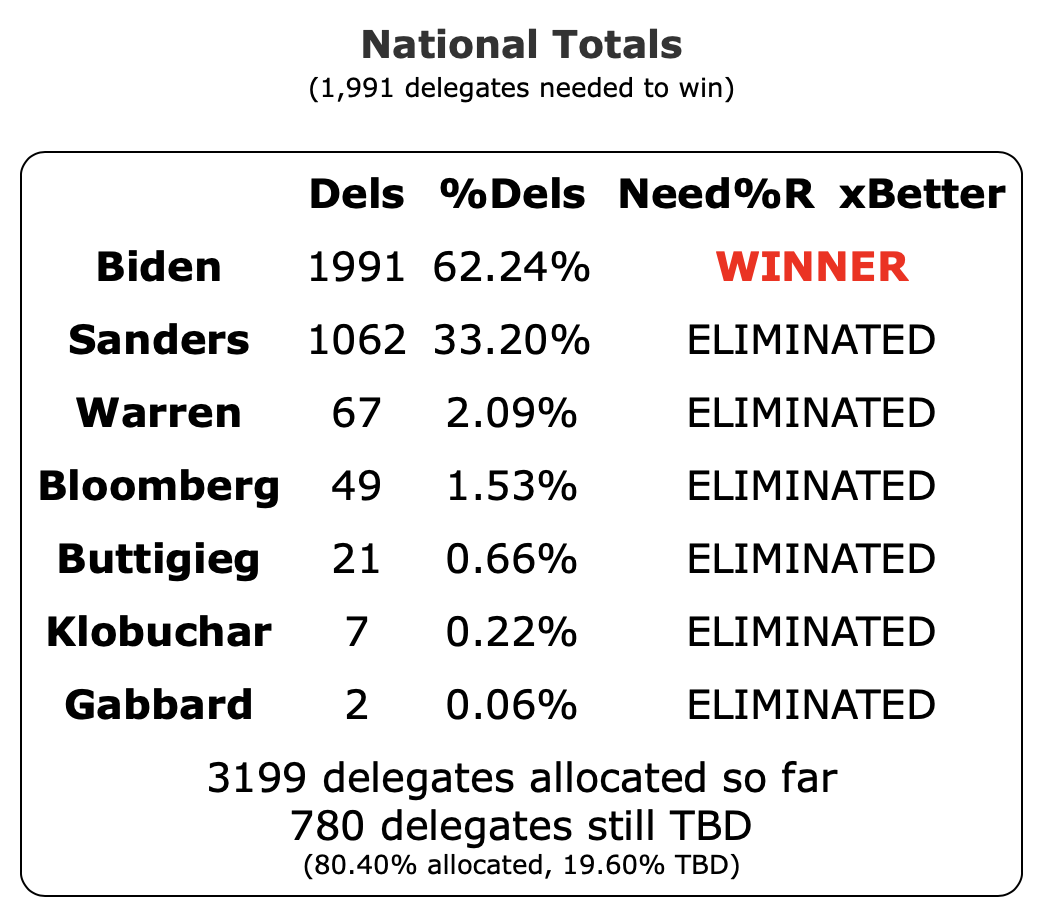
Biden clinched with almost exactly 80% of the delegates determined.
Of the five contested races in both parties since 2008 when I started tracking these, three took longer than this (in terms of % of delegates, not calendar date) and two took less.
Looking at the charts, first the three that took longer to clinch:
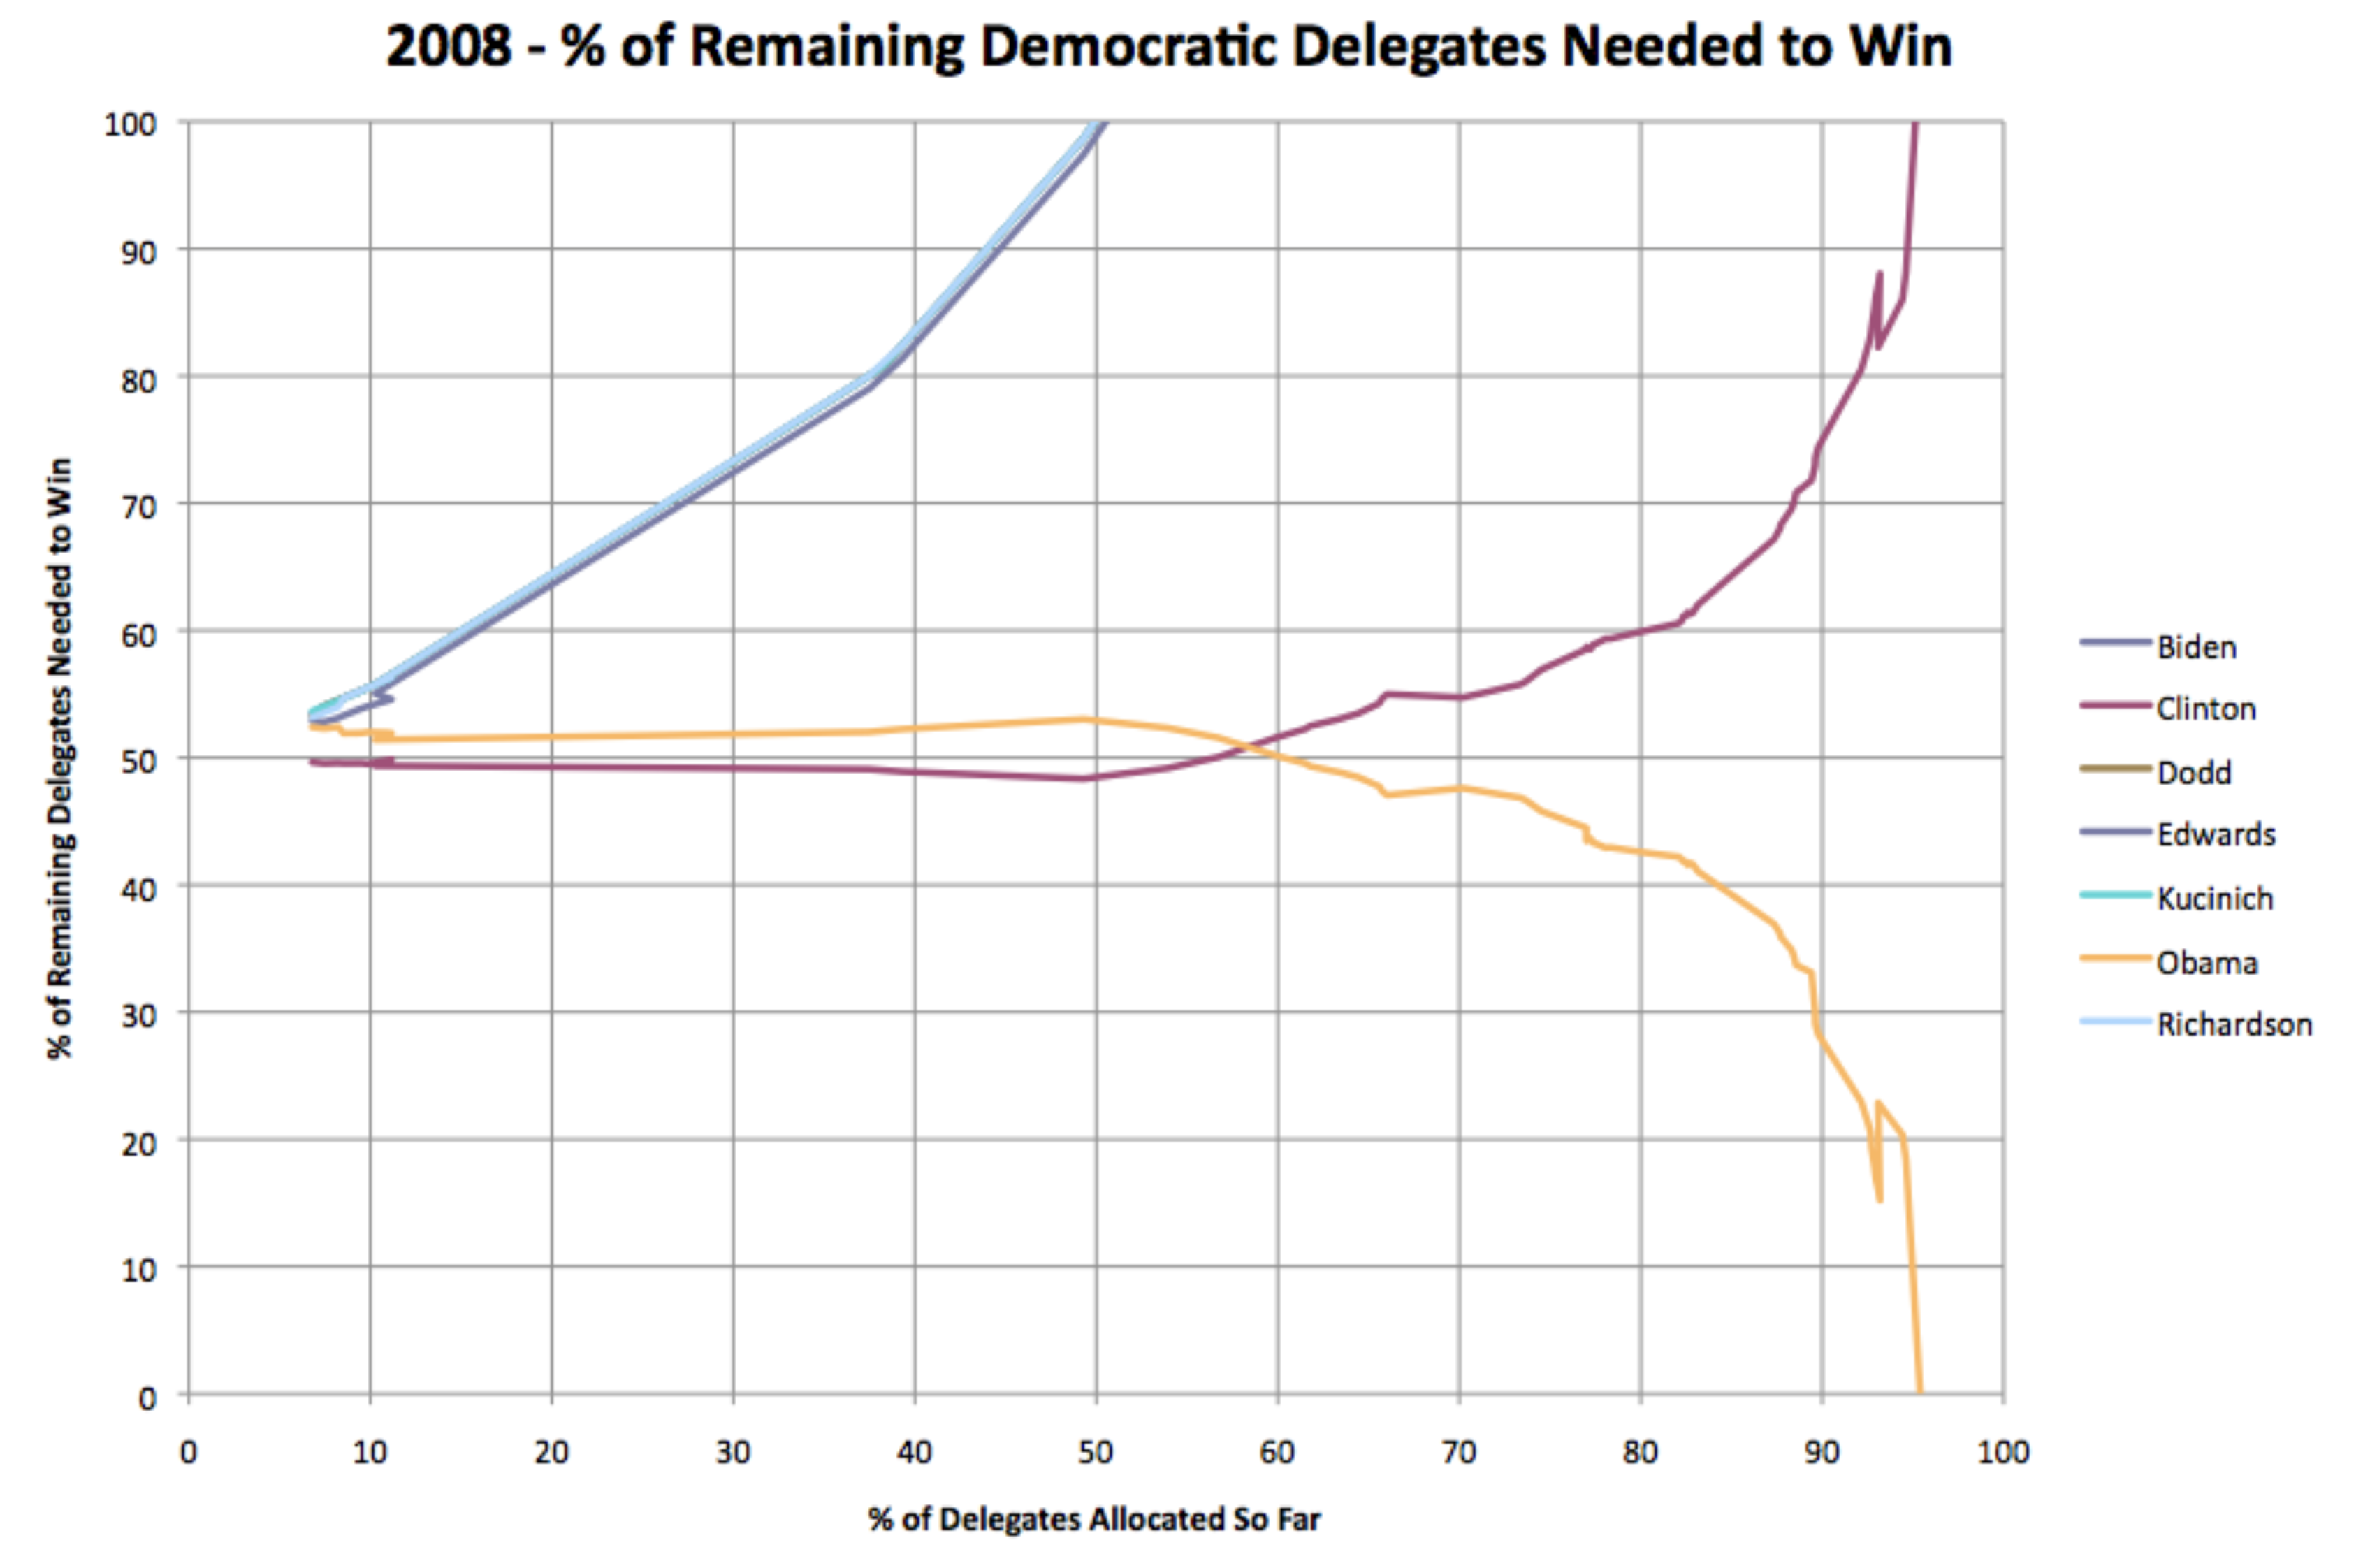
Obama in 2008:
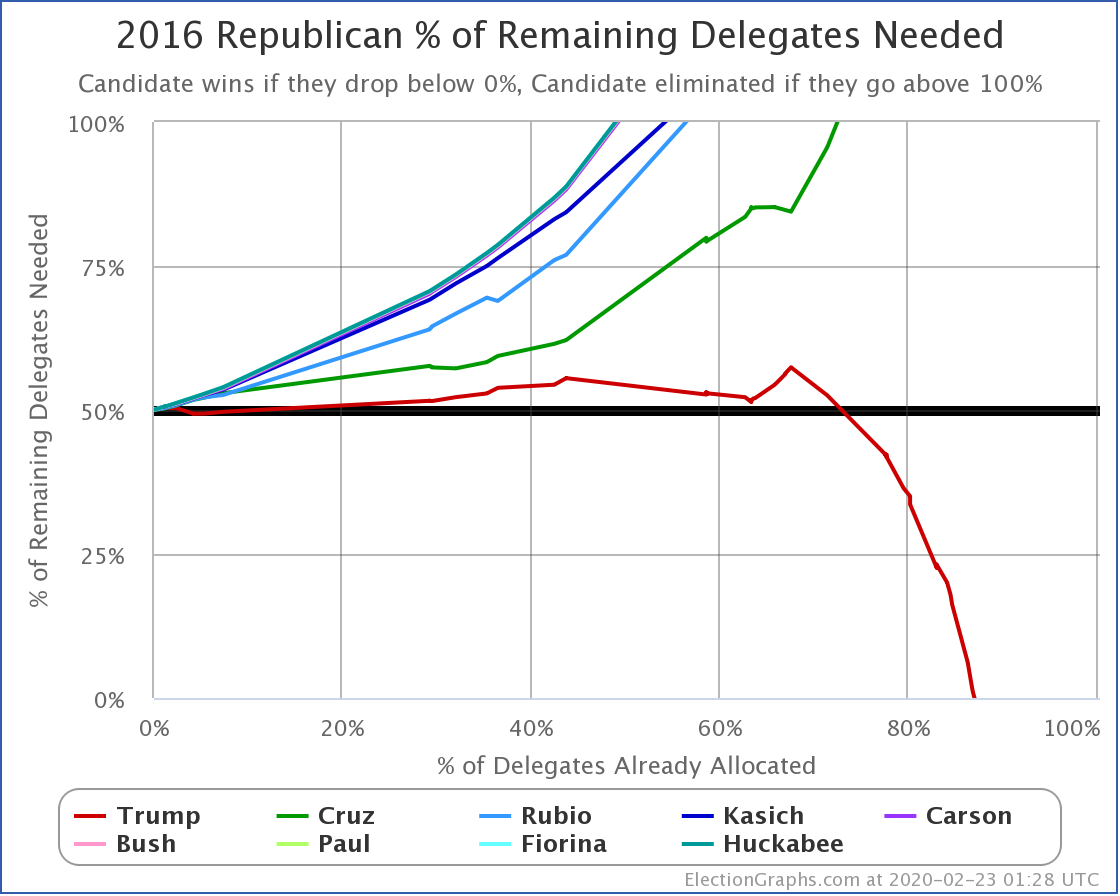
Trump in 2016:
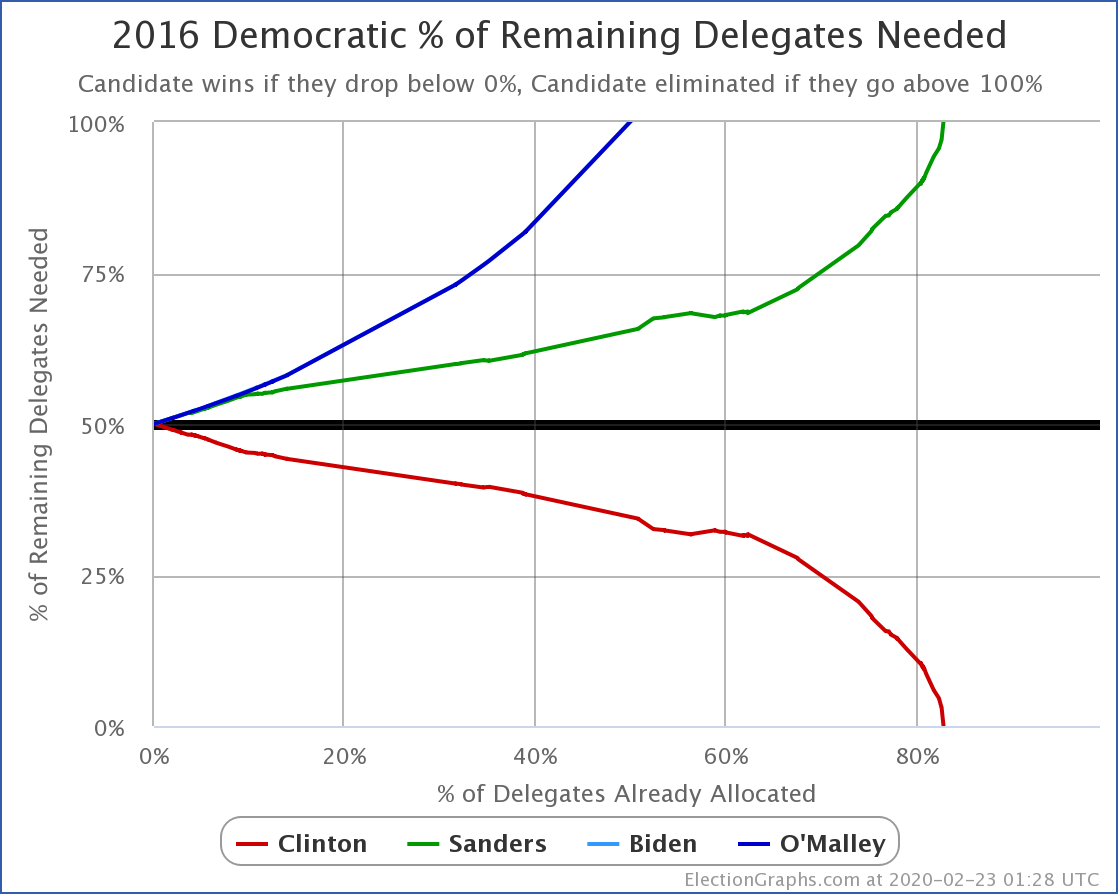
Clinton in 2016:
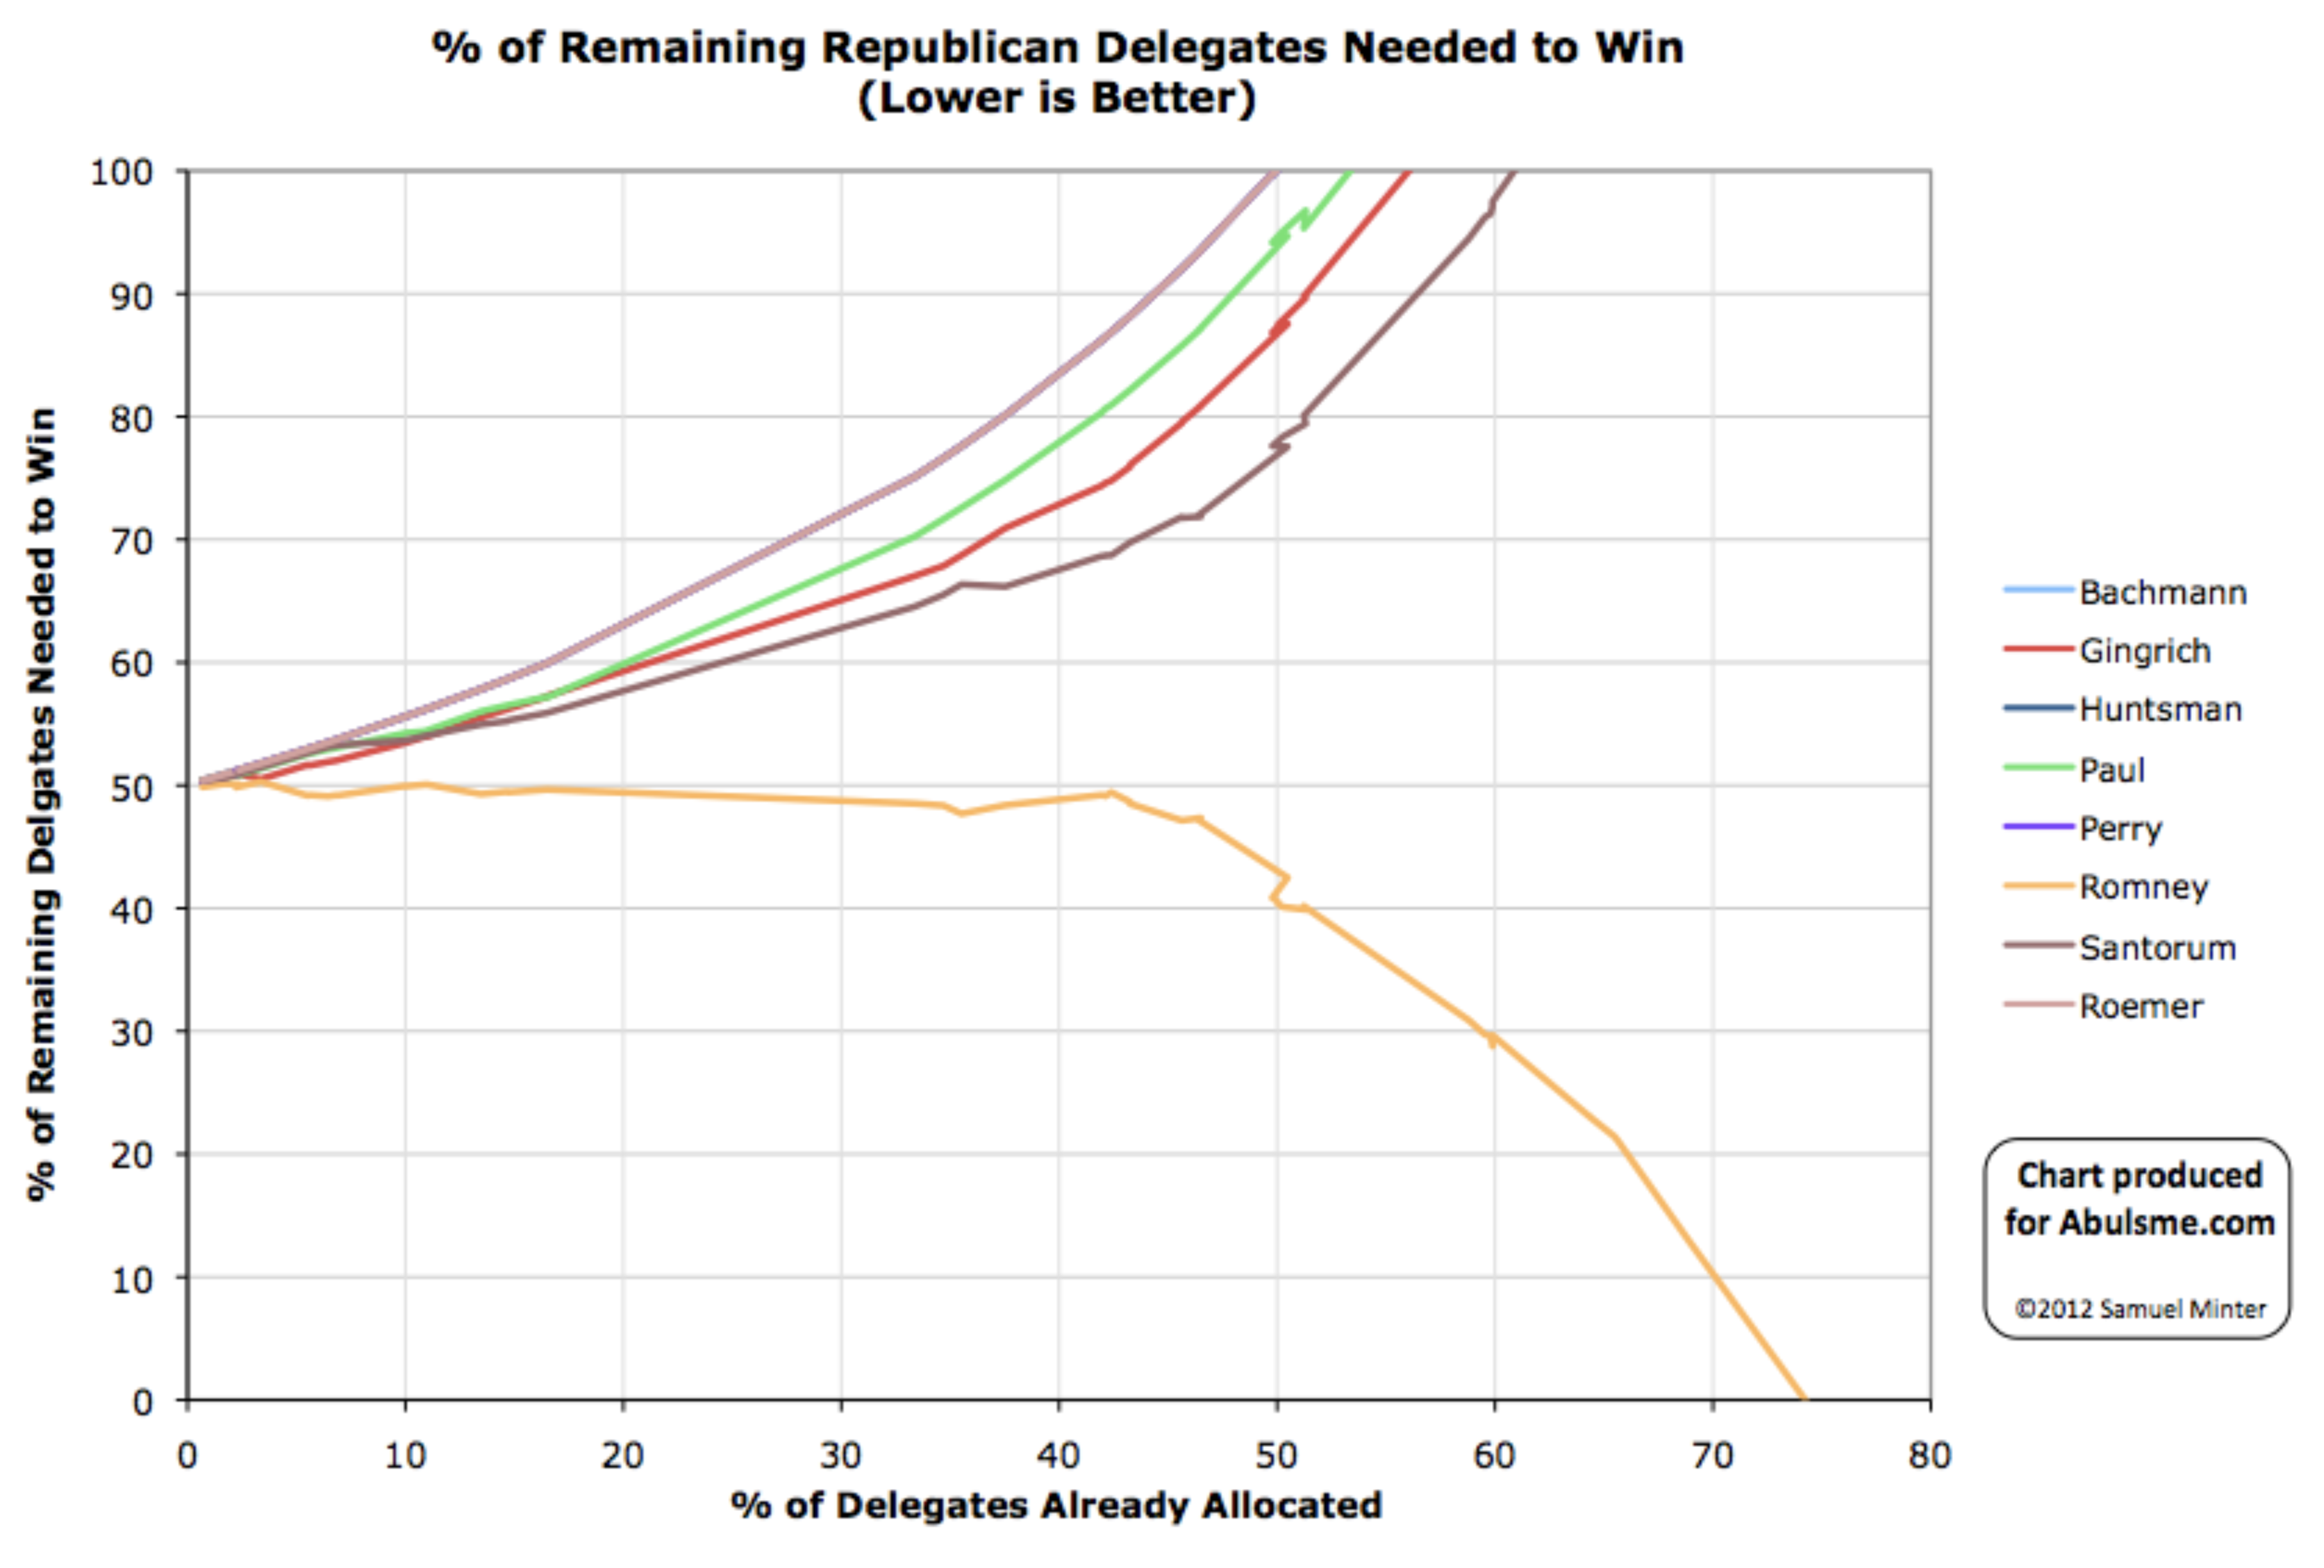
Then the two that clinched faster:
Romney in 2012:
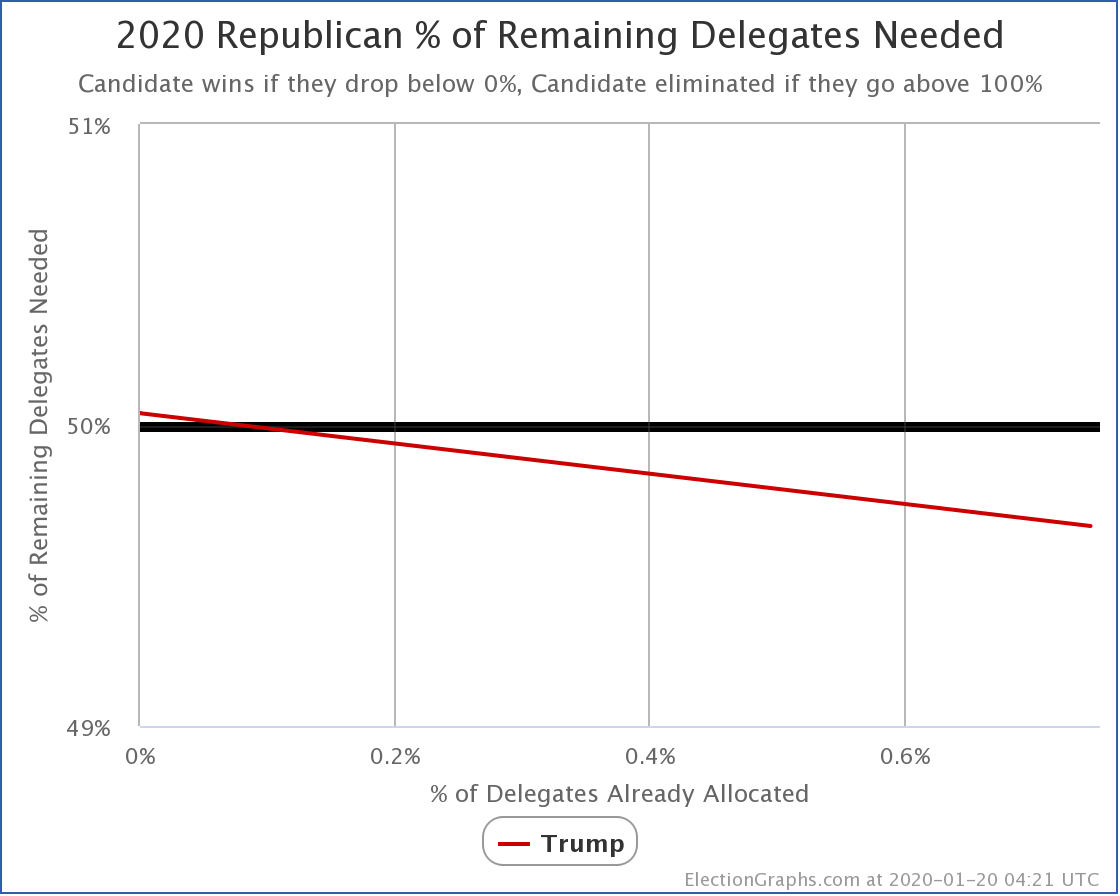
And of course, lacking any competitive challengers, Obama in 2012 and Trump in 2020 both clinched at the 50% mark.
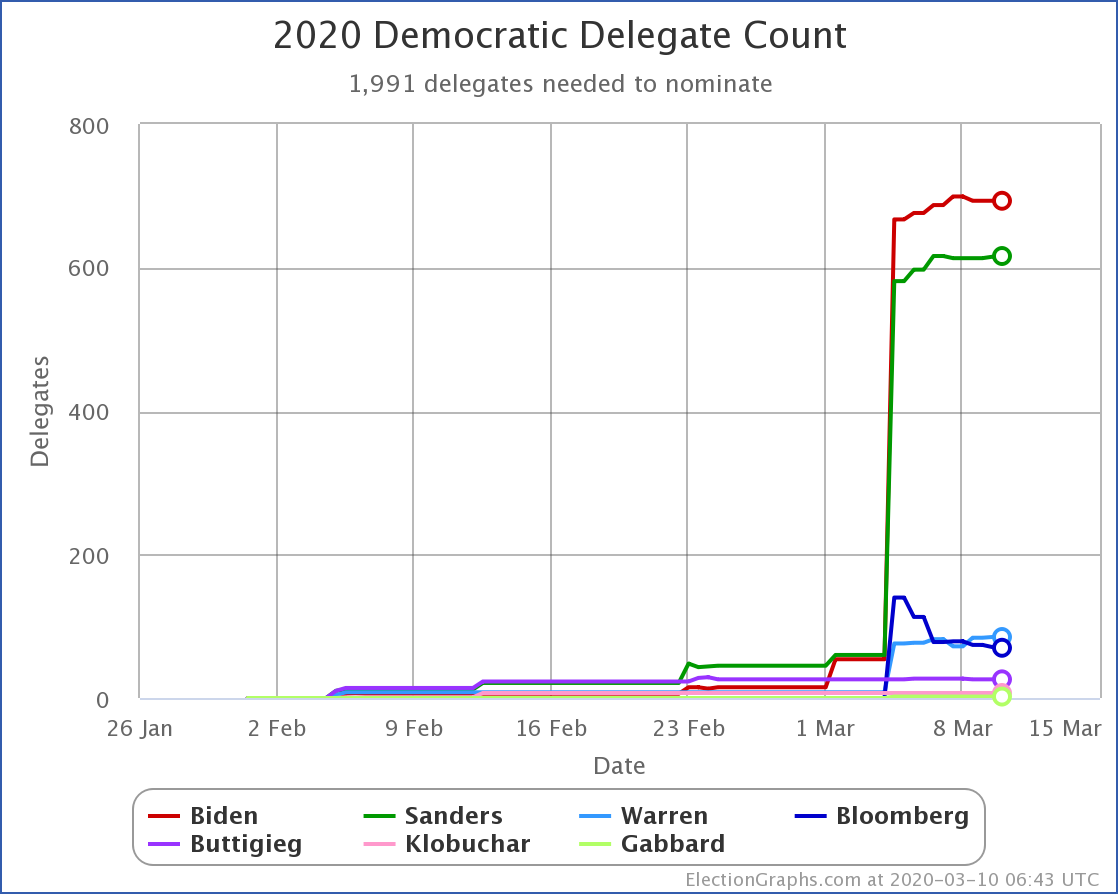
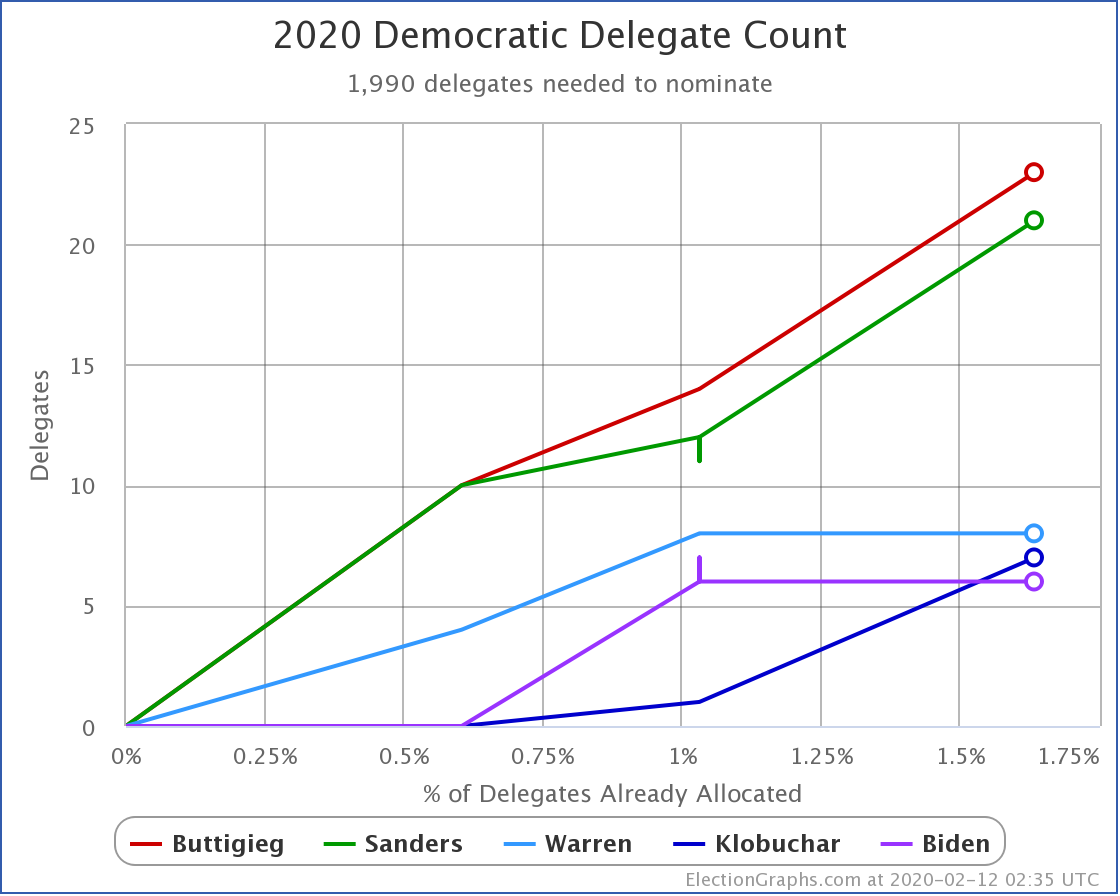
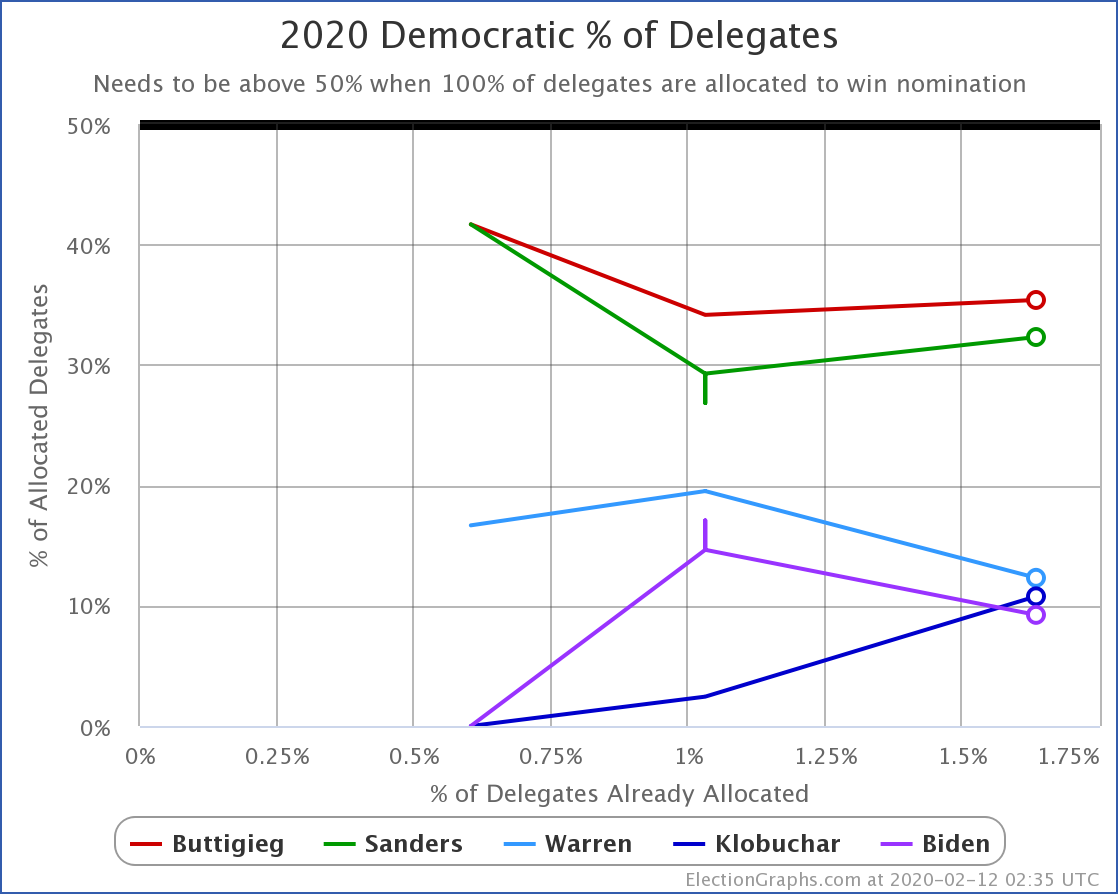
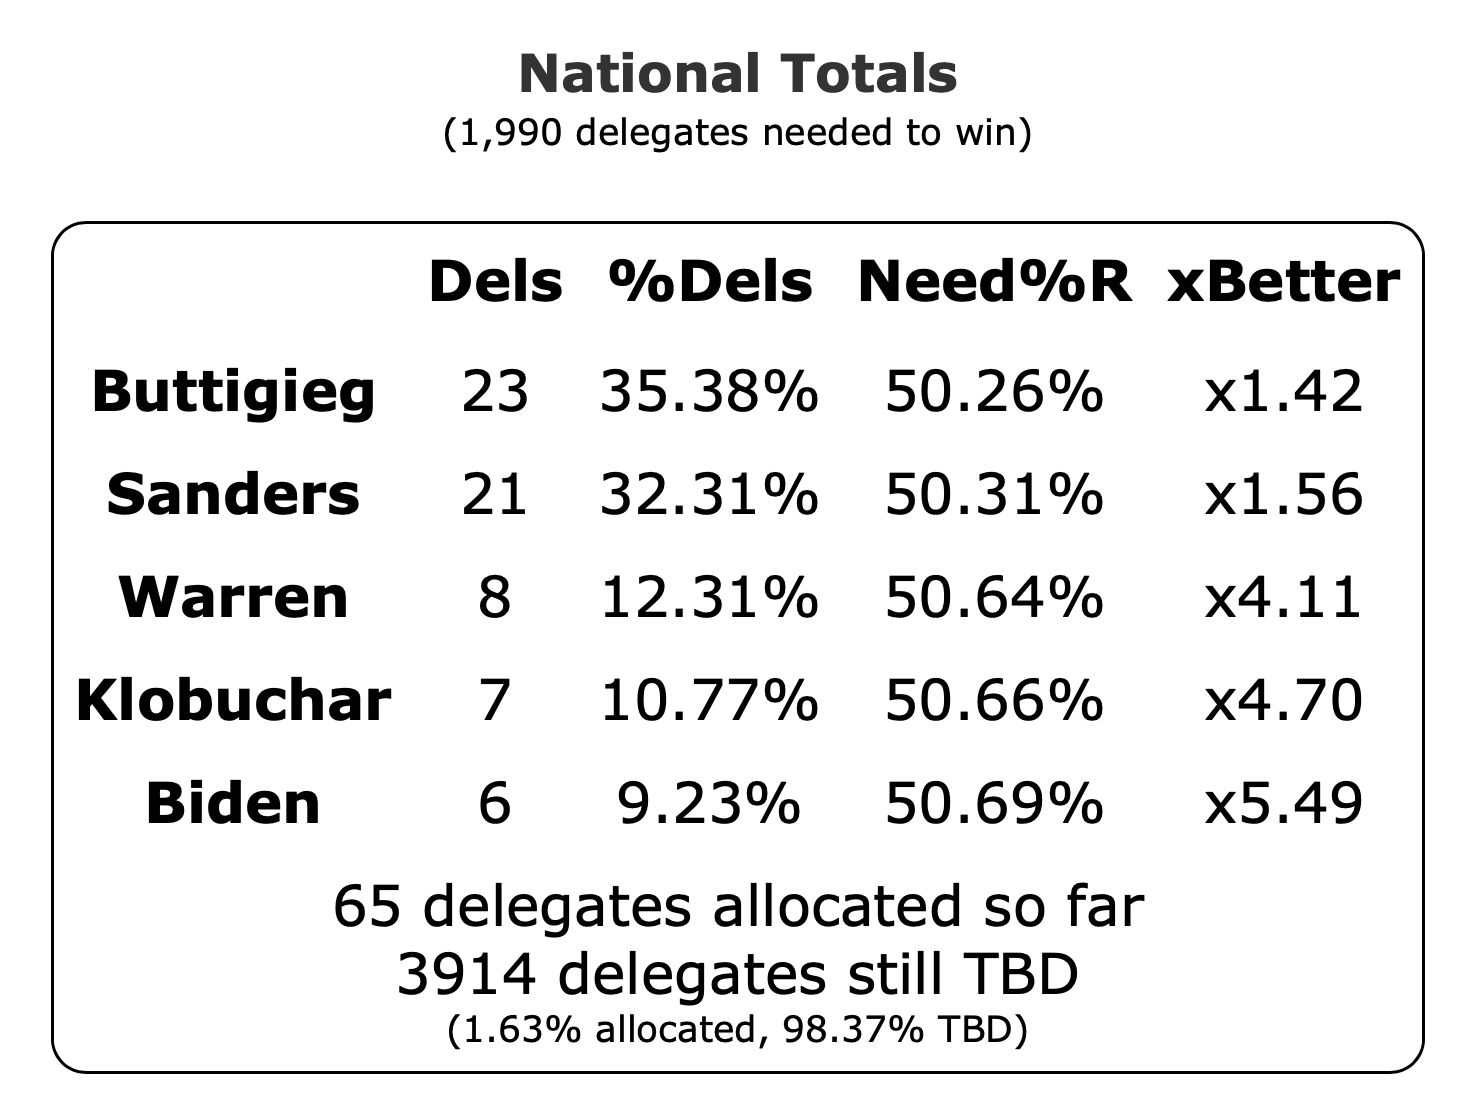
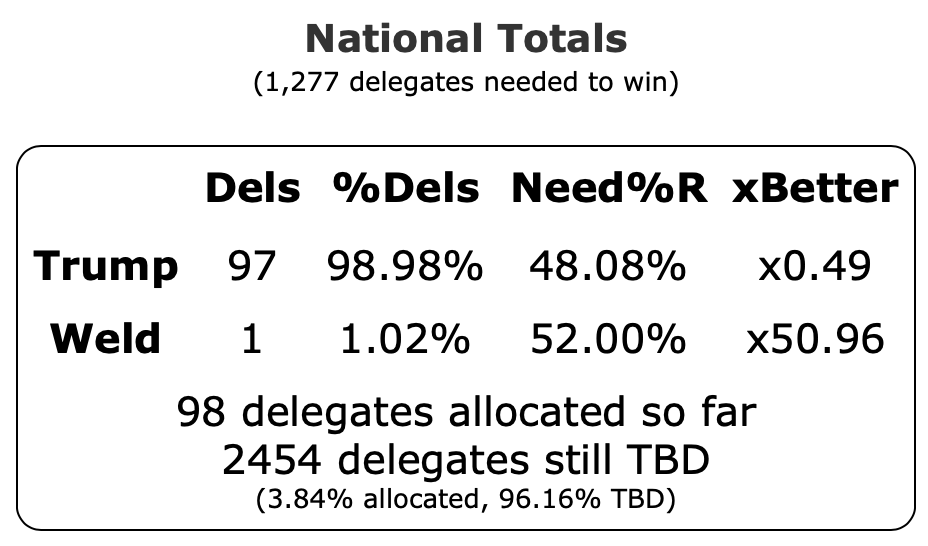
Our count of the totals on the day Biden clinched are as follows:
This will of course continue to change as those last 780 delegates get determined. And there may even still be some shifts in the 3199 already allocated as delegate selection plans wrap up before the convention.
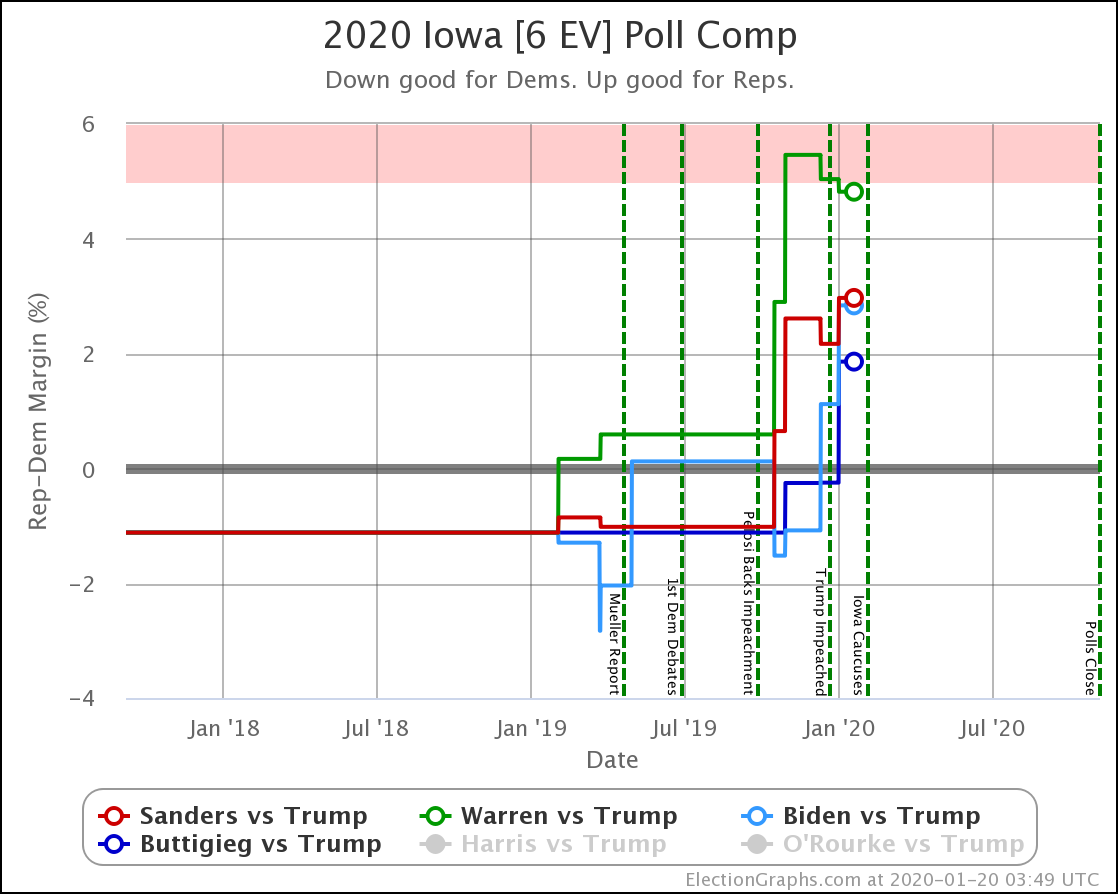
As a simple example of this, when the initial count was over back in February, the delegate count in Iowa was:
- Buttigieg 14
- Sanders 12
- Warren 8
- Biden 6
- Klobuchar 1
But when candidates dropped out and were no longer vying for delegates in the later parts of the delegate selection process, statewide delegates from the candidates who dropped out were reassigned to Biden. As of today, Iowa looks like this:
- Biden 14
- Sanders 12
- Buttigieg 9
- Warren 5
- Klobuchar 1
So after all this, Biden wins Iowa after all.
And of course, since they can't make a difference to the outcome, the superdelegates will get to vote on the first ballot too. So any full delegate count coming from the convention (virtual or otherwise) will be a bit different than what we have here, which just counted pledged delegates.
As more updates come in, we'll add them as updates to the end of this post.
We declared things "almost done" on March 11th, and "over" on March 18th, but now we are really "done done" absent something catastrophic that causes Biden to leave the race prematurely.
So there we are.
71.0 days until the Democratic National Convention.
78.0 days until the Republican National Convention.
Update 2020-06-08 04:16 UTC: Results from Guam today: Biden 5, Sanders 2. Also an update from PA: One delegate moves from Sanders to Biden. New totals: Biden 1997, Sanders 1063, Others 146.
Update 2020-06-09 04:16 UTC: Update from Arkansas: Bloomberg loses two delegates to Biden. New totals: Biden 1999, Sanders 1063, Others 144.
Update 2020-06-10 04:01 UTC: Today we have the results from Georgia and West Virginia. It looks like Biden will get all 133 delegates. New totals: Biden 2132, Sanders 1063, Others 144.
Update 2020-06-11 15:51 UTC: Not a delegate update, but a quick correction. Above I said, "And of course, since they can't make a difference to the outcome, the superdelegates will get to vote on the first ballot too.". This is slightly premature. For the superdelegates to vote on the first ballot, Biden has to have enough pledged delegates to have a majority of ALL delegates, which would be 2378 pledged delegates out of 4753 total delegates (rather than 1991 pledged delegates out of 3979 pledged delegates). So he is still 246 delegates short of that threshold, although he will probably get there before the end. For more details on this, see this FHQ post.
Update 2020-06-24 07:08 UTC: Today we have initial results from Kentucky and New York. Biden 250, Sanders 57. There are 21 delegates TBD in Kentucky which may end up officially uncommitted. New totals: Biden 2382, Sanders 1120, Others 144.
Update 2020-06-25 05:28 UTC: Today we have updates from Kentucky and New York. Biden gains 4 delegates, Sanders loses 3. New totals: Biden 2386, Sanders 1117, Others 144.
Update 2020-06-26 16:21 UTC: Today we have another update from Kentucky. Biden gains 8 more delegates, Sanders gains 2. Looks like 10 delegates will be officially uncommitted. New totals: Biden 2394, Sanders 1119, Others 144.
Update 2020-06-27 16:45 UTC: Today we have an update from New York. Biden loses one delegate to Sanders. New Totals: Biden 2393, Sanders 1120, Others 144, TBD 322.
Update 2020-06-29 03:46 UTC: Today an update from Kentucky. Biden gains one more delegate. New Totals: Biden 2394, Sanders 1120, Others 144, TBD 321.
Update 2020-07-01 02:35 UTC: An update from Kentucky today. Biden gains 9 delegates, Sanders loses 2. New totals: Biden 2403, Sanders 1118, Others 144, TBD 314.
Update 2020-07-07 05:45 UTC: An update from New York. Biden pulls one delegate from Sanders. New totals: Biden 2404, Sanders 1117, Others 144, TBD 314.
Update 2020-07-08 06:41 UTC: Initial results from New Jersey and Delaware have Biden getting all 147 delegates from the two states. New totals: Biden 2551, Sanders 1117, Others 144, TBD 167.
Update 2020-07-12 15:33 UTC: Initial results are in from Louisiana, and it looks like Biden will be getting all 54 delegates. New totals: Biden 2605, Sanders 1117, Others 144, TBD 113.
Update 2020-07-13 04:52 UTC: Initial results are in from Puerto Rico: Biden 44, Sanders 4, Bloomberg 3. New totals: Biden 2649, Sanders 1121, Others 147, TBD 62. Only Connecticut left. And 2 uncommitted delegates from Kentucky.
Update 2020-07-17 18:20 UTC: Logged an update from Rhode Island where a delegate moved from Sanders to Biden, and an update from Puerto Rico where a delegate moved from Biden to Sanders. No net change: Biden 2649, Sanders 1121, Others 147, TBD 62. Only Connecticut left. And 2 uncommitted delegates from Kentucky.
Update 2020-07-22 23:10 UTC: One delegate in Puerto Rico moves from Bloomberg to Biden. New totals: Biden 2650, Sanders 1121, Others 146, TBD 62.
Update 2020-08-03 04:17: Logged updates today from New Jersey and Puerto Rico. Net change, Biden lost 11 delegates, 3 went to Sanders, and 8 went to… Bloomberg. New totals: Biden 2639, Sanders 1124, Others 154, TBD 62. Only Connecticut left. And 2 uncommitted delegates from Kentucky.
Update 2020-08-06 23:30: Update from Puerto Rico today. 8 delegates move from Bloomberg to Biden. New totals: Biden 2647, Sanders, 1124, Others 146, TBD 62. Only Connecticut left. And 2 uncommitted delegates from Kentucky.
Update 2020-08-08 20:20: Today's delegate estimate update is from New Jersey. Two delegates shift from Biden to Sanders. New totals: Biden 2645, Sanders 1126, Others 146, TBD 62. Only Connecticut left. And 2 uncommitted delegates from Kentucky.
Update 2020-08-12 04:23: Results from Connecticut today. It looks like Biden will get all 60 delegates. Also an update from New York, where Sanders gives up 11 delegates to Biden. New totals: Biden 2716, Sanders, 1115, Others 146. Only the 2 uncommitted delegates from Kentucky are still unknown.
Update 2020-08-19 04:07: Tonight was the official roll call vote at the Democratic National Convention. The final results, as per @2020Delegates, including superdelegate votes since they couldn’t make a difference: Biden 3558, Sanders 1151, Abstain 5, Did Not Vote 35. And that is that for the Democratic nomination.
For more information:
This post is an update based on the data on the Election Graphs 2020 Delegate Race page. Election Graphs tracks estimates of the convention delegate totals for both parties. The charts, graphs, and maps in the post above are all as of the time of this post. Click through on any image for the current interactive versions of that chart, along with additional details.
Follow @ElectionGraphs on Twitter or Election Graphs on Facebook to see announcements of new blog posts. For those interested in more granular updates of delegate updates or general election polling, follow @ElecCollPolls on Twitter. If you find the information in these posts informative or useful, please consider visiting the donation page.