
Yes, we had Iowa, but on the general election side of things, since the last update on February 3rd, we have had new polls for Tennessee, North Dakota, South Carolina, New Hampshire (x2), and Kansas.
With the exception of New Hampshire, these are solidly red states and so didn't really do anything to change the national picture. But things did jiggle just a little bit with the two New Hampshire polls, so we'll review the changes on all the major candidate pairs.
But first, for the first time in one of these updates, we actually have delegate leaders in both parties. This may well change as soon as we get results from New Hampshire, but for the moment, the delegate leaders are Buttigieg and Trump.
So before we look at comparisons of the various Democrats vs. Trump, let's look specifically at Buttigieg vs. Trump.
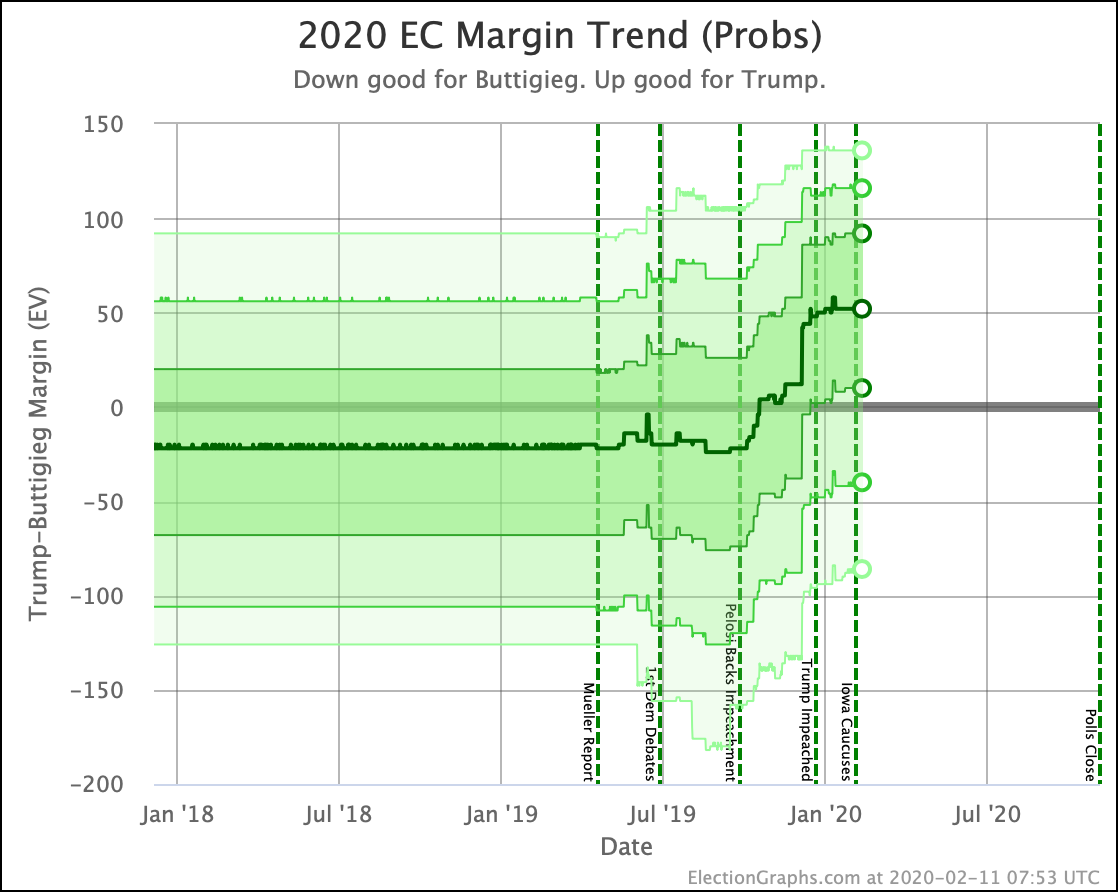
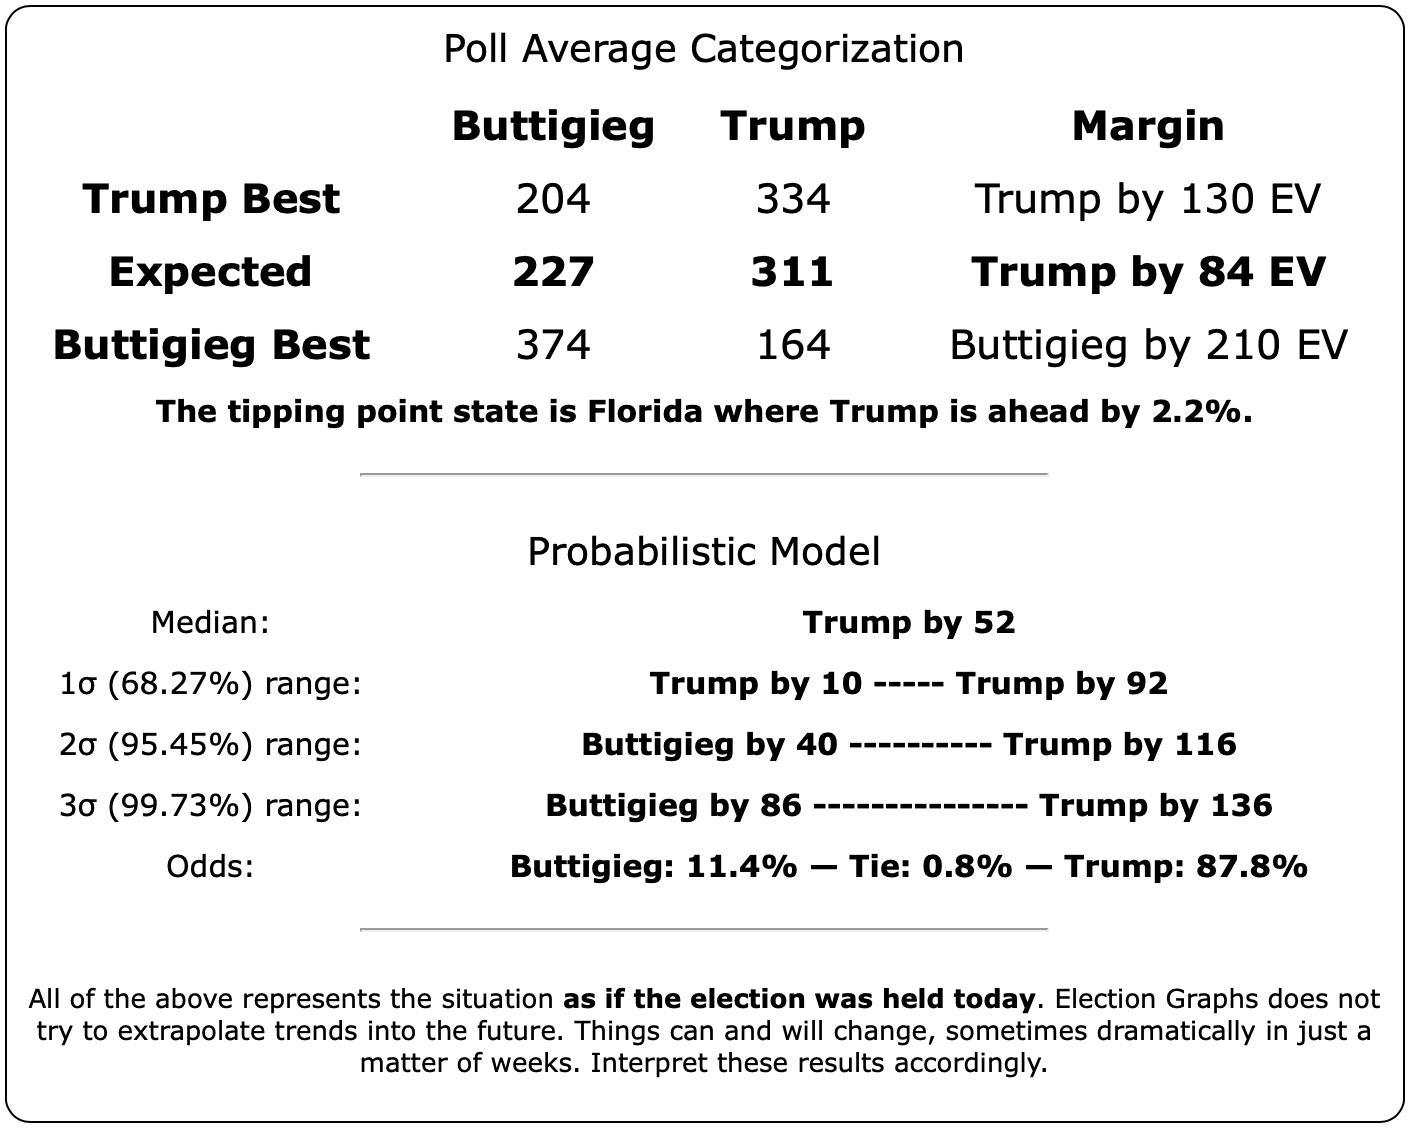
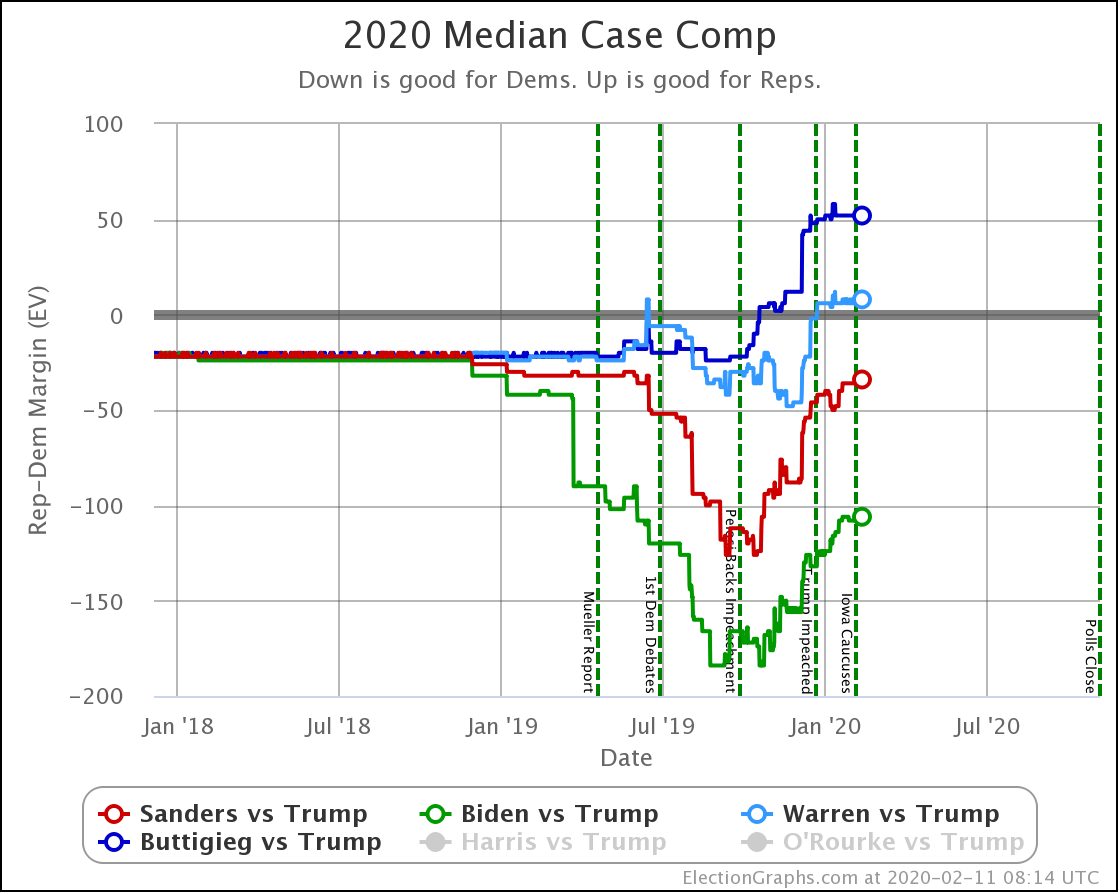
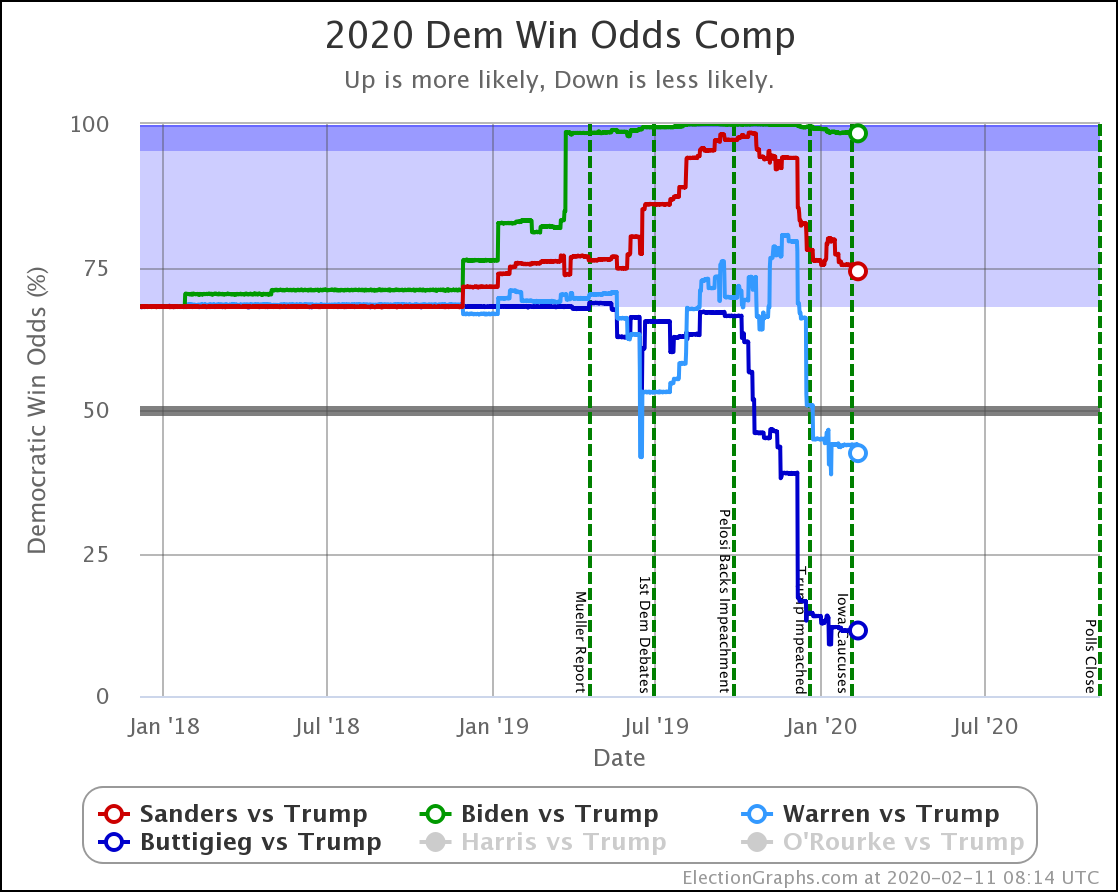
Looking at the Election Graphs probabilistic model, from September through the end of 2019, Buttigieg's position just kept getting worse. It seems to have leveled off a bit so far in 2020, so maybe Buttigieg is hitting a bottom. But currently, things don't look good for him, with the median case in our simulations being a 52 electoral vote defeat by Trump and only an 11.4% chance of an actual victory.
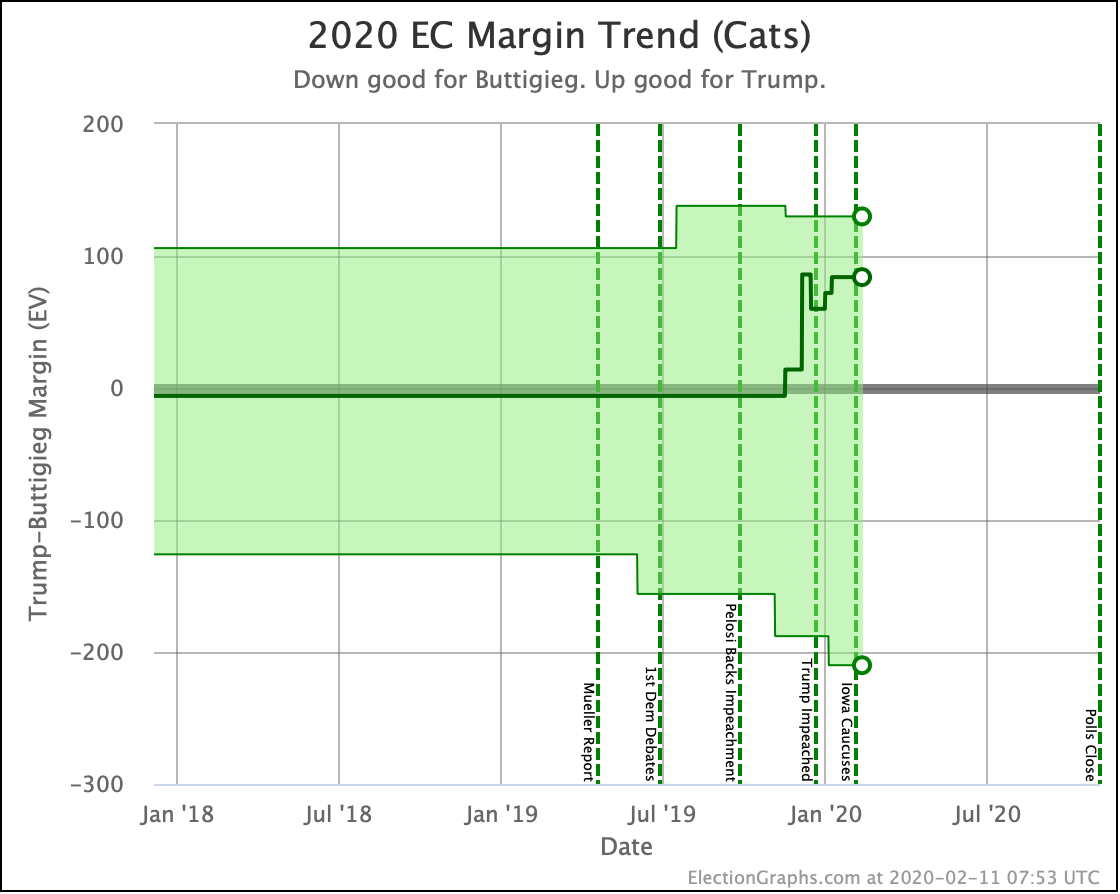
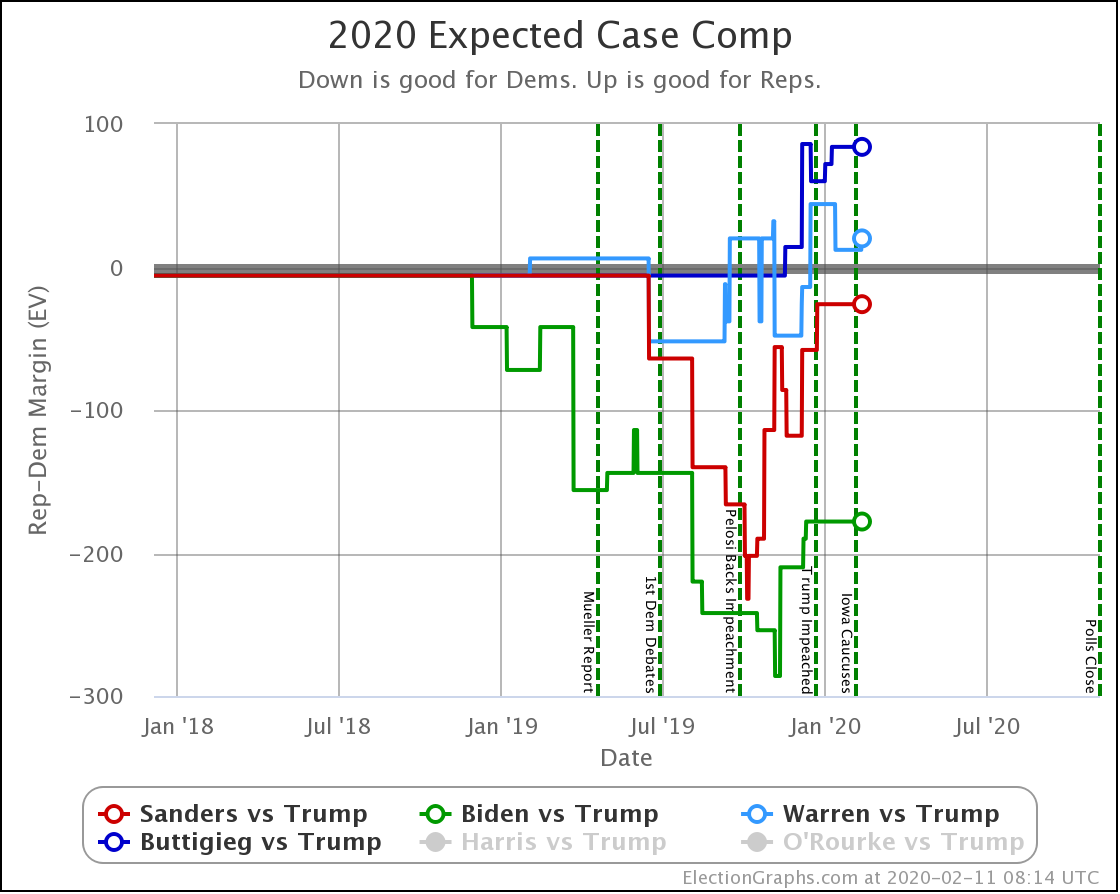
The categorization view, where every state just goes to whoever leads the average, regardless of how close it is, looks even worse. Buttigieg loses by 84 electoral votes.
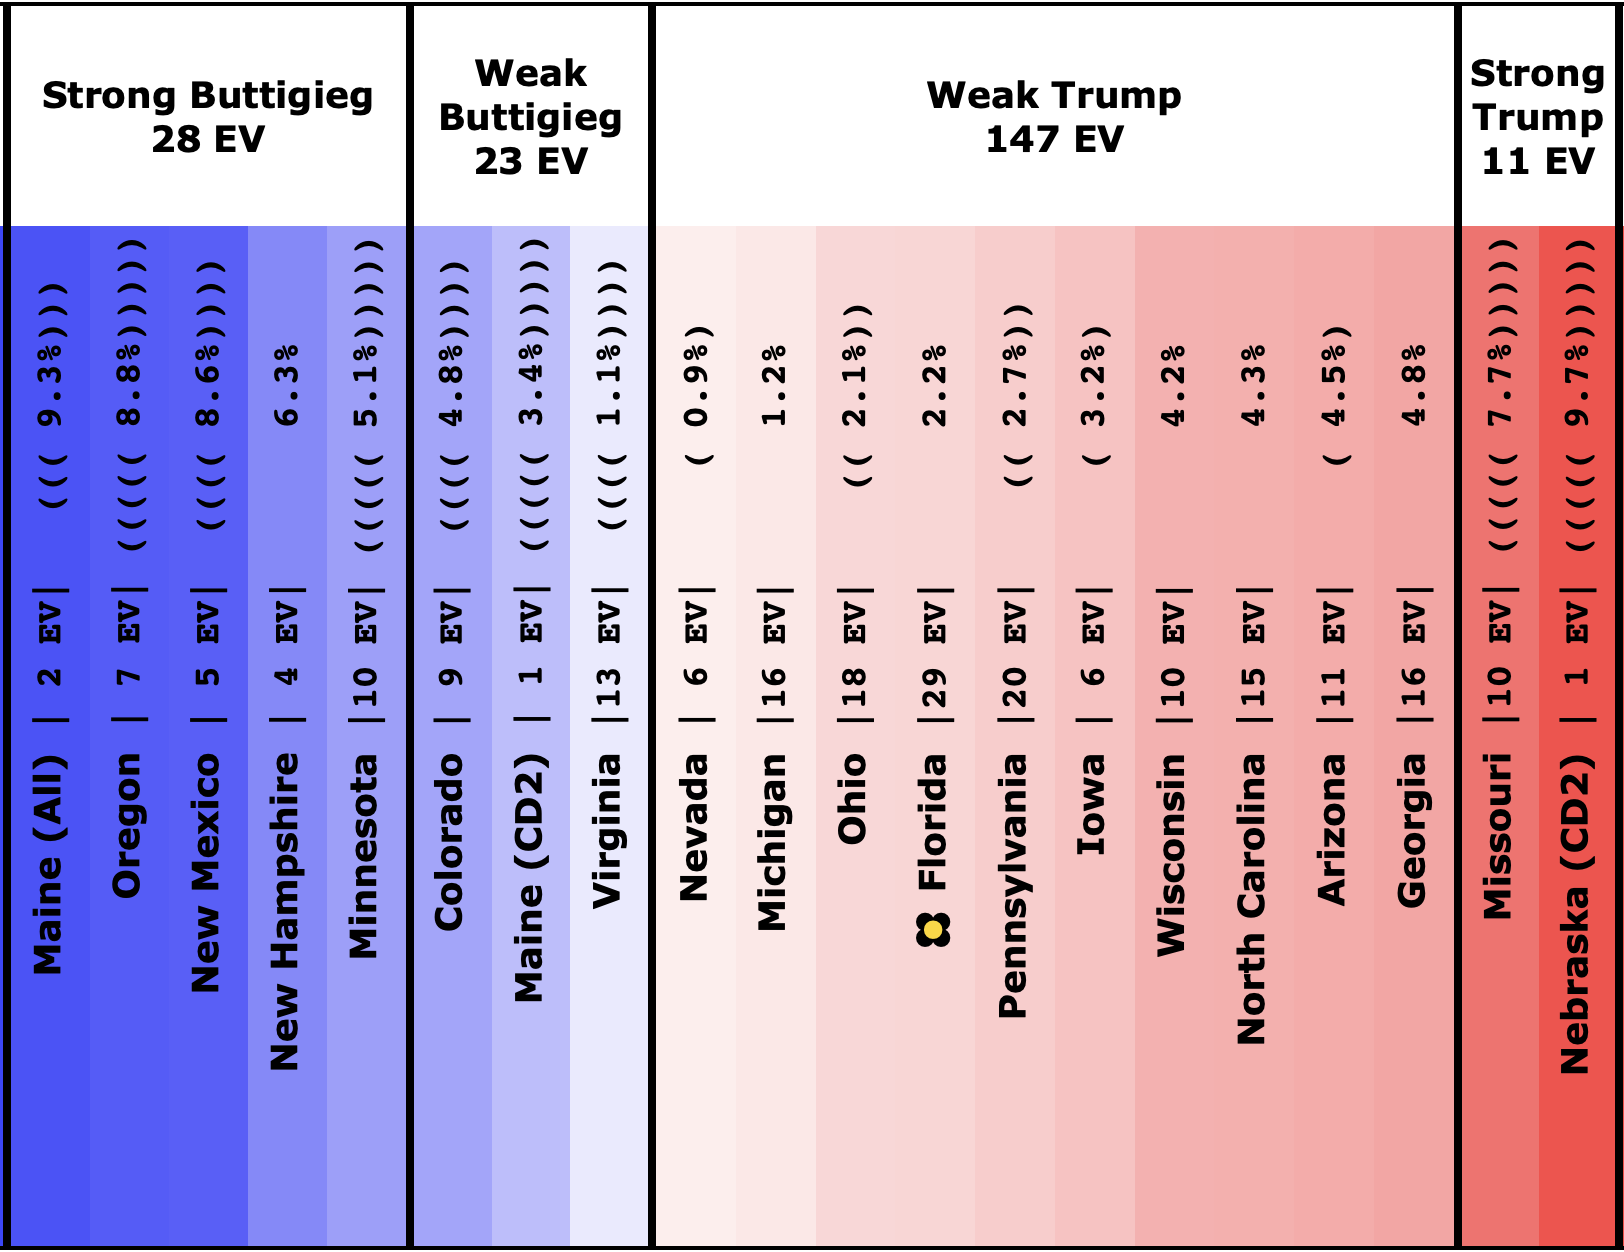
If the election was today, things would look very grim for Buttigieg. However, looking at the center part of the spectrum of states, you can see that to flip this back to a Buttigieg lead, you need to pull Nevada, Michigan, Ohio, and Flordia back across the line without losing any currently blue states. (There are other combinations of states that would do it too, but this would be the "easiest" group.)
This may seem like a lot, and that 11.4% chance of victory may seem small. But remember, that is "if the election was held today". It does not account for potential future movement.
Of the four states mentioned, Buttigieg is doing worst in Florida. But he is only losing Florida by 2.2% in the polling average. So an across the board margin gain of 2.2% would put him in the lead again. In 2016, this metric (the tipping point) moved more than 5% in a month on several different occasions.
So while the current state of play for Buttigieg does not look great, this far out from the election, for that matter even a month out from the election, a lot can still happen to change a picture like this.
But for the moment, at this very instant, a Buttigieg vs. Trump general election looks like a pretty easy Trump win. If Buttigieg became the nominee, he would have some work to do in order to change his odds.
OK, now let's look at our top four candidate combinations on our national metrics:
| Dem | 3 Feb | 11 Feb | 𝚫 |
| Biden | +178 | +178 | Flat |
| Sanders | +26 | +26 | Flat |
| Warren | -12 | -20 | -8 |
| Buttigieg | -84 | -84 | Flat |
In the "expected case" where everybody wins exactly the states where they lead the average, only Warren loses over these last 8 days, as New Hampshire slips from "Weak Warren" to "Weak Trump".
The tipping point doesn't move at all for any of these four between 3 Feb and 11 Feb, so we'll skip that one and move on to the probabilistic model.
| Dem | 3 Feb | 11 Feb | 𝚫 |
| Biden | +108 | +106 | -2 |
| Sanders | +36 | +34 | -2 |
| Warren | -6 | -8 | -2 |
| Buttigieg | -52 | -52 | Flat |
In the median Monte Carlo simulation of our probabilistic model, every Democrat except Buttigieg slips by two electoral votes. Slipping a bit, but not a lot. Certainly less change than we've seen in previous updates.
| Dem | 3 Feb | 11 Feb | 𝚫 |
| Biden | 98.5% | 98.4% | -0.1% |
| Sanders | 75.3% | 74.2% | -1.1% |
| Warren | 43.9% | 42.5% | -1.4% |
| Buttigieg | 11.4% | 11.4% | Flat |
Finally, in terms of chances of winning the electoral college, Buttigieg is flat, but the others all continue to fade a bit.
The Democratic weakening we have been seeing since September may be slowing, but it has not stopped.
And that is where we are on the eve of NewHampshire. As I write this, Dixville Notch, Hart's Landing, and Millsfield have already posted their results. In less than 17 hours, we'll start getting results from the rest of the state. The Democratic nomination race is in full swing.
266.6 days until polls start to close.
For more information:
This post is an update based on the data on the Election Graphs Electoral College 2020 page. Election Graphs tracks a poll-based estimate of the Electoral College. The charts, graphs, and maps in the post above are all as of the time of this post. Click through on any image to go to a page with the current interactive versions of that chart, along with additional details.
Follow @ElectionGraphs on Twitter or Election Graphs on Facebook to see announcements of updates. For those interested in individual poll updates, follow @ElecCollPolls on Twitter for all the polls as I add them. If you find the information in these posts informative or useful, please consider visiting the donation page.
One thought on “New Hampshire Eve”