
Since the last general election update on February 29th, there have been new state-level polls in Texas (x3), North Carolina (x3), Colorado, Florida, California (x2), Virginia, Georgia, Mississippi, Maine, Arizona, Utah, Michigan, Pennsylvania, and Wisconsin.
Although, as always, not all the polls individually go the same direction, in aggregate, this was a very good set of polling for the Democrats. Or to be more precise, the new results tended to be better for the Democrats than the older polls they displaced from the Election Graphs averages.
In this time frame, quite a few Democrats dropped out as well.
I would typically just go ahead and remove them from the charts and graphs I present here and leave us showing only Biden and Sanders. But some notable things happened in this last batch of polls for some of the others. So I will include them one last time.
In the next update, they will be gone.
But for now, here we go. This time lets start with the old fashioned chart of just how we would end up if every candidate won every state where they lead the Election Graphs averages:
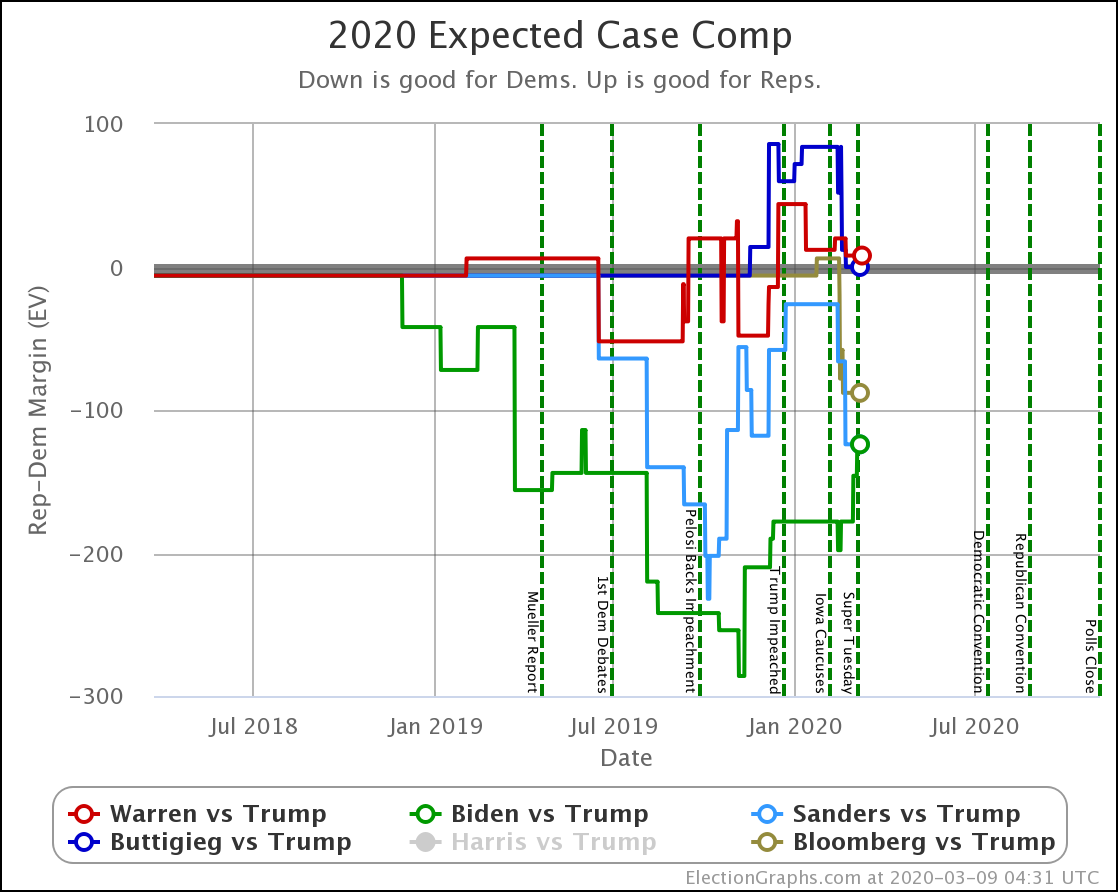
| Dem | 29 Feb | 9 Mar | 𝚫 |
| Biden | +178 | +124 | -54 |
| Sanders | +66 | +124 | +58 |
| Bloomberg | +58 | +88 | +30 |
| Buttigieg | -40 | TIE | +40 |
| Warren | -8 | -8 | Flat |
First of all, Biden moved from just barely winning Georgia (16 EV) and Arizona (11 EV) to losing them, while Sanders went from just barely losing Florida (29 EV) to winning it.
With these changes, Biden and Sanders end up winning the same states and end up with the same 124 electoral vote margin over Trump.
Either way, the Democrat gets 331 electoral votes, and Trump gets 207.
Now, their margins in the close states are different, which will impact all of the other metrics we track here at Election Graphs, including the odds of winning. Every other metric still shows Biden in a stronger position than Sanders.
Nevertheless, it is striking that in terms of who leads states, you have the two leading Democrats with identical maps. At least for the moment.
Now, I could have left out the other candidates and still noted the above.
But there was also a comeback for Buttigieg in the weeks before he dropped out of the race.
On February 21st, the "Expected Case" showed Buttigieg losing by 84 electoral votes.
On February 22nd, the average for Nevada (6 EV) flipped, and he was only down by 72 electoral votes.
On February 23rd, the average for Michigan (16 EV) flipped and he was only down by 40 electoral votes.
On March 7th, the average for Pennsylvania (20 EV) flipped and he was now TIED with Trump in the Electoral College.
That's right, an exact 269 to 269 tie in the Electoral College.
If that were to happen, the election would go to the House, voting by state delegations, and Trump would almost certainly win.
But still, that was a big movement in this metric in a short time, resulting in the all so exciting and rarely seen tie scenario.
This showed him performing better than Warren against Trump as well.
But Buttigieg and Warren are both out now, so that doesn't matter anymore. Bloomberg's improvement doesn't either.
Now the tipping point metric:
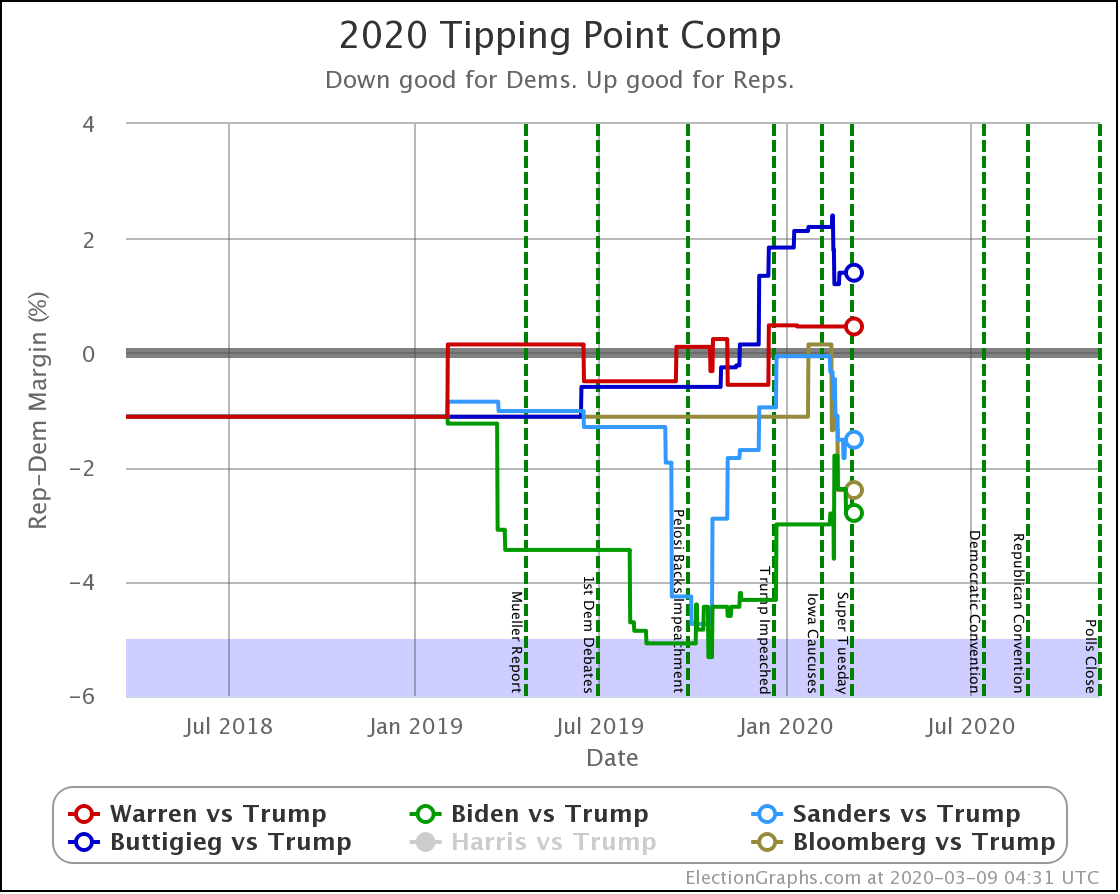
| Dem | 29 Feb | 9 Mar | 𝚫 |
| Biden | +2.6% | +2.8% | +0.2% |
| Bloomberg | +0.7% | +2.4% | +1.7% |
| Sanders | +0.8% | +1.5% | +0.7% |
| Warren | -0.5% | -0.5% | Flat |
| Buttigieg | -2.1% | -1.4% | +0.7% |
The tipping point is how much polls have to move uniformly to flip the outcome. In other words, you can look at it as a measure of how easy it would be to change the outcome.
By this measure, every Democrat except Warren improved.
Despite being at a tie, to actually WIN Buttigieg would still need polls to move another 1.4%.
But as I have pointed out before, the main thing to note with the tipping point is that all of these numbers are small. The largest is Biden at 2.8%, and that is TINY. Polls can move 3% or even 5% in a week or two easily. They can also have systematic errors that cause them off by that much.
The shift from Buttigieg losing by substantial margins to rally back to a tie in a matter of weeks is a perfect example of this, and another reason to note these other candidates one last time.
The structure of the Electoral College means small changes in the polls can result in a massive change to the Electoral College margin.
The small tipping point is the warning flag that whatever the Electoral College margins look like, either in the simplistic categorization model or in the probabilistic model we'll look at shortly, that it is still a close race, and things could change very very quickly.
Now the median margins in the probabilistic simulation:
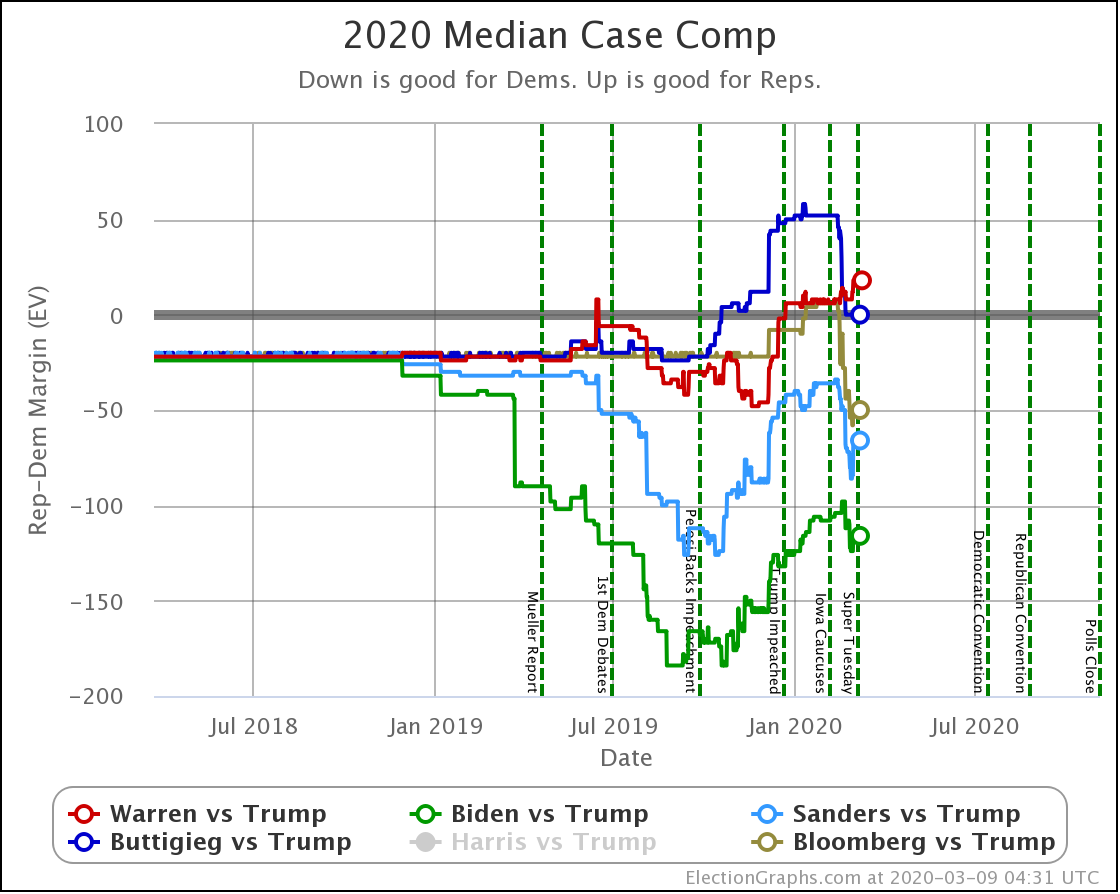
| Dem | 29 Feb | 9 Mar | 𝚫 |
| Biden | +100 | +116 | +16 |
| Sanders | +50 | +66 | +16 |
| Bloomberg | +8 | +50 | +42 |
| Buttigieg | -40 | TIE | +40 |
| Warren | -10 | -18 | -8 |
In this view, all of the Democrats except Warren improve. In addition to the Buttigieg surge, there was a Bloomberg surge here too. But both Biden and Sanders improve nicely as well.
Notably, since the median case and the earlier expected case usually don't match, Buttigieg still ends up in a tie in this view too.
I guess that is a fine way for him to close things out.
Finally, let's look at the odds:
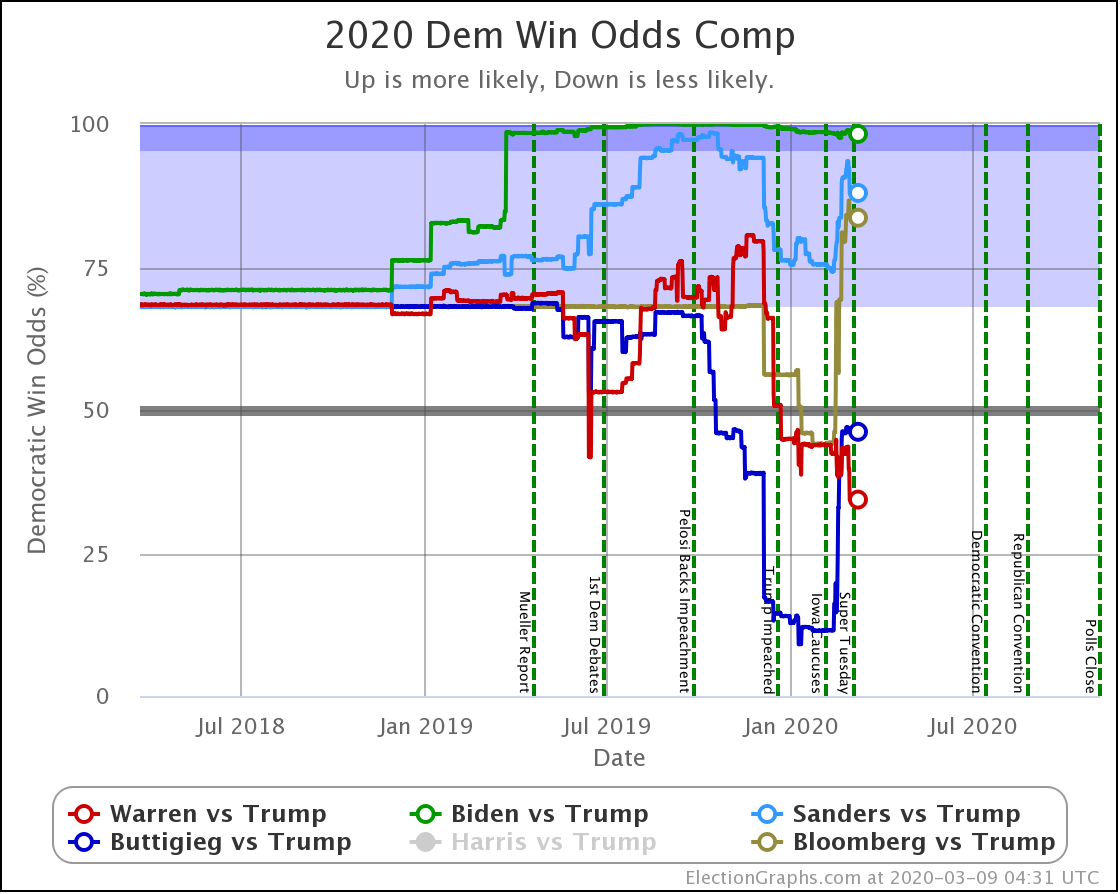
| Dem | 29 Feb | 9 Mar | 𝚫 |
| Biden | 97.7% | 98.3% | +0.6% |
| Sanders | 82.0% | 87.9% | +5.9% |
| Bloomberg | 54.1% | 83.6% | +29.5% |
| Buttigieg | 15.9% | 46.2% | +30.3% |
| Warren | 40.9% | 34.4% | -6.6% |
Again, both Buttigieg and Bloomberg made huge gains.
Sanders and Biden gained too, but the higher up you are, the harder it is to make further gains.
And Warren slipped a bit further, ending out her run at only about a one-in-three shot at beating Trump.
That would have required winning the nomination though.
But Bloomberg, Buttigieg, and Warren have all dropped out of the presidential race.
So now there are two.
239.7 days until polls start to close.
For more information:
This post is an update based on the data on the Election Graphs Electoral College 2020 page. Election Graphs tracks a poll-based estimate of the Electoral College. The charts, graphs, and maps in the post above are all as of the time of this post. Click through on any image for current interactive versions of the chart, along with additional details.
Follow @ElectionGraphs on Twitter or Election Graphs on Facebook to see announcements of updates. For those interested in individual poll updates, follow @ElecCollPolls on Twitter for all the polls as I add them. If you find the information in these posts informative or useful, please consider visiting the donation page.
One thought on “The Field Is Winnowed”