
Since the last update, there have been polls in Texas and Arizona.
Only Arizona resulted in a blog-worthy change.
Namely, the Biden vs. Trump matchup moved from "Strong Trump" to "Weak Trump."
The two polls we have so far on this matchup in Arizona have Biden doing significantly better than Democrats have fared here in recent Presidential elections. The latest one shows Biden ahead.
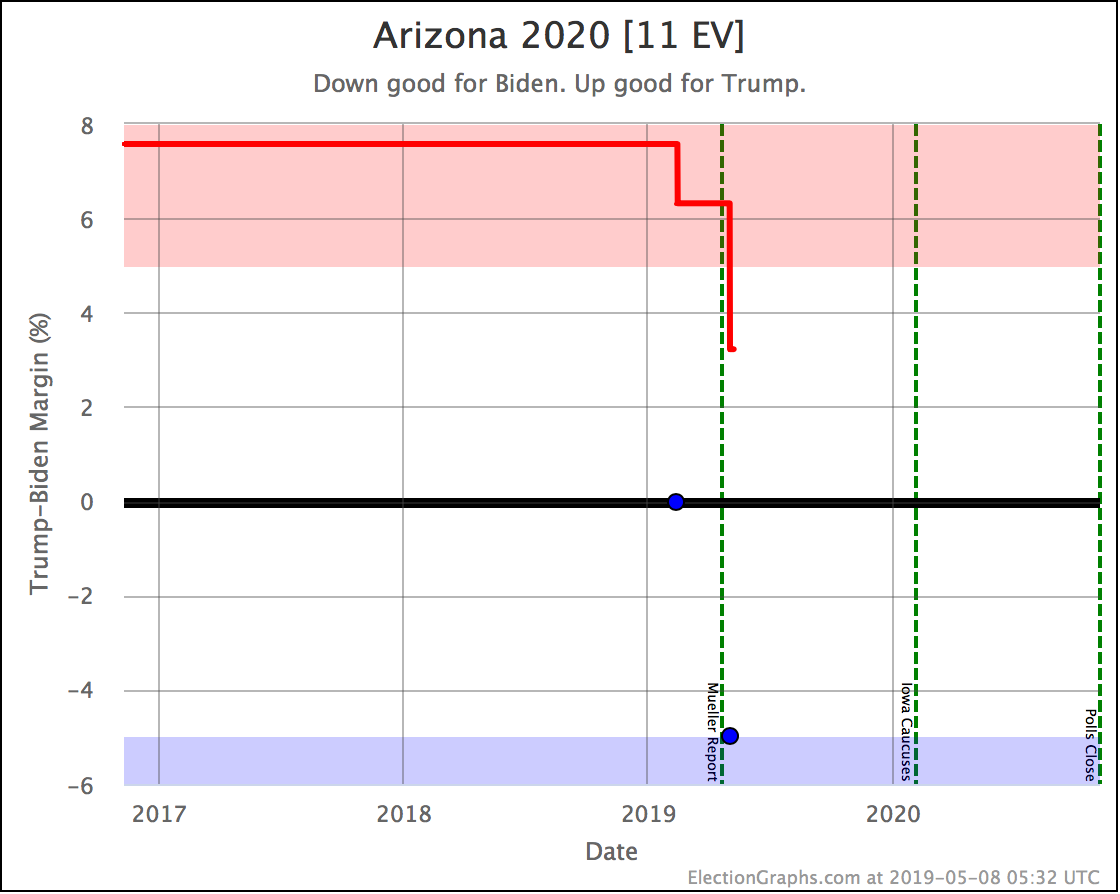
Given these results, the average is moving in the Democratic direction, but given Arizona's history, it would take more polls to pull the race into blue territory. For now, Biden will have to settle for the state being in reach as Trump's lead drops under 5% to 3.2% which improves Biden's "best case" on our bubble:
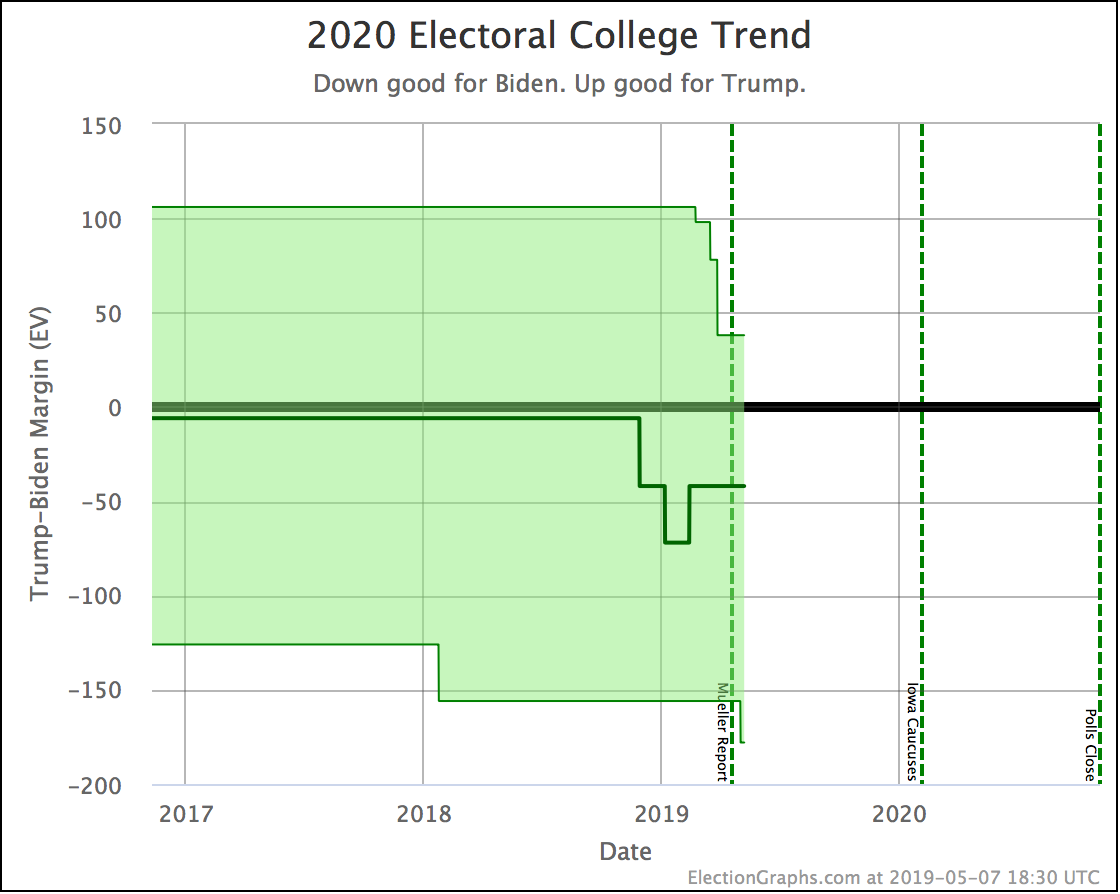
The case where Biden wins all the close states, now including Arizona, is the downward bump in the bottom right of the "envelope of possibilities" shown above.
Now, Democrats shouldn't be too excited about Arizona yet.
This week Election Graphs has added "win probabilities" based on the data shown in the "Polling Error vs. Final Margin" post back in January. Basically, given the history of how Election Graphs poll averages have matched up against actual election results in the 2008 to 2016 elections, I produce an estimate for the chances of each outcome given the margin. You can now see this on any of the state detail pages and state comparison pages.
At the "Republican leads by 3.2%" level this gives an estimate that Trump has an 87.7% chance of winning Arizona, leaving Biden with only a 12.3% chance. Now, this is non-trivial. But Trump still has a pretty substantial advantage, until or unless more polls come out confirming a Biden lead.
A few caveats since this is the first time I'm referencing this type of calculation:
- These "win chances" are based on the past performance of Election Graphs averages, and past performance may or may not be a good indicator of future results.
- The model represents "if the election was today." It does not take into account the probabilities of the polls moving one way or another in the time between now and the election.
- Since there are only two polls of this matchup in this state so far, only 2/5 of the data points included in the average are even real polls as opposed to results from previous elections.
- It is still a long, long time until the election. Things will change.
But still, this is a fun new number to look at, and I'll be referring to the "win odds" more often as new results come in. There will also be new visualizations of this metric coming soon. And while so far I've only added this information on the state detail and comparison pages, the intention is, of course, to use this as the basis for a Monte Carlo simulation of the national race in the way I mentioned in the January "Predicting 2016 by Cheating" post.
Stay tuned.
In the meantime, back to Arizona for a bit.
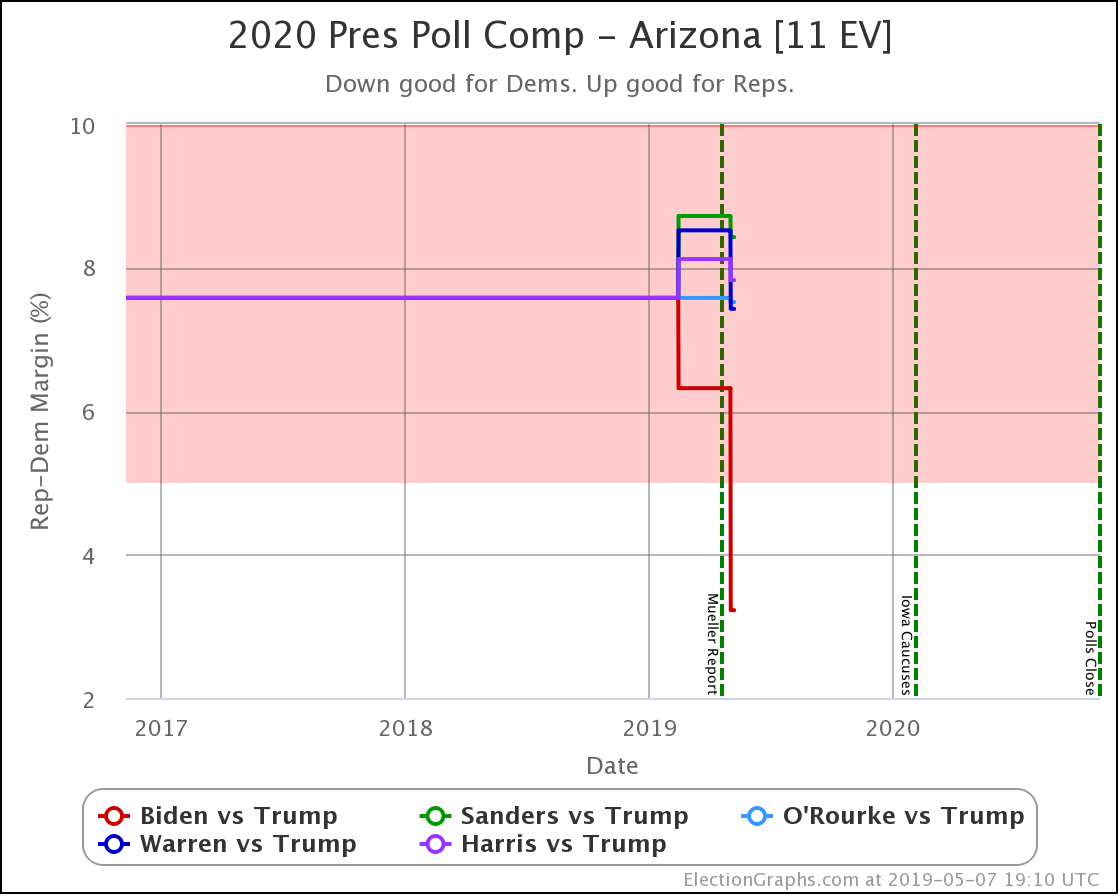
As has been the pattern in poll after poll, Biden is doing better against Trump than the other Democrats. You can see above that so far Biden vs. Trump is the only one of the five best-polled candidate combinations where the Democrat is polling dramatically different than the historical election result average in Arizona.
Biden looks like he makes Arizona competitive.
The others, not so much.
Finally, just a quick look at Texas as well:
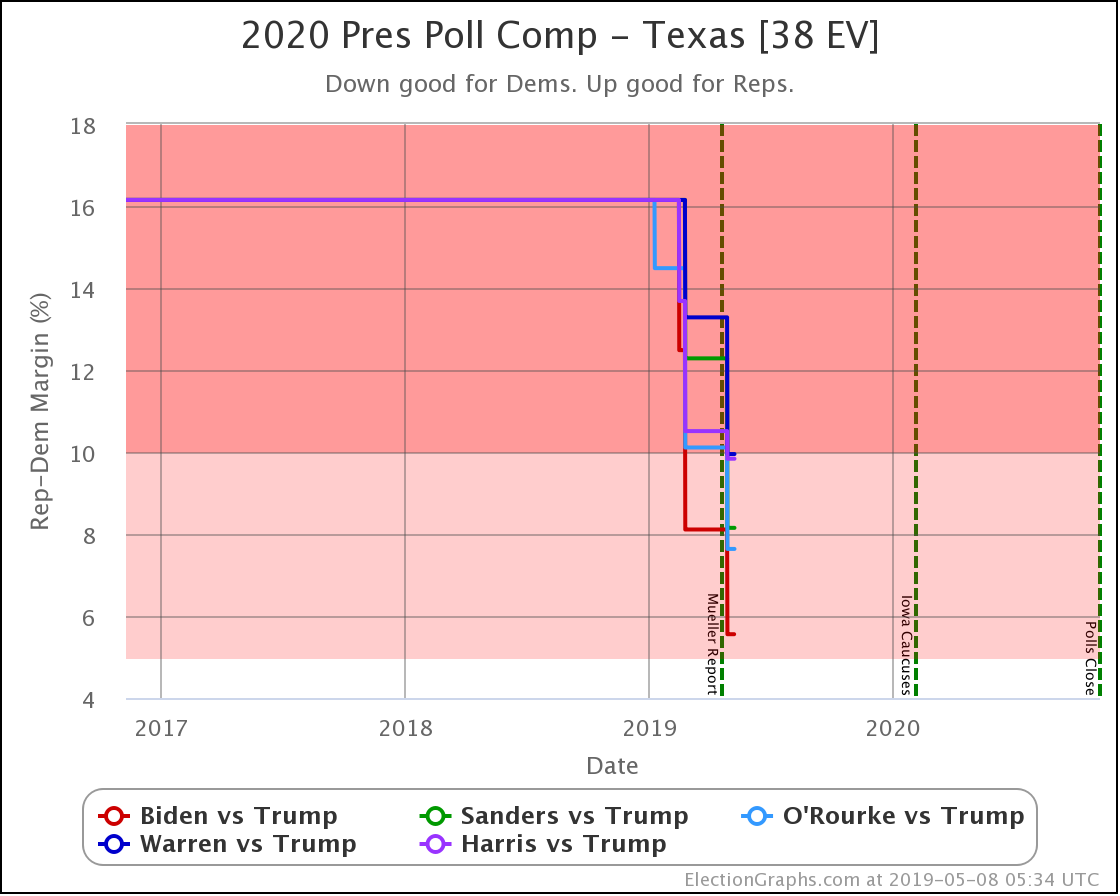
Unlike Arizona, in the case of Texas, ALL FIVE Democrats are doing significantly better against Trump than the historical election average. But that average was much more Republican to start with, so even with the polling averages moving in a Democratic direction, none of the five Democrats put Texas into swing state territory yet.
Biden, as usual, is doing best. Trump only leads Biden by 5.6%.
Using the new probabilities feature on Election Graphs, this translates into a 2.1% chance of Biden taking Texas.
545.7 days until polls start to close.
For more information:
This post is an update based on the data on the Election Graphs Electoral College 2020 page. Election Graphs tracks a poll-based estimate of the Electoral College. The charts, graphs, and maps in the post above are all as of the time of this post. Click through on any image to go to a page with the current interactive versions of that chart, along with additional details.
Follow @ElectionGraphs on Twitter or Election Graphs on Facebook to see announcements of updates. For those interested in individual poll updates, follow @ElecCollPolls on Twitter for all the polls as I add them. If you find the information in these posts informative or useful, please consider visiting the donation page.
One thought on “Biden makes Arizona close”