
Since the last update, there have been poll updates in Florida, Iowa, Texas, Wisconsin, Michigan, and Pennsylvania. These new polls were all part of a single release from WPA Intelligence, and they ONLY polled the Biden vs. Trump matchup.
There are several caveats about this polling. For more on that, I'll point you to a great thread on Twitter by Charles Franklin, Director of the Marquette Law School Poll where he goes into the details.
Election Graphs tries to include everything though, without any fancy weighting, so a poll like this can make some waves. So let's look at what Election Graphs status changes came out of this polling.
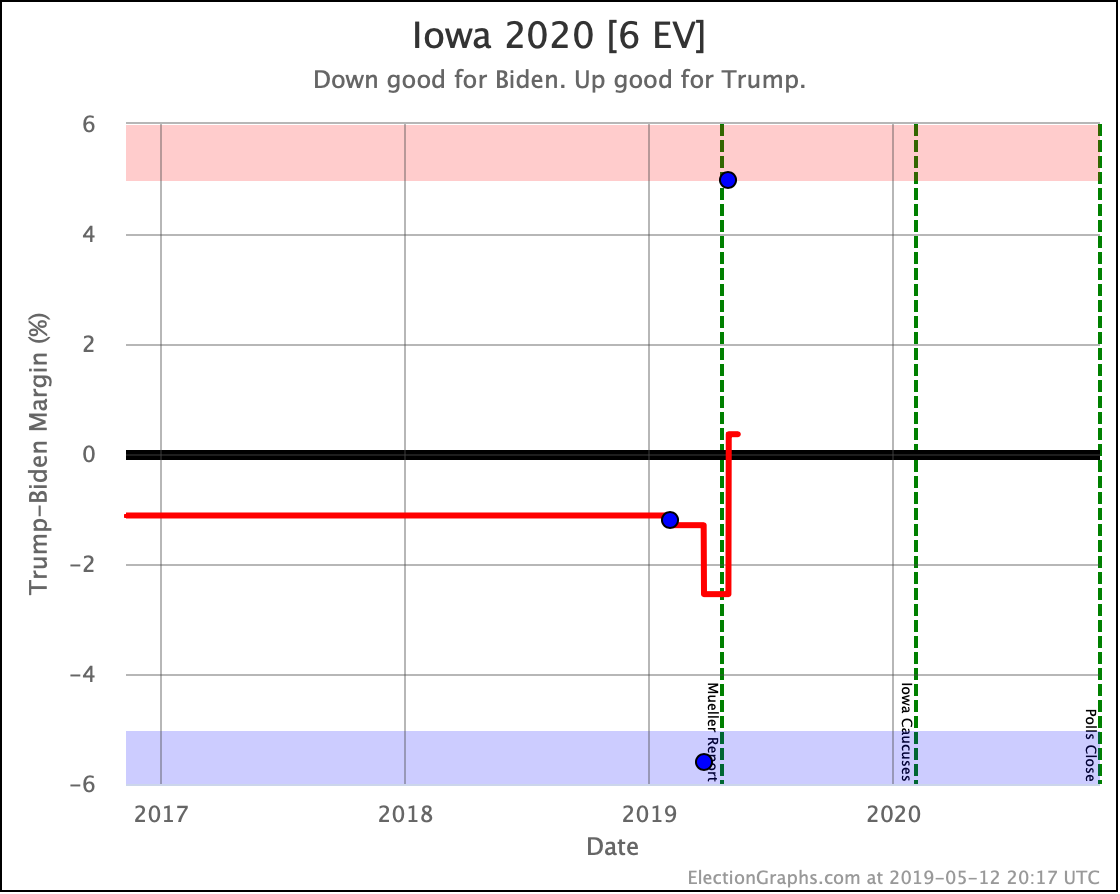
Due to Iowa:
- IA has moved from Weak Biden to Weak Trump
- Biden vs. Trump tipping point change: Biden by 1.2% in CO -> Biden by 0.3% in OH
- Biden vs. Trump expected case changed: Biden 290 to Trump 248 -> Biden 284 to Trump 254
Due to Texas:
- TX has moved from Strong Trump to Weak Trump
- Biden best case vs. Trump has changed: Biden 358 to Trump 180 -> Biden 396 to Trump 142
Due to Pennsylvania:
- PA has moved from Strong Biden to Weak Biden
- Trump best case vs. Biden has changed: Biden 250 to Trump 288 -> Biden 230 to Trump 308
We'll look at the national charts first, then dig into the state charts.
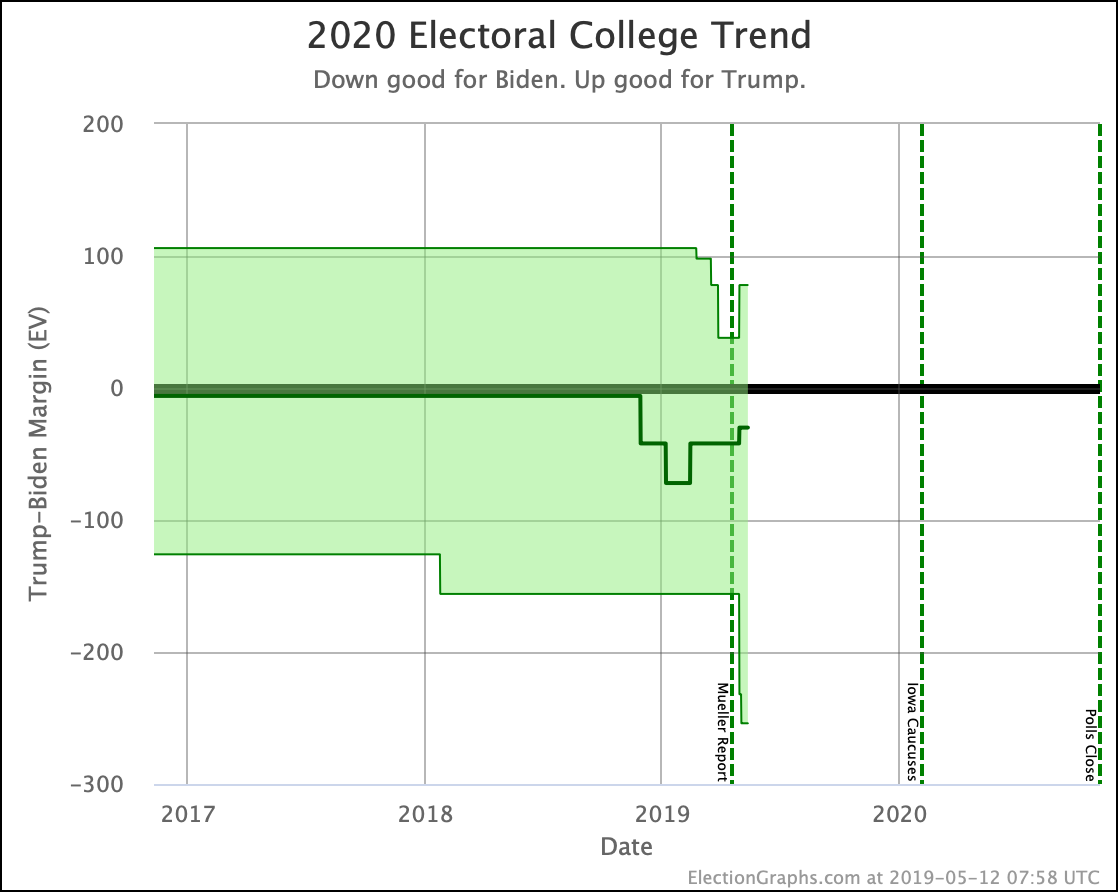
The most significant impact on the "envelope" is that it has widened significantly. Texas and Pennsylvania are now "in play," and just a few days ago Arizona started looking close too.
The difference between the case where all the close states go to Trump (a 78 electoral vote margin in Trump's favor, coming close to replicating Trump's 2016 margin), and the case where all the close states go to Biden (a 254 electoral vote margin in Biden's favor), is now huge.
There are lots of electoral votes in swing states, so there is a wide range of reasonable possibilities here.
At the same time, the middle line, showing where we are if both candidates win precisely the set of states where they are ahead in the poll average, gets closer. Biden still leads, but by only 30 electoral votes.
At the moment, this looks to be a very close race.
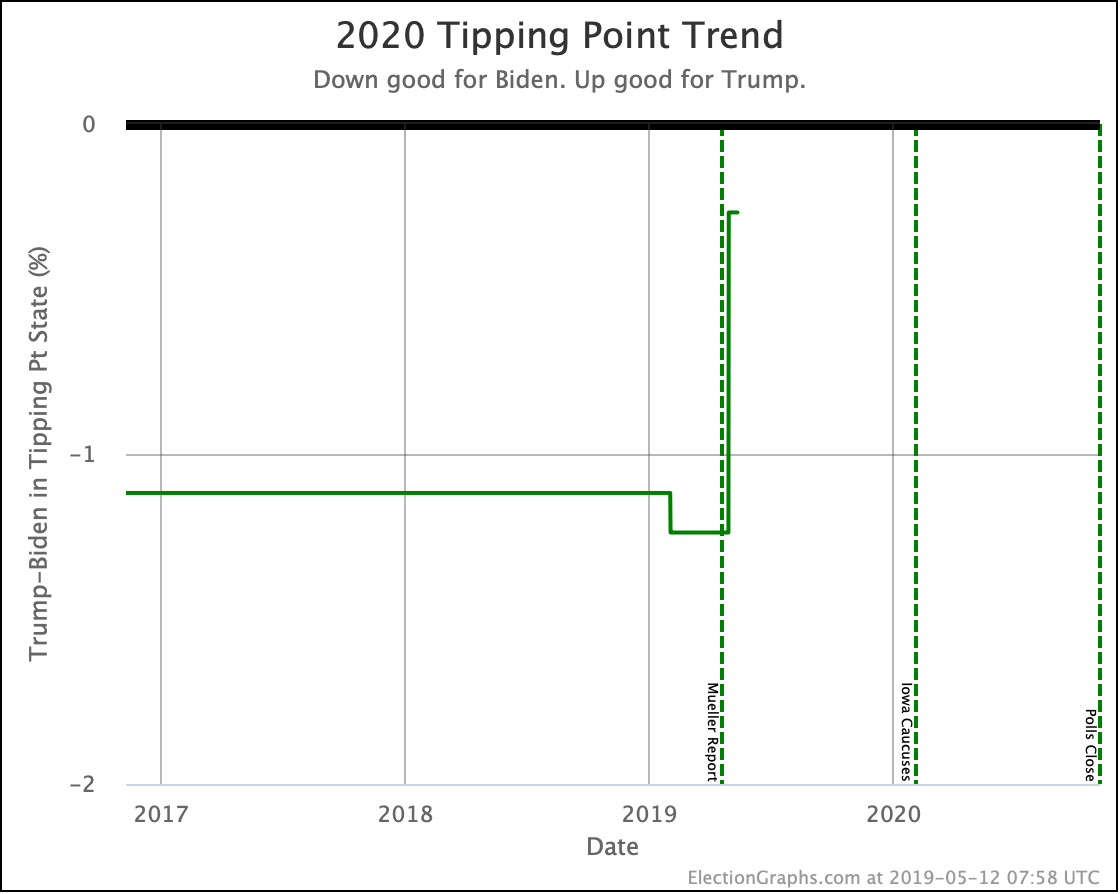
The tipping point chart shows this as well. The tipping point is the margin in the state that puts the winning candidate over the top. That is now Ohio, where Biden leads Trump by 0.3% in the current polling average.
As a comparison, on election eve in 2016, Clinton led Trump by 1.6% in the tipping point metric. And she lost.
Adding to that, given the historical performance of Election Graphs poll averages, an 0.3% Democratic lead ends up being only about a 48.8% chance of the Democrat winning. Given how actual election results have gone vs. the Election Graphs poll averages, the Republican is more likely to succeed when the Democrat leads by this narrow a margin!
Now, I don't have simulations in place yet for the full general election to produce odds there (maybe that will happen sometime in June if I get enough free time to do that), but with the tipping point this close to zero, and the envelope being so broad, things are clearly too close to call.
Now, let's look at some of the individual states, first with Biden vs. Trump only, then we'll compare to some of the other candidates.
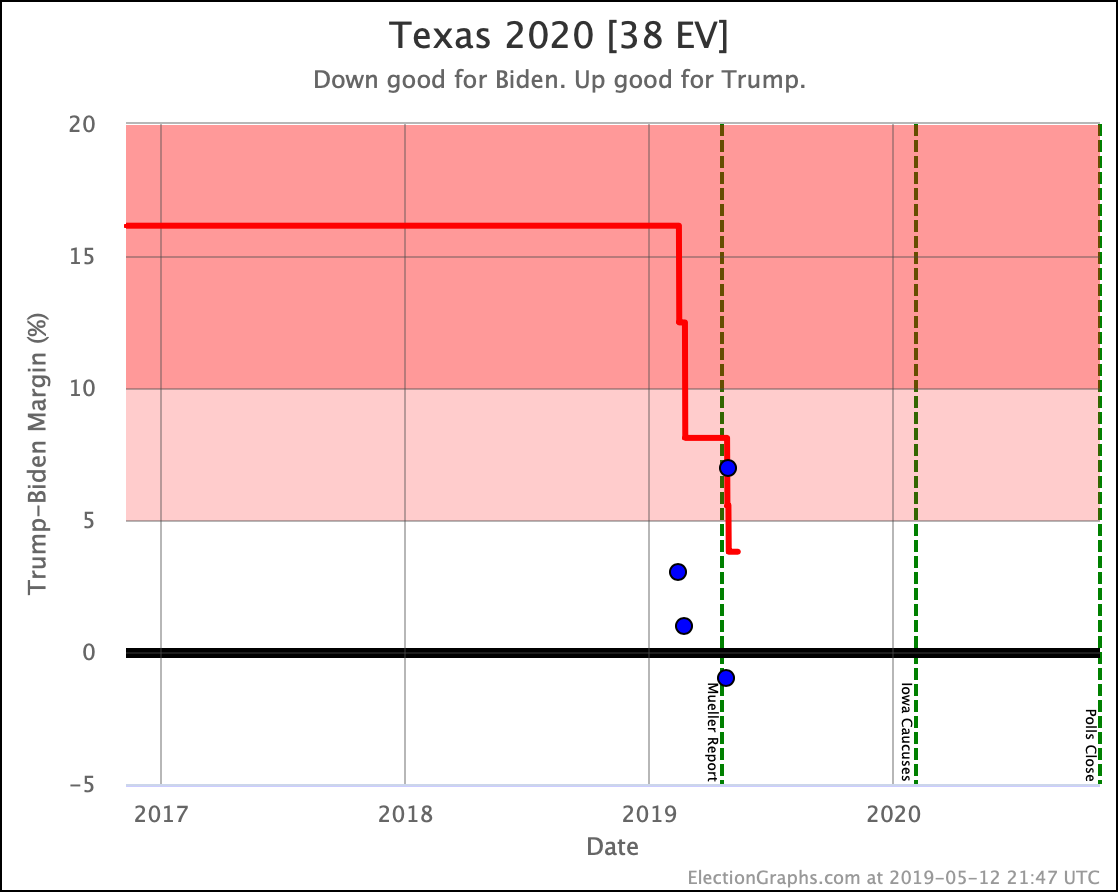
In Texas, the new poll, showing Trump leading Biden by 7%, is the most favorable of the four surveys done in Texas so far, but along with the others, it confirms a race much closer than the historical average of a 16.1% Republican win from the 2000-2016 elections.
This change was enough to tip the state into "Weak Trump" territory. With a 3.8% lead in the average though, this still translates into a 91.4% chance of a Trump win.
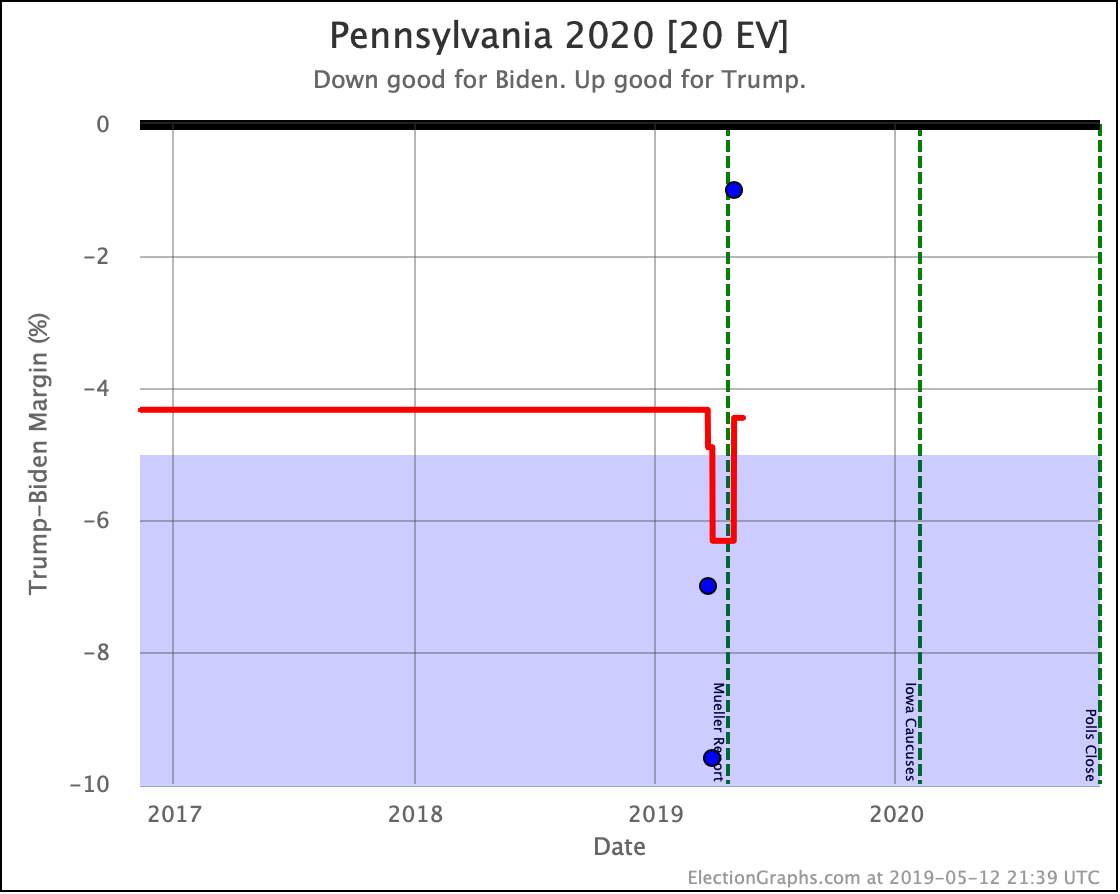
In Pennsylvania, this is only the third Biden vs. Trump poll. This poll shows the closest race yet and brings the average for the state back near the historical average election performance. Which of course means it is back in "Weak Biden" territory after a brief foray in the "Strong Biden" zone. Given the historical accuracy, this 4.5% Biden lead becomes an 88.6% chance of a Biden win.
Once again the best poll result for Trump out of three, and once again a large range in recent polls. This time the average gets pulled from just barely Biden, to just barely Trump.
Before we start comparing to other candidates, one more state to highlight:
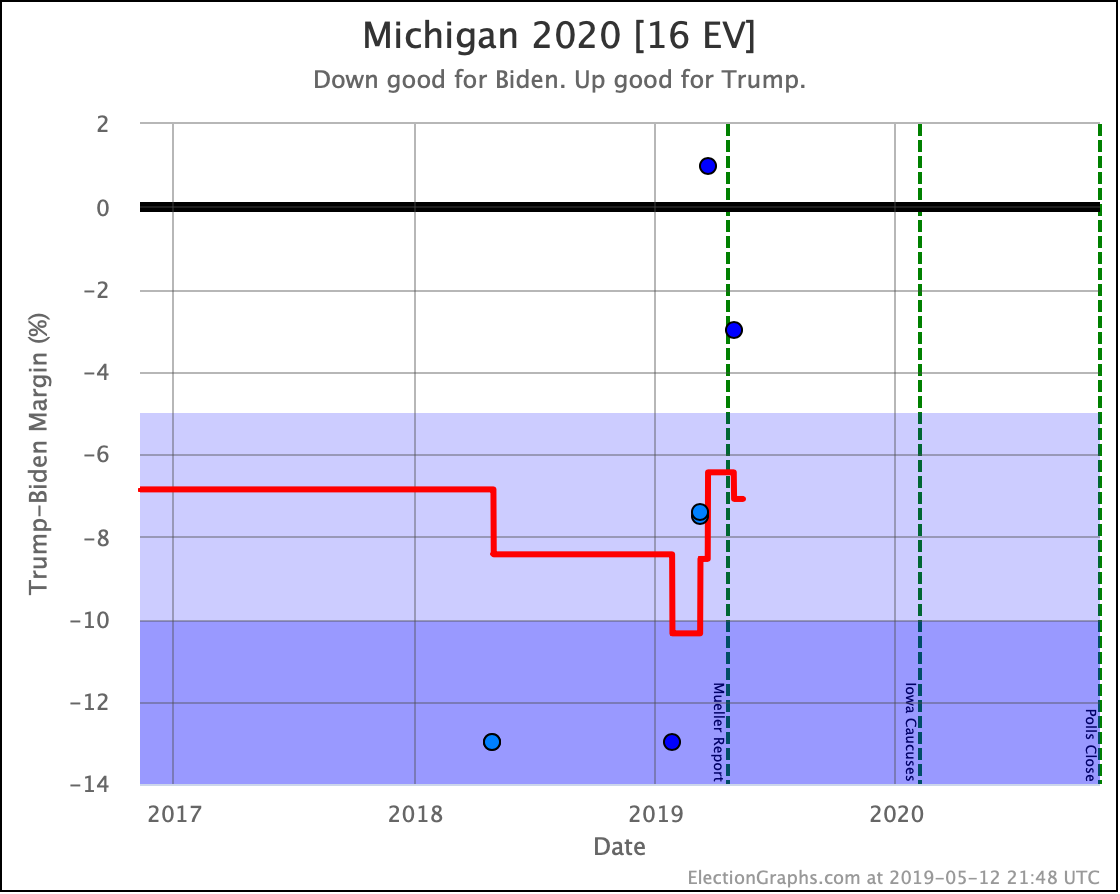
Biden vs. Trump in Michigan now has FIVE polls. This matchup/state combo is the first to have a full five data points, meaning the polling average is based only on actual polls and is not being "filled out" using previous election results.
Presumably, this will be happening more and more often now, but this is the first.
Now, this set of polls ONLY looked at Biden vs. Trump, but it moved how Biden was doing relative to the other Democratic contenders in terms of how they fare against Trump.
Before this set of polls, there had been Biden vs. Trump polling in 12 states: MA, MI, NH, WI, NV, PA, OH, IA, NC, AZ, TX, SC.
Of those states, Biden did better against Trump than the rest of the "best polled" candidates in all except New Hampshire and Michigan.
So he was better than the other Democrats in 83.3% of the states where there was polling.
Let's see where he is after these six polls:
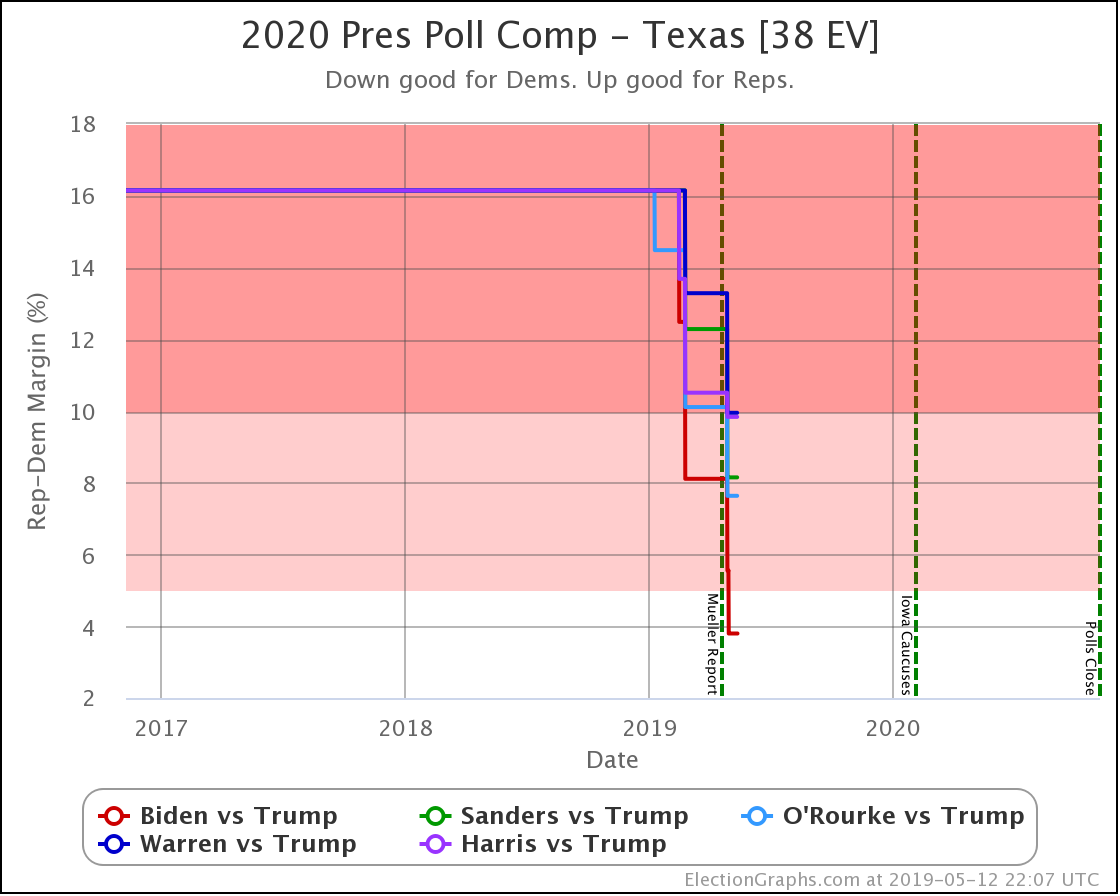
In Texas, Biden continues to do better than the other Democrats. So still 10/12.
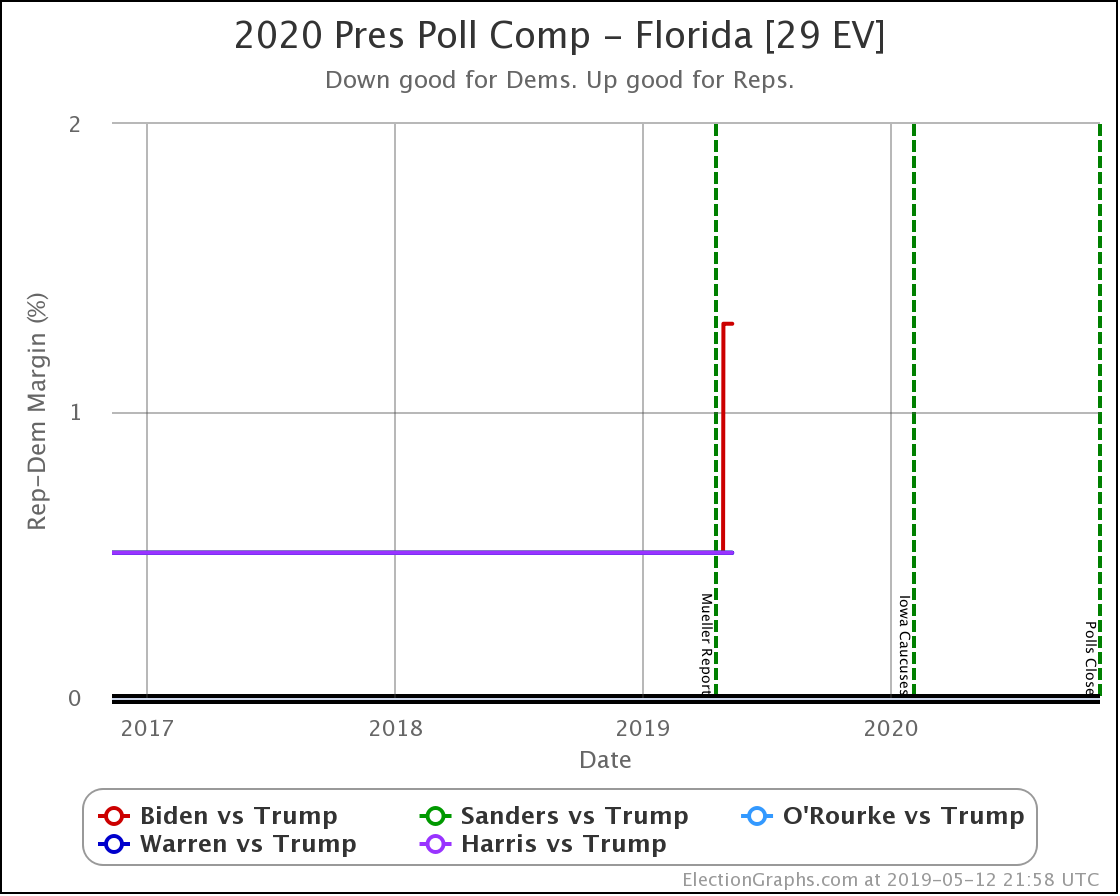
This survey is the very first poll in Florida, so the other candidates still show up as the average of the last five elections. But the new data point makes Florida a bit redder, so Biden is not doing better than the others here now. So 10/13 now.
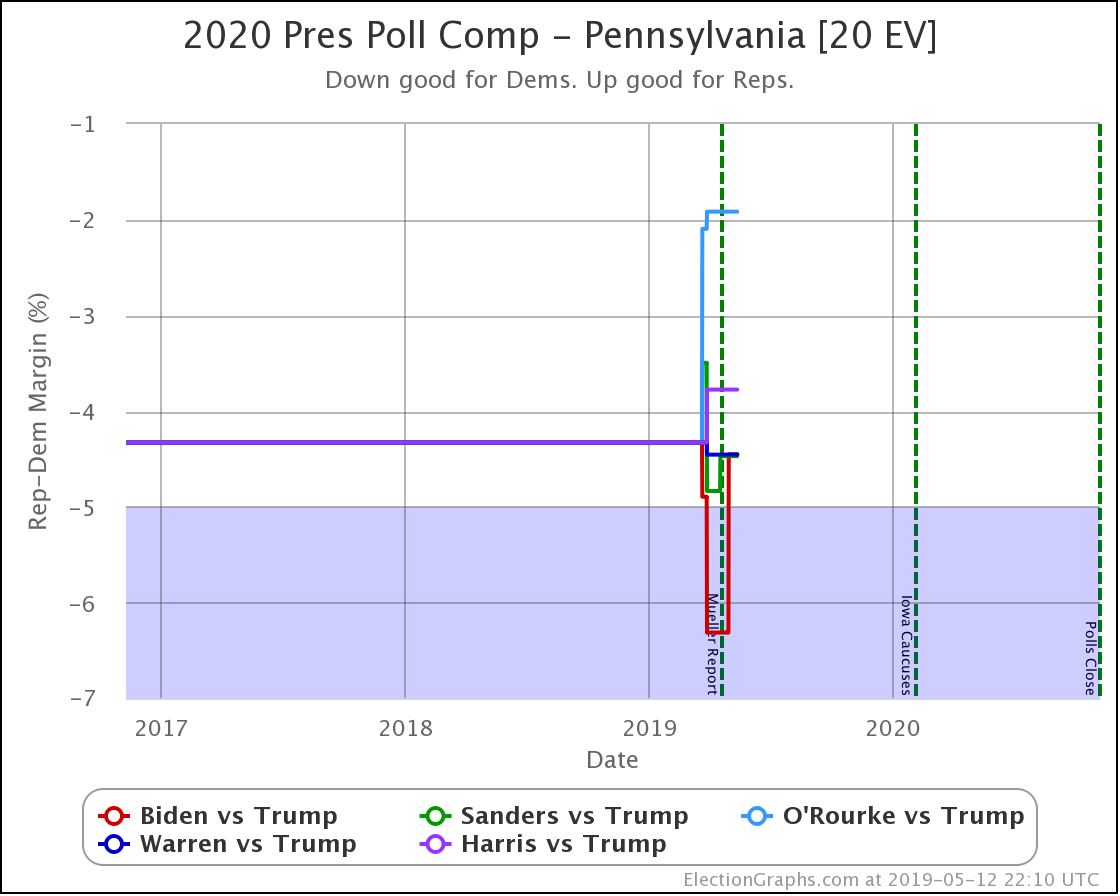
In Pennsylvania, Biden had been doing better than the rest, but now he ties with Sanders and Warren. So now 9/13.
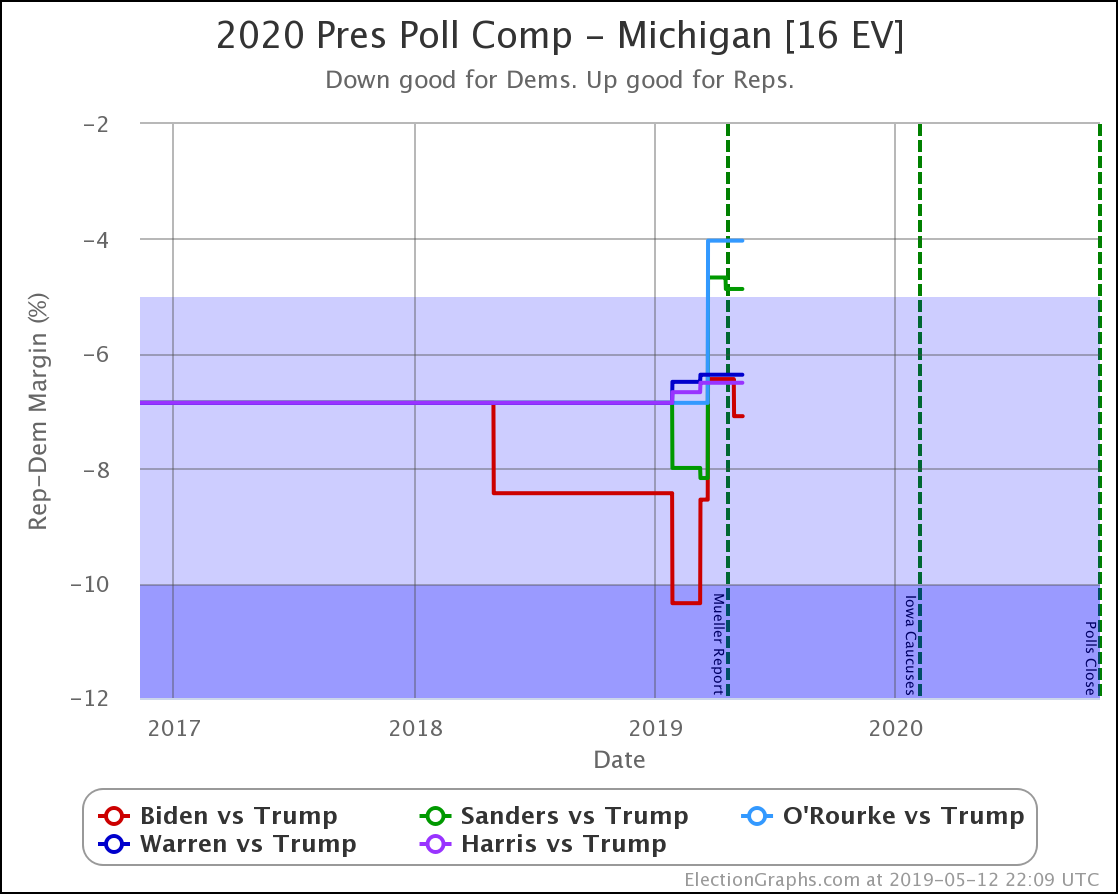
Michigan WAS one of the two states where Biden wasn't doing better than the other Democrats. Now he is. So 10/13.
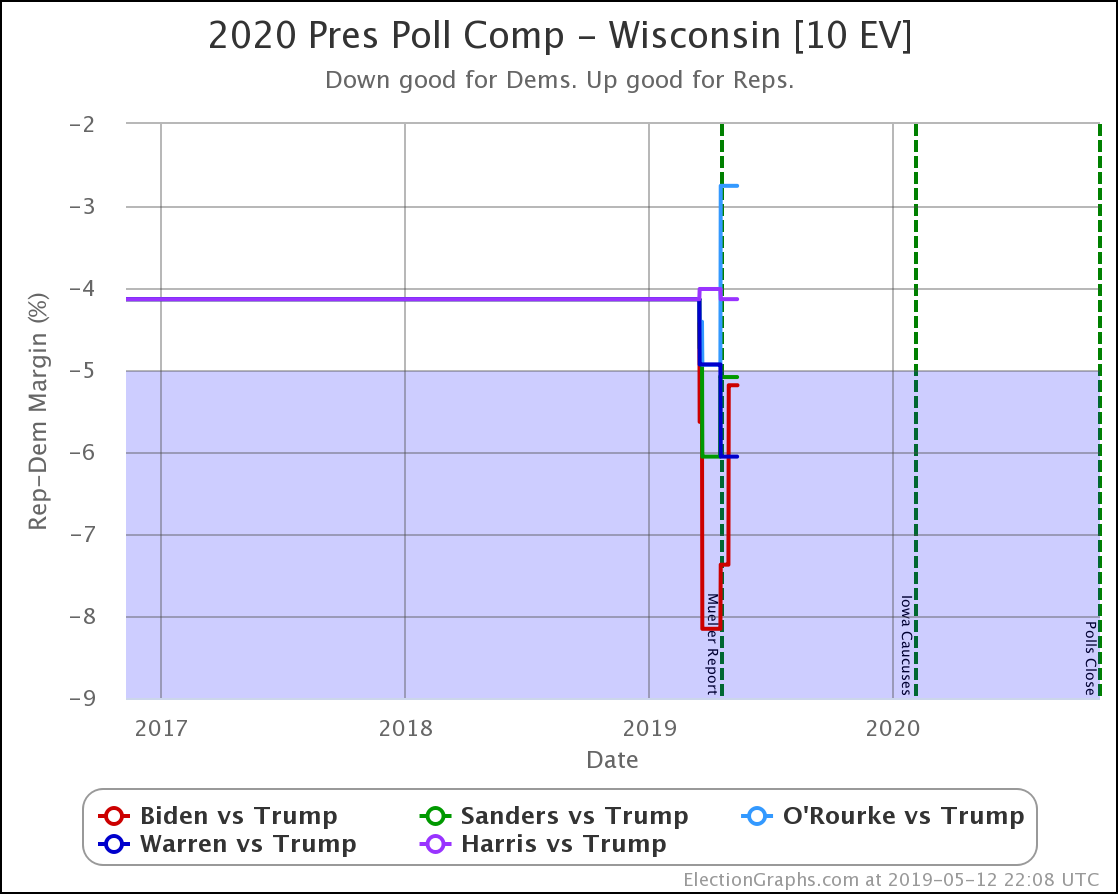
Biden had been doing best in Wisconsin. Now Warren does better. 9/13.
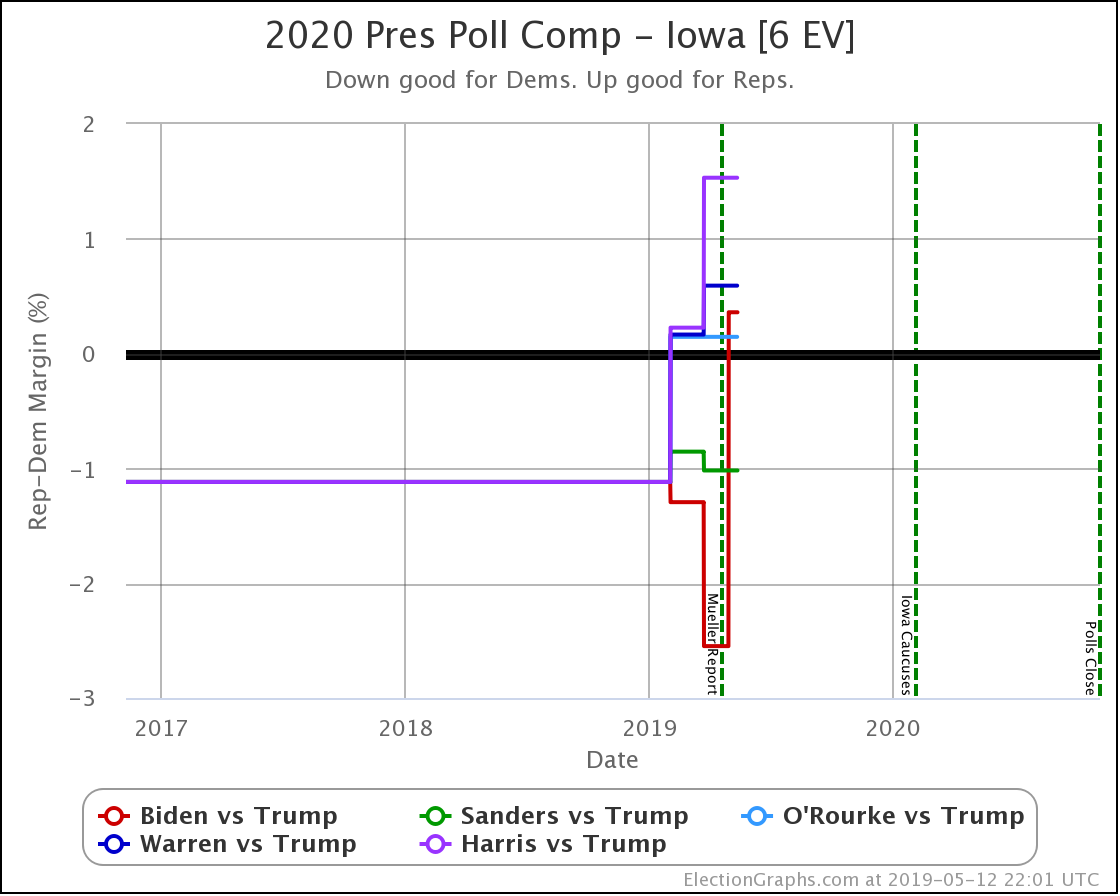
Biden had been doing best in Iowa, now both Sanders and O'Rourke do better. So we are now at 8/13.
8/13 = 61.5%. So of the individual states where there has been polling, what HAD been a very consistent story of Biden doing better than everyone else against Trump has slipped considerably.
A quick look nationally:
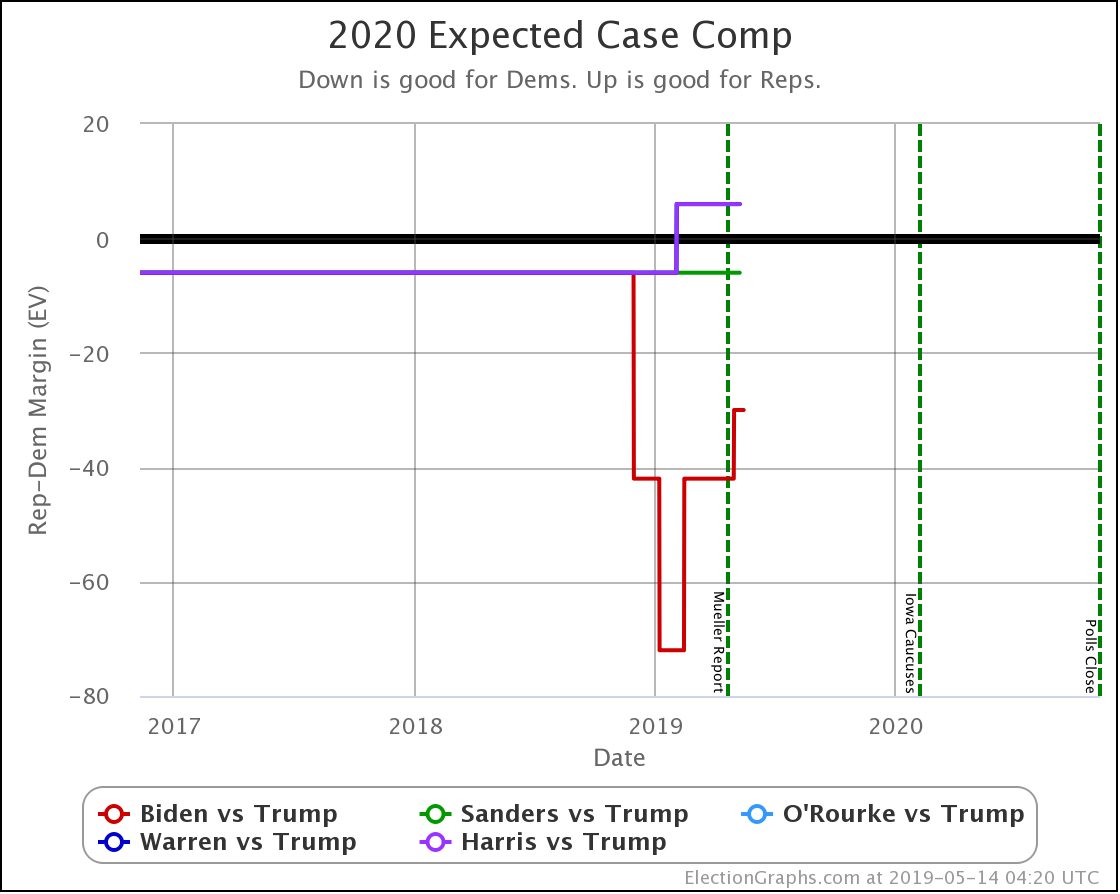
The "expected case" where each candidate gets the states where they lead in the Election Graphs average, no more, no less, still has Biden winning by a 30 electoral vote margin, while Sanders only wins by 6 electoral votes, and O'Rourke, Warren, and Harris all LOSE to Trump by 6 electoral votes. So Biden is still slightly ahead here.
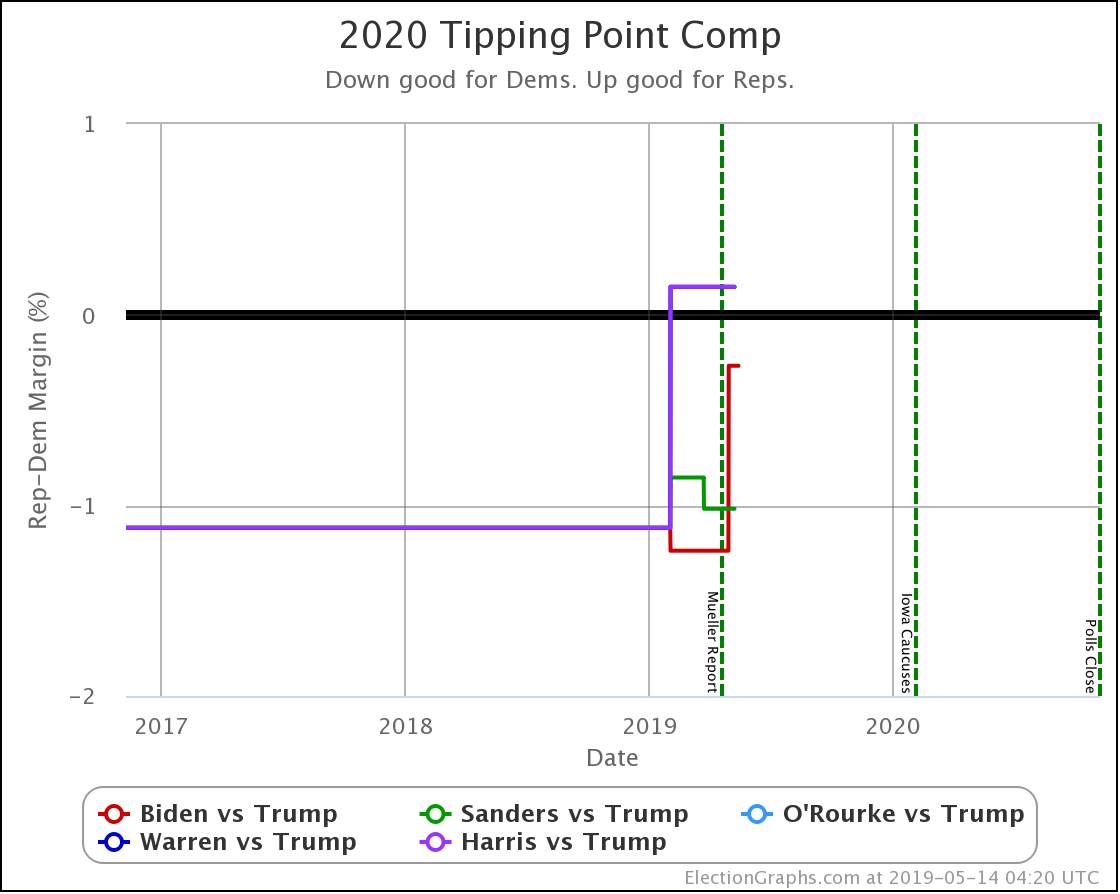
In the tipping point though, Biden now leads by 0.3%, which is better than O'Rourke, Warren, and Harris, who all lose by 0.1%. But Sanders leads by 1.0%.
So by this metric Sanders is doing better in the national race than Biden against Trump.
So what does this mean? Biden being ahead on the electoral vote margin, but behind on tipping point, essentially means that while his expected winning margin might be more, that lead is much more precarious.
Of course, as I said before, Clinton had a 1.6% tipping point lead and lost. So with all of these tipping points, the bottom line is that this still looks like a very very close race.
No matter which Democrat you pit against Trump, it looks like a dead heat.
And there is no longer a convincing case that any one of those Democrats is doing distinctly better than the others against Trump.
Can I put this in terms of percent chances of winning for each of the Democrats when matched against Trump? No. Not yet. But I'll be working on it.
Stay tuned. Everything is wide open.
539.8 days until polls start to close.
For more information:
This post is an update based on the data on the Election Graphs Electoral College 2020 page. Election Graphs tracks a poll-based estimate of the Electoral College. The charts, graphs, and maps in the post above are all as of the time of this post. Click through on any image to go to a page with the current interactive versions of that chart, along with additional details.
Follow @ElectionGraphs on Twitter or Election Graphs on Facebook to see announcements of updates. For those interested in individual poll updates, follow @ElecCollPolls on Twitter for all the polls as I add them. If you find the information in these posts informative or useful, please consider visiting the donation page.
One thought on “Texas and Pennsylvania close, Iowa flips red”