
Since the last update on May 9th, there have been new polls in California [x2], Ohio, Texas, Wisconsin [x3], Nebraska (CD2), Georgia [x3], New Jersey, North Carolina [x4], Florida [x4], Colorado, Arizona [x3], Virginia, Tennessee, Kentucky, Michigan [x4], Pennsylvania [x2], Washington [2], Minnesota, Maryland, Utah, New York, South Carolina, Indiana, and Missouri.
Despite all of this polling, things actually moved very little.
We'll start with the changes since last time on all of the metrics, then look at the graphs.
| Model | Metric | 9 May | 2 Jun | 𝚫 |
| Categories | Trump Best Expected Biden Best |
TIED Biden +166 Biden +286 |
Trump +2 Biden +130 Biden +288 |
Trump +2 Trump +36 Biden +2 |
| Tipping Point | Biden +4.2 | Biden +4.3% | Biden +0.1% | |
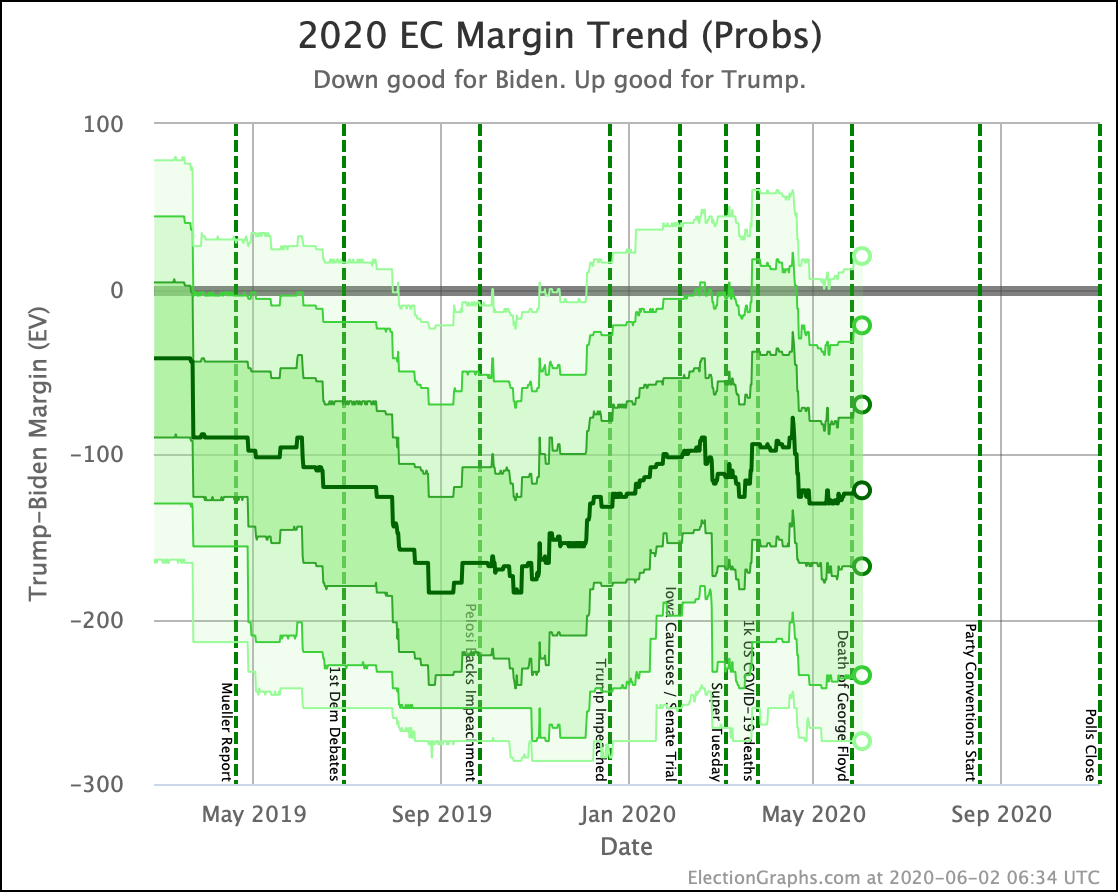
| Probabilities | Trump 2σ Median Biden 2σ |
Biden +36 Biden +130 Biden +240 |
Biden +22 Biden +122 Biden +234 |
Trump +14 Trump +8 Trump +6 |
| Trump Win Tie Biden Win |
0.2% 0.0% 99.8% |
0.5% 0.1% 99.4% |
+0.3% +0.1% -0.4% |
The biggest change is in the "Expected Case" where Trump reduces his losing margin against Biden from 166 EV to 130 EV.
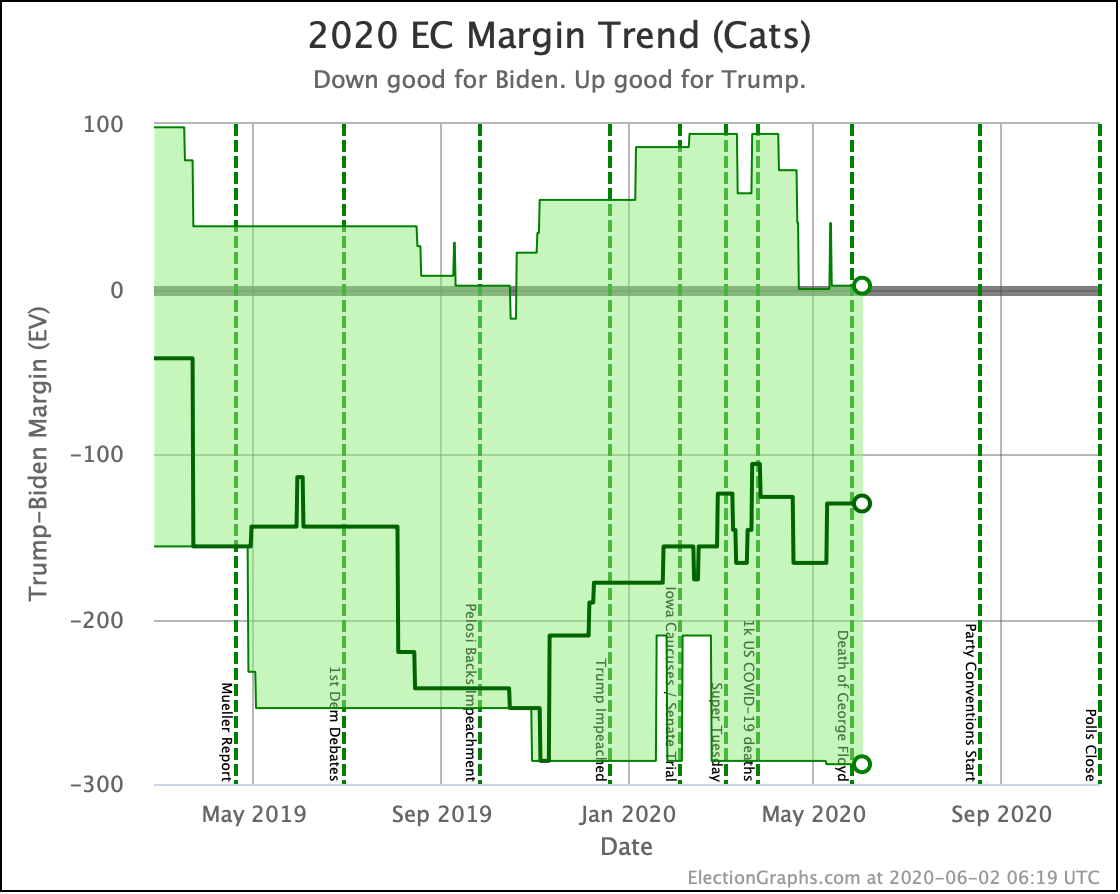
This is due to Ohio.
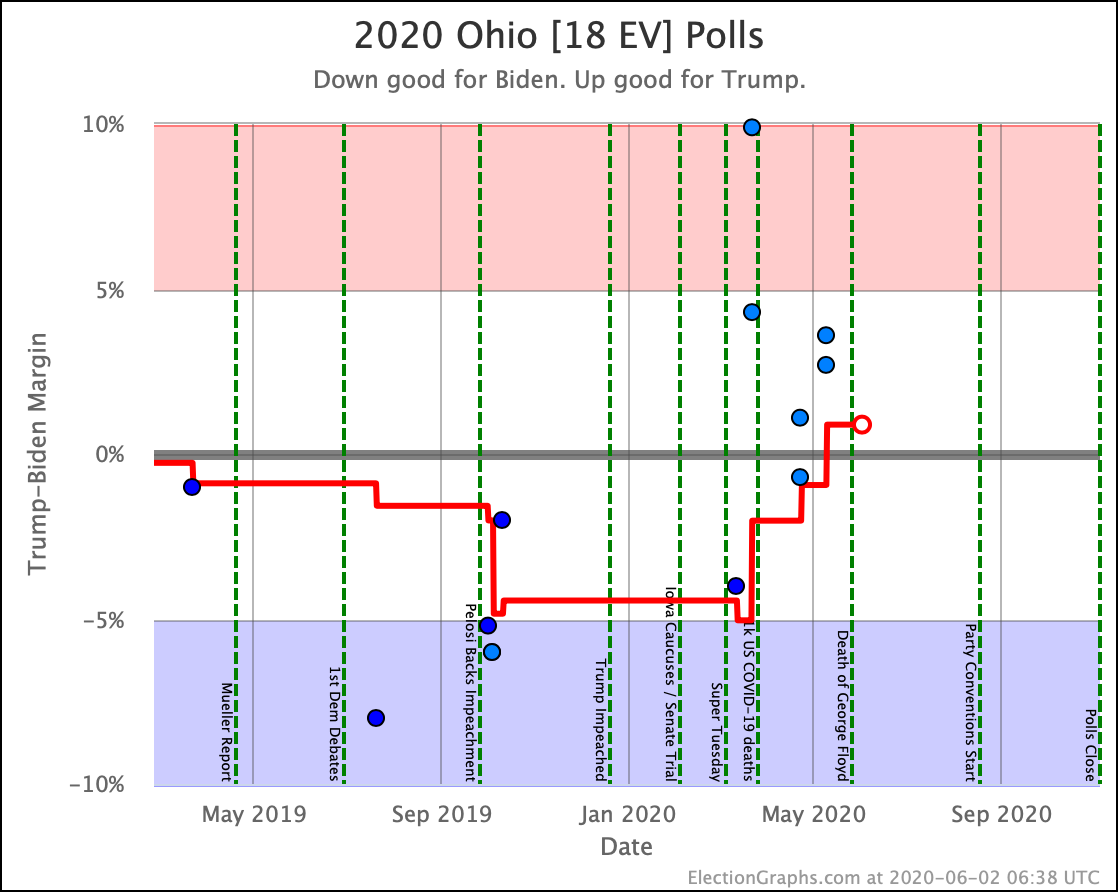
The polling average in Ohio moved from just barely Biden, to just barely Trump. Since the categorization model's Expected Case only cares who is in the lead, not by how much, this moves Ohio's 18 EV from one side to the other, for a net change in margin of 36 EV.
The probabilistic view, however, recognizes that both of these situations represent a close state that is very much in play. In addition, other close states move around a bit without actually changing category, but in ways that move the probabilistic results.
The net result is still Biden weakening a bit, just not quite as much as in the categorization view:
Aside from Ohio, Trump had nice movements in his direction in two close states:
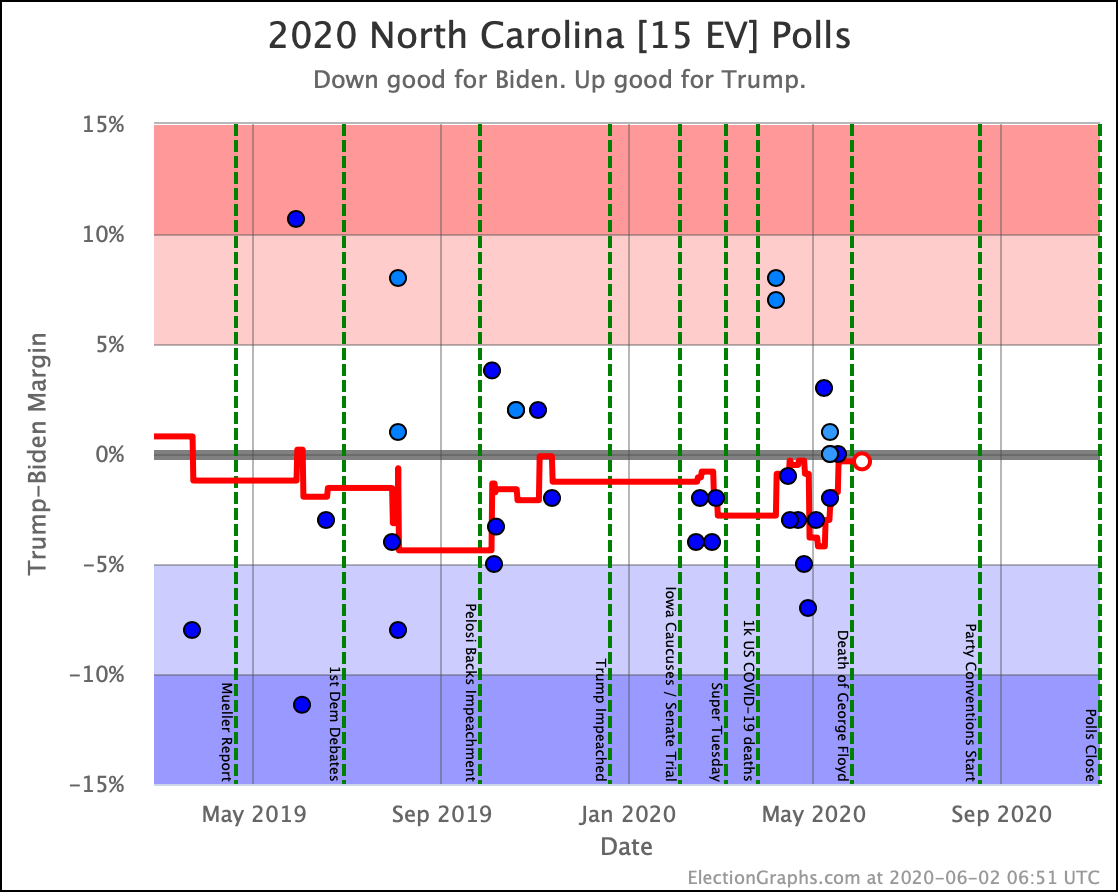
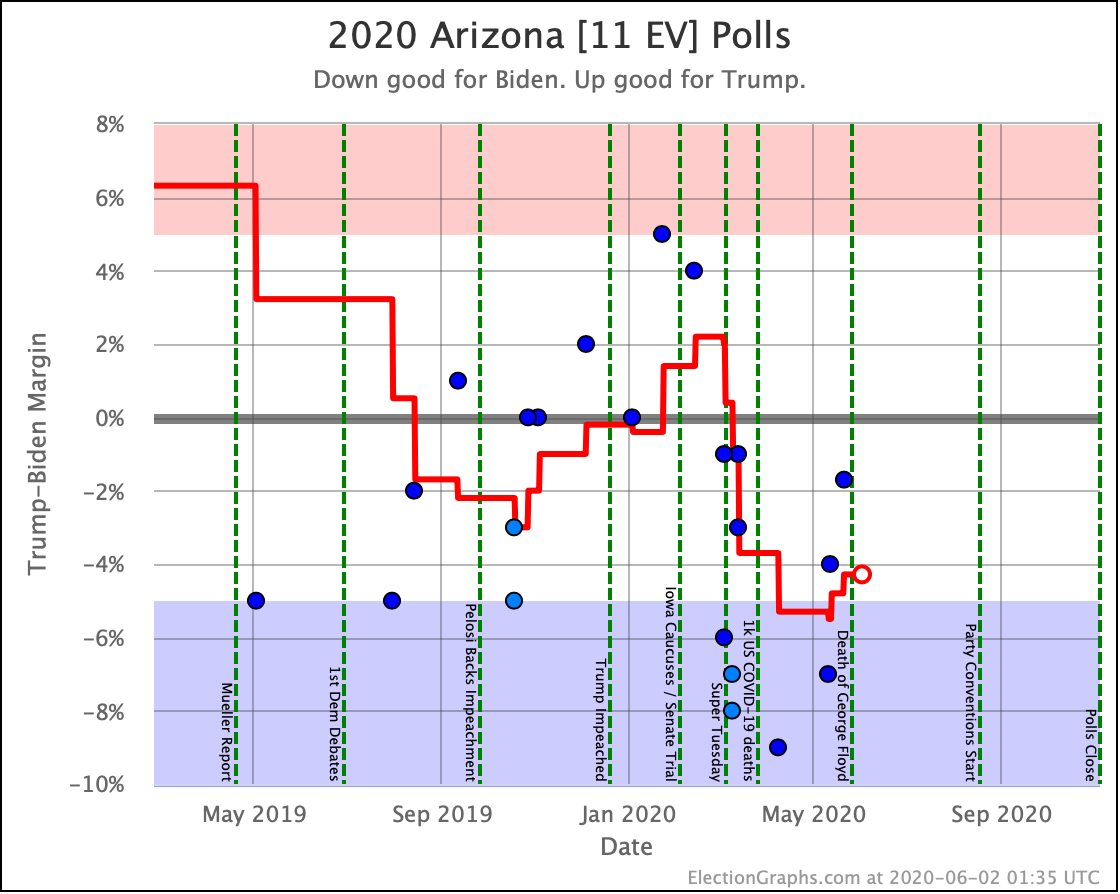
This was countered a little bit by improvements for Biden in a couple of states:
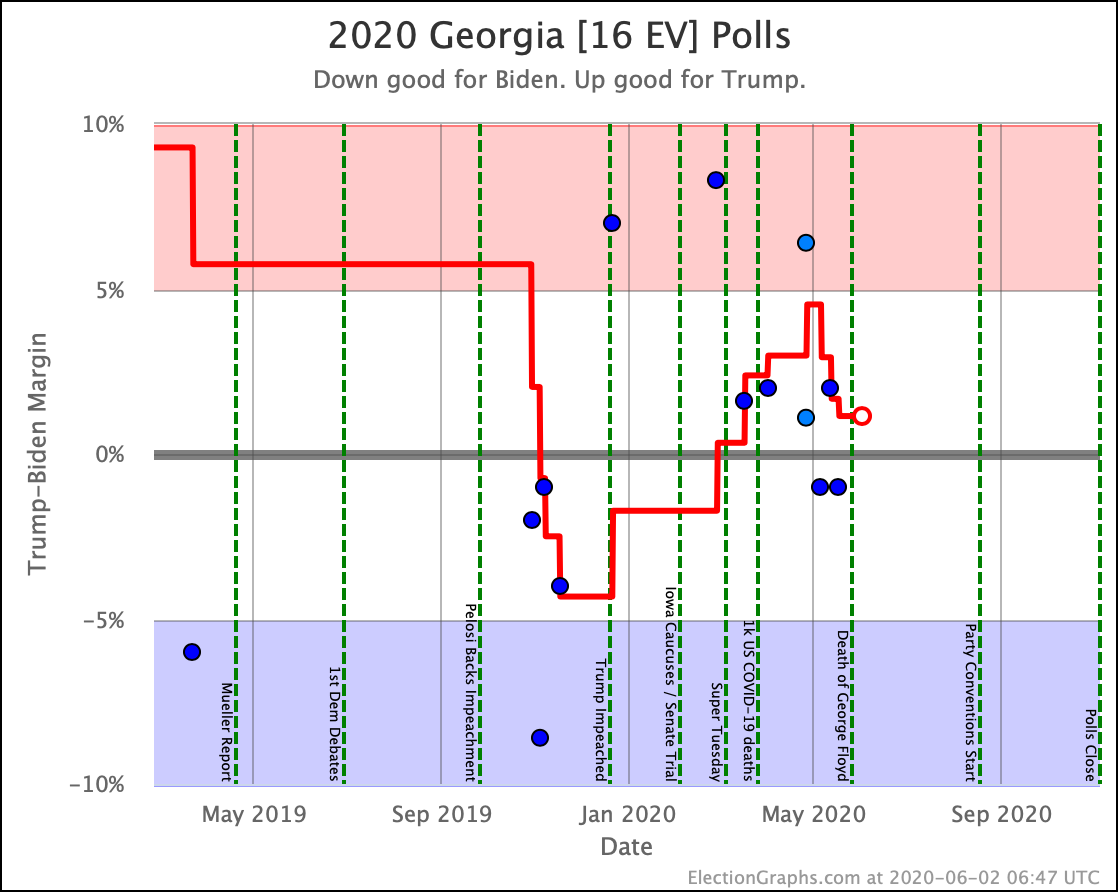
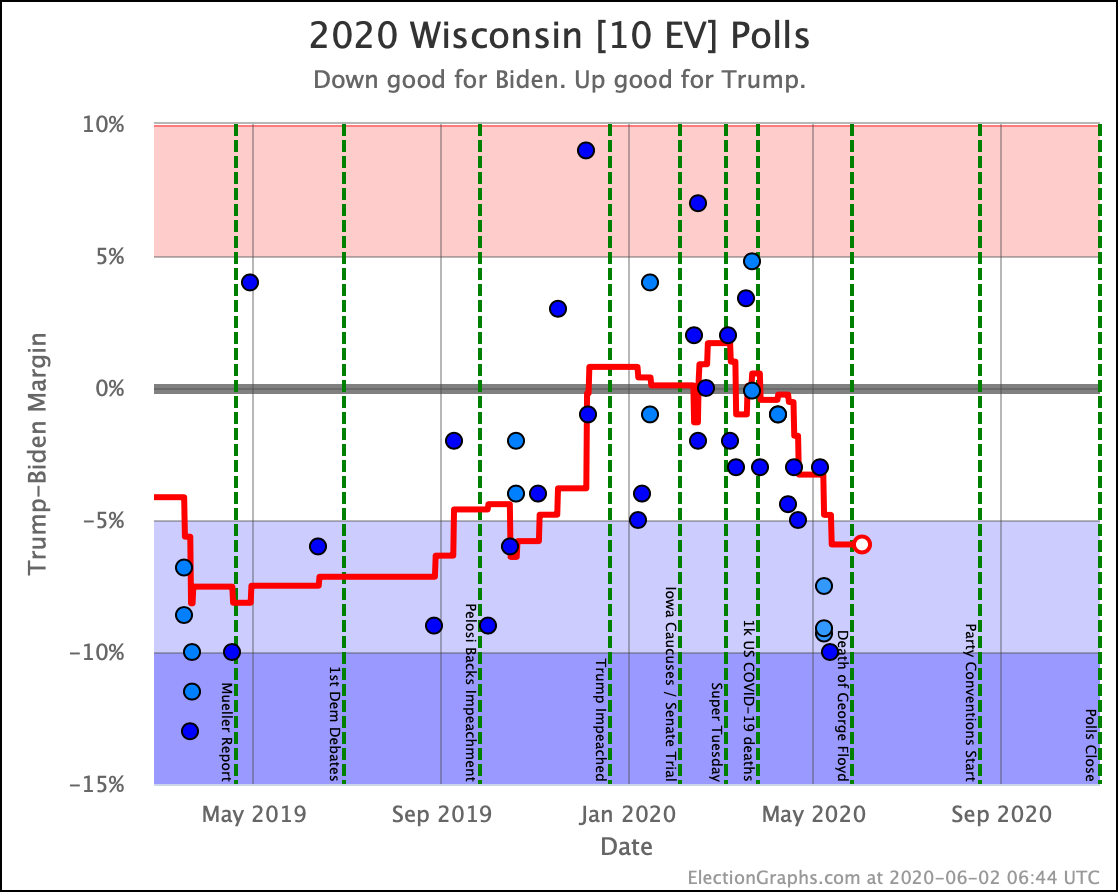
But that wasn't enough to improve Biden's overall situation. On balance, although it has been small, the movement in the last few weeks has been toward Trump.
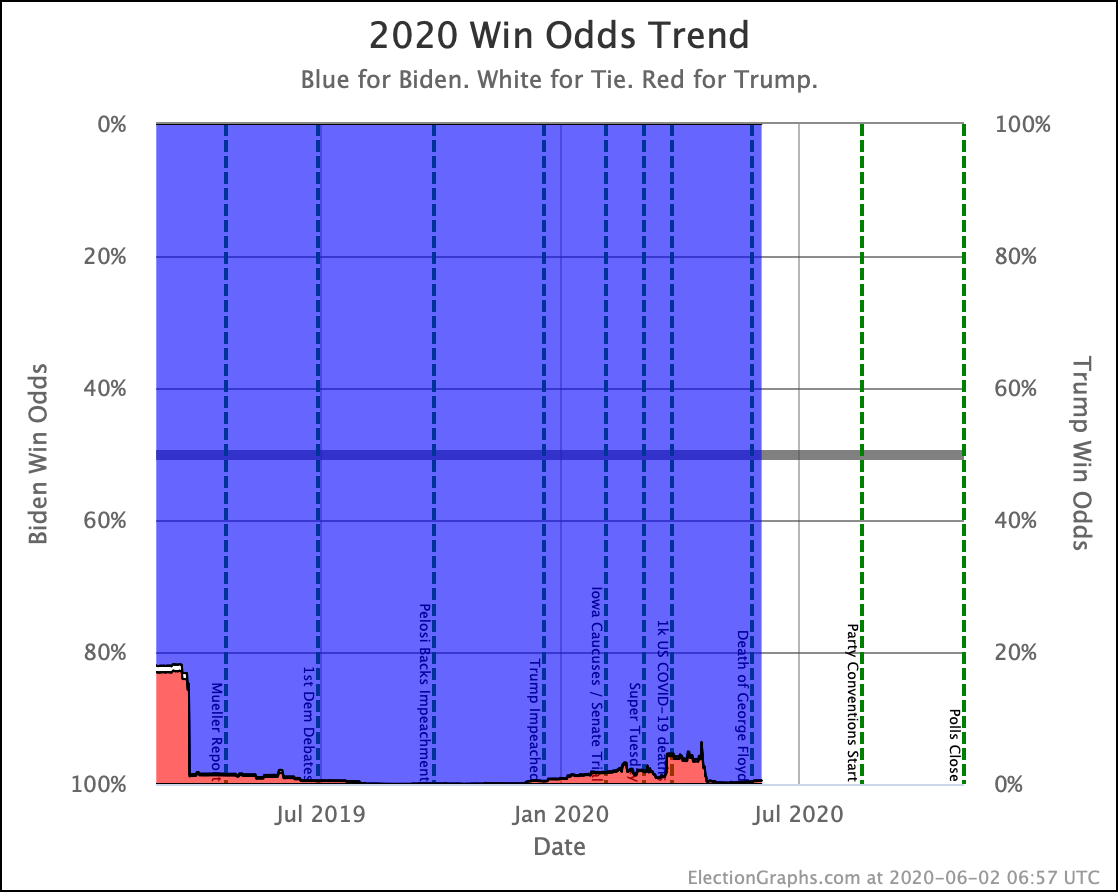
If the election was held today, Biden retains an overwhelming advantage.
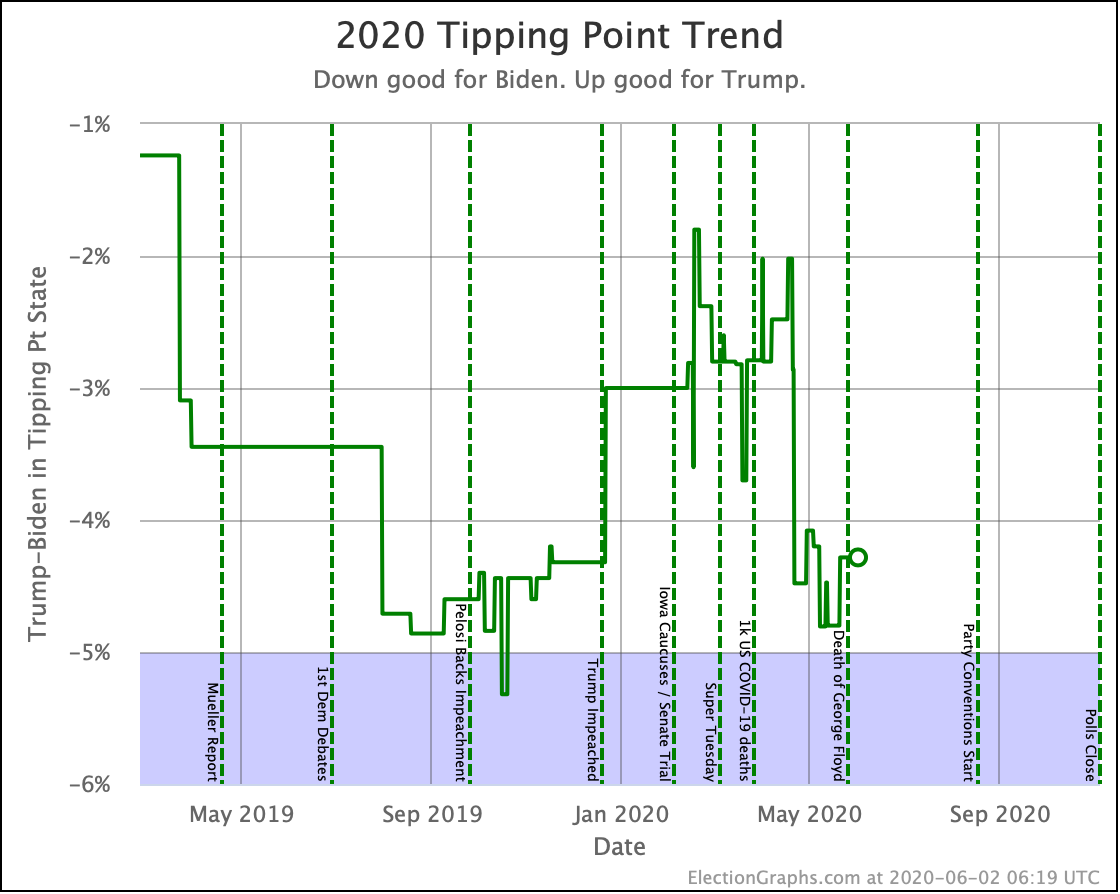
But as usual, we point out that the race is dynamic. It would only take a 4.3% shift in the polls to make Trump the favorite, and that kind of change can happen in a matter of weeks. We have a long way to go.
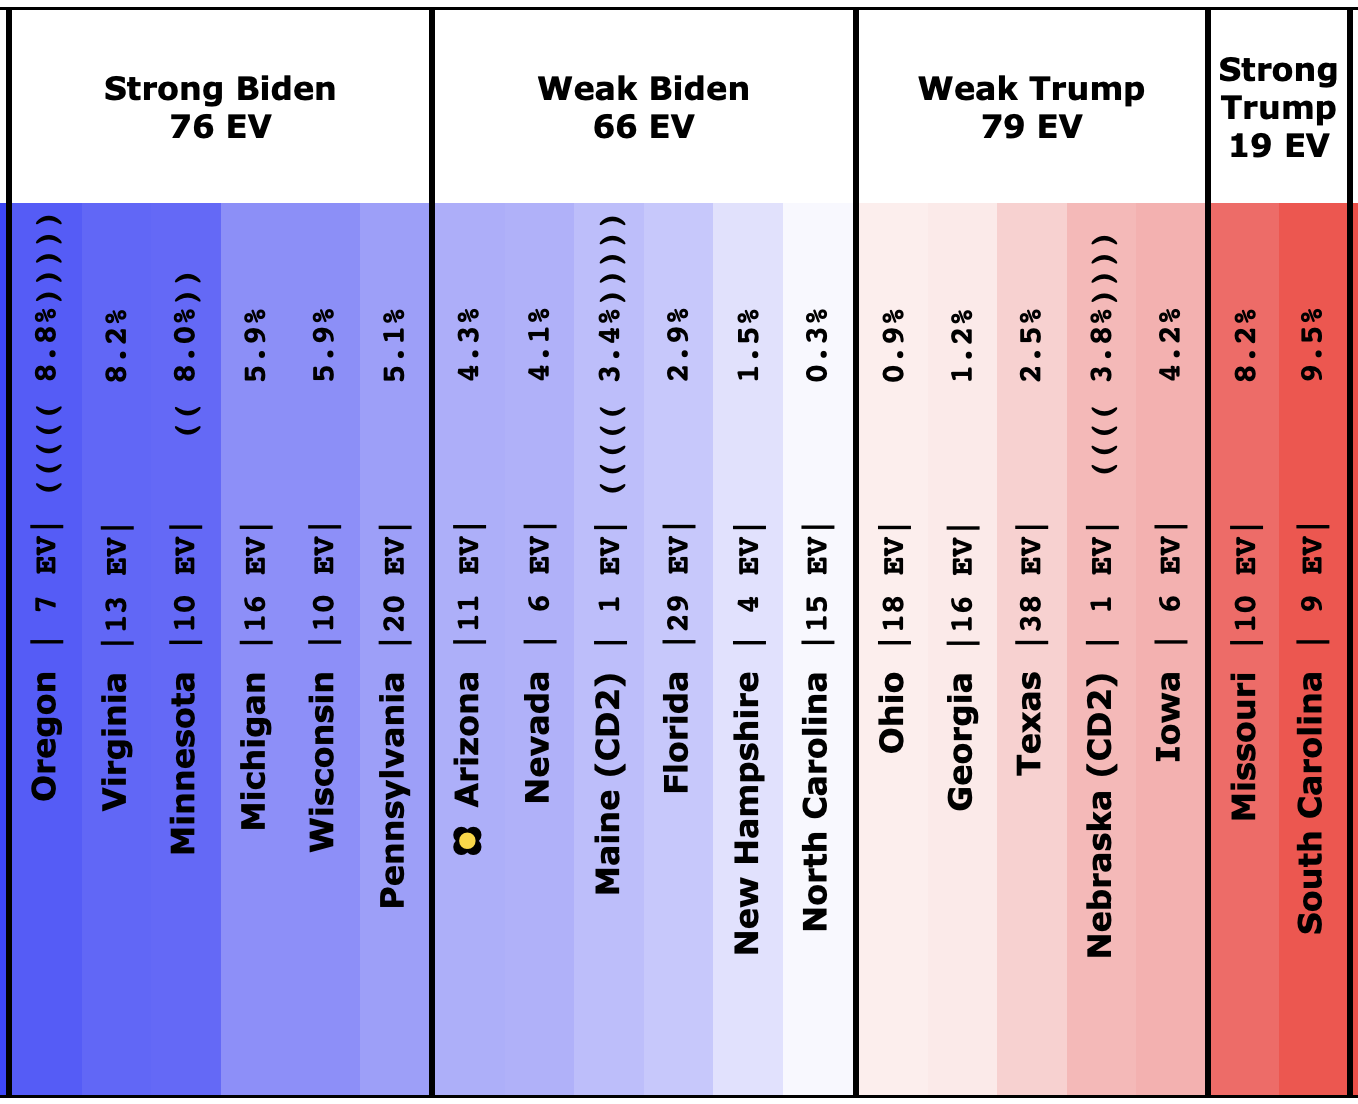
Right now these are the battlegrounds:
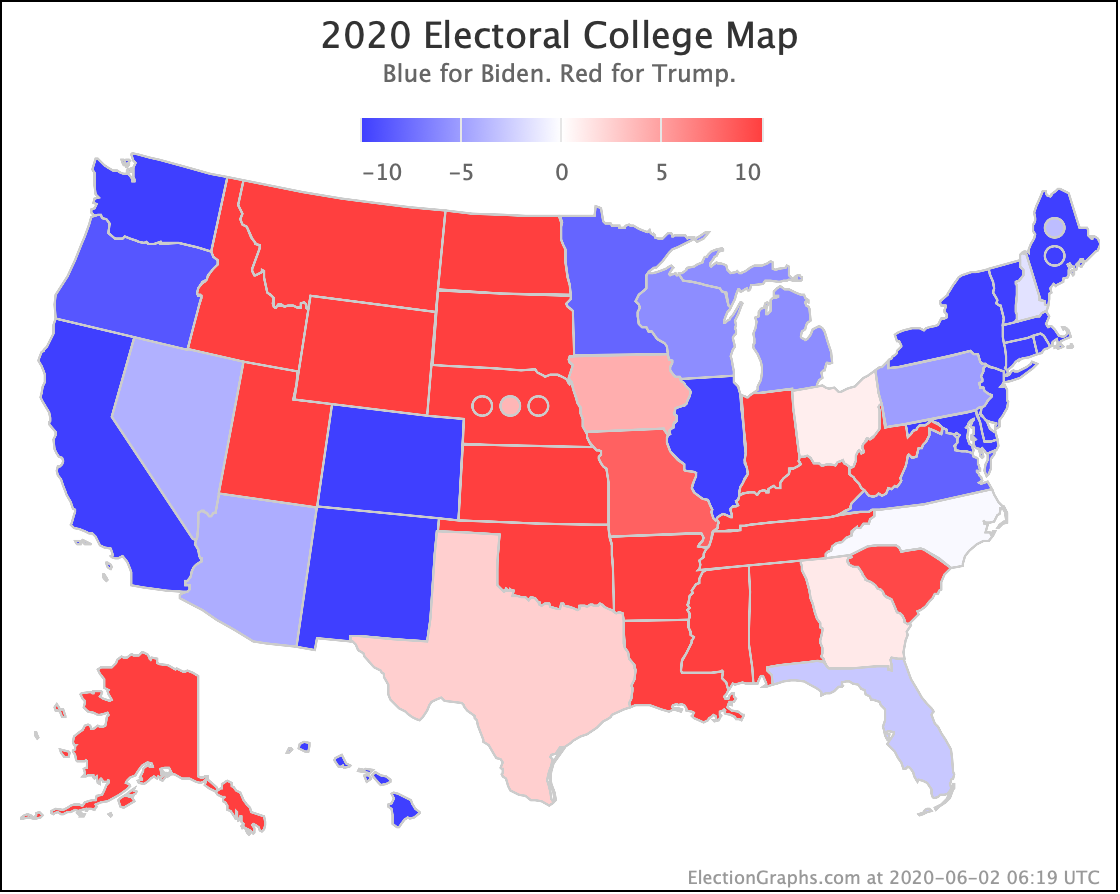
And this is the map:
154.7 days until polls start to close on election night.
For more information:
This post is an update based on the data on the Election Graphs Electoral College 2020 page. Election Graphs tracks a poll-based estimate of the Electoral College. The charts, graphs, and maps in the post above are all as of the time of this post. Click through on any image for current interactive versions of the chart, along with additional details.
Follow @ElectionGraphs on Twitter or Election Graphs on Facebook to see announcements of updates. For those interested in individual poll updates, follow @ElecCollPolls on Twitter for all the polls as I add them. If you find the information in these posts informative or useful, please consider visiting the donation page.
One thought on “Small Improvements for Trump”