
Since last week's update, there was only one new poll released, a University of Mary Washington poll of Virginia.
They polled Biden, Sanders, Warren, and Harris against Trump. No new data for Buttigieg or O'Rourke.
This poll was the first public polling of Virginia this cycle. The only glimpse we had previously was leaked Trump internal polling from March which only included Biden.
Virginia has been trending blue over the last few elections, but Election Graphs starts with the average of the previous five elections before we have polls and the average margin from 2000 to 2016 ended up as a 0.1% Republican lead.
The leaked Biden vs. Trump poll moved the state from Weak Trump (by 0.1%) to Weak Biden (by 4.9%) in the Election Graphs average, but with no 2020 data, all the other Democrats remained in "Weak Trump" territory despite the general sense that because of the trends in Virginia, this was unlikely to stay the case.
At long last, we have a new public poll of Virginia though. So we start to see how the state looks for 2020.
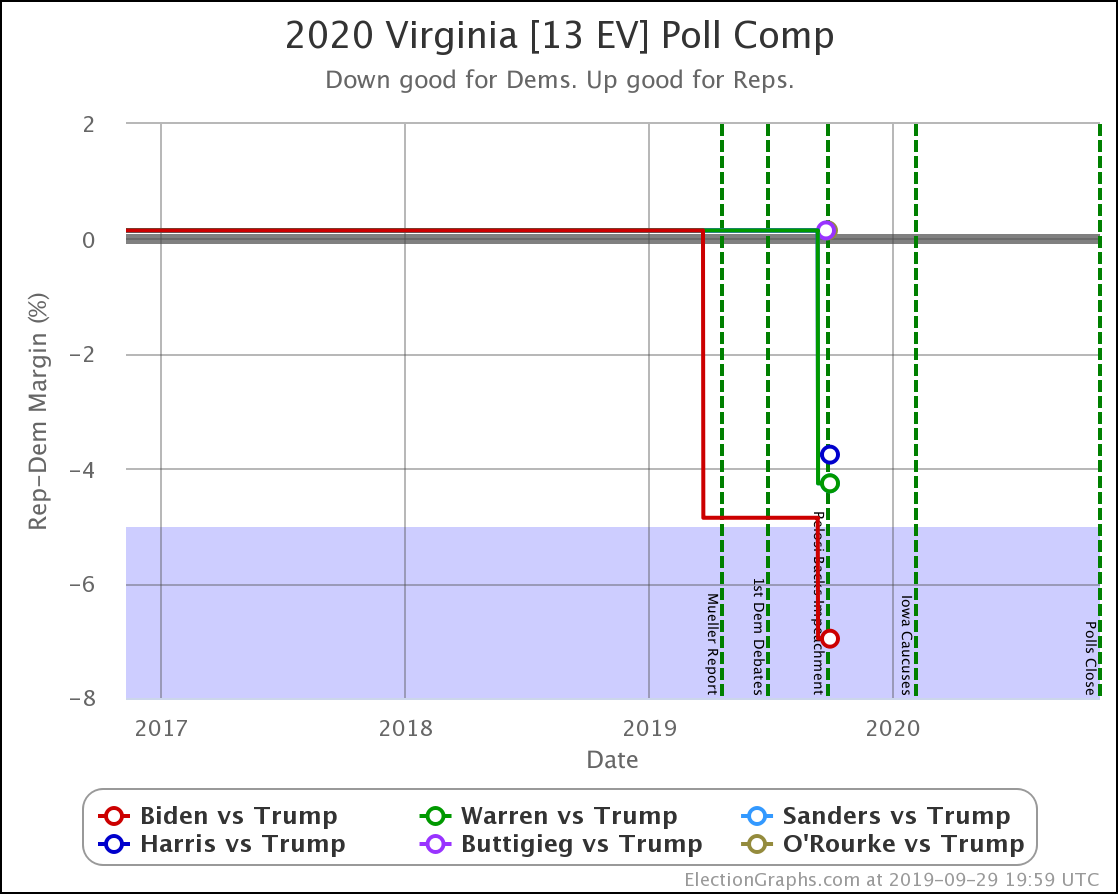
All four Democratic candidates led Trump by double digits in this new poll. The poll averages still include some older election results though, since this is the first 2020 polling in Virginia for every matchup except Biden vs. Trump.
In terms of categories, this moved the state from "Weak Trump" to "Weak Democratic" for Sanders, Warren, and Harris.
Biden, having already taken the lead after that leaked Trump internal poll, now moves from "Weak Biden" to "Strong Biden."
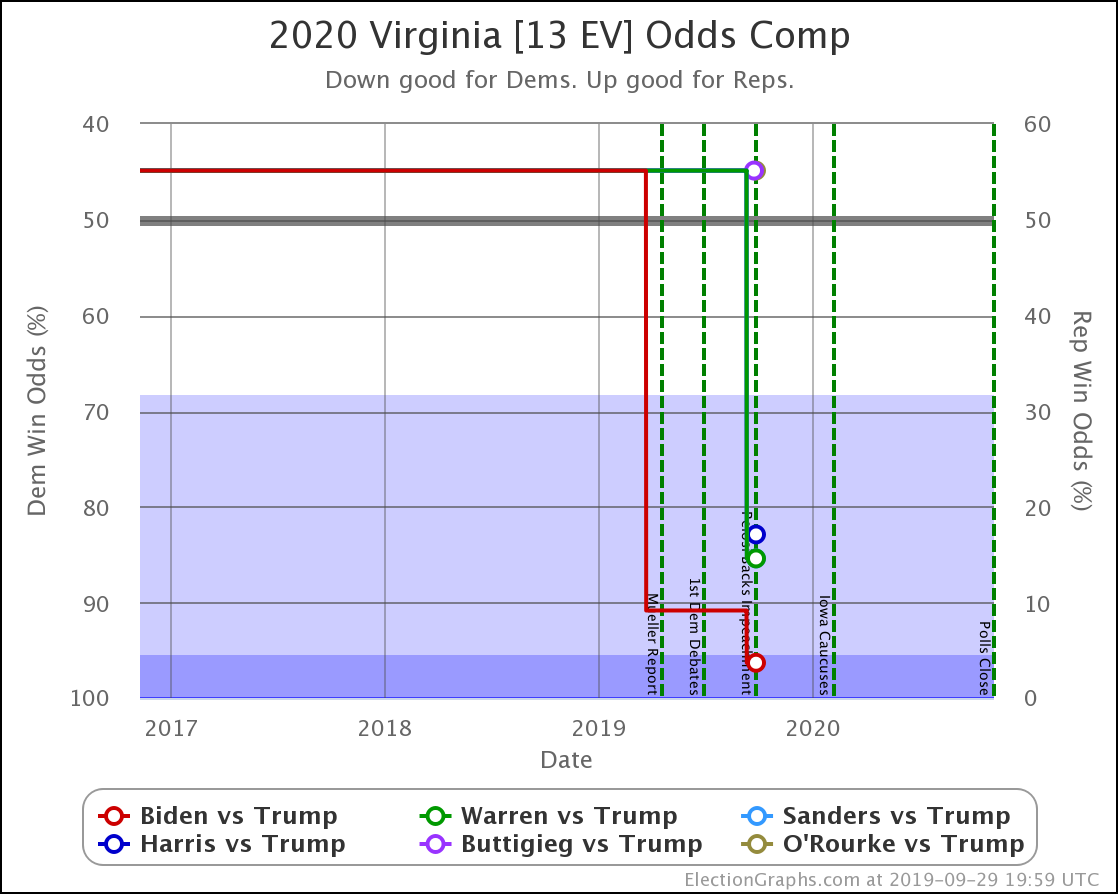
In terms of odds of winning, that means that every Democrat that has been polled in Virginia so far is estimated to have an 80%+ chance of winning the state according to the historical accuracy of Election Graphs poll averages.
As usual, I must repeat the universal caveat on this site: These numbers are if the election was today. The election is not today, a lot will change between now and then.
Also, in this case, we still have sparse polling.
So, what does the national picture look like now in terms of the chance of the Democrat winning?
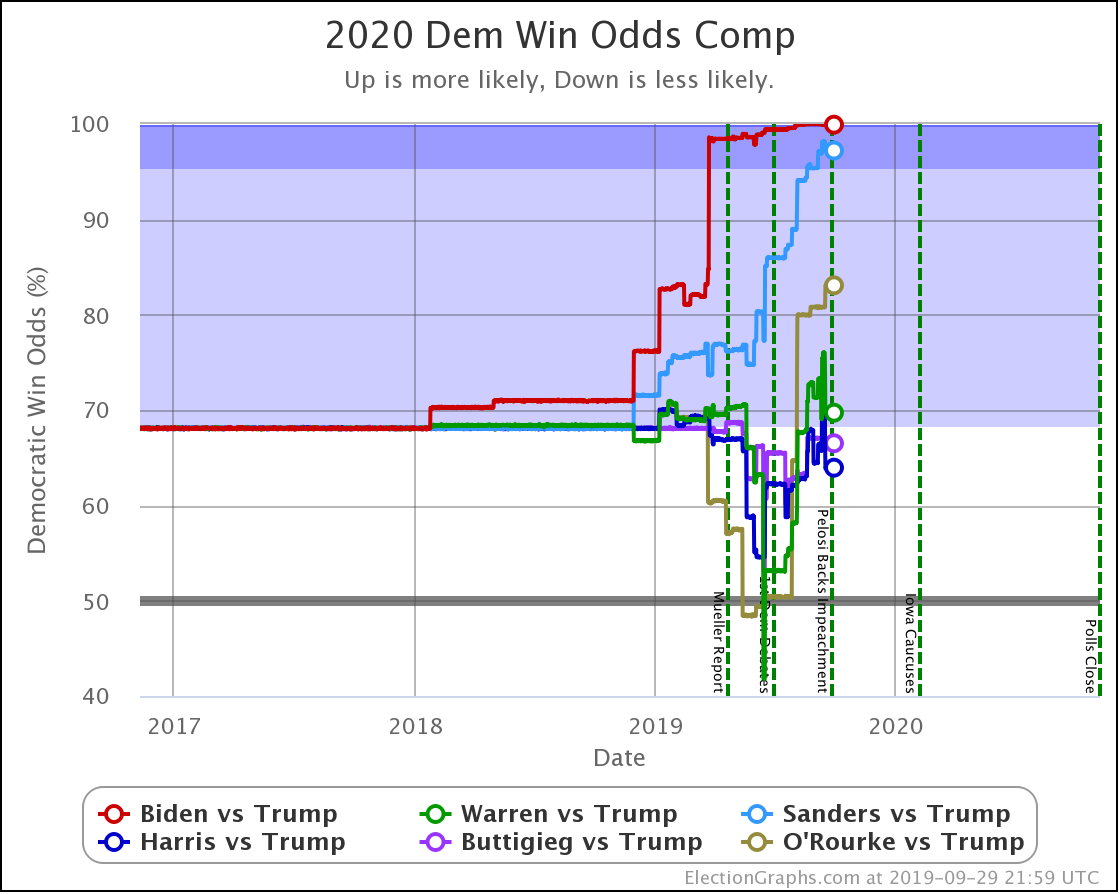
| Dem | 22 Sep | 29 Sep | 𝚫 |
| Biden | 99.9% | 99.9% | Flat |
| Sanders | 95.3% | 97.2% | +1.9% |
| O'Rourke | 83.1% | 83.1% | Flat |
| Warren | 62.4% | 69.7% | +7.3% |
| Buttigieg | 66.5% | 66.5% | Flat |
| Harris | 54.7% | 64.0% | +10.7% |
It is hard for Biden to improve his position much given where he is, but the movement of Virginia in the blue direction helps the other three Democrats with poll results, with the most significant boost going to Harris.
And that is all for this week.
400.9 days until polls start to close.
For more information:
This post is an update based on the data on the Election Graphs Electoral College 2020 page. Election Graphs tracks a poll-based estimate of the Electoral College. The charts, graphs, and maps in the post above are all as of the time of this post. Click through on any image to go to a page with the current interactive versions of that chart, along with additional details.
Follow @ElectionGraphs on Twitter or Election Graphs on Facebook to see announcements of updates. For those interested in individual poll updates, follow @ElecCollPolls on Twitter for all the polls as I add them. If you find the information in these posts informative or useful, please consider visiting the donation page.