
I'm trying to get back in the habit of more frequent updates in preparation for actually entering 2020, but there is not much new this time.
Since the last update on December 16th, there has only been a single poll in Virginia. And they only polled Sanders, Biden, and Warren vs. Trump.
The categorization style changes resulting from this were:
- Biden vs. Trump state category change: VA has moved from Solid Biden to Strong Biden
- Sanders vs. Trump state category change: VA has moved from Strong Sanders to Weak Sanders
- Trump best case vs. Sanders has changed: Sanders 217 to Trump 321 -> Sanders 204 to Trump 334
Since there is relatively little new polling this time, instead of just looking at some of the overview candidate comparisons, let's look at each of the Virginia results.

Pollsters have not paid enough attention to Virginia. For Sanders, there have only been three polls. One from UMW and two from VCU. Each of these has released multiple "views" of their data. These detailed results are why you see more than three dots on the chart. For instance, in the latest, a new VCU poll gave results for "all," "registered voters," and "likely voters."
For Sanders vs. Trump, those broke like this:
- All: Sanders 46% to Trump 46% (Tie)
- Registered Voters: Sanders 45% to Trump 47% (Trump +2%)
- Likely Voters: Sanders 45% to Trump 48% (Trump +3%)
When a single poll releases multiple results, Election Graphs essentially averages the results. So, in this case, these three results together count as a Trump +1.67% poll.
The Election Graphs average now contains three actual 2020 polls, plus the 2016 and 2012 election results to round out the average giving Sanders a 4.4% lead in Virginia.
Just looking at the three actual polls, though, you can see each subsequent result has been worse for Sanders than the previous one. That is probably not the trend he would like to see.
But this is where I go back to what I said at the start. There have only been three polls. It is easy to see trends that are not real when you only have three data points. We need more.
But this last poll moves the average back into the competitive zone. Although Virginia has been trending blue, Democrats may not want to take it for granted.
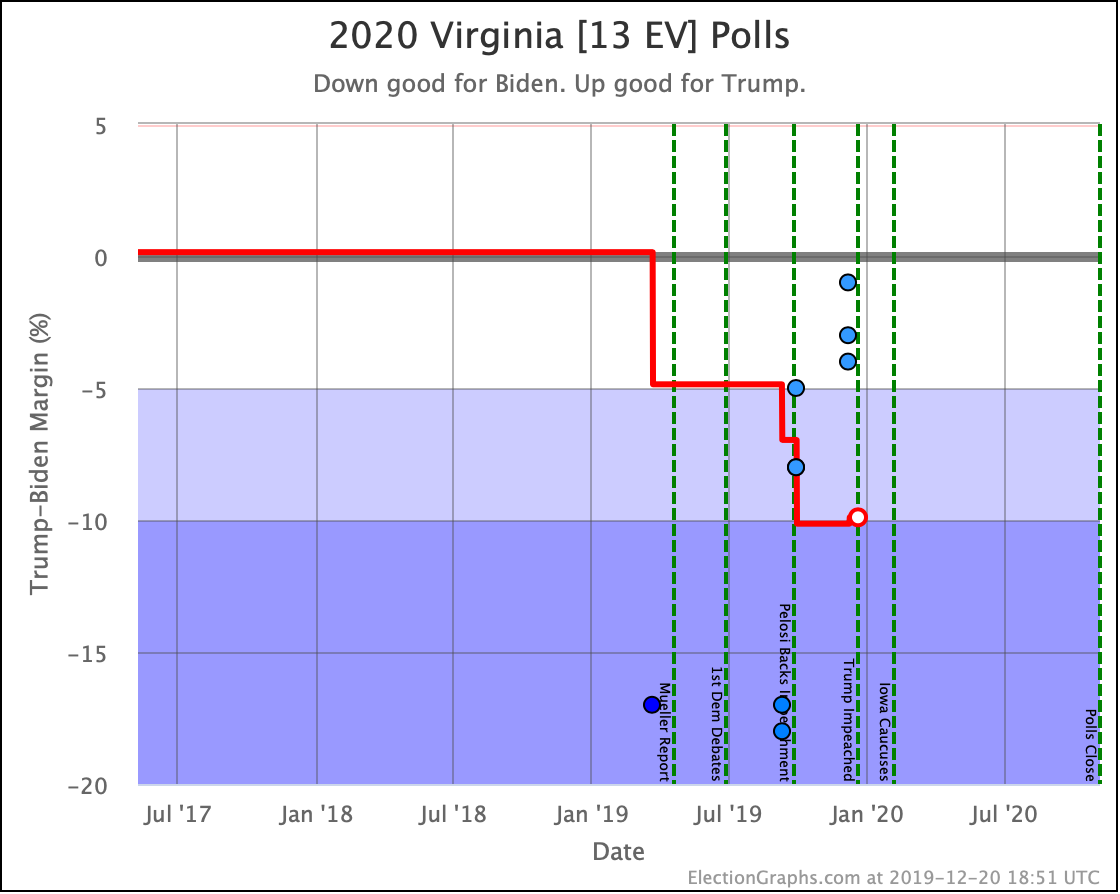
Biden vs. Trump also shows each of the last three polls weaker for Biden than the one before. Except there is one additional 2020 poll, the leaked Trump internal poll from March. That provides one more data point showing a strong Democratic lead, and Biden's numbers have been better than Sanders anyway, so we end up at a Biden +9.9% average, which is slightly worse than the 10.1% lead before this latest poll. The line isn't moving toward Trump as much as with Sanders, but Biden still shows weakening.
The latest couple of polls have been significantly weaker, though, so again, we need more Virginia polls.
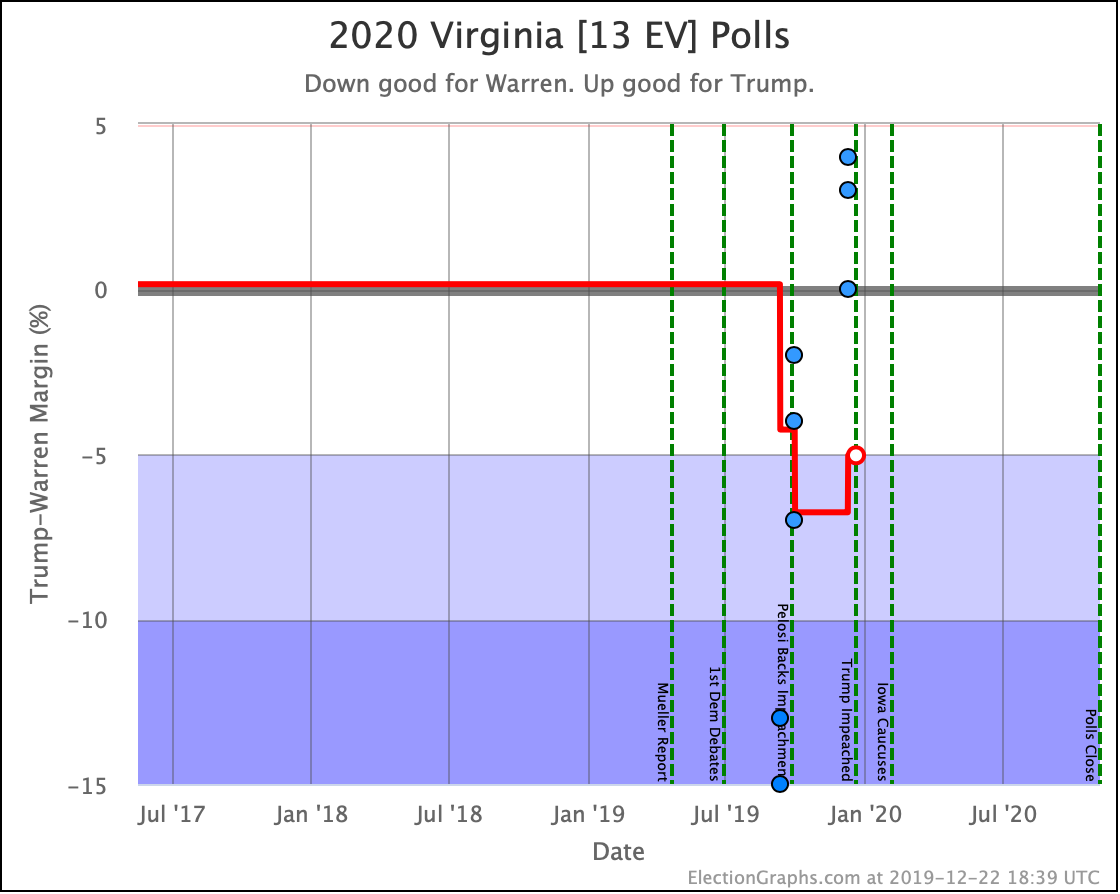
Warren shows a similar pattern to Sanders, except a little bit stronger, with the average standing at a Warren +5.0% lead.
The Democrats weakening in Virginia continues the trends I discussed last time. The fall was not great for the Democrats.
The longer-term trends are evident in the graphs, but see the charts below for the new changes caused by the one new VCU poll in this update.
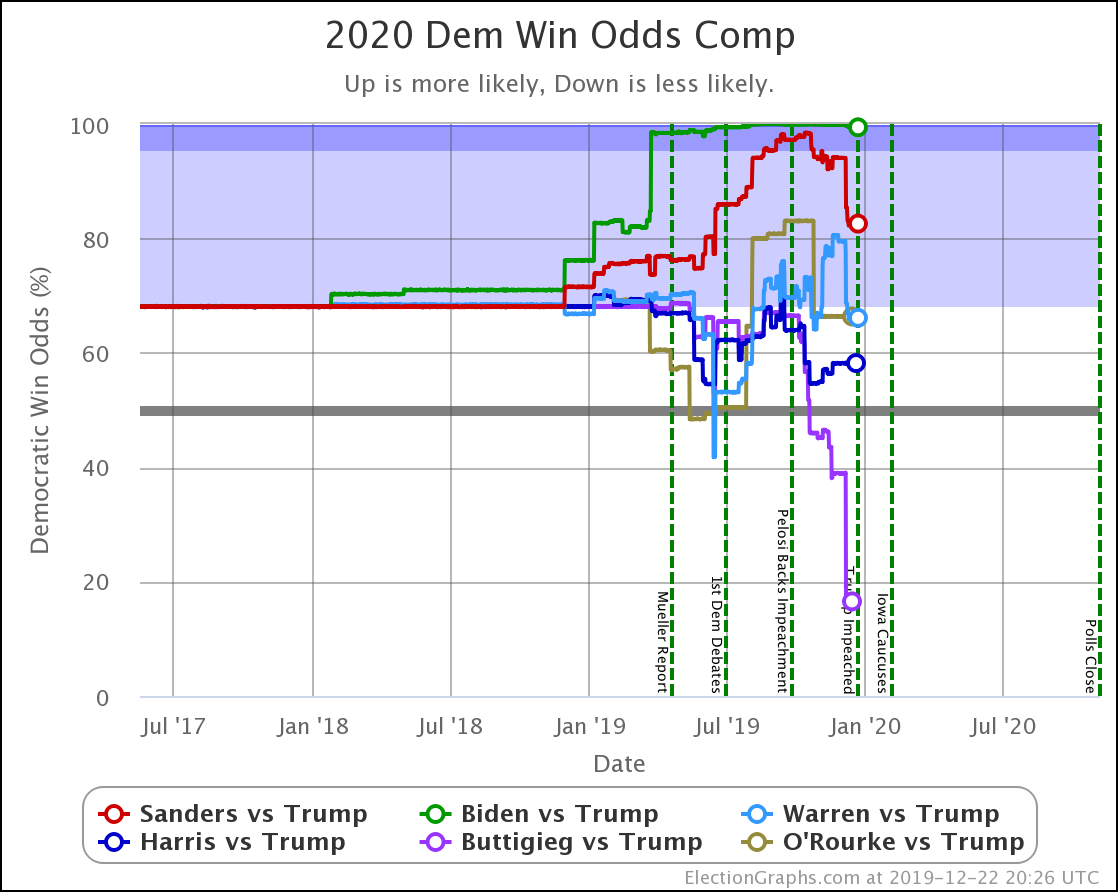
| Dem | 16 Dec | 22 Dec | 𝚫 |
| Biden | 99.4% | 99.4% | Flat |
| Sanders | 83.5% | 82.6% | -0.9% |
| Warren | 67.2% | 66.1% | -1.1% |
| Buttigieg | 16.5% | 16.5% | Flat |
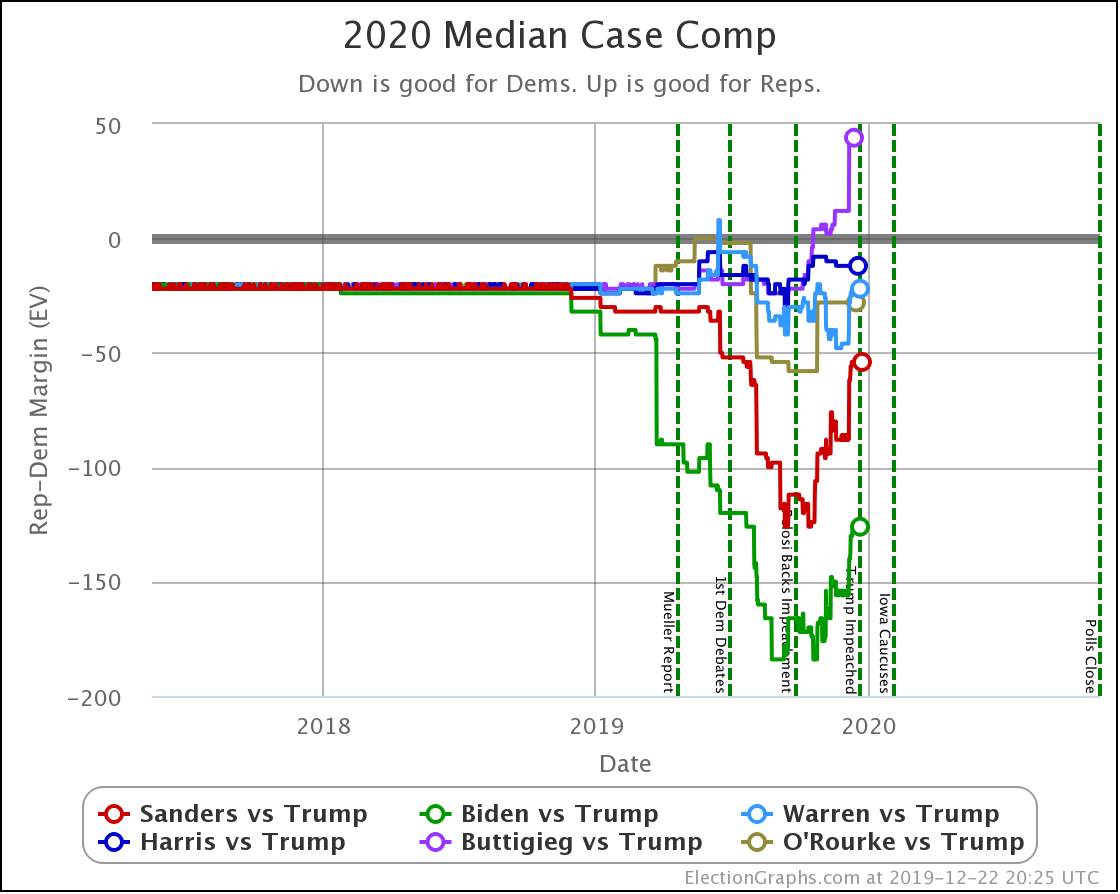
| Dem | 16 Dec | 22 Dec | 𝚫 |
| Biden | +126 | +126 | Flat |
| Sanders | +56 | +54 | -2 |
| Warren | +24 | +22 | -2 |
| Buttigieg | -44 | -44 | Flat |
On the categorization view, there were no changes to the Expected Case or Tipping Point numbers, so we'll skip those this time.
And that's where we are.
317.1 days until polls start to close.
For more information:
This post is an update based on the data on the Election Graphs Electoral College 2020 page. Election Graphs tracks a poll-based estimate of the Electoral College. The charts, graphs, and maps in the post above are all as of the time of this post. Click through on any image to go to a page with the current interactive versions of that chart, along with additional details.
Follow @ElectionGraphs on Twitter or Election Graphs on Facebook to see announcements of updates. For those interested in individual poll updates, follow @ElecCollPolls on Twitter for all the polls as I add them. If you find the information in these posts informative or useful, please consider visiting the donation page.
One thought on “Looking at Virginia”