Republican Delegates after MI/ID/MO

I wasn't expecting Missouri.

Thought that wasn't going to be until May based on the Green Papers calendar.

But regardless, we got results for 54 delegates from Missouri, 39 delegates from Michigan, and 32 delegates from Idaho on Saturday.

Donald Trump got all 125 of those delegates.

And so the walk toward the nomination continues.

Next up, Republicans in DC later today, and in North Dakota Monday.

Then Super Tuesday.

134.3 days until the Republican National Convention

169.3 days until the Democratic National Convention


Another Mixed Week for Dems

Since last week's update, there has been new polling released in Arizona (x2), Colorado, Kentucky, Maine, North Carolina, California (x2), Florida, Texas, and Missouri.

Once again we have mixed results.

Two of the six most polled Democrats (Biden and O'Rourke) improve their positions in the probabilistic view when you combine the results of all of those polls.

The other four (Sanders, Buttigieg, Warren, and Harris) slip in their matchups against Trump. Some weaken significantly.

So let's start with the national "Odds of a Democratic Win" view:

Dem 15 Sep 22 Sep 𝚫
Biden 99.8% 99.9% +0.1%
Sanders 96.9% 95.3% -1.6%
O'Rourke 80.8% 83.1% +2.3%
Buttigieg 67.0% 66.5% -0.5%
Warren 69.0% 62.4% -6.6%
Harris 65.7% 54.7% -11.0%

The two that stand out here are Warren and Harris. The new polls this week hurt their win chances significantly. Harris is now looking only slightly better off than a coin toss in a race against Trump.

We'll look at each state to determine where these changes are coming from, but first, you can also see this pattern dramatically when looking at the "Median Case" from the Monte Carlo simulations.

In this view, you can see that the winning margins of every  Democratic candidate except O'Rourke have been decreasing lately. Including Biden.

A lot of the "movement" of these various lines up until now could still be attributed to actual 2020 polling replacing old elections in our state polling averages. We are getting to the point though where a lot (although not all) of the critical states are mostly 2020 polls.

So we may start seeing trends that represent real changes in public opinion. We will also begin to see what level of variability is just inherent in looking at the election this way. It may end up being "normal" that some of these lines bounce up and down quite a bit as we go along.

In the meantime though, time to look at the trends in each of the states where there was new polling over the last week. There are a lot, so I'll be brief.

California is so blue; it is mostly irrelevant to the national race. All of the Democrats have a 100% chance of winning California. It is notable though that all six candidates are doing even stronger in California than the historical average from the 2000 to 2016 elections. California is getting even bluer.

A lot of the win odds changes this week can be attributed to Texas. With the latest polling in Texas, the trend of each new poll moving the state further in the Democratic direction has ended. Biden and O'Rourke still improve slightly, but every other Democrat erodes. Along with Biden and O'Rourke, Sanders retains a lead. Warren, Harris, and Buttigieg not only lose Texas but the picture of them "making it close" is slipping. At least this week.

Florida is the other big state responsible for much of this week's changes. The only Democrats who did not weaken in Florida this week are the ones that were not in the polls. Florida has a lot of electoral votes, and Florida is close, so it has an outsized impact on the national picture.

The only mover this week in North Carolina is Biden, with his average moving to a greater than 5% lead for the first time. Trump leads all the other Democrats by narrow margins.

Arizona is another state where there is a big gap between Biden and the rest of the field. This week Biden took the lead in the Arizona poll average. Add Arizona to Texas as red states that flip, and you can see why Biden's national position remains so strong.  Sanders also makes Arizona close, but all of the other Democrats are hovering around the historical average, which is a Strong Republican win.

Missouri is clear red state, and with two polls so far this cycle, it just looks like it is getting redder.

At the same time, Colorado is getting bluer. Only Biden moves the state into Strong Democrat territory so far though. The other candidates still only have narrow leads in the polling average.

Kentucky is red and not in contention for 2020. With the small amount of polling so far though, Biden still does best, actually decreasing the Republican margin slightly. Not so much for the others.

Finally Maine. Maine is blue and does not look to be changing into anything else. With the first few polls, Biden looked like he might be making it even bluer than before. But as we stand today, all of the Democrats are pretty close to the historical average for the state.

And that is where things are this week.

408.0 days until polls start to close.

For more information:

This post is an update based on the data on the Election Graphs Electoral College 2020 page. Election Graphs tracks a poll-based estimate of the Electoral College. The charts, graphs, and maps in the post above are all as of the time of this post. Click through on any image to go to a page with the current interactive versions of that chart, along with additional details.

Follow @ElectionGraphs on Twitter or Election Graphs on Facebook to see announcements of updates. For those interested in individual poll updates, follow @ElecCollPolls on Twitter for all the polls as I add them. If you find the information in these posts informative or useful, please consider visiting the donation page.

Missouri, Michigan, and Utah

Since last week's update, there has been new polling in Missouri, Michigan, and Utah.

The only category change coming out of this was that in a Harris vs. Trump race Missouri moves from Strong Trump (a 5% to 10% Trump lead) to Solid Trump (a greater than 10% Trump lead).

Looking more generally, the Democrats improve their leads in Michigan, Missouri looks redder than it did before, and Utah is still bright red but a little less so.

Looking at a national level, Harris, Warren, and Sanders improve their win probabilities against Trump in the probabilistic view. Everyone else is flat.

Dem 25 Aug 1 Sep 𝚫
Biden 99.9% 99.9% Flat
Sanders 95.5% 95.7% +0.2%
O'Rourke 80.0% 80.0% Flat
Warren 71.0% 72.6% +1.6%
Harris 65.8% 67.9% +2.1%
Buttigieg 67.1% 67.1% Flat

Now, let's look at the three states with new polls:

Biden and Sanders improve their polling averages noticeably with this new polling from EPIC-MRA. Warren and Harris also improve slightly. EPIC-MRA did not poll Buttigieg and O'Rourke.

Bottom line, Biden and Sanders continue to be in a position to easily win Michigan. The others are all leading, but narrowly, and the state would very much be in play.

This is the first 2020 polling for Missouri. RRG polled Biden, Sanders, O'Rourke, and Harris. It is actually an old poll from April, but it was new to Election Graphs this week.

In all four cases the averages moved in the Republican direction.

This first set of Missouri polling ranged from an 8% Trump win (against Biden) to a 16% Trump win (against Harris).  Only one poll so far, but it isn't looking like Missouri is one of those red states that is getting less red.

Utah, on the other hand, does look like a red state that might be getting a little less red. Maybe.

The first 2020 polling for Utah is from Y2 Analytics, and the sample sizes on their head-to-head matches are extraordinarily small (from 140 to 153), so you should take them with a massive pile of salt.

The average of the margins in Utah from 2000 to 2016 is a 36.1% Republican victory. Utah has not gone Democratic since Lyndon Johnson's 1964 landslide over Barry Goldwater. Utah is a VERY red state.

This new poll shows a range of results in our top six candidates from Sanders winning by 6%, to Buttigieg losing by 20%. Biden and Warren were within the margin of error of winning too.

Even that Buttigieg loss does better than the historical average. But Sanders WINNING? That is a very surprising result for Utah.

And, while he is not in the six most polled candidates against Trump, so we wouldn't usually mention it, Y2 also polled Booker against Trump, and had Booker beating Trump by 12%!

Frankly, these Utah results are tough to believe. It would take a lot more than one poll to make it reasonable to think that Utah was competitive for ANY of the Democratic candidates, let alone that one of them was leading by double digits.

Which is of course why you look at averages, not at individual polls. This Y2 poll when averaged in with the 2004 to 2016 elections, is enough for Election Graphs to put the poll average for the best of our six Democrats (Sanders) at a 26.8% Trump lead, which still translates into a 100% chance of Trump winning Utah.

(And for the record, Trump would lead Booker by 25.6%, also a 100% chance of Trump winning.)

If we get more Utah polls showing a close race, maybe this will change. But for the moment the weight of the historical averages means we treat this Y2 poll with extreme skepticism, and Utah remains a very very Red state.

And that's where things stand at the beginning of September.

429.2 days until polls start to close.

For more information:

This post is an update based on the data on the Election Graphs Electoral College 2020 page. Election Graphs tracks a poll-based estimate of the Electoral College. The charts, graphs, and maps in the post above are all as of the time of this post. Click through on any image to go to a page with the current interactive versions of that chart, along with additional details.

Follow @ElectionGraphs on Twitter or Election Graphs on Facebook to see announcements of updates. For those interested in individual poll updates, follow @ElecCollPolls on Twitter for all the polls as I add them. If you find the information in these posts informative or useful, please consider visiting the donation page.

The 2020 Starting Line

Well, here we are. A few months later than I intended, but it is finally time to launch the Election Graphs coverage of Election 2020.

Before I start rolling in the state polls that have already come out, let's look at a more general Democratic vs Republican view based on the last few elections, just as I did four years ago.

Election Graphs uses a five poll average generally (with certain exceptions I won't get into here). When there have not yet been five polls, we use previous election results to "jump start" the poll averages.

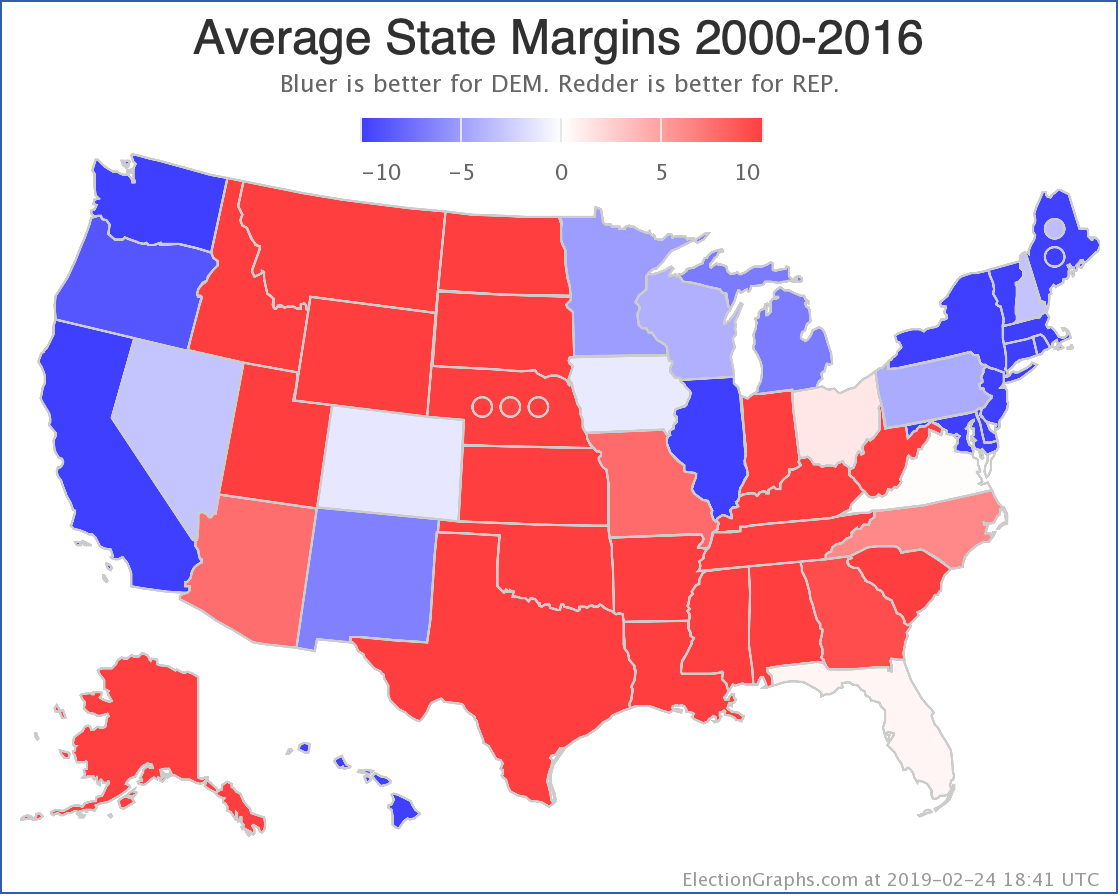
The map above represents the average percentage margins (Republican-Democrat) over the last five election cycles. That would be 2000, 2004, 2008, 2012, and 2016. This is a very long time period. Things look different in 2019 than they did in 2000.

You could argue that just using the 2016 results would be a better starting point, but averaging over a long time period like this to some degree gives us an impression of where states stand independent of the specifics of any one specific election.

Looking at specific states and where those averages are, you get this spectrum:

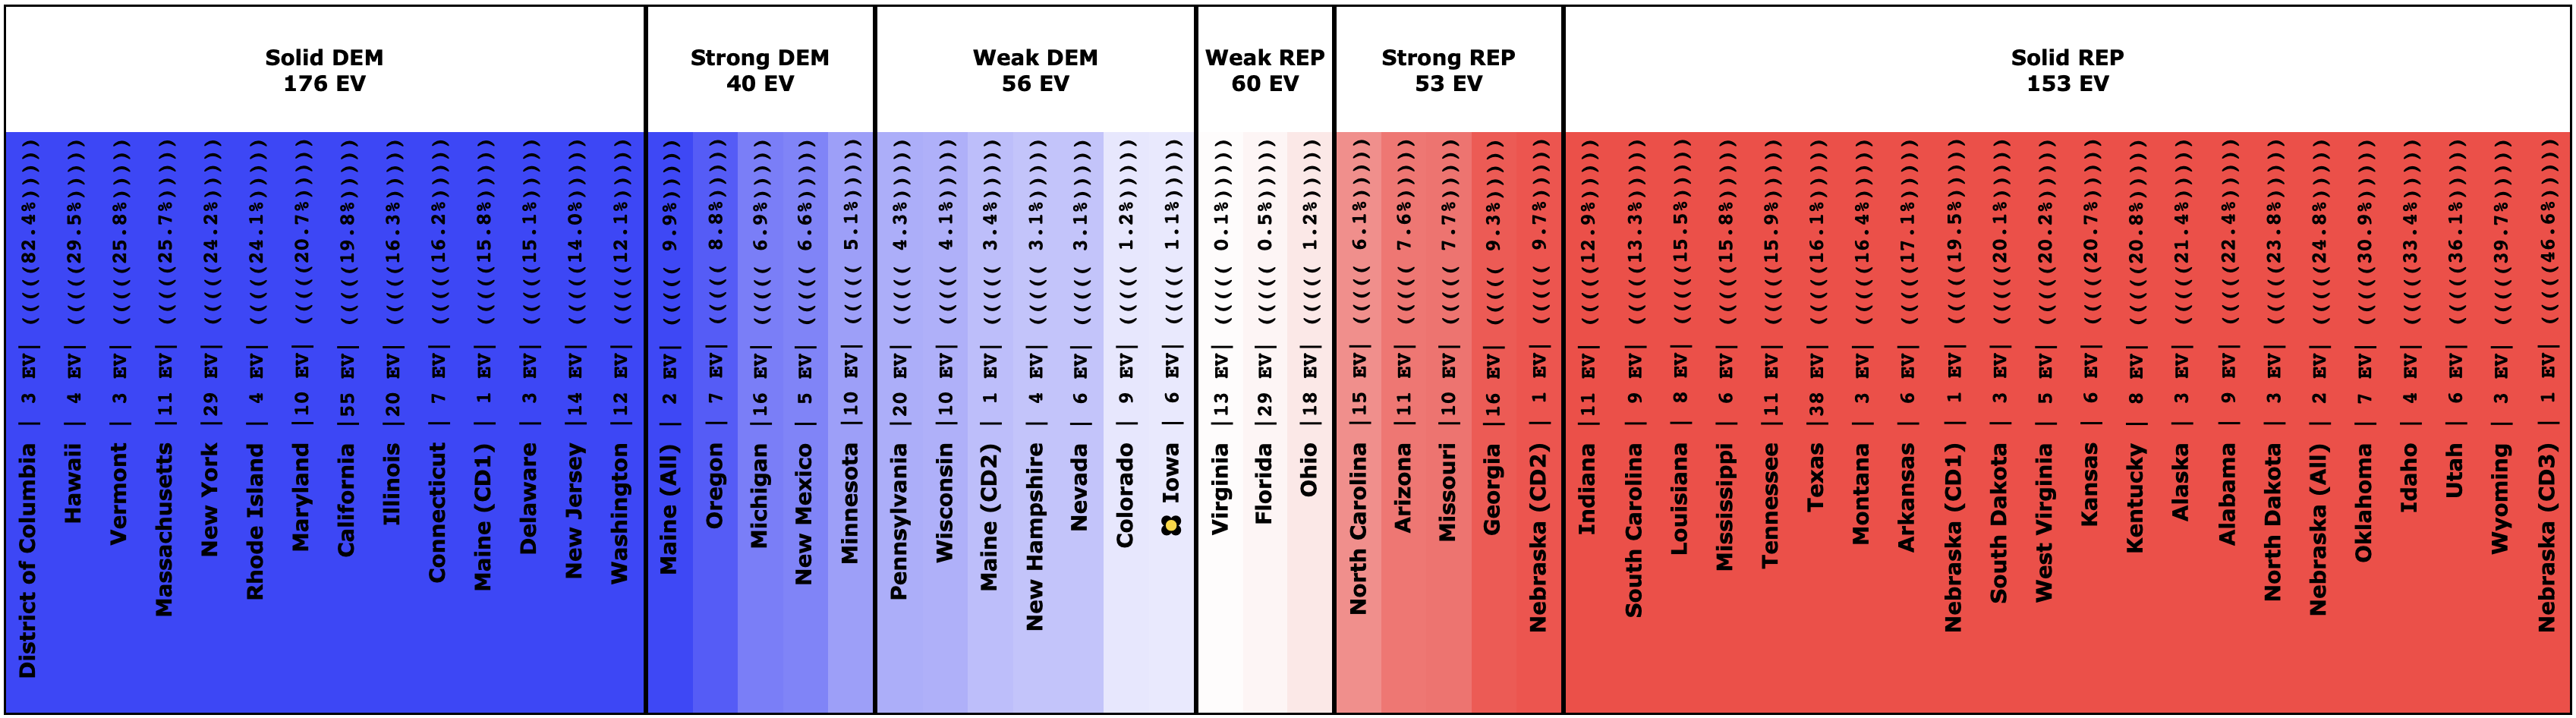
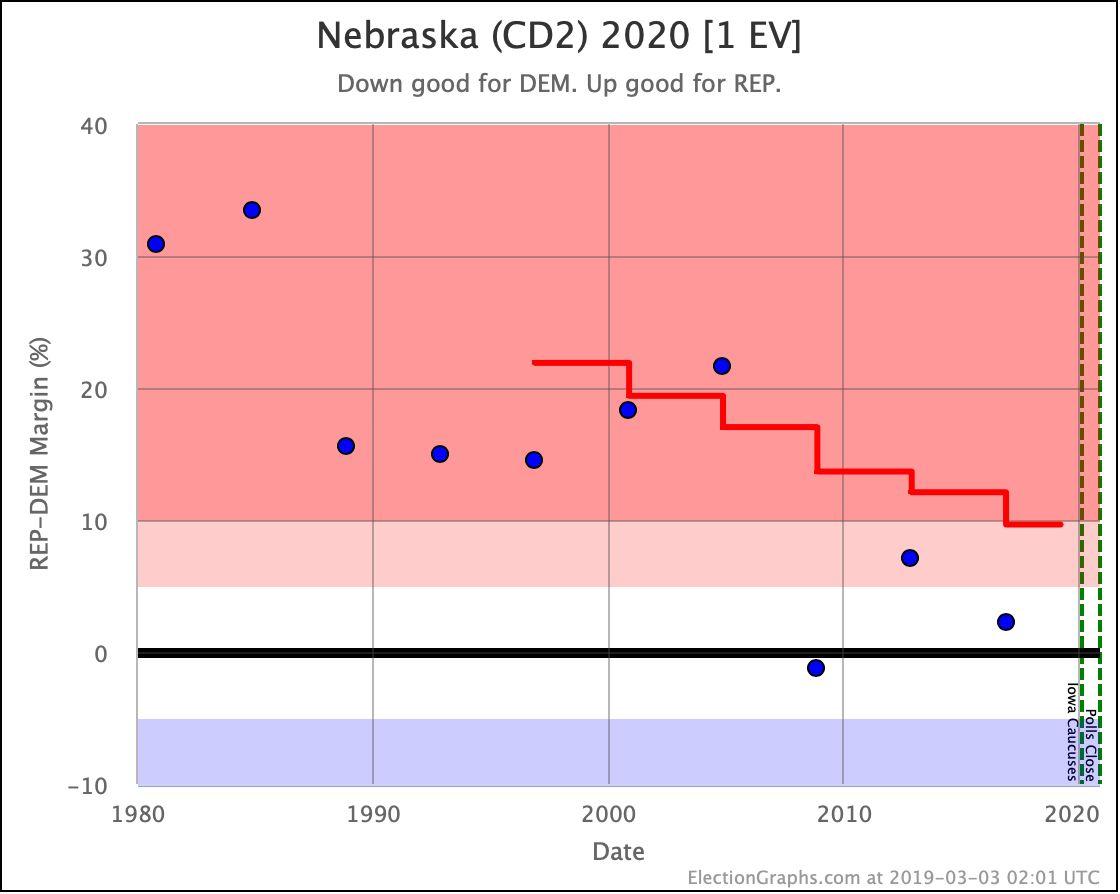
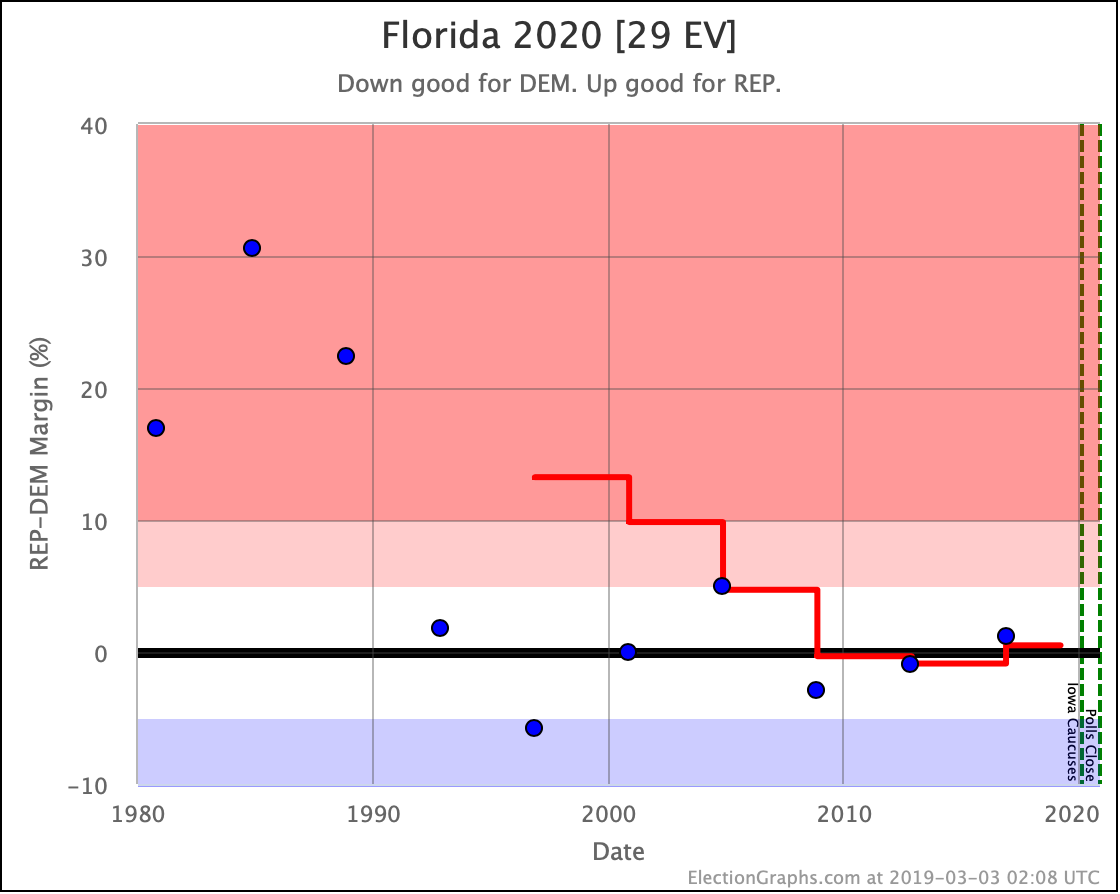
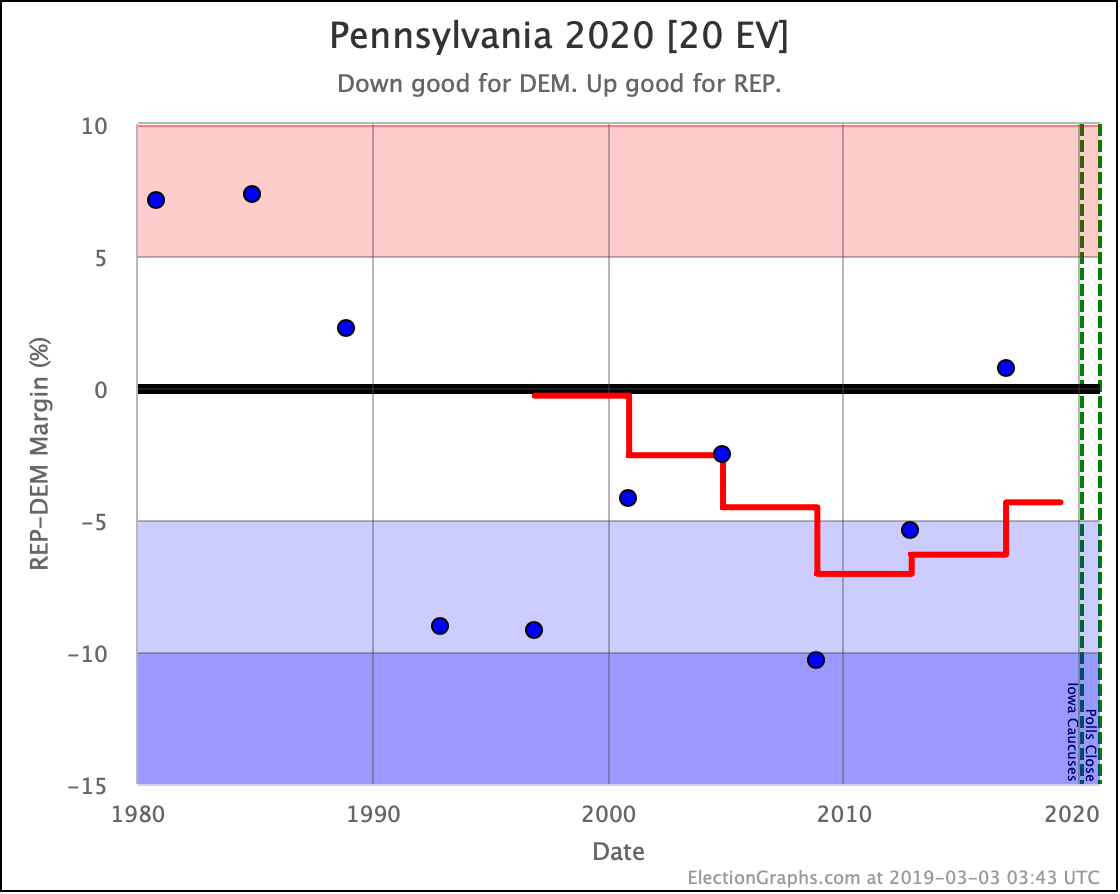
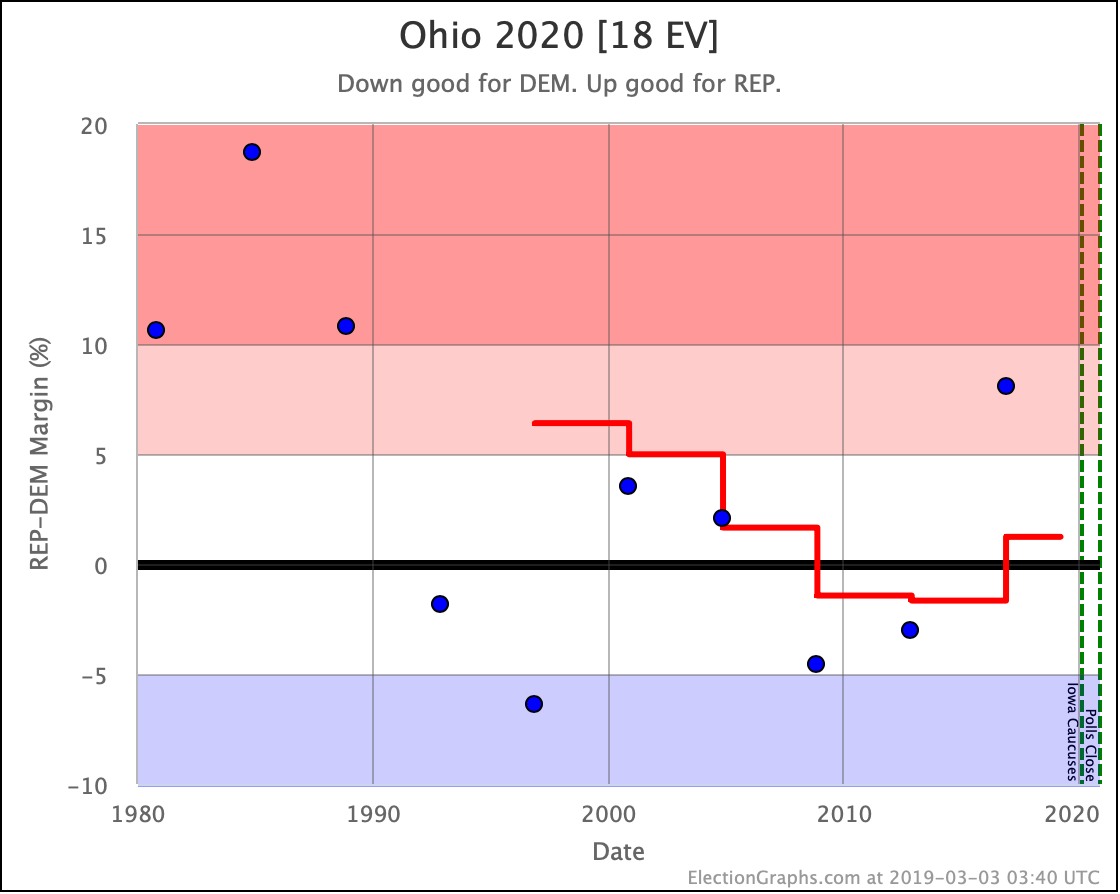
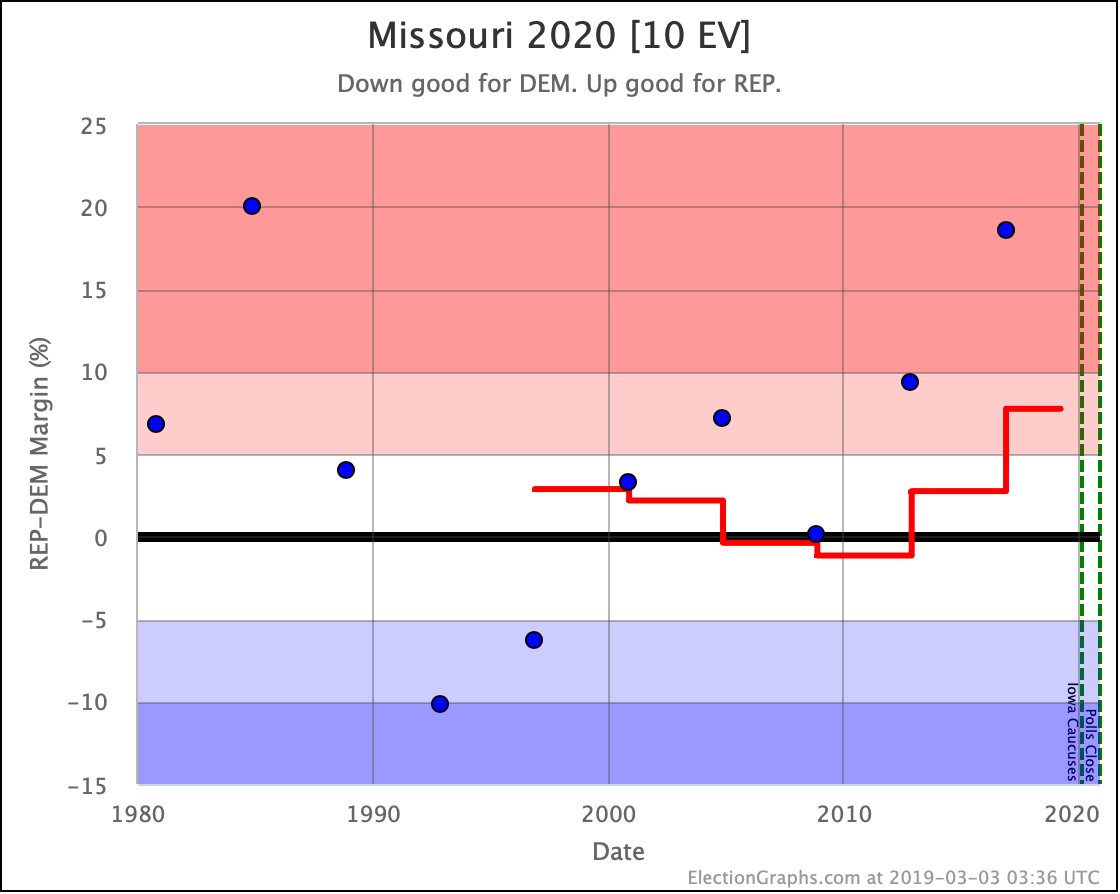
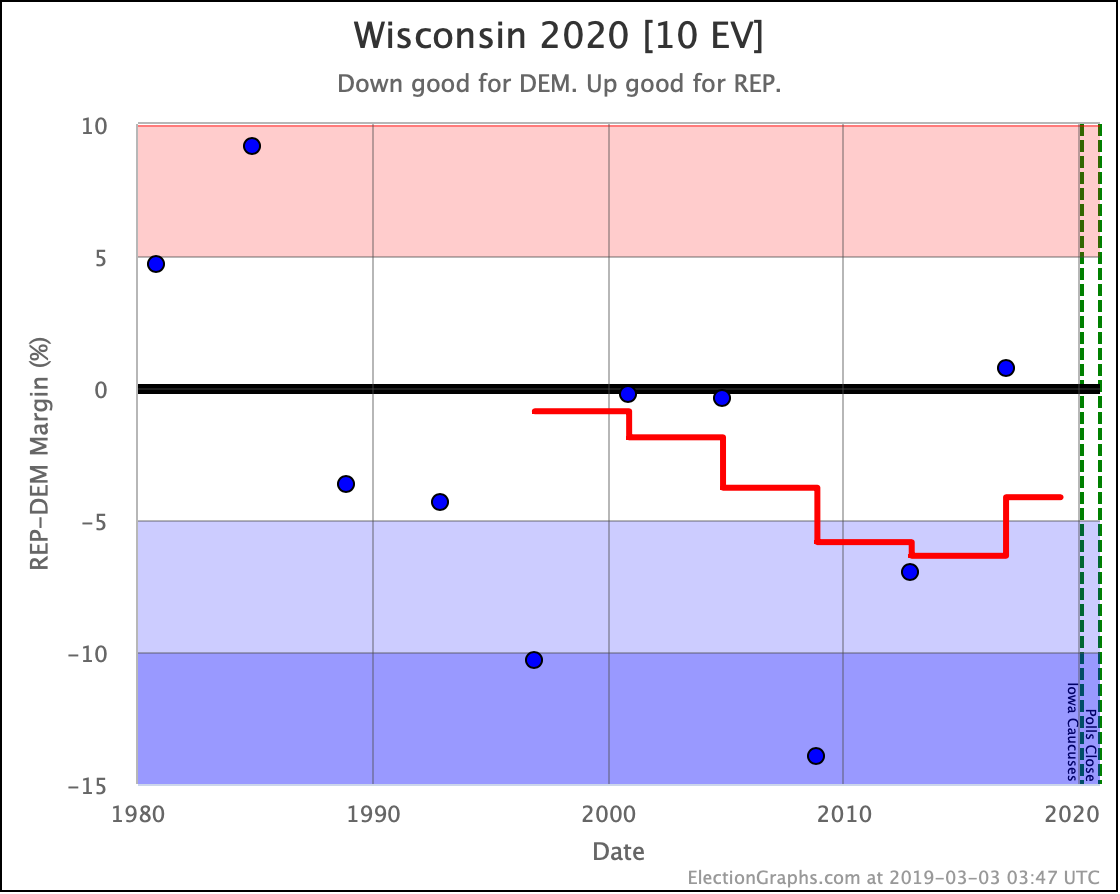
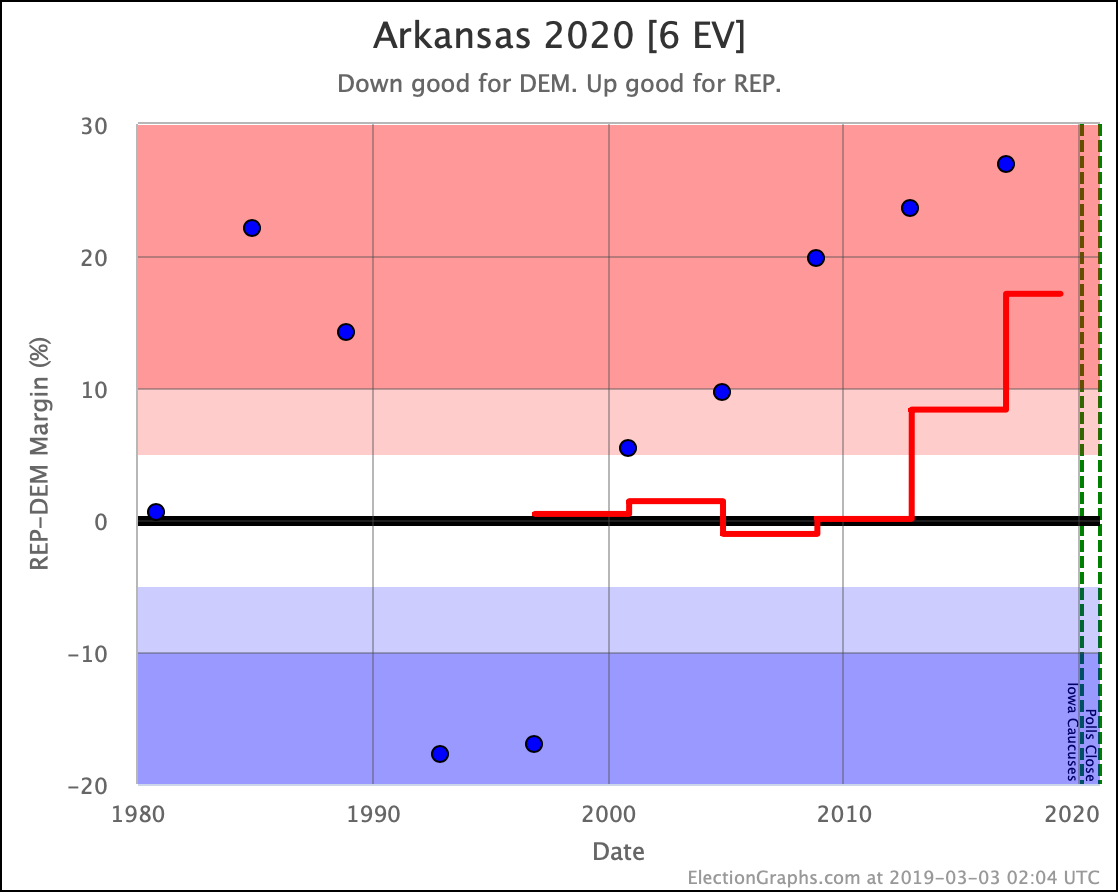
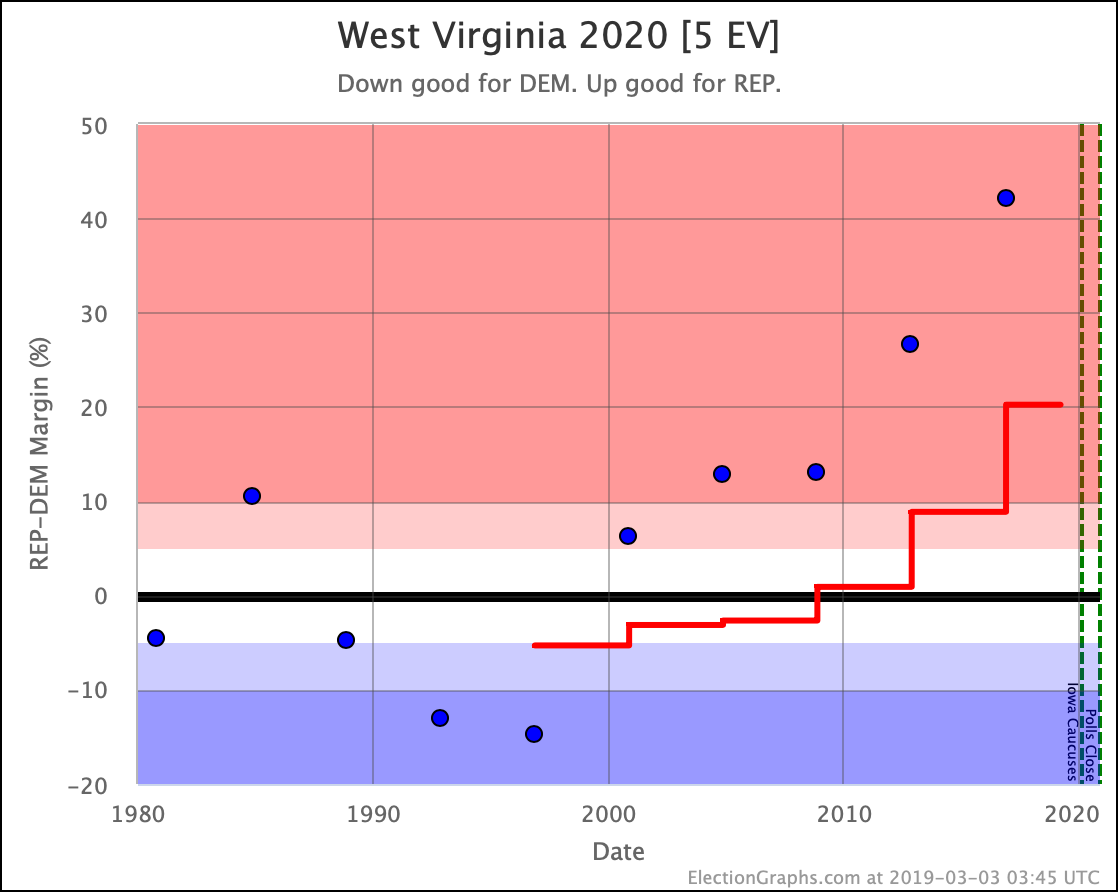
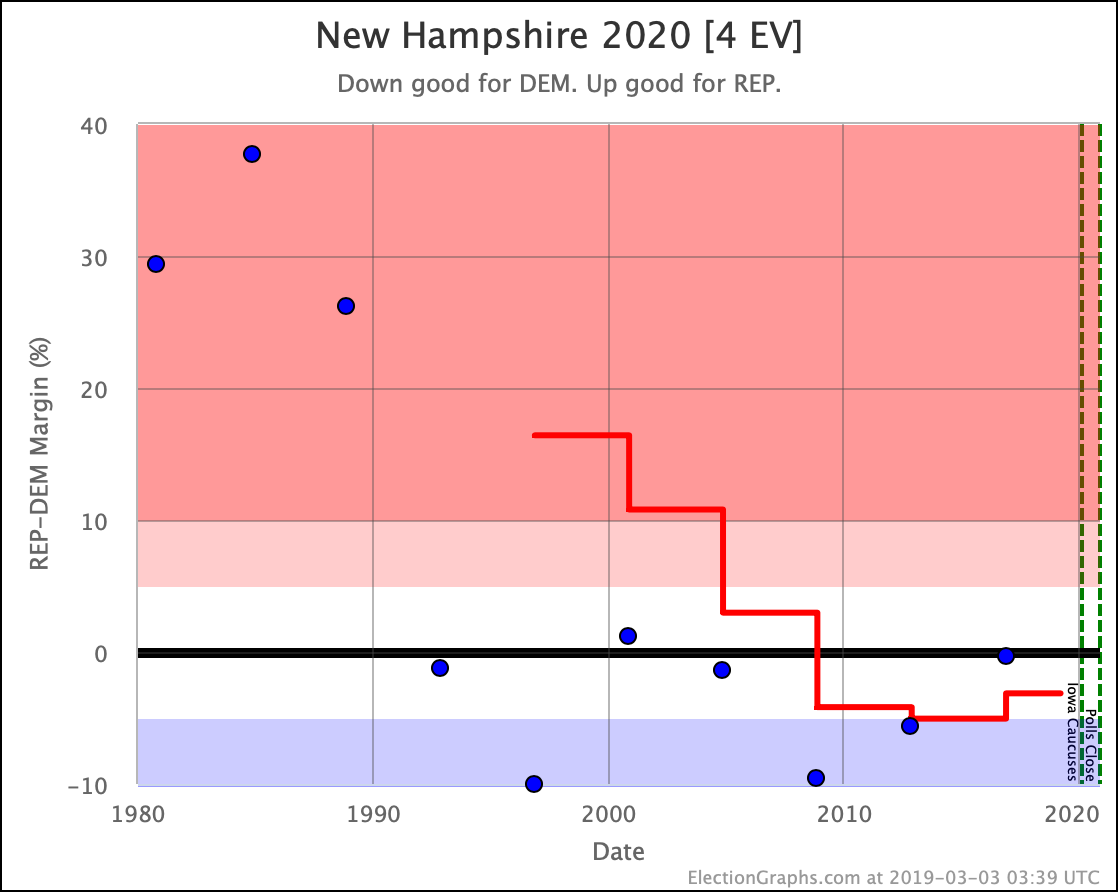
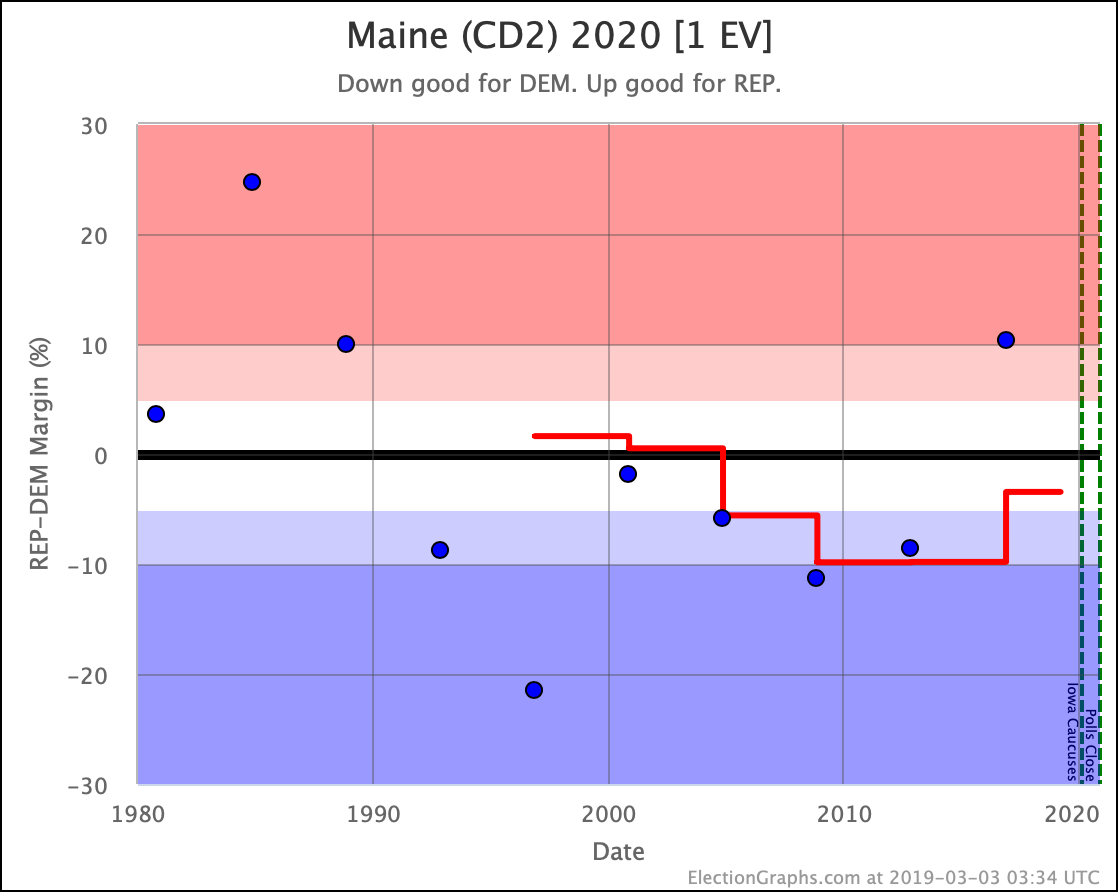
Specifically, let's zoom in and look at the states where the margin in this 5 cycle average is under 10%:

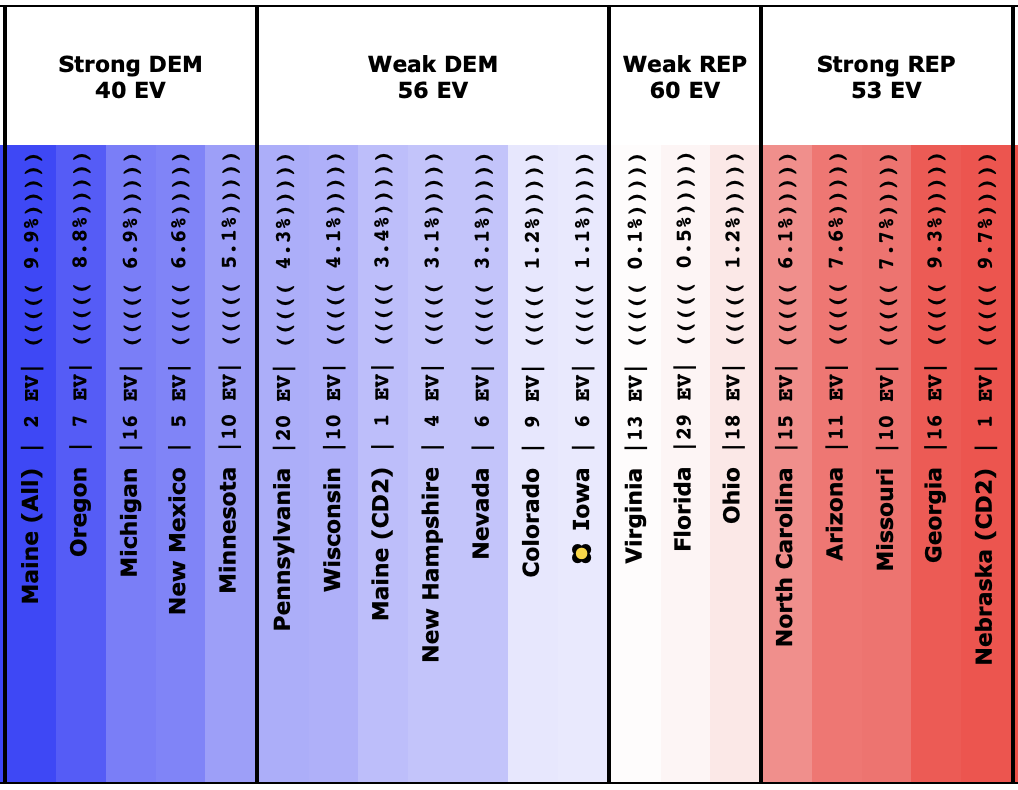
These are the states (and Maine and Nebraska congressional districts) that look like they are in play based on the historical results from 2000 to 2016.

Once we get close to the election, "Strong" states mostly will slip out of reach. (Although Wisconsin was a "Strong Clinton" state and Trump still managed to win it, so it CAN happen, it is just exceedingly rare.) This far out though, just under 612 days until the first election night polls close, this whole zone is potentially up for grabs.

If the right set of events happens, even some states outside of this group may end up becoming competitive. Major changes do happen during presidential campaigns. But here at the beginning, it seems unlikely that any of the states (or CD's) outside of those above will be in play.

Things will move quickly as new polls putting actual candidates against each other get added. But this is the starting line.

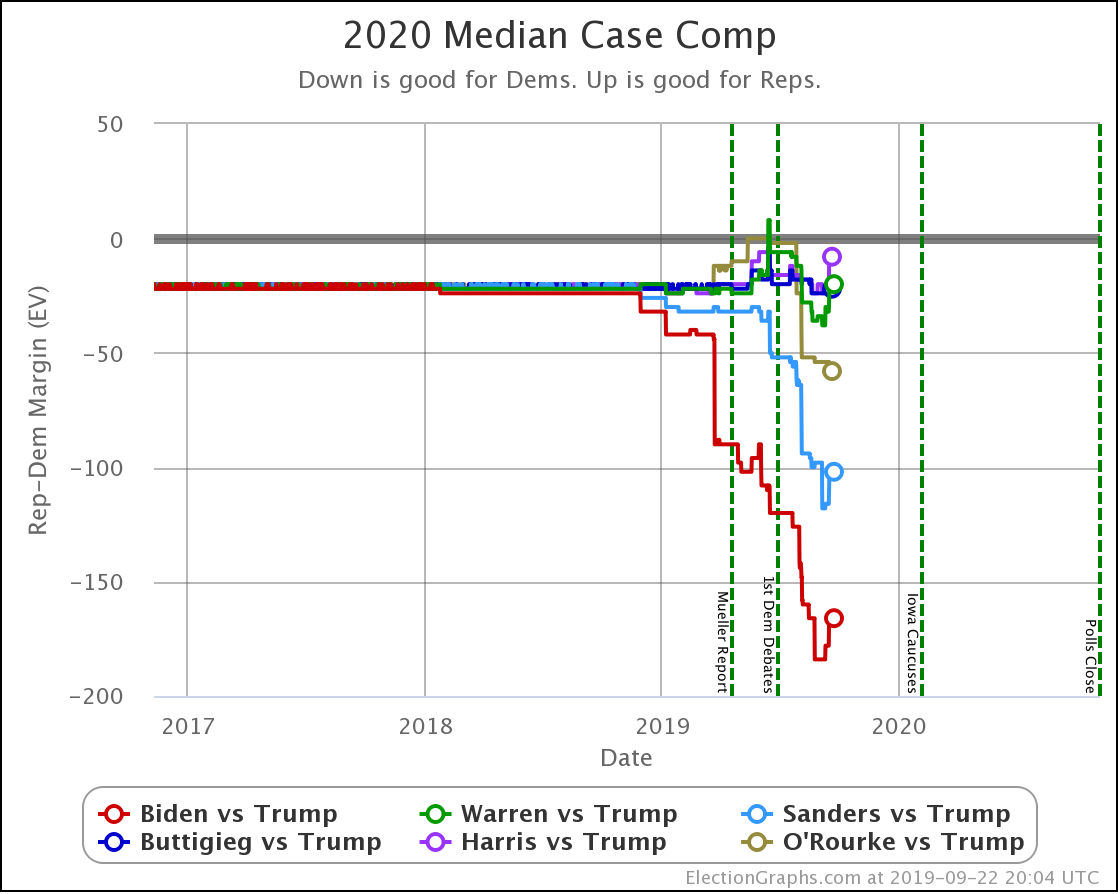
Where does this put us in terms of who might be ahead or behind? Election Graphs traditionally not only shows an electoral college breakdown based on who is ahead in every state but also where things would end up if you let all of the "Weak" states swing to one or the other candidate to generate "Best Case" scenarios for each candidate.

Here is what that looks like at the starting line:

DEM REP Margin
REP Best 216 322 REP by 106 EV
Expected 272 266 DEM by 6 EV
DEM Best 332 206 DEM by 126 EV
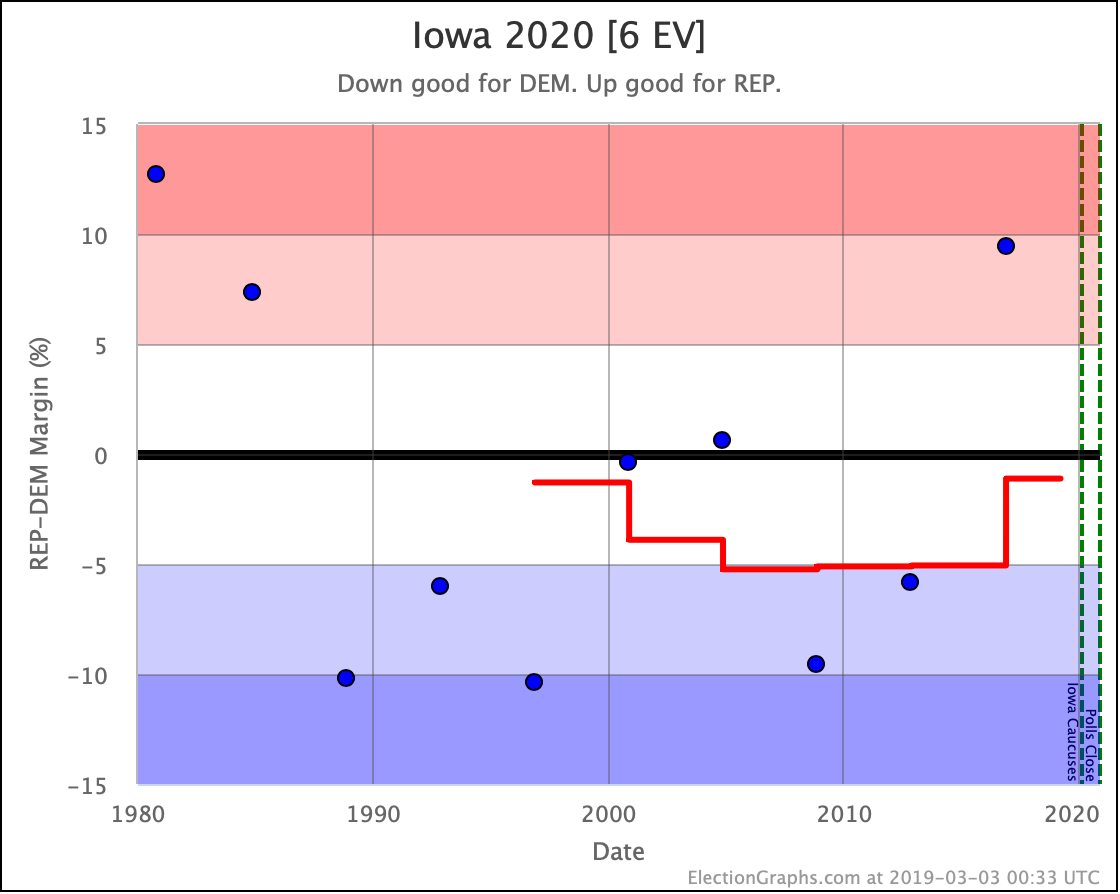
The tipping point state is Iowa where DEM is ahead by 1.1%.

So… we start at essentially a dead heat. The average of the last five elections (three where Republicans won, and two where Democrats won), is a Democratic squeaker. When you throw the "Weak" states from side to side, you get a fairly large range as well.

That's as good a place to start a presidential race as any. Dead even.

Now the specific candidates for 2020 will start differentiating themselves with their campaigns, and they will move this to one side or another… or of course, we can arrive at the election itself with things still too close to call… which is always fun.

Before I close out this post and start adding in actual 2020 polls though, it is worth also looking at how this "five election average" has shifted over the years. I currently have elections back to 1980 entered into the data Election Graphs pulls from, so we can look at these averages back through 1996.

First up, here is the electoral college trend itself:

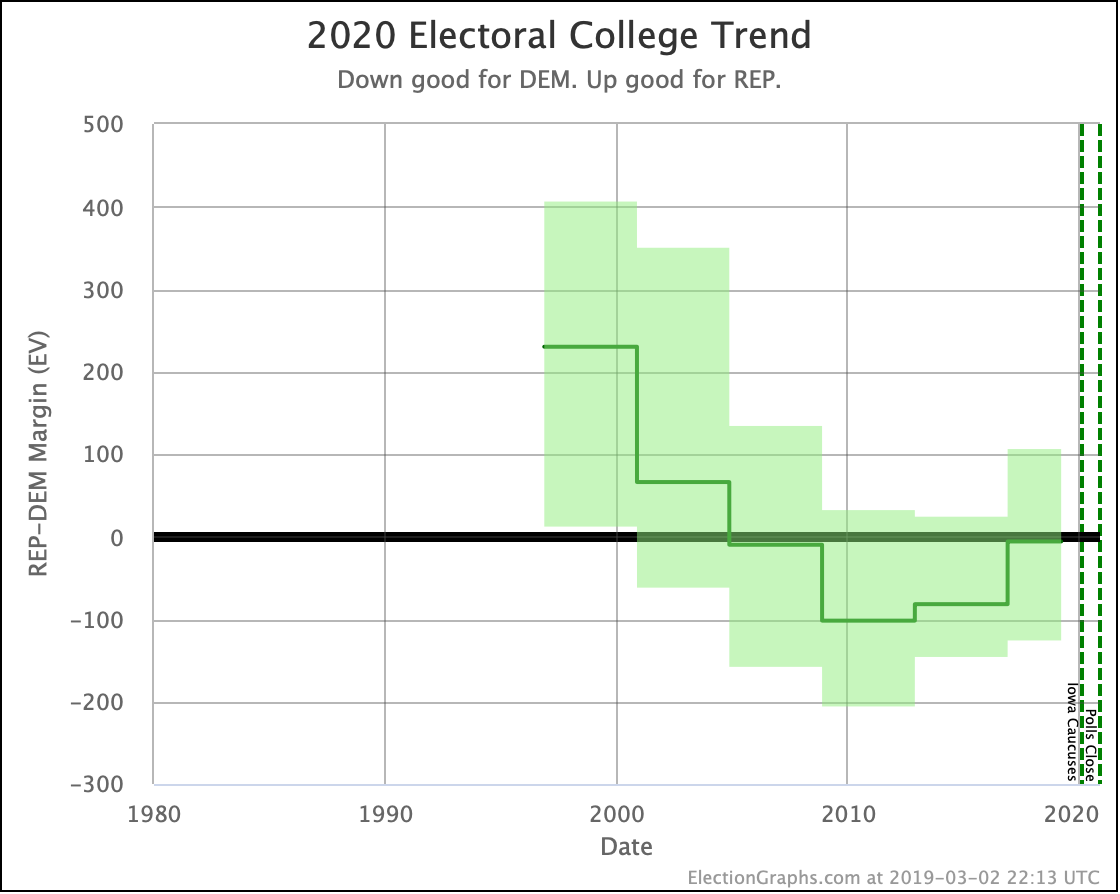
From 1996 through 2008, each election moved the electoral college results based on these averages toward the Democrats… even when the Republicans won… because they won by less than the Republicans from the earlier elections that dropped out of the average.

That stopped in 2012. Obama won in 2012, but not as strongly as Clinton won in 1992, which dropped off the five election average that year.

Then Trump won in 2016, which was obviously a more Republican result than Clinton winning in 1996.

2016 also reversed another trend, which was that the electoral college totals of the states that were closer than 5% had been going down with each election. In other words, there were fewer close states each time. But dropping 1996 and adding 2016 expanded the range between "best case" scenarios a bit. We have a wider playing field going into 2020 than we did going into 2016.

Next, the tipping point:

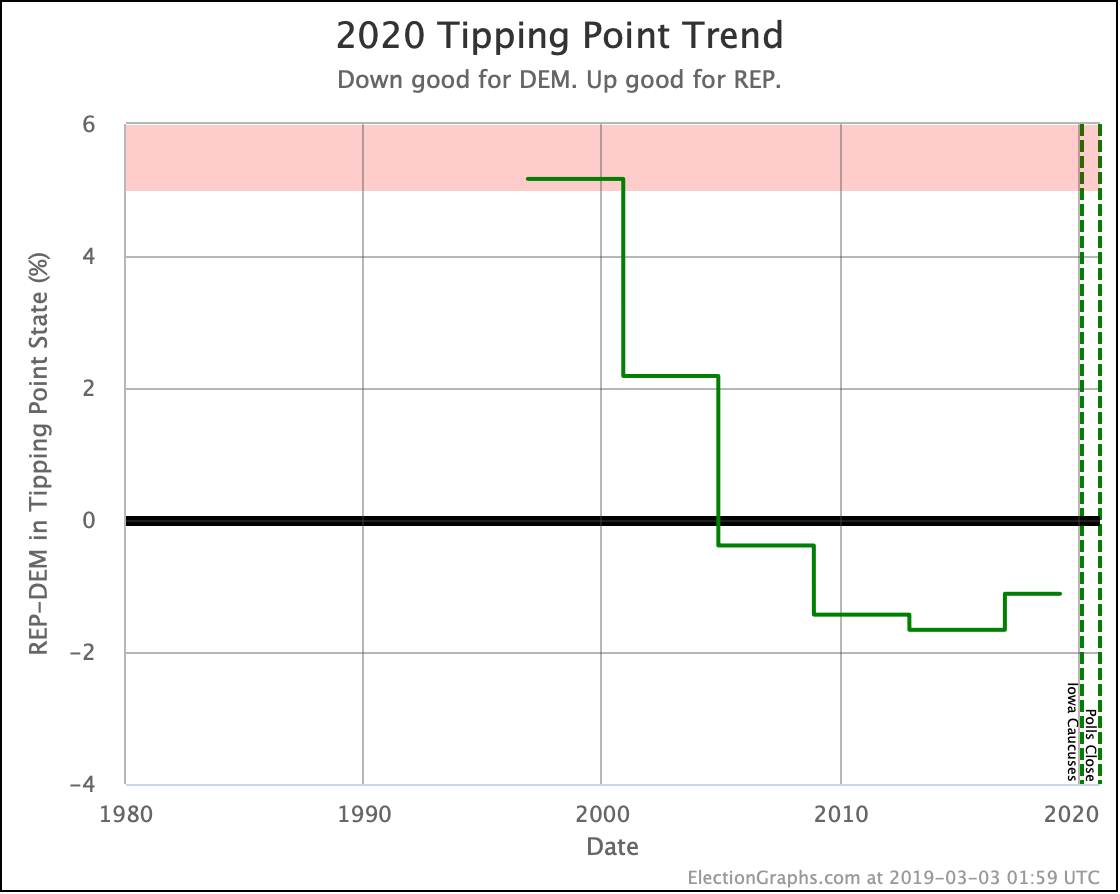
This basically shows the same pattern, so I won't spend time digging deeper there.

But there is one more place to spend a little time. Time to look at how each state moved from the 1996-2012 average to the 2000-2016 average.

Let's start this historical review with an animation of the national view flipping between how things looked four years ago, and how they look today:

As expected, since we are replacing Clinton's 1996 win with Trump's 2016 win, the overall map becomes redder and blue retreats.

Now let's look at individual states that moved to different Election Graphs categories ("Solid", "Strong", "Weak" for either party) in this change.

Of these category changes, only two favored the Democrats:

Every other category change was toward the Republicans:

All of the states moved of course. The ones highlighted here are just the ones that shifted between my categories. And of course, many of those were not decisive. But the shift toward the Republicans is clear.

The stage is set.

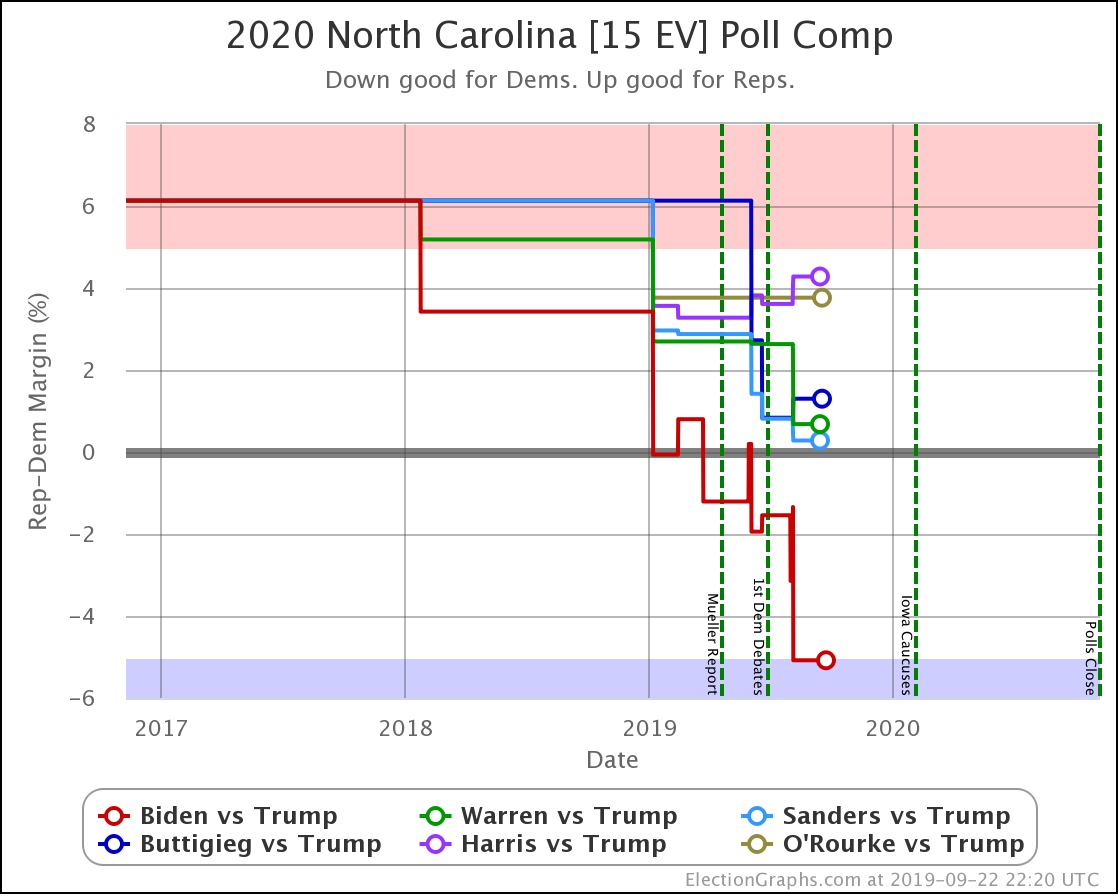
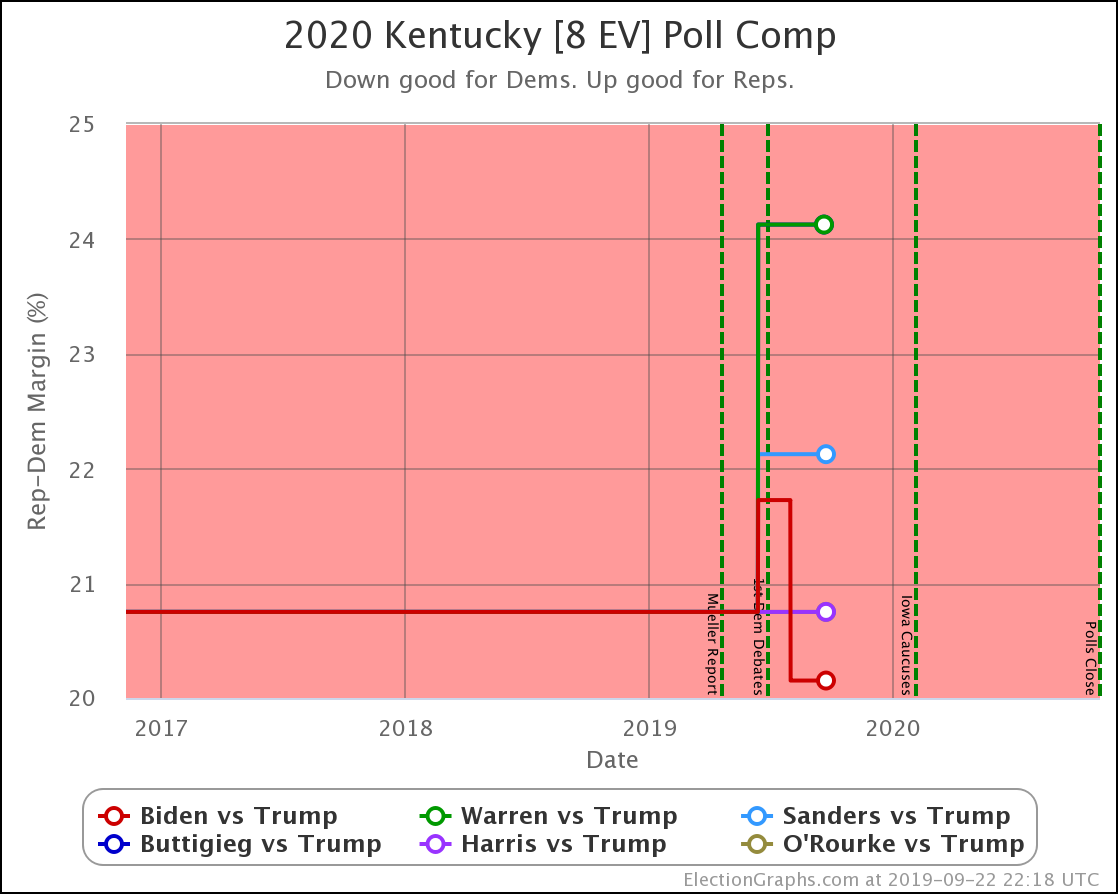
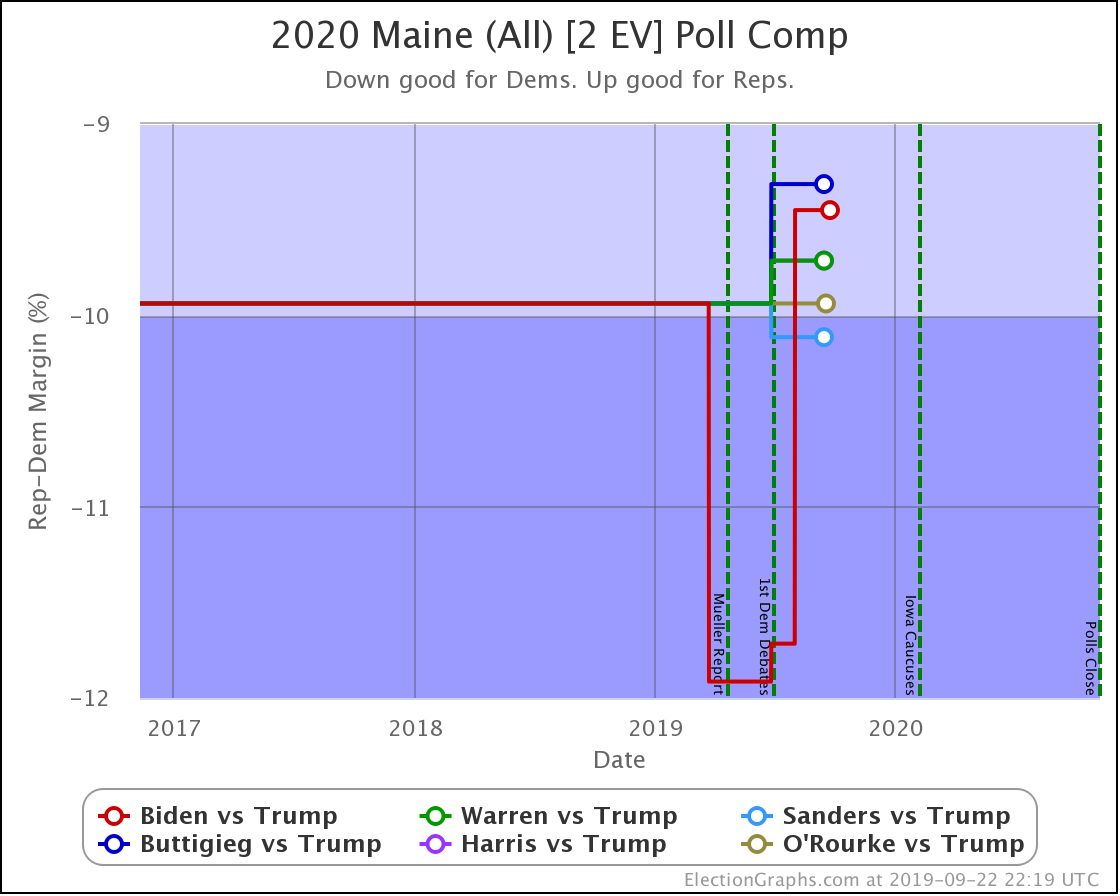
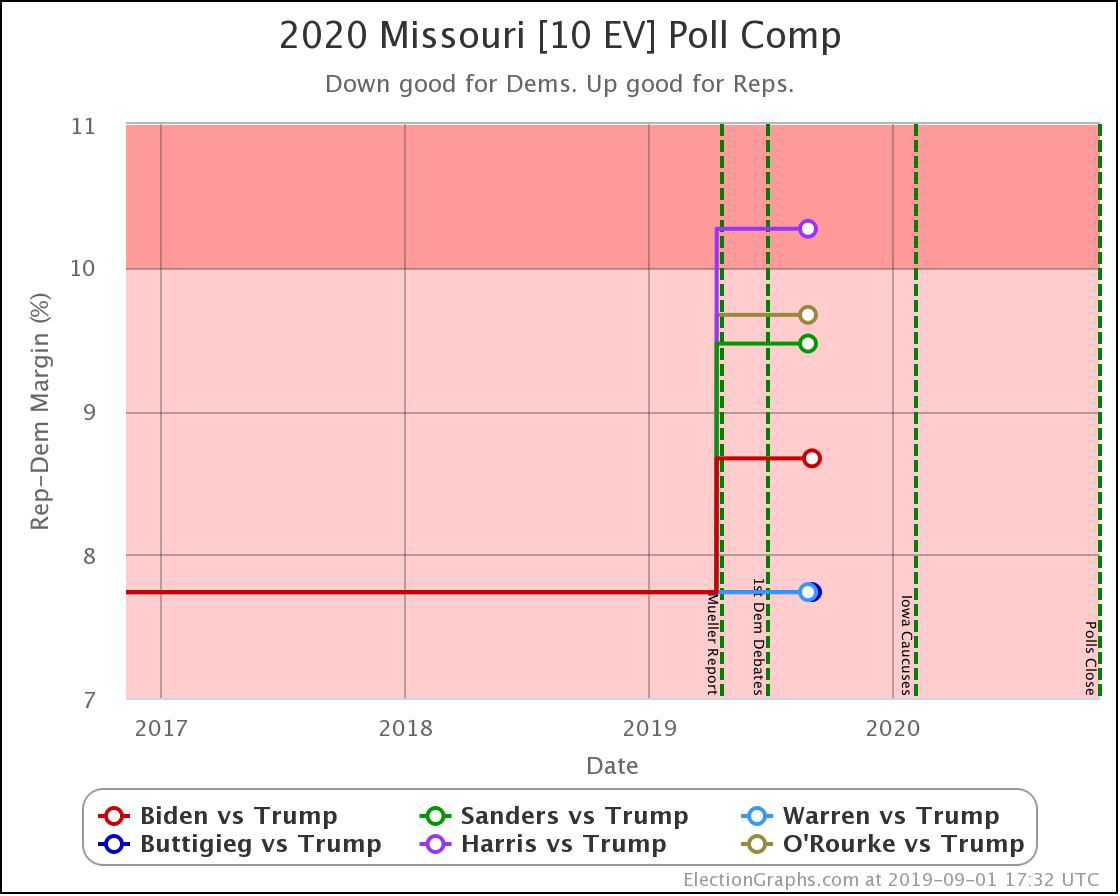
Next up, very soon, I'll start folding in the polls on specific candidate matchups that have already been released on the state level, and we'll see how things look once we are looking at real data on the 2020 race rather than just long term generic averages.

The race is on, and Election Graphs will be tracking it for you.

Here we go.