Since last week's update, there has been new polling in Missouri, Michigan, and Utah.
The only category change coming out of this was that in a Harris vs. Trump race Missouri moves from Strong Trump (a 5% to 10% Trump lead) to Solid Trump (a greater than 10% Trump lead).
Looking more generally, the Democrats improve their leads in Michigan, Missouri looks redder than it did before, and Utah is still bright red but a little less so.
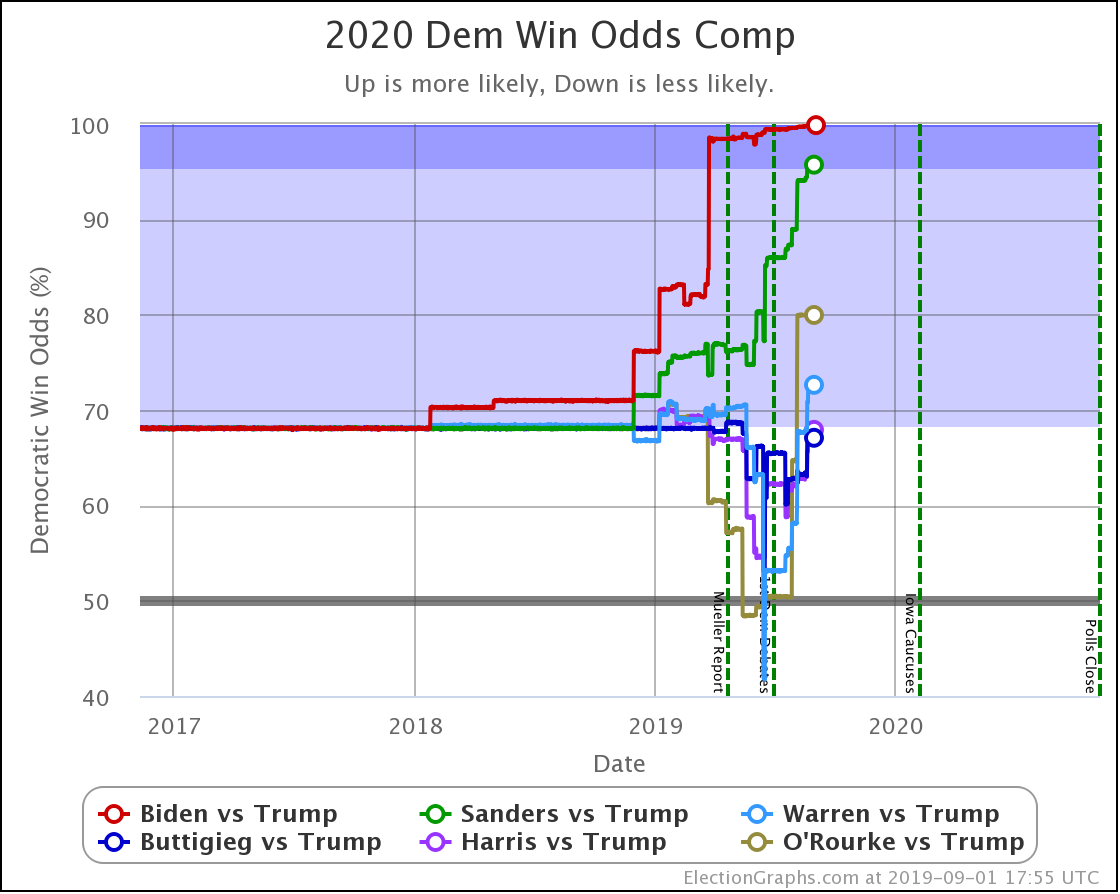
Looking at a national level, Harris, Warren, and Sanders improve their win probabilities against Trump in the probabilistic view. Everyone else is flat.
| Dem | 25 Aug | 1 Sep | 𝚫 |
| Biden | 99.9% | 99.9% | Flat |
| Sanders | 95.5% | 95.7% | +0.2% |
| O'Rourke | 80.0% | 80.0% | Flat |
| Warren | 71.0% | 72.6% | +1.6% |
| Harris | 65.8% | 67.9% | +2.1% |
| Buttigieg | 67.1% | 67.1% | Flat |
Now, let's look at the three states with new polls:
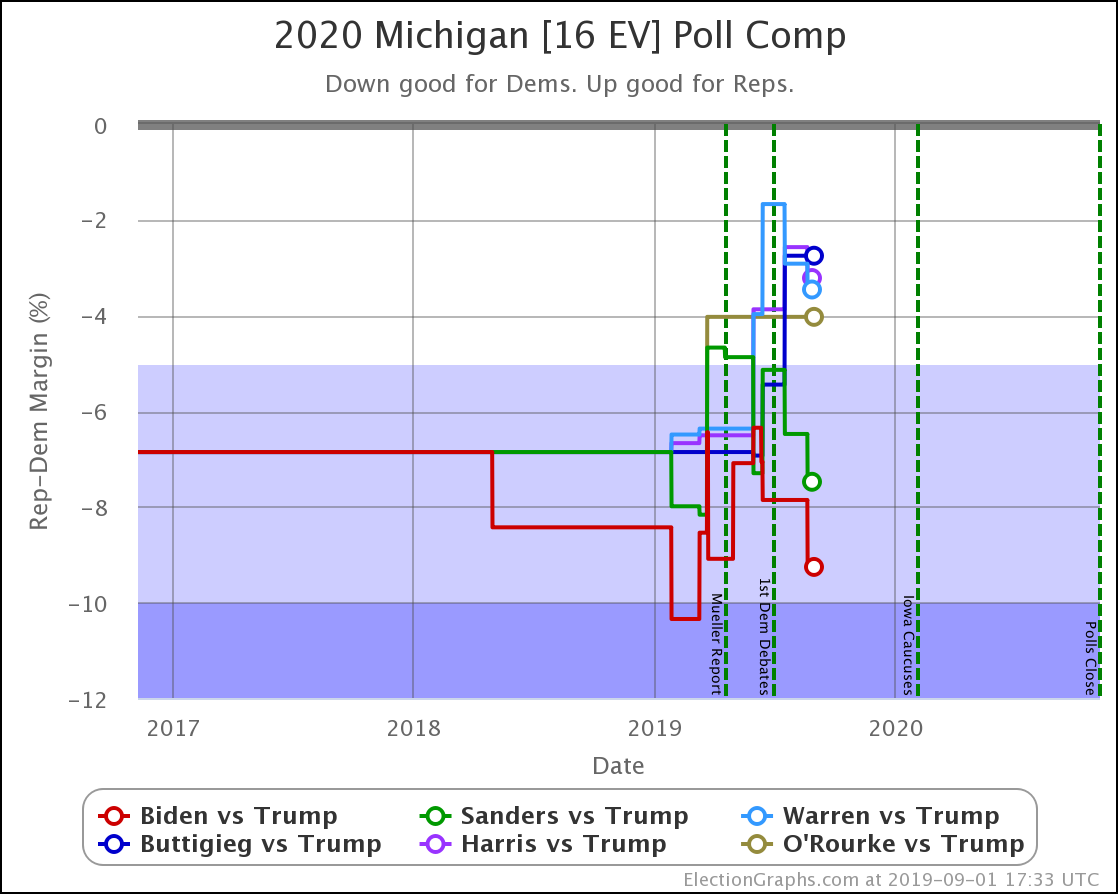
Biden and Sanders improve their polling averages noticeably with this new polling from EPIC-MRA. Warren and Harris also improve slightly. EPIC-MRA did not poll Buttigieg and O'Rourke.
Bottom line, Biden and Sanders continue to be in a position to easily win Michigan. The others are all leading, but narrowly, and the state would very much be in play.
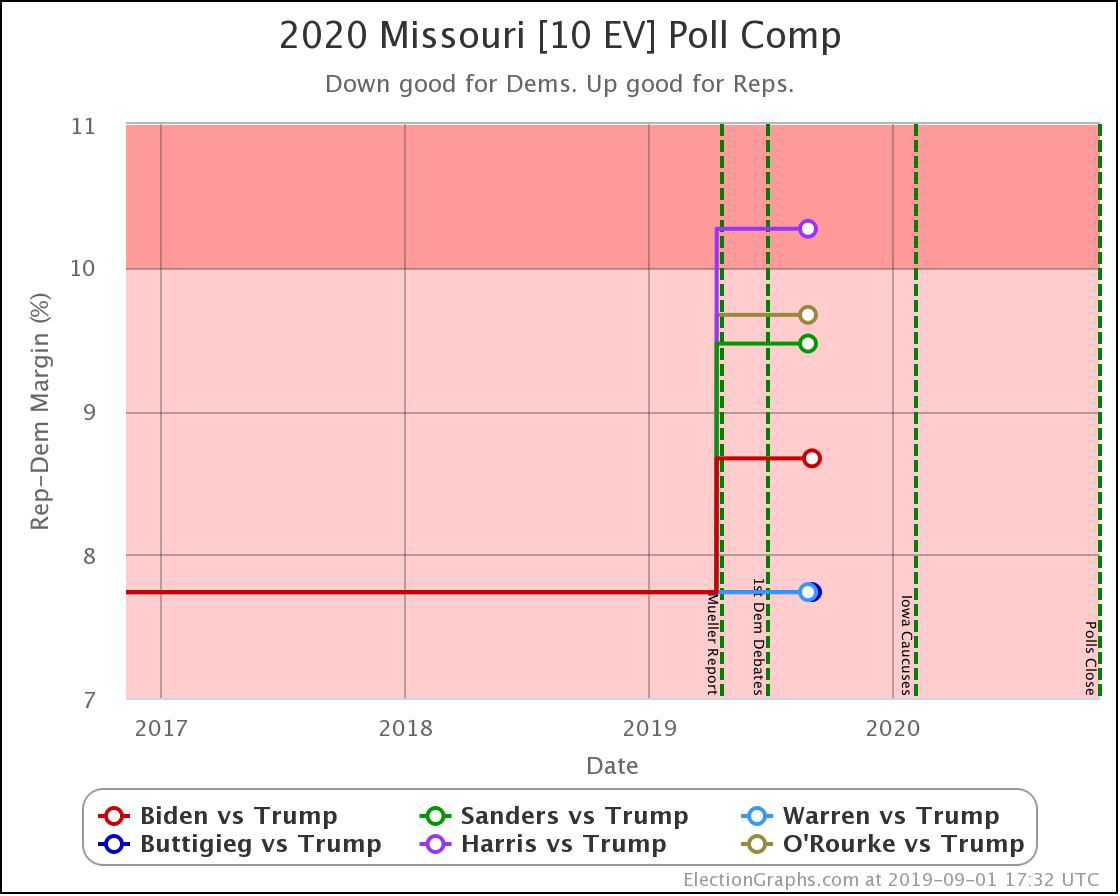
This is the first 2020 polling for Missouri. RRG polled Biden, Sanders, O'Rourke, and Harris. It is actually an old poll from April, but it was new to Election Graphs this week.
In all four cases the averages moved in the Republican direction.
This first set of Missouri polling ranged from an 8% Trump win (against Biden) to a 16% Trump win (against Harris). Only one poll so far, but it isn't looking like Missouri is one of those red states that is getting less red.
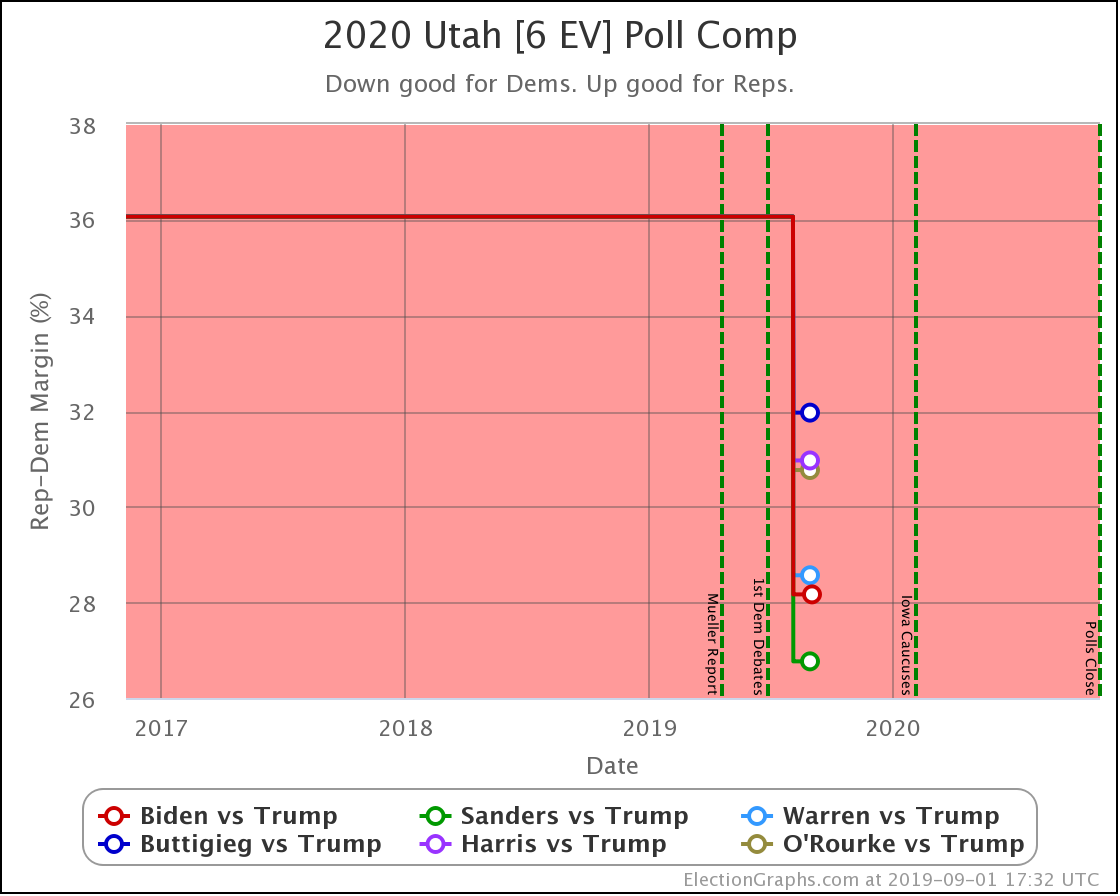
Utah, on the other hand, does look like a red state that might be getting a little less red. Maybe.
The first 2020 polling for Utah is from Y2 Analytics, and the sample sizes on their head-to-head matches are extraordinarily small (from 140 to 153), so you should take them with a massive pile of salt.
The average of the margins in Utah from 2000 to 2016 is a 36.1% Republican victory. Utah has not gone Democratic since Lyndon Johnson's 1964 landslide over Barry Goldwater. Utah is a VERY red state.
This new poll shows a range of results in our top six candidates from Sanders winning by 6%, to Buttigieg losing by 20%. Biden and Warren were within the margin of error of winning too.
Even that Buttigieg loss does better than the historical average. But Sanders WINNING? That is a very surprising result for Utah.
And, while he is not in the six most polled candidates against Trump, so we wouldn't usually mention it, Y2 also polled Booker against Trump, and had Booker beating Trump by 12%!
Frankly, these Utah results are tough to believe. It would take a lot more than one poll to make it reasonable to think that Utah was competitive for ANY of the Democratic candidates, let alone that one of them was leading by double digits.
Which is of course why you look at averages, not at individual polls. This Y2 poll when averaged in with the 2004 to 2016 elections, is enough for Election Graphs to put the poll average for the best of our six Democrats (Sanders) at a 26.8% Trump lead, which still translates into a 100% chance of Trump winning Utah.
(And for the record, Trump would lead Booker by 25.6%, also a 100% chance of Trump winning.)
If we get more Utah polls showing a close race, maybe this will change. But for the moment the weight of the historical averages means we treat this Y2 poll with extreme skepticism, and Utah remains a very very Red state.
And that's where things stand at the beginning of September.
429.2 days until polls start to close.
For more information:
This post is an update based on the data on the Election Graphs Electoral College 2020 page. Election Graphs tracks a poll-based estimate of the Electoral College. The charts, graphs, and maps in the post above are all as of the time of this post. Click through on any image to go to a page with the current interactive versions of that chart, along with additional details.
Follow @ElectionGraphs on Twitter or Election Graphs on Facebook to see announcements of updates. For those interested in individual poll updates, follow @ElecCollPolls on Twitter for all the polls as I add them. If you find the information in these posts informative or useful, please consider visiting the donation page.