
Changes to the Election Graphs analysis based on a new poll from Emerson in Iowa:
- Booker vs. Trump replaces Harris vs. Trump in the Election Graphs "five best-polled candidate matchups" group that we'll spend time talking about here on the blog.
- Sanders vs. Trump tipping point change: Sanders by 0.9% in IA -> Sanders by 1% in IA
- Booker vs. Trump tipping point change: Booker by 1.1% in IA -> Booker by 0.3% in IA
With these updates, the overall picture we have described here in previous posts remains the same. Biden is doing better against Trump than the other Democrats.
Looking at the tipping point since that is what changed with this update…
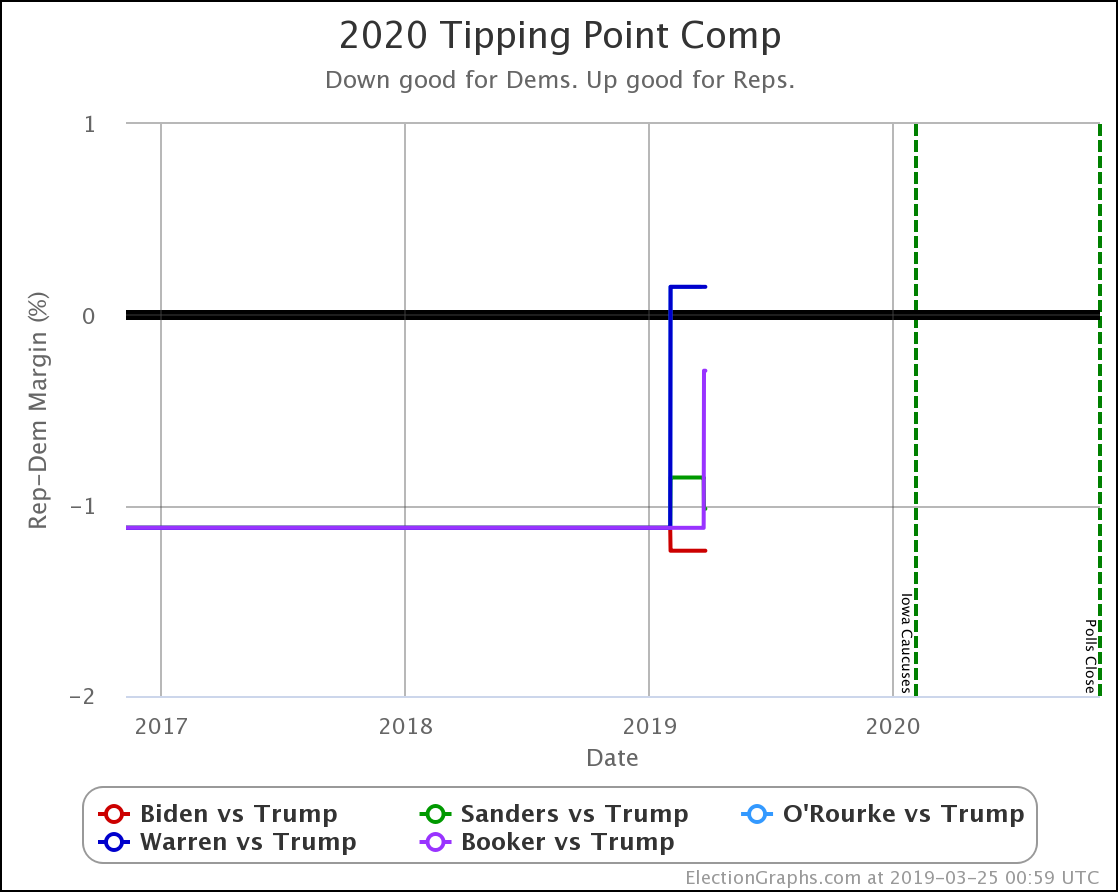
At the moment Biden leads Trump by 1.2% in the tipping point metric, Sanders leads by 1.0%, and Booker leads by 0.3%.
Warren and O'Rourke both trail Trump by 0.1%.
And specifically in Iowa:
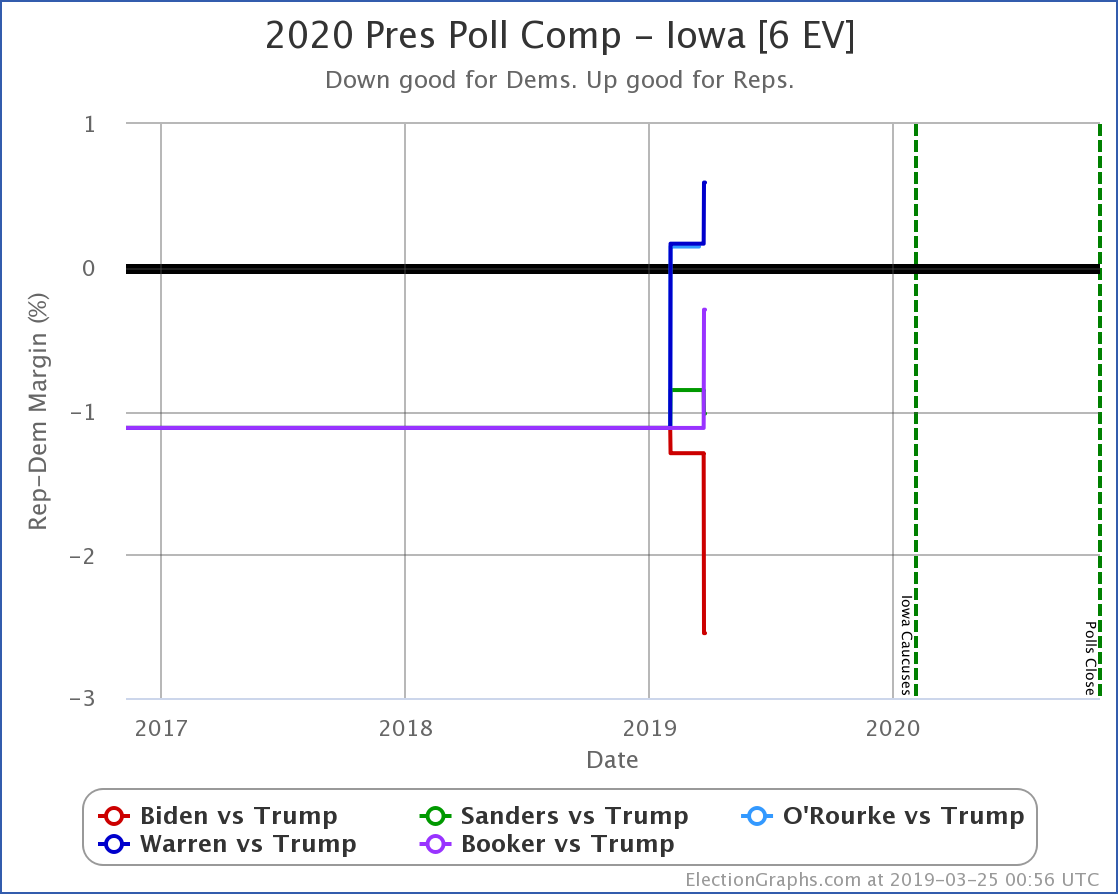
With this new poll, Biden's lead over Trump in the Election Graphs Iowa average increases from 1.2% and Sanders improves by 0.1%.
Meanwhile, Warren falls further behind Trump by 0.4%, and Booker's lead drops by 0.8%.
Emerson didn't poll O'Rourke this time, so no change there.
Once again, as with the national picture, Biden does better than the other Democrats against Trump.
It is important to note though that in both Iowa and the country as a whole, the numbers so far continue to show an exceptionally close race. Biden's 1.2% tipping point lead is less than the 1.6% tipping point lead Clinton had on election day 2016.
And we still have incredibly sparse data. Biden vs. Trump has the best polling, and even in that matchup only 9 out of 56 jurisdictions that determine electoral votes have been polled at all, and none have had more than three polls. So the Election Graphs numbers are still mostly based on prior election history rather than actual 2020 polling.
But with the state polls so far, mirroring the primary polling we have seen, the theme, for now, is that Biden does best, followed by Sanders, with others trailing significantly. The Biden/Sanders advantage is likely still driven primarily by name recognition, but as the year progresses, that will be less and less of a factor.
589.9 days left until election day polls start to close.
For more information:
This post is an update based on the data on the Election Graphs Electoral College 2020 page. Election Graphs tracks a poll-based estimate of the Electoral College. The charts, graphs, and maps in the post above are all as of the time of this post. Click through on any image to go to a page with the current interactive versions of that chart, along with additional details.
Follow @ElectionGraphs on Twitter or Election Graphs on Facebook to see announcements of updates. For those interested in individual poll updates, follow @ElecCollPolls on Twitter for all the polls as I add them. If you find the information in these posts informative or useful, please consider visiting the donation page.
One thought on “Iowa Update”