
Since the last update, Firehouse/0ptimus released three new polls in Pennsylvania [20 EV], Michigan [16 EV], and Wisconsin [10 EV] resulting in the following notable changes in Election Graphs status:
- O'Rourke vs. Trump
- Michigan has moved from Strong O'Rourke to Weak O'Rourke
- Trump best case vs. O'Rourke has changed: O'Rourke 216 to Trump 322 -> O'Rourke 200 to Trump 338
Biden vs. Trump was the only other candidate pairing looked at in these polls, but no category or tipping point changes resulted.
Before I show all the relevant graphs, I thought I'd show another comparison for these three candidate pairs. Let's look at the current spectrum of the states:
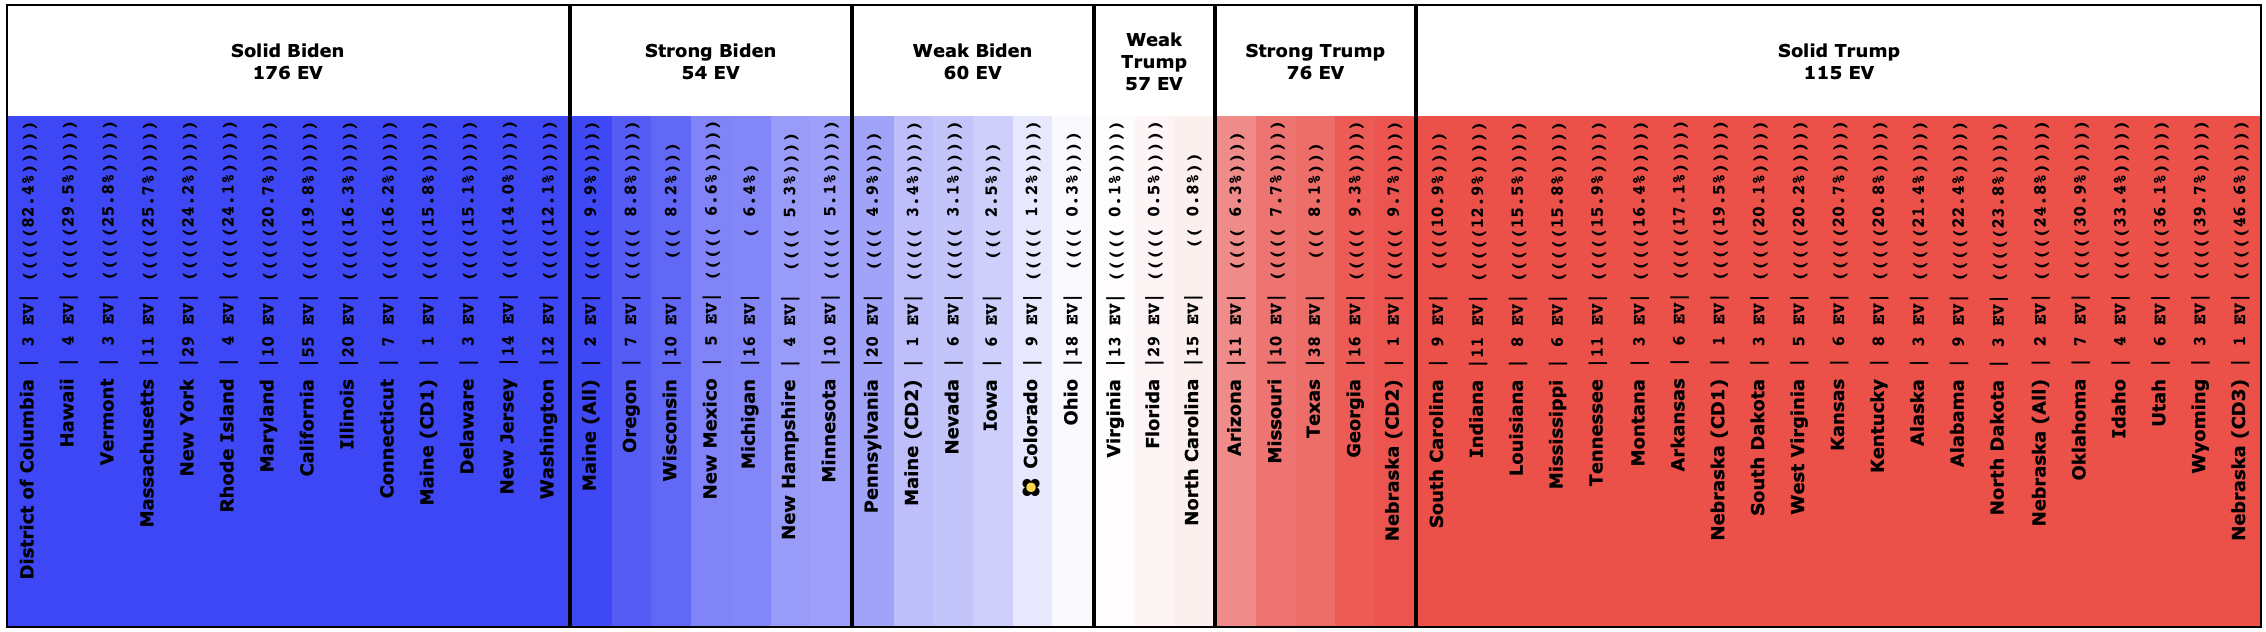

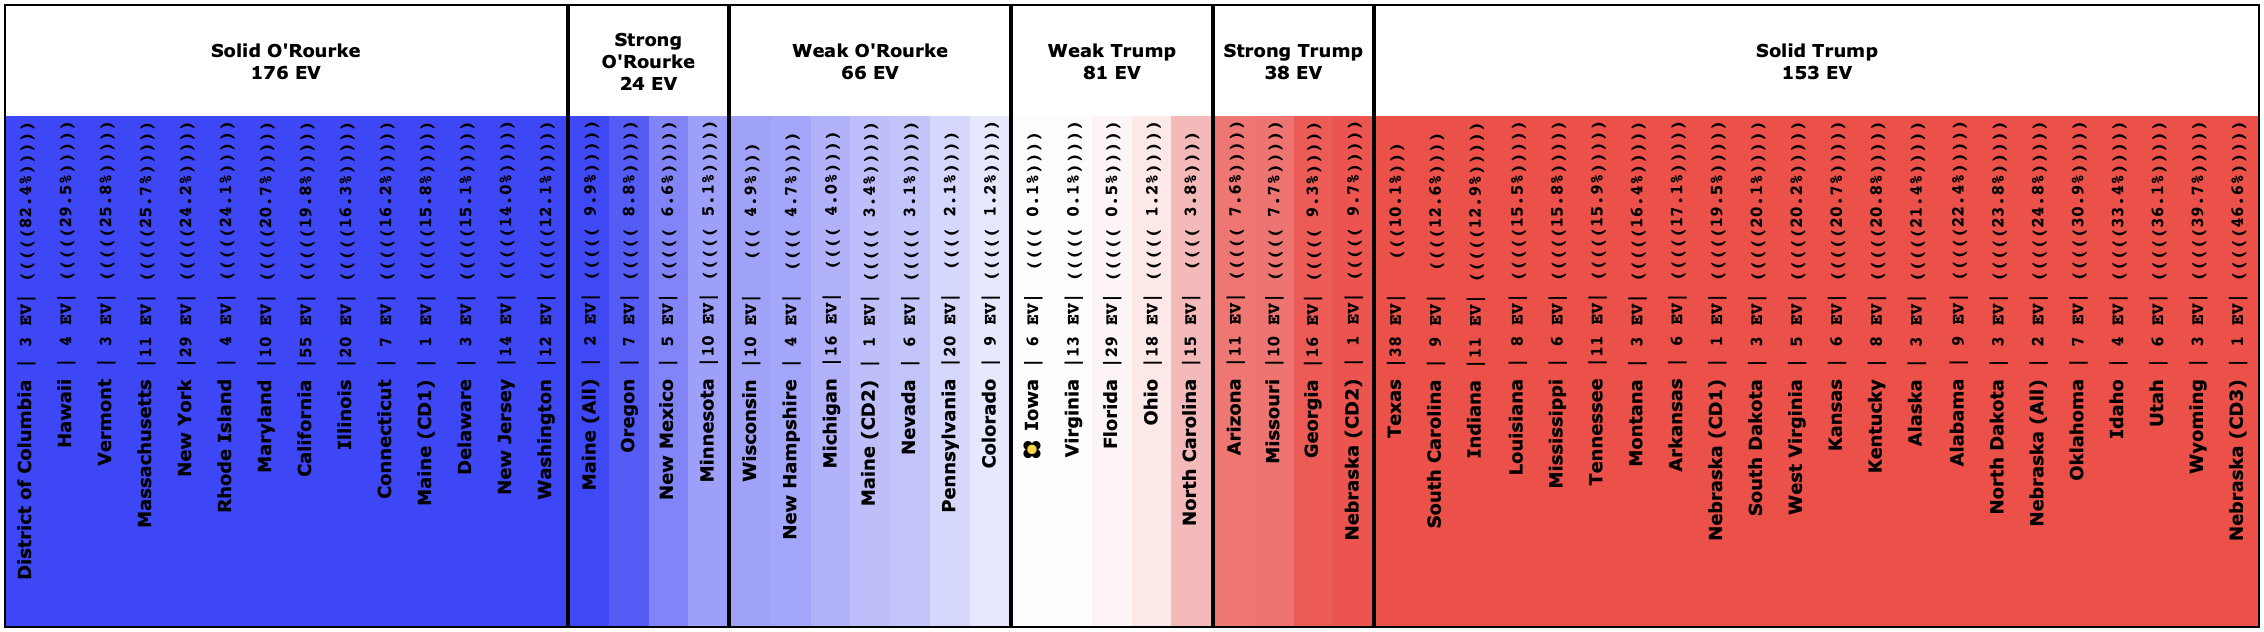
Click through on any of these to look at the specific numbers or details. The point here is to look at the overall pattern though. You can see here how at the moment as you move from Biden to Sanders to O'Rourke, Trump gains strength, moving more states from Weak Dem to Weak Trump, and more areas slip from Strong Dem to Weak Dem. There is even one move from Strong Trump to Solid Trump (Texas).
This is just another view of the theme that has been present in all the Election Graphs update posts so far: Biden doing better than other Democrats against Trump. This situation will very likely change. The other candidates will get more exposure, and name recognition factors will fade. But that hasn't happened yet.
OK. Now to graphs.
On the national level, Trump's "best case" changed against these three candidates. Best case is perhaps a misnomer here, as 2016 showed, it is possible for a candidate to do better than the "best case" described here, which is merely the candidate winning all of the close states. But doing better than this best case is enough of an outlier to be a surprise. So it still serves as a good reference for the upper end of likely outcomes.
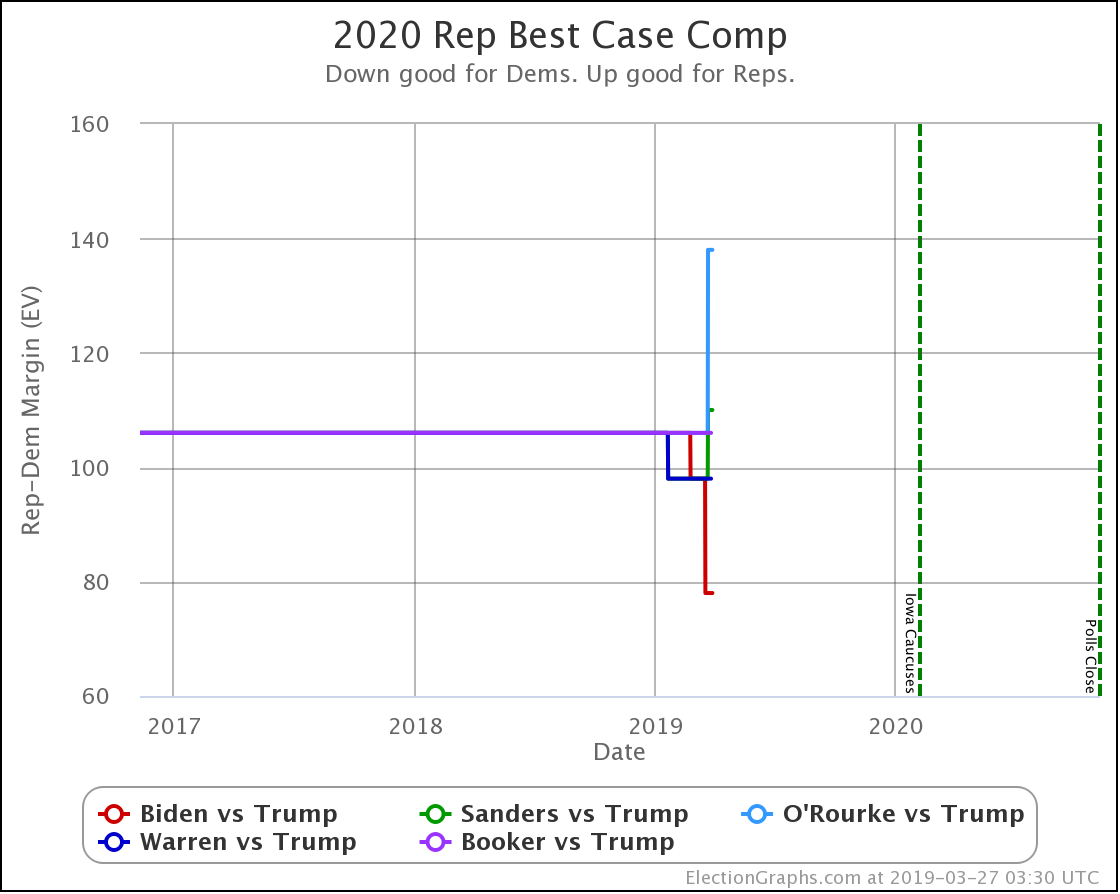
Looking at the Trump best cases only, not the "expected case" or "tipping point" that we usually spend more time looking at, Trump does best against O'Rourke, followed by Sanders, then Booker, then Warren, then finally does worst against Biden. (As usual, I am looking only at the five best-polled candidate pairs.)
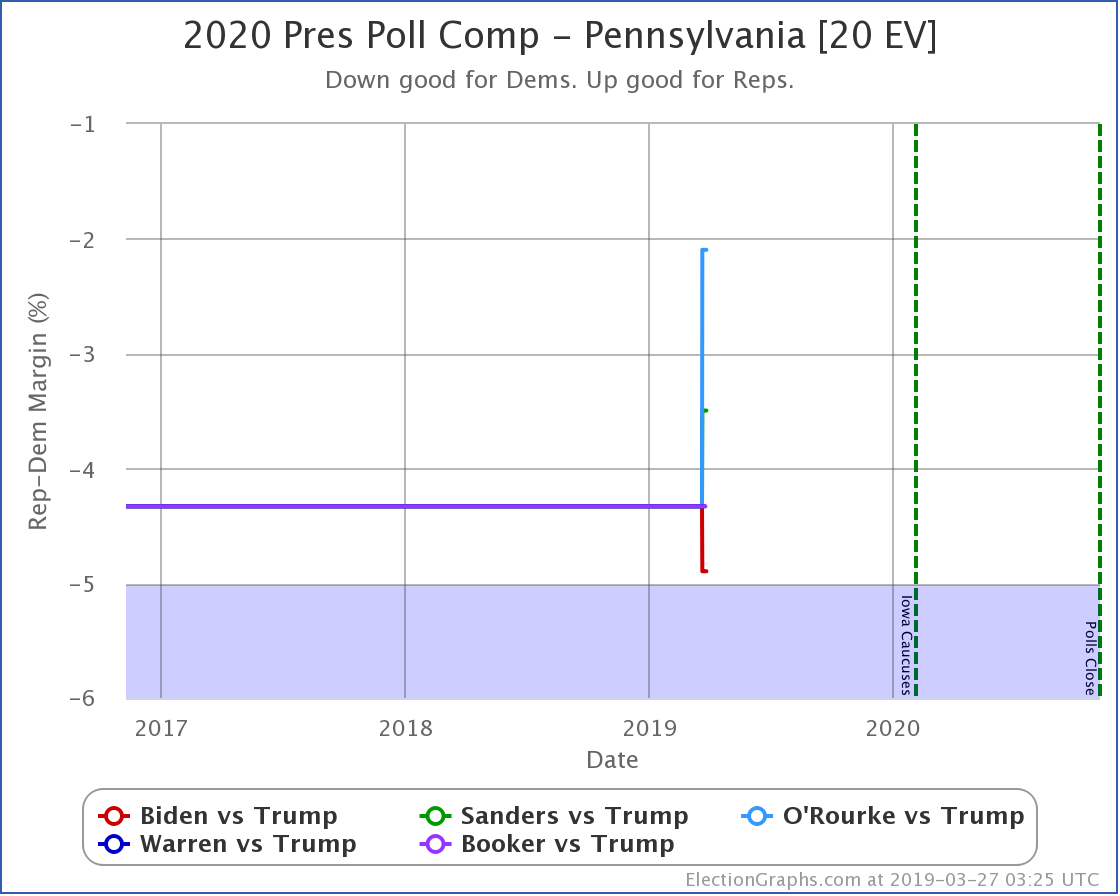
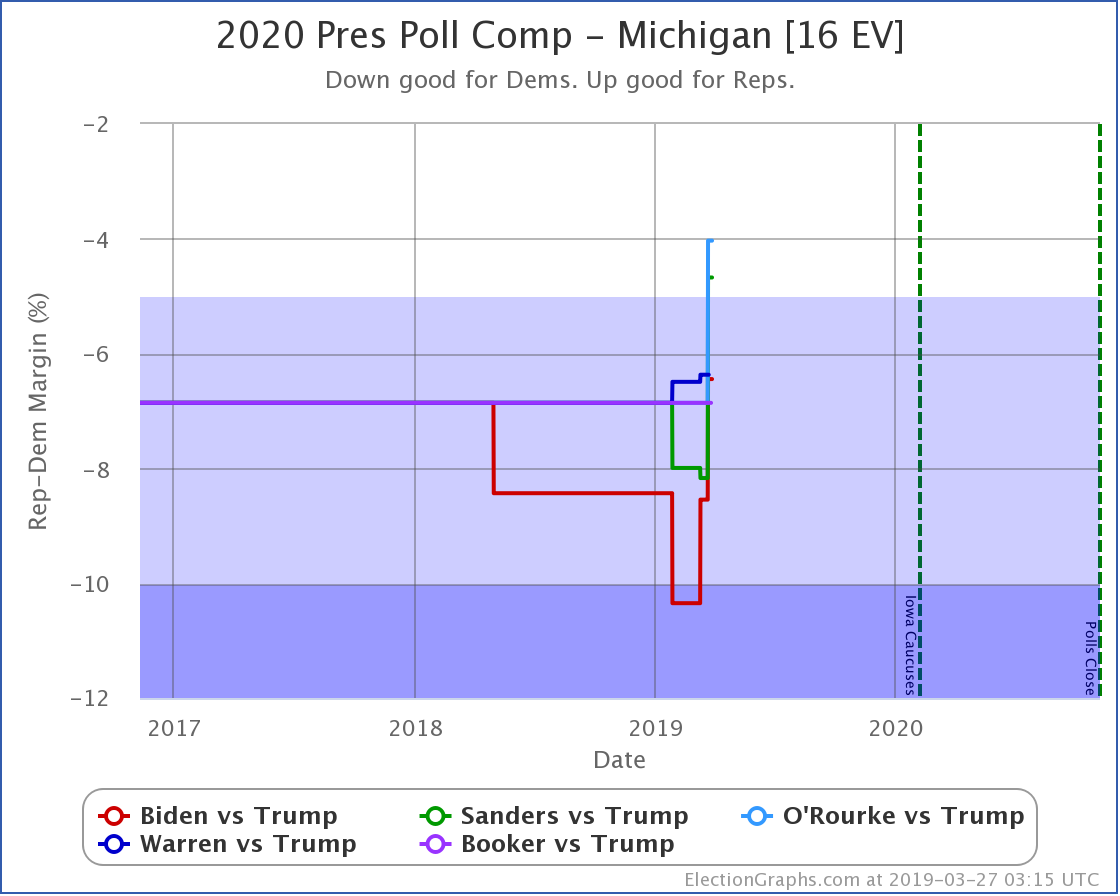
Finally, a quick look at the comparison charts for the three states included in this latest batch of polls. Remember only Biden, Sanders, and O'Rourke were in this batch of polls.
Pennsylvania was a mix with Biden improving, while Sanders and O'Rourke did worse.
Trump improved against all three in Michigan.
All three Democrats improved their position in Wisconsin.
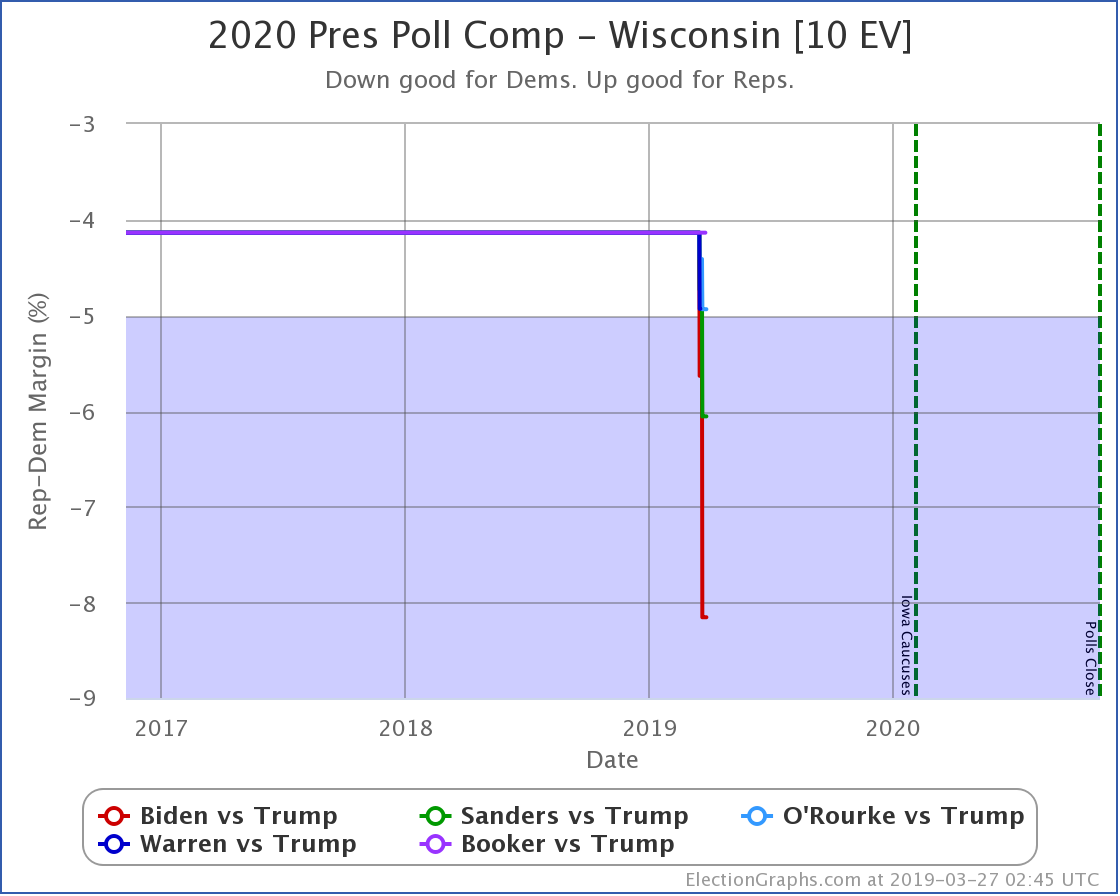
And yet again Biden is doing better against Trump than the other Democrats in all three states.
587.0 days until polls start to close on Election Day 2020.
For more information:
This post is an update based on the data on the Election Graphs Electoral College 2020 page. Election Graphs tracks a poll-based estimate of the Electoral College. The charts, graphs, and maps in the post above are all as of the time of this post. Click through on any image to go to a page with the current interactive versions of that chart, along with additional details.
Follow @ElectionGraphs on Twitter or Election Graphs on Facebook to see announcements of updates. For those interested in individual poll updates, follow @ElecCollPolls on Twitter for all the polls as I add them. If you find the information in these posts informative or useful, please consider visiting the donation page.
One thought on “Sanders and O'Rourke in the Midwest”