Since the last update, there have been new polls in Kentucky, Wisconsin, Michigan, Pennsylvania, Florida (x2), and North Carolina.
With this update, Buttigieg vs. Trump has now replaced Harris vs. Trump in the "five best-polled candidate combinations" that I'll spend time on in these posts. The new list is Biden, Warren, Buttigieg, Sanders, and O'Rourke all paired against Trump.
With this latest batch of polls, we have the following changes:
National:
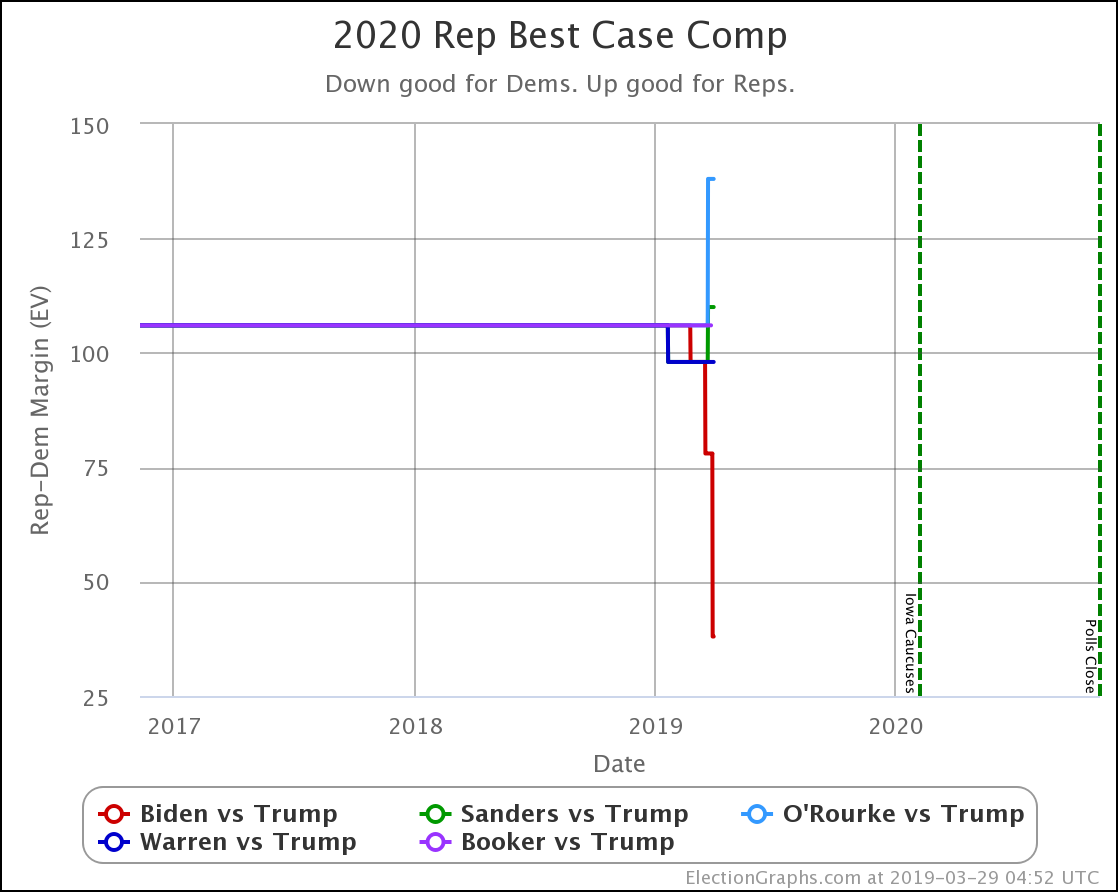
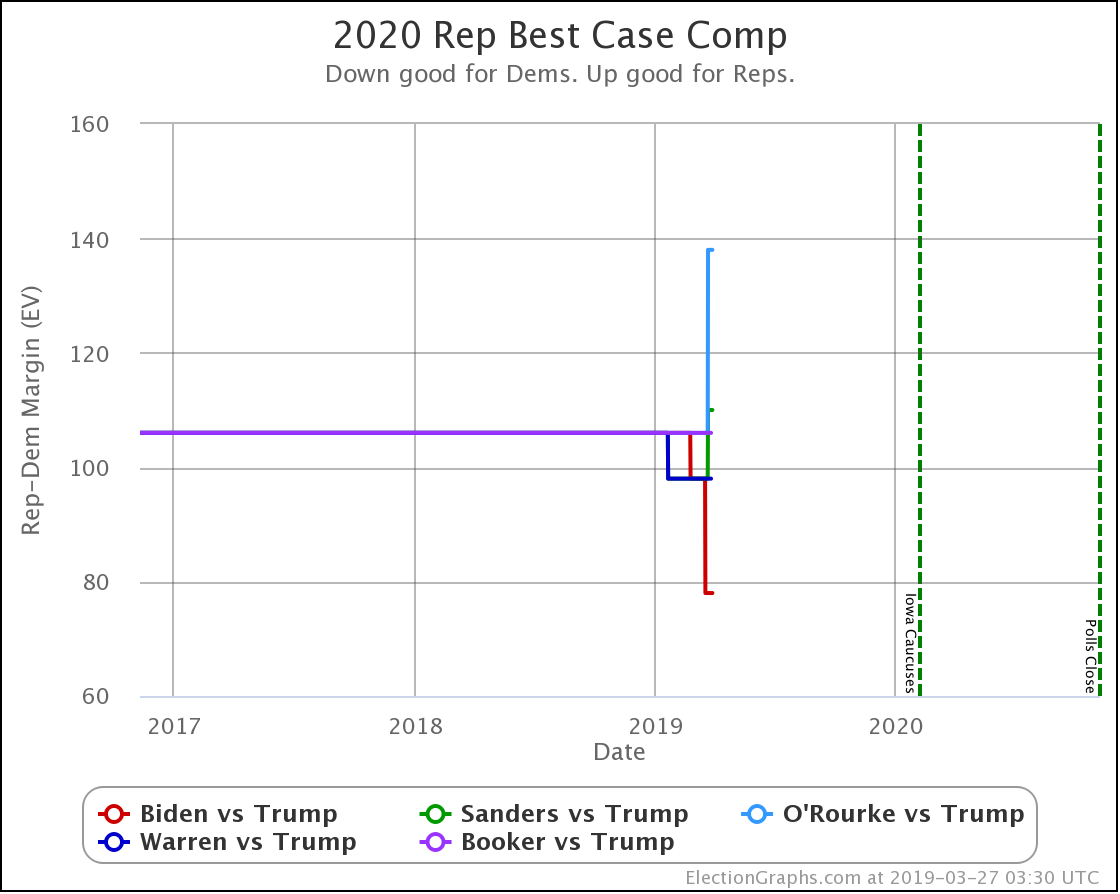
- Trump best case vs. Warren has changed: Warren 214 to Trump 324 -> Warren 204 to Trump 334
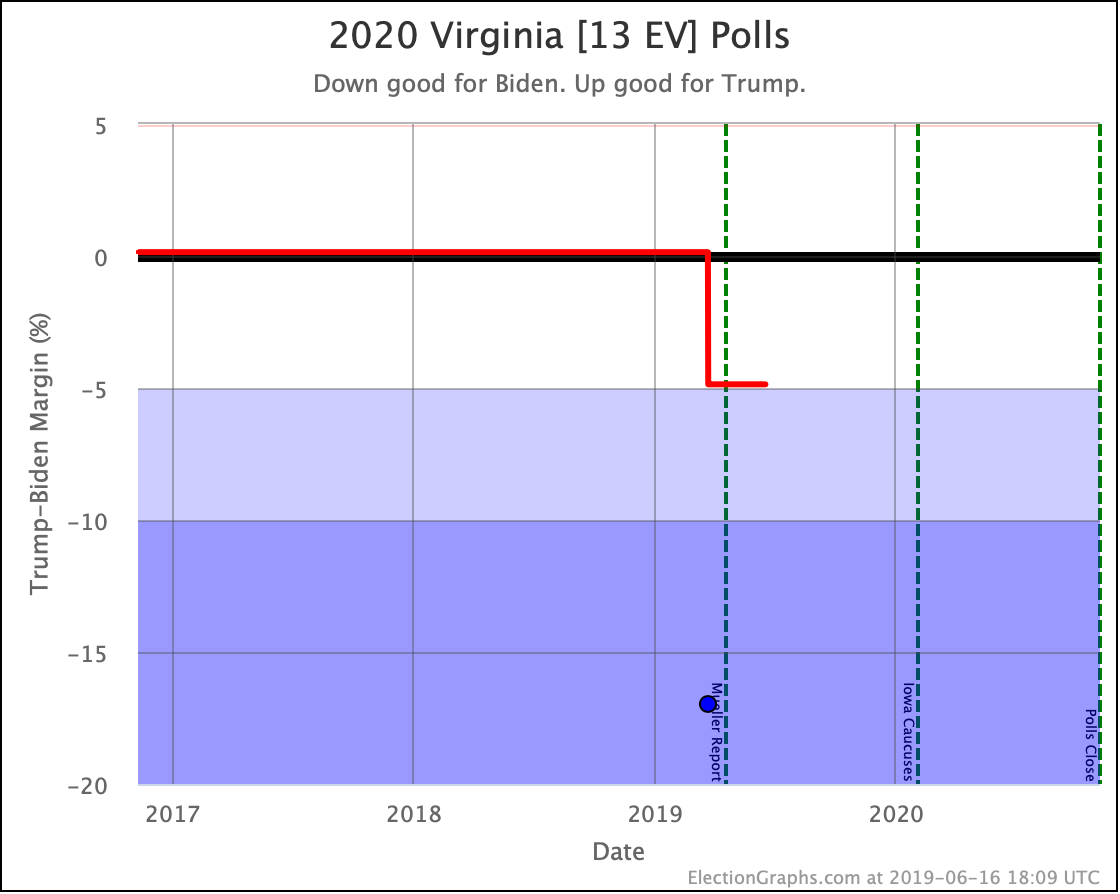
- Warren vs. Trump tipping point change: Trump by 0.1% in VA -> Warren by 0.5% in FL
- Warren vs. Trump expected case change: Warren 266 to Trump 272 -> Warren 295 to Trump 243
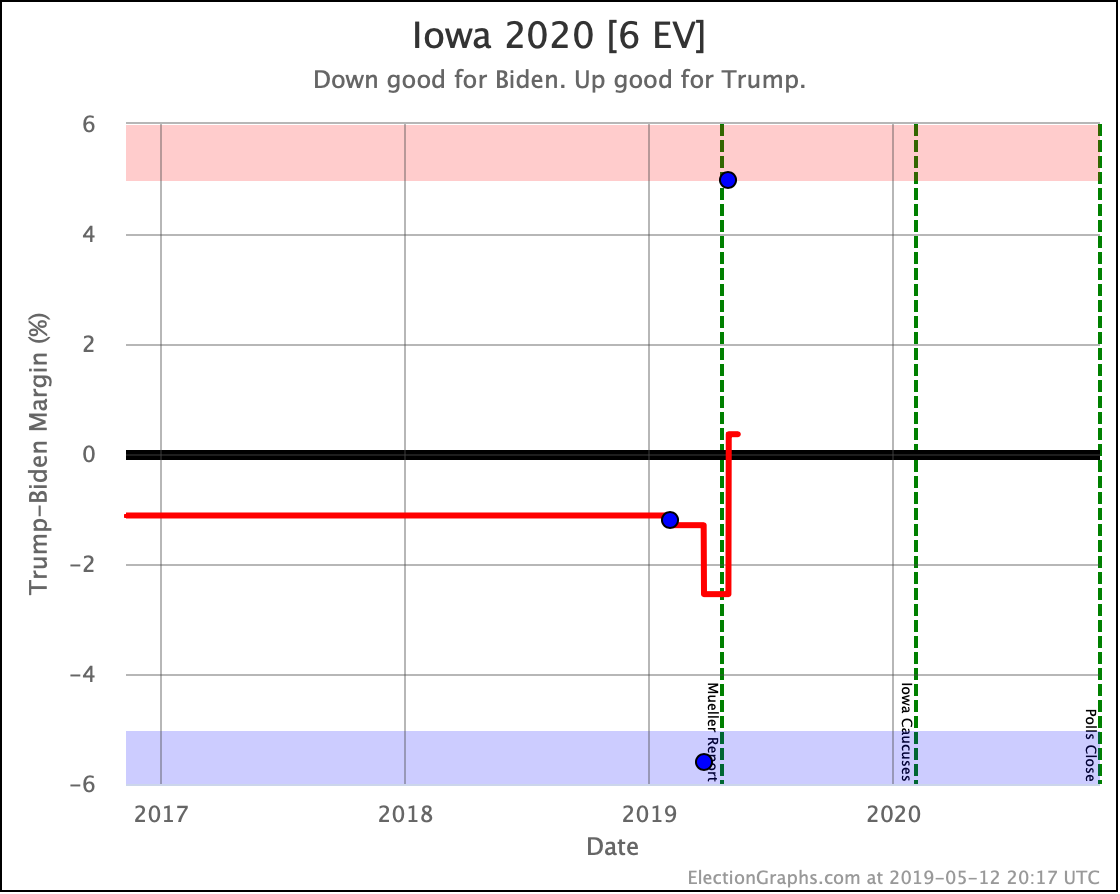
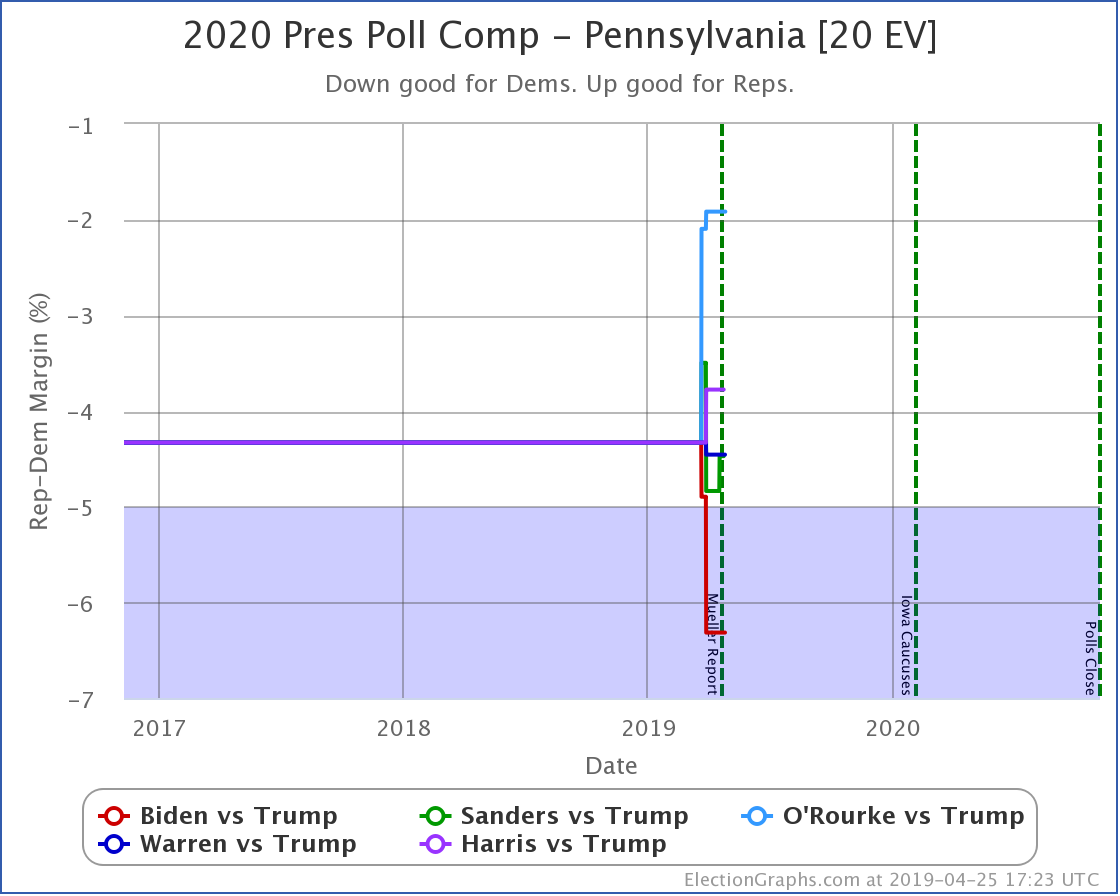
- Buttigieg vs. Trump tipping point change: Buttigieg by 1.1% in IA -> Buttigieg by 0.6% in PA
- Sanders vs. Trump tipping point change: Sanders by 1% in IA -> Sanders by 1.3% in FL
- Sanders vs. Trump expected case change: Sanders 272 to Trump 266 -> Sanders 301 to Trump 237
- O'Rourke vs. Trump tipping point change: Trump by 0.5% in FL -> Trump by 0.3% in FL
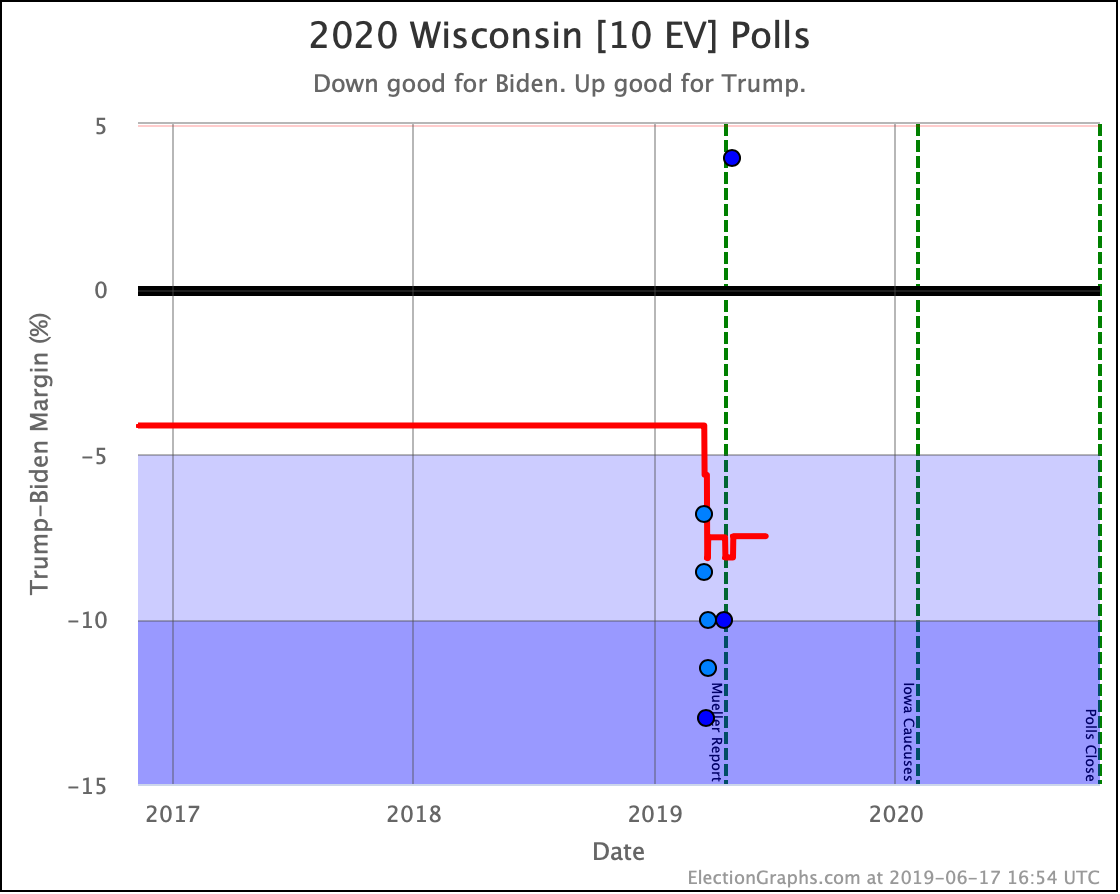
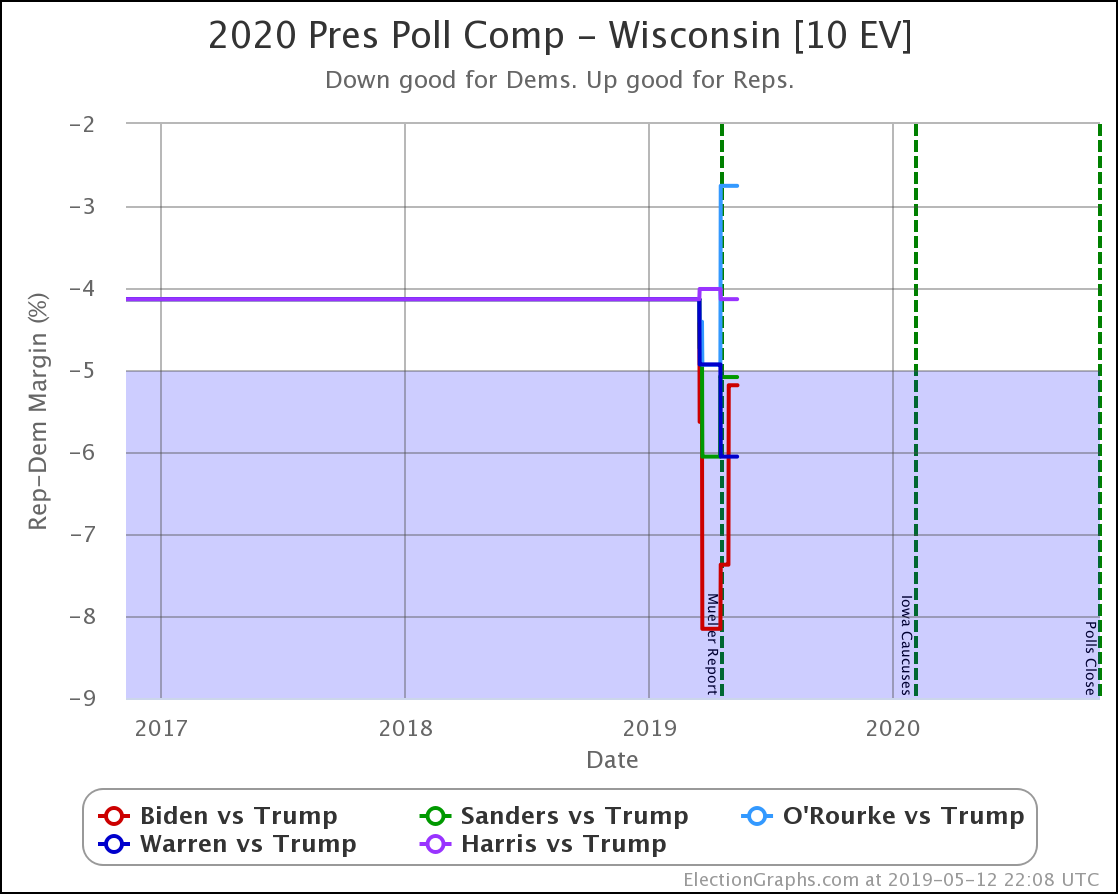
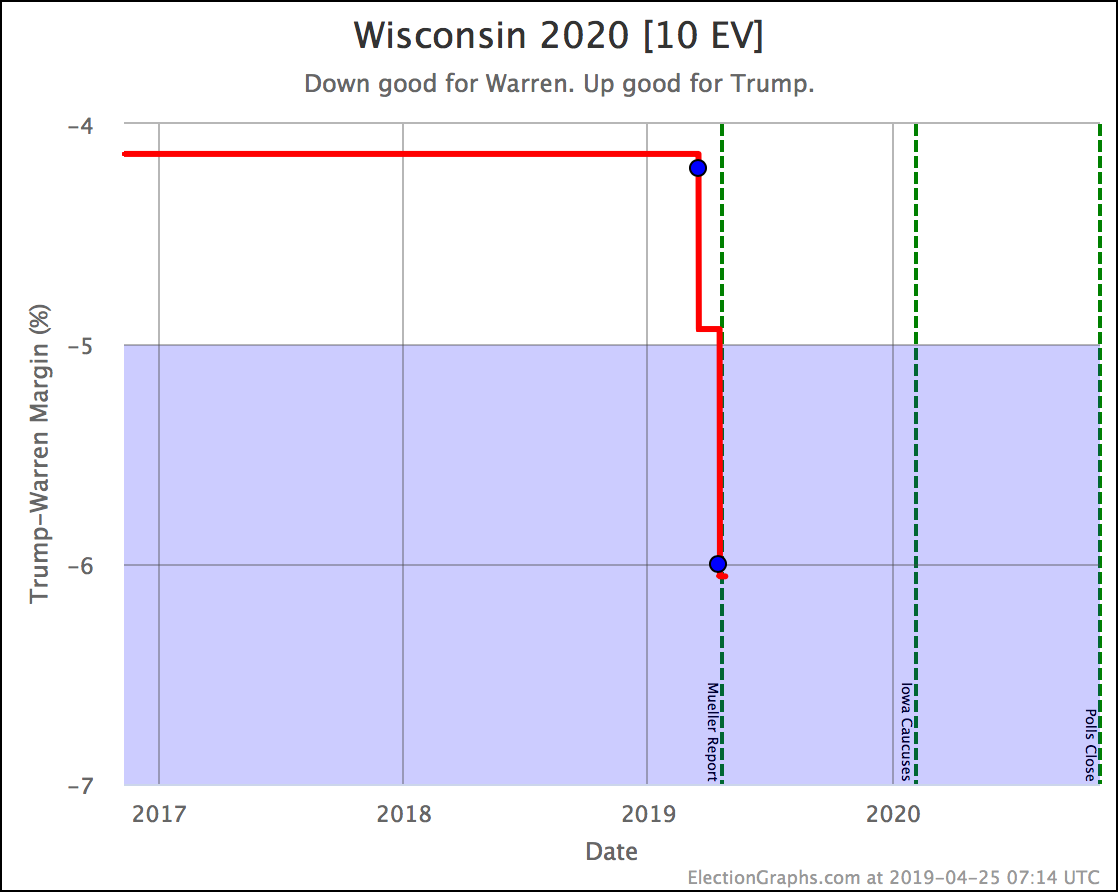
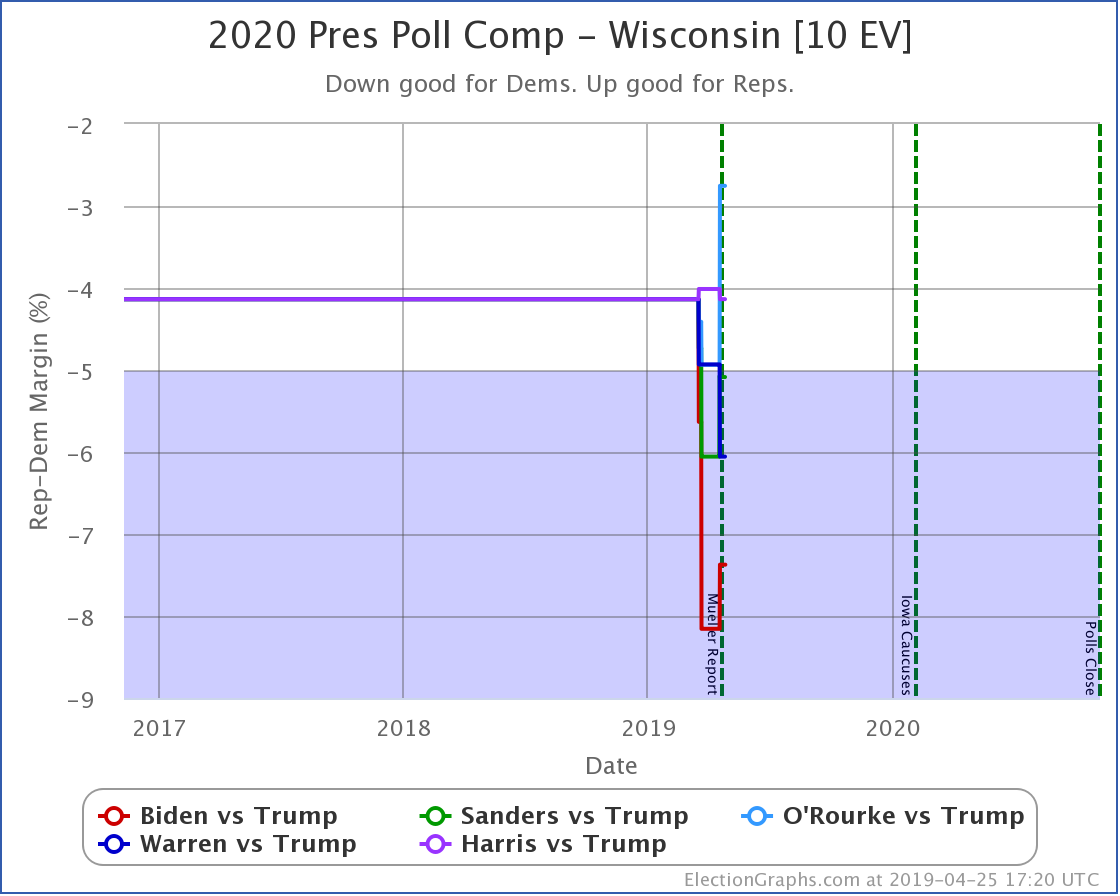
Wisconsin:
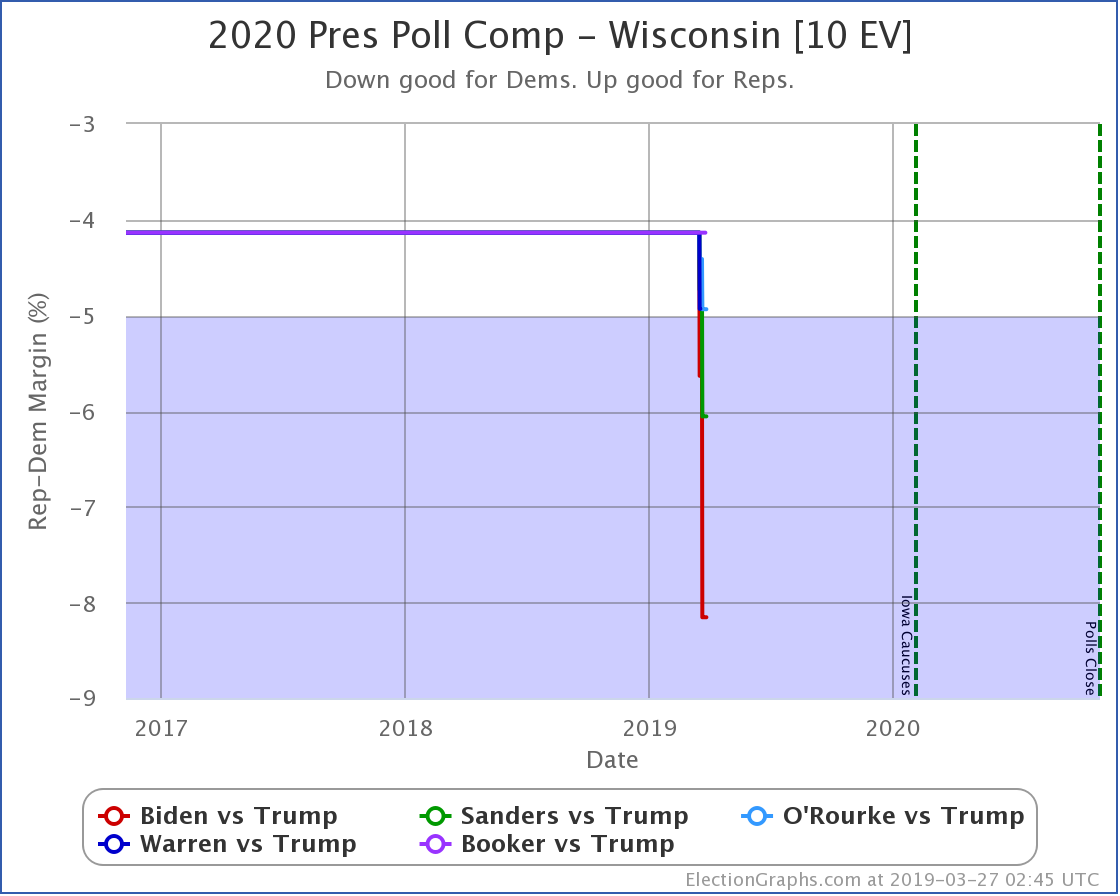
- Warren vs. Trump state category change: WI has moved from Strong Warren to Weak Warren
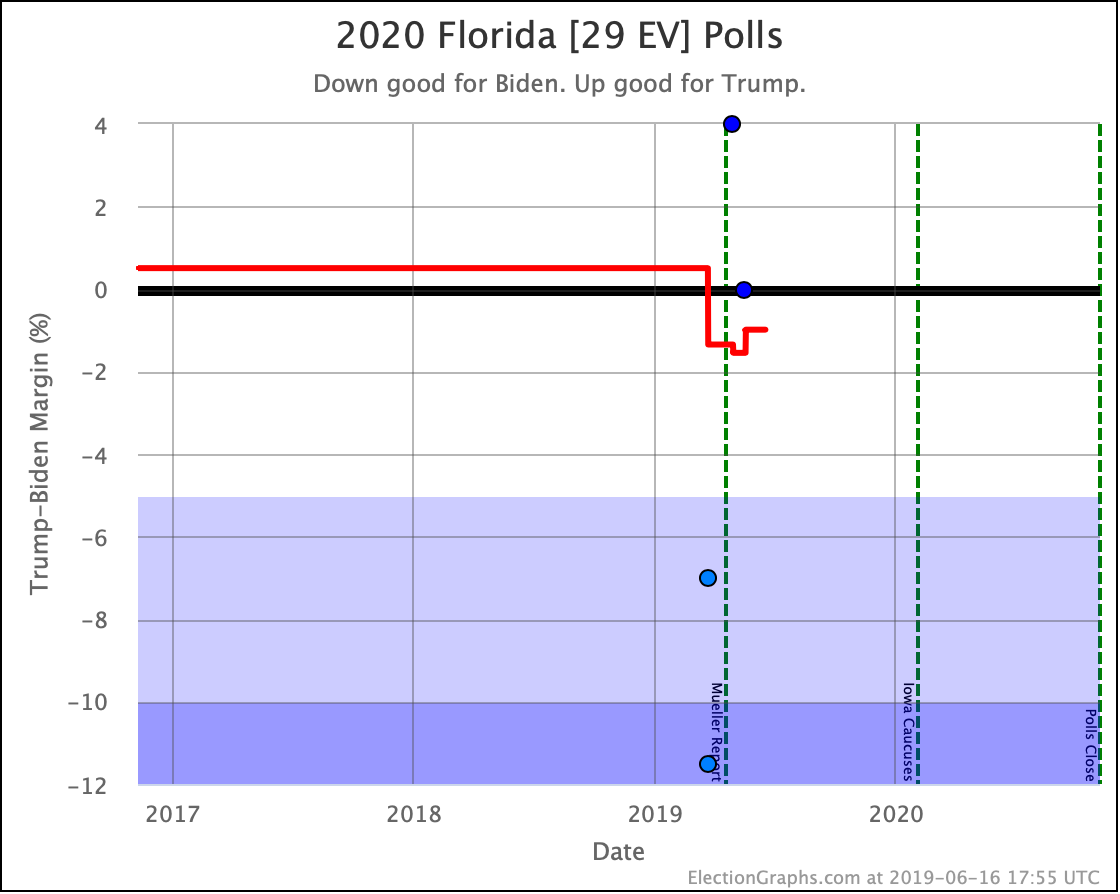
Florida:
- Sanders vs. Trump state category change: FL has moved from Weak Trump to Weak Sanders
- Warren vs. Trump state category change: FL has moved from Weak Trump to Weak Warren
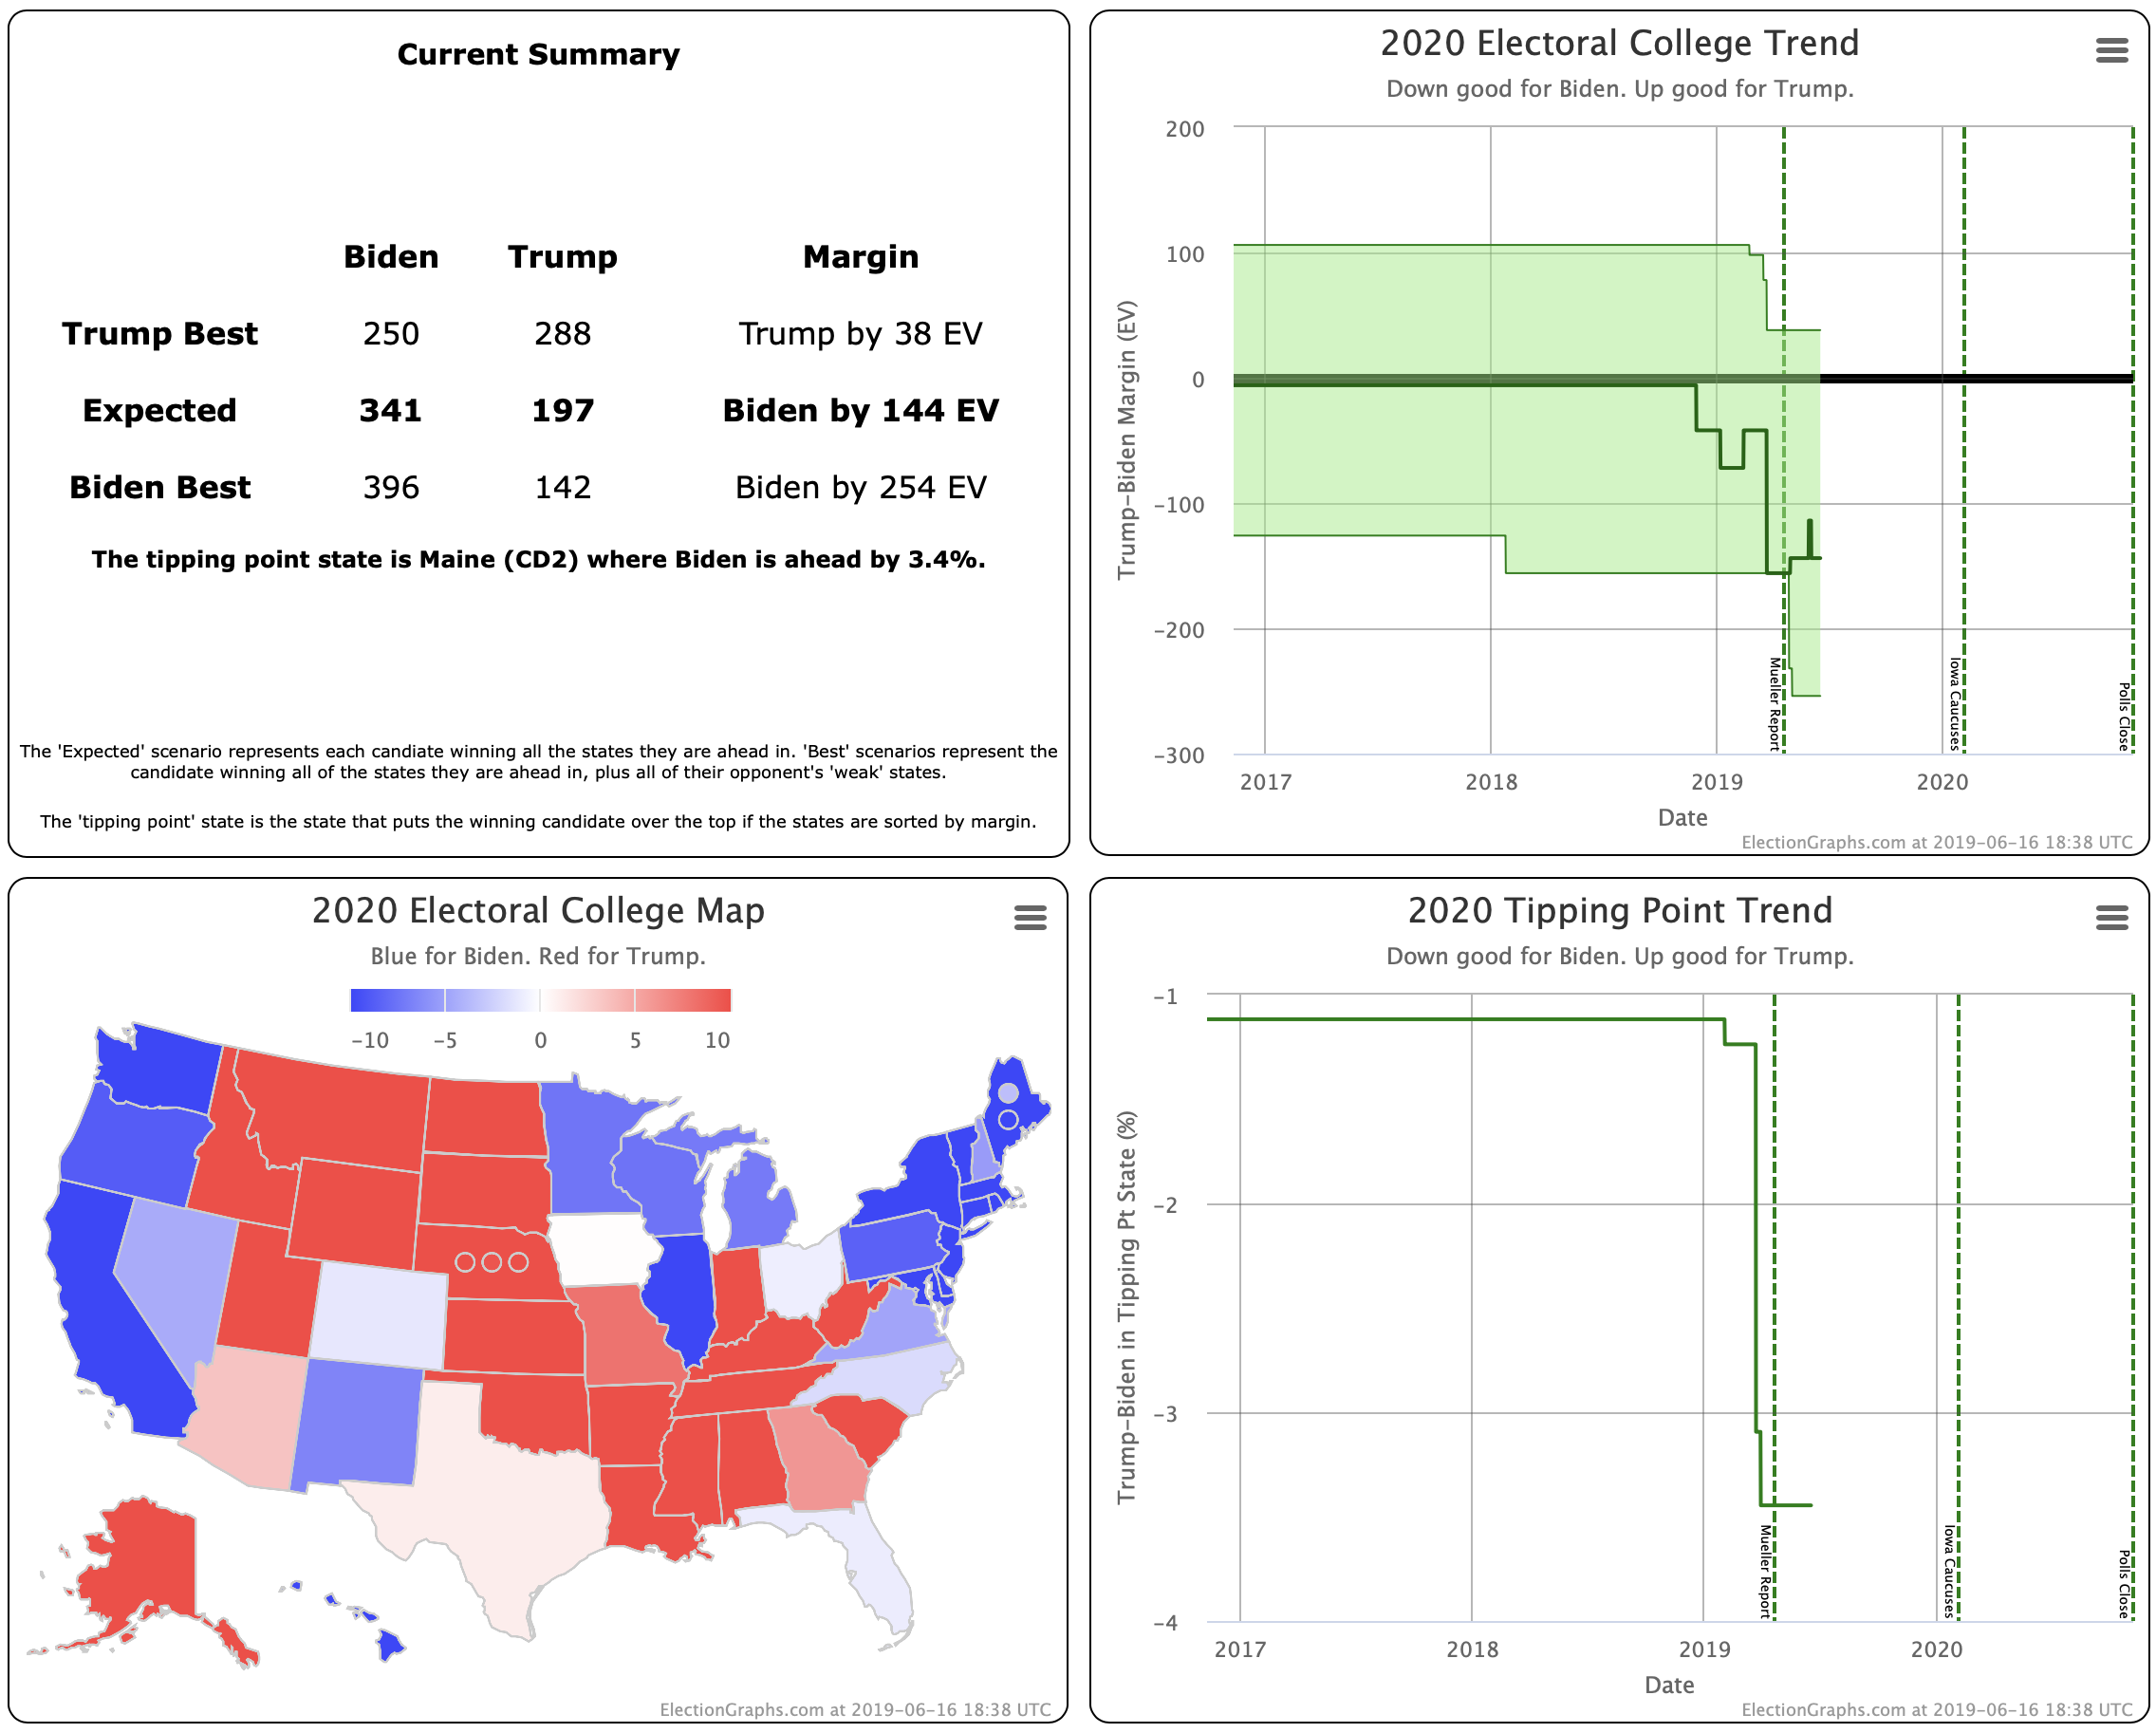
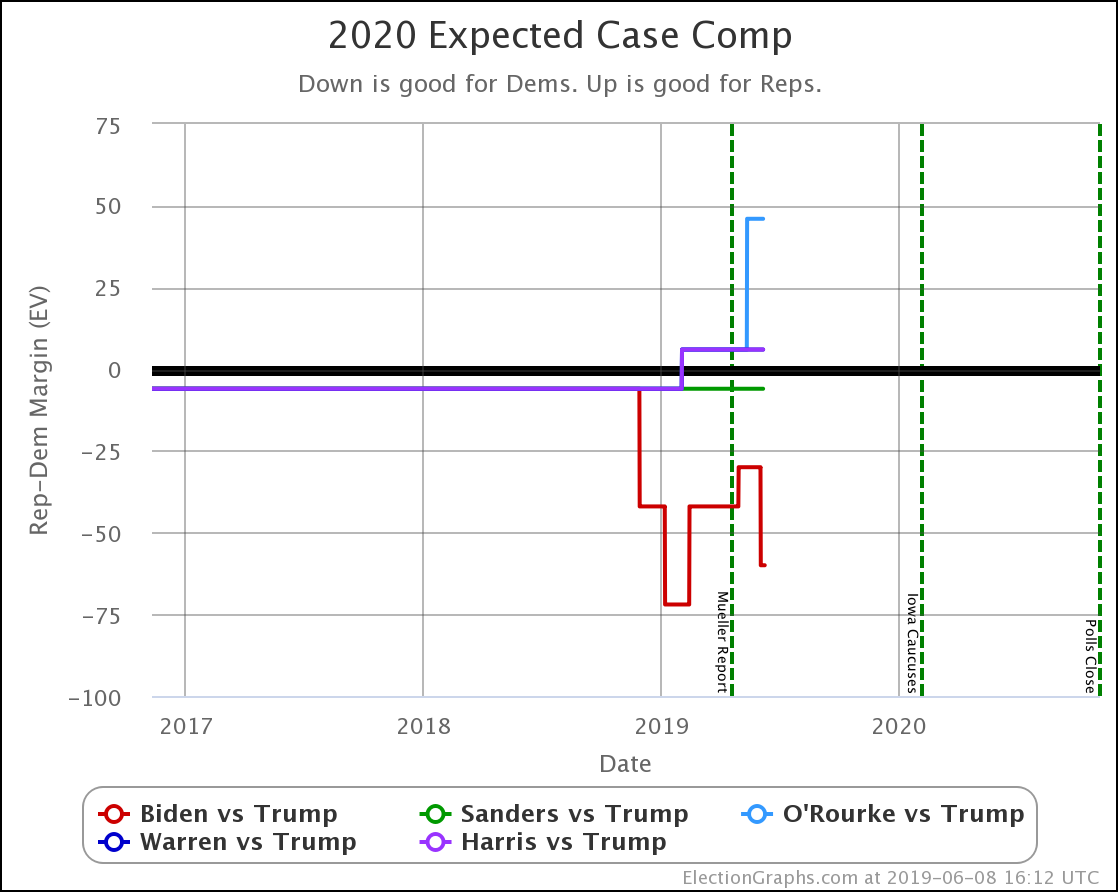
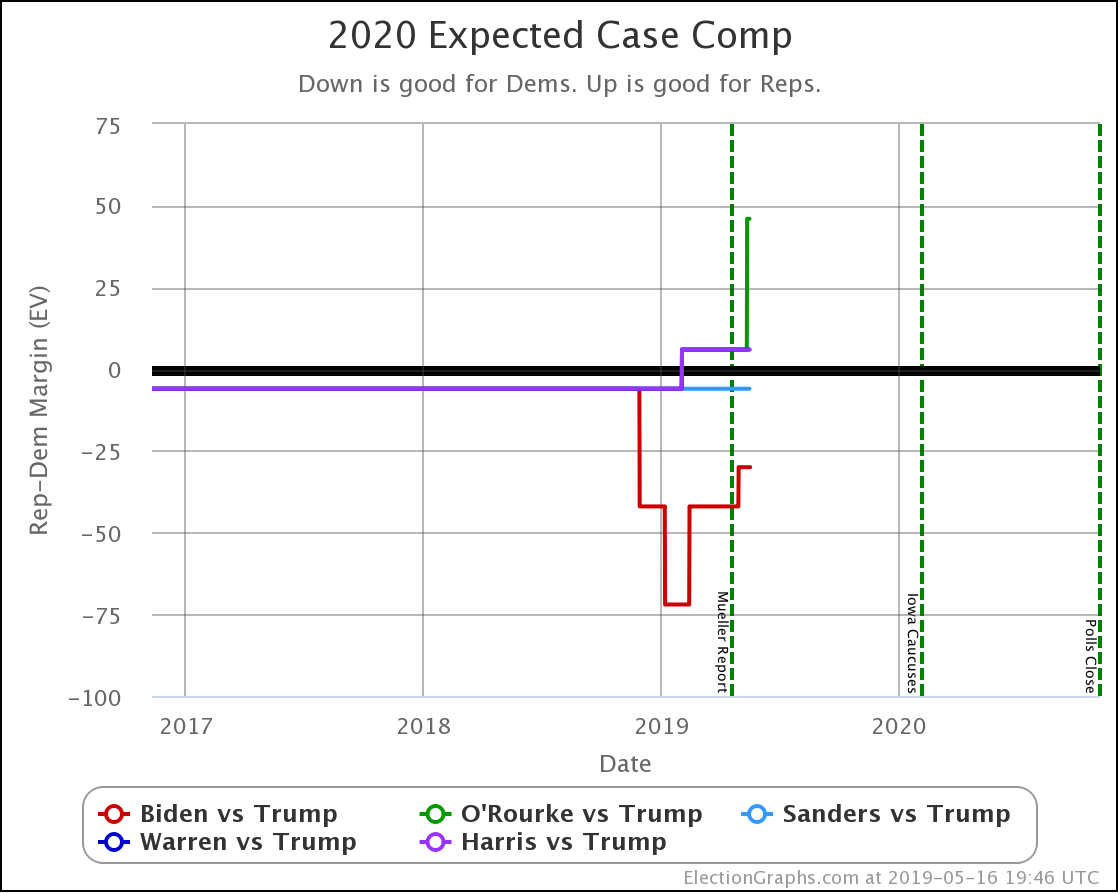
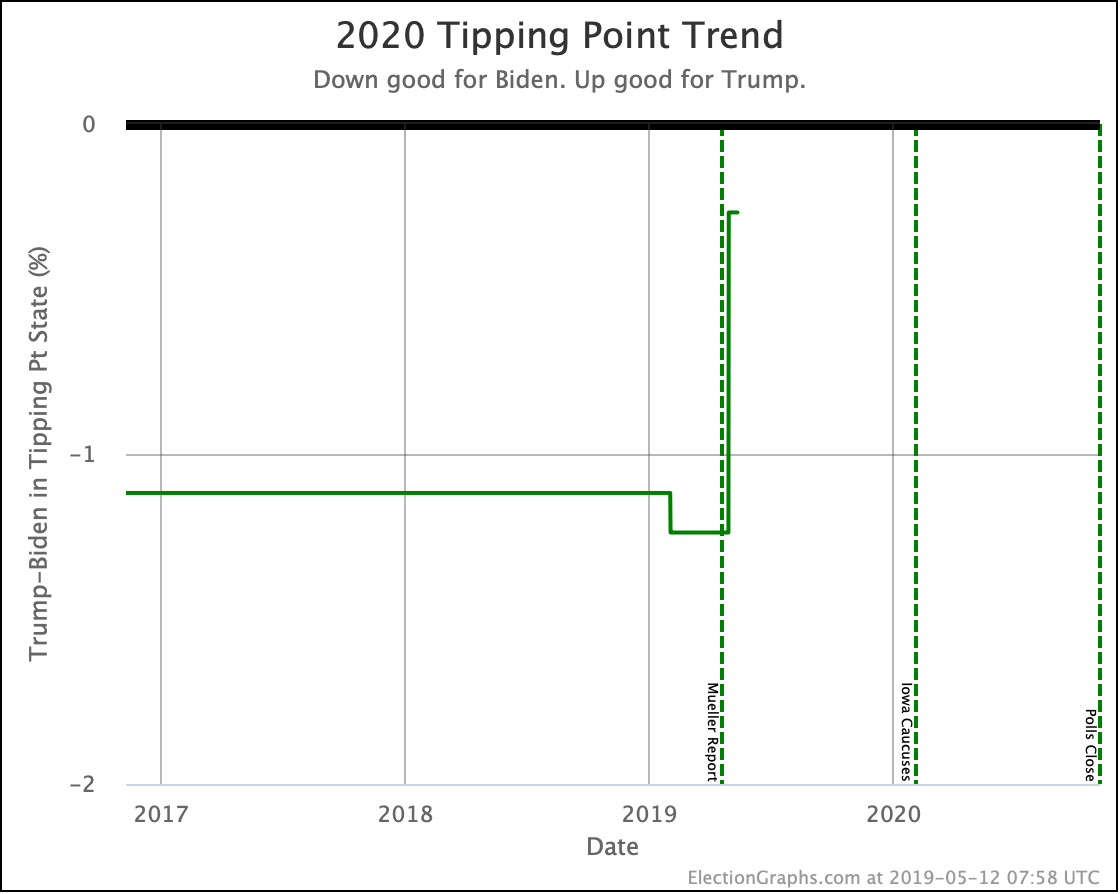
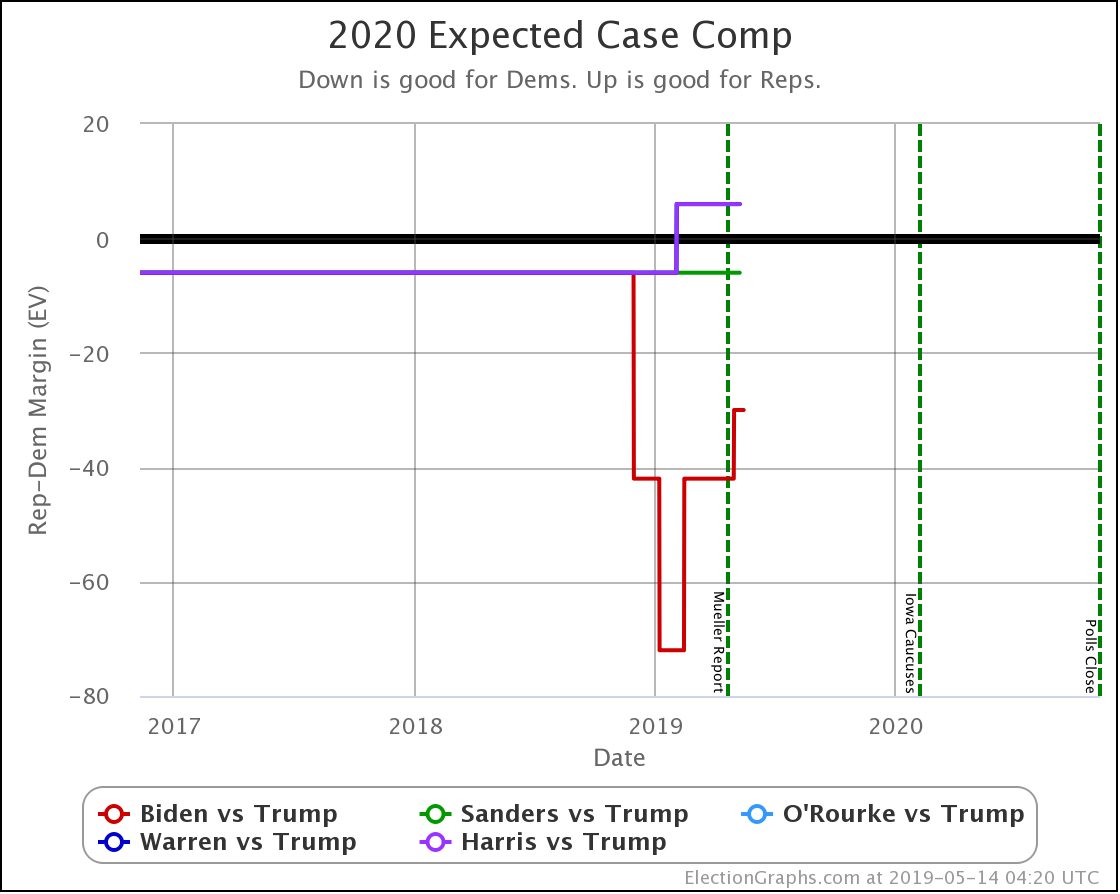
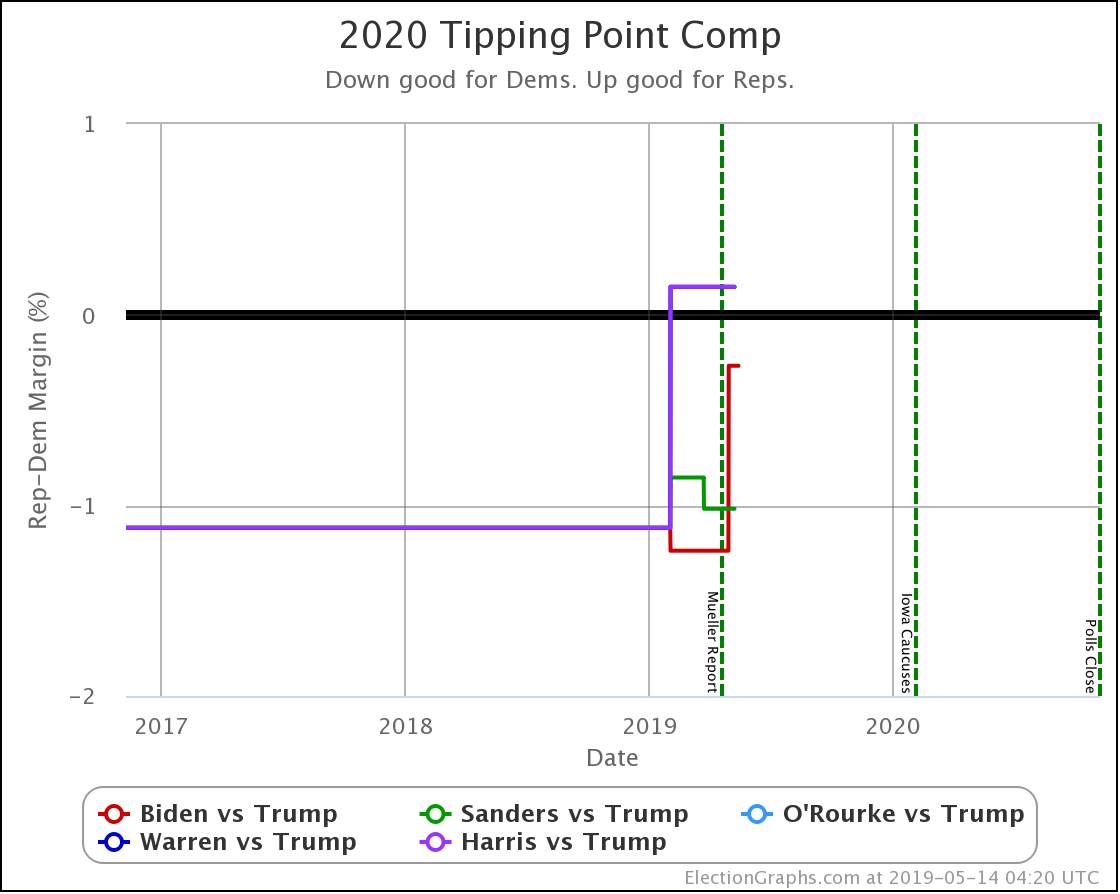
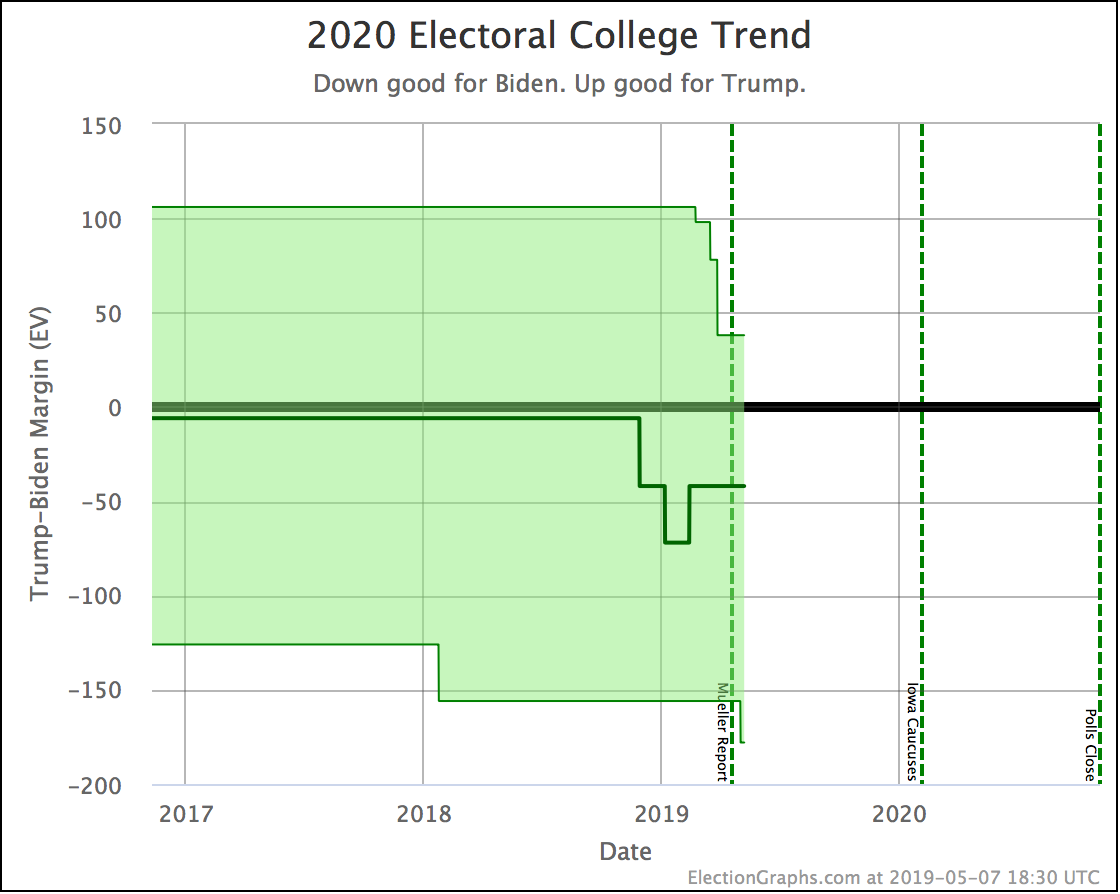
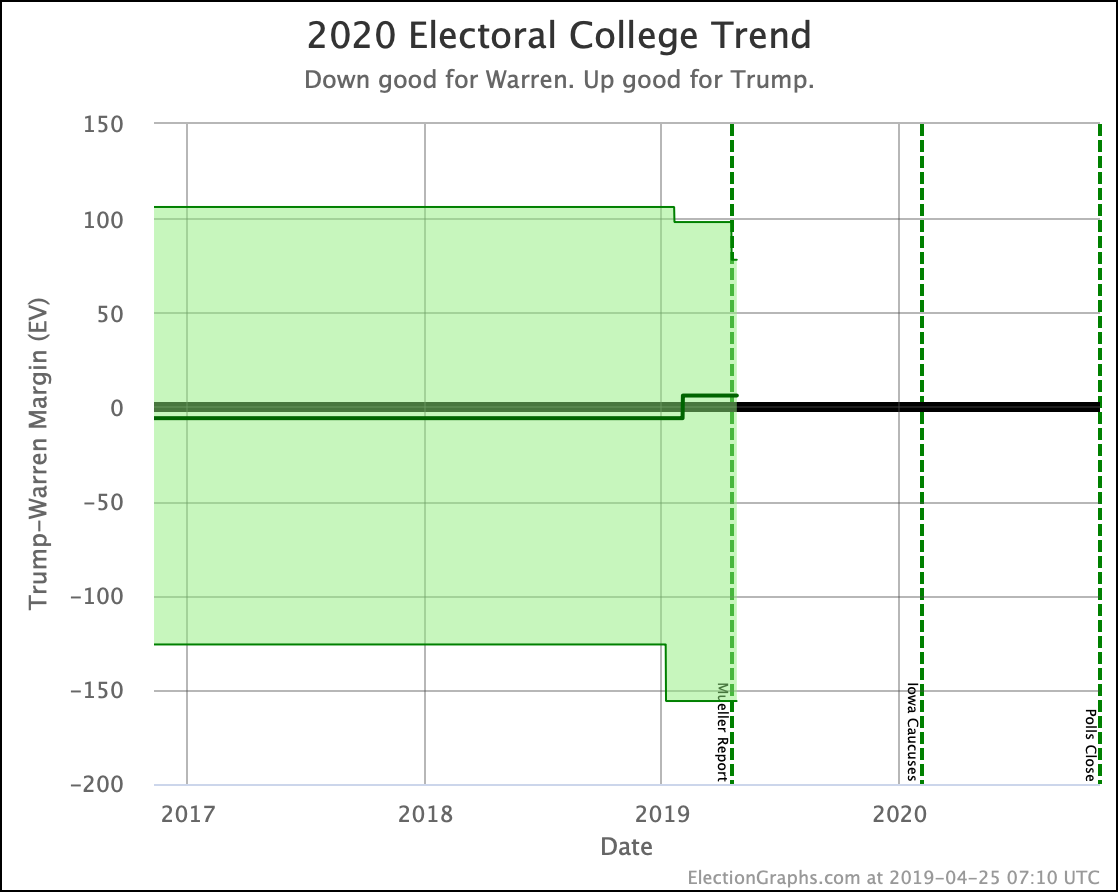
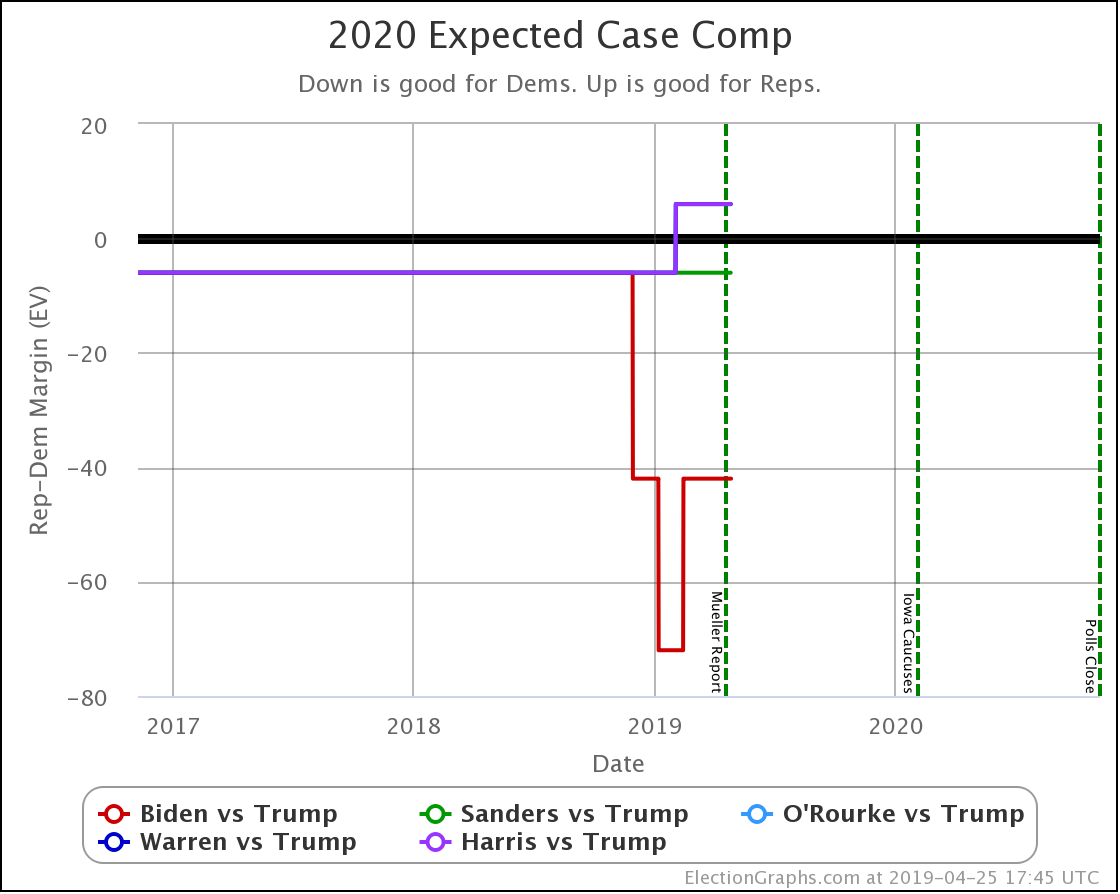
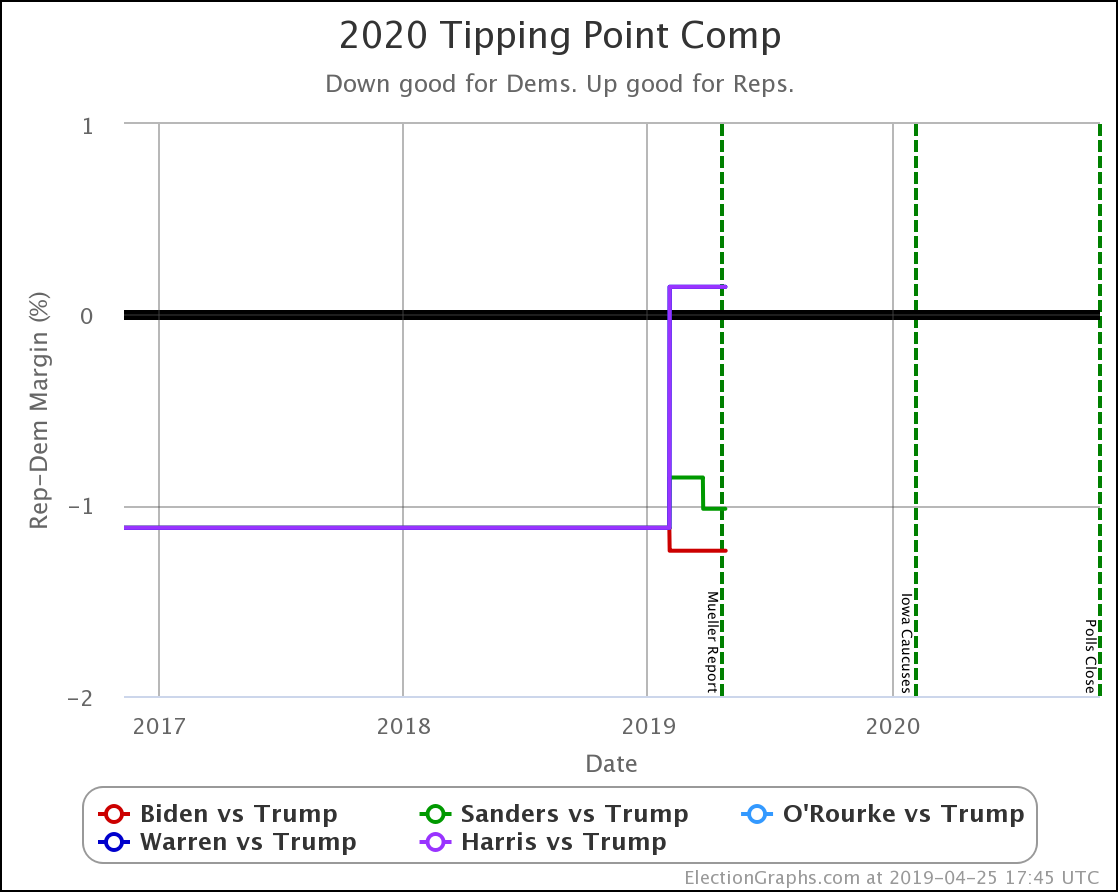
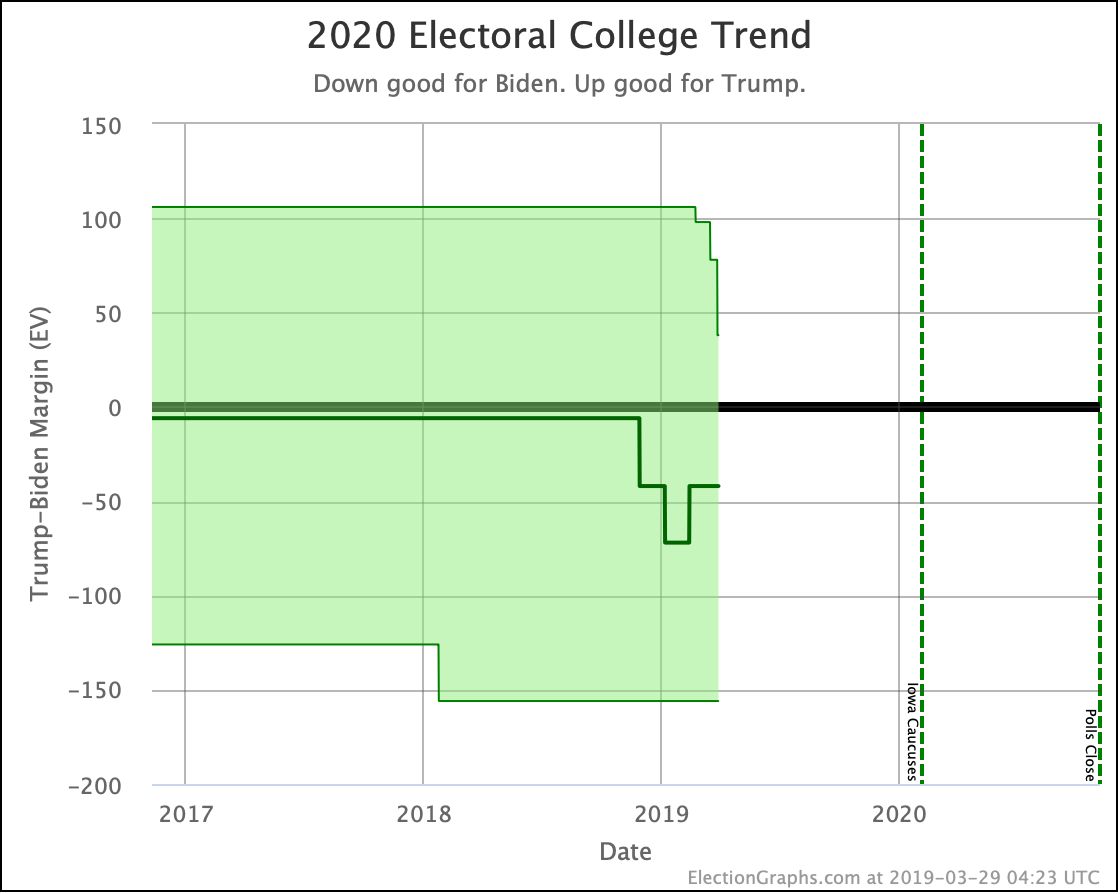
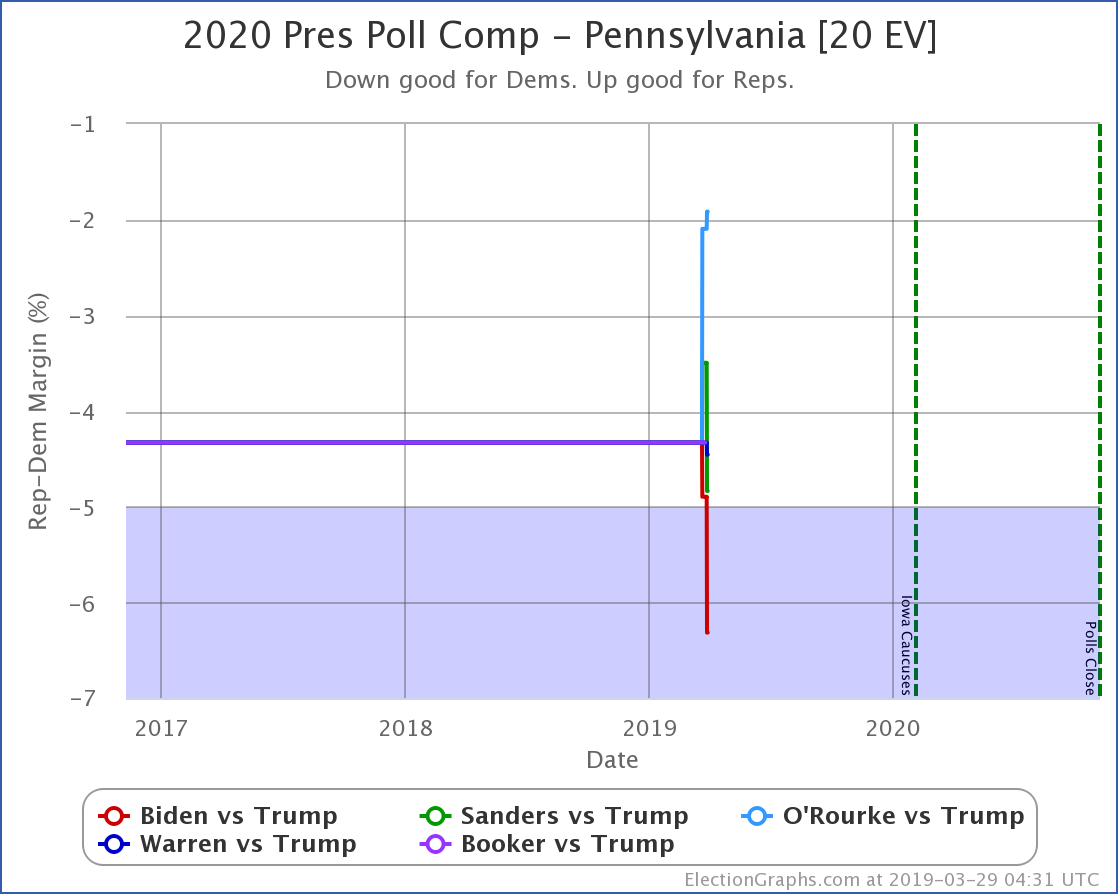
OK, now on to the graphs… national first:
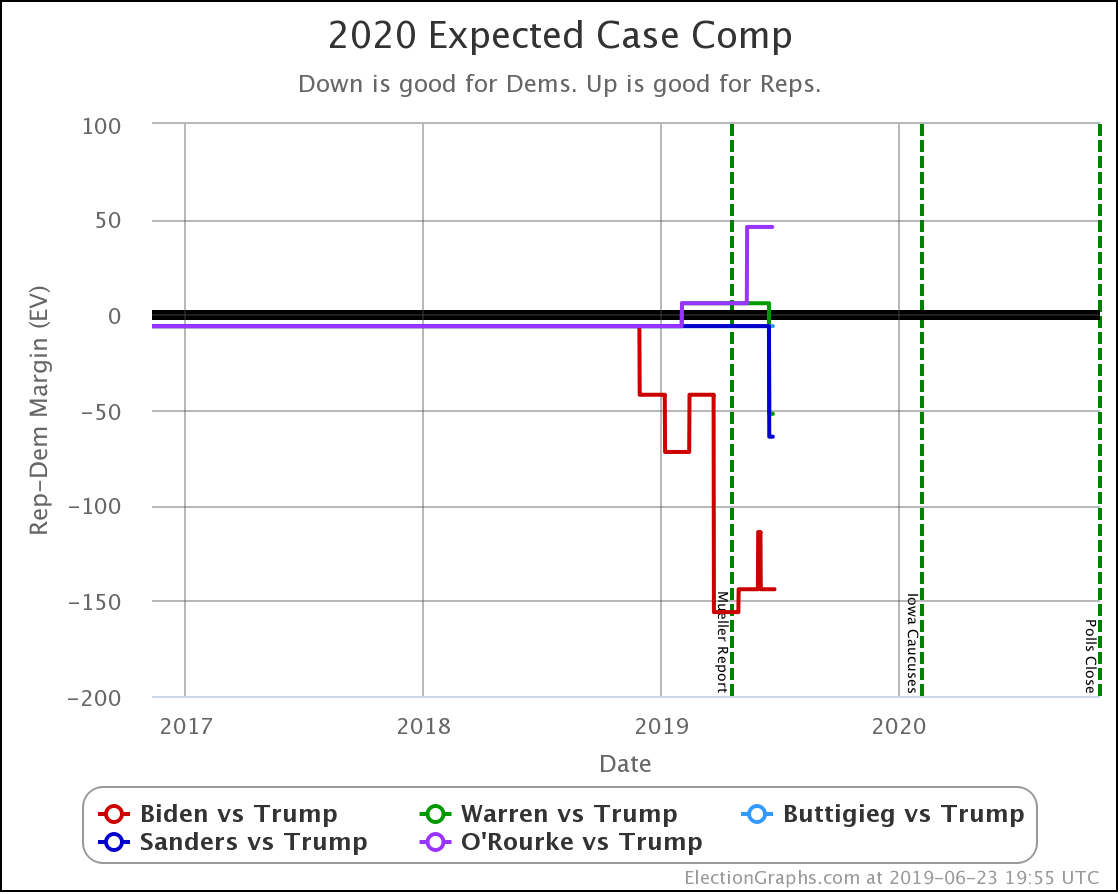
In the expected case, Warren and Sanders improve.
Notably, Warren moves from losing to winning with this update.
Biden continues to do the best of the five Democrats, while O'Rourke does worst.
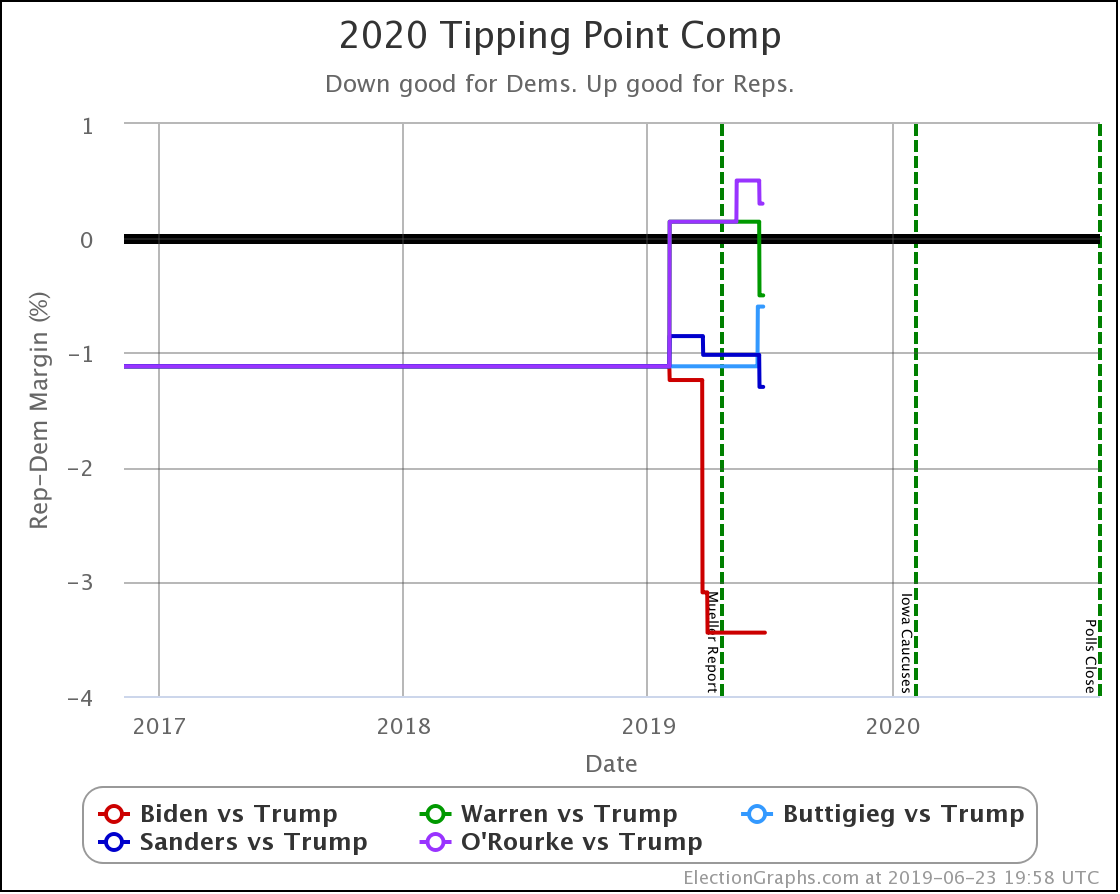
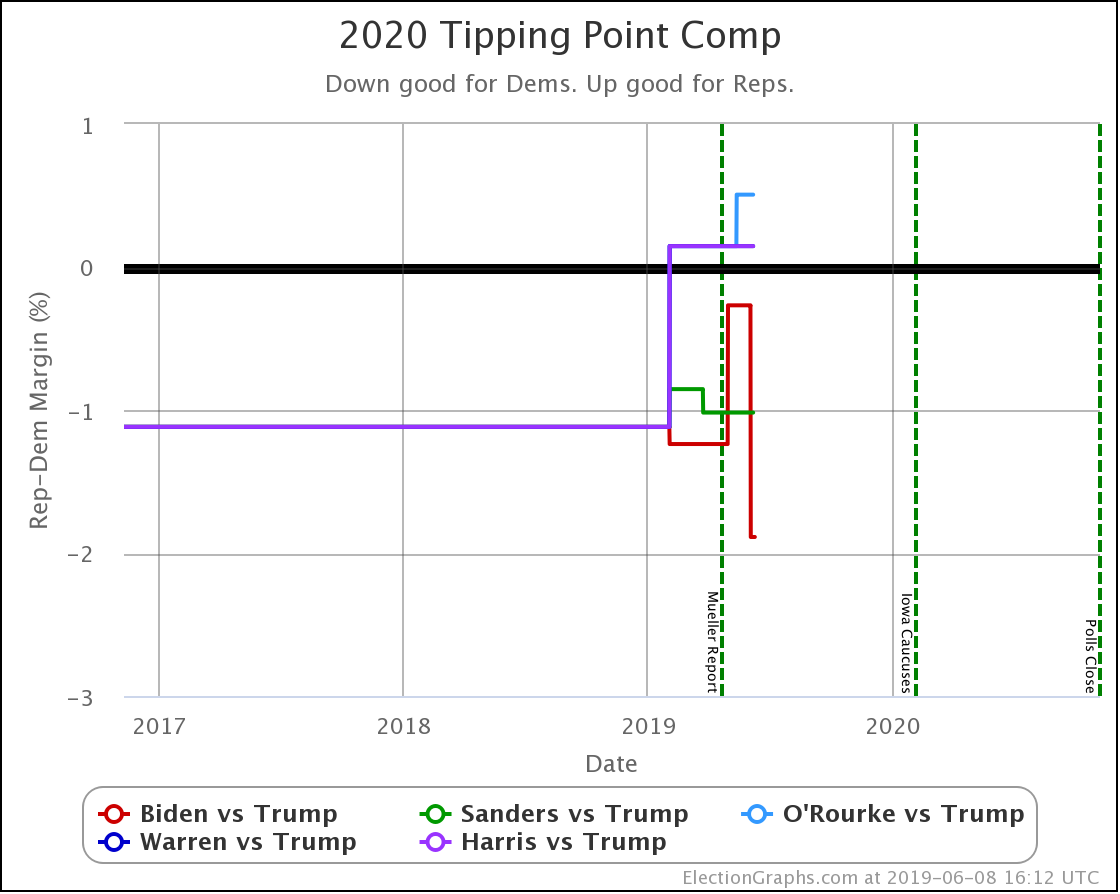
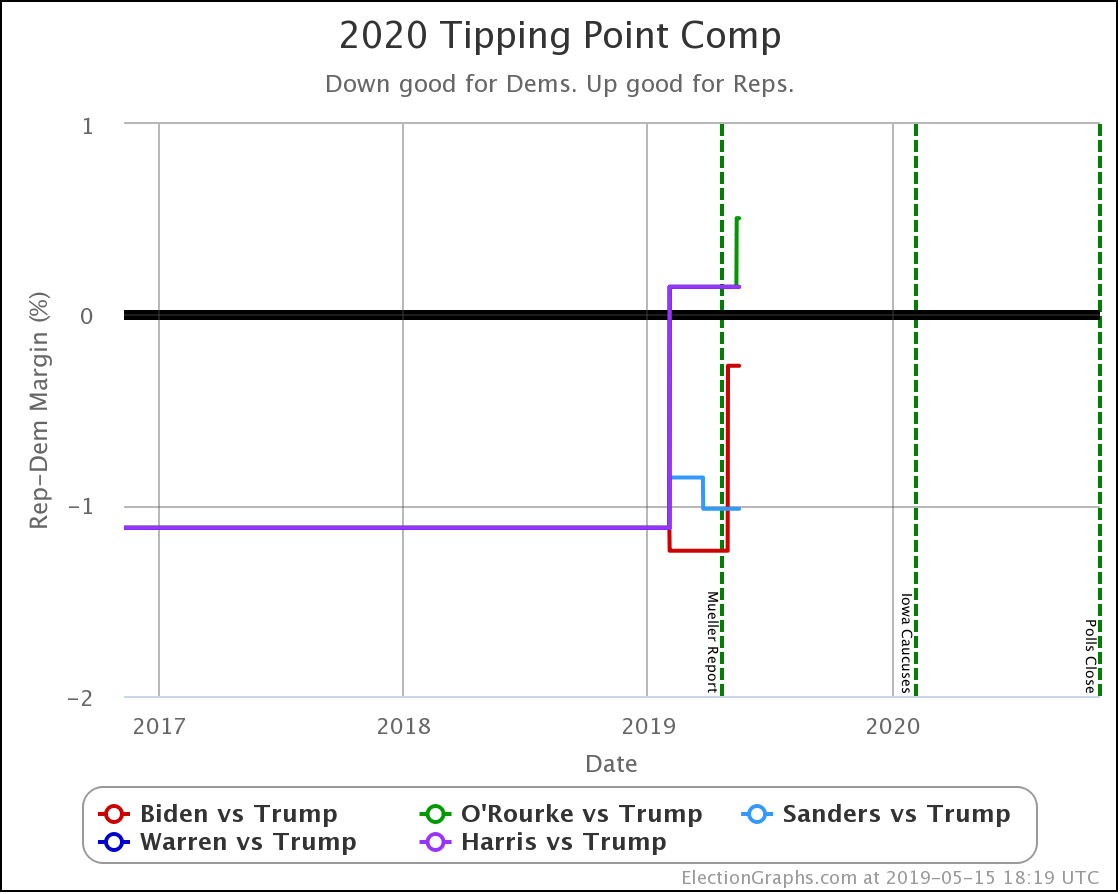
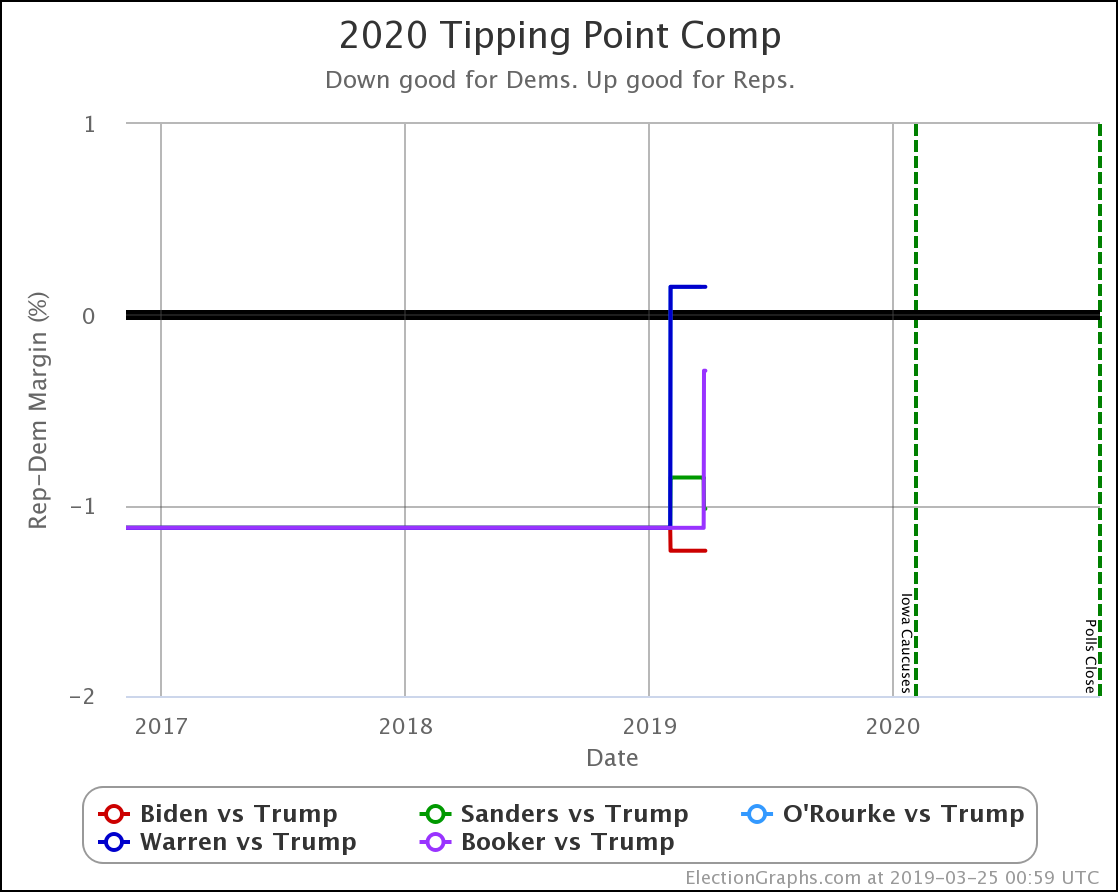
In the tipping point Warren, Sanders, and O'Rourke improve, while Buttigieg weakens.
Once again, you can see Warren crossing the center line to the winning side of the field.
And once again Biden does best, while O'Rourke does worst.
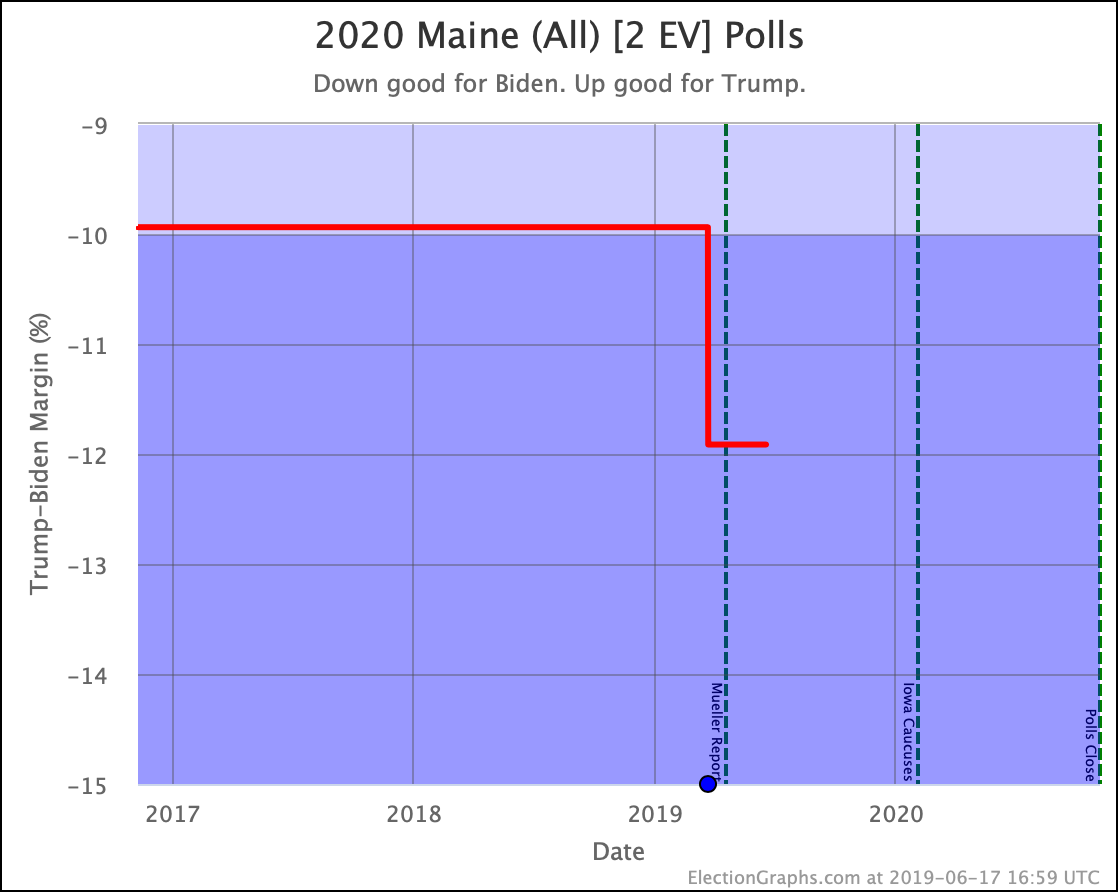
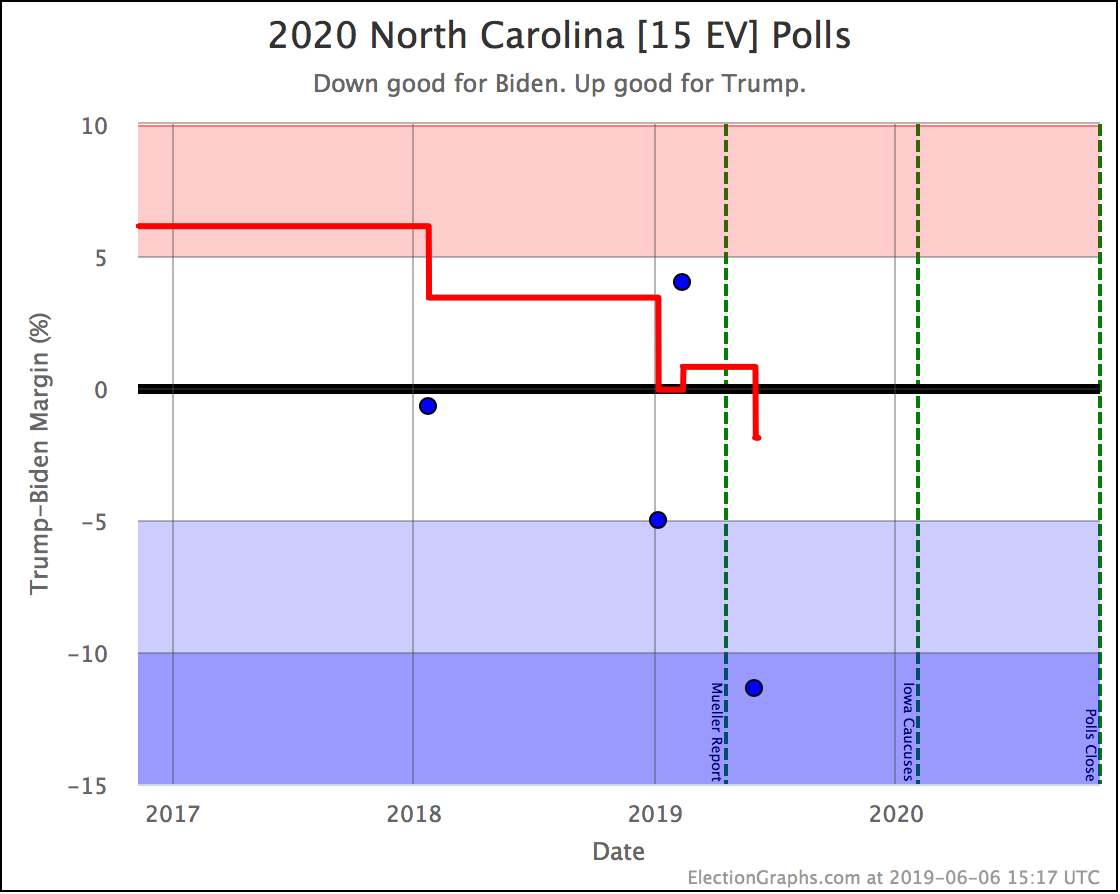
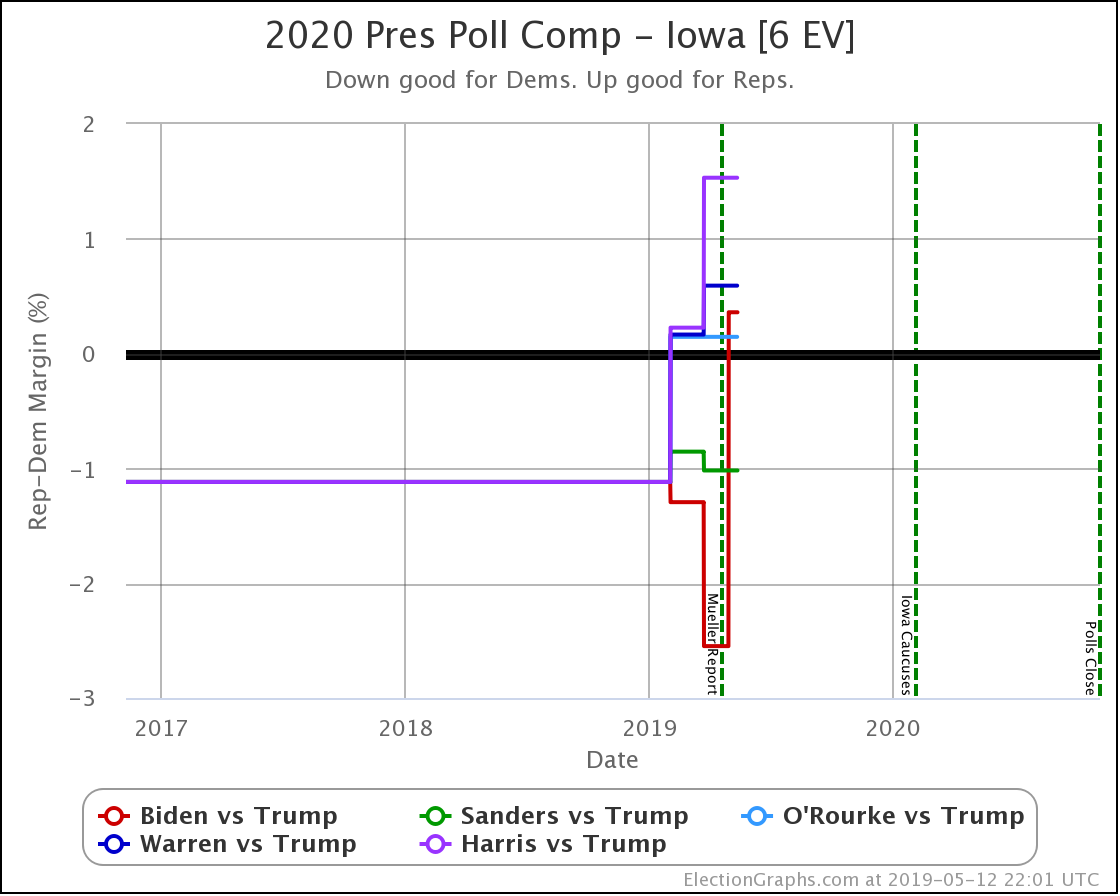
Now let's look at all of the states that had new polls in this batch:
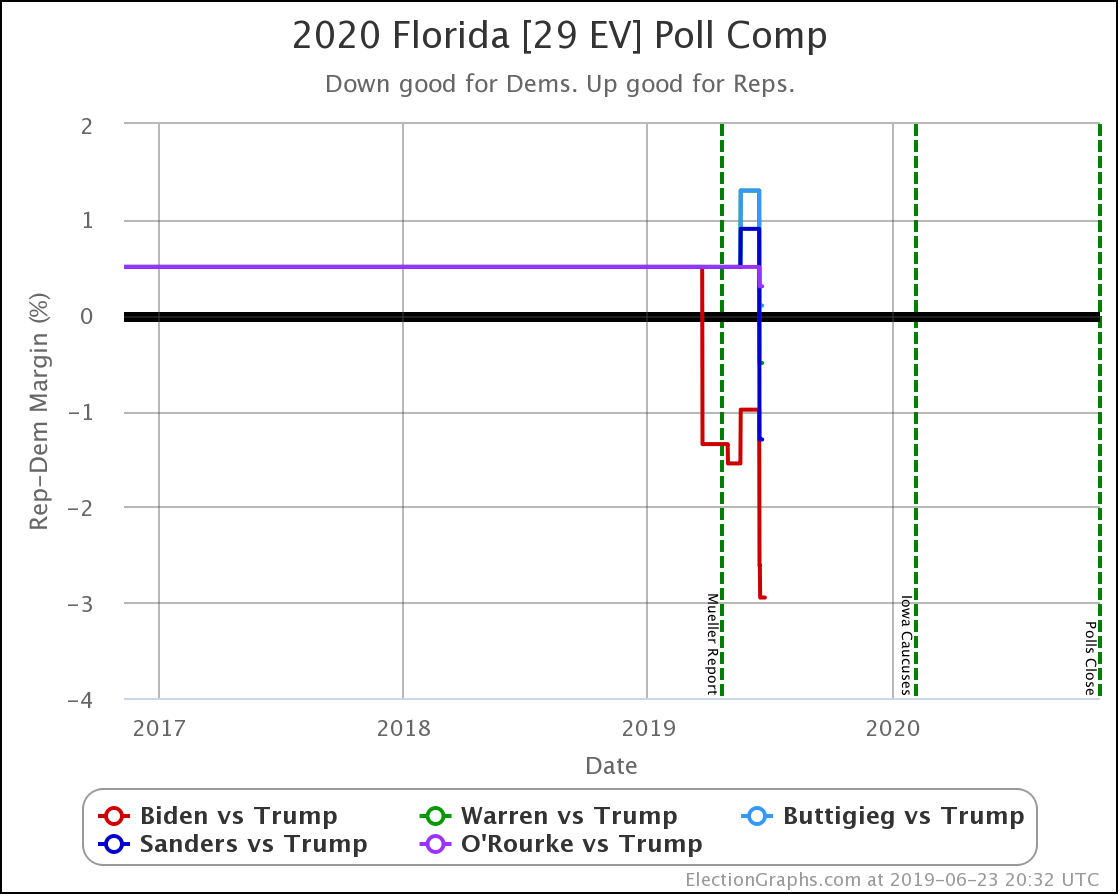
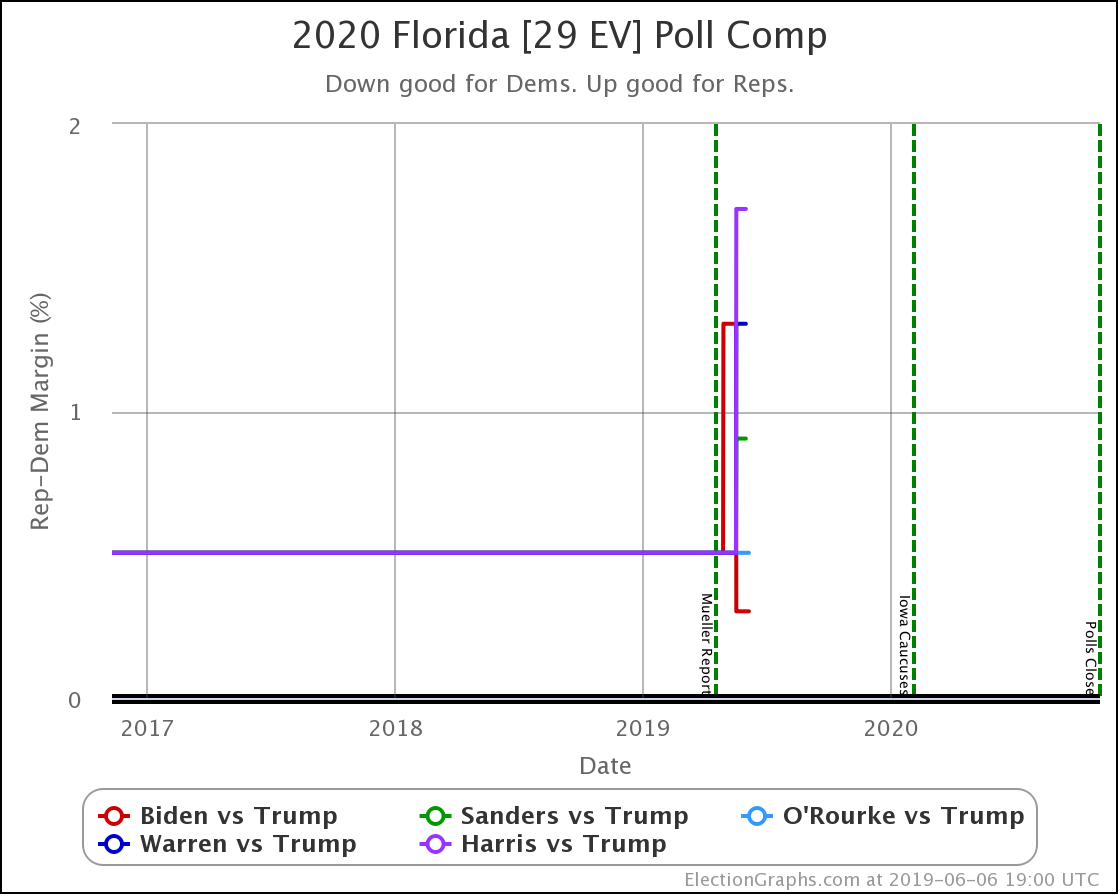
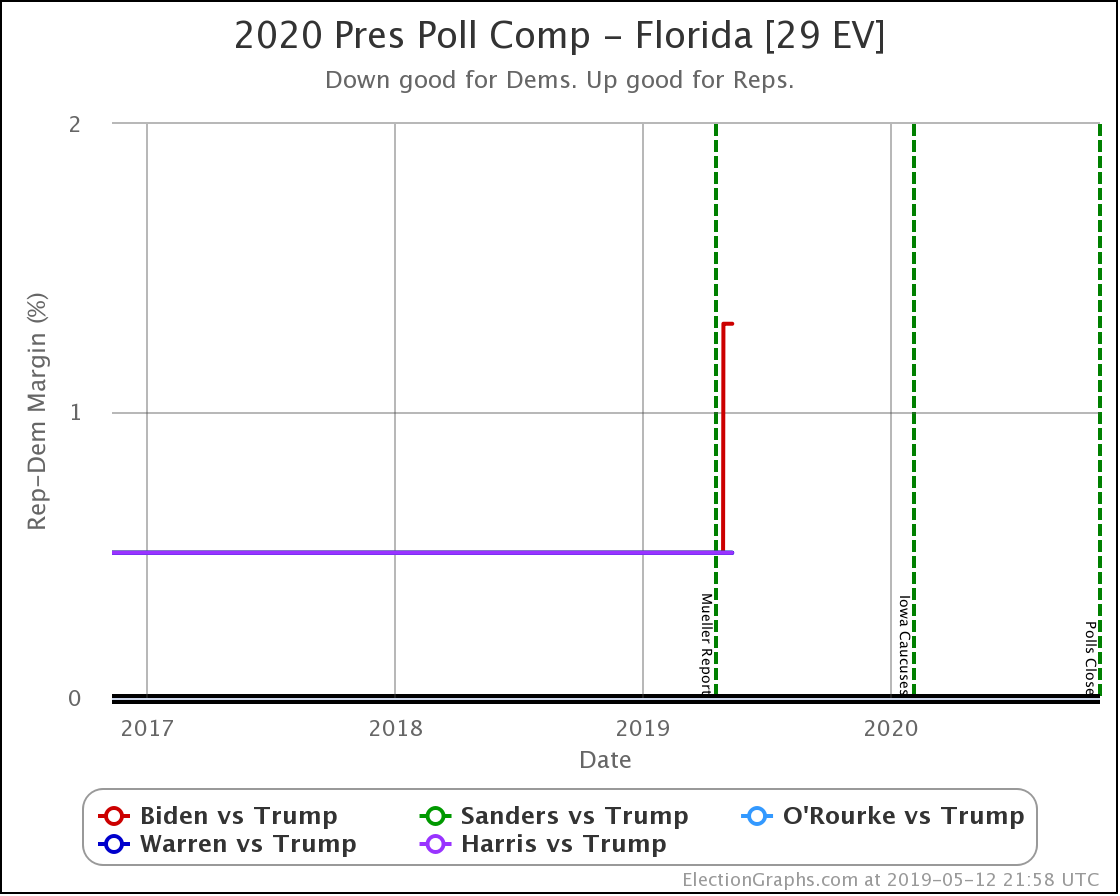
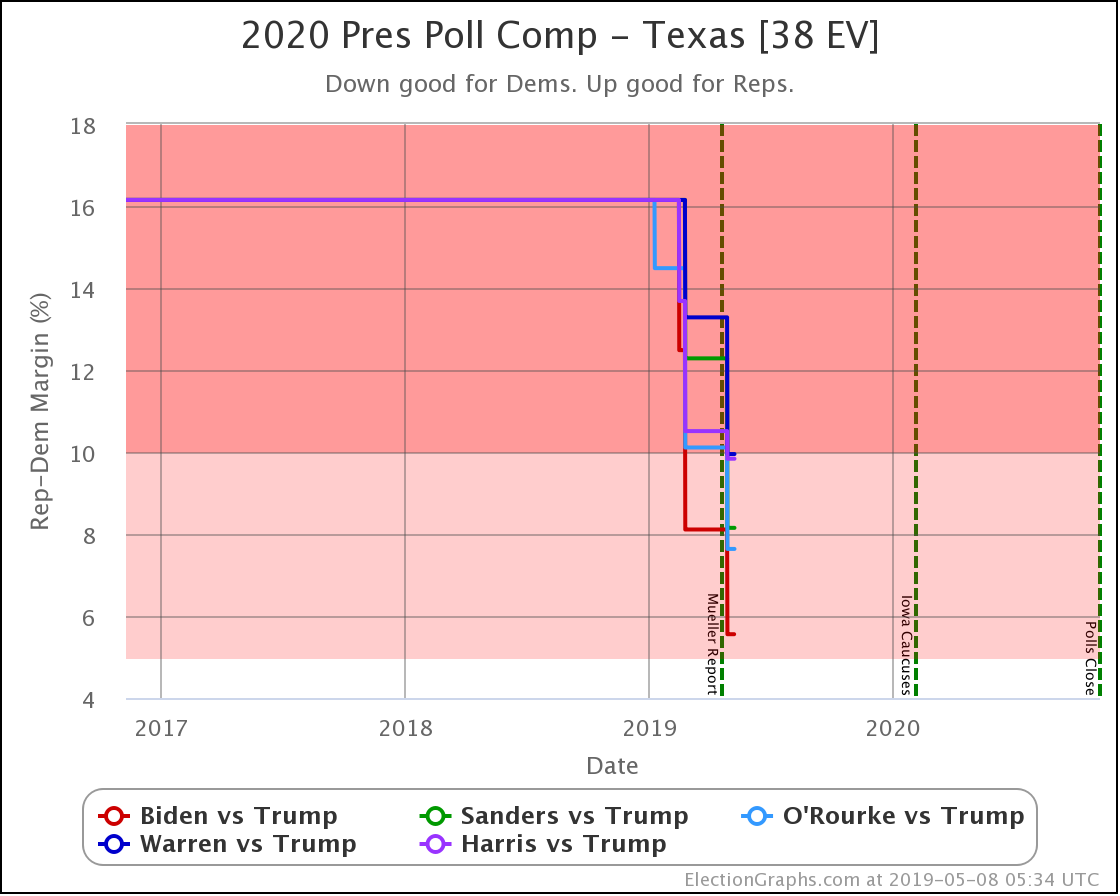
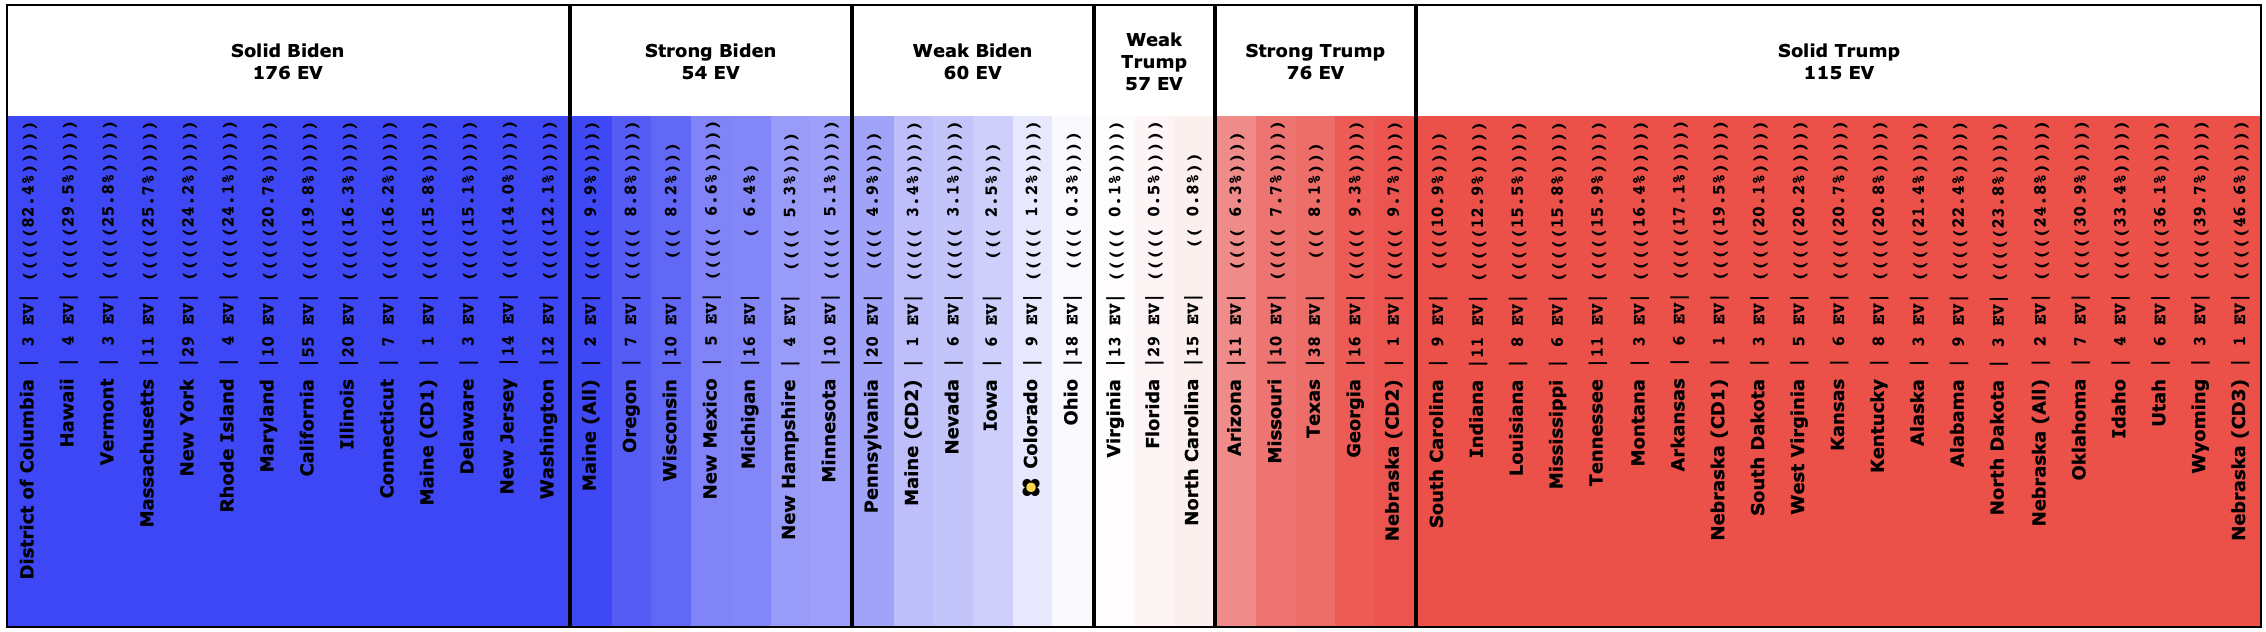
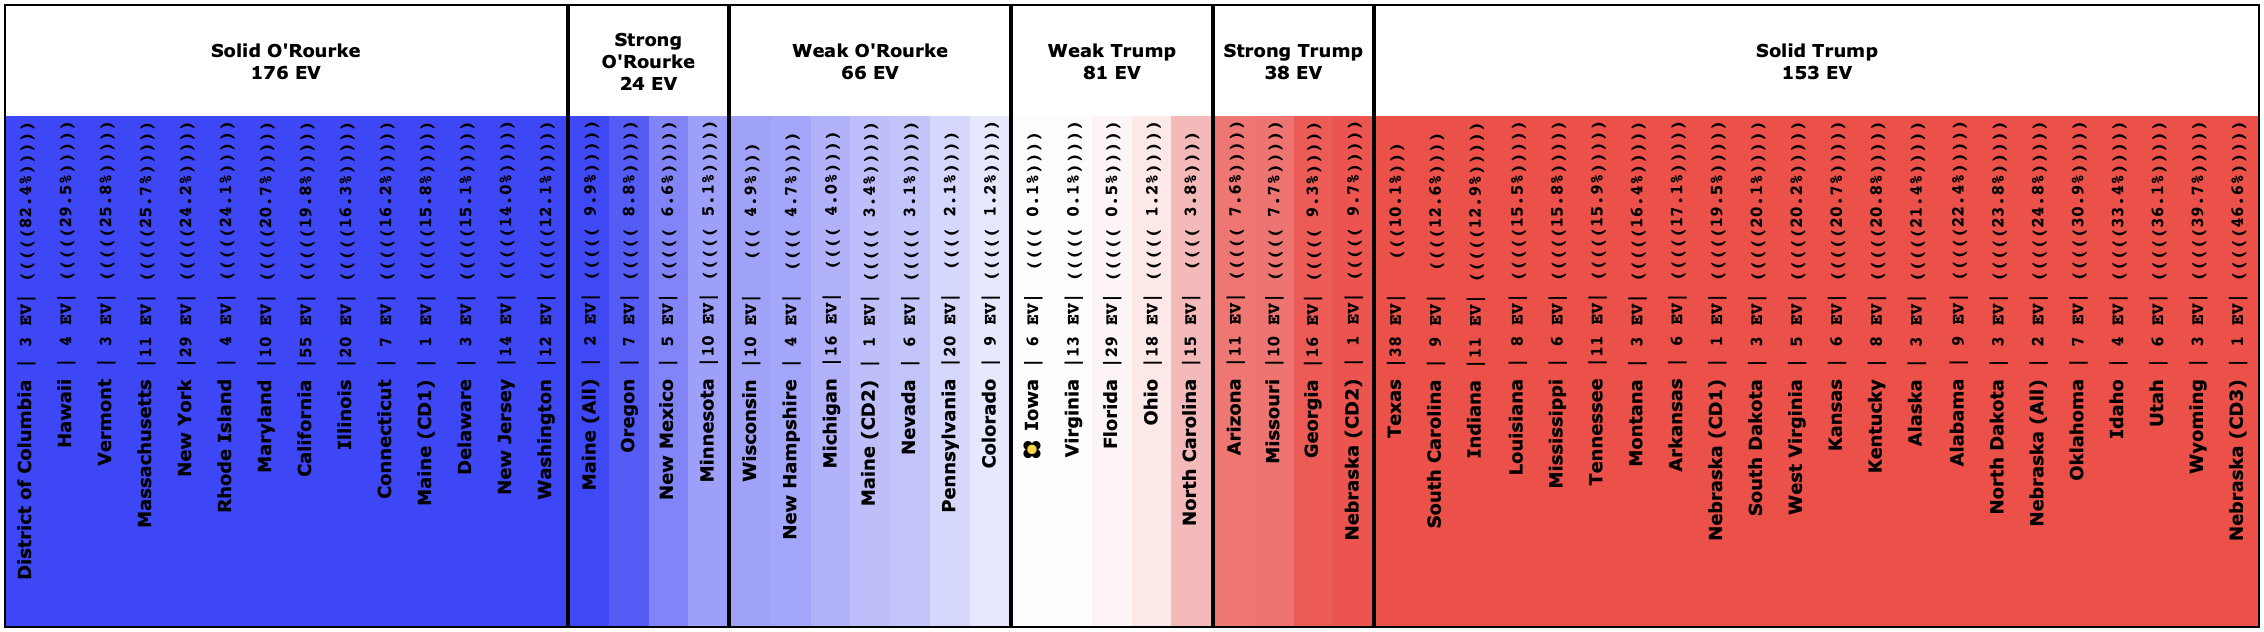
In Florida, O'Rourke and Buttigieg are losing to Trump. Biden, Warren, and Sanders are beating him. As usual, Biden is doing better than the other Democrats. But every single matchup here is close. As usual, Florida is a battleground state.
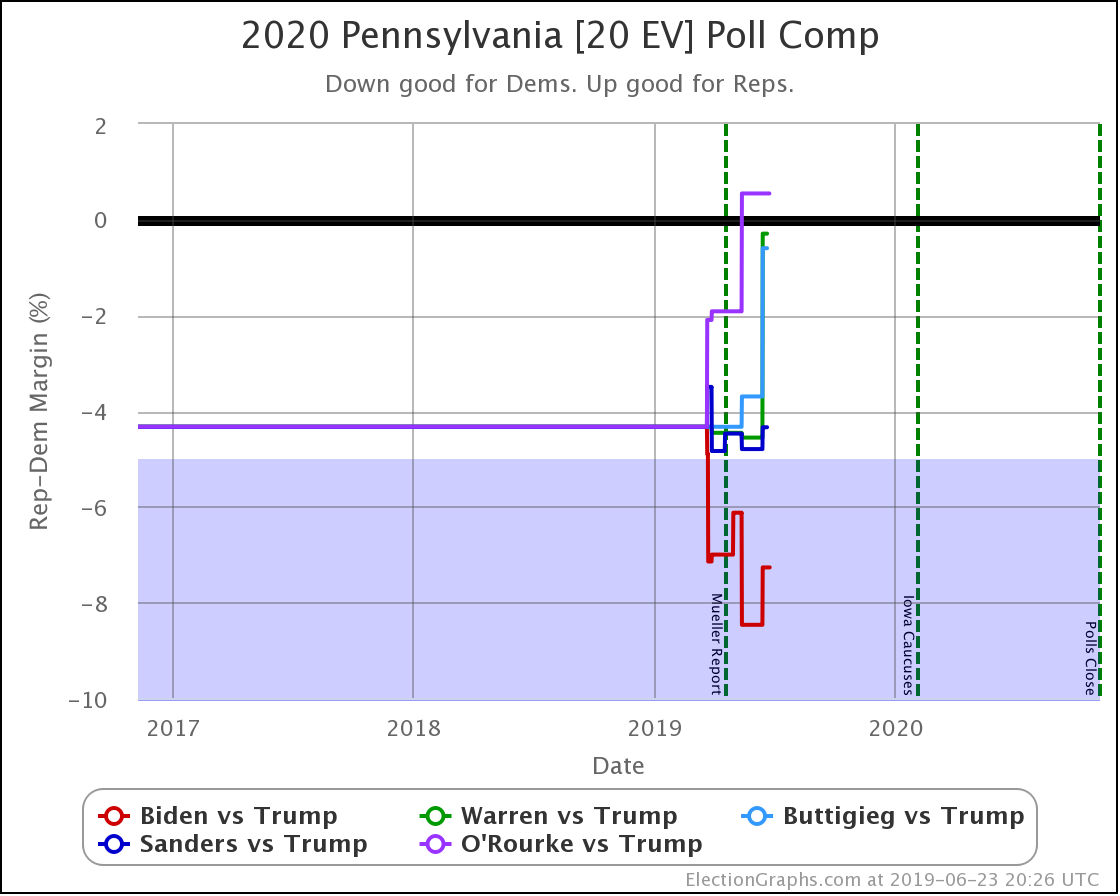
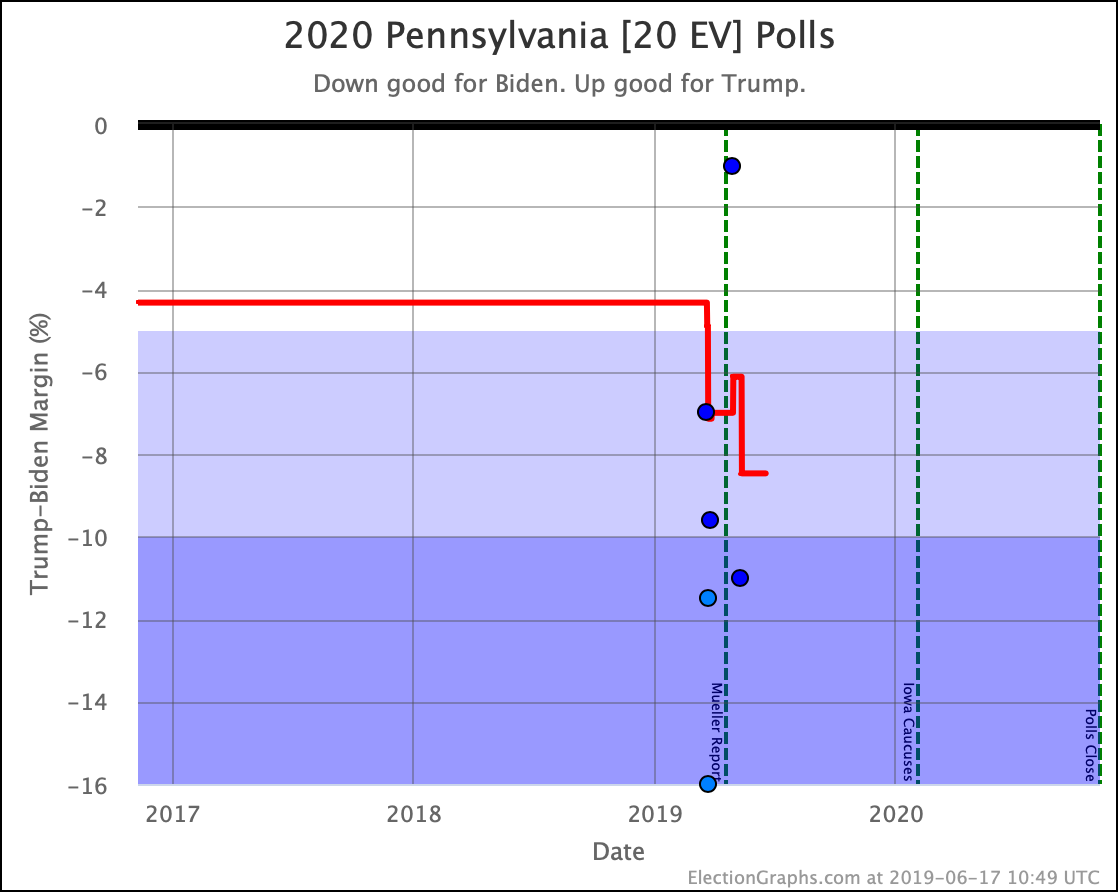
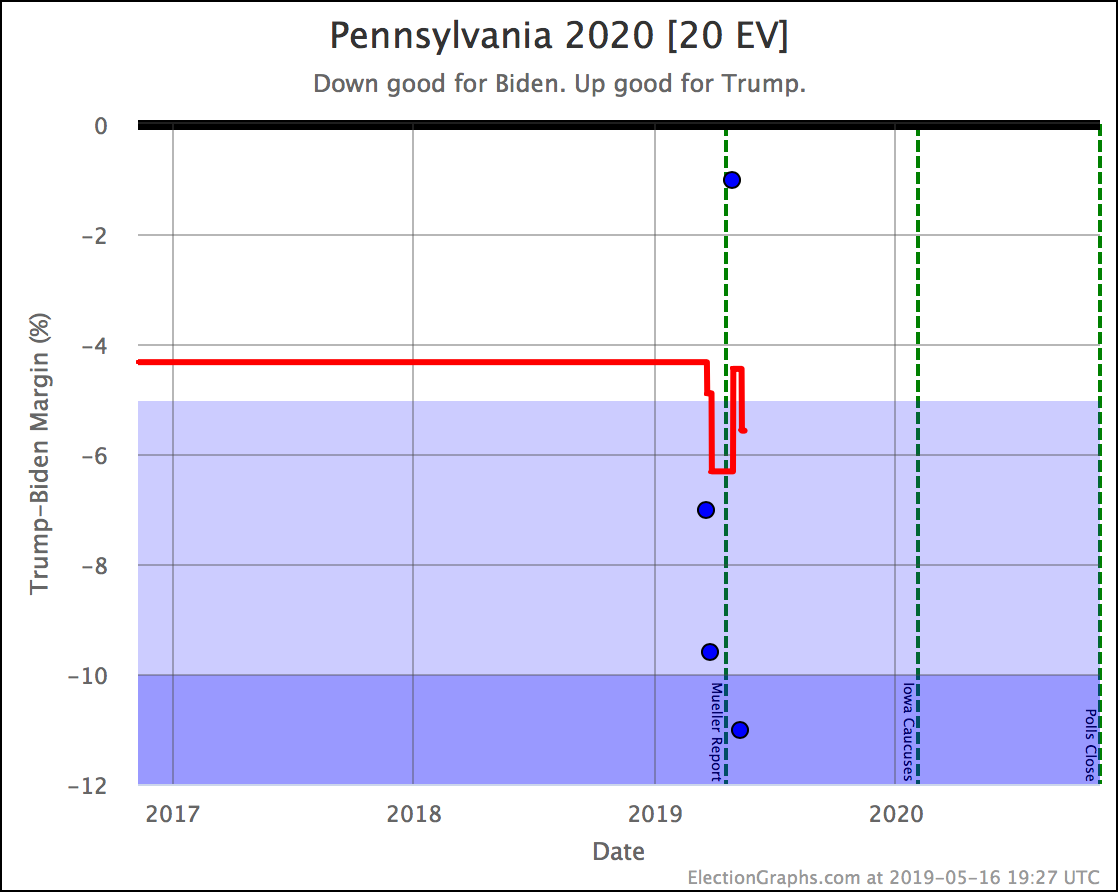
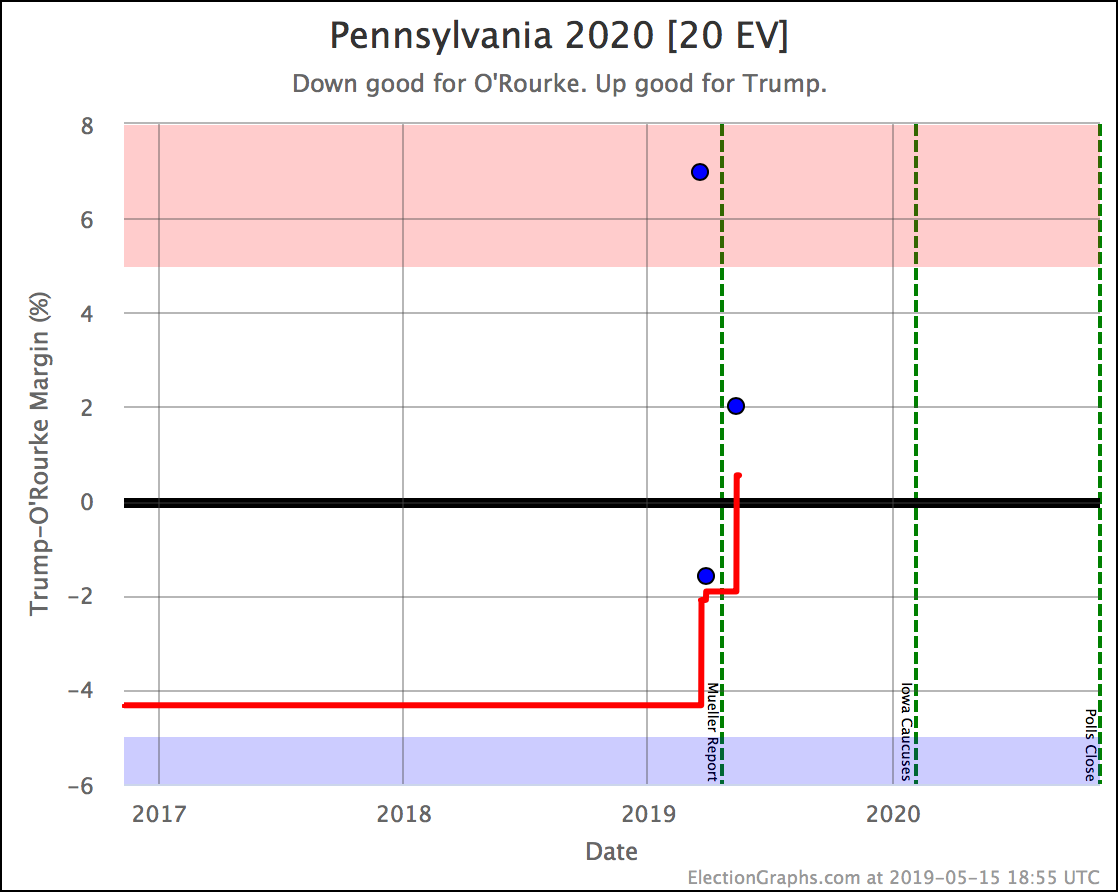
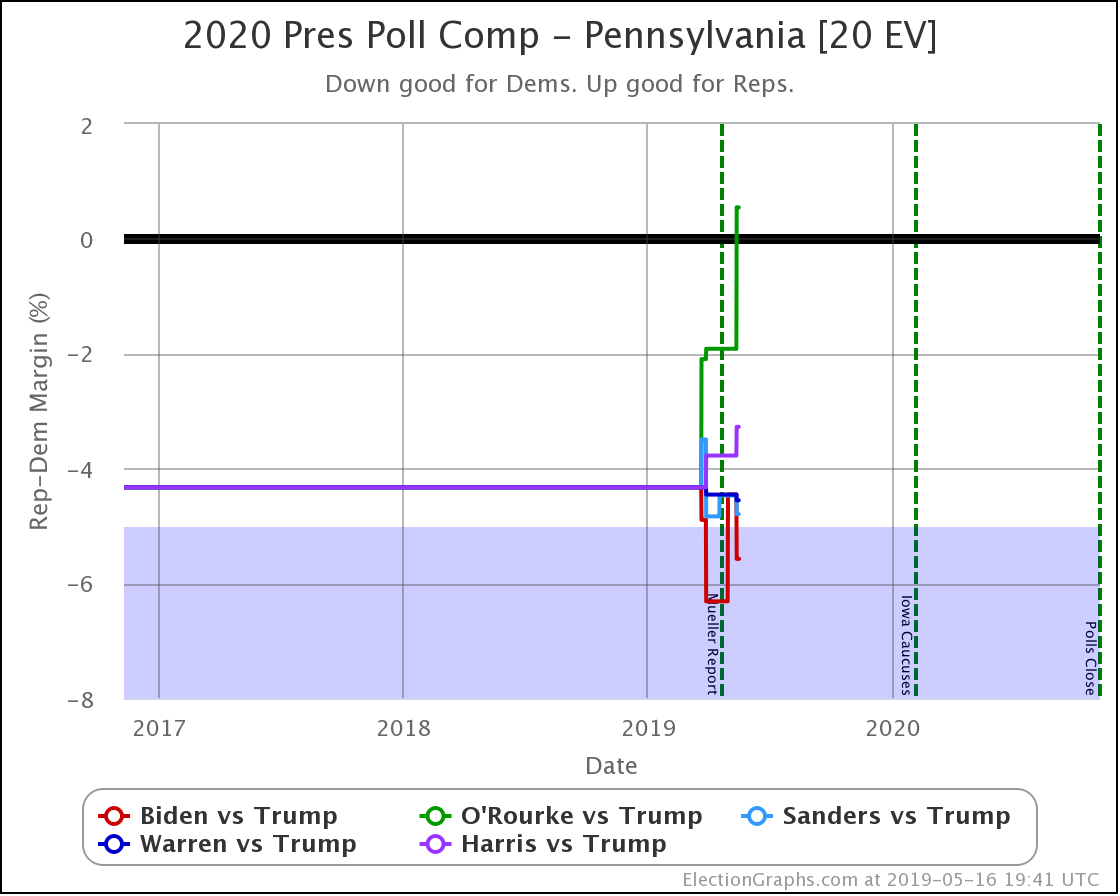
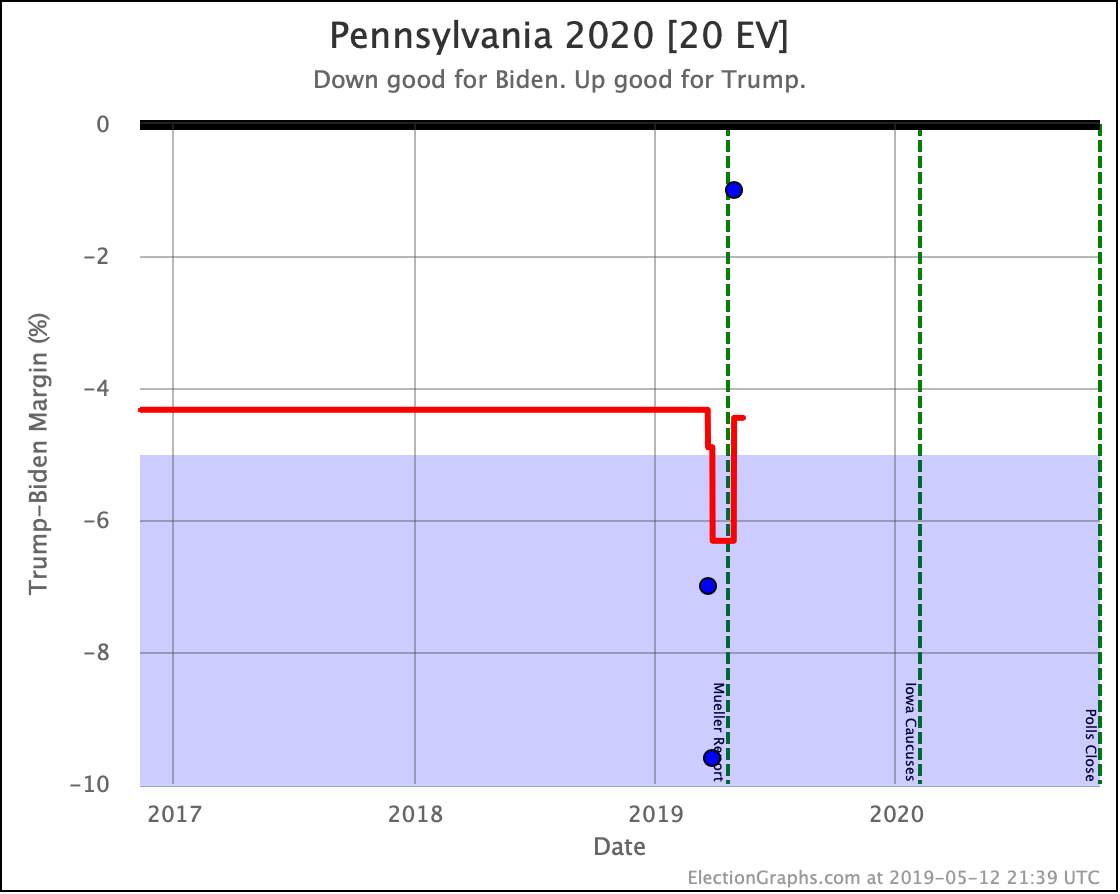
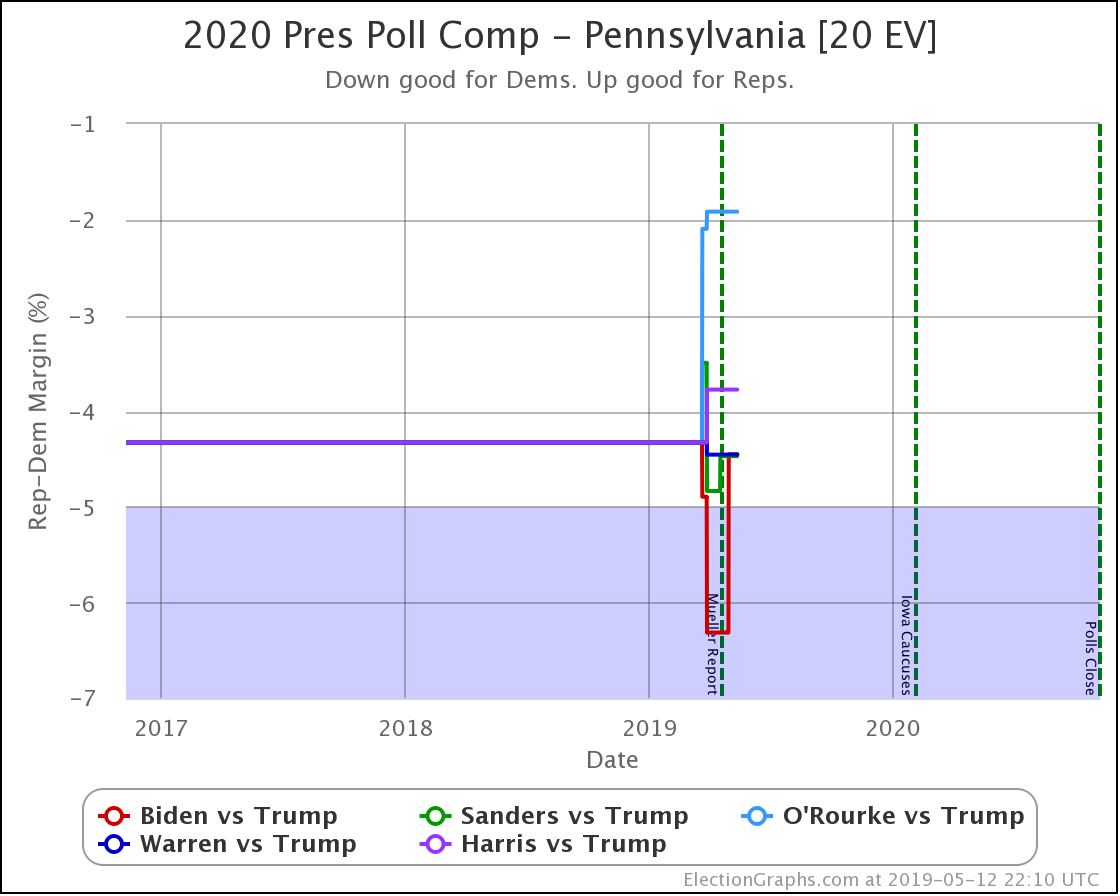
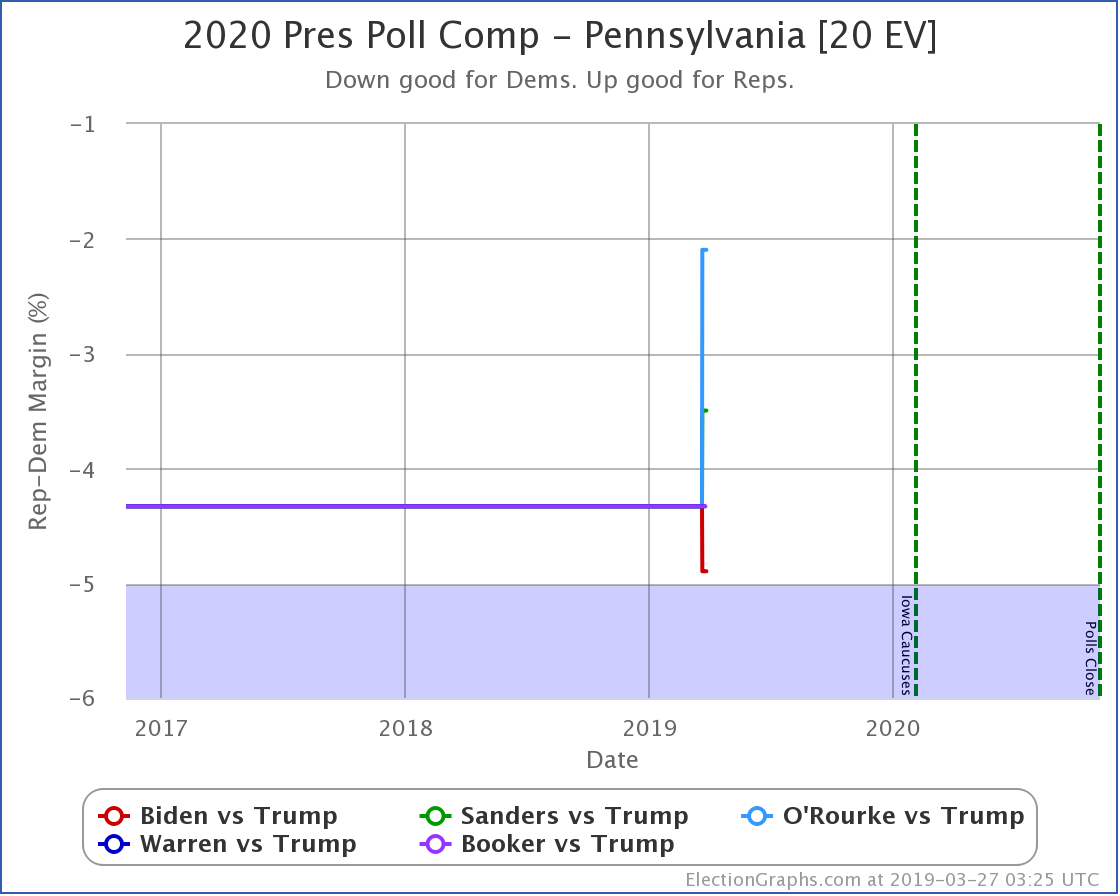
Biden has a healthy lead in Pennsylvania. O'Rourke is behind Trump. All the rest of these five Democrats are in the lead over Trump, but they have narrow edges.
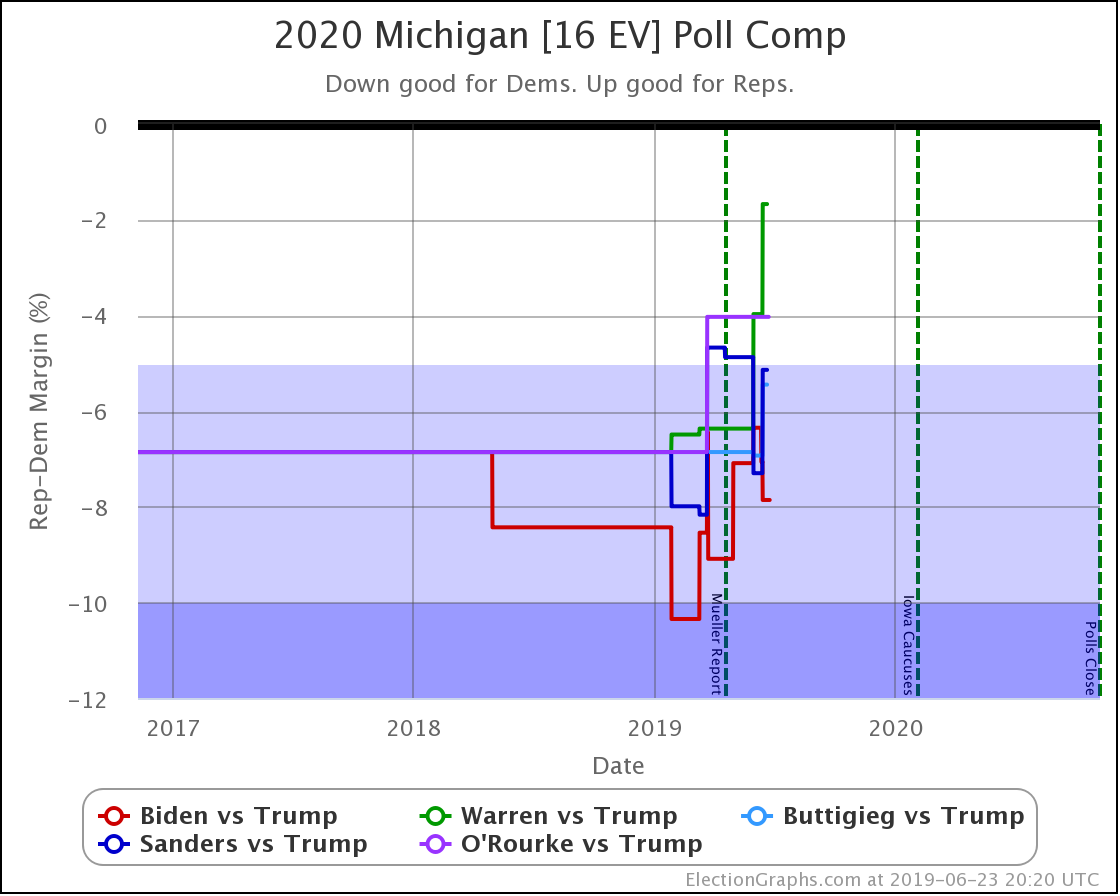
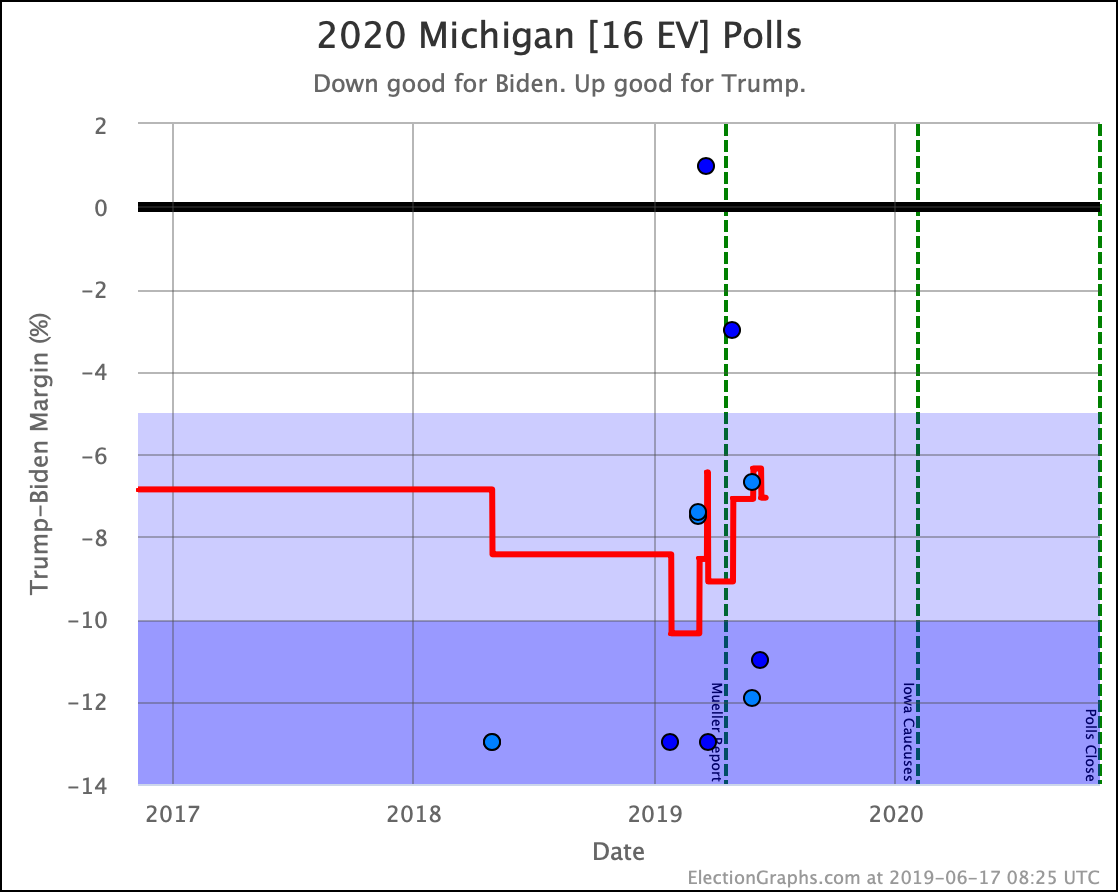
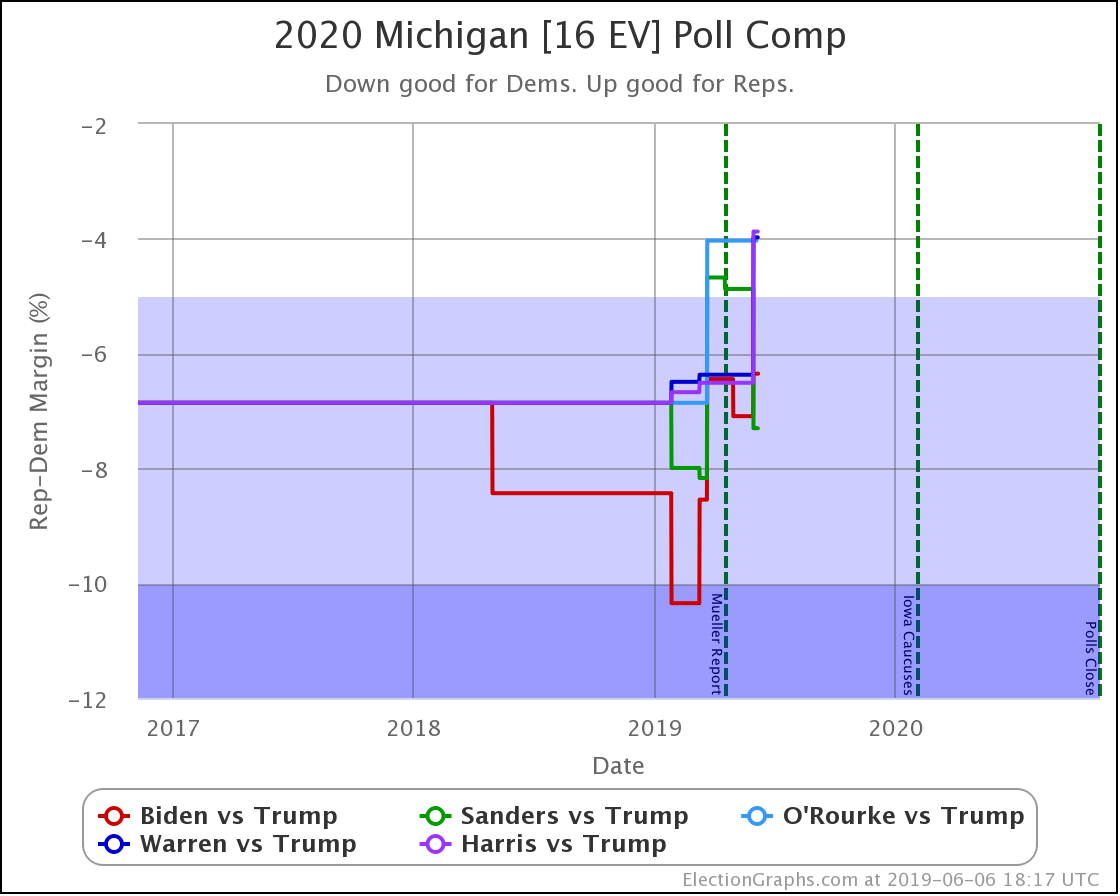
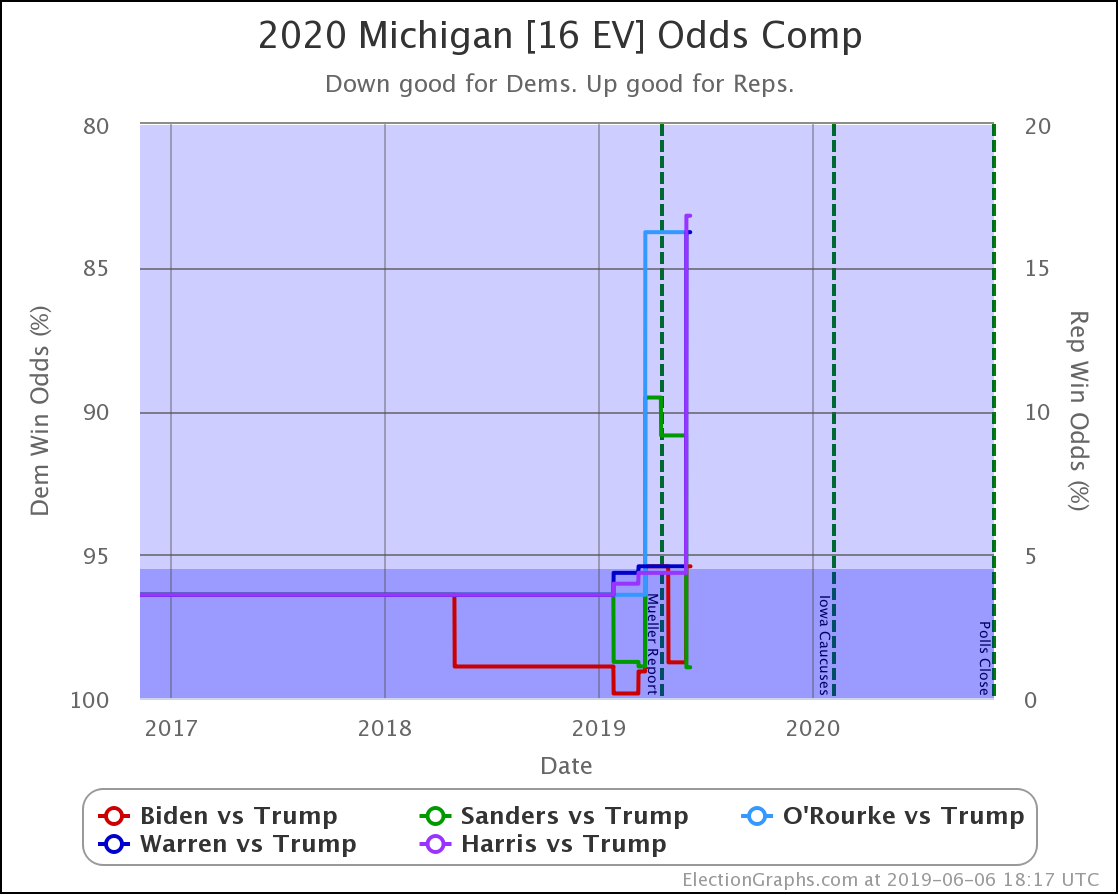
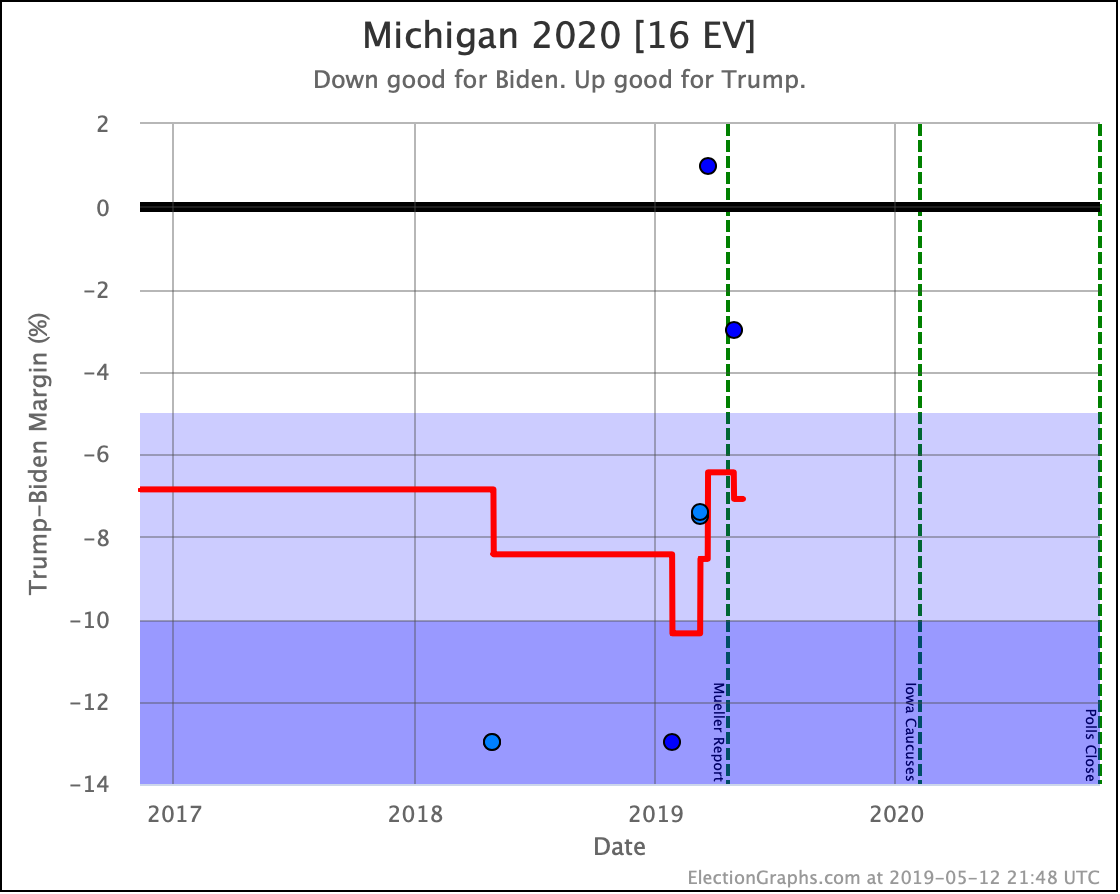
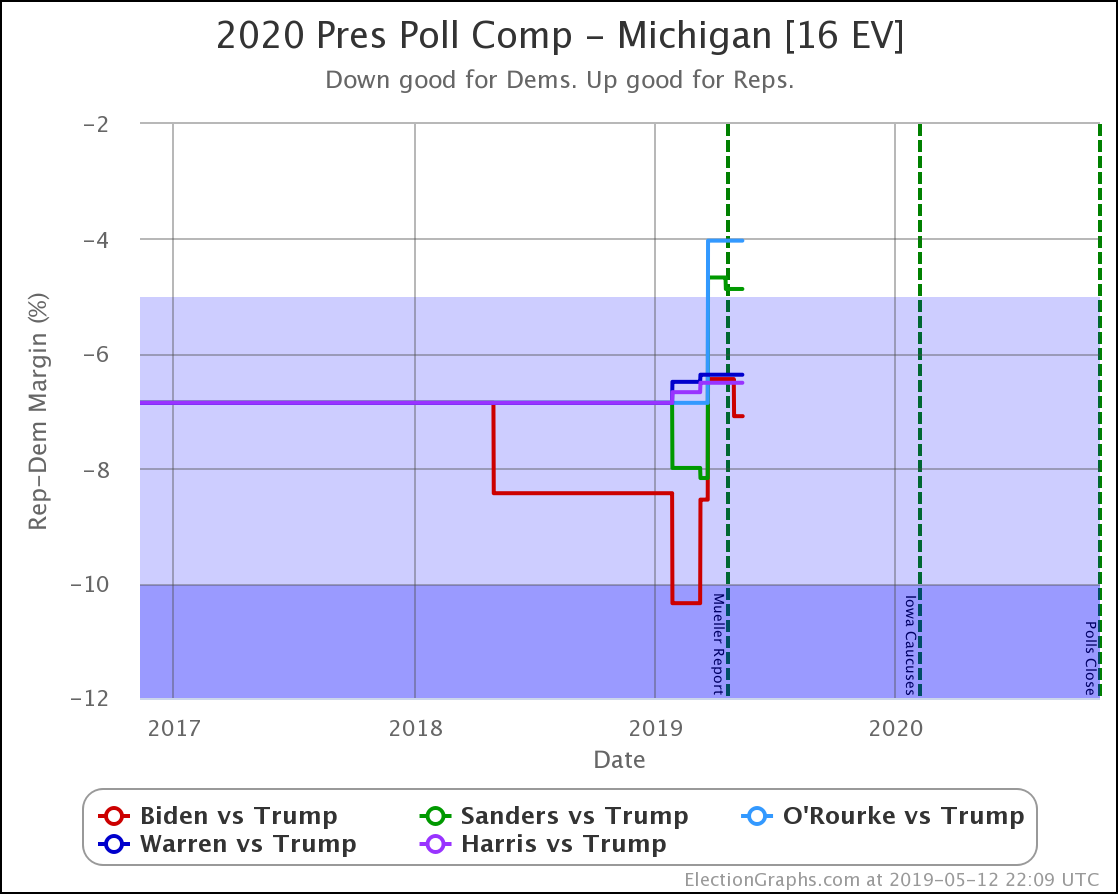
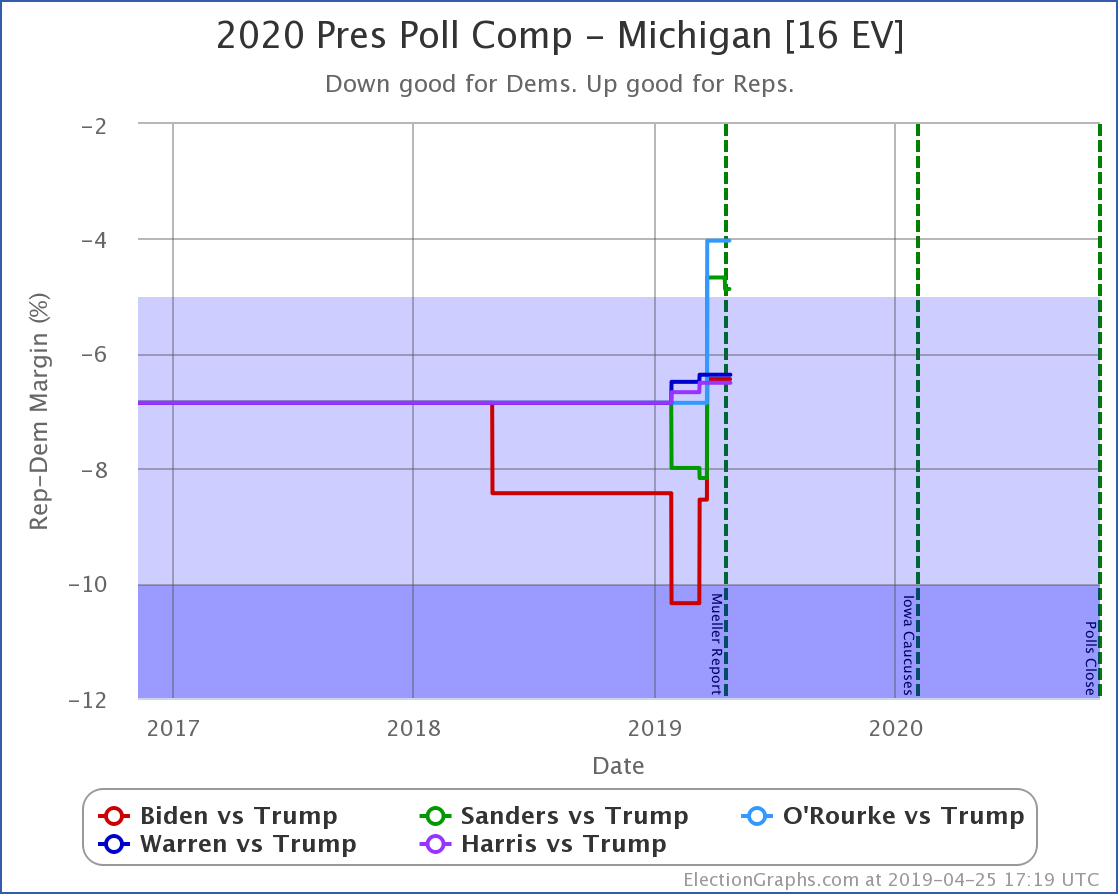
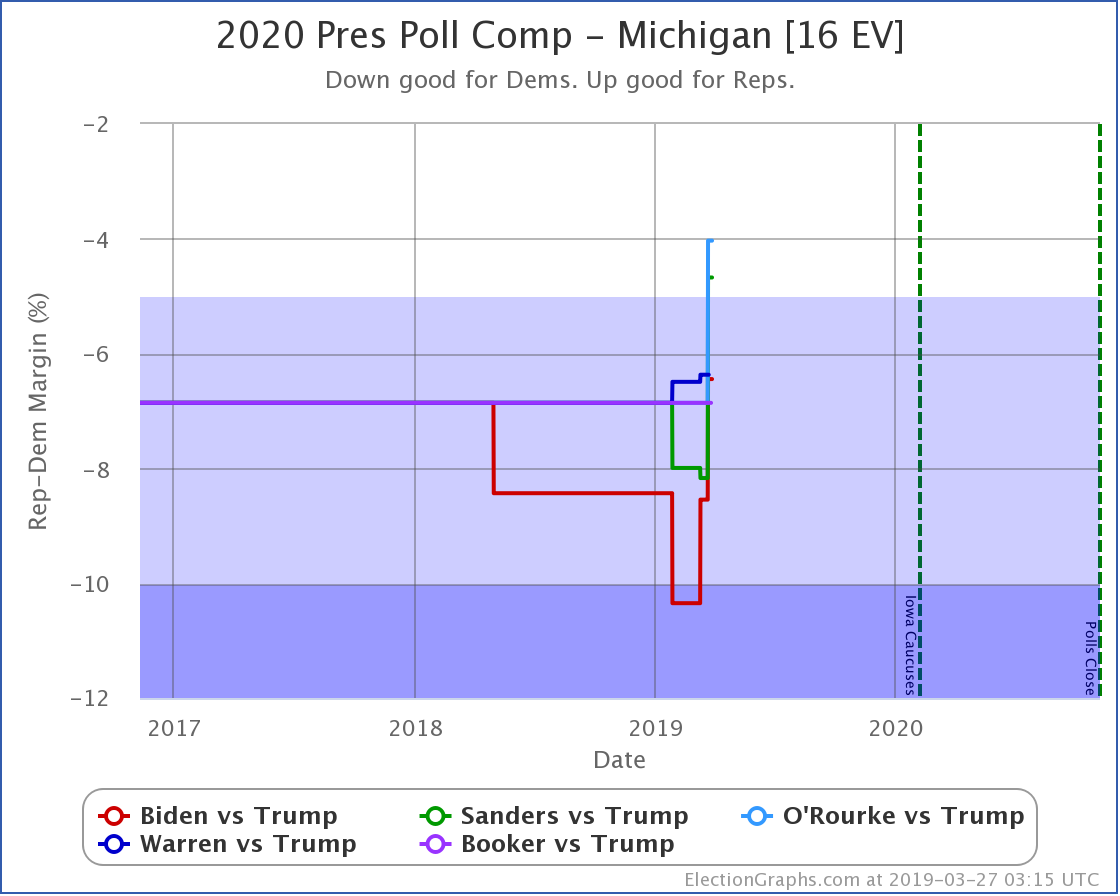
In Michigan, Biden is doing best. Warren is doing worst. Strong leads for Biden, Sanders, and Buttigieg. Warren and O'Rourke ahead by narrower margins. But all five leading Trump.
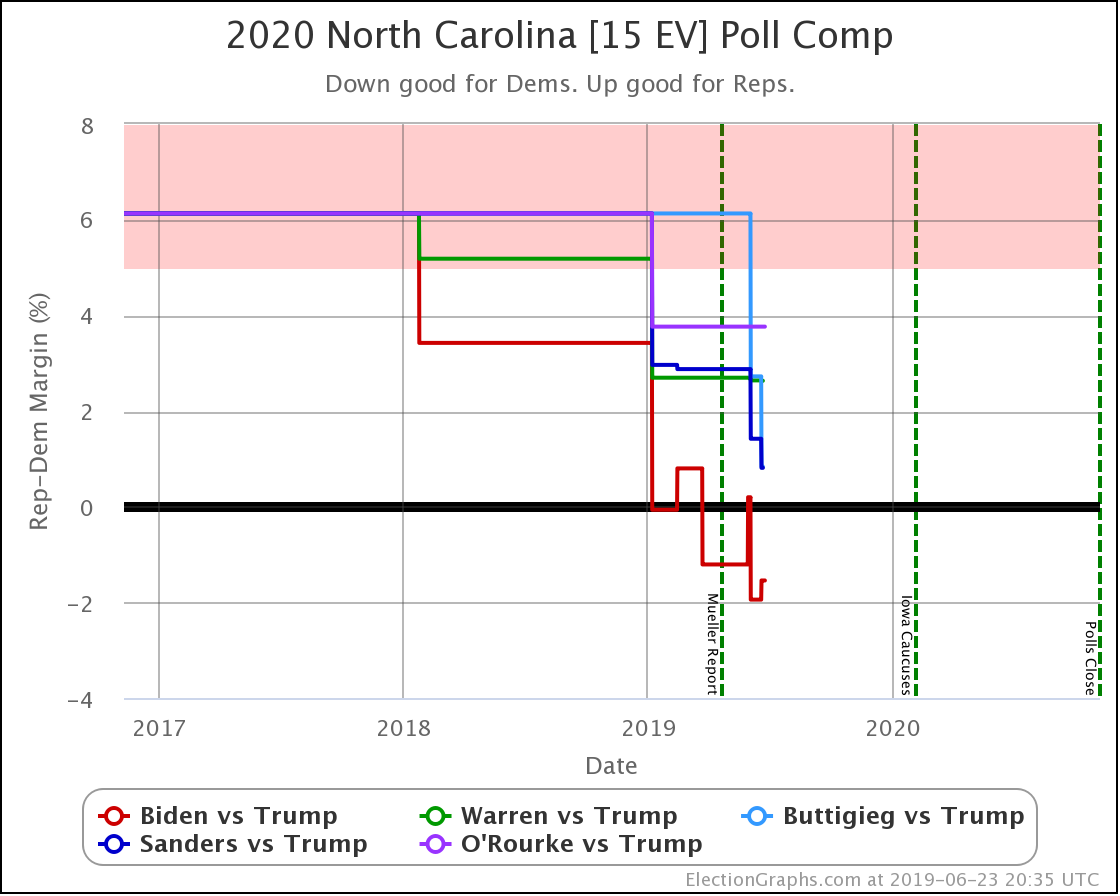
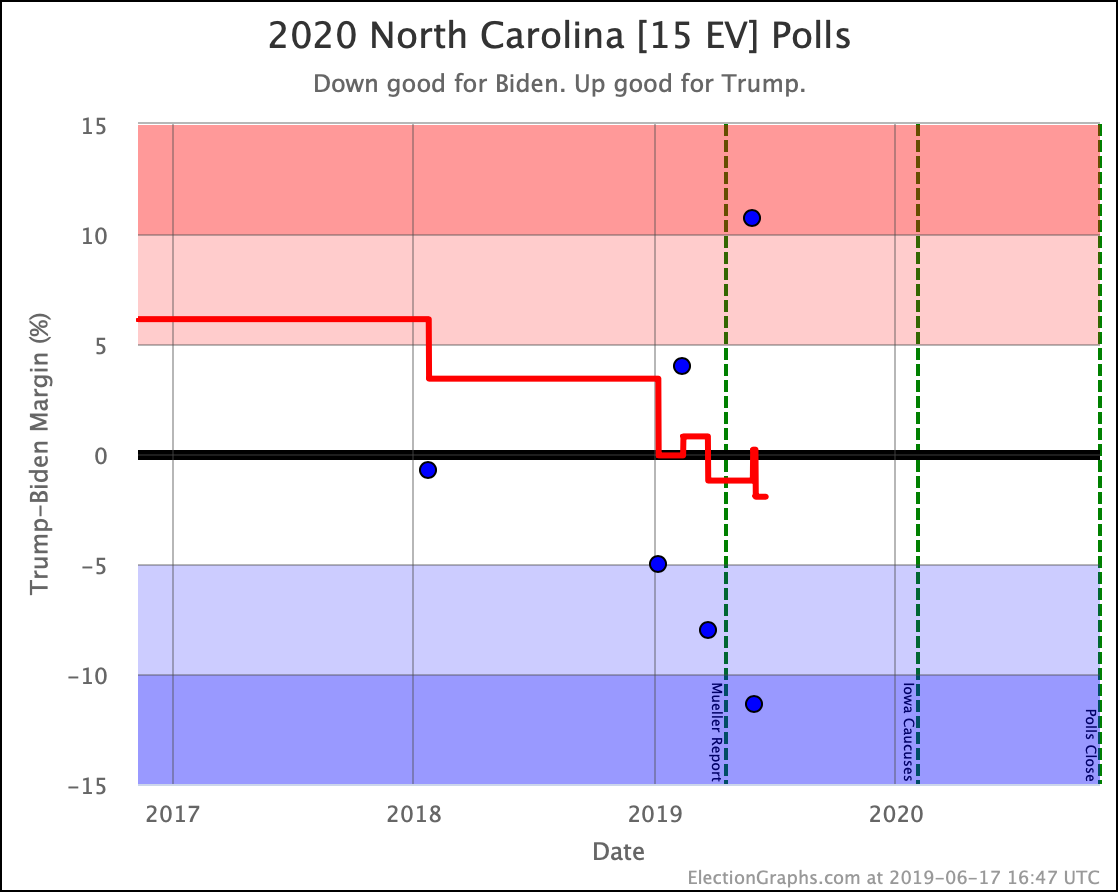
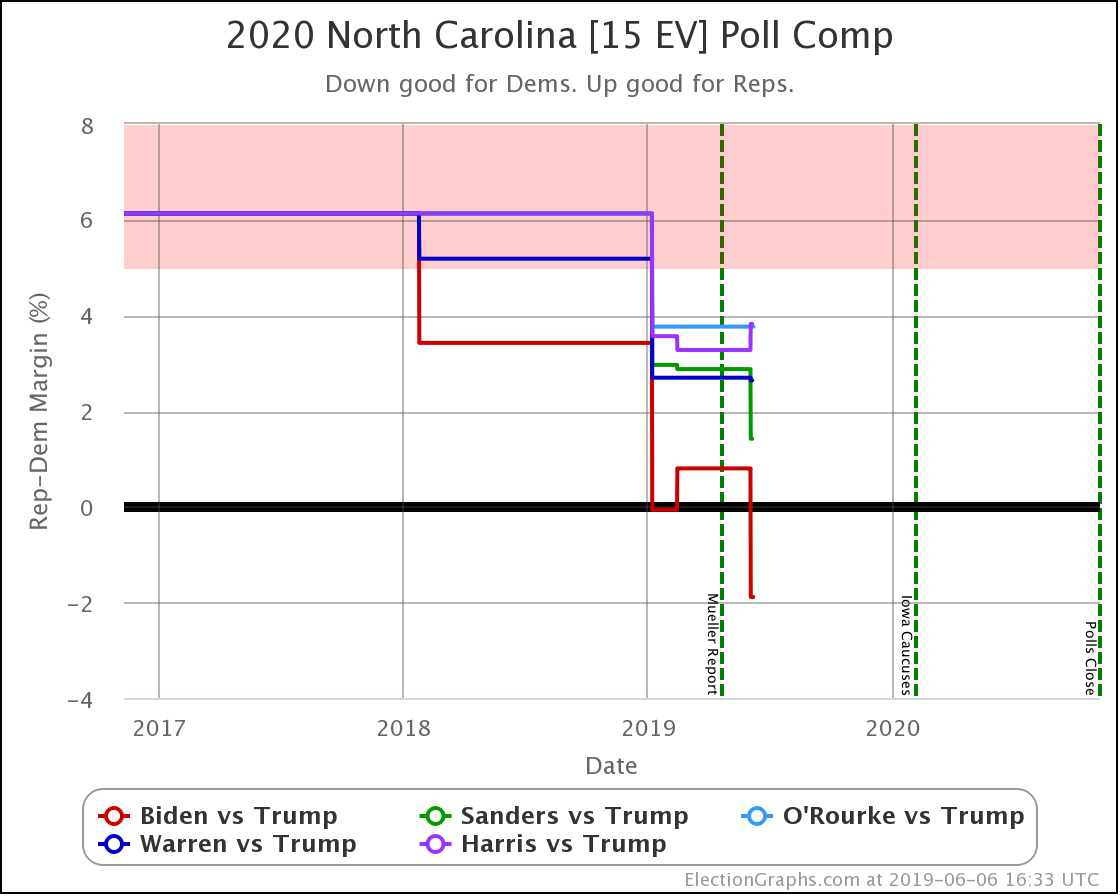
Biden is the only Democrat leading Trump in North Carolina. But all five would make it a close race. North Carolina is definitely in play at the moment.
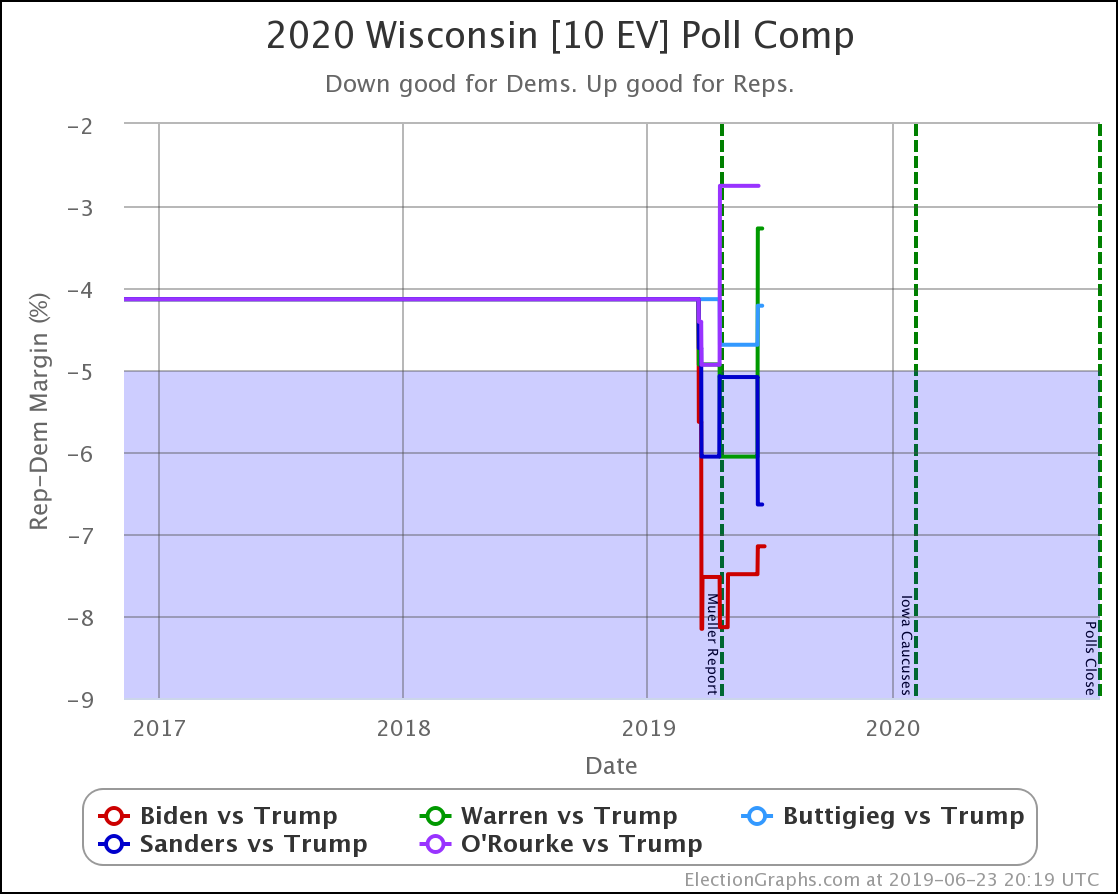
In Wisconsin, Biden is doing best, O'Rourke is doing worst. Biden and Sanders have strong leads. Buttigieg, Warren, and O'Rourke are only weakly ahead. But all five lead Trump.
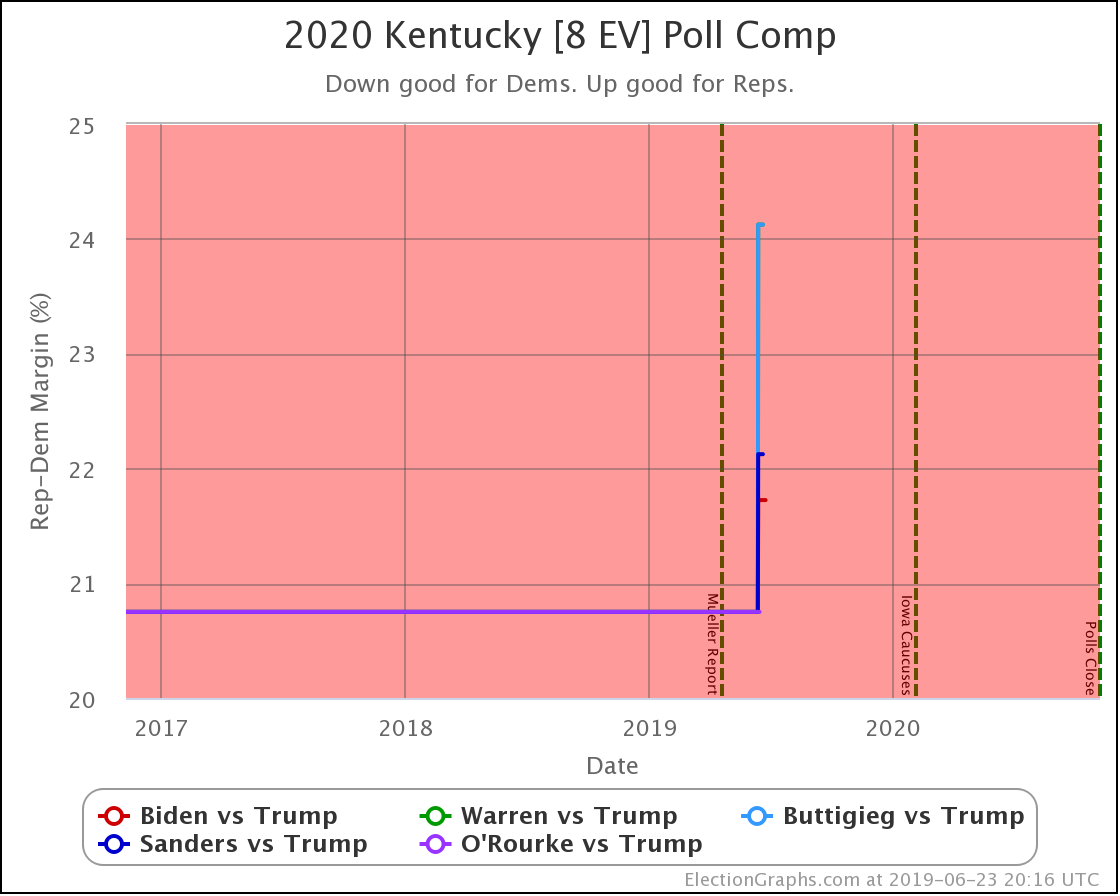
Kentucky is very very solidly red. With the very first Kentucky poll of the cycle, it looks like it may be even redder this time around than the average of the last five elections.
OK, finally, the odds based view of the national race. I haven't managed to make this view live on the site with graphs and all yet, but I'll at least provide updates here.
| Democrat | Dem Odds | Trump Odds | Tie Odds |
| Biden | 99.4% | 0.4% | 0.1% |
| Sanders | 86.0% | 13.2% | 0.8% |
| Buttigieg | 65.5% | 33.2% | 1.2% |
| Warren | 53.2% | 44.9% | 1.9% |
| O'Rourke | 50.5% | 47.8% | 1.7% |
For those missing Harris, since she dropped off my top five, she's now at a 62.3% chance of winning.
It remains striking what a vast range there is between Biden on the one end of this spectrum and O'Rourke on the other.
As always, the caveat that things can and will change, but if the election was today, Biden looks about as close to a sure thing as you can get (much stronger than the median odds based view Clinton had, which was at about 86% on election day), while meanwhile, O'Rourke looks like a coin toss.
If this is primarily due to name recognition and the main deciding factor for voters is simply Trump vs. non-Trump, you should see the divergence between various Democrats reduce over the next few months as people get to know some of the lesser-known Democrats.
If on the other hand, these kinds of differences persist as we get closer to the Iowa caucuses, then there are lots of people out there where the choice of Democrat does indeed influence them on their final vote. In this case, "electability" becomes a valid criterion for Democrats to consider when making their choices in the primaries and caucuses.
3.1 days until the first Democratic debate.
499.1 days until polls start to close on Election Day 2020.
For more information:
This post is an update based on the data on the Election Graphs Electoral College 2020 page. Election Graphs tracks a poll-based estimate of the Electoral College. The charts, graphs, and maps in the post above are all as of the time of this post. Click through on any image to go to a page with the current interactive versions of that chart, along with additional details.
Follow @ElectionGraphs on Twitter or Election Graphs on Facebook to see announcements of updates. For those interested in individual poll updates, follow @ElecCollPolls on Twitter for all the polls as I add them. If you find the information in these posts informative or useful, please consider visiting the donation page.