Small Improvements for Trump

Since the last update on May 9th, there have been new polls in California [x2], Ohio, Texas, Wisconsin [x3], Nebraska (CD2), Georgia [x3], New Jersey, North Carolina [x4], Florida [x4], Colorado, Arizona [x3], Virginia, Tennessee, Kentucky, Michigan [x4], Pennsylvania [x2], Washington [2], Minnesota, Maryland, Utah, New York, South Carolina, Indiana, and Missouri.

Despite all of this polling, things actually moved very little.

We'll start with the changes since last time on all of the metrics, then look at the graphs.

Model Metric 9 May 2 Jun 𝚫
Categories Trump Best
Expected
Biden Best
TIED
Biden +166
Biden +286
Trump +2
Biden +130
Biden +288
Trump +2
Trump +36
Biden +2
Tipping Point Biden +4.2 Biden +4.3% Biden +0.1%
Probabilities Trump 2σ
Median
Biden 2σ
Biden +36
Biden +130
Biden +240
Biden +22
Biden +122
Biden +234
Trump +14
Trump +8
Trump +6
Trump Win
Tie
Biden Win
0.2%
0.0%
99.8%
0.5%
0.1%
99.4%
+0.3%
+0.1%
-0.4%

The biggest change is in the "Expected Case" where Trump reduces his losing margin against Biden from 166 EV to 130 EV.

This is due to Ohio.

The polling average in Ohio moved from just barely Biden, to just barely Trump. Since the categorization model's Expected Case only cares who is in the lead, not by how much, this moves Ohio's 18 EV from one side to the other, for a net change in margin of 36 EV.

The probabilistic view, however, recognizes that both of these situations represent a close state that is very much in play. In addition, other close states move around a bit without actually changing category, but in ways that move the probabilistic results.

The net result is still Biden weakening a bit, just not quite as much as in the categorization view:

Aside from Ohio, Trump had nice movements in his direction in two close states:

This was countered a little bit by improvements for Biden in a couple of states:

But that wasn't enough to improve Biden's overall situation. On balance, although it has been small, the movement in the last few weeks has been toward Trump.

If the election was held today, Biden retains an overwhelming advantage.

But as usual, we point out that the race is dynamic. It would only take a 4.3% shift in the polls to make Trump the favorite, and that kind of change can happen in a matter of weeks. We have a long way to go.

Right now these are the battlegrounds:

And this is the map:

154.7 days until polls start to close on election night.

For more information:

This post is an update based on the data on the Election Graphs Electoral College 2020 page. Election Graphs tracks a poll-based estimate of the Electoral College. The charts, graphs, and maps in the post above are all as of the time of this post. Click through on any image for current interactive versions of the chart, along with additional details.

Follow @ElectionGraphs on Twitter or Election Graphs on Facebook to see announcements of updates. For those interested in individual poll updates, follow @ElecCollPolls on Twitter for all the polls as I add them. If you find the information in these posts informative or useful, please consider visiting the donation page.

Yeah. Done Here. Over.

Arizona, Florida, and Illinois add to the delegate totals as a result of primaries on March 17th. Although initially scheduled for the same day, Ohio's governor and health department delayed that state's election due to the coronavirus pandemic. Even without Ohio, there was a nice haul of 441 delegates for the evening.

Going into the evening, Biden needed at least 223 of those delegates (50.52%), to be on a winning pace. By contrast, Sanders needed 255 delegates (57.78%).

We had discussed after the March 10th states how this was an almost unreachable bar for Sanders. That winning at that level would require a seismic change in the state of the race.

No such massive realignment happened. Although exact delegate totals will continue to shift as counts become final, as of election night, the March 17th results look like:

  • Biden 294 (66.7%)
  • Sanders 147 (33.3%)

Biden significantly exceeded the marks he needed. Sanders came nowhere near where he would have had to have been.

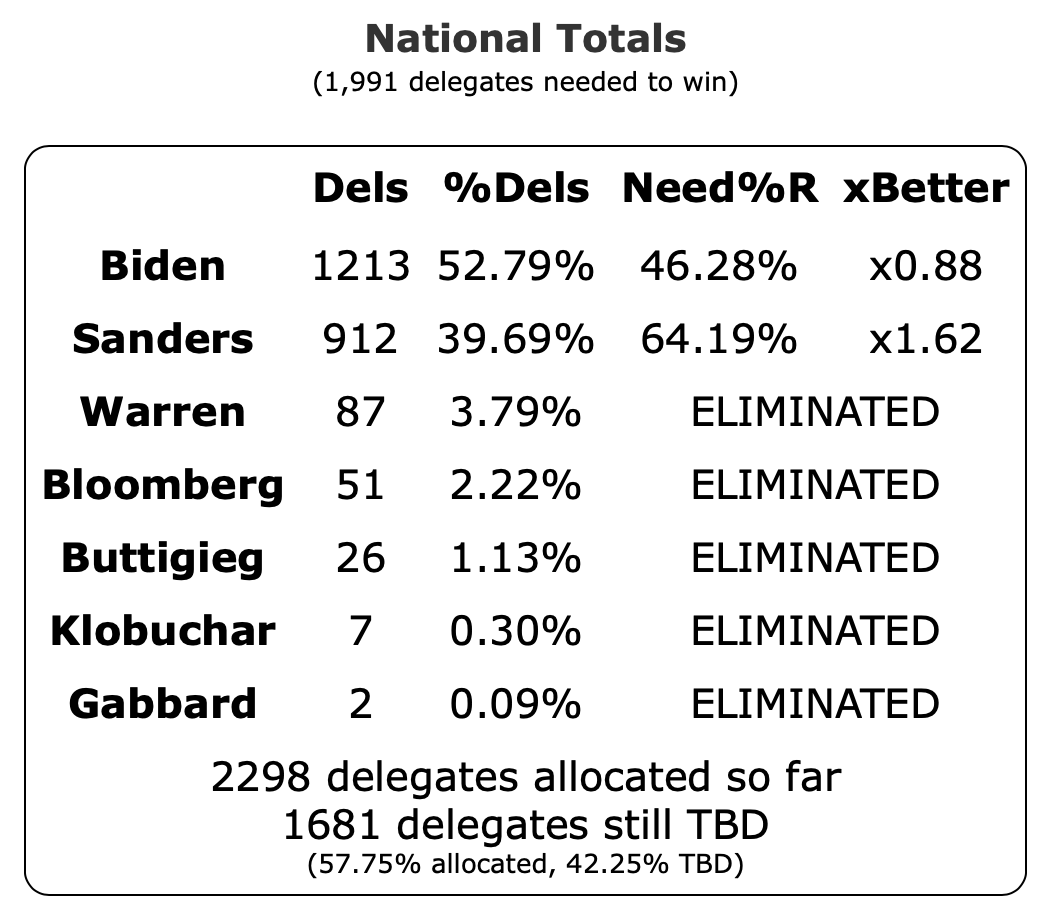
Everybody else other than Biden and Sanders has now been mathematically eliminated.

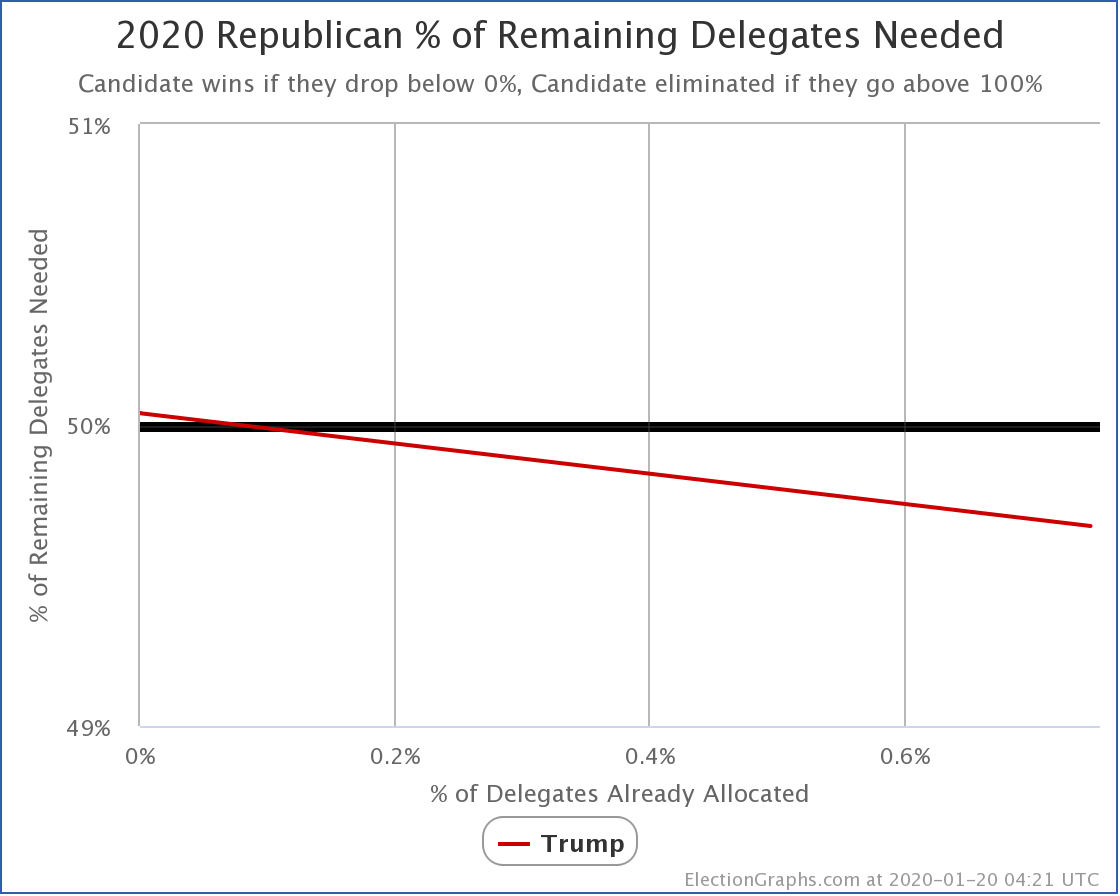
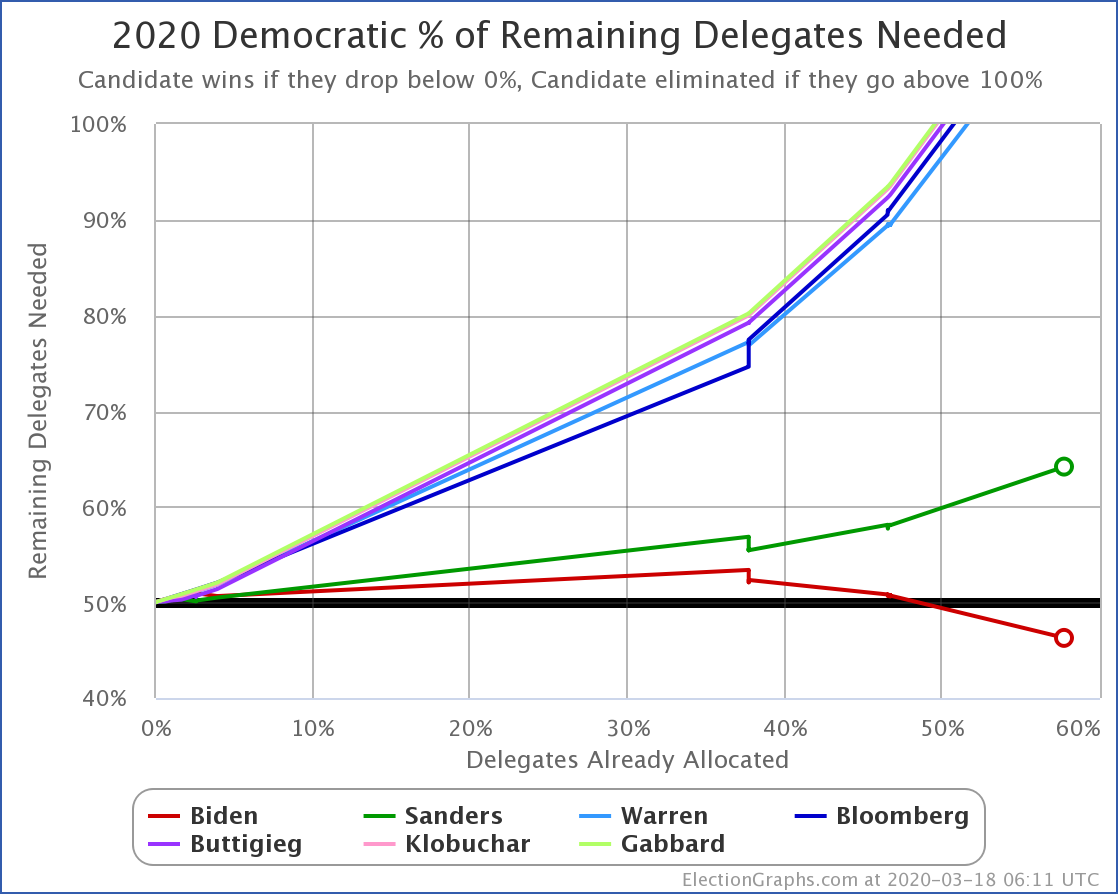
Looking at the "% of Remaining Delegates Needed" chart, you can see that Biden's curve heads downward, while Sanders's is clearly on a dramatic upswing.

At this point, Sanders would need 64.19% of the remaining delegates to catch up and win.  Absent scenarios where Biden drops out for health reasons, or something just as catastrophic, there is no reasonable scenario where Sanders wins the remaining races by an average 64% to 36% margin.

We'll keep tracking things, just in case something extraordinary does happen. Because after all, given how 2020 is going, you never know.

But really, the Democratic race is over now. It was a stretch not to say that a week ago. But now, it is undeniably over.

Biden will be the Democratic nominee.

Oh. And look at this…

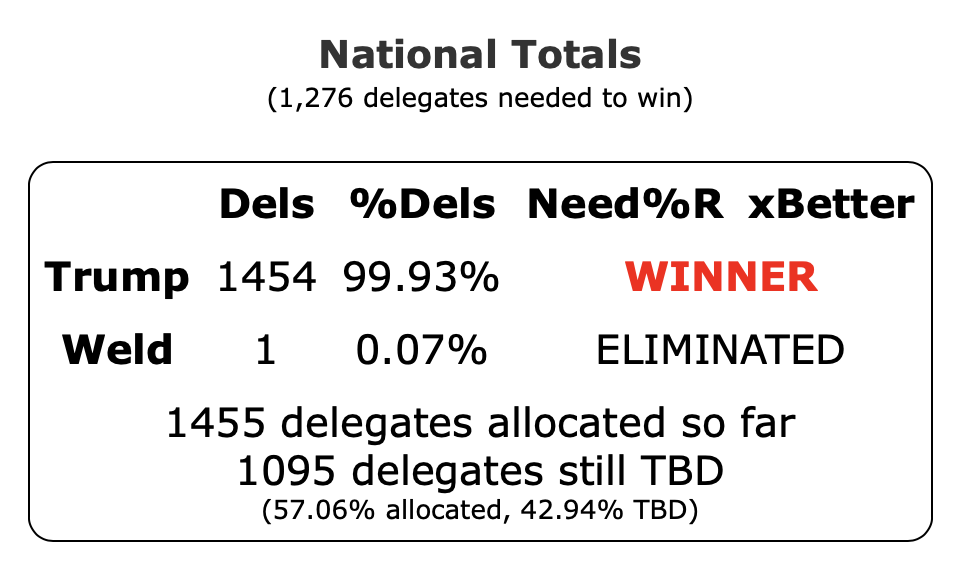
Although Weld did earn a single solitary delegate along the way (who may or may not make it to the convention floor), Trump clinched the Republican nomination with the March 17th results.

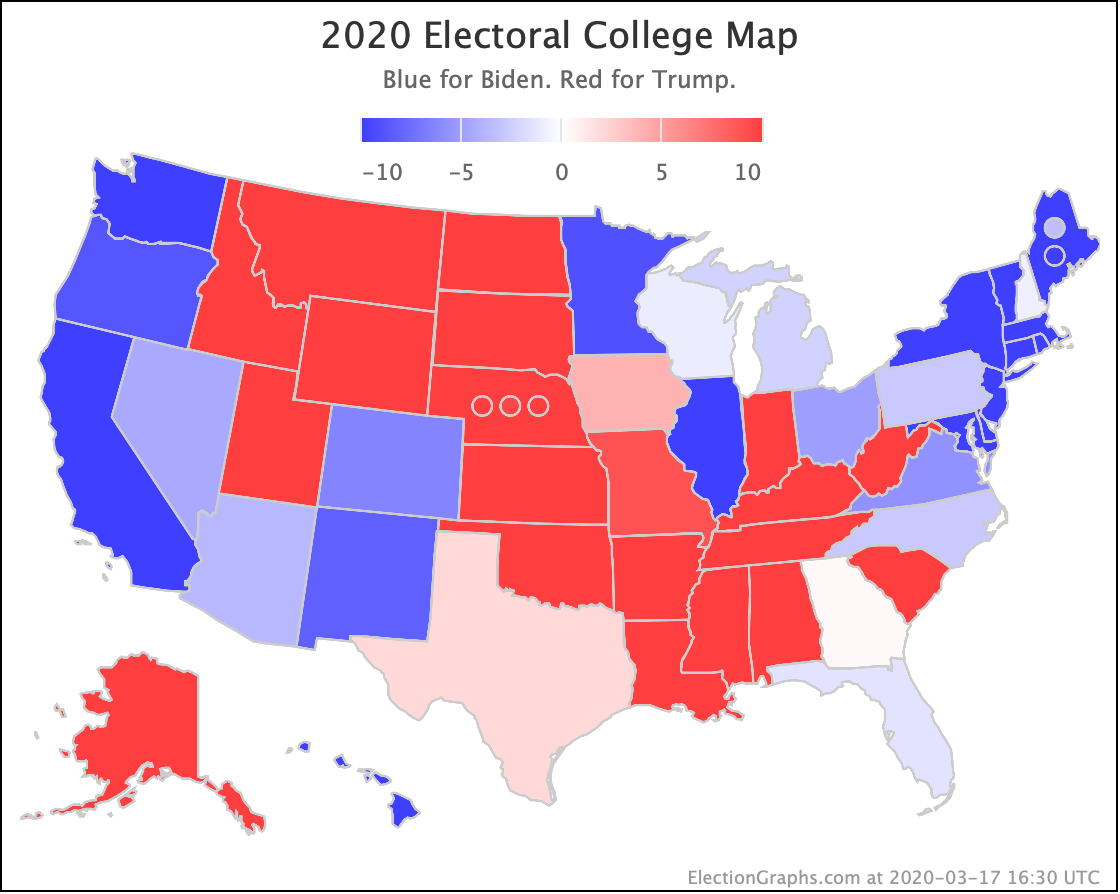
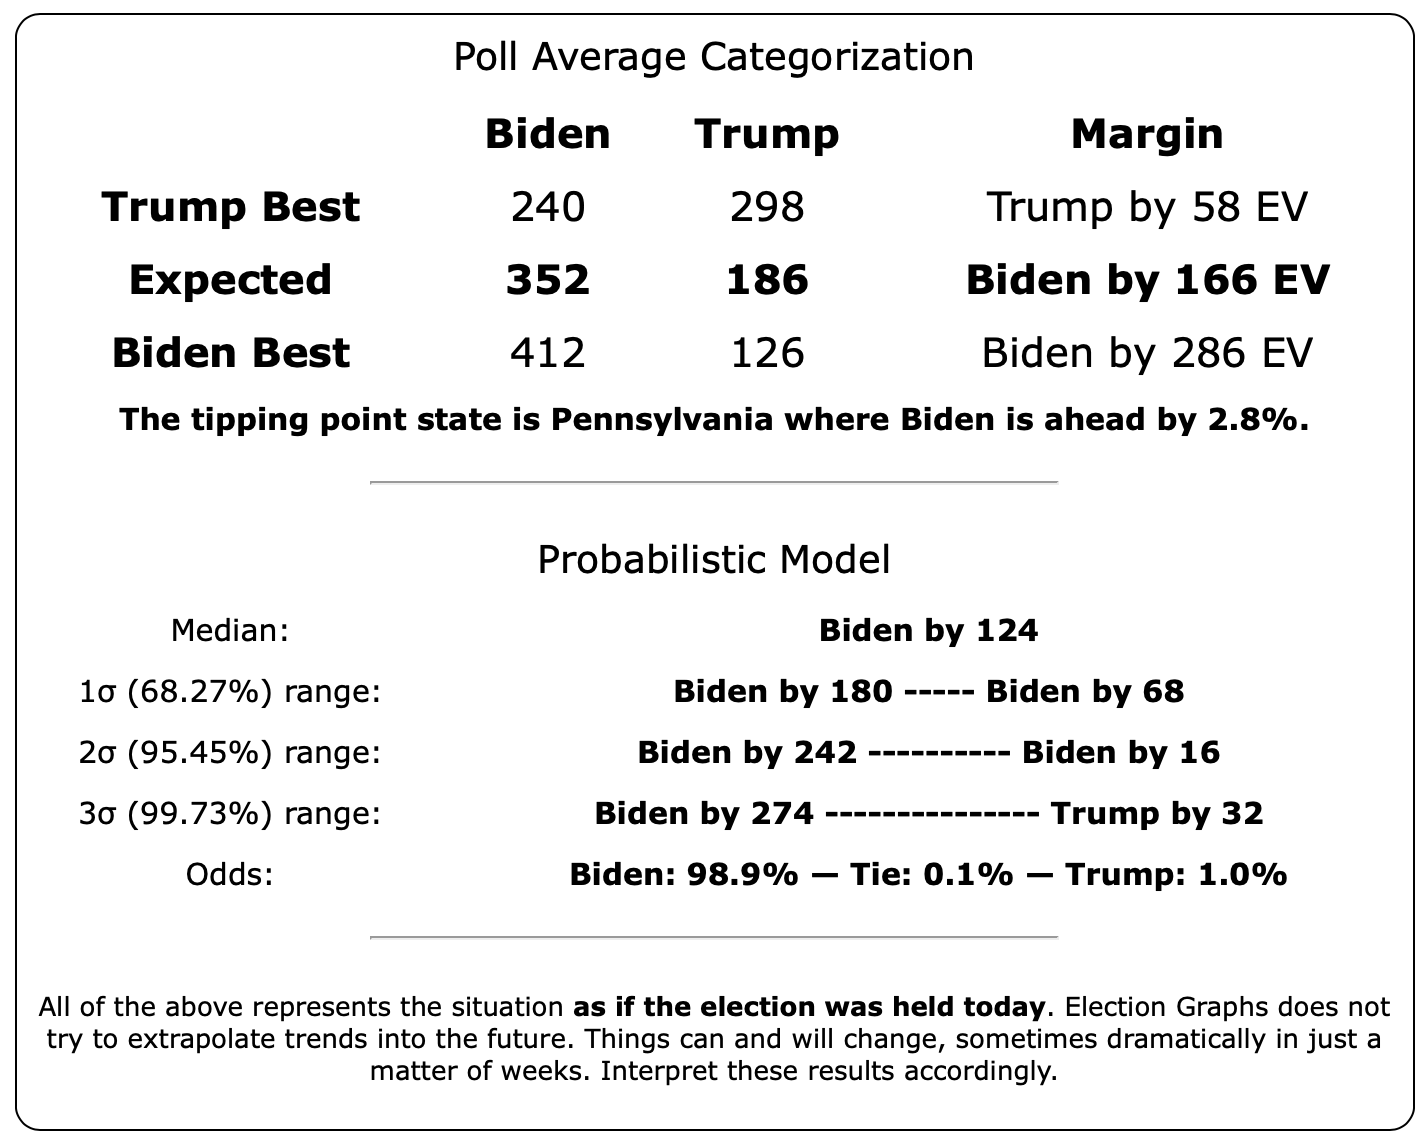
So we're looking at Biden vs. Trump for the general election.

As of the morning of March 18th, that race looks like this:

117.3 days until the Democratic National Convention.

159.3 days until the Republican National Convention.

230.5 days until polls start to close on Election Night 2020.

The real race is just beginning. Get ready.

Update 2020-03-19 00:51 UTC: Today Bloomberg gives up 2 California delegates to Biden. New totals: Biden 1215, Sanders 912, Others 171. Biden needs 46.16% of the remaining delegates to win. Sanders needs 64.19%.

Update 2020-03-20 02:39 UTC: Today Biden gives up 1 California delegate to Sanders. New totals: Biden 1214, Sanders 913, Others 171. Biden needs 46.22% of the remaining delegates to win. Sanders needs 64.13%.

Update 2020-03-23 00:19 UTC: Today Warren gives up 1 Utah delegate to Sanders. New Totals: Biden 1214, Sanders 914, Others 170. Biden needs 46.22% of the remaining delegates to win. Sanders needs 64.07%.

Update 2020-03-24 00:20 UTC: Today Warren and Bloomberg give up 2 delegates each in Utah. Of those Sanders gets 3 and Biden gets 1. New totals: Biden 1215, Sanders 917, Others 166. Biden needs 46.16% of the remaining delegates to win. Sanders needs 63.89%.

Update 2020-03-25 00:42 UTC: Today we have results from Democrats Abroad: Sanders 9, Biden 4. In addition some revisions to Maine, North Carolina, Utah, and Washington netting: Bloomberg +3, Biden +1, Sanders -1, Warren -3. New totals: Biden 1220, Sanders 925, Others 166. Biden needs 46.22% of the remaining delegates to win. Sanders needs 63.91%.

Update 2020-03-29 04:35 UTC: Updates today from California, Massachusetts, and North Carolina. Net change: Biden +3, Warren -1, Bloomberg -2. New totals: Biden 1223, Sanders 925, Others 163. Biden needs 46.04% of the remaining delegates to win. Sanders needs 63.91%.

Update 2020-03-30 09:18 UTC: Updates today from Virginia and Florida. Net Change: Biden +1, Warren +1, Sanders -2. New totals: Biden 1224, Sanders 923, Others 164. Biden needs 45.98% of the remaining delegates to win. Sanders needs 64.03%.

Update 2020-04-01 02:27 UTC: One delegate in Massachusetts moves from Warren to Sanders in today's update to the estimate. New totals: Biden 1224, Sanders 924, Others 163. Biden needs 45.98% of the remaining delegates to win. Sanders needs 63.97%.

Update 2020-04-02 00:20 UTC: In today's update to our estimates, one delegate in Virginia moves from Warren to Biden. New totals: Biden 1225, Sanders 924, Others 162. Biden needs 45.92% of the remaining delegates to win. Sanders needs 63.97%.

Update 2020-04-13 03:51 UTC: Today we added results from Alaska. Biden won 8 delegates, Sanders won 7. Also an update from Texas, with Sanders giving up 3 delegates, 2 to Biden, 1 to Bloomberg. New totals: Biden 1235, Sanders 928, Others 163. Biden needs 45.74% of the remaining delegates to win. Sanders needs 64.31%.

Update 2020-04-14 17:32 UTC: Today we added results from Wisconsin. Biden won 57 delegates, Sanders won 27. New totals: Biden 1292, Sanders 955, Others 163. Biden needs 44.55% of the remaining delegates to win. Sanders needs 66.03%. Sanders also officially dropped out since yesterday's update.

Update 2020-04-18 02:03 UTC: An update from Idaho today. Biden takes another delegate from Sanders. New totals: Biden 1293, Sanders 954, Others 163. Biden needs 44.49% of the remaining delegates to win. Sanders needs 66.09%.

Update 2020-04-20 16:08 UTC: Today we add the results from Wyoming. Biden won 10 delegates, Sanders won 4. New totals: Biden 1302, Sanders 958, Others 163. Biden needs 44.24% of the remaining delegates to win. Sanders needs 66.43%.

Update 2020-04-28 03:11 UTC: Today New York canceled their primary since all but one candidate has dropped out. They gave all 274 delegates to Biden. In addition, an update to the Arizona totals, moving one delegate from Biden to Sanders. New totals: Biden 1576, Sanders 959, Others 163. Biden needs 32.40% of the remaining delegates to win. Sanders needs 80.56%.

Update 2020-04-29 15:57 UTC: Adding in the results from Ohio: Biden 155, Sanders 21. In addition, one delegate moves from Warren to Sanders in California. New totals: Biden 1691, Sanders 981, Others 162. Biden needs 26.20% of the remaining delegates to win. Sanders needs 88.21%.

Update 2020-05-04 03:04 UTC: Today we get the results for Kansas: Biden 29, Sanders 10. New totals: Biden 1720, Sanders 991, Others 162. Biden needs 24.50% of the remaining delegates to win. Sanders needs 90.42%.

Update 2020-05-06 15:47 UTC: In today's update, a court ruled that NY's decision to cancel their primary and give all the delegates to Biden was invalid and a primary should happen after all. So Biden loses 274 delegates. New totals: Biden 1446, Sanders 991, Others 162. Biden needs 39.49% of the remaining delegates to win. Sanders needs 72.46%.

Update 2020-05-13 05:11 UTC: Today we have results for Nebraska. 29 delegates for Biden. New totals: Biden 1475, Sanders 991, Others 162. Biden needs 38.19% of the remaining delegates to win. Sanders needs 74.02%.

Update 2020-05-15 04:05 UTC: Today an update in Wisconsin moving one delegate from Biden to Sanders. New totals: Biden 1474, Sanders 992, Others 162. Biden needs 38.27% of the remaining delegates to win. Sanders needs 73.95%.

Update 2020-05-18 01:06 UTC: Today Massachusetts moves 8 delegates from Warren to Biden. New totals: Biden 1482, Sanders, 992, Others 154. Biden needs 37.68% of the remaining delegates to win. Sanders needs 73.95%.

Update 2020-05-20 16:20 UTC: Today we have results from Oregon: Biden 47, Sanders 14. New totals: Biden 1529, Sanders 1006, Others 154. Biden needs 35.81% of the remaining delegates to win. Sanders needs 76.36%.

Update 2020-05-21 02:44 UTC: Update from Oregon. One delegate moves from Biden to Sanders. New totals: Biden 1528, Sanders 1007, Others 154.  Biden needs 35.89% of the remaining delegates to win. Sanders needs 76.28%.

Update 2020-05-24 19:18 UTC: Today we have results from Hawaii: Biden 16, Sanders 8. New totals: Biden 1544, Sanders 1015, Others 154. Biden needs 35.31% of the remaining delegates to win. Sanders needs 77.09%.

Update 2020-06-03 19:08 UTC: Today we have updates from DC, IN, MD, MT, NM, PA, RI, and SD: Biden 424, Sanders 55. New totals: Biden 1968, Sanders 1070, Others 154. With that Sanders is mathematically eliminated from winning the nomination absent other candidates losing delegates. Biden still needs 2.92% of the remaining delegates to clinch though.

Update 2020-06-05 04:53 UTC: Updates from Indiana and New Mexico today. Net change, one delegate moves from Biden to Sanders. New totals: Biden 1967, Sanders 1071, Others 154. All other candidates have been mathematically eliminated, but Biden still needs 3.05% of the remaining delegates to clinch.

Update 2020-06-06 16:18 UTC: Updates from IA, IN, PA, and RI today. Net Change: Biden +17, Warren -3, Buttigieg -5, Sanders -9. New Totals: Biden 1984, Sanders 1062, Others 146. Some places already have Biden over the magic number, but in our count, he still needs 7 more delegates.

Update 2020-06-07 17:42 UTC: Some places had him there yesterday, but by our count, the Virgin Islands puts Biden over the top today as he gets all 7 delegates there. New totals: Biden 1991, Sanders 1062, Others 146.

For more information:

This post is an update based on the data on the Election Graphs 2020 Delegate Race page. Election Graphs tracks estimates of the convention delegate totals for both parties. The charts, graphs, and maps in the post above are all as of the time of this post. Click through on any image for the current interactive versions of that chart, along with additional details.

Follow @ElectionGraphs on Twitter or Election Graphs on Facebook to see announcements of new blog posts. For those interested in more granular updates of delegate updates or general election polling, follow @ElecCollPolls on Twitter. If you find the information in these posts informative or useful, please consider visiting the donation page.

Mixed Results

Since the last blog post on January 6th, there have been new state-level polls in New Mexico, Iowa, Arizona, Michigan (x2), Georgia, Nevada, Wisconsin (x2), Connecticut, Florida, and West Virginia.

These polls have, in general, shown mixed results. Some move toward Trump, some step toward the Democrats. For some, it depends which Democrat you are watching.

Add everything in from all the states, and you end up with a pretty neutral update on the probabilistic view, with no massive moves, and the changes we do have going in different directions.

Let's look first at the median margins in the Monte Carlo simulations:

Dem 6 Jan 19 Jan 𝚫
Biden +132 +126 -6
Sanders +46 +48 +2
Warren +2 +4 +2
Buttigieg -48 -50 -2

Two Democrats improve against Trump, two diminish. But none of these move very much from where they were.

It is worth noting that between the last update and this one, Warren vs. Trump did briefly flip to the median being a six electoral vote Trump win. But then that reversed and ended up with Warren being slightly better off than she was.

When you look at the four curves, it seems POSSIBLE that we have hit an inflection point. After several months of the curves moving towards Trump, have we now changed direction?

I would urge caution on that interpretation. It is premature. Notice that there was a similar "bump" back toward the Democrats in November. But it was short-lived, and the longer-term trend continued.

So, on the whole, no big moves this update.

Now in terms of win odds:

Dem 6 Jan 19 Jan 𝚫
Biden 99.5% 99.2% -0.3%
Sanders 78.0% 79.9% +1.9%
Warren 50.8% 52.4% +1.6%
Buttigieg 14.4% 14.2% -0.2%

Between these updates, Biden had briefly dropped below 99%. But he rebounded up to 99.2%. Not quite the 99.9%+ he had back in September, but still very strong.

Sanders and Warren both improve a little bit here, with Sanders continuing to be weaker than Biden, but much stronger than Warren, who is barely better than a coin toss.

And Buttigieg, well, at the moment he continues to look like cannon fodder for Trump if that was the matchup.

Looking at the older categorization view, in terms of straight-up changes to the categories I put states in, four changes were good for the Democrats, and three changes were good for Trump.

Moves toward the Democrats:

  • Sanders: New Mexico moved from Strong Sanders to Solid Sanders
  • Warren: Iowa moved from Strong Trump to Weak Trump
  • Warren: Michigan moved from Weak Trump to Weak Warren
  • Buttigieg: Arizona moved from Strong Trump to Weak Trump

Moves toward Trump:

  • Sanders: Georgia moved from Weak Sanders to Weak Trump
  • Biden: Michigan moved from Strong Biden to Weak Biden
  • Buttigieg: Iowa moved from Weak Buttigieg to Weak Trump

With the categorization view, we're simplifying and only say how the electoral college would look if every candidate won every state where they lead the average, rather than noting how often close states could flip to the underdog. But with that view, things look like this:

Dem 6 Jan 19 Jan 𝚫
Biden +178 +178 Flat
Sanders +58 +26 -32
Warren -44 -12 +30
Buttigieg -60 -84 -24

The changes here are more significant than in the probabilistic view because when a state goes from just barely one side, to just slightly on the other, it makes a huge and immediate difference.

Here only Warren actually improves from where we were at the last update, but she still loses to Trump.

Then the tipping points:

Dem 6 Jan 19 Jan 𝚫
Biden +4.3% +3.0% -1.3%
Sanders +1.0% +0.1% -0.9%
Warren -0.5% -0.5% Flat
Buttigieg -1.8% -1.6% +0.2%

On this view, only Buttigieg improves, and just barely. Because while another state flipped to Trump, the margin in the state needed to flip the balance back to him is less than it was before.

Each of these views shows a different way of looking at the race. If I had to pick one at the moment, I'd choose the probabilistic win odds, because it best incorporates all of the various factors at play. But all of them still show something worth tracking.

Now, a quick review of trends in each of the swing states with updates this time around. (I'll skip the states that are not really in contention.)

There is no real clear direction to the movement in Florida. The last updates have been good for the Dems, but all four of these candidates are neck and neck with Trump in Florida. Florida can't get enough of being a state living right on the knife's edge.

Georgia has been very sparsely polled.

The first few polls showed it moving much further in the Democratic direction than the historical average. The latest results inch back toward the red. But Georgia is a state to keep a careful eye on. At the moment, it is clearly in contention.

The historical average in Michigan has been pretty blue, but the most recent polls have shown that 2016 (a narrow 0.2% Republican win) may not have been an aberration. All four of these candidates are showing close races at the moment, with Buttigieg losing to Trump, and the other Democrats holding on to narrow leads.

The trends since the summer have been toward the Republicans, but the most recent polls have gone the other way, so the next releases will be critical to watch, as we will see if the state starts moving back to the blue, or stays in swing-state territory.

Arizona is almost the opposite of Michigan. A historically red state, where the early polls pulled things into the disputed zone, but some of the more recent results have started to move the averages back, at least for Sanders and Biden. This is another state to watch very carefully.

Wisconsin started out with a historical average of Weak Democrat. 2020 polls have shifted this to Weak Trump for all four of these Democrats. The most recent polls make it look like this movement may have plateaued, but it is too early to tell.

Iowa's historical average was Weak Democrat, now it looks like Weak Trump, but it is still close enough to be in contention.

And Nevada. Warren and Buttigieg are just barely losing to Trump. Sanders and Biden are winning by a bit larger margin, but still close.

That's it for the state by state updates this time.

Finally, I have one more thing to highlight before closing.

As I write this, there are just over two weeks until the Iowa caucuses, which are traditionally the start of the delegate race for both parties. I was planning on opening up the 2020 Delegate Race part of Election Graphs with the Iowa caucuses. But surprise surprise, as I was cleaning things up there and getting it ready for launch, I discovered that some delegates are already in motion.

No, it isn't superdelegates on the Democratic side. Due to rule changes this time around, they can't vote on the first ballot unless they mathematically can't make any difference to the outcome, so we aren't tracking them this time.

It is on the Republican side.

It turns out that on December 11th, the Hawaii Republican Party voted on delegate selection rules that just went ahead and bound their 19 delegates to Trump, bypassing any possible primaries or caucuses.

Other states have said they will do this, but Hawaii is the first state to make it official.

So Trump already has 19 of the 1277 delegates he needs to win the Republican convention.

Now, nobody expects any of the Republicans who are running against Trump to get much of anywhere. It currently seems unlikely they will even get any delegates at all.

So the graphs on the Republican side are likely to be very dull, and I probably usually won't even bother to show or mention them in these blog updates. But since this is the very first delegate update, here you go:

So out of 2552 Republican delegates, 19 have already been allocated. That is 0.74% of the delegates. Given that all 19 went to Trump, that means Trump needs 49.66% of the remaining delegates to clinch the nomination.

The next expected delegate allocation is actually also before Iowa. The Kansas Republicans will decide how to allocate their delegates at their convention which runs from January 31st to February 1st. I'm sure their choice will be a huge surprise to everyone.

And with that, the 2020 Delegate Race page is open for business!

288.8 days until polls start to close.

For more information:

This post is an update based on the data on the Election Graphs Electoral College 2020 page. Election Graphs tracks a poll-based estimate of the Electoral College. The charts, graphs, and maps in the post above are all as of the time of this post. Click through on any image to go to a page with the current interactive versions of that chart, along with additional details.

Follow @ElectionGraphs on Twitter or Election Graphs on Facebook to see announcements of updates. For those interested in individual poll updates, follow @ElecCollPolls on Twitter for all the polls as I add them. If you find the information in these posts informative or useful, please consider visiting the donation page.

Is Impeachment Hurting the Dems?

Once again, too long between updates. Since the last one on November 20th there have been new polls in Wisconsin (x3), New Hampshire, California (x2), Texas (x2), Arizona, Michigan, Pennsylvania, and Iowa.

If I'd been posting weekly as I had intended, there would have been a post looking at how Election Graphs win odds correlated to the popular vote polling averages at RCP and using that to measure the Democrats' Electoral College disadvantage. (Spoiler: As of right now it looks like Democrats need an approximately 6% popular vote win margin to have a 50/50 chance of winning the Electoral College.)

I also would have done a post talking about how while for us political junkies, it seems inconceivable that people don't know who at least the top five Democratic candidates are, this article in the Washington Post by Robert Griffin lays out a pretty convincing case that a large part of the differences in polling between Democratic candidates vs. Trump is STILL simply that lots of people don't know who some of these people are, something that clearly would change before Election Day if they were to win the nomination. That is obviously very important when interpreting what we see here on Election Graphs, which is 100% driven by state level general election matchup polls.

But I kind of missed talking about both those points when they were fresh. So I'll let the above suffice for now.

The main thing I want to look at today is this:

This shows the median electoral college result from the Election Graphs Monte Carlo simulations for each candidate pair.

For both Biden and Sanders there is a very clear "V" shaped pattern. (OK, if you look closely, you can see a "W", but the large scale pattern is a "V".) In the first half of this V, as new polls came in and the state averages moved from the baseline based on the 2000-2016 elections, to averages based on 2020 polls, almost every poll made Sanders and Biden look better.

Although he dropped out already, you can see a smaller scale version of this "V" pattern with O'Rourke as well.

Buttigieg doesn't show the initial portion of this V. As the initial polls came in, his results basically just stayed at about the same level as the 2000-2016 baseline. Frankly though, there was very little Buttigieg vs. Trump state level polling in this time frame though, which would explain that.

But all four of these candidates share the second half of the "V". Starting at a specific point in time, as new polling results came in, more often than not, the state averages would move away from the Democrat, and so the median electoral college results would also move the same direction.

When you look at the charts, the inflection point seems to be… well… very close to the date Nancy Pelosi announced that she was officially backing the impeachment investigation over the Ukraine issue.

There are some ups and downs, and you could argue that the best numbers for the Democrats were perhaps a little bit earlier or a little bit later, but roughly speaking, leading up to that announcement on September 24th, every week Sanders, Biden, and O'Rourke looked better in the polls than the week before, while Buttigieg held steady. After September 24th though, Sanders, Biden, Buttigieg, and O'Rourke all looked weaker in each subsequent week.

This may be a coincidence. It may just relate to which pollsters put out polls in which states during this time period. It may just be a "reversion to the mean" after a series of earlier polls were more favorable to the Democrats than was really reflected by the ground truth…

But the location of the inflection point compared to the date when impeachment moved from something a few people were talking about, to a real thing that was happening is hard to ignore. It certainly LOOKS like the impeachment efforts are hurting the Democratic candidates in state level head to head polling against Trump. State after state where the polling averages had moved from red to blue, have now slipped back into the red again.

But wait. There has been one clear omission in the discussion above.

Warren's trend line just does not match the patterns followed by the four candidates discussed above. (Neither did Harris's for that matter, but she dropped out, so we won't spend more time there.) There is no clear "V" shape like Sanders, Biden, and O'Rourke. Nor does Warren follow Buttigieg's pattern.

In fact, Warren does not show any change that looks like it coincides with impeachment events. Initially as early polls came in, she looked like she would do worse than the median based on the 2000-2016 averages. Then she started doing a little better than that. And now she's a little worse again.

The fact that the reversal in fortunes that lines up with the impeachment announcement does not seem to apply to Warren (or Harris) seems notable. After all, Warren was one of the first Democratic candidates to come out strongly in favor of impeachment, and she did so strongly. If there was an impact from impeachment, why wouldn't it touch her? Perhaps even more than other candidates? This may in fact be an argument toward this movement NOT being tied directly to impeachment, but rather to something unrelated.

Without information that specifically digs into motivations rather than just candidate preferences, it is hard to say anything definitive. But the alignment certainly is suggestive. We shall see if those trends continue as the impeachment saga continues to play out.

In the mean time, we'll close out by looking at the changes in our main metrics since the last update post, followed by some of the state level charts.

Dem 20 Nov 16 Dec 𝚫
Biden +158 +126 -32
Sanders +88 +56 -32
Warren +50 +24 -26
Buttigieg -6 -44 -38

All four still active Democrats weakened significantly in their "median case" from the Election Graphs Monte Carlo simulations.

This  has not been a good month for the Democrats.

Dem 20 Nov 16 Dec 𝚫
Biden 99.9% 99.4% -0.5%
Sanders 95.0% 83.5% -11.5%
Warren 81.8% 67.2% -14.6%
Buttigieg 44.3% 16.5% -27.8%

Given how far ahead Biden was, his win odds are still 99%+. But the other three took pretty big hits these last few weeks.

Especially Buttigieg. Last time he was already the only candidate with a less than 50% chance of beating Trump. But now that has dropped to a paltry 16.5%.

Dem 20 Nov 16 Dec 𝚫
Biden +210 +178 -32
Sanders +118 +58 -60
Warren +48 +14 -34
Buttigieg +6 -86 -92

Using the older and simpler "expected case" where every candidate simply wins every state where they lead the polls, you see similar across the board drops to what you see in the "median case" from the simulation, but the drops are even more dramatic.

Dem 20 Nov 16 Dec 𝚫
Biden +4.4% +4.3% -0.1%
Sanders +1.8% +1.0% -0.8%
Warren +0.6% +0.6% Flat
Buttigieg +0.2% -1.3% -1.5%

For the tipping point, which measures how much of a gain would be needed to flip the electoral college winner if that gain occurred uniformly across all states, Warren manages to stay flat, but the other three Democrats get weaker.

Finally, presented without additional commentary, the updated state charts in each of the states with new polling. You'll notice the recent swing toward Trump occurs in almost every state.

The news is coming hot and heavy these days. Iowa is now less than 50 days away. Things will develop quickly. Stay tuned.

323.6 days until polls start to close.

For more information:

This post is an update based on the data on the Election Graphs Electoral College 2020 page. Election Graphs tracks a poll-based estimate of the Electoral College. The charts, graphs, and maps in the post above are all as of the time of this post. Click through on any image to go to a page with the current interactive versions of that chart, along with additional details.

Follow @ElectionGraphs on Twitter or Election Graphs on Facebook to see announcements of updates. For those interested in individual poll updates, follow @ElecCollPolls on Twitter for all the polls as I add them. If you find the information in these posts informative or useful, please consider visiting the donation page.

Goodbye Blue Texas

It has once again been longer than I like, but it is time for another post.

Since the last update, there have been new polls in Michigan (x3), Nevada (x2), Texas (x2), Arizona (x2), Pennsylvania (x3), Florida (x2), North Carolina (x3), Wisconsin (x2), Iowa, Georgia (x4), and New Hampshire.

That is a lot. Sorry about that. Oops.

The most striking individual state result is that after peaking in September with three of the top six Democrats leading Trump in the Texas averages, and two more getting close, Texas has been moving back toward Trump.

As of now, none of the six most polled Democrats lead in Texas, and only three of those keep Trump's lead to less than 5%. And one of those (O'Rourke) has already dropped out of the race, leaving only Sanders and Biden still making it close.

Converting this to win odds, Biden has a 30.1% chance of winning the state (if the election was today), and Sanders has a 25.0% chance of winning.

None of the rest (except O'Rourke, who is out) is above 5%.

So Texas is reverting to form. It may be closer than it has been in previous years, but at least for the moment, the Democratic hopes for a blue Texas seem to be fading.

I'll go over other states with new polling at the end of the post, but first, a look at four ways of looking at the changes in the national summary since the last post.

O'Rourke vs. Trump is now in the top six best-polled candidate combinations (replacing Sanders vs. Pence). But since O'Rourke dropped out, we will leave him out and only look at the top five for now.

I haven't done posts showing the update-to-update comparisons for the older "categorization method" before, but since that used to be the bread and butter of Election Graphs, let's start there.

Dem 1 Nov 20 Nov 𝚫
Biden +254 +210 -44
Sanders +190 +118 -72
Warren +38 +48 +10
Harris +20 +20 Flat
Buttigieg +6 +6 Flat

In this "expected case" view, where every candidate wins every state where they lead in the poll average, both Sanders and Biden have lost ground.

Warren improves her position a little.

Harris and Buttigieg are flat.

Dem 1 Nov 20 Nov 𝚫
Biden +5.3% +4.4% -0.9%
Sanders +4.7% +1.8% -2.9%
Harris +1.4% +1.4% Flat
Warren +0.3% +0.6% +0.3%
Buttigieg +0.6% +0.2% -0.4%

Looking at the tipping points, which is analogous to the popular vote, but adjusted for the structure of the electoral college, once again, Warren is the only Democrat who is improving.

Harris is flat.

Biden, Sanders, and Buttigieg all lose ground to different degrees.

Note that while for a short time, Biden had a tipping point greater than 5%, meaning he could win using only states where he led by more than 5% and didn't even need any swing states. That is no longer true.

Now all five of these Democrats have tipping points indicating that they need to win at least some tight states to win.

Now, moving on to the more elaborate probabilistic model I look at a bit more these days…

Dem 1 Nov 20 Nov 𝚫
Biden +184 +158 -26
Sanders +124 +88 -36
Warren +36 +50 +14
Harris +8 +12 +4
Buttigieg -4 -6 -2

This view shows the "Median Case." The median case is the electoral vote margin in the exact middle of the 1,000,001 simulation runs done for each candidate combination when sorted by the margin. About half the time, the Democrat does better than this. About half the time, they do worse.

Warren and Harris both improve a bit. Biden, Sanders, and Buttigieg all lose ground.

Note that while in the classification view, all five Democrats lead Trump, in the probabilistic view, Buttigieg's median case is actually to lose.

But we need to look at probabilities, not the single "median case" estimate. You should not think that since a candidate is ahead or behind on the median case, that maps to winning and losing.

For instance, Buttigieg's median case is a six electoral vote loss to Trump. But if you look at the 2σ range, that is the range of outcomes that you would expect to occur 95.45% of the time; you get a range from Buttigieg winning by 92 electoral votes to Trump winning by 90 electoral votes.

There is a huge range of possibilities. It isn't just "Trump is ahead in the median case, so he wins."

So time to look at the win odds…

Dem 1 Nov 20 Nov 𝚫
Biden 100.0% 99.9% -0.1%
Sanders 98.3% 95.0% -3.3%
Warren 73.1% 81.8% +8.7%
Harris 54.6% 58.2% +3.6%
Buttigieg 46.0% 44.3% -1.7%

The trends above, which cover just under three weeks, show Warren and Harris improving, while Biden, Sanders, and Buttigieg slip back.

But looking back a bit farther, we can see some overall trends going back to September.

Biden continues to be pegged at a 99%+ chance of winning. His lead in some states has slipped, but his overall margins are high enough that this hasn't yet started to impact his chances of winning.

Sanders never had as big a margin lead as Biden, so as some of those states slipped back toward Trump, you see a more significant impact on his odds of winning.

Harris and Buttigieg have never done all that much better than a coin flip against Trump, peaking at around a 70% chance of winning. But since September, they have both dropped significantly, with Buttigieg now only at a 44.3% chance of winning, and Harris only at 58.2%.

The only candidate consistently improving over the last few months has been Warren. She bottomed out at only a 41.7% shot of winning in June, and while there have been ups and downs, the trend is clearly in Warren's direction.

We will, of course, see if that lasts. As can be seen by the spike toward Trump in June, trends can reverse quite quickly.

Now, besides Texas, here are a few additional states where there are trends worth noting. (Since so many places had new polls, I'll skip a few where there is less to comment on.)

No clear trends in Florida except to note that it is an exceptionally close race no matter which Democrat you match up against Trump. As has been usual for the last few presidential races, Florida is right on the line. And it is big. So it makes a huge difference.

The general trend in Pennsylvania, Michigan, and Wisconsin over the past few months has been for Democratic leads to decrease.

In Pennsylvania, there is no Democrat with more than a 5% lead, and Warren (and O'Rourke) are both slightly behind.

At this point, only Biden has a lead higher than 5% in Michigan.

In Wisconsin, all the Democrats still lead, but none by more than 5%.

These are, of course, the three states that gave Trump his victory in 2016. At the moment, they are all looking to be close battlegrounds once again.

The people who say that the Democratic nominee needs to pay close attention to these states are certainly not wrong.

And at the moment, the Democrats seem to be slipping in all three.

Pollsters have not paid as much attention to Georgia as I would like. But there have been a bunch of polls in the last few weeks and they show a competitive state, which is a significant change from the historical average.

The poll average now shows Biden and Sanders ahead, with Warren, Harris, and Buttigieg all bringing Trump's lead under 5%.

(O'Rourke has never been polled in Georgia, and now that he has dropped out, probably will never be. Sniff.)

Although Biden has reversed a bit recently, overall Sanders, Warren, and Biden are making North Carolina a narrowly fought battleground.

Harris and Buttigieg, while they are still keeping Trump's lead under 5%, do not seem to be gaining any additional ground lately.

Arizona has also been moving toward the Democrats. At least for Sanders, Warren, and Biden. Warren and Biden actually are slightly leading. Sanders brings Trump's lead under 5%.

Harris and Buttigieg, on the other hand, are not making things much closer than the historical 7.6% average Republican margin in the state. Just as in North Carolina, they lag behind the stronger Democrats.

So Trump is gaining in Texas, Pennsylvania, Michigan, and Wisconsin.

But the Democrats are gaining in Georgia, North Carolina, and Arizona.

As we get closer, things will heat up; there will be lots more polls and more movement.

Are we having fun yet?

349.7 days until polls start to close on election night.

For more information:

This post is an update based on the data on the Election Graphs Electoral College 2020 page. Election Graphs tracks a poll-based estimate of the Electoral College. The charts, graphs, and maps in the post above are all as of the time of this post. Click through on any image to go to a page with the current interactive versions of that chart, along with additional details.

Follow @ElectionGraphs on Twitter or Election Graphs on Facebook to see announcements of updates. For those interested in individual poll updates, follow @ElecCollPolls on Twitter for all the polls as I add them. If you find the information in these posts informative or useful, please consider visiting the donation page.

Another Mixed Week for Dems

Since last week's update, there has been new polling released in Arizona (x2), Colorado, Kentucky, Maine, North Carolina, California (x2), Florida, Texas, and Missouri.

Once again we have mixed results.

Two of the six most polled Democrats (Biden and O'Rourke) improve their positions in the probabilistic view when you combine the results of all of those polls.

The other four (Sanders, Buttigieg, Warren, and Harris) slip in their matchups against Trump. Some weaken significantly.

So let's start with the national "Odds of a Democratic Win" view:

Dem 15 Sep 22 Sep 𝚫
Biden 99.8% 99.9% +0.1%
Sanders 96.9% 95.3% -1.6%
O'Rourke 80.8% 83.1% +2.3%
Buttigieg 67.0% 66.5% -0.5%
Warren 69.0% 62.4% -6.6%
Harris 65.7% 54.7% -11.0%

The two that stand out here are Warren and Harris. The new polls this week hurt their win chances significantly. Harris is now looking only slightly better off than a coin toss in a race against Trump.

We'll look at each state to determine where these changes are coming from, but first, you can also see this pattern dramatically when looking at the "Median Case" from the Monte Carlo simulations.

In this view, you can see that the winning margins of every  Democratic candidate except O'Rourke have been decreasing lately. Including Biden.

A lot of the "movement" of these various lines up until now could still be attributed to actual 2020 polling replacing old elections in our state polling averages. We are getting to the point though where a lot (although not all) of the critical states are mostly 2020 polls.

So we may start seeing trends that represent real changes in public opinion. We will also begin to see what level of variability is just inherent in looking at the election this way. It may end up being "normal" that some of these lines bounce up and down quite a bit as we go along.

In the meantime though, time to look at the trends in each of the states where there was new polling over the last week. There are a lot, so I'll be brief.

California is so blue; it is mostly irrelevant to the national race. All of the Democrats have a 100% chance of winning California. It is notable though that all six candidates are doing even stronger in California than the historical average from the 2000 to 2016 elections. California is getting even bluer.

A lot of the win odds changes this week can be attributed to Texas. With the latest polling in Texas, the trend of each new poll moving the state further in the Democratic direction has ended. Biden and O'Rourke still improve slightly, but every other Democrat erodes. Along with Biden and O'Rourke, Sanders retains a lead. Warren, Harris, and Buttigieg not only lose Texas but the picture of them "making it close" is slipping. At least this week.

Florida is the other big state responsible for much of this week's changes. The only Democrats who did not weaken in Florida this week are the ones that were not in the polls. Florida has a lot of electoral votes, and Florida is close, so it has an outsized impact on the national picture.

The only mover this week in North Carolina is Biden, with his average moving to a greater than 5% lead for the first time. Trump leads all the other Democrats by narrow margins.

Arizona is another state where there is a big gap between Biden and the rest of the field. This week Biden took the lead in the Arizona poll average. Add Arizona to Texas as red states that flip, and you can see why Biden's national position remains so strong.  Sanders also makes Arizona close, but all of the other Democrats are hovering around the historical average, which is a Strong Republican win.

Missouri is clear red state, and with two polls so far this cycle, it just looks like it is getting redder.

At the same time, Colorado is getting bluer. Only Biden moves the state into Strong Democrat territory so far though. The other candidates still only have narrow leads in the polling average.

Kentucky is red and not in contention for 2020. With the small amount of polling so far though, Biden still does best, actually decreasing the Republican margin slightly. Not so much for the others.

Finally Maine. Maine is blue and does not look to be changing into anything else. With the first few polls, Biden looked like he might be making it even bluer than before. But as we stand today, all of the Democrats are pretty close to the historical average for the state.

And that is where things are this week.

408.0 days until polls start to close.

For more information:

This post is an update based on the data on the Election Graphs Electoral College 2020 page. Election Graphs tracks a poll-based estimate of the Electoral College. The charts, graphs, and maps in the post above are all as of the time of this post. Click through on any image to go to a page with the current interactive versions of that chart, along with additional details.

Follow @ElectionGraphs on Twitter or Election Graphs on Facebook to see announcements of updates. For those interested in individual poll updates, follow @ElecCollPolls on Twitter for all the polls as I add them. If you find the information in these posts informative or useful, please consider visiting the donation page.

Good Polling Week For Democrats

Since last week's update, there have been new polls in Nevada, Colorado, and Arizona.

There was only one category change. Biden's poll average in Nevada moved from a 4.5% lead to a 6.2% lead which changed the state from Weak Biden to Strong Biden in the Election Graphs categorizations.

This change drops Trump's best case in the categorization view to a 26 electoral vote win over Biden as Nevada is moved out of the list of potential Trump wins:

The Biden vs. Trump tipping point also shifted from a 3.4% Biden lead in Maine's 2nd congressional district to a 4.9% Biden lead in Virginia.

But taking into account the polling changes in all three states, and looking at the probabilistic model, of the six most polled Democrats against Trump, five improved their odds of winning the electoral college.

The only exception was O'Rourke. None of the new polls included him. Again.

Dem 18 Aug 25 Aug 𝚫
Biden 99.7% 99.9% +0.2%
Sanders 94.1% 95.5% +1.4%
O'Rourke 80.0% 80.0% Flat
Warren 67.6% 71.0% +3.4%
Buttigieg 63.2% 67.1% +3.9%
Harris 62.9% 65.8% +2.9%

The odds favor all of the Democrats over Trump at this point.  There is a massive spread between the extremes, however. At the low-end, Harris loses about a third of the simulated elections to Trump. Meanwhile at the high-end Biden looks very solid indeed with that 99.9%.

As usual, disclaimers are essential. What we see NOW may not resemble what things look like by the time we get to the Iowa caucuses, let alone by the time we get to Election Day 2020.

Although as every day passes, this is less true, many people still are not paying close attention to this contest, and many people don't know much about Harris and Buttigieg and some of the others. Name recognition and the intensity of the coverage does matter, and that will all ramp up as voting approaches.

Perhaps even more importantly, the general election campaign itself won't go into full swing until it looks like the winning candidates on both sides are inevitable, and that will make a huge difference. For instance, I would be surprised to see that 99.9% for Biden survive contact with an all-out assault from the Republican side.

With that said, let's look at the three states individually:

Biden is the only candidate breaking out in Arizona. The polling average still shows a Trump lead, but the three actual 2020 polls so far show one tie and two Biden leads. The state is held on the red side by the Republican wins in 2012 and 2016. At the very least though, it is clear that Biden puts Arizona into contention.

Warren's poll average has also improved a little bit on the 2000-2016 average Republican win margin of 7.6%, but she has yet to show a single poll with her leading Trump.

The other four have barely moved the needle. And Sanders and Harris are doing worse in Arizona than the historical average.

The difference between Biden and the others is even starker when you look at the chart showing the odds of winning Arizona:

Biden is now up to a 31.8% chance of winning Arizona. The other five candidates range from an 0.3% chance (Sanders) to a 1.8% chance (Warren).

Unlike Texas, where it looks like all the Democrats are making the state look bluer, Arizona is much more selective.

The Emerson poll this week is the very first Colorado polling for 2020. Biden, Sanders, Warren, and Buttigieg all lead Trump by more than 5% in the new poll. Harris leads by a narrower 3%.

In all of these cases, the average drops significantly in the blue direction, because it is the 2000 election results that are falling off the average, where the Republican won by an 8.4% margin.

One poll is not enough to move the state out of the "Weak Democrat" category though. But if the next Colorado results are similar to these, the next election to drop off the average will be the 4.7% Republican win in 2004 and the state will probably move to "Strong Democrat" at that point.

Looking at the odds view though, you can see that even the move from this one new poll makes a big difference. With just the average of the last five elections as the poll average, we put the Democratic chance of winning Colorado at 58.4%. An advantage, but just barely.

With this first 2020 poll, excluding O'Rourke since no pollster included him, the Democrats range from an 81.2% chance of winning the state (Harris) to a 90.9% chance (Biden).

All the Democrats improved their averages in Nevada except for Buttigieg.

Biden is the standout, moving into "Strong Biden" territory, with his 6.2% margin translating into a 94.8% win chance. The other Democrats range from a 70.6% chance to win (Warren) to an 88.2% chance to win (Sanders).

And that is where we are this week.

436.1 days until polls start to close.

For more information:

This post is an update based on the data on the Election Graphs Electoral College 2020 page. Election Graphs tracks a poll-based estimate of the Electoral College. The charts, graphs, and maps in the post above are all as of the time of this post. Click through on any image to go to a page with the current interactive versions of that chart, along with additional details.

Follow @ElectionGraphs on Twitter or Election Graphs on Facebook to see announcements of updates. For those interested in individual poll updates, follow @ElecCollPolls on Twitter for all the polls as I add them. If you find the information in these posts informative or useful, please consider visiting the donation page.

Biden makes Arizona close

Since the last update, there have been polls in Texas and Arizona.

Only Arizona resulted in a blog-worthy change.

Namely, the Biden vs. Trump matchup moved from "Strong Trump" to "Weak Trump."

The two polls we have so far on this matchup in Arizona have Biden doing significantly better than Democrats have fared here in recent Presidential elections. The latest one shows Biden ahead.

Given these results, the average is moving in the Democratic direction, but given Arizona's history, it would take more polls to pull the race into blue territory. For now, Biden will have to settle for the state being in reach as Trump's lead drops under 5% to 3.2% which improves Biden's "best case" on our bubble:

The case where Biden wins all the close states, now including Arizona, is the downward bump in the bottom right of the "envelope of possibilities" shown above.

Now, Democrats shouldn't be too excited about Arizona yet.

This week Election Graphs has added "win probabilities" based on the data shown in the "Polling Error vs. Final Margin" post back in January. Basically, given the history of how Election Graphs poll averages have matched up against actual election results in the 2008 to 2016 elections, I produce an estimate for the chances of each outcome given the margin. You can now see this on any of the state detail pages and state comparison pages.

At the "Republican leads by 3.2%" level this gives an estimate that Trump has an 87.7% chance of winning Arizona, leaving Biden with only a 12.3% chance. Now, this is non-trivial. But Trump still has a pretty substantial advantage, until or unless more polls come out confirming a Biden lead.

A few caveats since this is the first time I'm referencing this type of calculation:

  1. These "win chances" are based on the past performance of Election Graphs averages, and past performance may or may not be a good indicator of future results.
  2. The model represents "if the election was today." It does not take into account the probabilities of the polls moving one way or another in the time between now and the election.
  3. Since there are only two polls of this matchup in this state so far, only 2/5 of the data points included in the average are even real polls as opposed to results from previous elections.
  4. It is still a long, long time until the election. Things will change.

But still, this is a fun new number to look at, and I'll be referring to the "win odds" more often as new results come in. There will also be new visualizations of this metric coming soon. And while so far I've only added this information on the state detail and comparison pages, the intention is, of course, to use this as the basis for a Monte Carlo simulation of the national race in the way I mentioned in the January "Predicting 2016 by Cheating" post.

Stay tuned.

In the meantime, back to Arizona for a bit.

As has been the pattern in poll after poll, Biden is doing better against Trump than the other Democrats. You can see above that so far Biden vs. Trump is the only one of the five best-polled candidate combinations where the Democrat is polling dramatically different than the historical election result average in Arizona.

Biden looks like he makes Arizona competitive.

The others, not so much.

Finally, just a quick look at Texas as well:

Unlike Arizona, in the case of Texas, ALL FIVE Democrats are doing significantly better against Trump than the historical election average. But that average was much more Republican to start with, so even with the polling averages moving in a Democratic direction, none of the five Democrats put Texas into swing state territory yet.

Biden, as usual, is doing best. Trump only leads Biden by 5.6%.

Using the new probabilities feature on Election Graphs, this translates into a 2.1% chance of Biden taking Texas.

545.7 days until polls start to close.

For more information:

This post is an update based on the data on the Election Graphs Electoral College 2020 page. Election Graphs tracks a poll-based estimate of the Electoral College. The charts, graphs, and maps in the post above are all as of the time of this post. Click through on any image to go to a page with the current interactive versions of that chart, along with additional details.

Follow @ElectionGraphs on Twitter or Election Graphs on Facebook to see announcements of updates. For those interested in individual poll updates, follow @ElecCollPolls on Twitter for all the polls as I add them. If you find the information in these posts informative or useful, please consider visiting the donation page.

The First 2020 Polls

A few days ago I looked at where all the states ended up if you just look at the average results of the last few elections. No 2020 specific data.

But there have already been state level 2020 polls. Sixteen by my count. They are now all included on Election Graphs.

When I do updates here, unless there is a strong reason to do otherwise, I'm going to only discuss the five "best polled" candidate pairs. At the moment, the only Republican polled so far has been Trump. (Sorry Weld fans.) The five best polled Democrats against him right now are Biden, Warren, O'Rourke, Sanders, and Harris… in that order.

So with that out of the way, let's start looking at some graphs!

The chart above shows the "expected" electoral college result for each of these five candidate pairs, assuming each candidate wins all the states they lead in the Election Graphs five poll averages. This average still includes previous election results since there are no states where there are actually five polls yet.

So what do we see? From the very limited polling we have so far, we see Biden doing noticeably better than any of the other four Democrats when pitted against Trump. In the electoral college, Biden leads Trump by a 42 electoral vote margin. Sanders leads Trump by 6 electoral votes. And then Warren, O'Rourke, and Harris all lose to Trump by 6 electoral votes.

The "tipping point" is perhaps a better way to look at things. It is similar to looking at a popular vote margin, but adjusted for the structure of the electoral college. Here Biden has a 1.2% tipping point margin over Trump and Sanders has a 0.9% tipping point margin over Trump, but Warren, O'Rourke, and Harris all trail Trump by an 0.1% margin.

Frankly, ALL of these results, for all five possible opponents to Trump, are firmly within the "too close to call" zone. Even if it was the day before the election, not 607 days before the election. With this much time left, and with the extremely limited polling so far, any patterns we see may easily disappear as new polls come in. It might even be safe to say they will probably disappear. It is still very very early.

Having said that, the Biden advantage is even more striking as you start looking state by state. The following charts show how the polling average in each state has moved as the polls so far have come in.

Note: Keep in mind these are all measuring how each of the Democrats would fare against Trump in the general election, NOT how they might fare against each other in the primaries.

Watch the red line. The red line is Biden. Down is better for Democrats.

OK, in California Biden hasn't broken out. He hasn't actually been polled in California yet. So his average is just the average of the last five presidential elections.

Biden doing better than the other four Democrats in Texas.

Biden doing better than the other four Democrats in Ohio.

Biden doing better than the other four Democrats in Michigan.

Biden doing better than the other four Democrats in North Carolina.

Biden doing better than the other four Democrats in Arizona.

OK, none of the top five have been polled in Minnesota yet. (Only Klobuchar has been.) So they are all still on one line.

Biden doing better than the other four Democrats in South Carolina.

Biden doing better than the other four Democrats in Iowa.

OK, we finally have a state where Biden has been polled and he isn't doing better than the other Democrats. In New Hampshire, both Sanders and Warren do better against Trump than Biden does.

But that is it. Out of 10 states where we have state polls so far, Biden does better than the other four Democrats in 7. In 2 Biden hasn't been polled yet. Only in 1 does another Democrat do better against Trump.

Now, to be clear, at this stage in a Presidential race, this may be due entirely to name recognition. Most people may still not have much of an idea who Warren, O'Rourke, and Harris even are. But surely they would know who Sanders is, right? His name recognition must be comparable to Biden's. Right?

In any case, the way Biden consistently is outperforming other Democrats against Trump in the polls so far is striking. And he hasn't even officially said he is running yet.

It will be interesting to see if this pattern continues as the field starts to gel, and the other candidates get better known.

Election Graphs will of course update as the new polls come in…

For more information…

This post is an update based on the data on the Election Graphs Electoral College 2020 page. Election Graphs tracks a poll-based estimate of the Electoral College. The charts, graphs, and maps in the post above are all as of the time of this post. Click through on any image to go to a page with the current interactive versions of that chart, along with additional details. Follow @ElectionGraphs on Twitter or Election Graphs on Facebook to see announcements of updates. For those interested in individual poll updates, follow @ElecCollPolls on Twitter for all the polls as they are added. If you find the information in these posts interesting or useful, please consider visiting the donation page.