
A few days ago I looked at where all the states ended up if you just look at the average results of the last few elections. No 2020 specific data.
But there have already been state level 2020 polls. Sixteen by my count. They are now all included on Election Graphs.
When I do updates here, unless there is a strong reason to do otherwise, I'm going to only discuss the five "best polled" candidate pairs. At the moment, the only Republican polled so far has been Trump. (Sorry Weld fans.) The five best polled Democrats against him right now are Biden, Warren, O'Rourke, Sanders, and Harris… in that order.
So with that out of the way, let's start looking at some graphs!
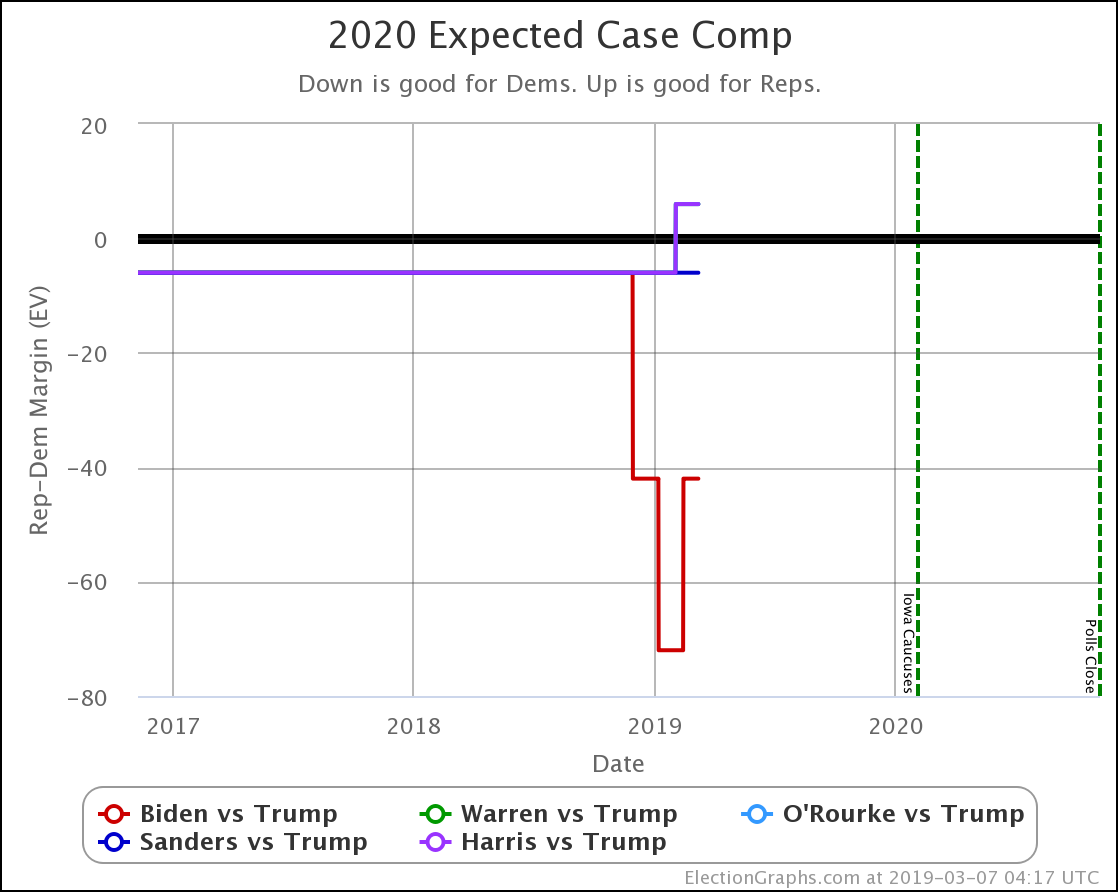
The chart above shows the "expected" electoral college result for each of these five candidate pairs, assuming each candidate wins all the states they lead in the Election Graphs five poll averages. This average still includes previous election results since there are no states where there are actually five polls yet.
So what do we see? From the very limited polling we have so far, we see Biden doing noticeably better than any of the other four Democrats when pitted against Trump. In the electoral college, Biden leads Trump by a 42 electoral vote margin. Sanders leads Trump by 6 electoral votes. And then Warren, O'Rourke, and Harris all lose to Trump by 6 electoral votes.
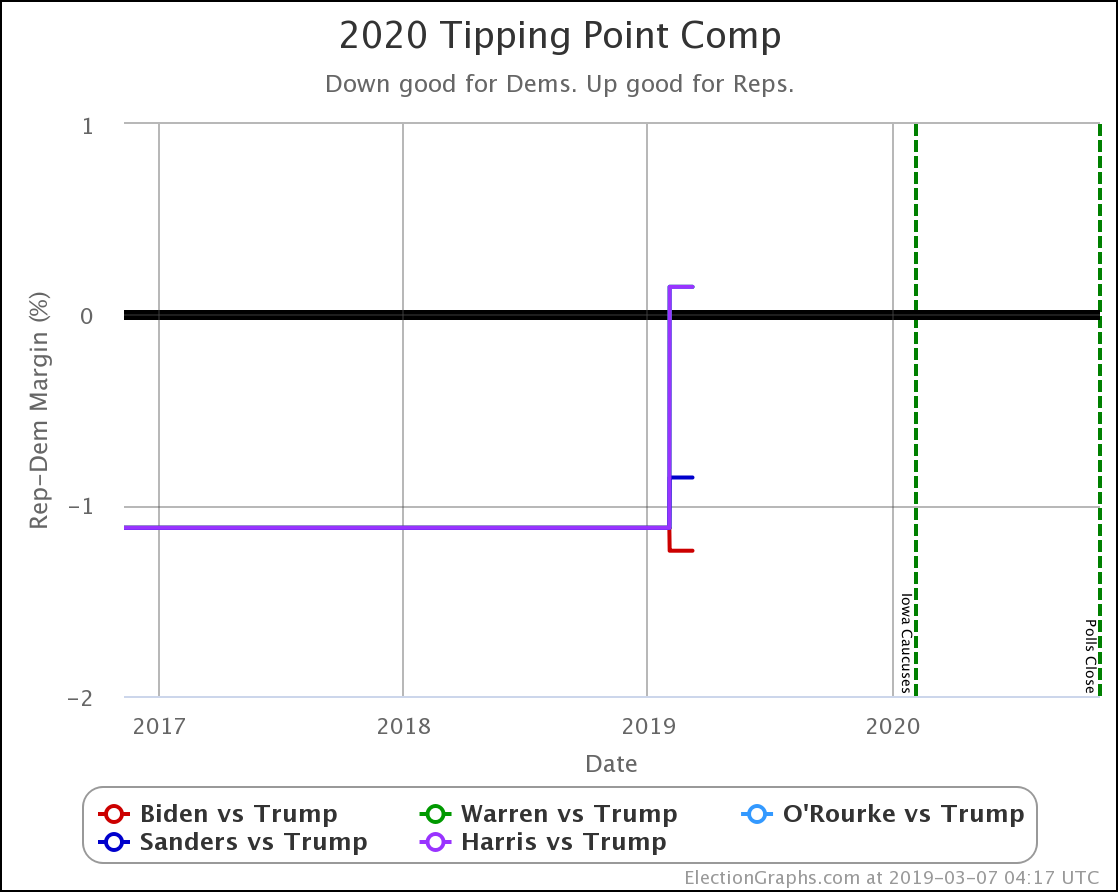
The "tipping point" is perhaps a better way to look at things. It is similar to looking at a popular vote margin, but adjusted for the structure of the electoral college. Here Biden has a 1.2% tipping point margin over Trump and Sanders has a 0.9% tipping point margin over Trump, but Warren, O'Rourke, and Harris all trail Trump by an 0.1% margin.
Frankly, ALL of these results, for all five possible opponents to Trump, are firmly within the "too close to call" zone. Even if it was the day before the election, not 607 days before the election. With this much time left, and with the extremely limited polling so far, any patterns we see may easily disappear as new polls come in. It might even be safe to say they will probably disappear. It is still very very early.
Having said that, the Biden advantage is even more striking as you start looking state by state. The following charts show how the polling average in each state has moved as the polls so far have come in.
Note: Keep in mind these are all measuring how each of the Democrats would fare against Trump in the general election, NOT how they might fare against each other in the primaries.
Watch the red line. The red line is Biden. Down is better for Democrats.
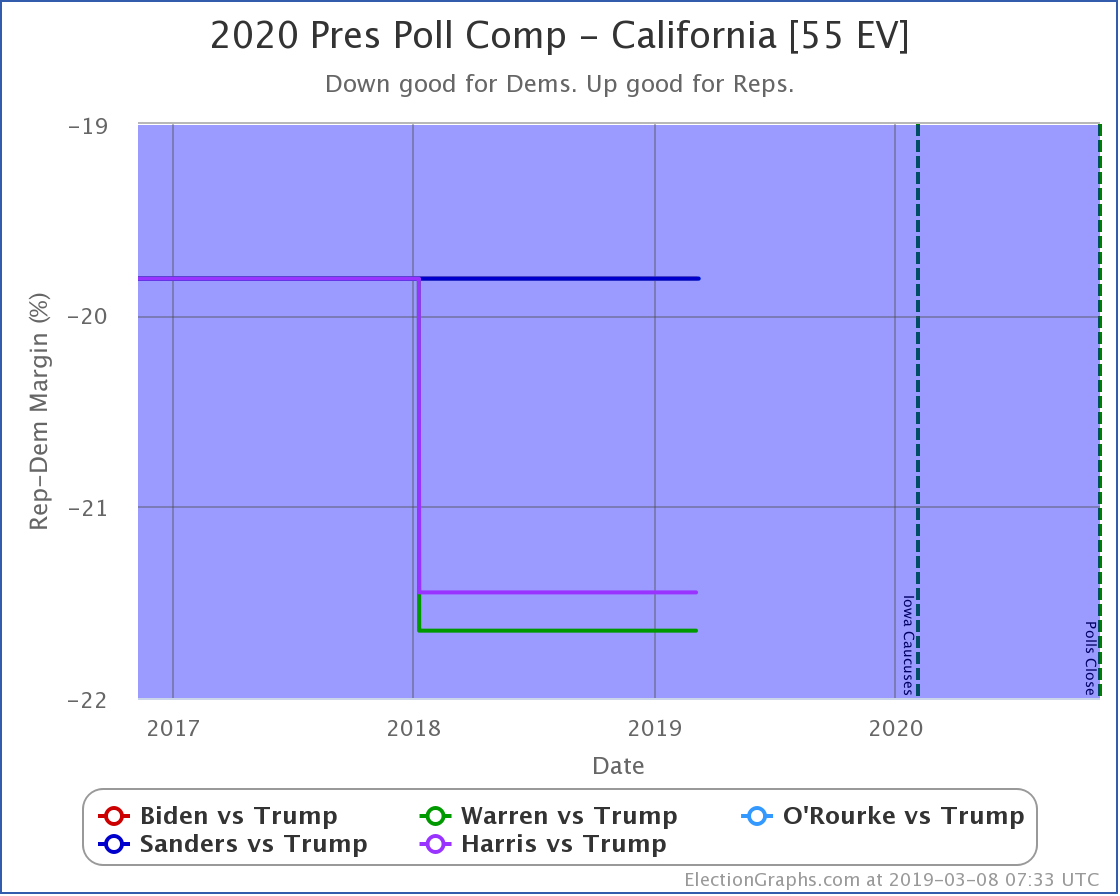
OK, in California Biden hasn't broken out. He hasn't actually been polled in California yet. So his average is just the average of the last five presidential elections.
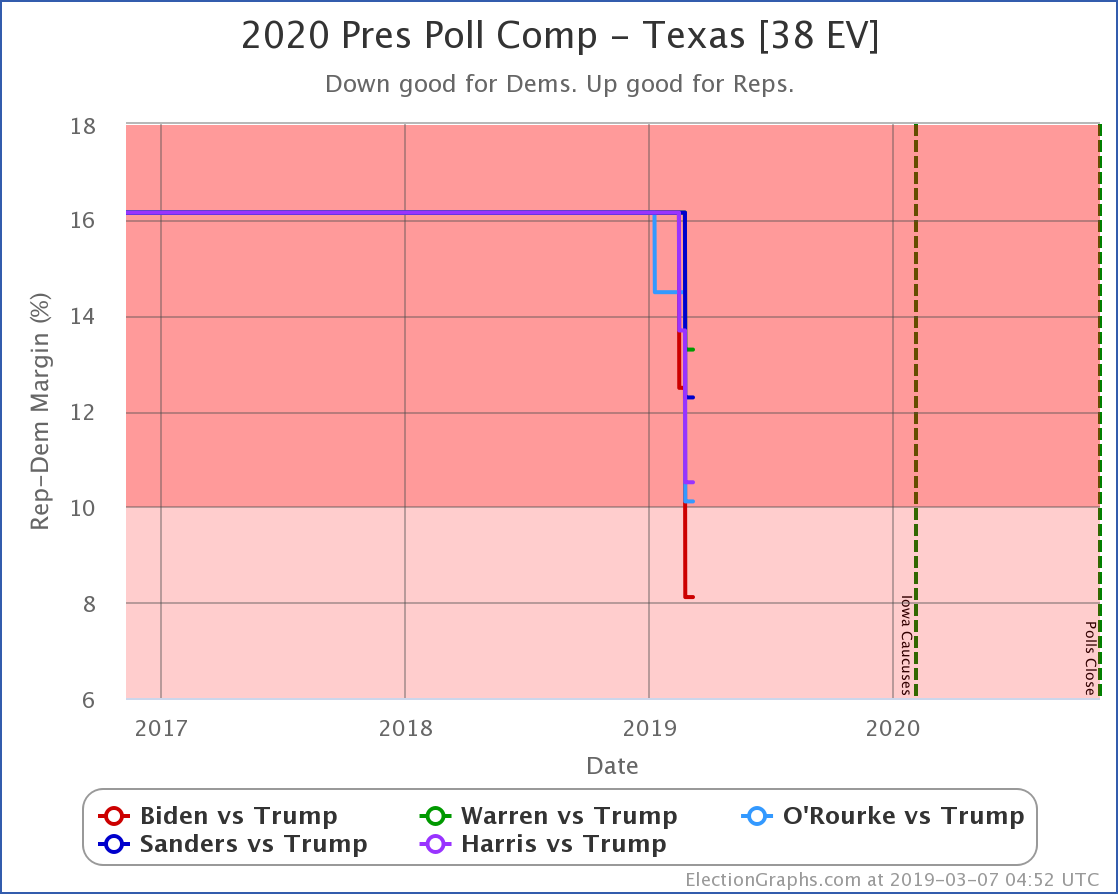
Biden doing better than the other four Democrats in Texas.
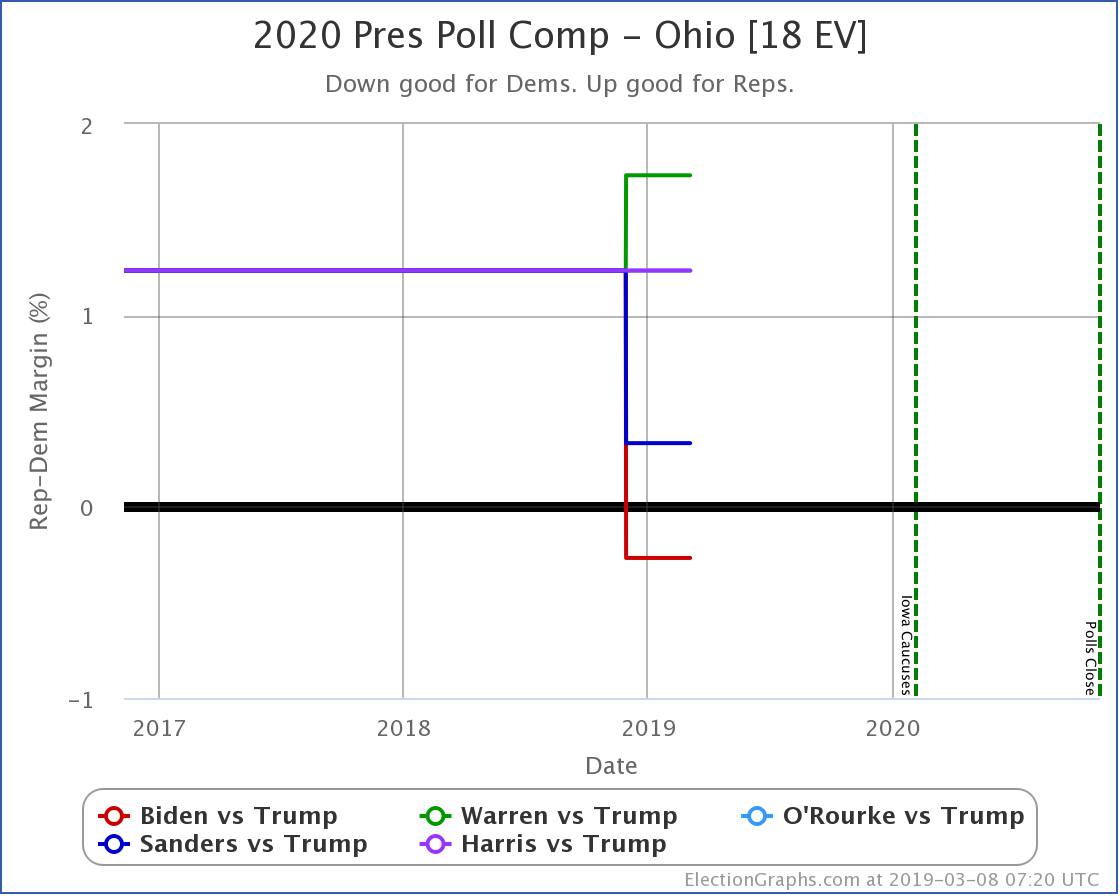
Biden doing better than the other four Democrats in Ohio.
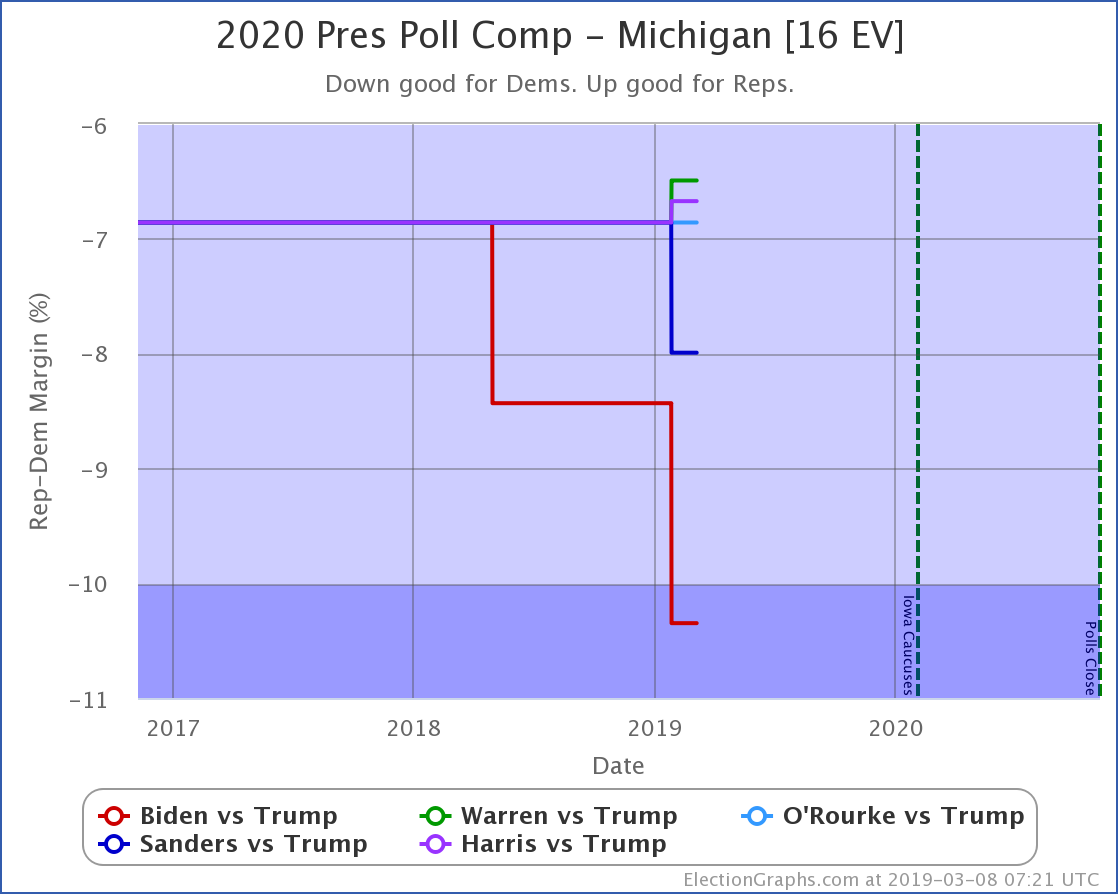
Biden doing better than the other four Democrats in Michigan.
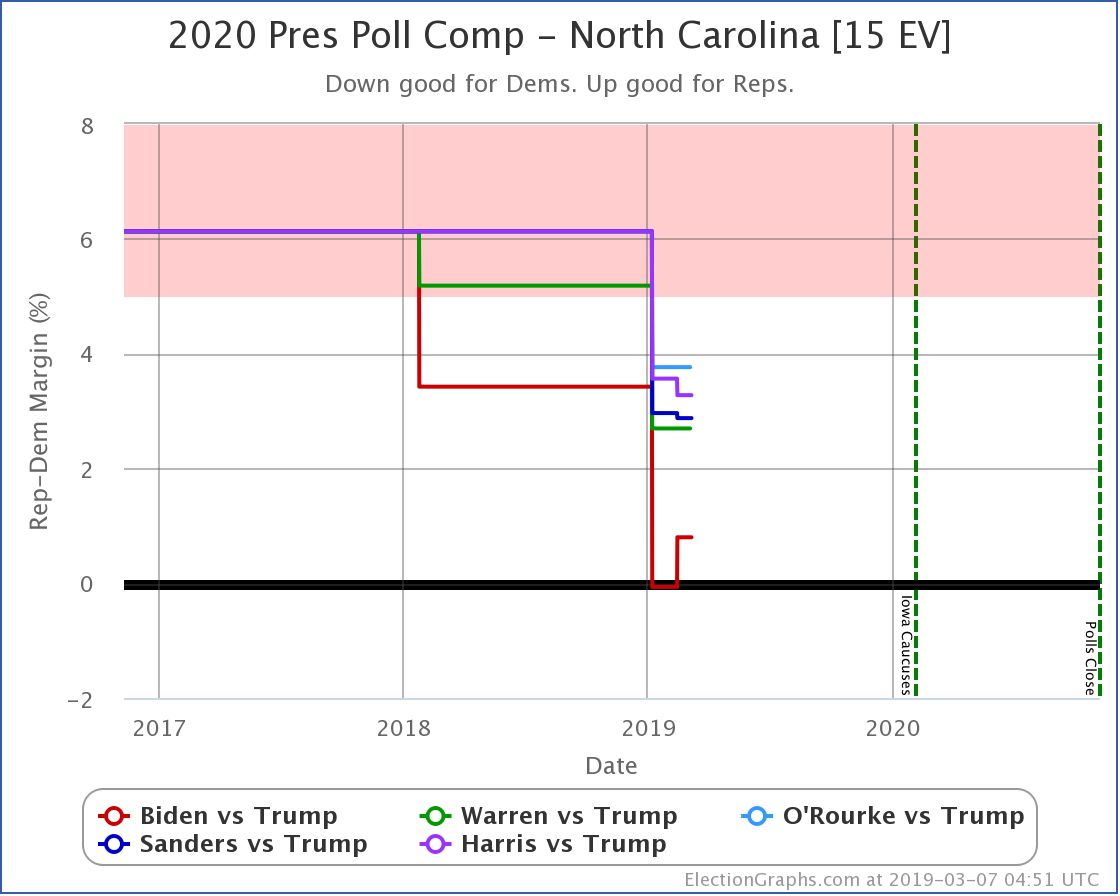
Biden doing better than the other four Democrats in North Carolina.
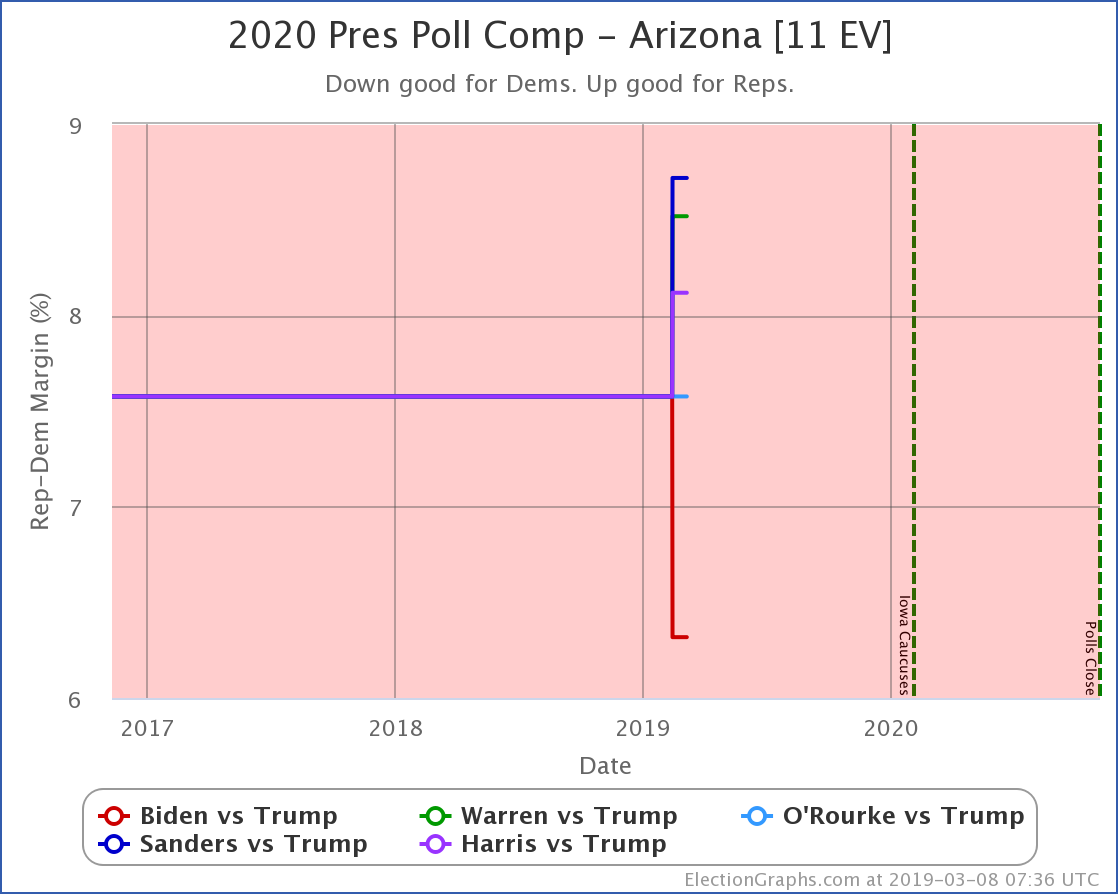
Biden doing better than the other four Democrats in Arizona.
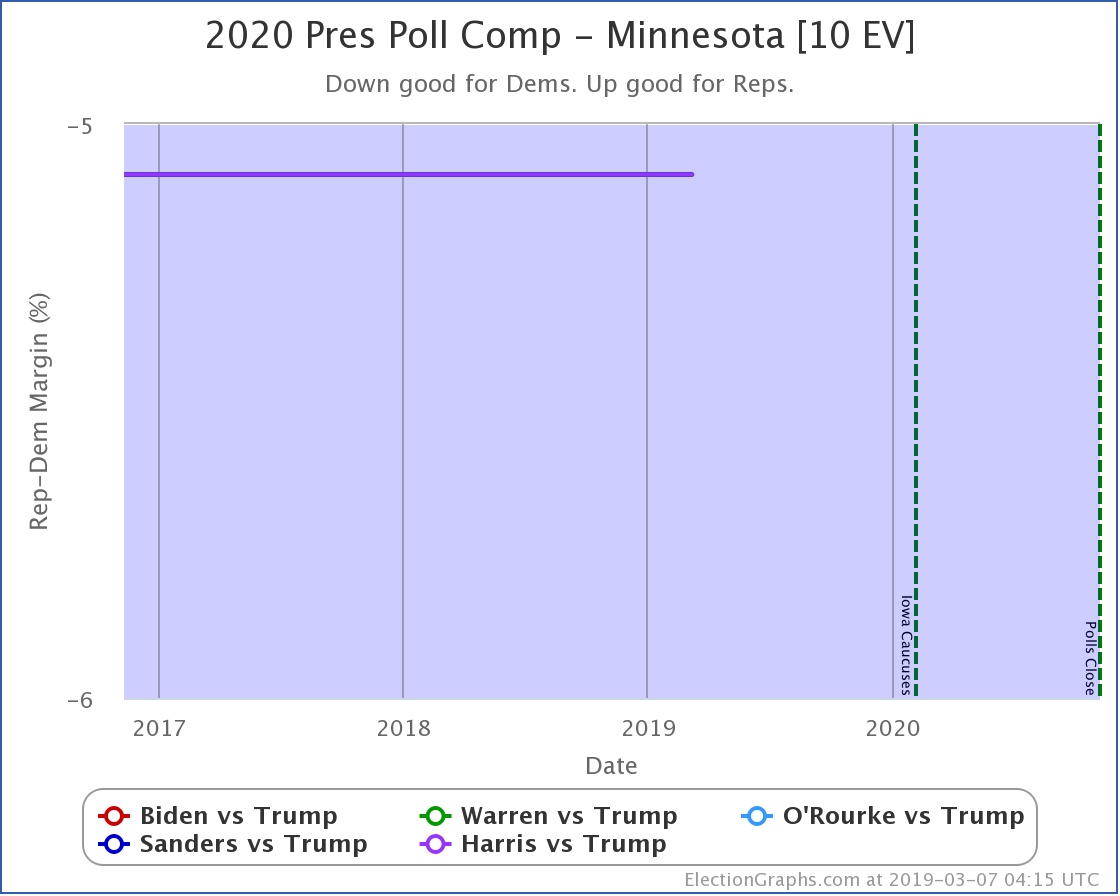
OK, none of the top five have been polled in Minnesota yet. (Only Klobuchar has been.) So they are all still on one line.
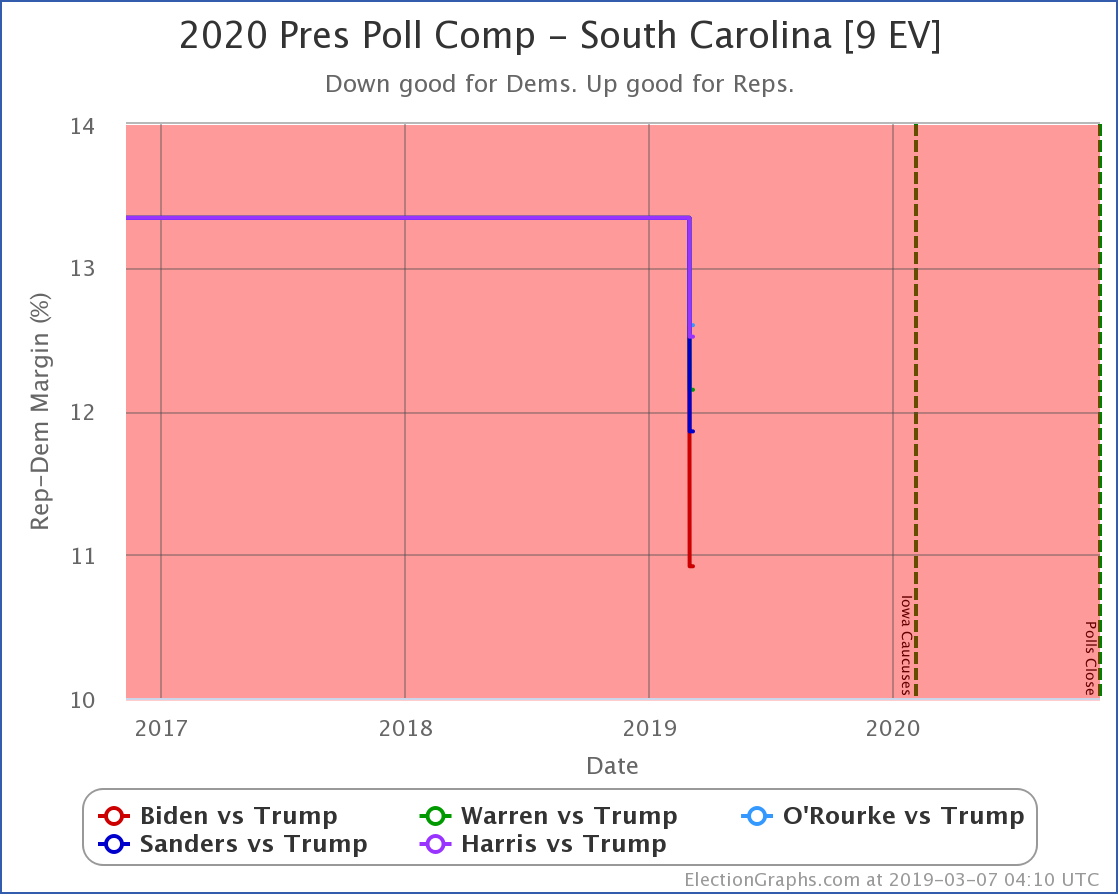
Biden doing better than the other four Democrats in South Carolina.
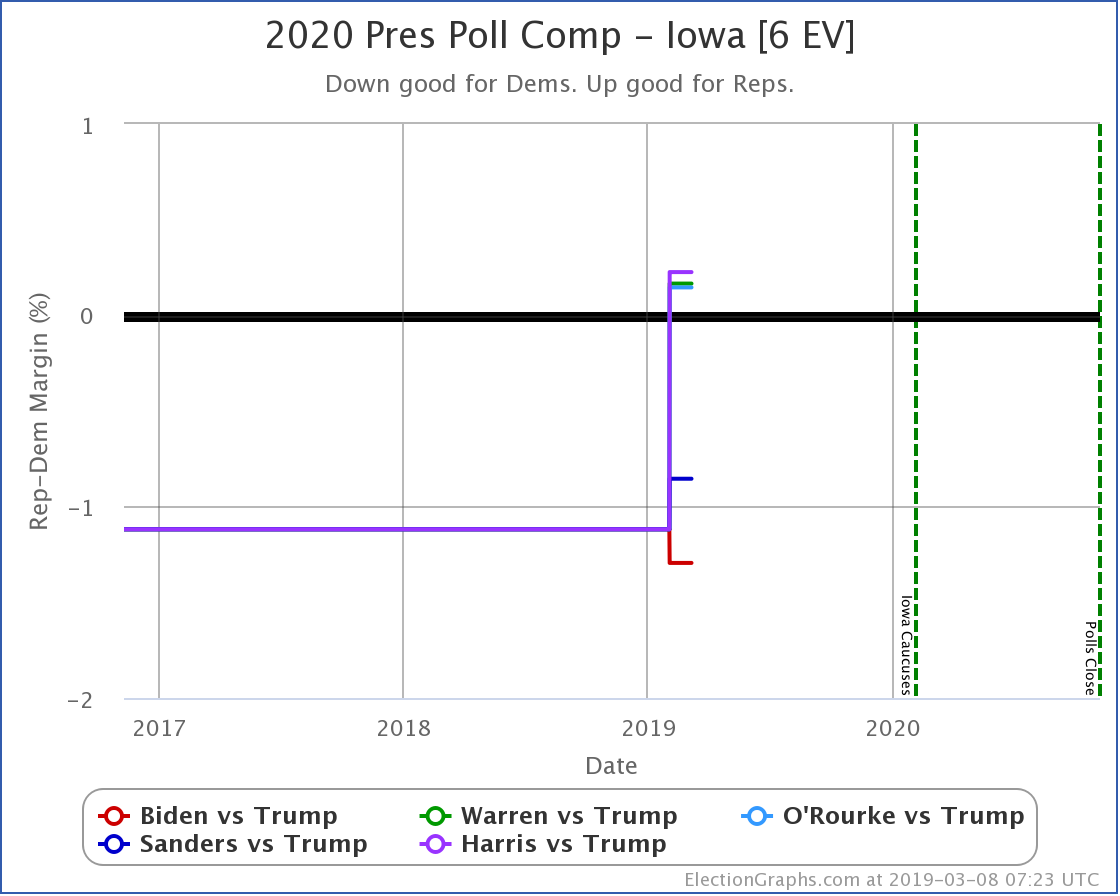
Biden doing better than the other four Democrats in Iowa.
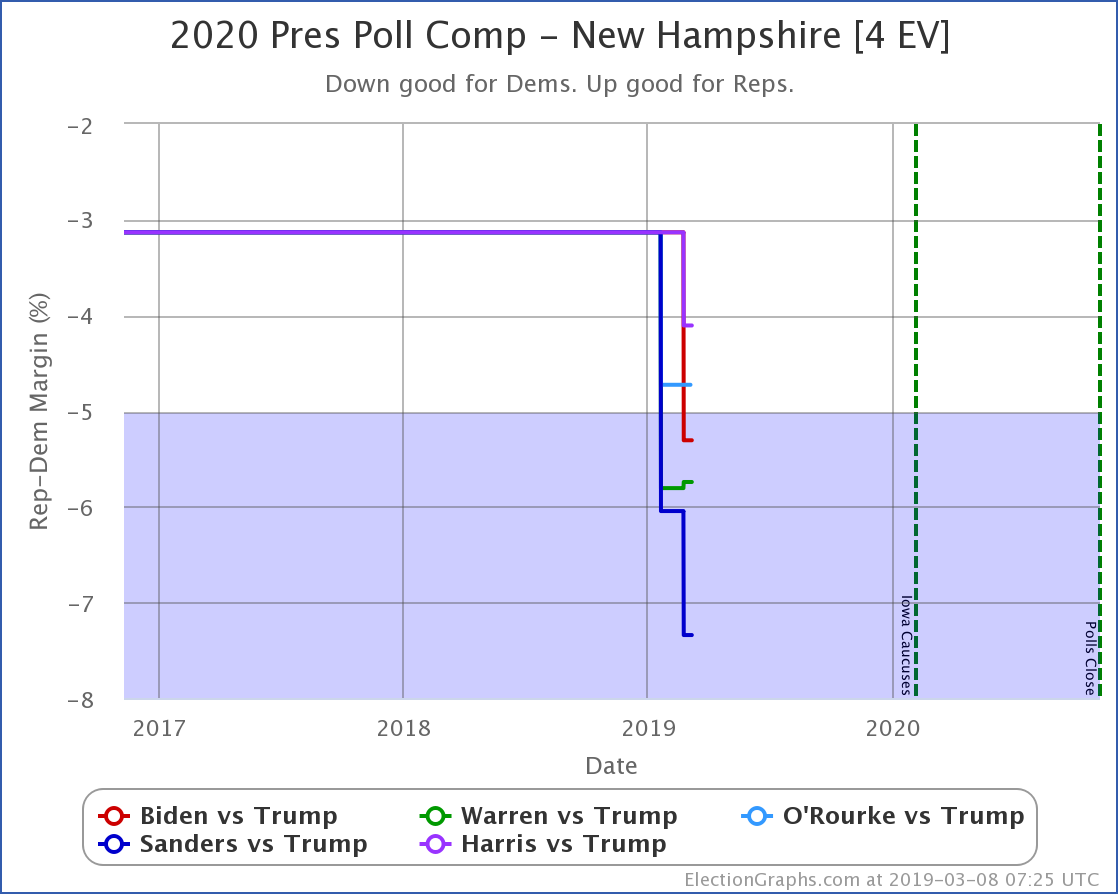
OK, we finally have a state where Biden has been polled and he isn't doing better than the other Democrats. In New Hampshire, both Sanders and Warren do better against Trump than Biden does.
But that is it. Out of 10 states where we have state polls so far, Biden does better than the other four Democrats in 7. In 2 Biden hasn't been polled yet. Only in 1 does another Democrat do better against Trump.
Now, to be clear, at this stage in a Presidential race, this may be due entirely to name recognition. Most people may still not have much of an idea who Warren, O'Rourke, and Harris even are. But surely they would know who Sanders is, right? His name recognition must be comparable to Biden's. Right?
In any case, the way Biden consistently is outperforming other Democrats against Trump in the polls so far is striking. And he hasn't even officially said he is running yet.
It will be interesting to see if this pattern continues as the field starts to gel, and the other candidates get better known.
Election Graphs will of course update as the new polls come in…
For more information…
This post is an update based on the data on the Election Graphs Electoral College 2020 page. Election Graphs tracks a poll-based estimate of the Electoral College. The charts, graphs, and maps in the post above are all as of the time of this post. Click through on any image to go to a page with the current interactive versions of that chart, along with additional details. Follow @ElectionGraphs on Twitter or Election Graphs on Facebook to see announcements of updates. For those interested in individual poll updates, follow @ElecCollPolls on Twitter for all the polls as they are added. If you find the information in these posts interesting or useful, please consider visiting the donation page.
2 thoughts on “The First 2020 Polls”