Blue Virginia

Since last week's update, there was only one new poll released, a University of Mary Washington poll of Virginia.

They polled Biden, Sanders, Warren, and Harris against Trump. No new data for Buttigieg or O'Rourke.

This poll was the first public polling of Virginia this cycle. The only glimpse we had previously was leaked Trump internal polling from March which only included Biden.

Virginia has been trending blue over the last few elections, but Election Graphs starts with the average of the previous five elections before we have polls and the average margin from 2000 to 2016 ended up as a 0.1% Republican lead.

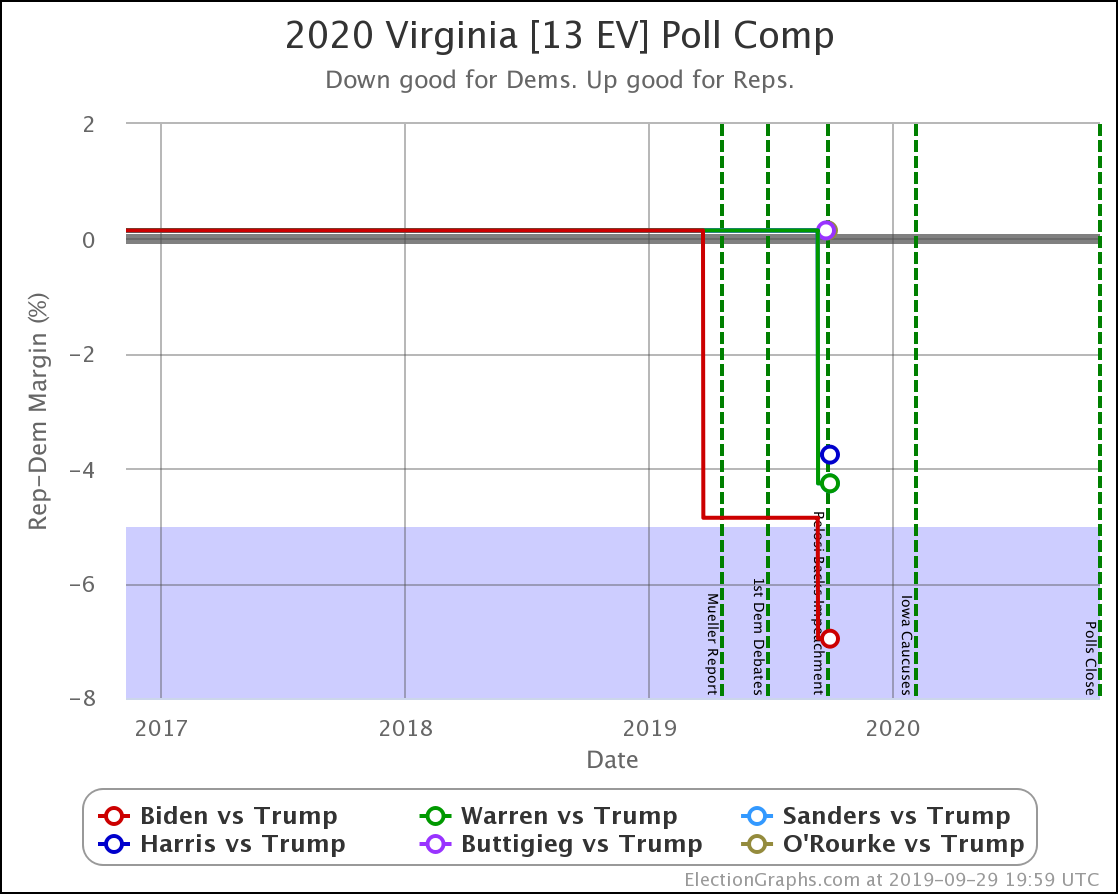
The leaked Biden vs. Trump poll moved the state from Weak Trump (by 0.1%) to Weak Biden (by 4.9%) in the Election Graphs average, but with no 2020 data, all the other Democrats remained in "Weak Trump" territory despite the general sense that because of the trends in Virginia, this was unlikely to stay the case.

At long last, we have a new public poll of Virginia though. So we start to see how the state looks for 2020.

All four Democratic candidates led Trump by double digits in this new poll. The poll averages still include some older election results though, since this is the first 2020 polling in Virginia for every matchup except Biden vs. Trump.

In terms of categories, this moved the state from "Weak Trump" to "Weak Democratic" for Sanders, Warren, and Harris.

Biden, having already taken the lead after that leaked Trump internal poll, now moves from "Weak Biden" to "Strong Biden."
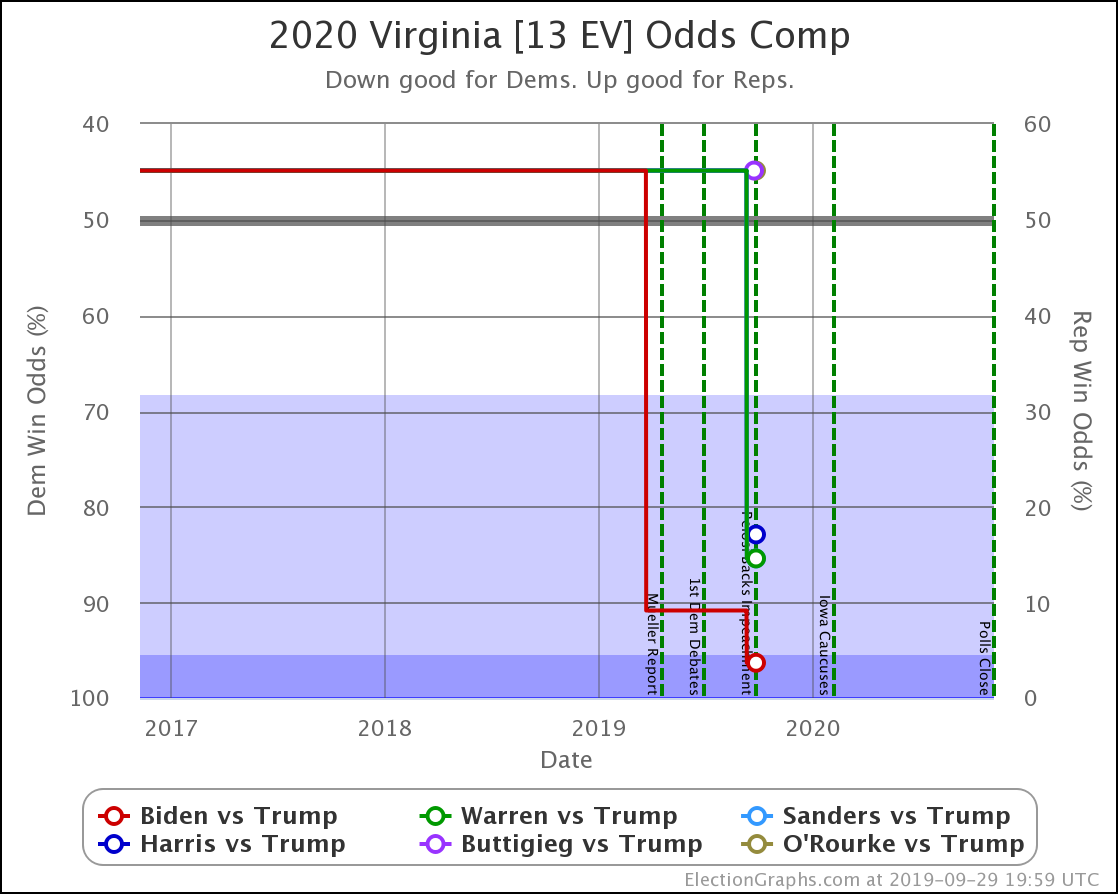

In terms of odds of winning, that means that every Democrat that has been polled in Virginia so far is estimated to have an 80%+ chance of winning the state according to the historical accuracy of Election Graphs poll averages.

As usual, I must repeat the universal caveat on this site: These numbers are if the election was today. The election is not today, a lot will change between now and then.

Also, in this case, we still have sparse polling.

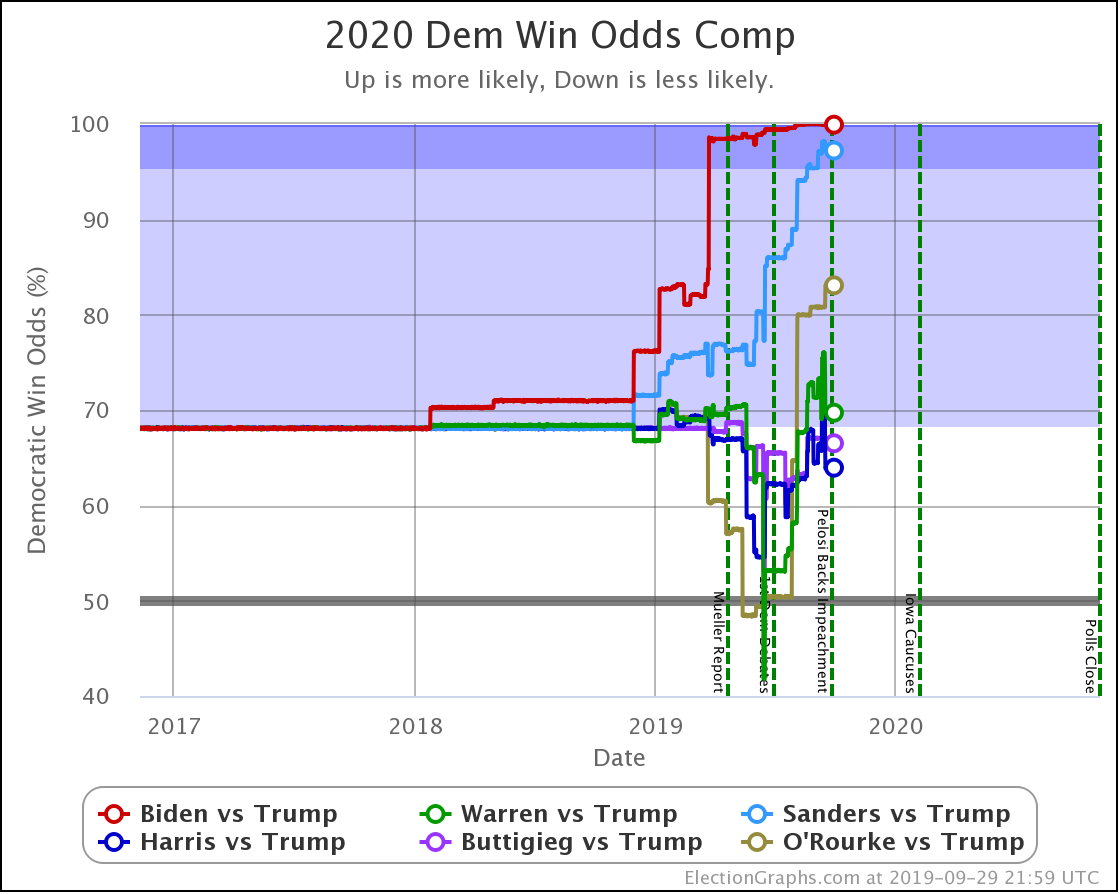
So, what does the national picture look like now in terms of the chance of the Democrat winning?

Dem 22 Sep 29 Sep 𝚫
Biden 99.9% 99.9% Flat
Sanders 95.3% 97.2% +1.9%
O'Rourke 83.1% 83.1% Flat
Warren 62.4% 69.7% +7.3%
Buttigieg 66.5% 66.5% Flat
Harris 54.7% 64.0% +10.7%

It is hard for Biden to improve his position much given where he is, but the movement of Virginia in the blue direction helps the other three Democrats with poll results, with the most significant boost going to Harris.

And that is all for this week.

400.9 days until polls start to close.

For more information:

This post is an update based on the data on the Election Graphs Electoral College 2020 page. Election Graphs tracks a poll-based estimate of the Electoral College. The charts, graphs, and maps in the post above are all as of the time of this post. Click through on any image to go to a page with the current interactive versions of that chart, along with additional details.

Follow @ElectionGraphs on Twitter or Election Graphs on Facebook to see announcements of updates. For those interested in individual poll updates, follow @ElecCollPolls on Twitter for all the polls as I add them. If you find the information in these posts informative or useful, please consider visiting the donation page.

Another Mixed Week for Dems

Since last week's update, there has been new polling released in Arizona (x2), Colorado, Kentucky, Maine, North Carolina, California (x2), Florida, Texas, and Missouri.

Once again we have mixed results.

Two of the six most polled Democrats (Biden and O'Rourke) improve their positions in the probabilistic view when you combine the results of all of those polls.

The other four (Sanders, Buttigieg, Warren, and Harris) slip in their matchups against Trump. Some weaken significantly.

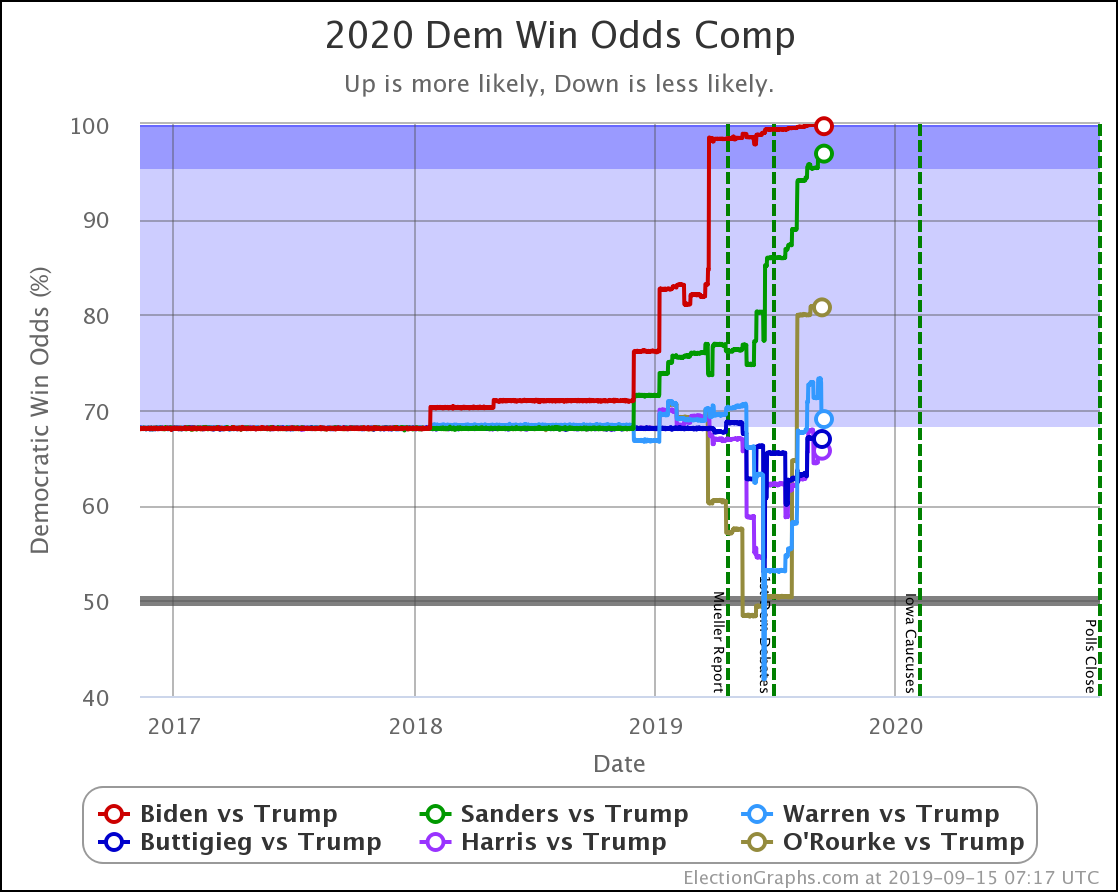
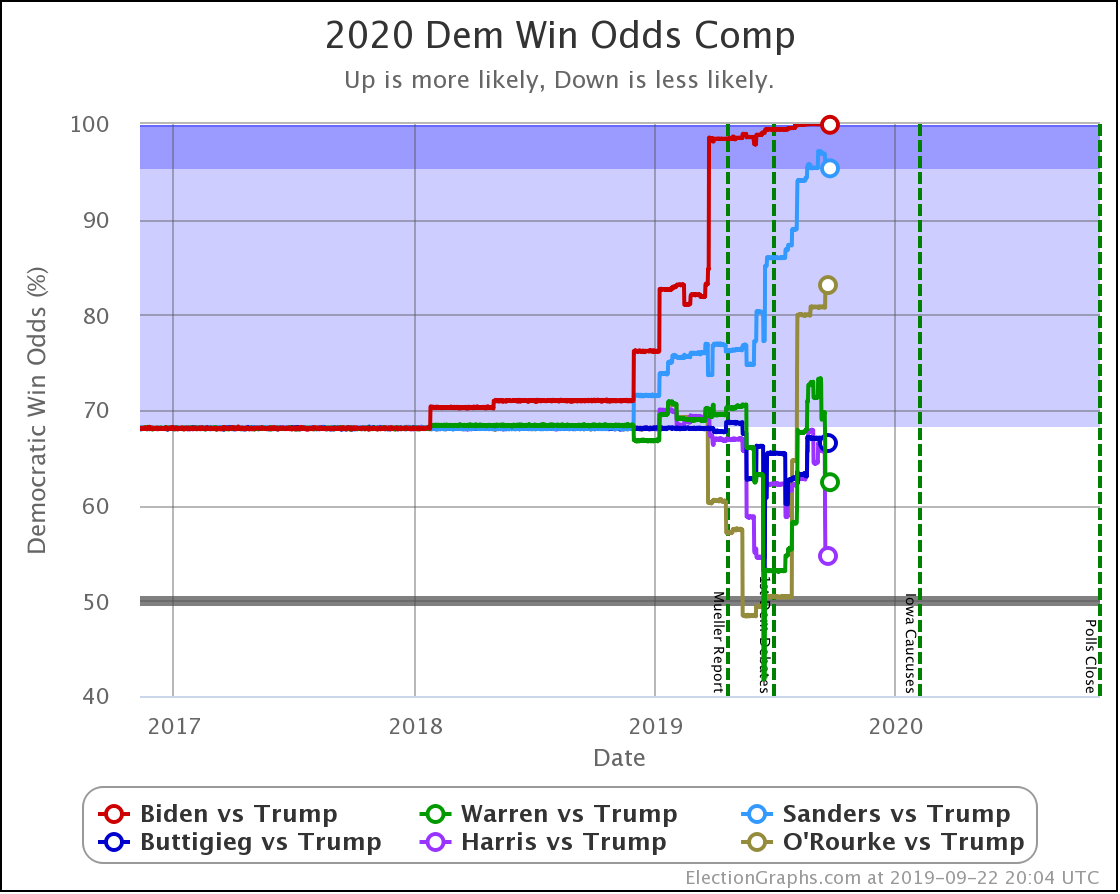
So let's start with the national "Odds of a Democratic Win" view:

Dem 15 Sep 22 Sep 𝚫
Biden 99.8% 99.9% +0.1%
Sanders 96.9% 95.3% -1.6%
O'Rourke 80.8% 83.1% +2.3%
Buttigieg 67.0% 66.5% -0.5%
Warren 69.0% 62.4% -6.6%
Harris 65.7% 54.7% -11.0%

The two that stand out here are Warren and Harris. The new polls this week hurt their win chances significantly. Harris is now looking only slightly better off than a coin toss in a race against Trump.

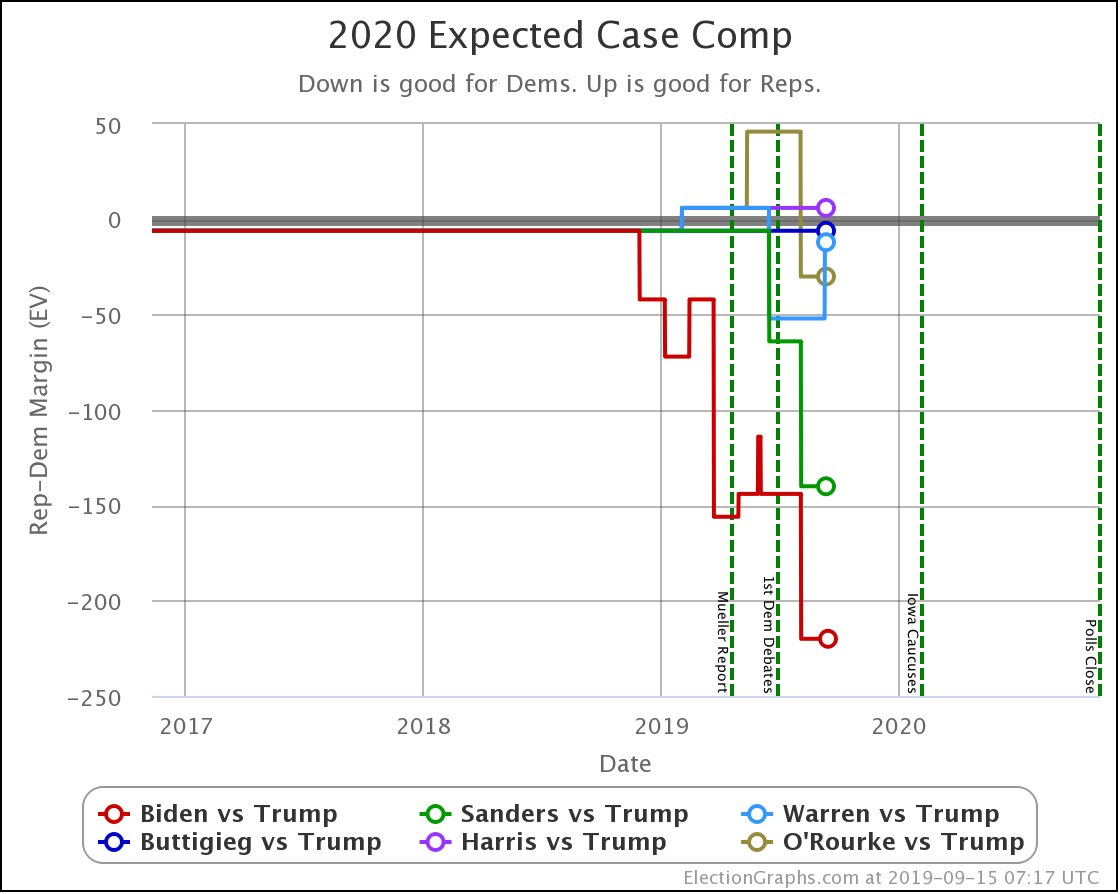
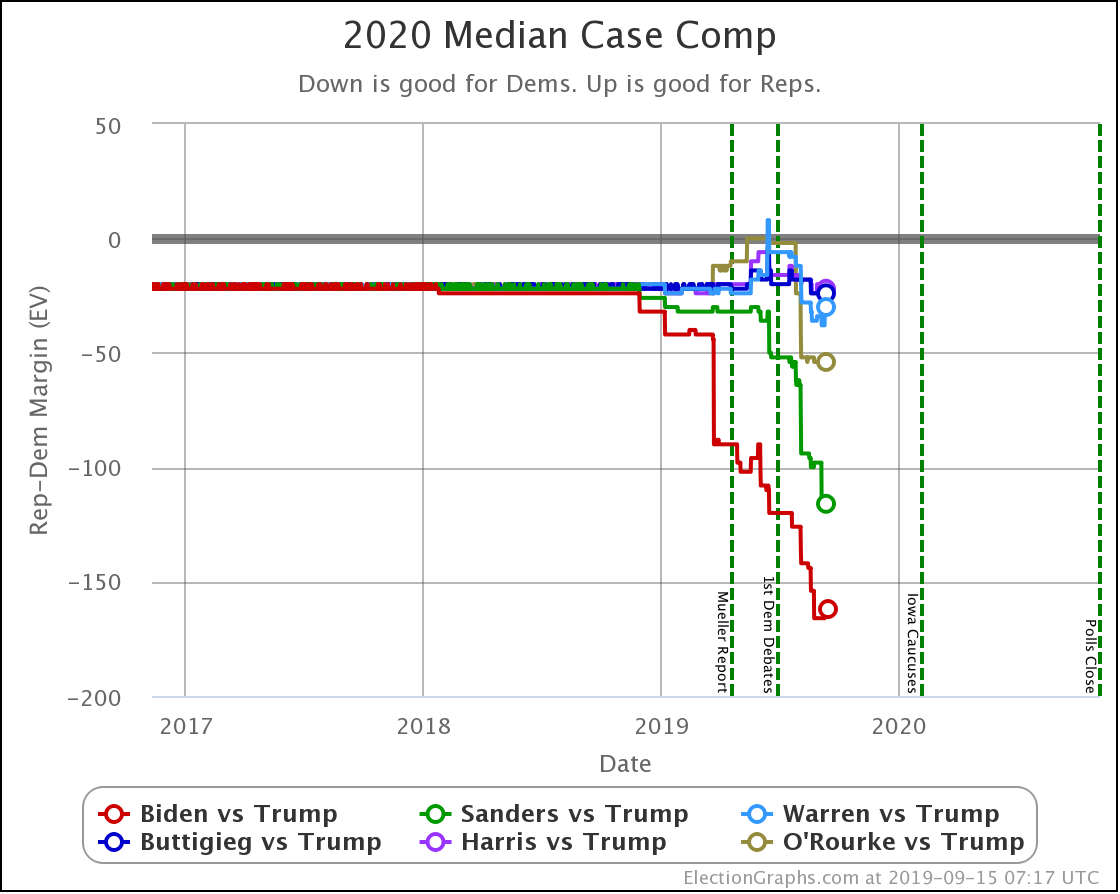
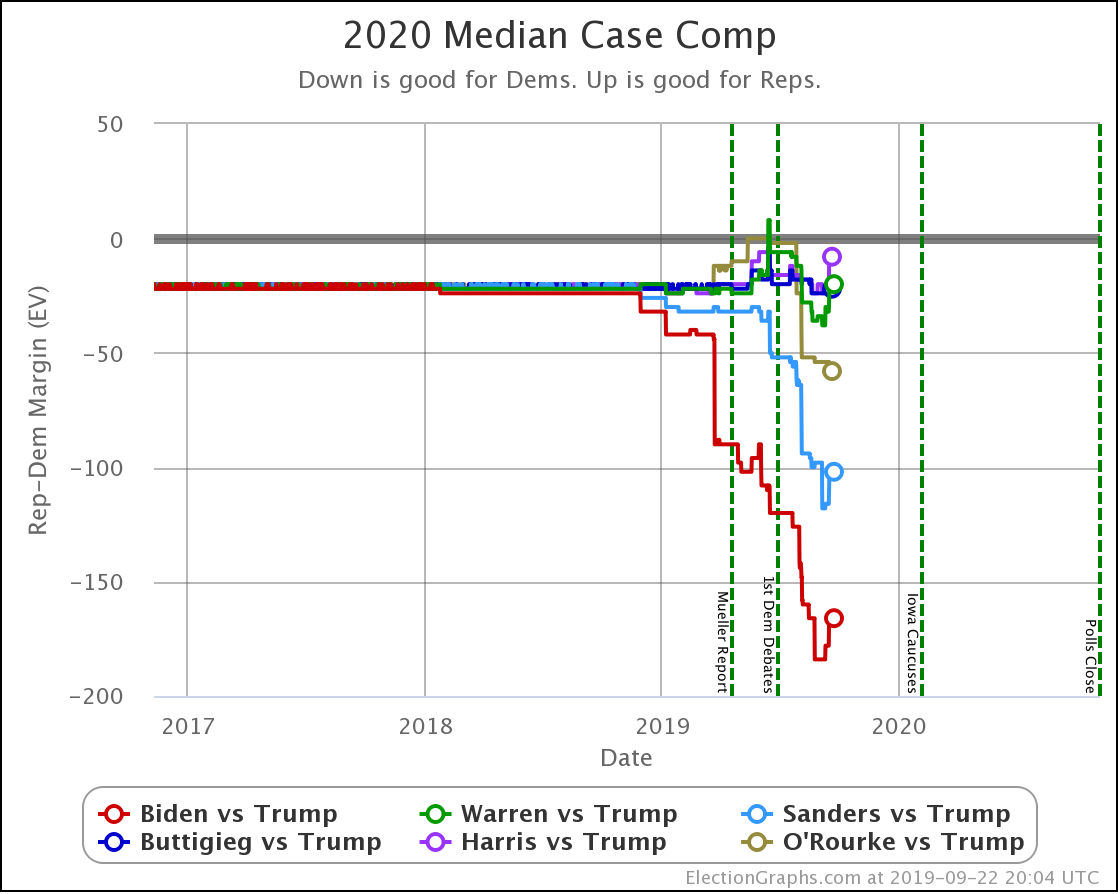
We'll look at each state to determine where these changes are coming from, but first, you can also see this pattern dramatically when looking at the "Median Case" from the Monte Carlo simulations.

In this view, you can see that the winning margins of every  Democratic candidate except O'Rourke have been decreasing lately. Including Biden.

A lot of the "movement" of these various lines up until now could still be attributed to actual 2020 polling replacing old elections in our state polling averages. We are getting to the point though where a lot (although not all) of the critical states are mostly 2020 polls.

So we may start seeing trends that represent real changes in public opinion. We will also begin to see what level of variability is just inherent in looking at the election this way. It may end up being "normal" that some of these lines bounce up and down quite a bit as we go along.

In the meantime though, time to look at the trends in each of the states where there was new polling over the last week. There are a lot, so I'll be brief.

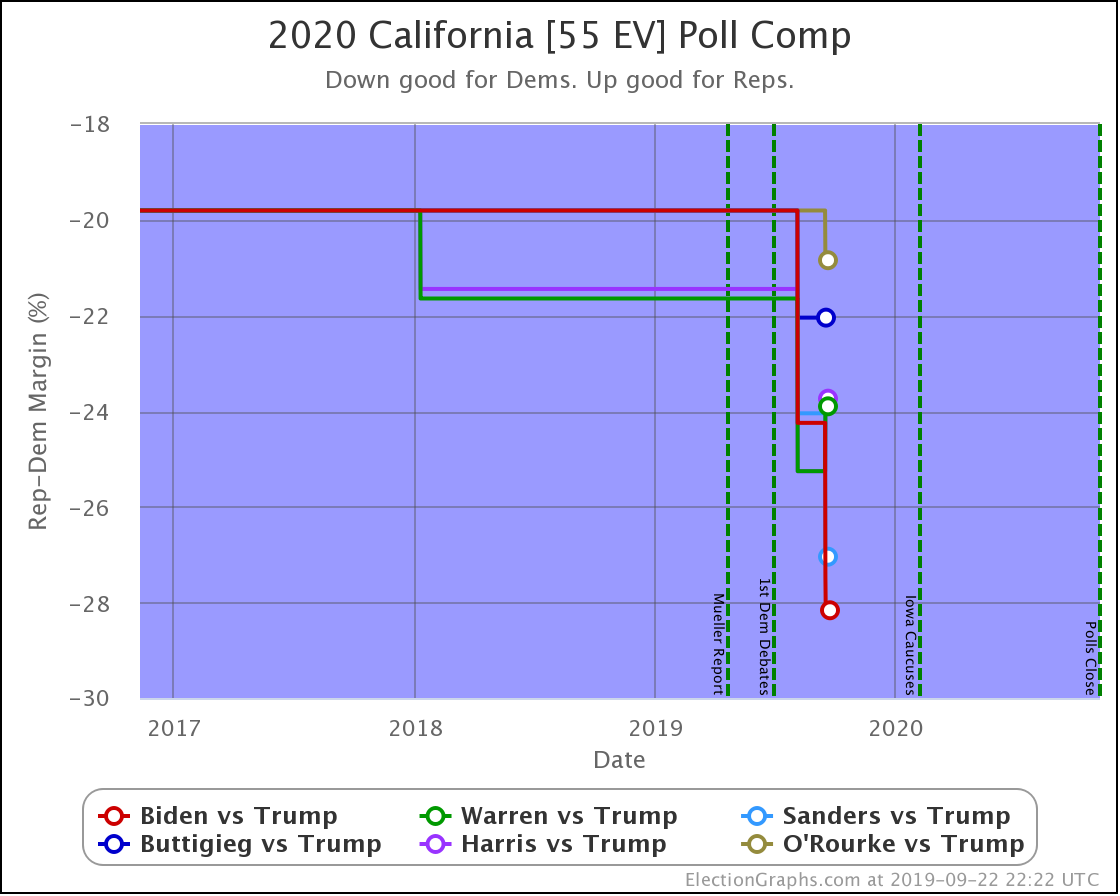
California is so blue; it is mostly irrelevant to the national race. All of the Democrats have a 100% chance of winning California. It is notable though that all six candidates are doing even stronger in California than the historical average from the 2000 to 2016 elections. California is getting even bluer.

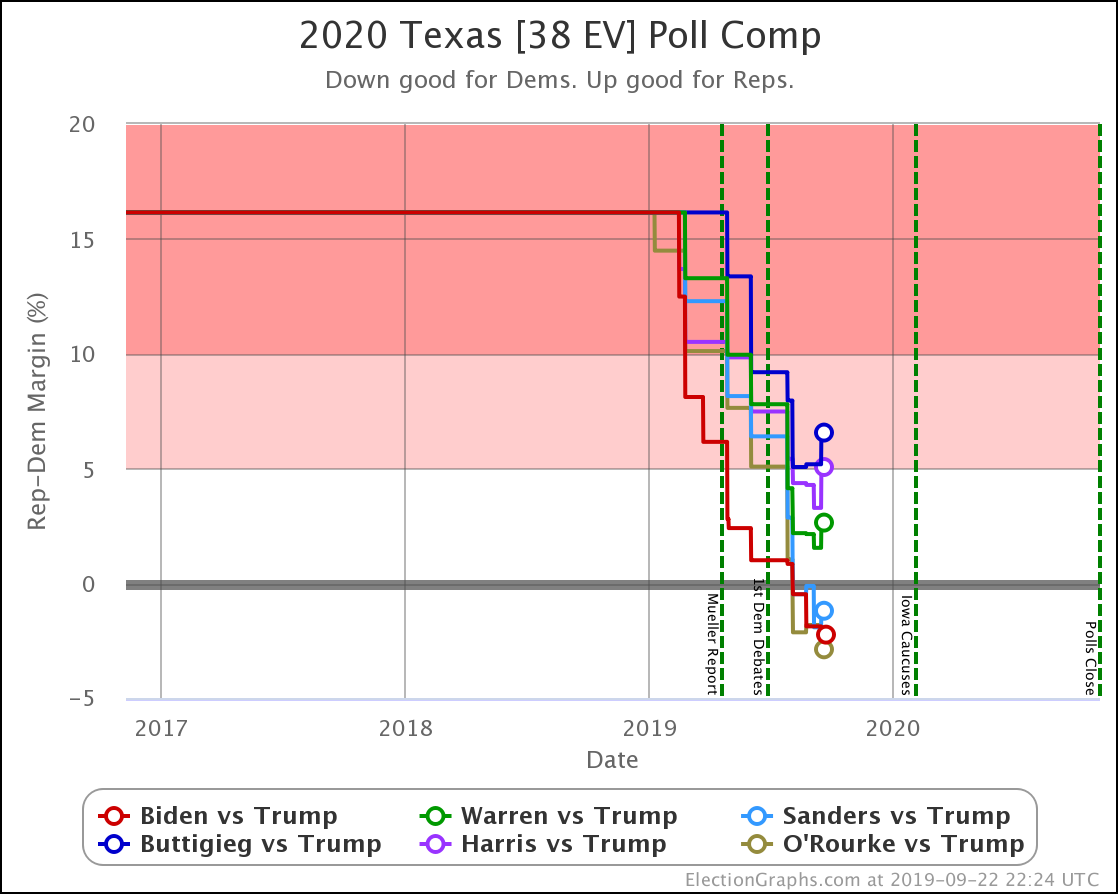
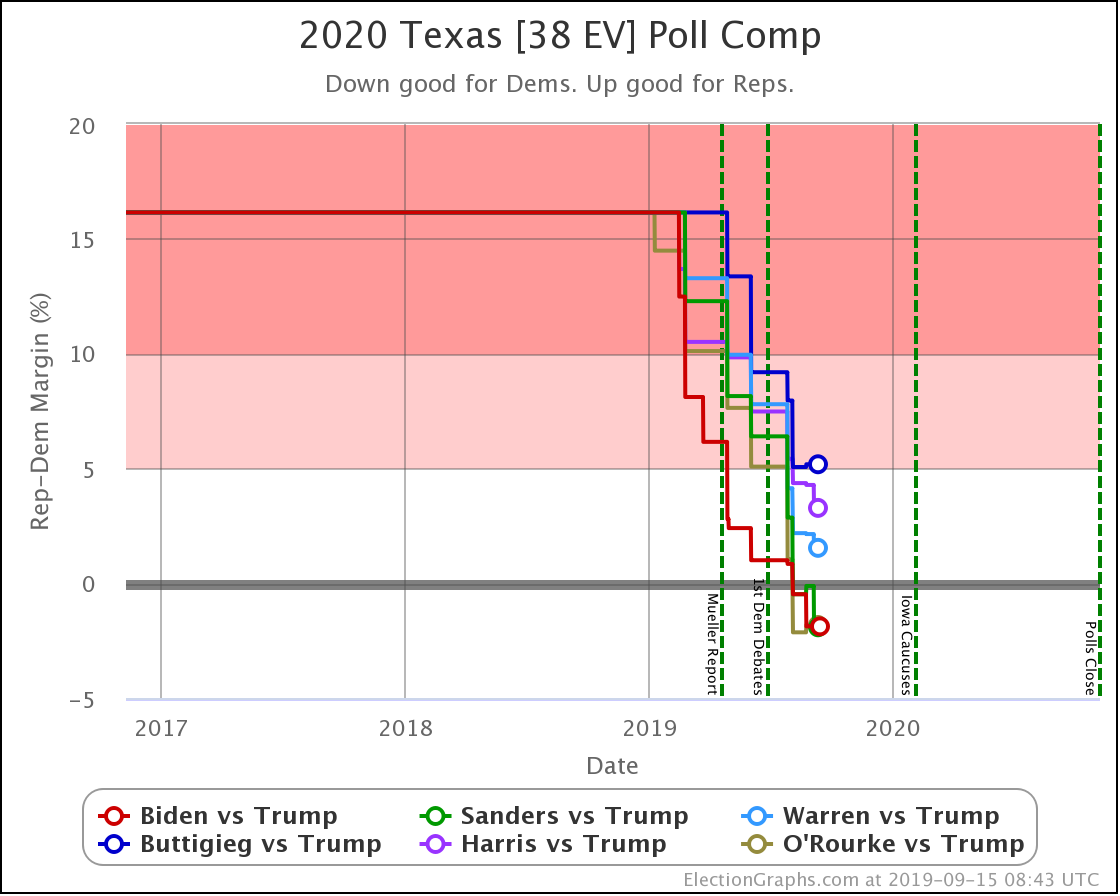
A lot of the win odds changes this week can be attributed to Texas. With the latest polling in Texas, the trend of each new poll moving the state further in the Democratic direction has ended. Biden and O'Rourke still improve slightly, but every other Democrat erodes. Along with Biden and O'Rourke, Sanders retains a lead. Warren, Harris, and Buttigieg not only lose Texas but the picture of them "making it close" is slipping. At least this week.

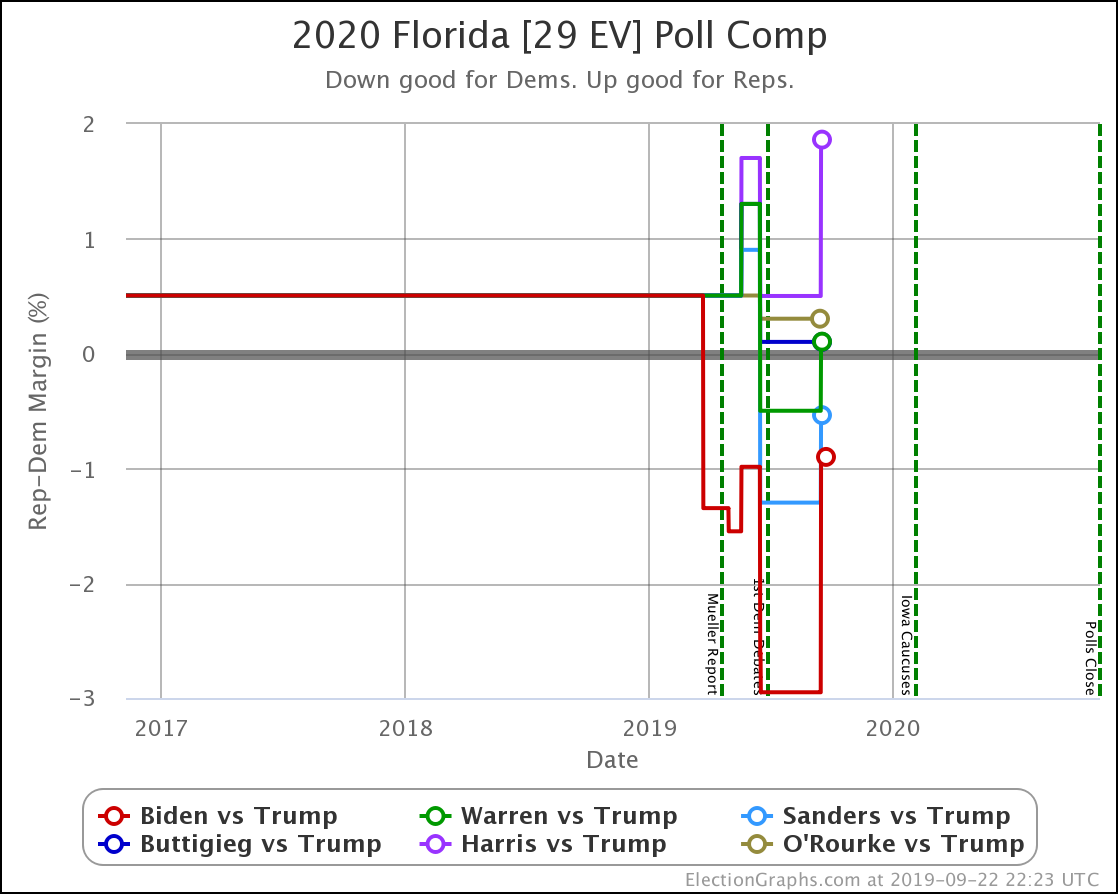
Florida is the other big state responsible for much of this week's changes. The only Democrats who did not weaken in Florida this week are the ones that were not in the polls. Florida has a lot of electoral votes, and Florida is close, so it has an outsized impact on the national picture.

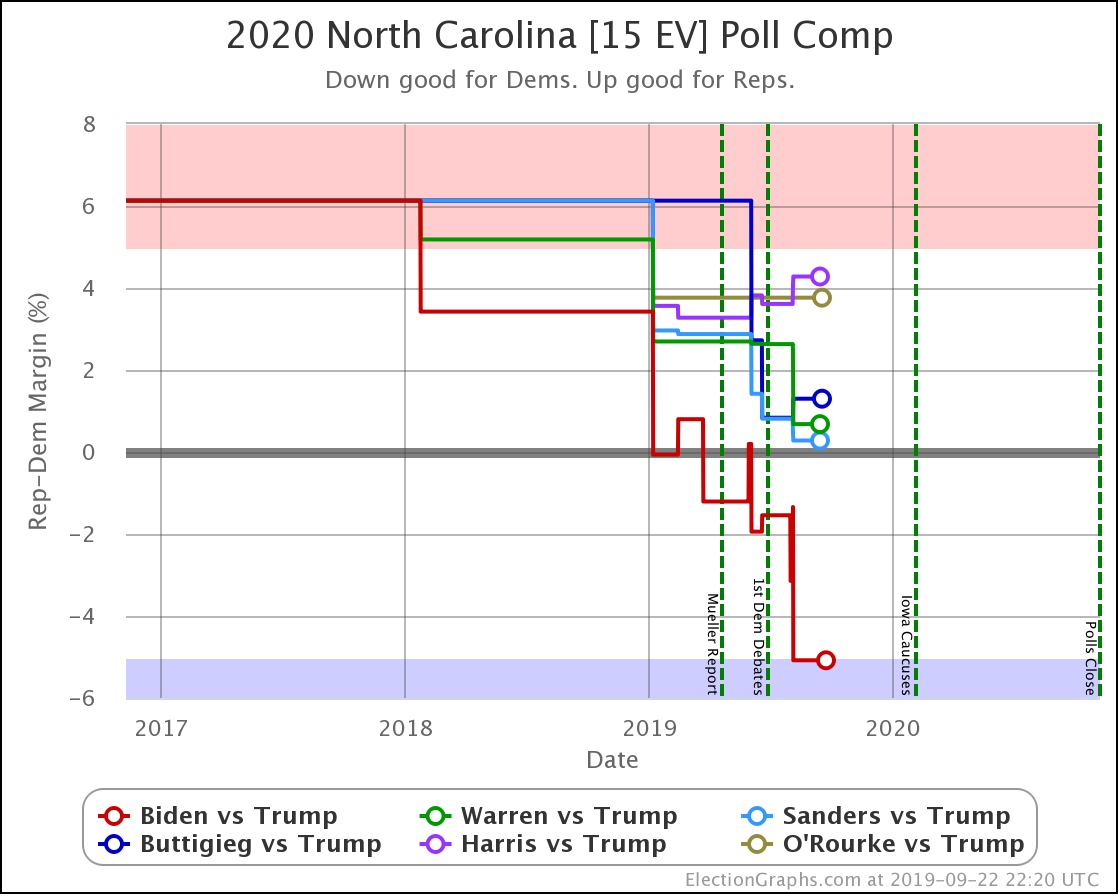
The only mover this week in North Carolina is Biden, with his average moving to a greater than 5% lead for the first time. Trump leads all the other Democrats by narrow margins.

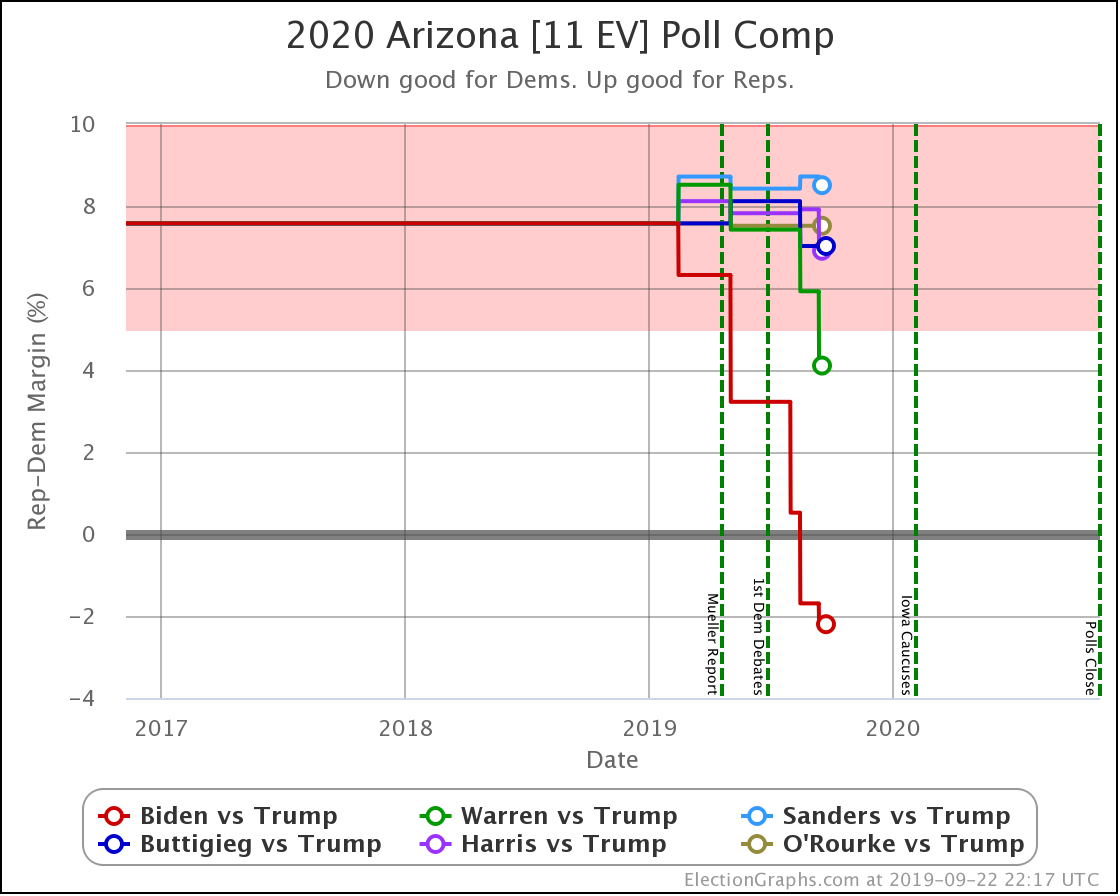
Arizona is another state where there is a big gap between Biden and the rest of the field. This week Biden took the lead in the Arizona poll average. Add Arizona to Texas as red states that flip, and you can see why Biden's national position remains so strong.  Sanders also makes Arizona close, but all of the other Democrats are hovering around the historical average, which is a Strong Republican win.

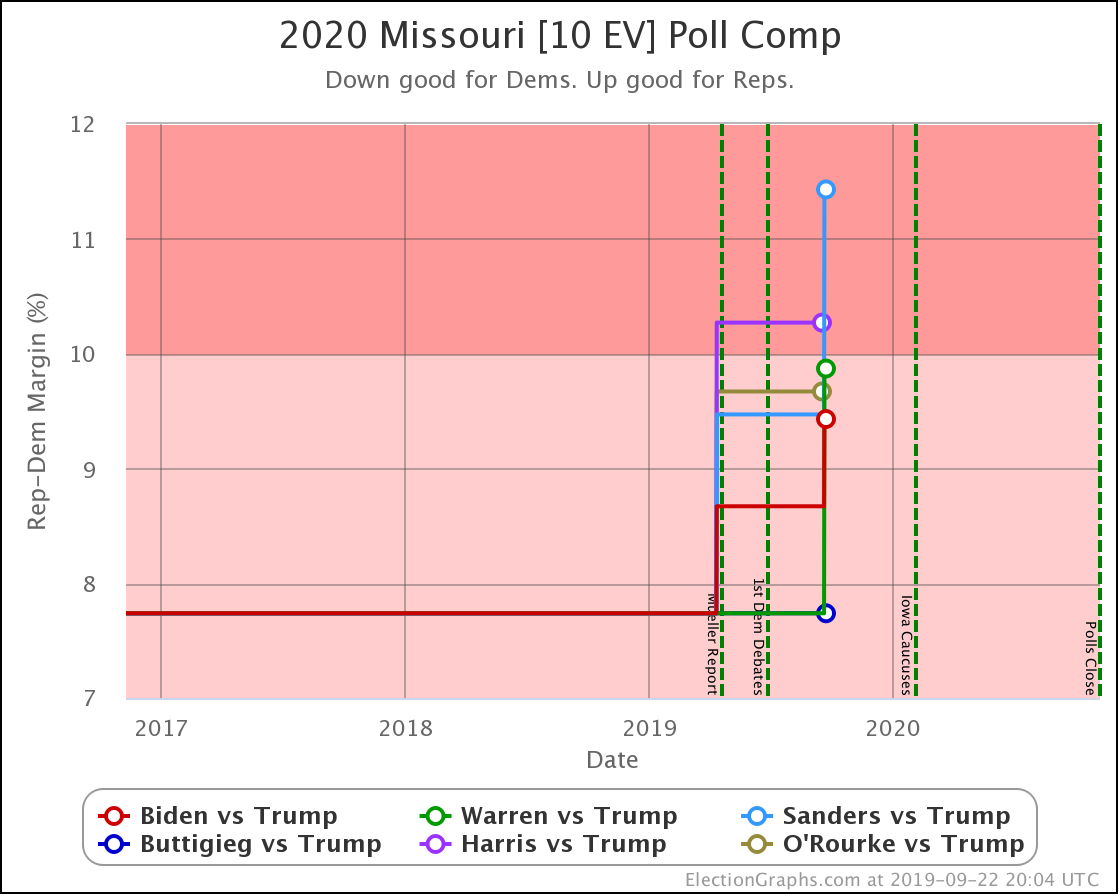
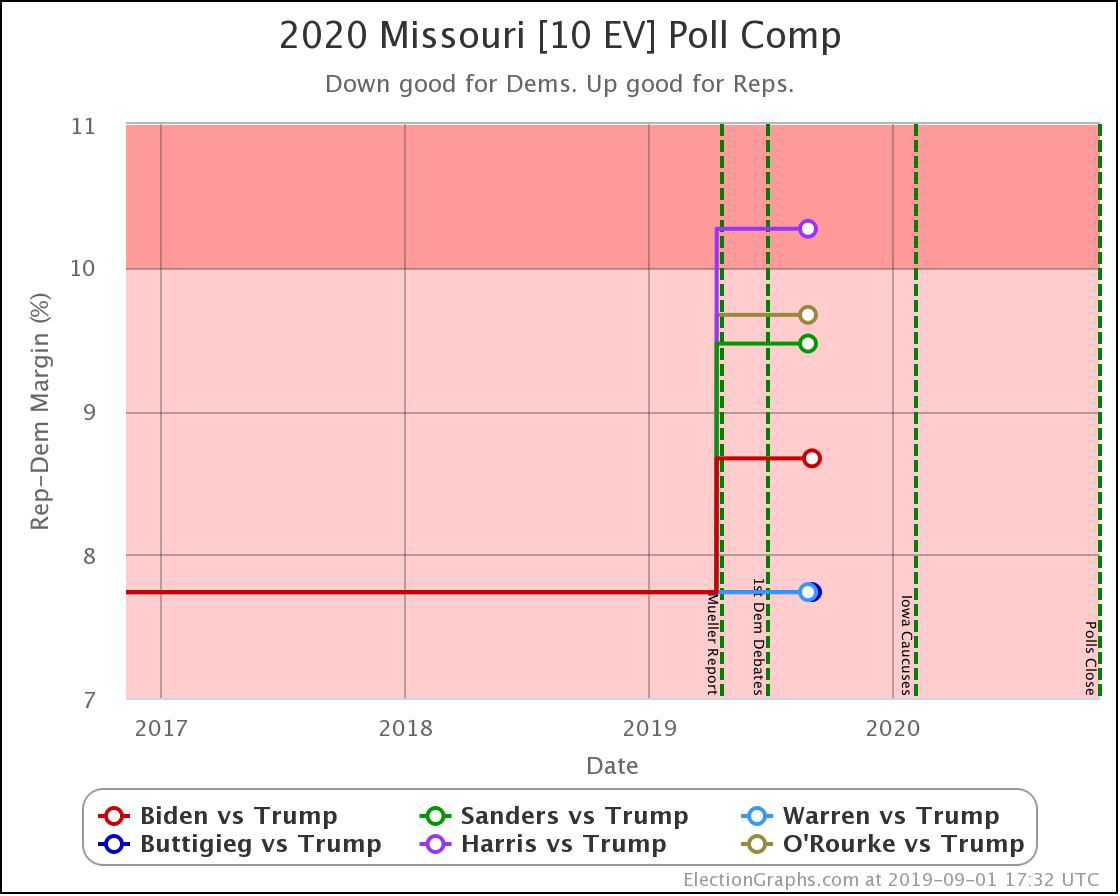
Missouri is clear red state, and with two polls so far this cycle, it just looks like it is getting redder.

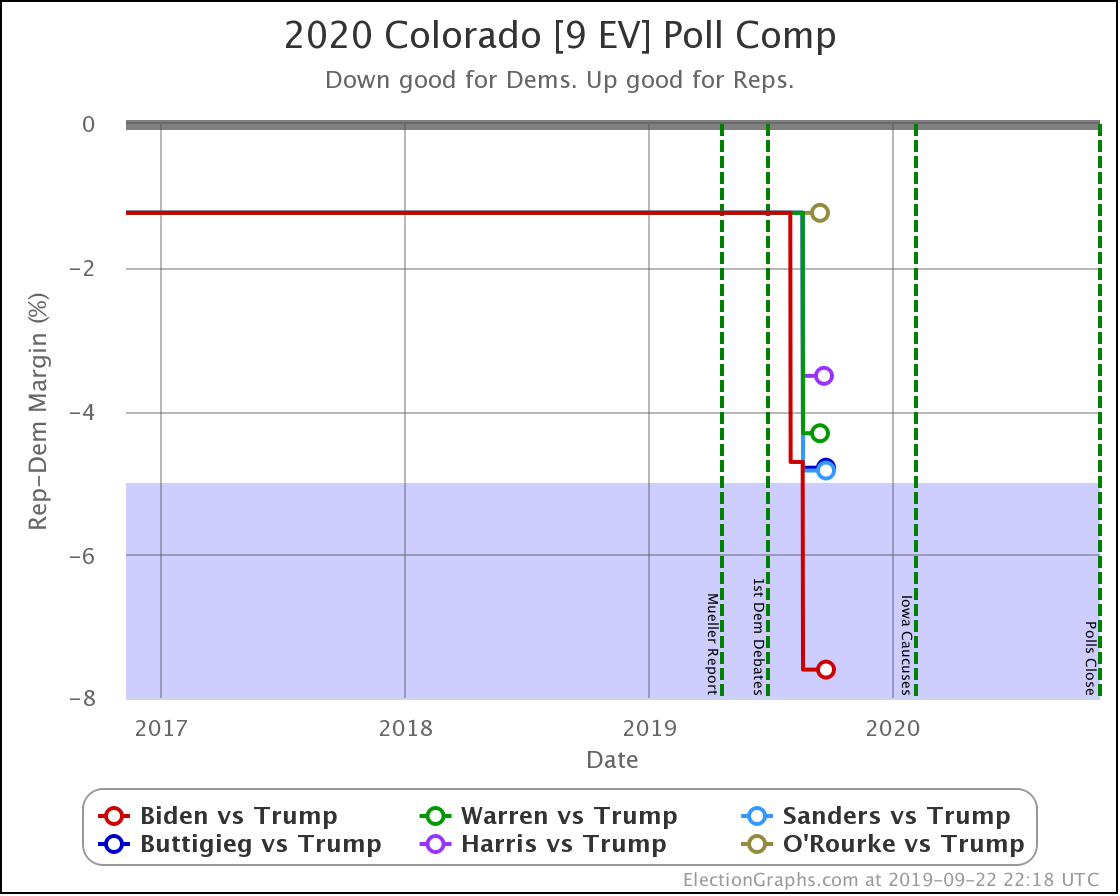
At the same time, Colorado is getting bluer. Only Biden moves the state into Strong Democrat territory so far though. The other candidates still only have narrow leads in the polling average.

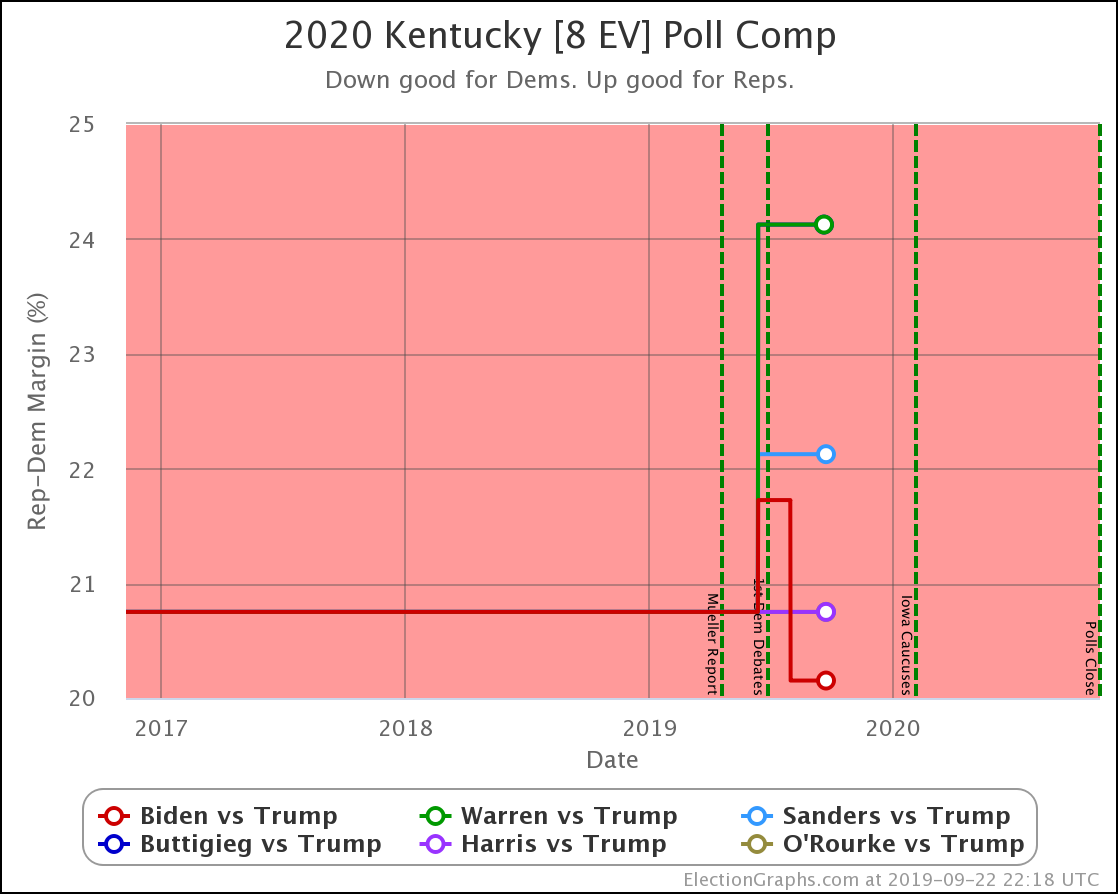
Kentucky is red and not in contention for 2020. With the small amount of polling so far though, Biden still does best, actually decreasing the Republican margin slightly. Not so much for the others.

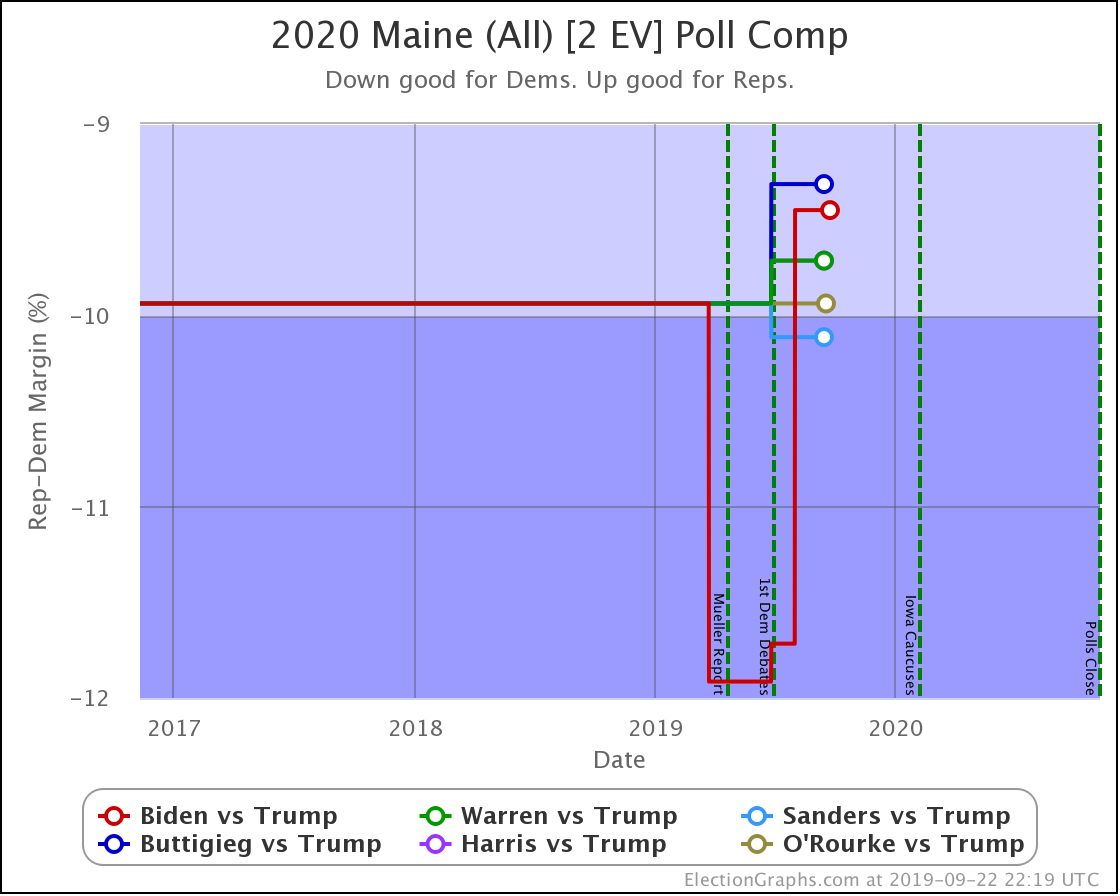
Finally Maine. Maine is blue and does not look to be changing into anything else. With the first few polls, Biden looked like he might be making it even bluer than before. But as we stand today, all of the Democrats are pretty close to the historical average for the state.

And that is where things are this week.

408.0 days until polls start to close.

For more information:

This post is an update based on the data on the Election Graphs Electoral College 2020 page. Election Graphs tracks a poll-based estimate of the Electoral College. The charts, graphs, and maps in the post above are all as of the time of this post. Click through on any image to go to a page with the current interactive versions of that chart, along with additional details.

Follow @ElectionGraphs on Twitter or Election Graphs on Facebook to see announcements of updates. For those interested in individual poll updates, follow @ElecCollPolls on Twitter for all the polls as I add them. If you find the information in these posts informative or useful, please consider visiting the donation page.
Some Dems Up, Some Dems Down

Since last week's update, there have been two new polls in Texas, and one each in New Hampshire, Wisconsin, Michigan, and Pennsylvania.

For the six most polled Democrats against Trump (Biden, Sanders, Warren, Buttigieg, Harris, and O'Rourke) this week saw the following category changes:

  • Biden vs. Trump state category change: WI has moved from Strong Biden to Weak Biden
  • Sanders vs. Trump state category change: MI has moved from Strong Sanders to Weak Sanders
  • Warren vs. Trump state category change: PA has moved from Weak Warren to Weak Trump

Looking at how this impacted the national numbers:

In the "Expected Case" where every candidate wins every state they are ahead in, Pennsylvania moving from slightly Warren to slightly Trump means that Warren now only has a 12 electoral vote margin in this scenario.

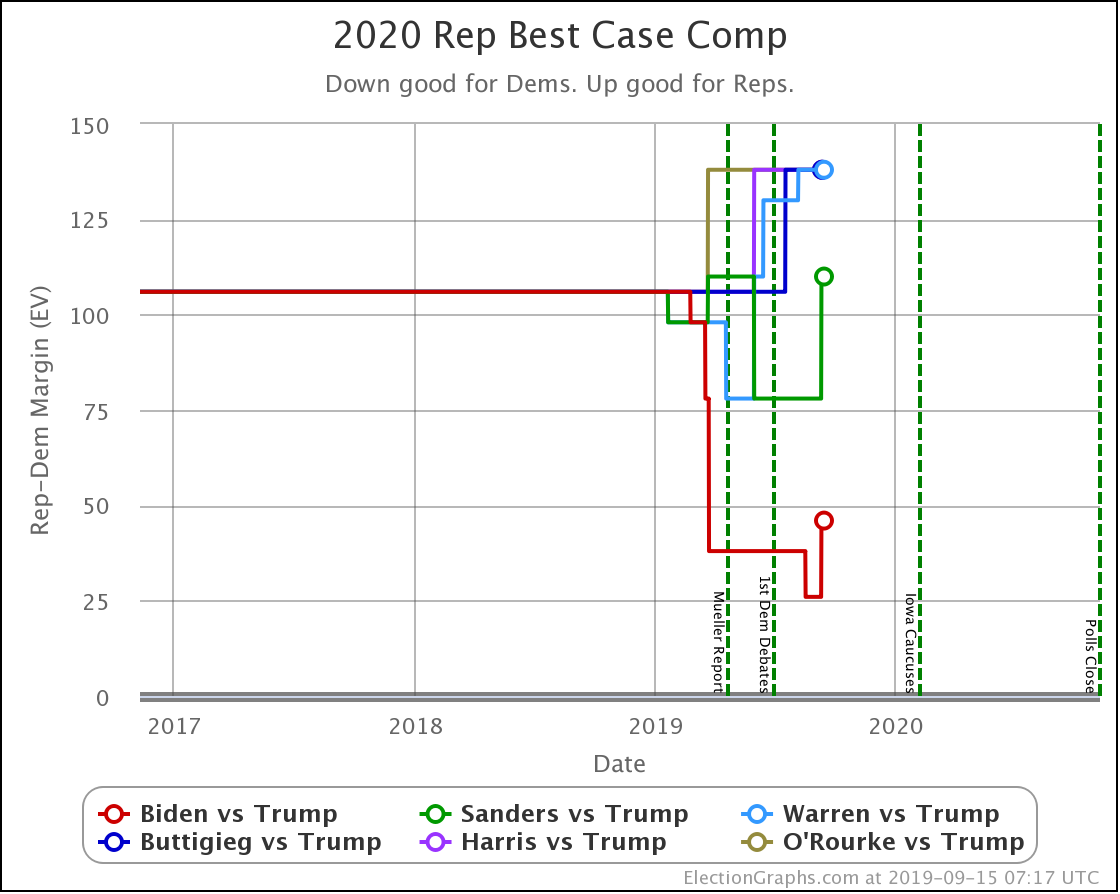
Biden's lead dropping below 5% in Wisconsin, and Sander's lead dropping below 5% in Michigan meanwhile, improves Trump's "Best Case" (where he wins not only all of the states where he is ahead but also all the ones where he is behind by less than 5%) against both candidates.

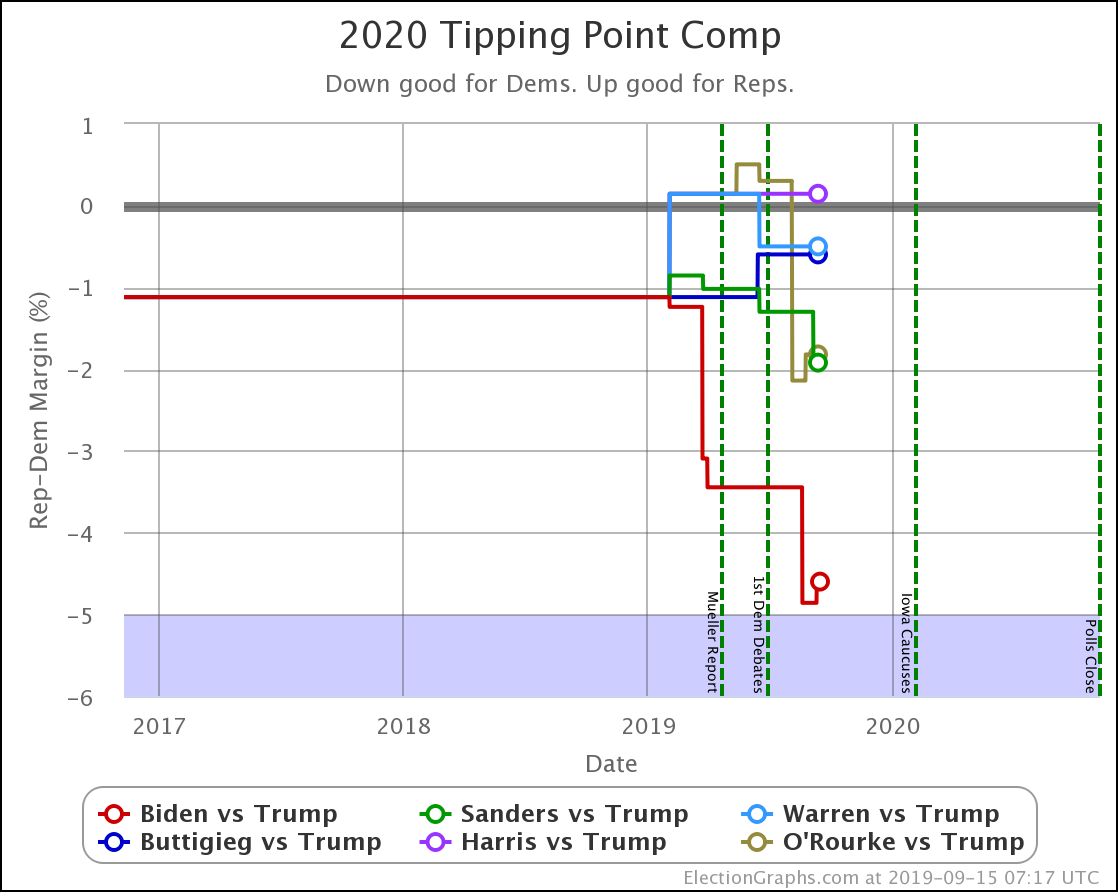
As these five states moved around, several tipping points moved as well.

  • Sanders vs. Trump tipping point change: Sanders by 1.3% in FL -> Sanders by 1.9% in TX
  • O'Rourke vs. Trump tipping point change: O'Rourke by 2.1% in TX -> O'Rourke by 1.8% in TX
  • Biden vs. Trump tipping point change: Biden by 4.9% in VA -> Biden by 4.6% in WI

The tipping point changes already make it clear that this was a mixed week. Some Democrats improved their positions against Trump; some moved in the opposite direction. This mix in the situation exists despite all of the actual category changes being in Trump's direction.

The movement within categories that starts to be shown by the tipping point is something we can see even better if we switch to the probabilistic simulation view:

Dem 8 Sep 15 Sep 𝚫
Biden 99.9% 99.8% -0.1%
Sanders 95.8% 96.9% +1.1%
O'Rourke 80.0% 80.8% +0.8%
Warren 71.1% 69.0% -2.1%
Buttigieg 67.1% 67.0% -0.1%
Harris 64.3% 65.7% +1.4%

There were a lot of mixed results in a lot of states this week. But when you balance it all out in terms of the odds of winning in the Electoral College:

  • Harris, Sanders, and O'Rourke strengthened against Trump
  • Warren, Biden, and Buttigieg weakened against Trump

Another way of looking at this is the median margins in the Monte Carlo simulations for each of the candidate combinations:

Unlike the categorization "Expected Case" view, where Harris narrowly loses to Trump, all six Democrats lead Trump in the probabilistic "Median Case."

Warren, Buttigieg, and Harris all lead by 30 or less electoral votes, though. In electoral vote terms, that is a very tight race. Any state with more than 15 electoral votes slipping to the other side of the centerline would switch the outcome.

O'Rourke, Sanders, and Biden, each, in turn, have more of a margin than the candidate before, so additional buffer. They can afford for more to go wrong before they lose.

Now, let's look at each of the five states that got polled this week.

Of the two polls in Texas, one matched other recent surveys and was mostly favorable to the Democrats. The other showed clear Republican leads.

The net impact of the two polls on the averages was that Biden, Sanders, Warren, and Harris continued improving in Texas, while Buttigieg and O'Rourke got a little weaker.

You do get one piece of oddness, though. I use the methodology I described in my Polling Error vs. Final Margin post to translate margins into odds of winning. When I use the straight-up unsmoothed numbers from the 2008 to 2016 elections, there are a few places where the relationship between the polling average and the win odds are not monotonic.

This behavior means that even though O'Rourke's polling average dropped from a 2.1% lead to a 1.8% lead, my computed "odds of winning Texas" for O'Rourke INCREASED from 66.4% to 68.2%.

Now, I could have smoothed the handful of places where this non-monotonic behavior occurs out of existence. But I chose when I first set up the odds based view to use the numbers that came straight out of my analysis of the previous election results without any further manipulation.

Given the historical data and the methodology I used, a 1.8% Democratic lead is indeed slightly more likely to win than a 2.1% Democratic lead. Of course, this does seem a little crazy and is quite possibly just an example of overfitting.

But it isn't a huge difference and occurs at only a few specific margin zones, so I'll leave it be.

We still end up with a situation where three of the six Democrats are leading in Texas though, and another two make it close.

Texas continues to be one of the most important states to watch.

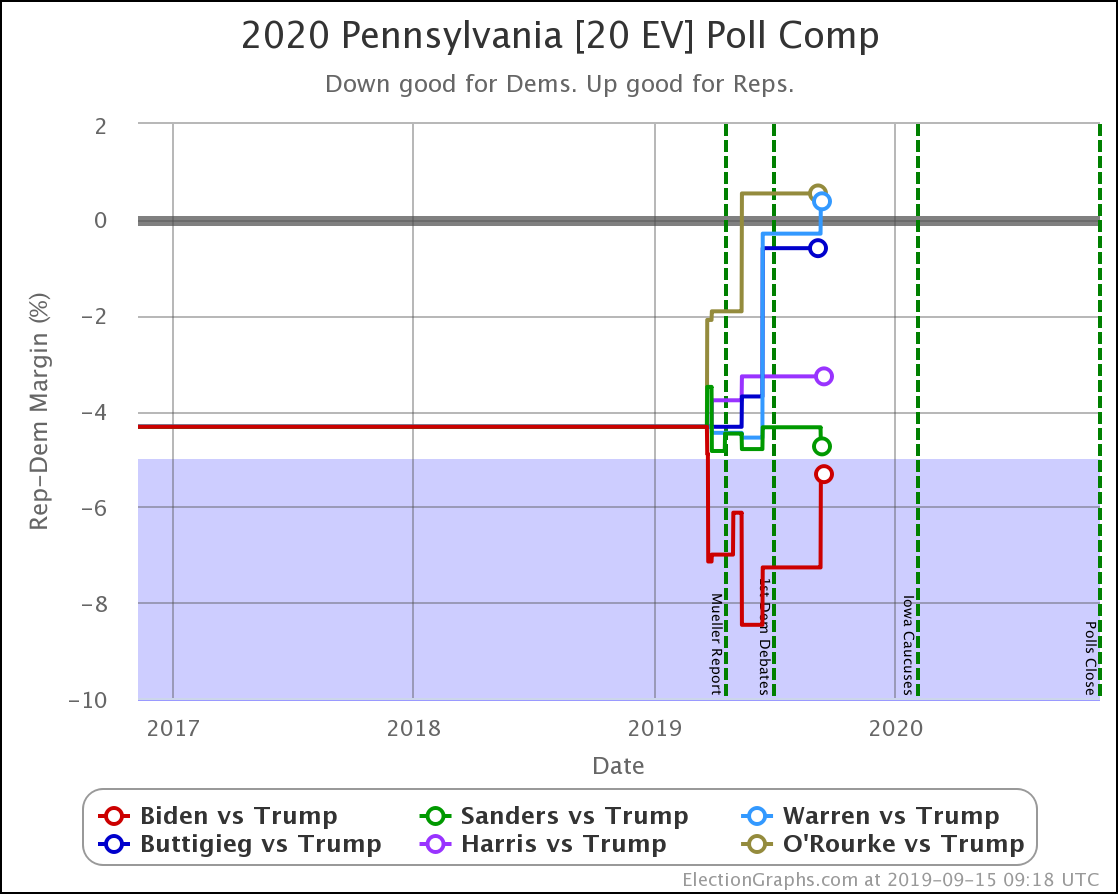
Sanders improved slightly in Pennsylvania.

Biden's lead deteriorated significantly.

Warren lost her lead to Trump.

The poll did not include the others.

Biden, Sanders, and Warren all weaken against Trump in Michigan with this week's update.

The poll did not include the others.

Warren got stronger in Wisconsin.

Biden and Sanders got weaker.

The poll did not include the others.

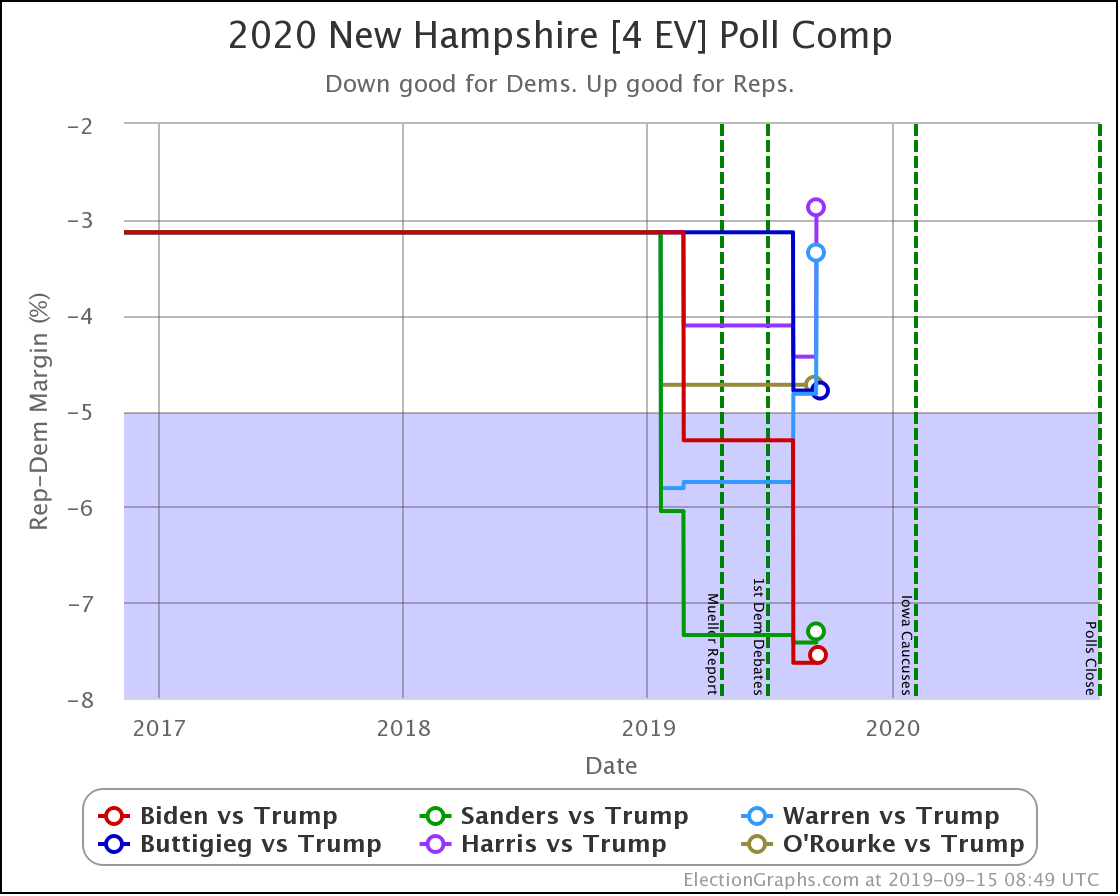
Biden, Sanders, Warren, and Harris all got weaker in New Hampshire with the latest polling.

The poll did not include Buttigieg or O'Rourke.

And that's it for this week's update.

415.6 days until polls start to close.

For more information:

This post is an update based on the data on the Election Graphs Electoral College 2020 page. Election Graphs tracks a poll-based estimate of the Electoral College. The charts, graphs, and maps in the post above are all as of the time of this post. Click through on any image to go to a page with the current interactive versions of that chart, along with additional details.

Follow @ElectionGraphs on Twitter or Election Graphs on Facebook to see announcements of updates. For those interested in individual poll updates, follow @ElecCollPolls on Twitter for all the polls as I add them. If you find the information in these posts informative or useful, please consider visiting the donation page.
Most Democrats Weaken in Wisconsin

Since last week's update, there was only one new state-level general election poll. The addition this week was a Marquette poll of Wisconsin.

There were no category changes based on these results.

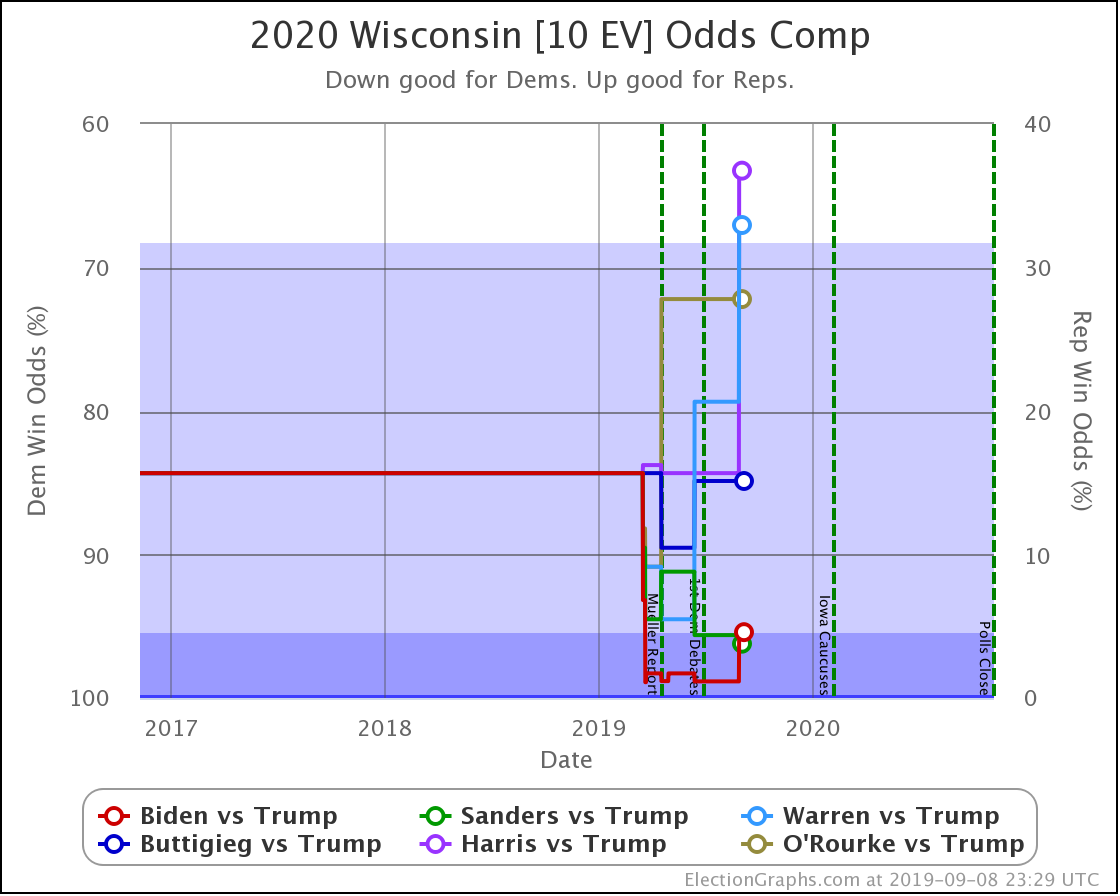
Biden and Sanders continue to have strong leads in Wisconsin (more than a 5% margin but less than a 10% margin).

Meanwhile, Warren, Buttigieg, Harris, and O'Rourke have weak leads (less than a 5% margin).

There has been some movement within the broader categories though, so let's take a look:

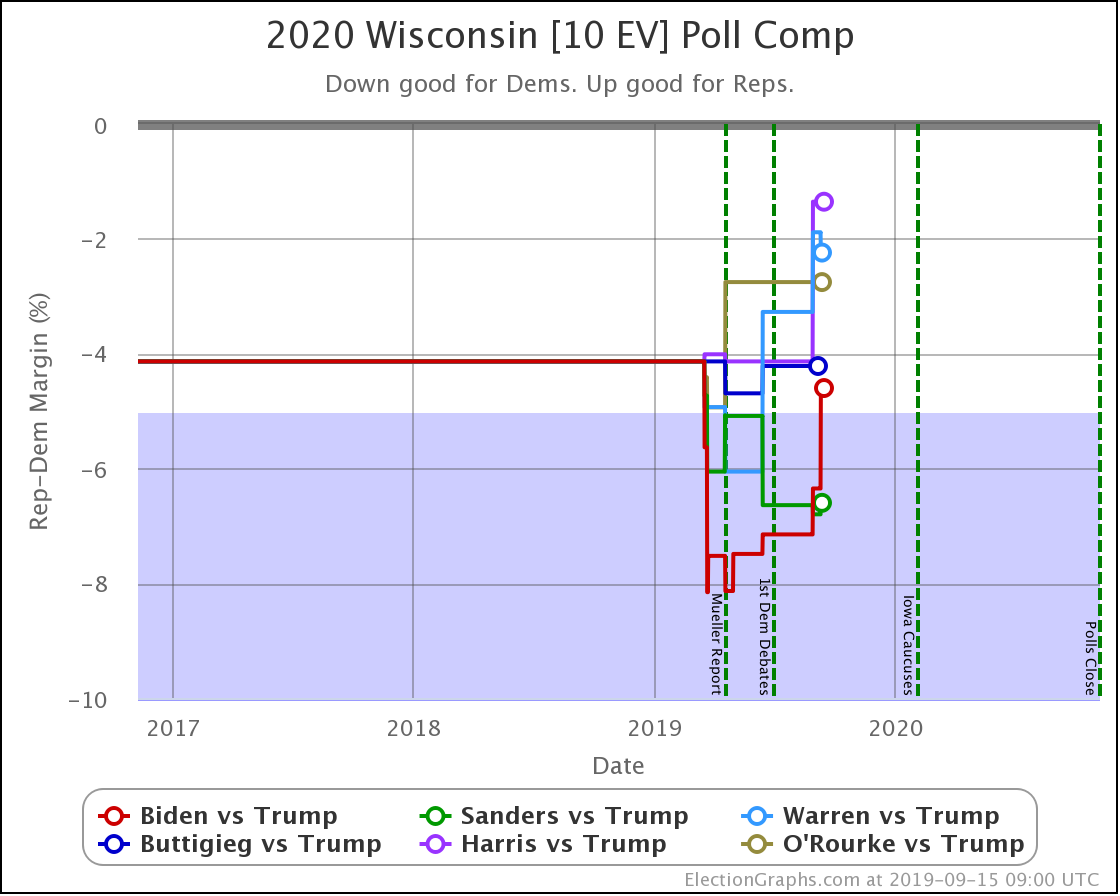
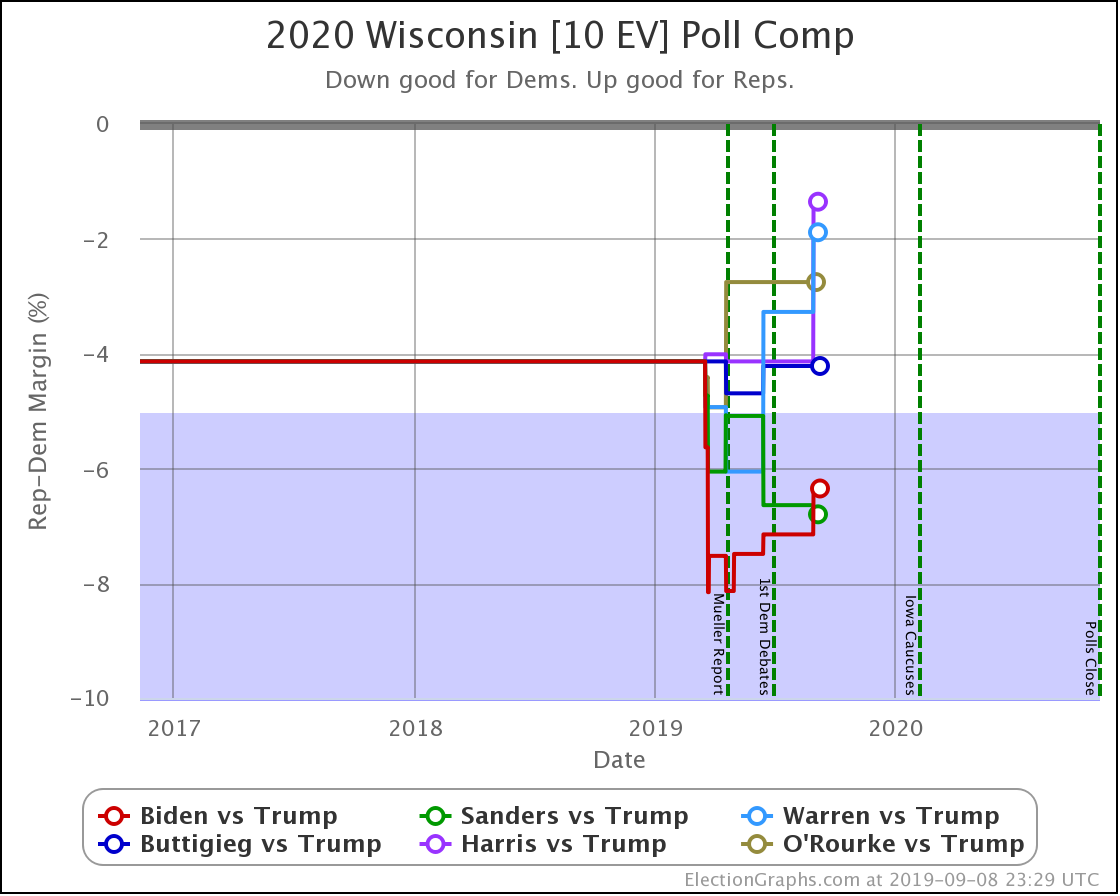
Marquette did not poll Buttigieg or O'Rourke, so their averages do not change.

Of the rest, only Sanders improved their Election Graphs average in Wisconsin, going from a 6.6% lead to a 6.8% lead.

Everybody else weakens.

Biden drops from a 7.2% lead to 6.4%.

Warren goes from a 3.3% lead to only 1.9%.

Harris goes from a 4.1% lead to just 1.4%.

In terms of winning odds, while every Democrat here is favored to win, we have a vast range.

Sanders is now best off with a 96.2% chance of winning Wisconsin.

Harris is weakest, with only a 62.3% chance of winning the state.

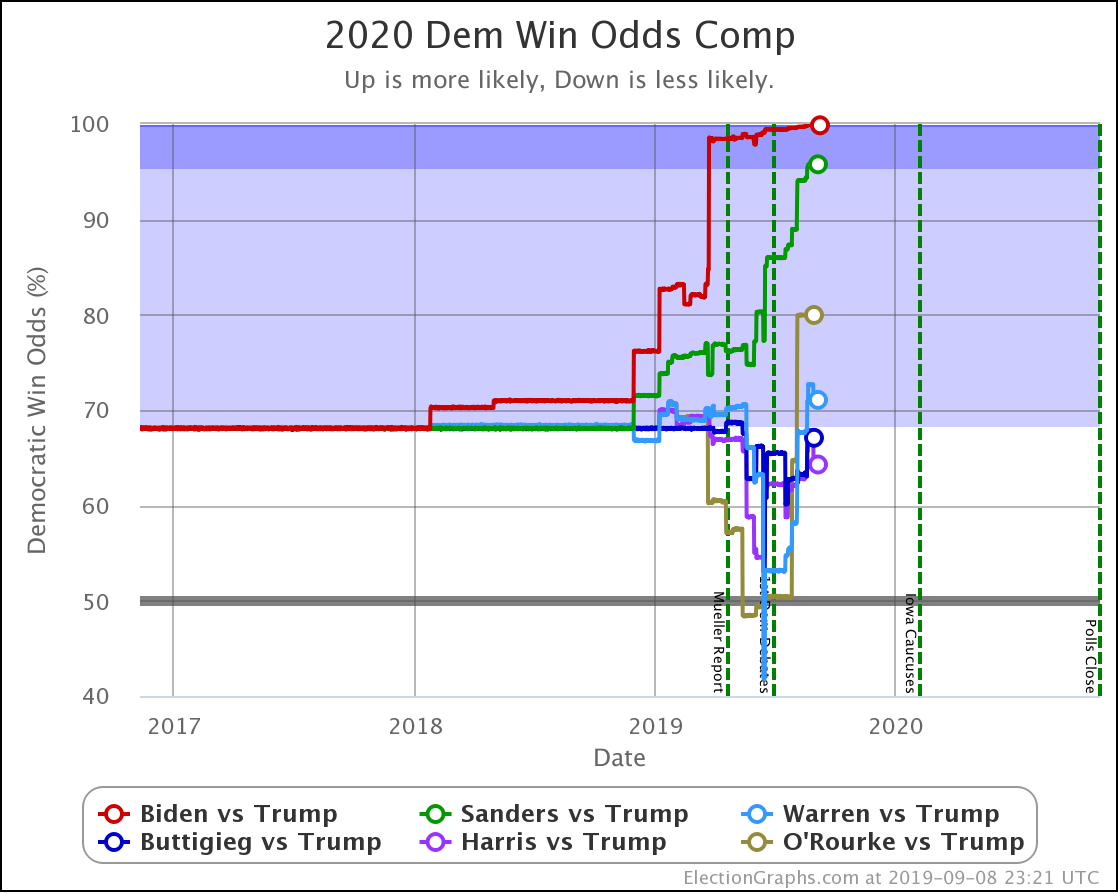
So, how does this change the national picture?

Dem 1 Sep 8 Sep 𝚫
Biden 99.9% 99.9% Flat
Sanders 95.7% 95.8% +0.1%
O'Rourke 80.0% 80.0% Flat
Warren 72.6% 71.1% -1.5%
Buttigieg 67.1% 67.1% Flat
Harris 67.9% 64.3% -3.6%

Even though Biden weakened a bit in Wisconsin, his overall position is strong enough that things look flat when rounding to the nearest 0.1%. But if you must know an additional digit after the decimal point, his national win chance in the Election Graphs simulation moves from about 99.89% to approximately 99.86%. But we don't deserve that additional digit. That is false precision. So it is flat.

Sanders, of course, has a small gain, while Warren and Harris both drop.

Harris is hurt the most by this week's polling and takes over from Buttigieg as the weakest of these six Democrats against Trump.

And that's it for this week.

422.0 days until polls start to close.

For more information:

This post is an update based on the data on the Election Graphs Electoral College 2020 page. Election Graphs tracks a poll-based estimate of the Electoral College. The charts, graphs, and maps in the post above are all as of the time of this post. Click through on any image to go to a page with the current interactive versions of that chart, along with additional details.

Follow @ElectionGraphs on Twitter or Election Graphs on Facebook to see announcements of updates. For those interested in individual poll updates, follow @ElecCollPolls on Twitter for all the polls as I add them. If you find the information in these posts informative or useful, please consider visiting the donation page.
Missouri, Michigan, and Utah

Since last week's update, there has been new polling in Missouri, Michigan, and Utah.

The only category change coming out of this was that in a Harris vs. Trump race Missouri moves from Strong Trump (a 5% to 10% Trump lead) to Solid Trump (a greater than 10% Trump lead).

Looking more generally, the Democrats improve their leads in Michigan, Missouri looks redder than it did before, and Utah is still bright red but a little less so.

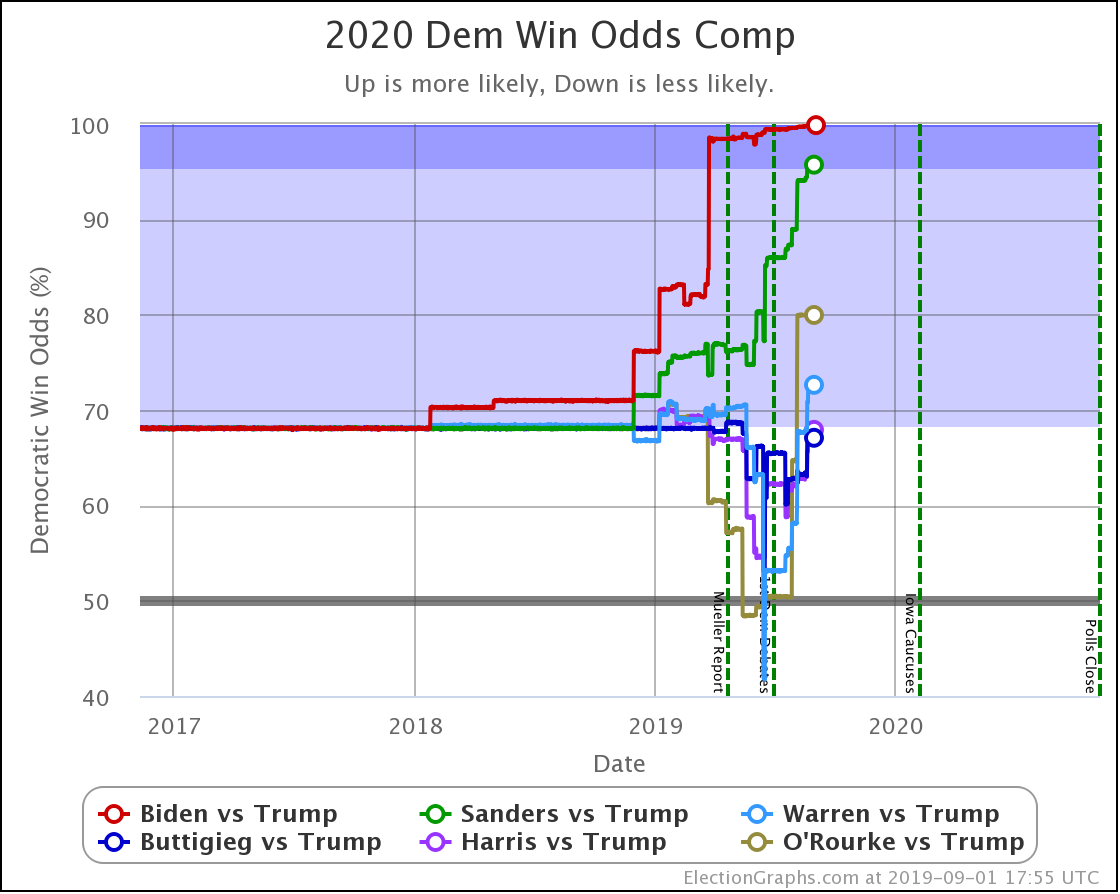
Looking at a national level, Harris, Warren, and Sanders improve their win probabilities against Trump in the probabilistic view. Everyone else is flat.

Dem 25 Aug 1 Sep 𝚫
Biden 99.9% 99.9% Flat
Sanders 95.5% 95.7% +0.2%
O'Rourke 80.0% 80.0% Flat
Warren 71.0% 72.6% +1.6%
Harris 65.8% 67.9% +2.1%
Buttigieg 67.1% 67.1% Flat

Now, let's look at the three states with new polls:

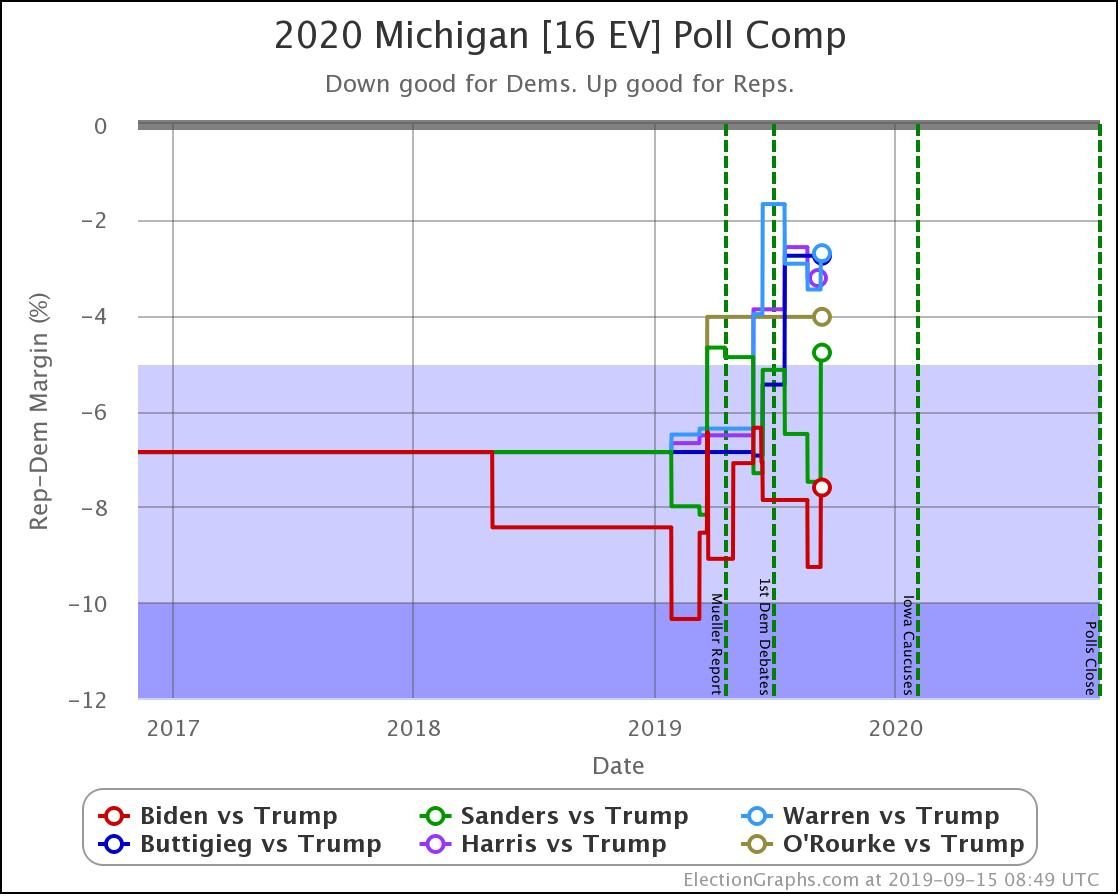
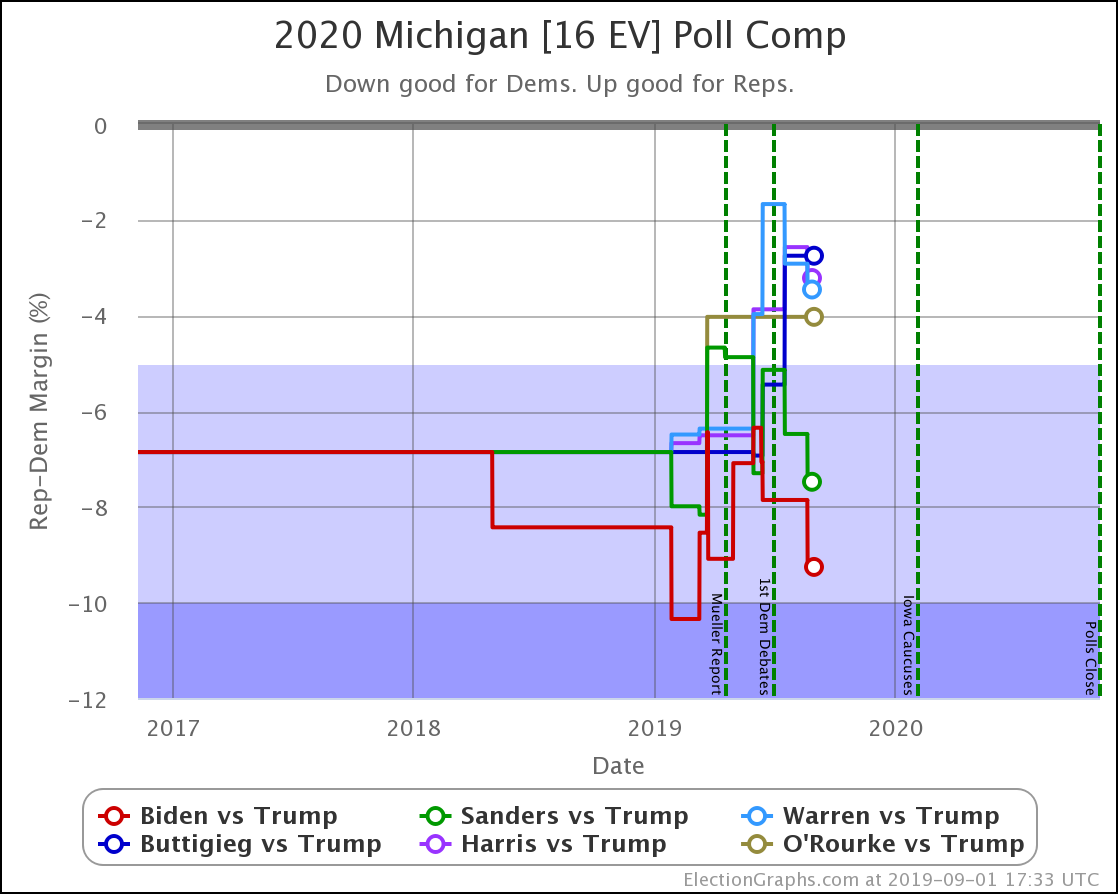
Biden and Sanders improve their polling averages noticeably with this new polling from EPIC-MRA. Warren and Harris also improve slightly. EPIC-MRA did not poll Buttigieg and O'Rourke.

Bottom line, Biden and Sanders continue to be in a position to easily win Michigan. The others are all leading, but narrowly, and the state would very much be in play.

This is the first 2020 polling for Missouri. RRG polled Biden, Sanders, O'Rourke, and Harris. It is actually an old poll from April, but it was new to Election Graphs this week.

In all four cases the averages moved in the Republican direction.

This first set of Missouri polling ranged from an 8% Trump win (against Biden) to a 16% Trump win (against Harris).  Only one poll so far, but it isn't looking like Missouri is one of those red states that is getting less red.

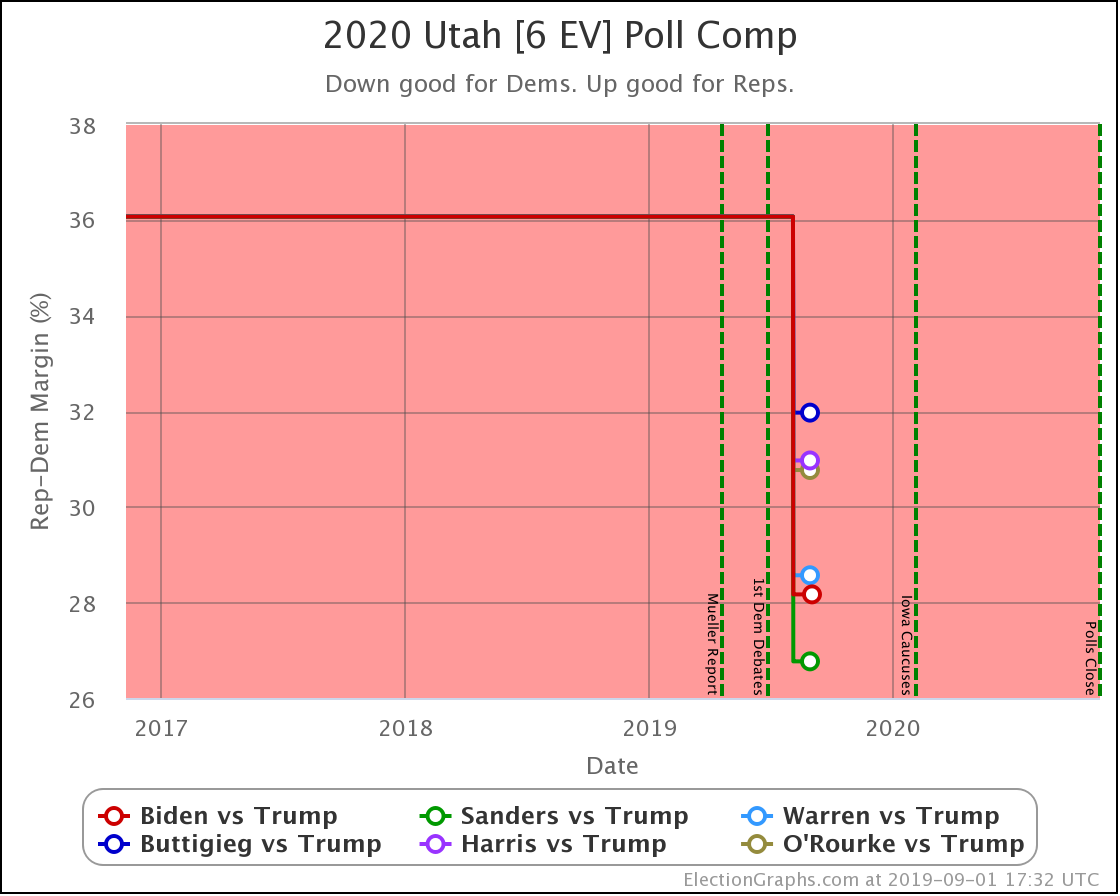
Utah, on the other hand, does look like a red state that might be getting a little less red. Maybe.

The first 2020 polling for Utah is from Y2 Analytics, and the sample sizes on their head-to-head matches are extraordinarily small (from 140 to 153), so you should take them with a massive pile of salt.

The average of the margins in Utah from 2000 to 2016 is a 36.1% Republican victory. Utah has not gone Democratic since Lyndon Johnson's 1964 landslide over Barry Goldwater. Utah is a VERY red state.

This new poll shows a range of results in our top six candidates from Sanders winning by 6%, to Buttigieg losing by 20%. Biden and Warren were within the margin of error of winning too.

Even that Buttigieg loss does better than the historical average. But Sanders WINNING? That is a very surprising result for Utah.

And, while he is not in the six most polled candidates against Trump, so we wouldn't usually mention it, Y2 also polled Booker against Trump, and had Booker beating Trump by 12%!

Frankly, these Utah results are tough to believe. It would take a lot more than one poll to make it reasonable to think that Utah was competitive for ANY of the Democratic candidates, let alone that one of them was leading by double digits.

Which is of course why you look at averages, not at individual polls. This Y2 poll when averaged in with the 2004 to 2016 elections, is enough for Election Graphs to put the poll average for the best of our six Democrats (Sanders) at a 26.8% Trump lead, which still translates into a 100% chance of Trump winning Utah.

(And for the record, Trump would lead Booker by 25.6%, also a 100% chance of Trump winning.)

If we get more Utah polls showing a close race, maybe this will change. But for the moment the weight of the historical averages means we treat this Y2 poll with extreme skepticism, and Utah remains a very very Red state.

And that's where things stand at the beginning of September.

429.2 days until polls start to close.

For more information:

This post is an update based on the data on the Election Graphs Electoral College 2020 page. Election Graphs tracks a poll-based estimate of the Electoral College. The charts, graphs, and maps in the post above are all as of the time of this post. Click through on any image to go to a page with the current interactive versions of that chart, along with additional details.

Follow @ElectionGraphs on Twitter or Election Graphs on Facebook to see announcements of updates. For those interested in individual poll updates, follow @ElecCollPolls on Twitter for all the polls as I add them. If you find the information in these posts informative or useful, please consider visiting the donation page.