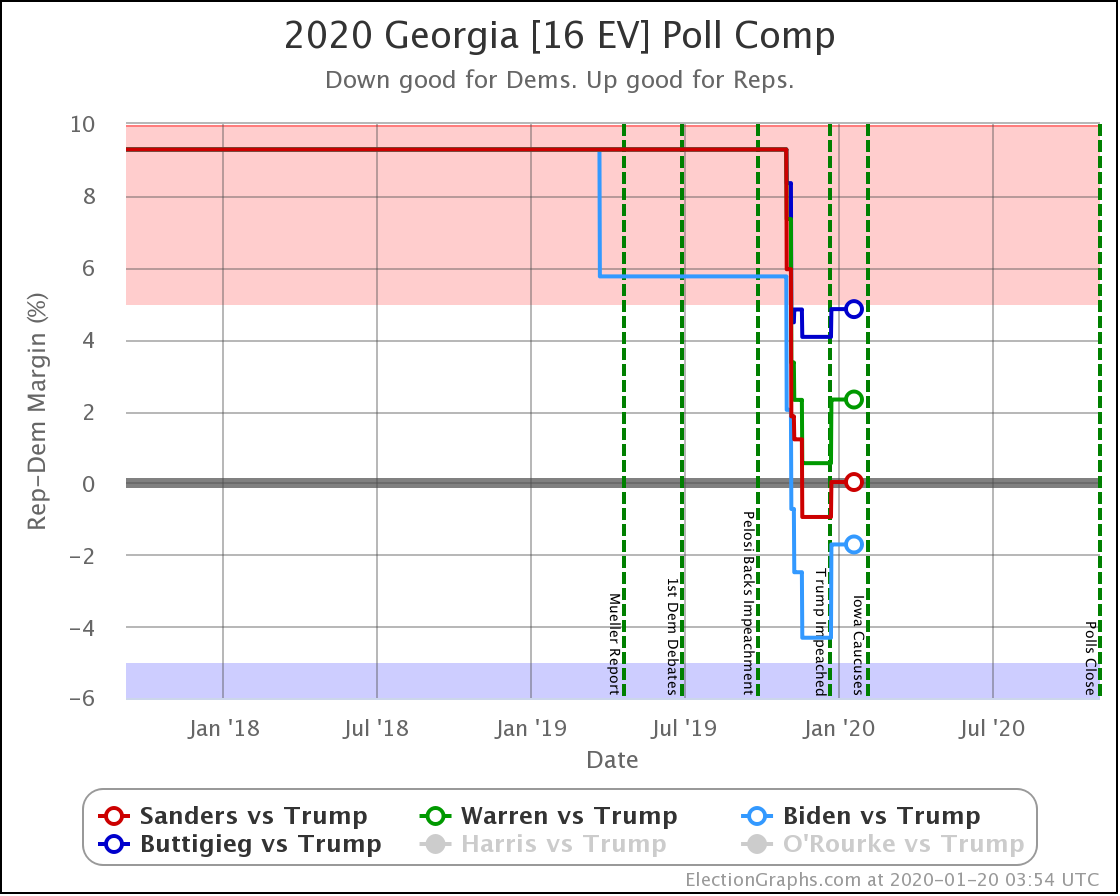
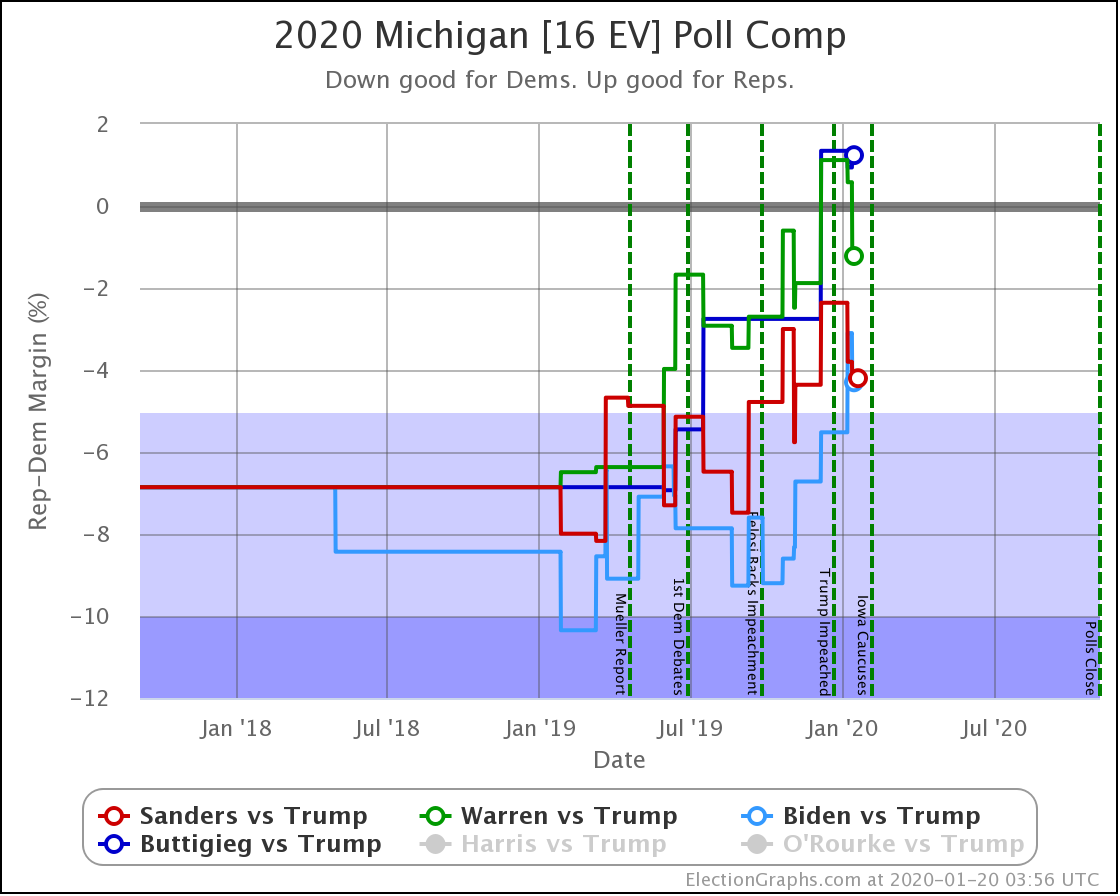
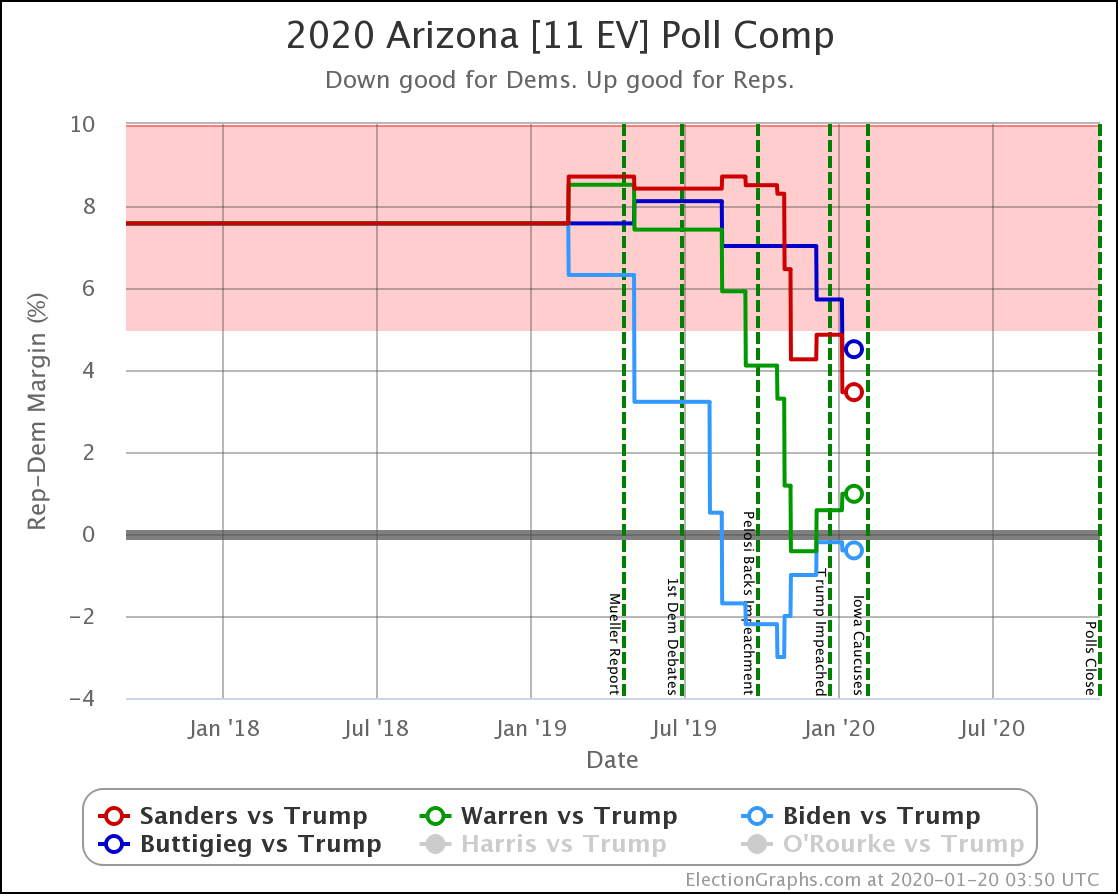
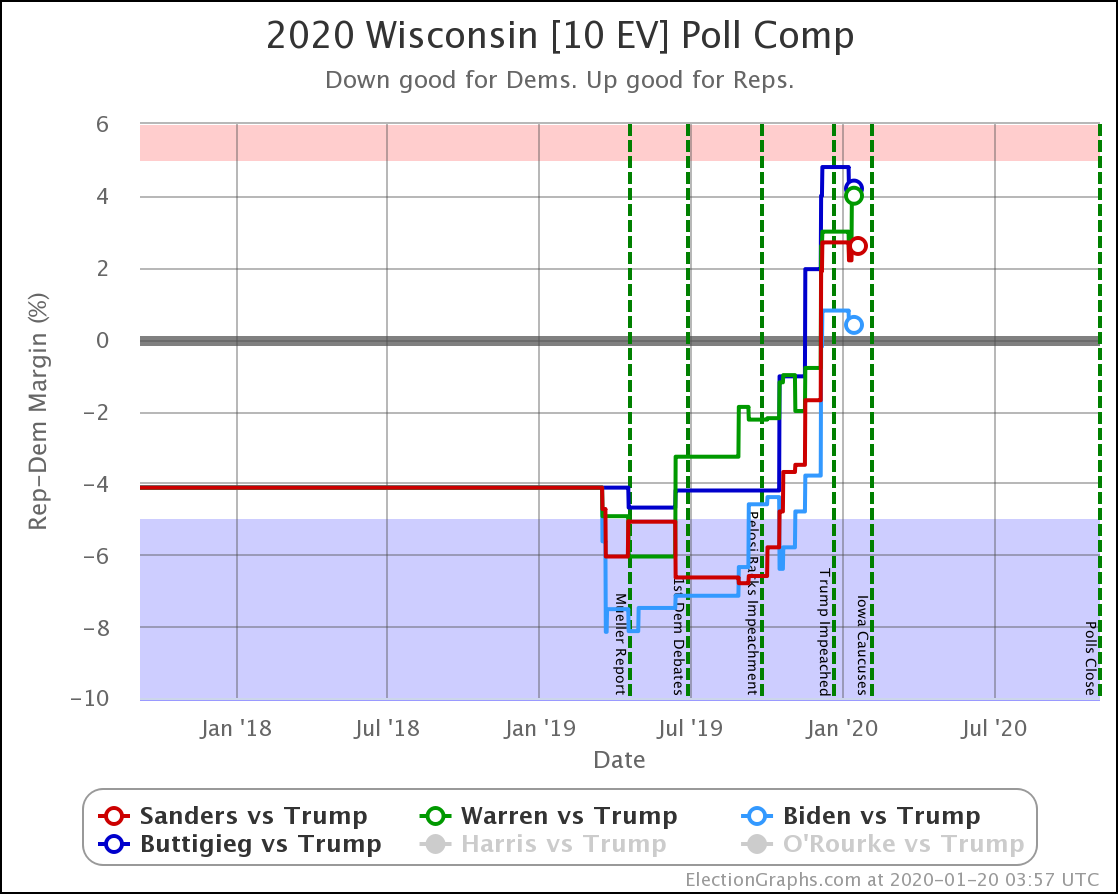
Since the last update on the general election on March 16th, there have been new polls in Arizona (x2), Ohio (x2), Florida (x3), Connecticut, Michigan (x5), Pennsylvania (x2), Wisconsin (x3), New York, California, and Georgia.
Most attention in the just over three weeks since that post has been on the coronavirus pandemic rather than electoral politics, so doing an update here sort of fell a bit on the to-do list. But since the back and forth with executive actions and court battles finished, and there actually is a primary in Wisconsin with in-person voting happening today, it is a good time for an update.
Before I start, some housekeeping. I am very tempted at this point to simply report on Biden vs. Trump. As discussed in the last update on the Democratic nomination, at this point, a Sanders comeback to win the nomination would require something catastrophic. Something of the magnitude of Biden having to drop out due to health reasons. There is no realistic path based only on Sanders doing an excellent job making his case. Biden would have to implode in some substantial way.
However, I've decided to continue to report here on the comparisons between Biden vs. Trump and Sanders vs. Trump as long as the following are all true:
- It is still mathematically possible for both of them to win the nomination
- Neither one has dropped out
- There is new polling with both candidates
So we'll keep looking at Sanders vs. Trump too, at least for the moment.
With all of that said, the last three weeks have not been kind to the Democrats, but they have been especially bad to Sanders.
It looks like a lot of close states moved toward Trump. This is potentially a "crisis bump" where folks rally around the leader during a traumatic national incident. The pandemic certainly qualifies as that sort of event.
In Sander's case, there may also simply be movement because, with his losses in the Democratic primary, he is not perceived as being as strong as he was before. And he was weaker to begin with.
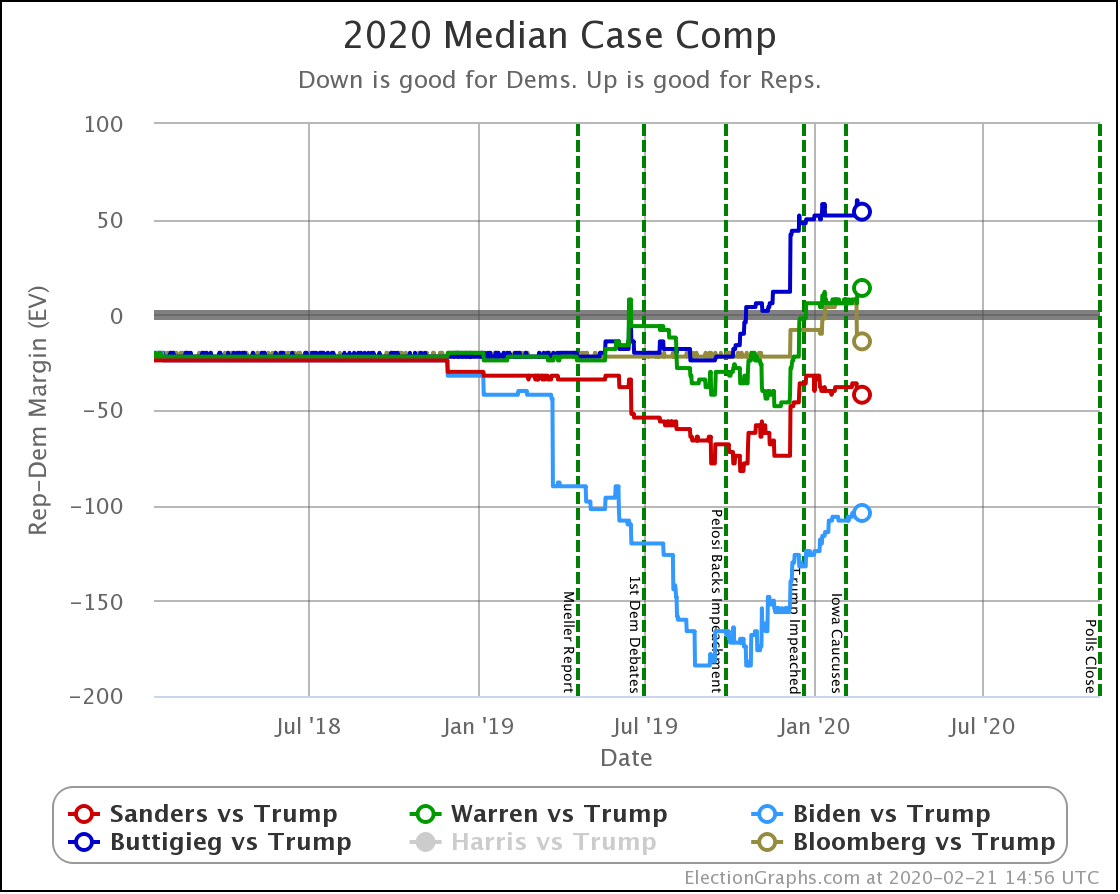
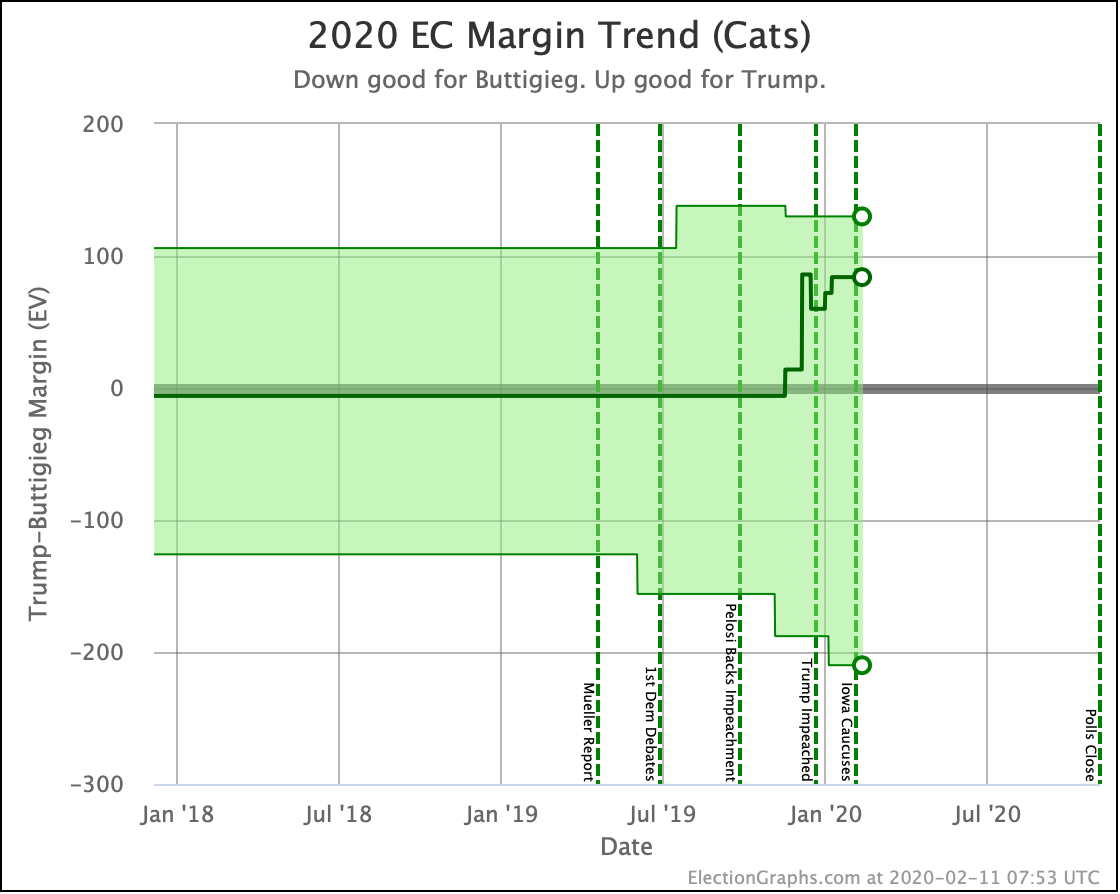
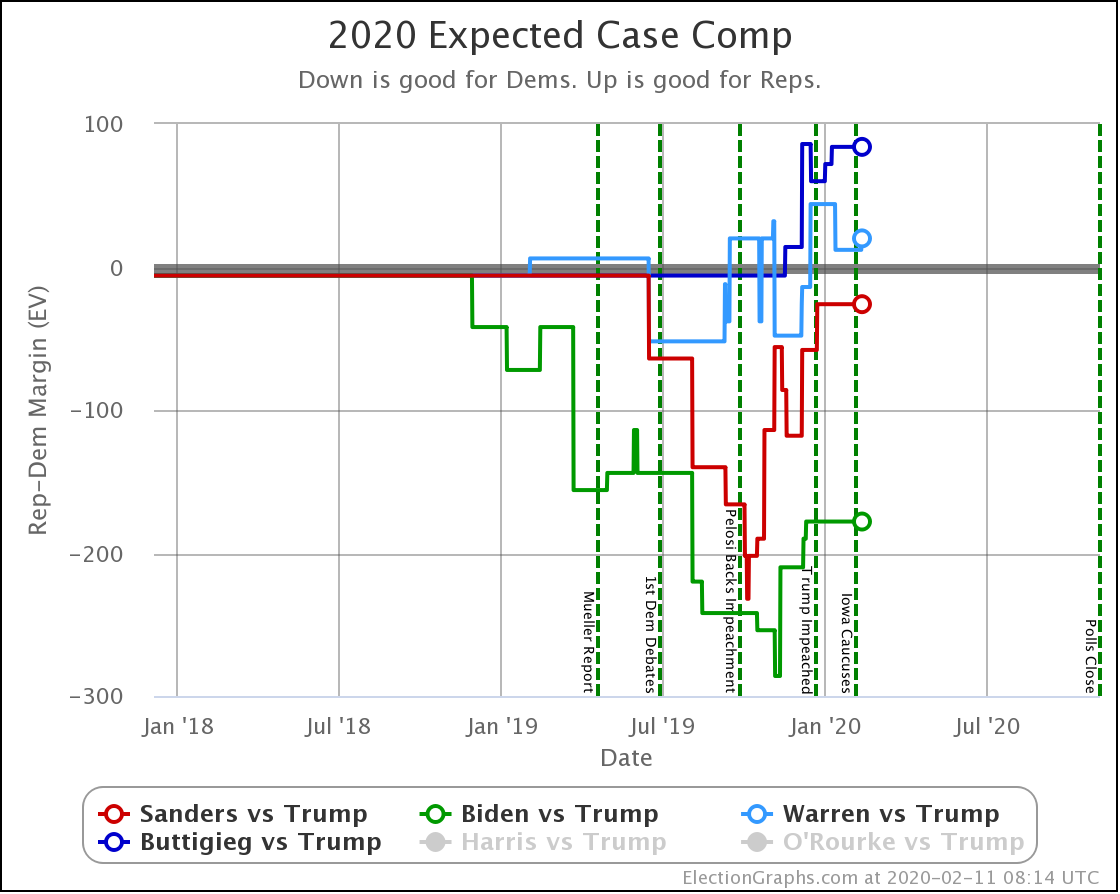
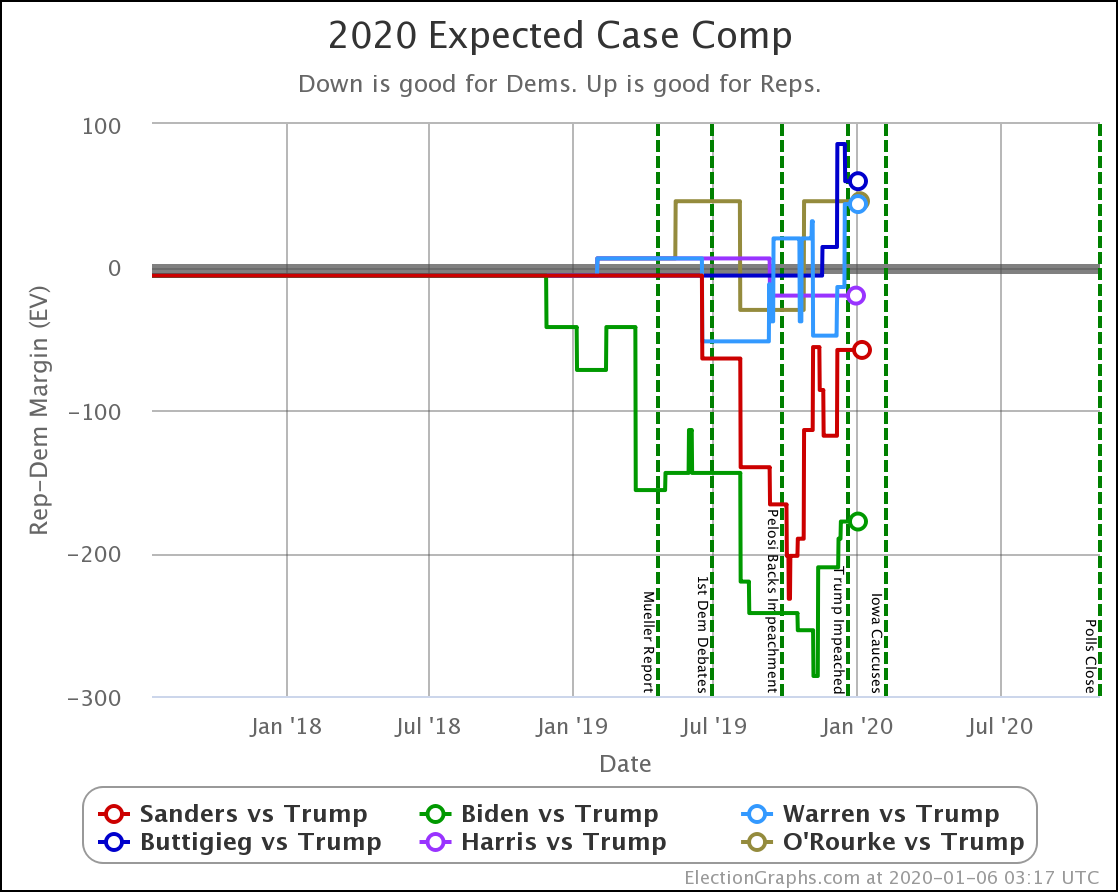
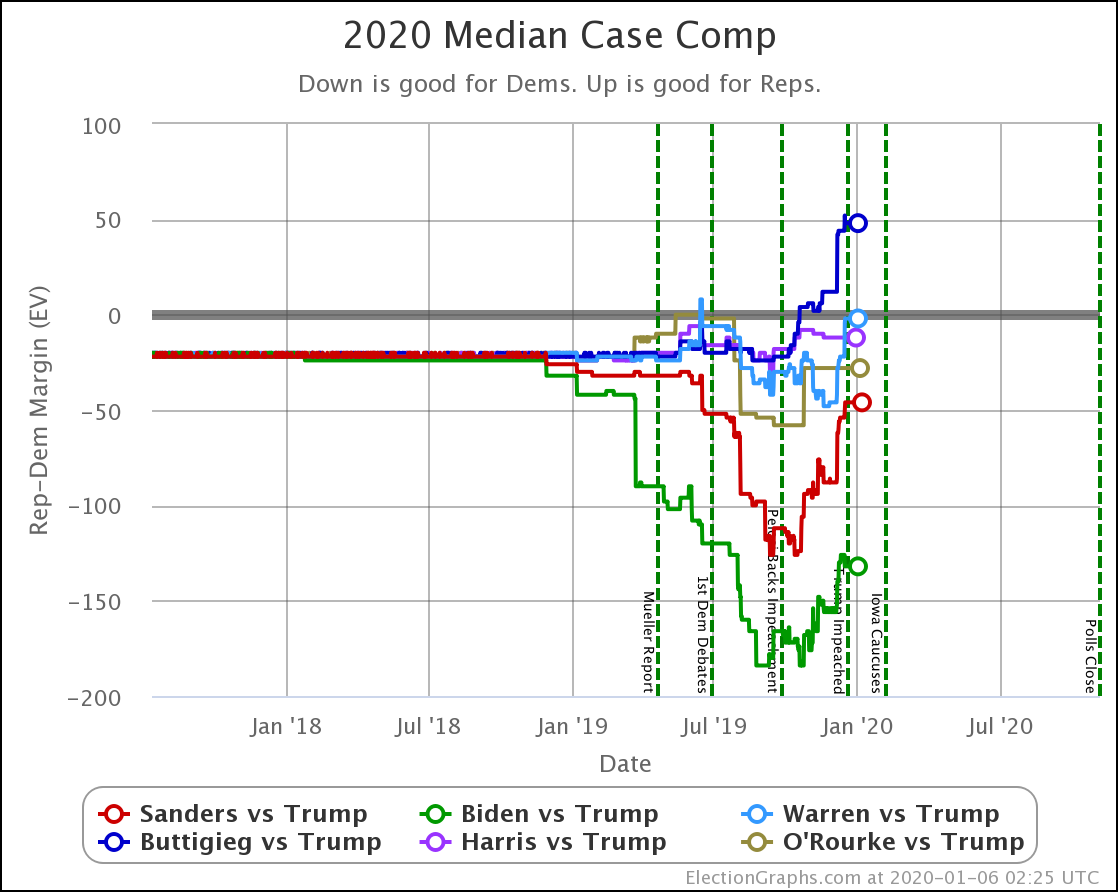
Let's take a look at our four main metrics and see how things look:
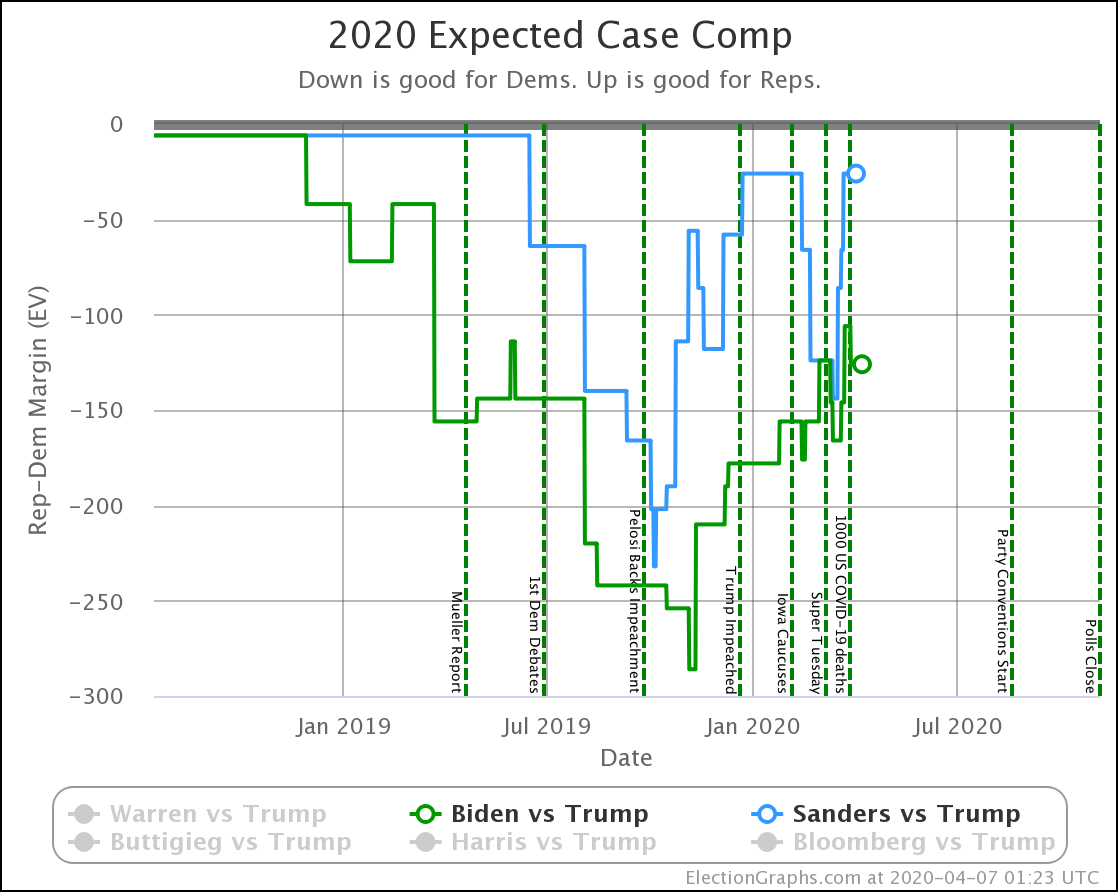
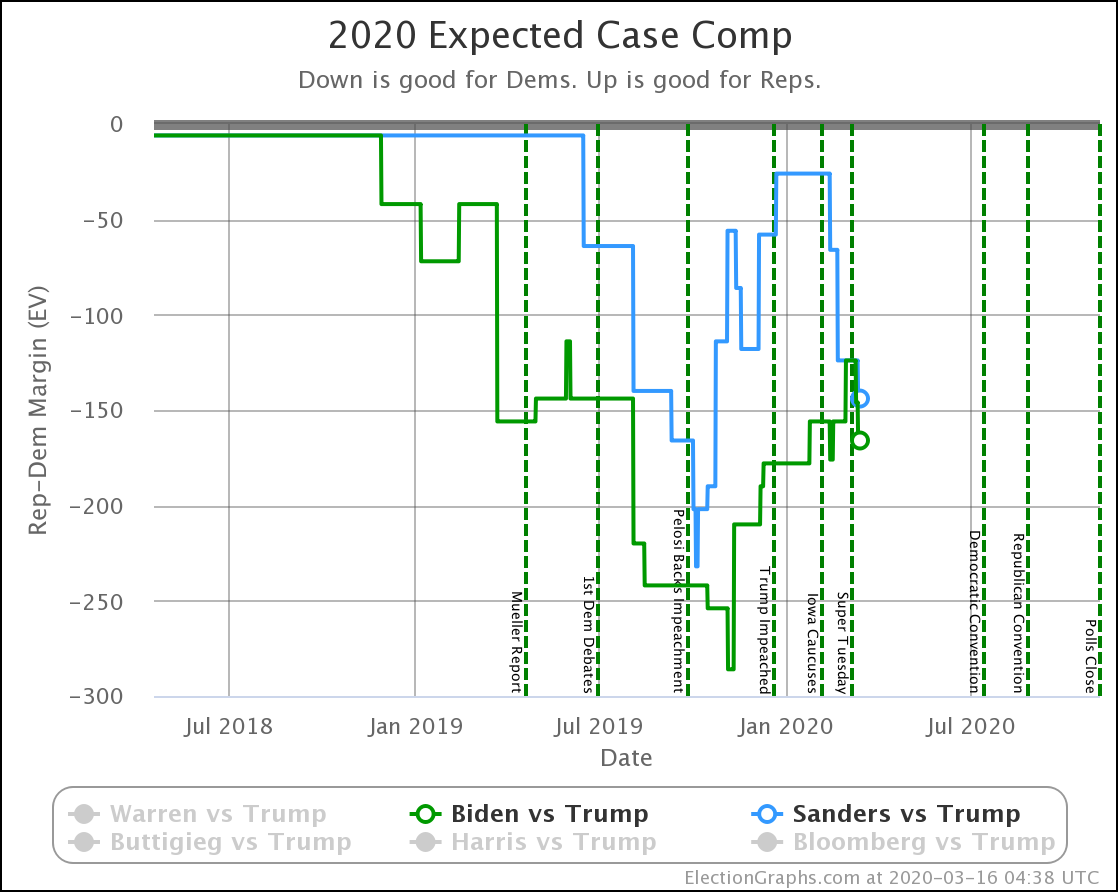
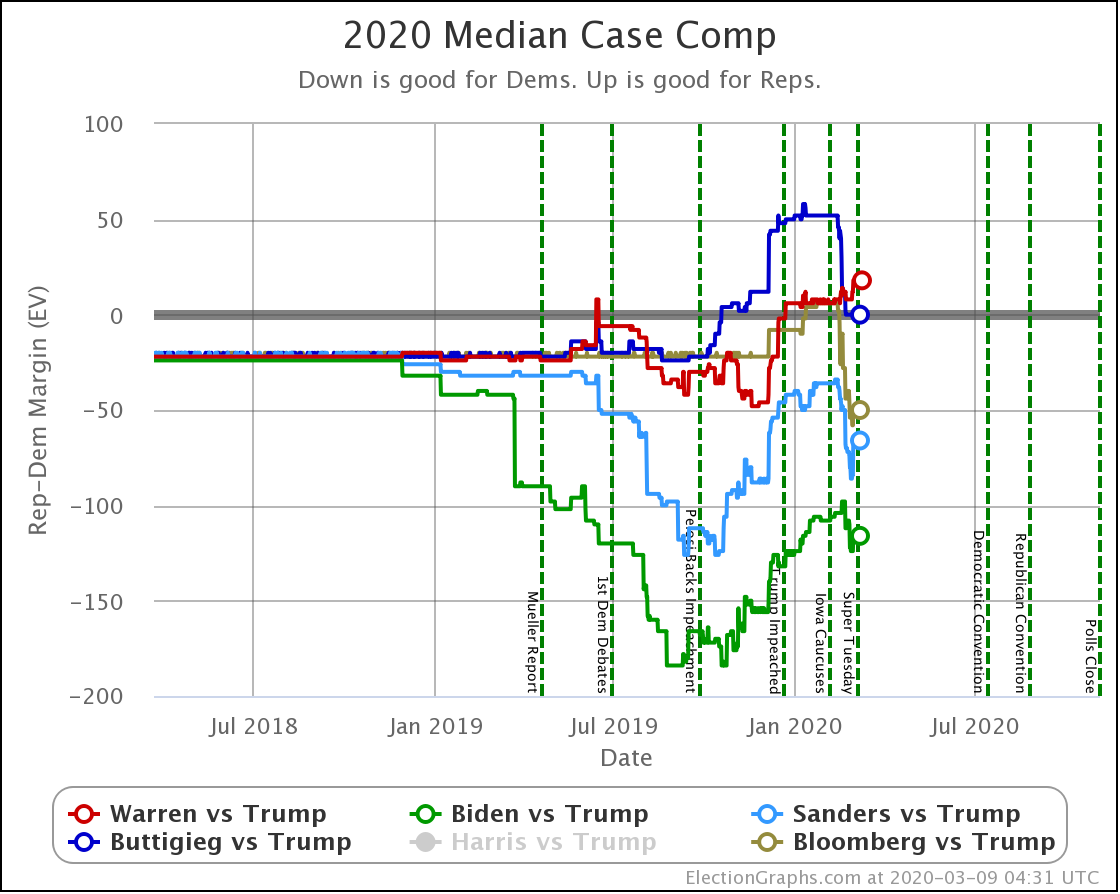
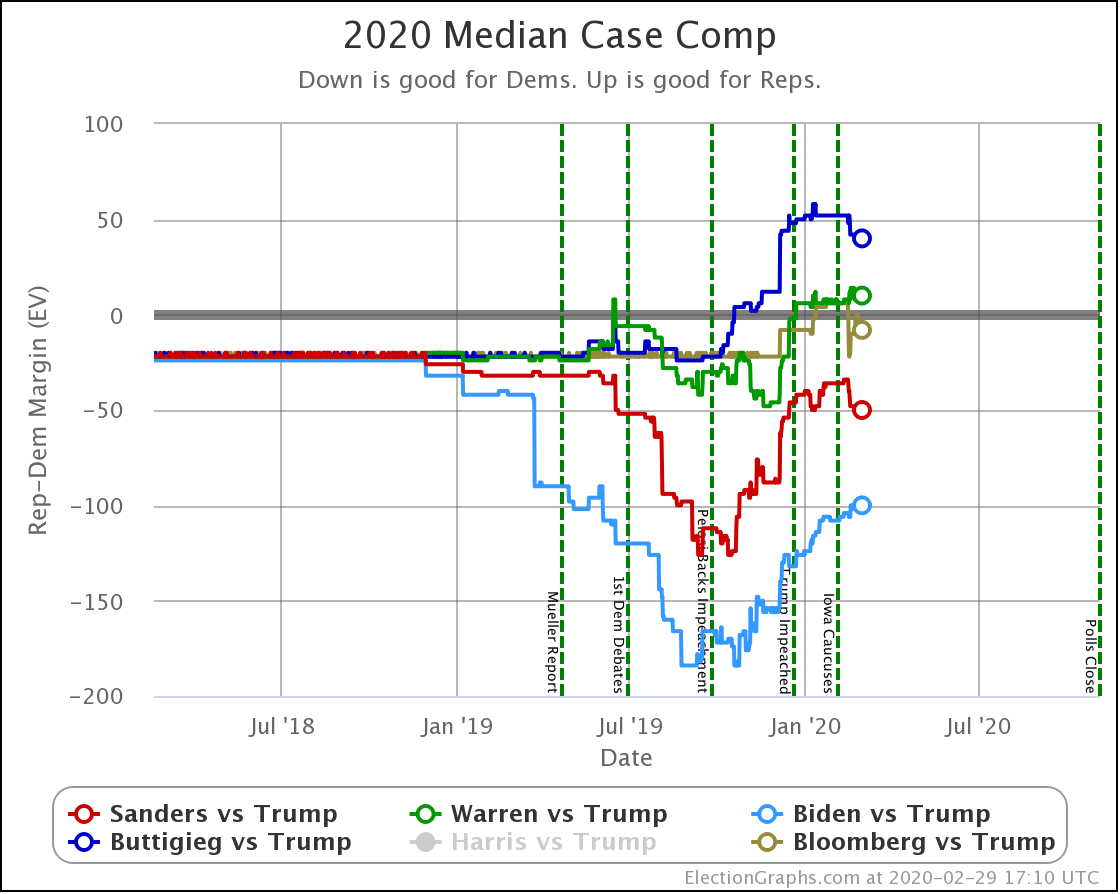
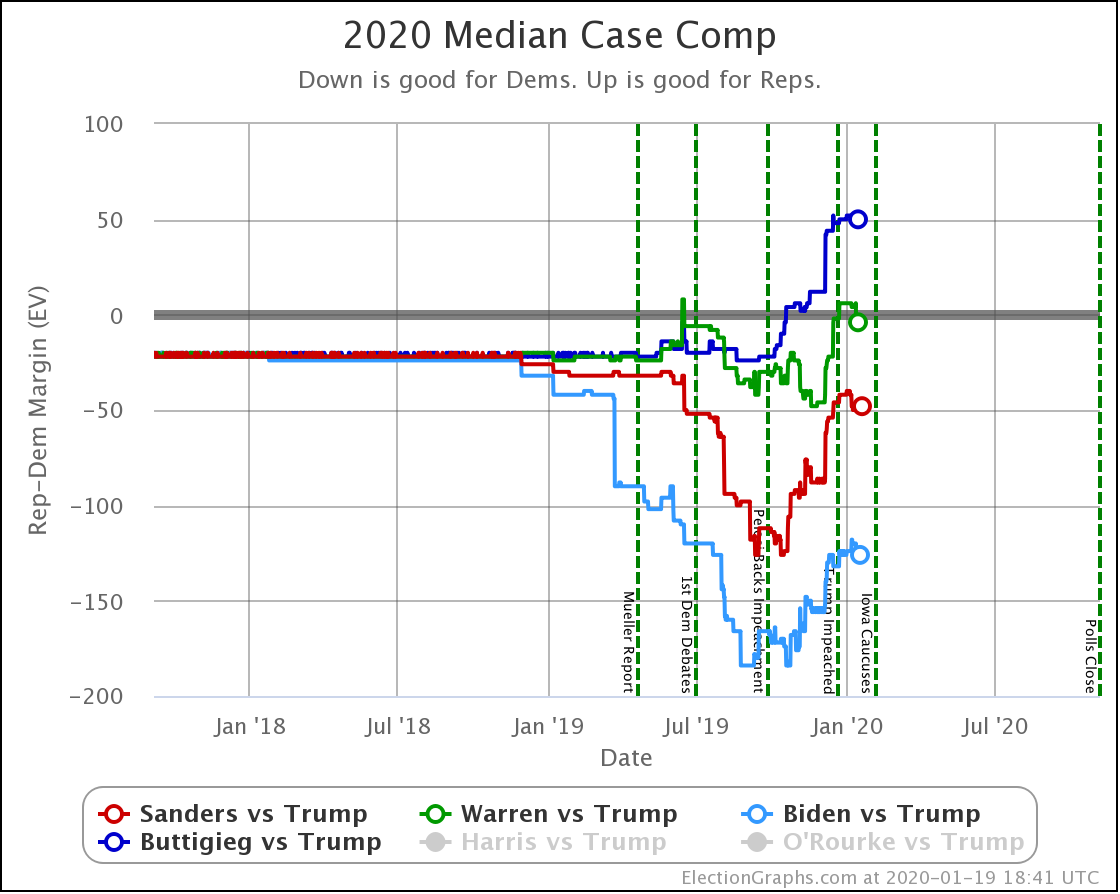
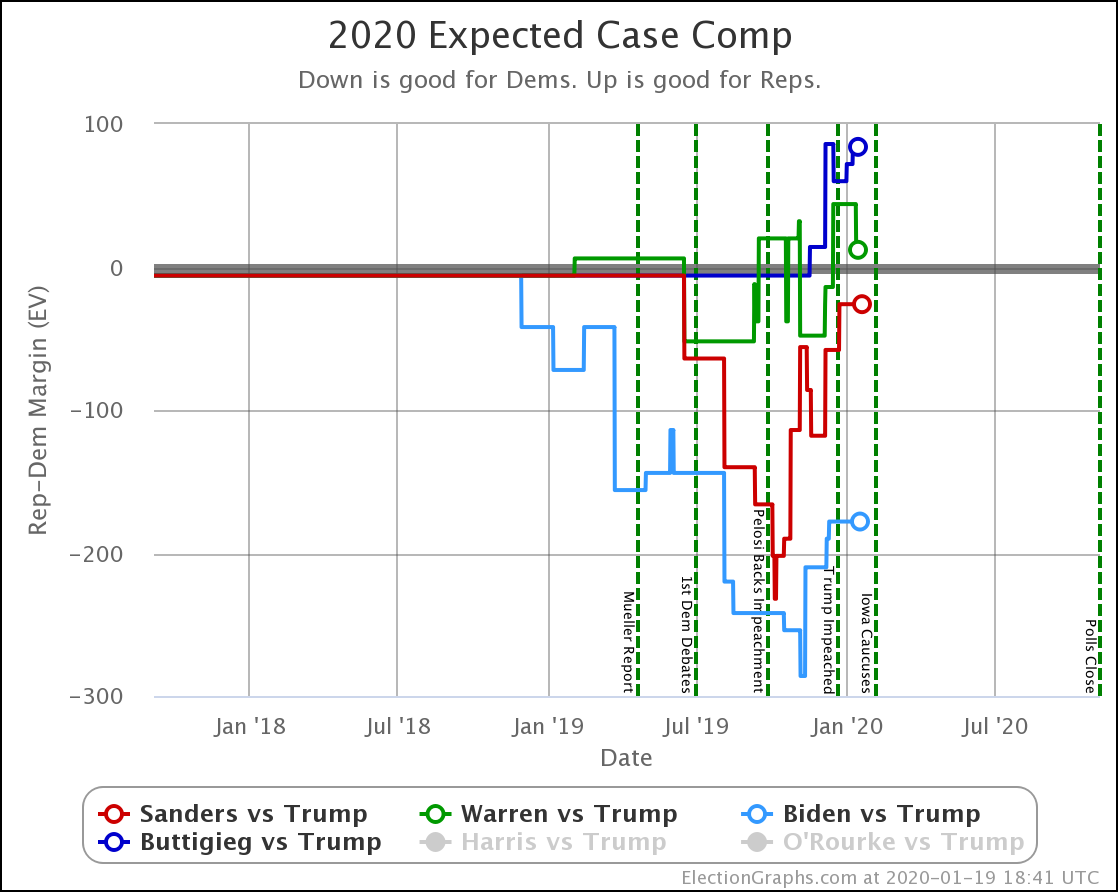
| Dem | 16 Mar | 7 Apr | 𝚫 |
| Biden | +166 | +126 | -40 |
| Sanders | +144 | +26 | -118 |
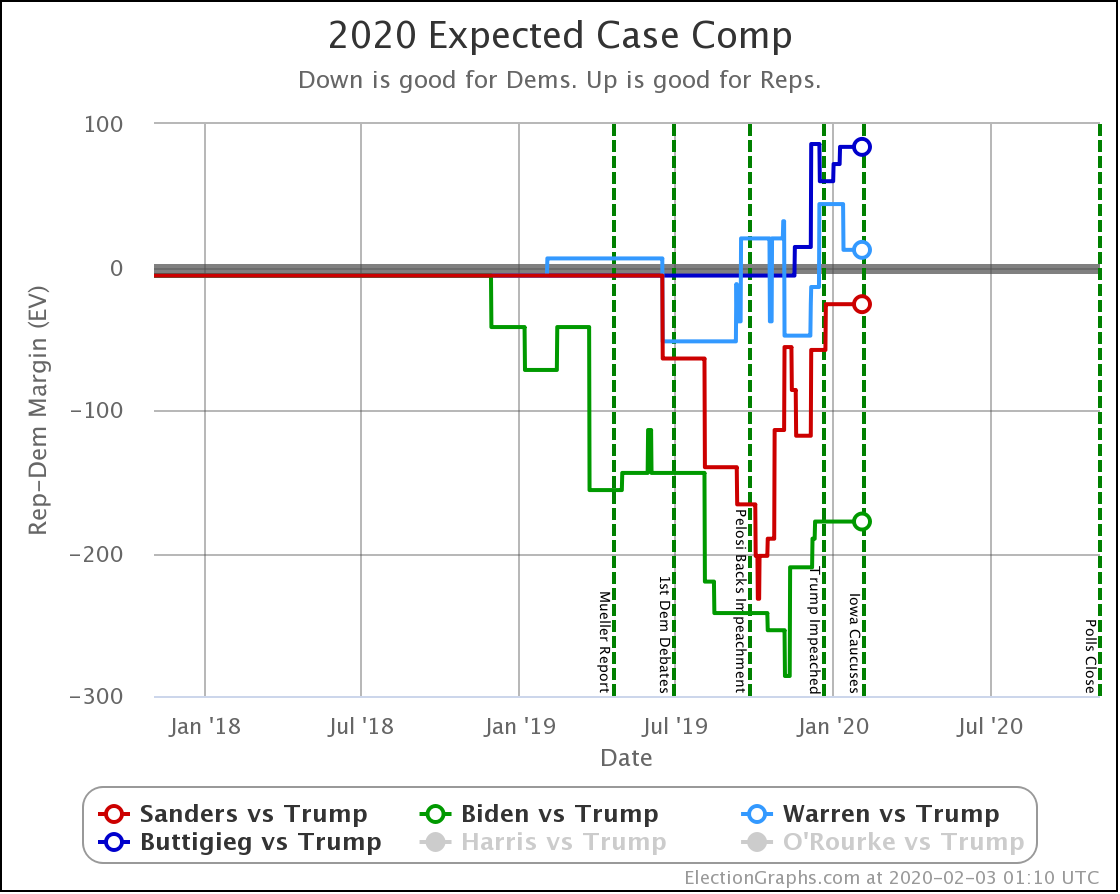
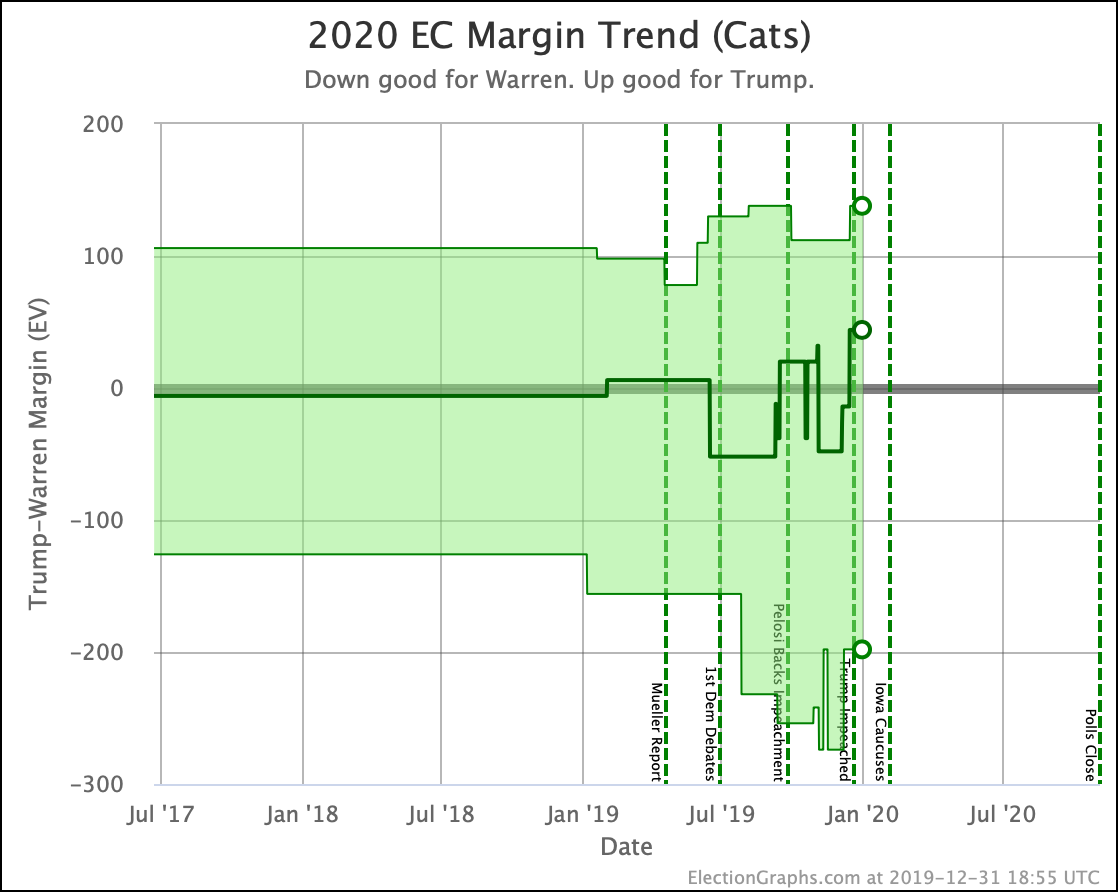
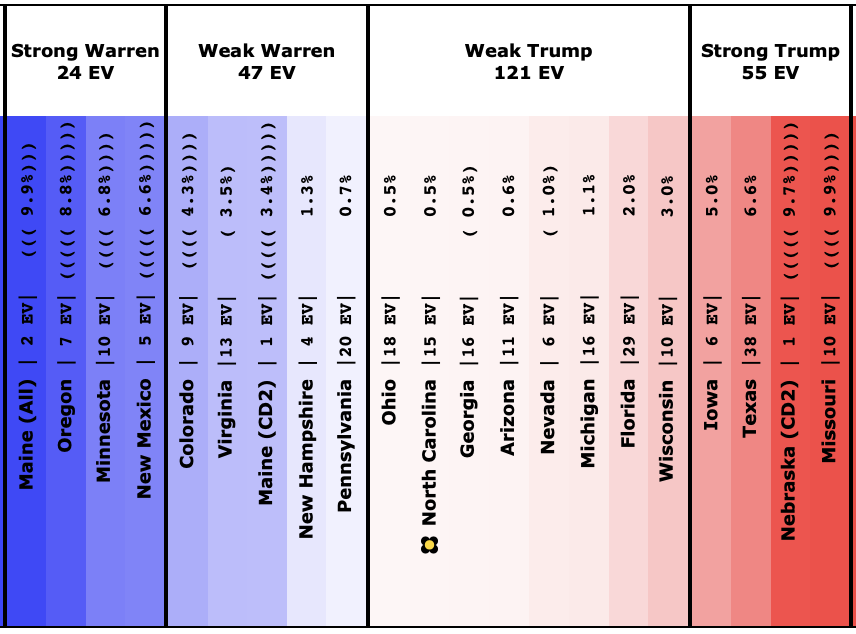
Starting with just the expected case, if everybody wins all the states where they lead in the Election Graphs average, we see that both Democrats have lost a lot of ground.
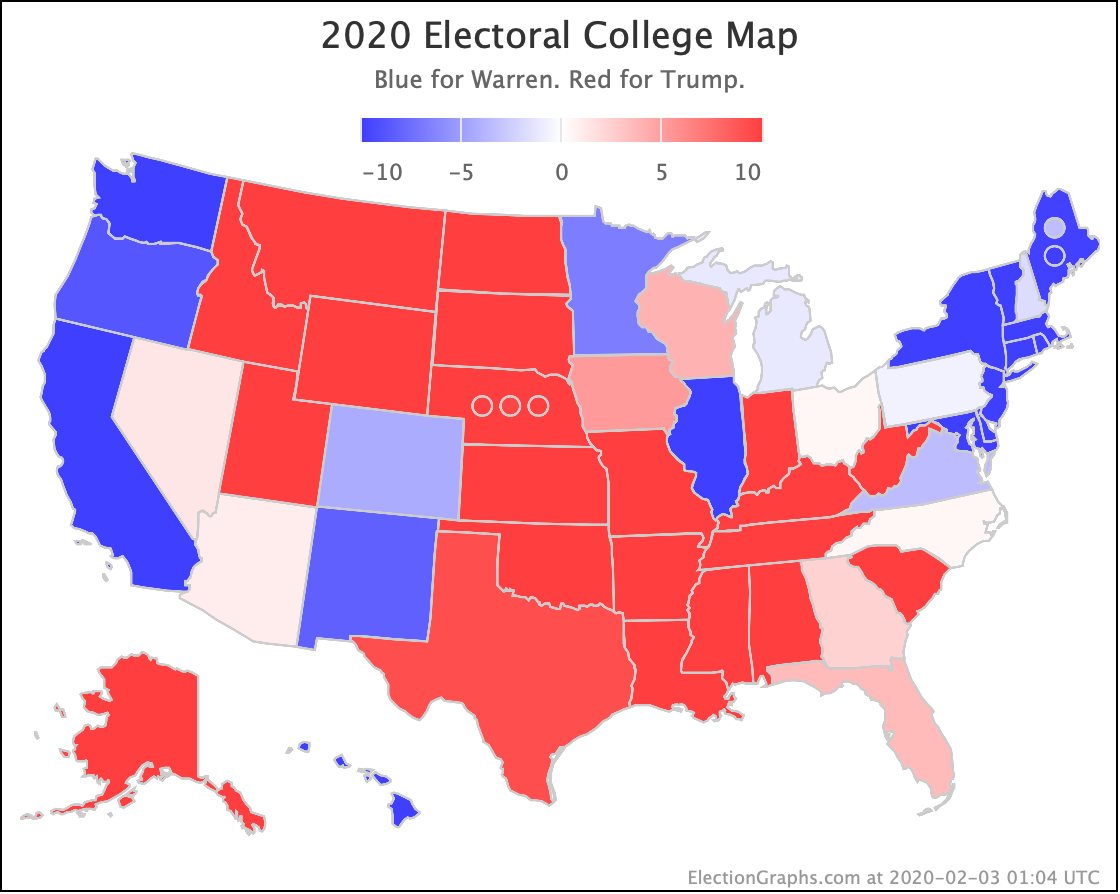
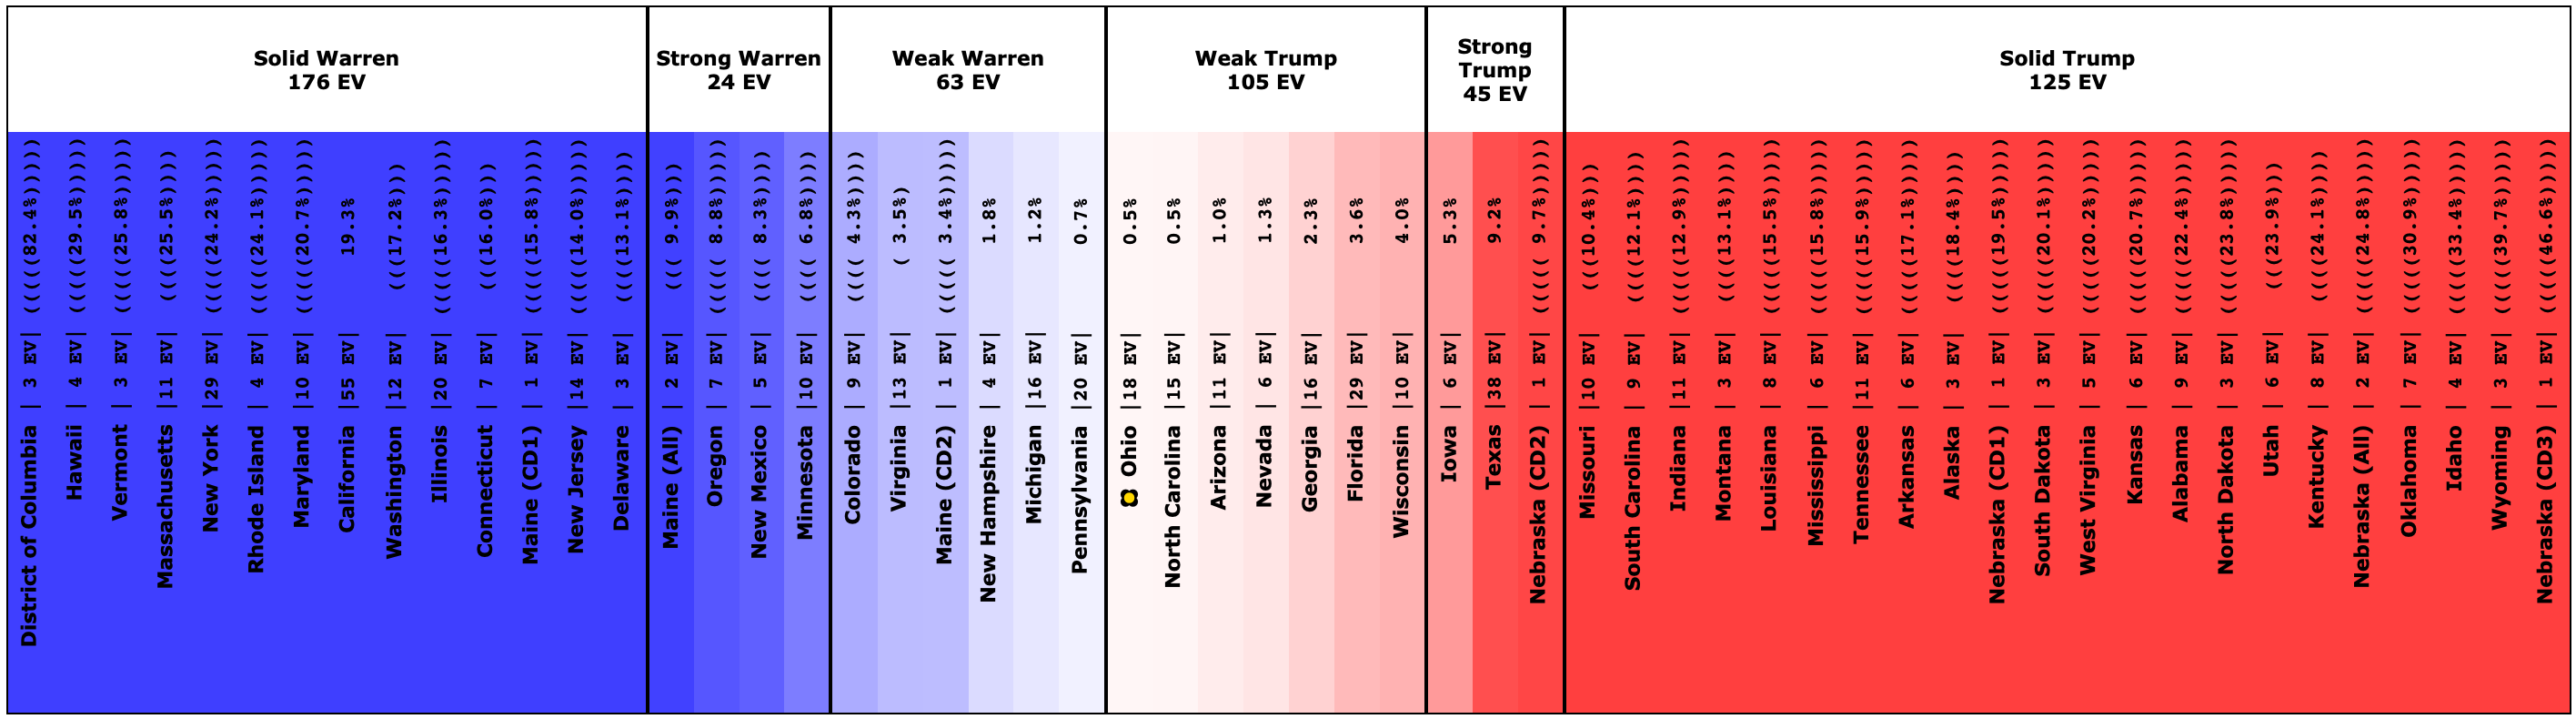
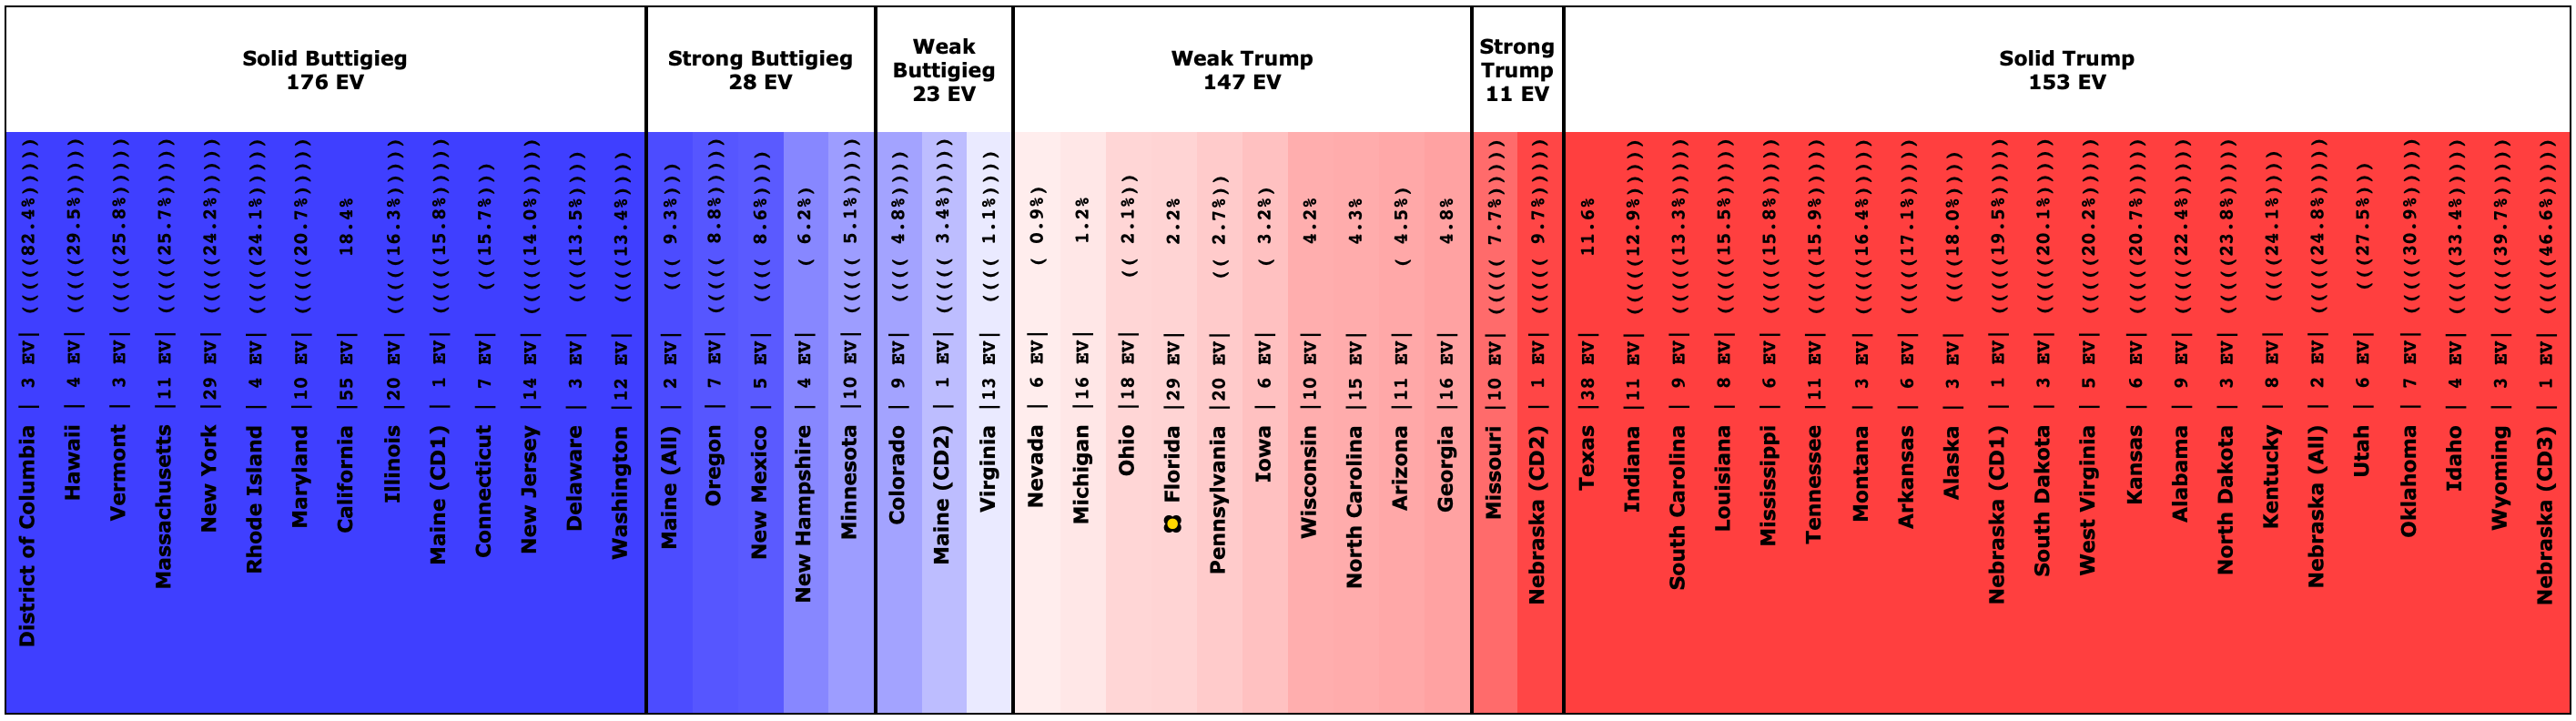
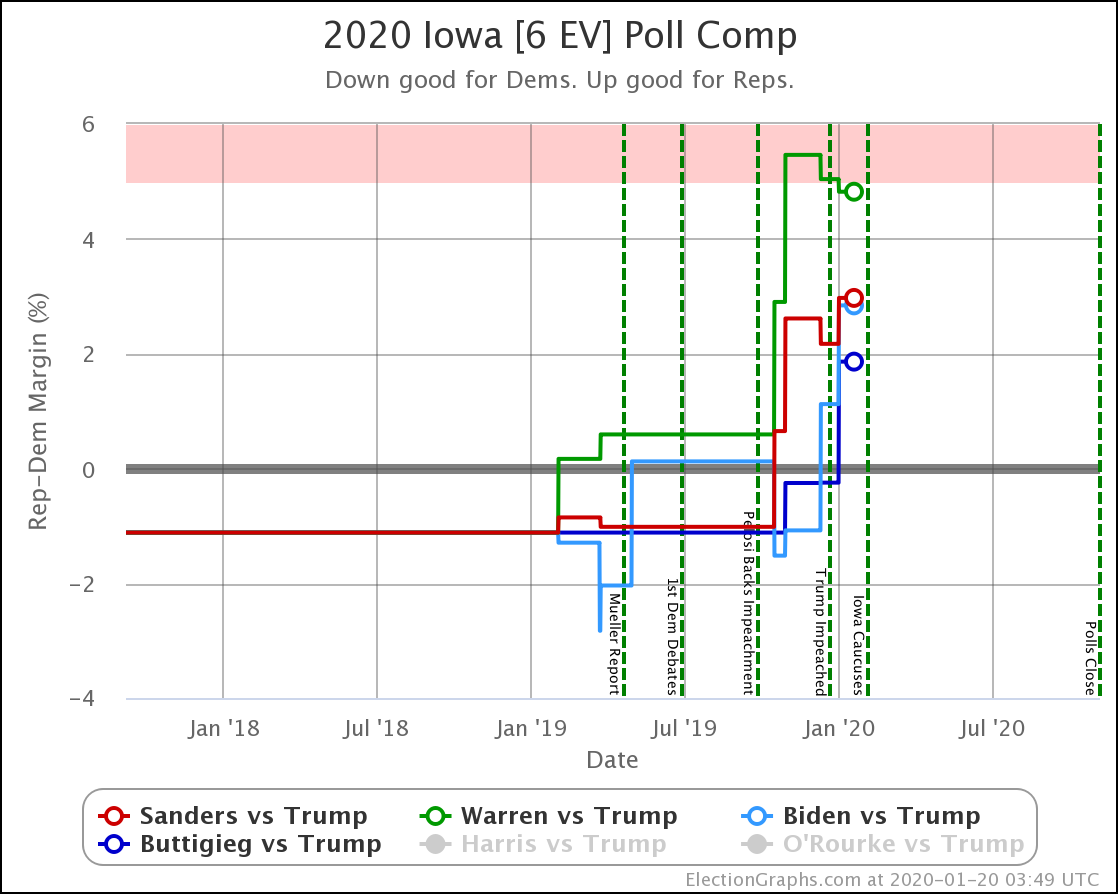
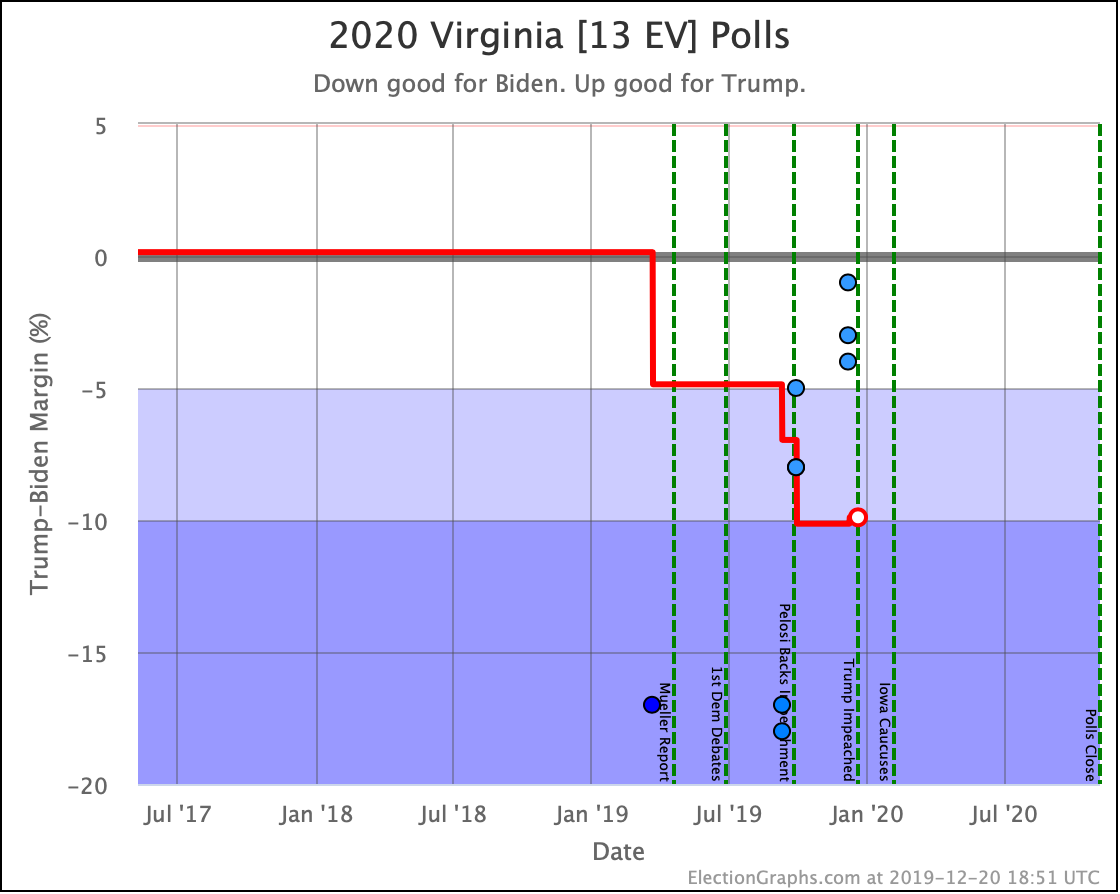
So, over the last three weeks, Biden went from being just a little ahead in Pennsylvania (20 EV), to being just a little bit behind. That's a 40 EV net loss in margin.
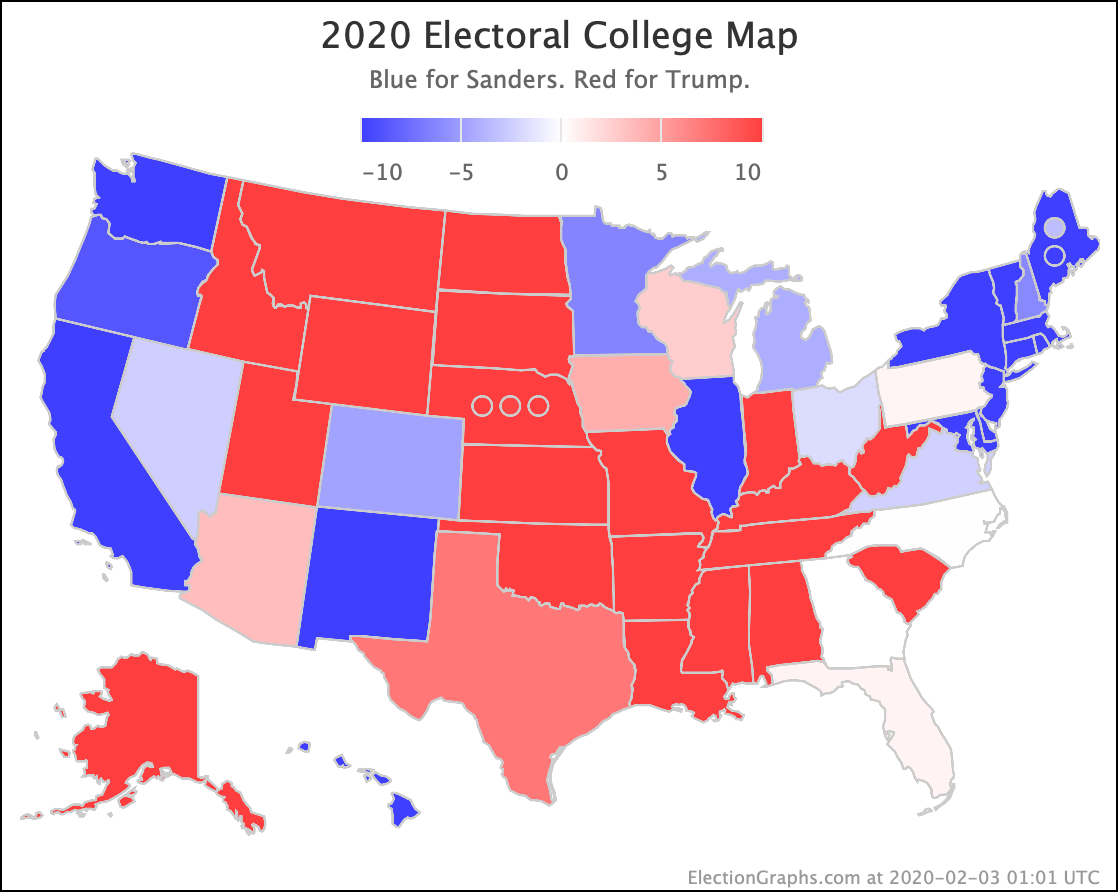
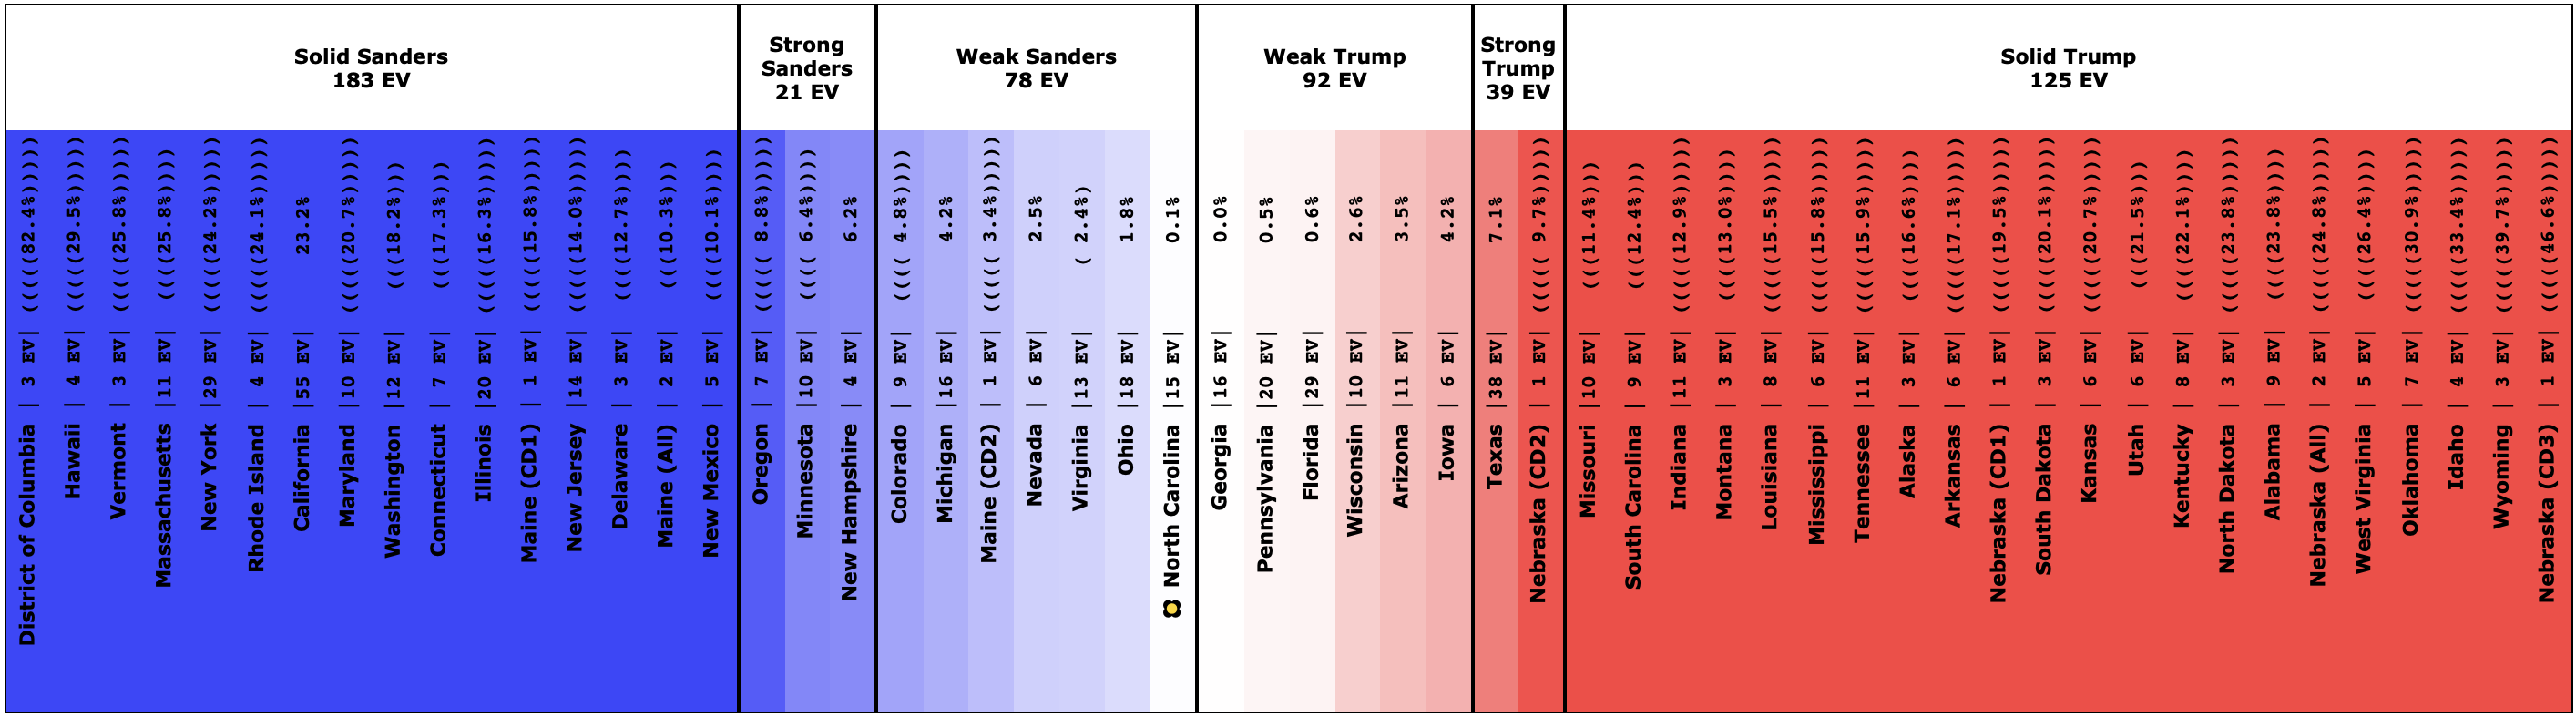
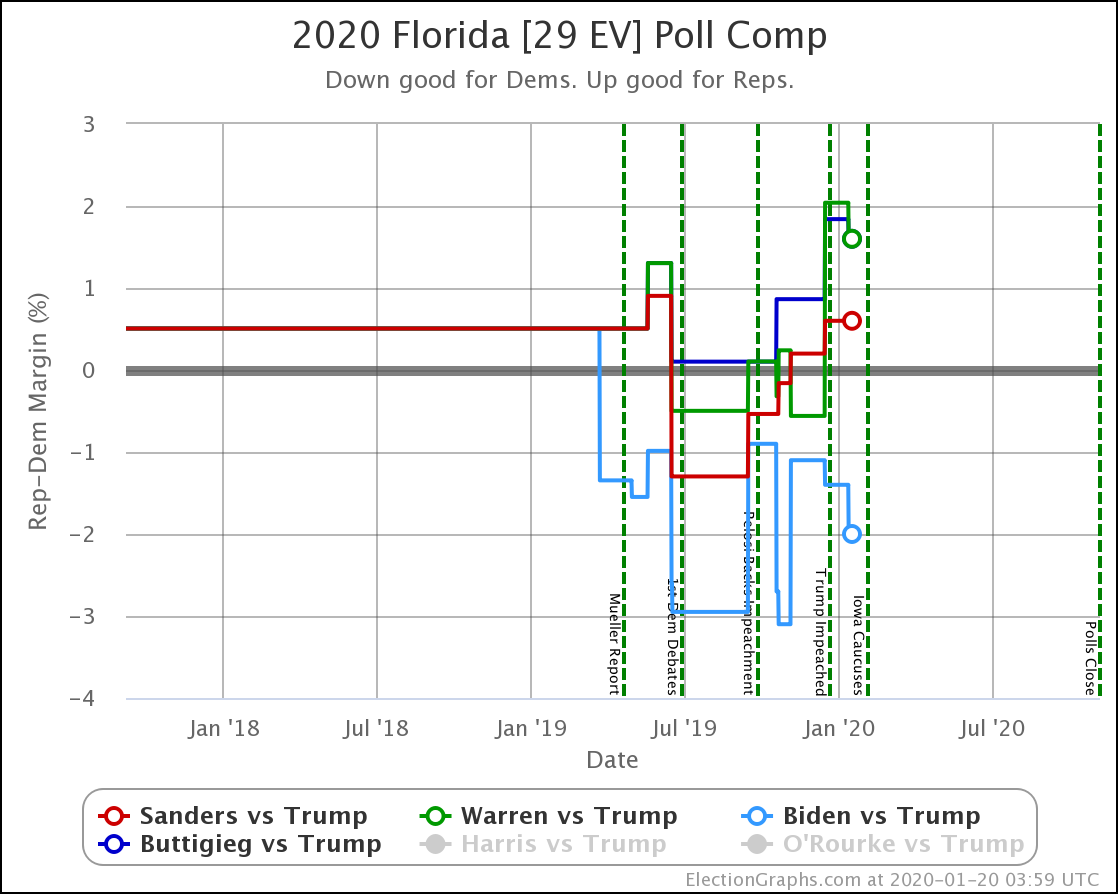
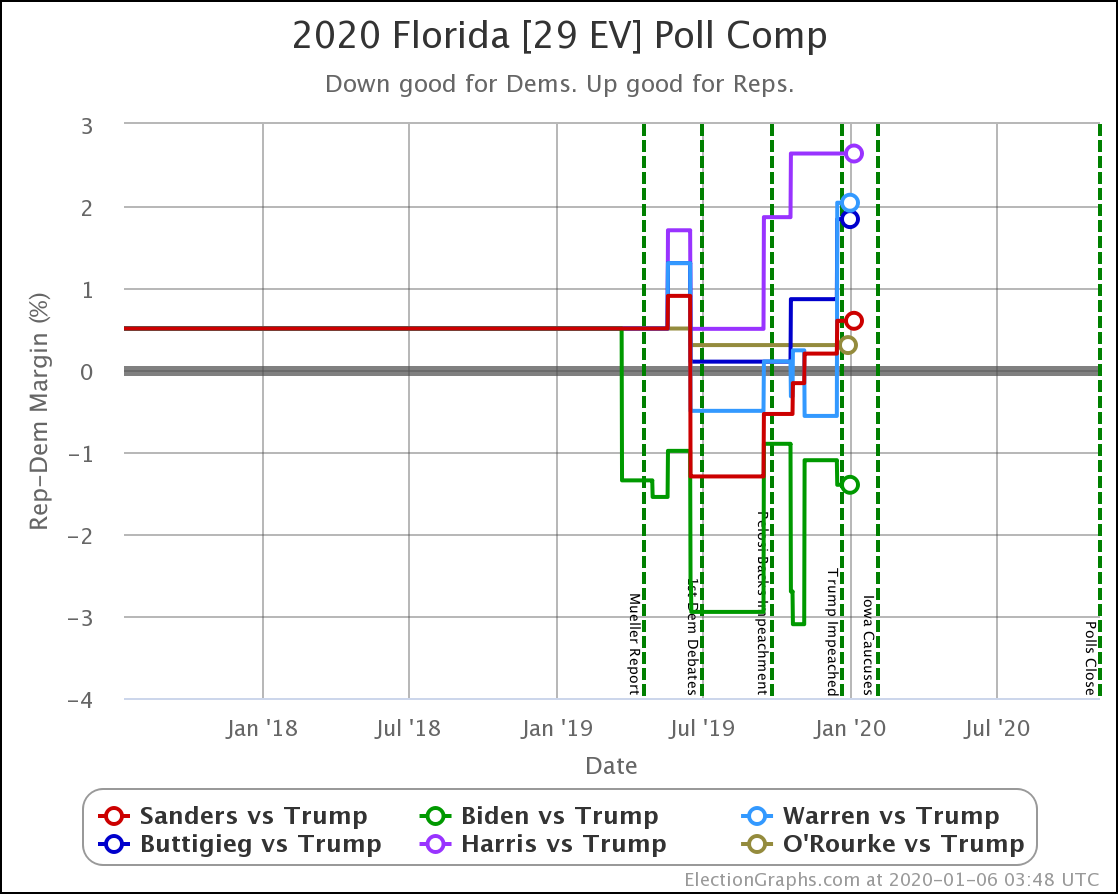
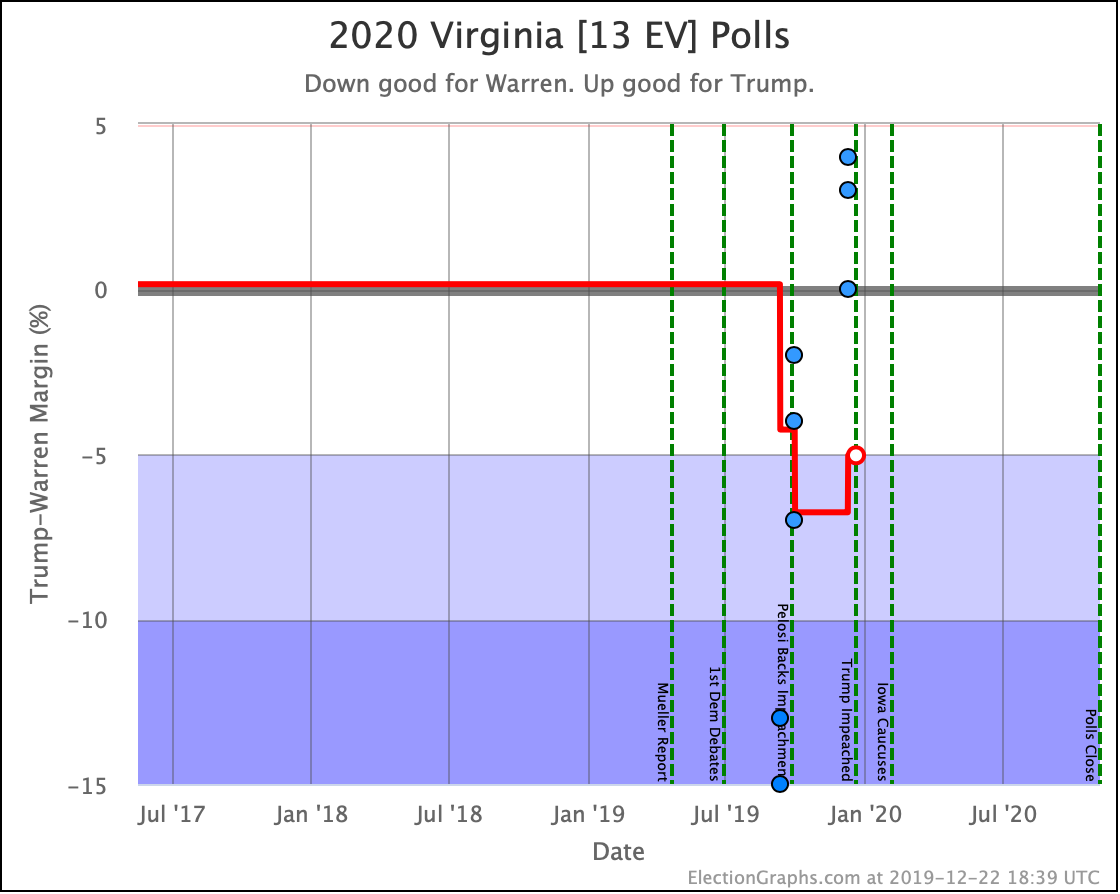
Sanders also lost his small lead in Pennsylvania. But in addition, he lost his leads in Florida (29 EV) and Wisconsin (10 EV). So that's an additional 78 electoral votes of margin lost for a total of 118 EV of margin lost.
Biden started with a bigger lead as well. So this view now has Biden leading Trump by 126 electoral votes, while Sanders's lead is now a very narrow 26 electoral votes. Still ahead, but suddenly a very close race.
Just from a handful of states slipping just a little bit.
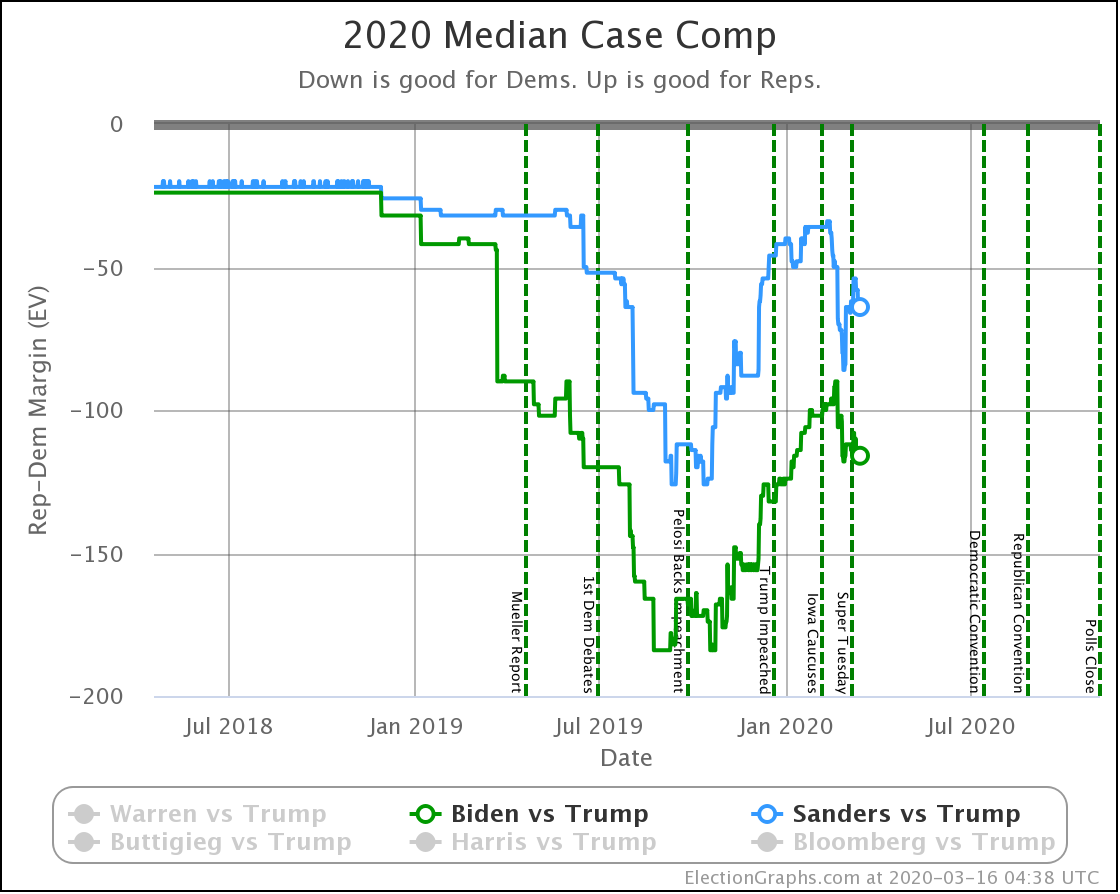
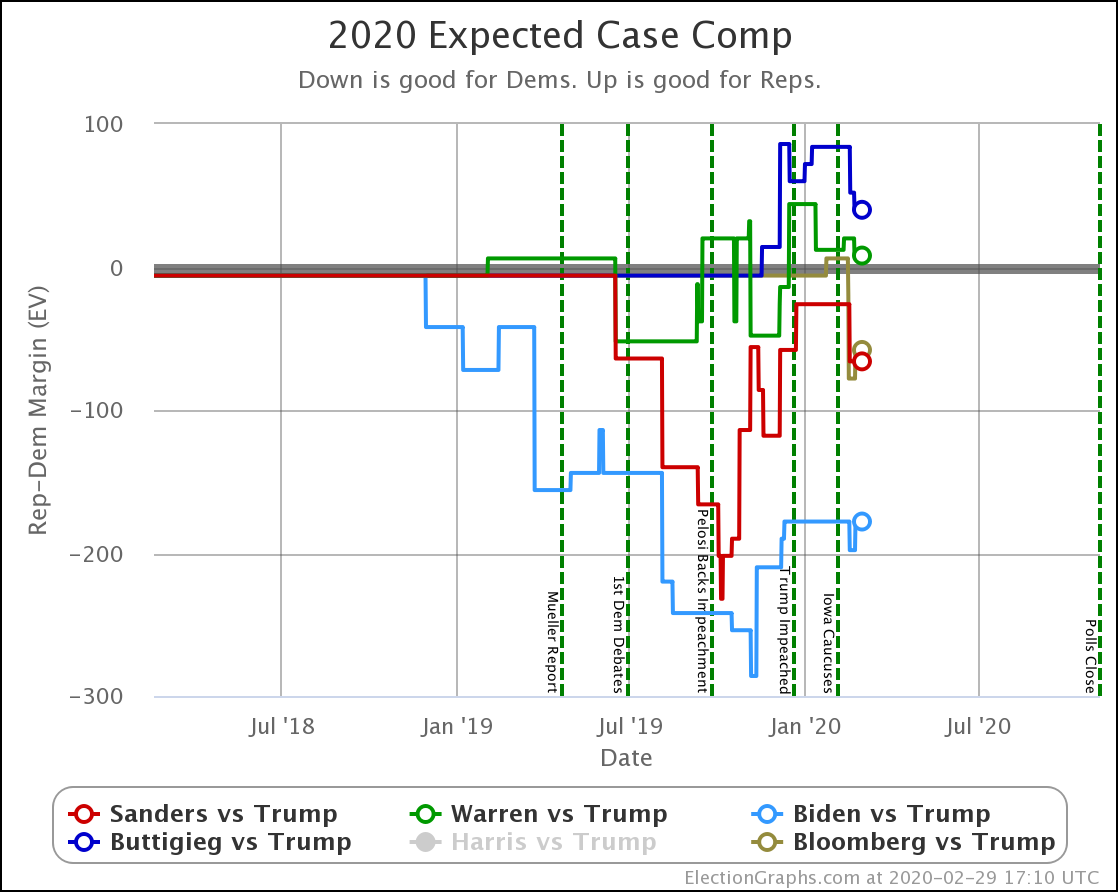
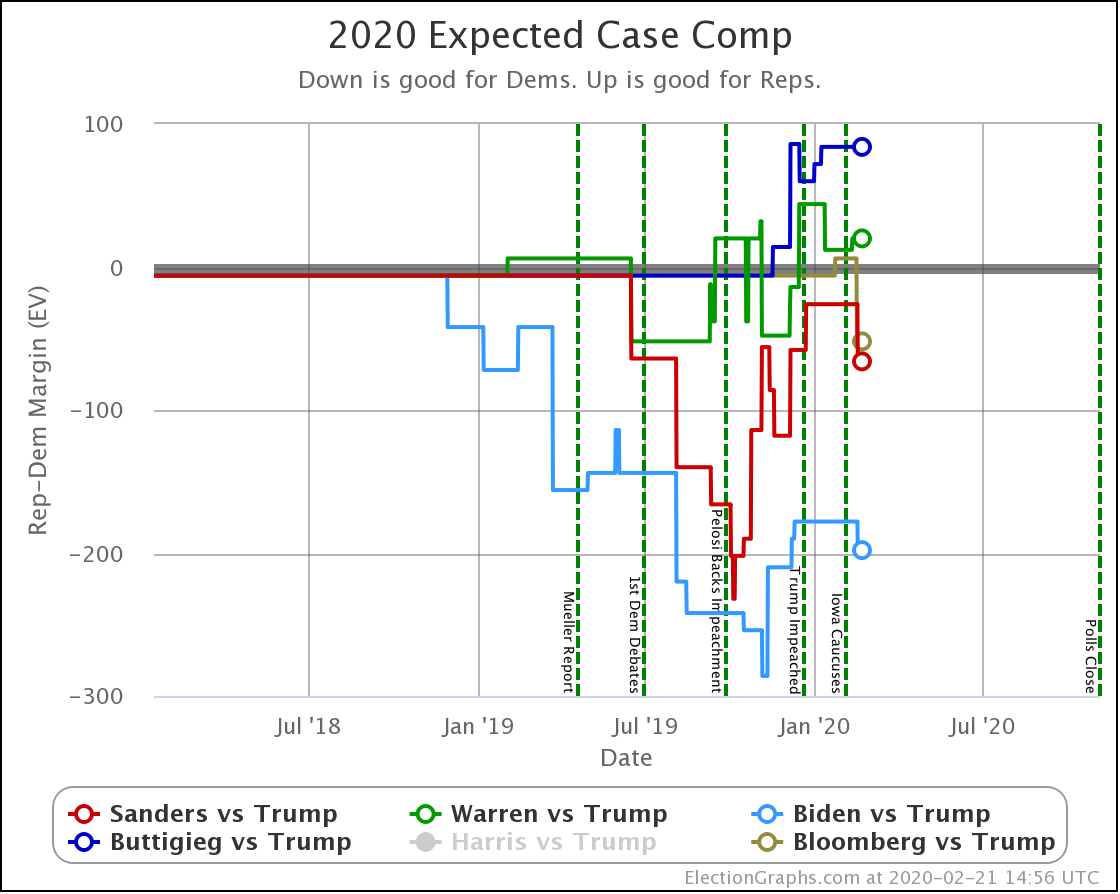
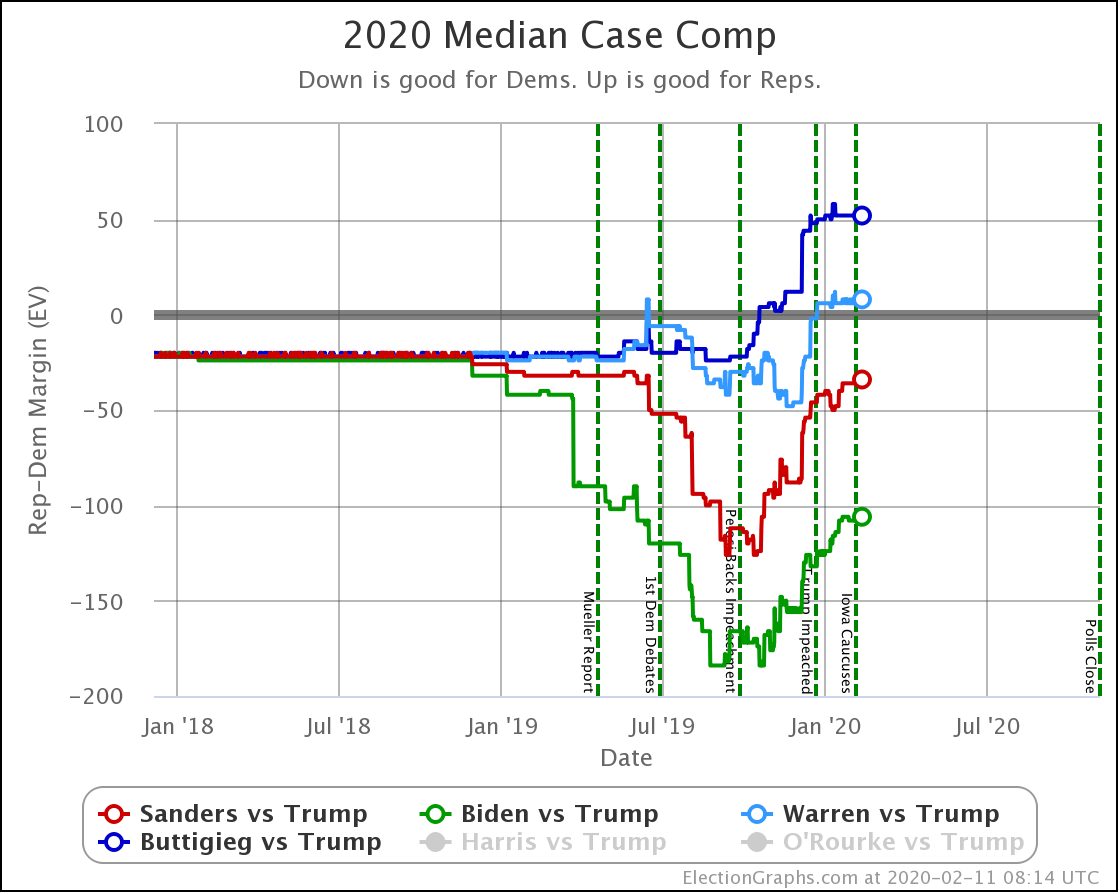
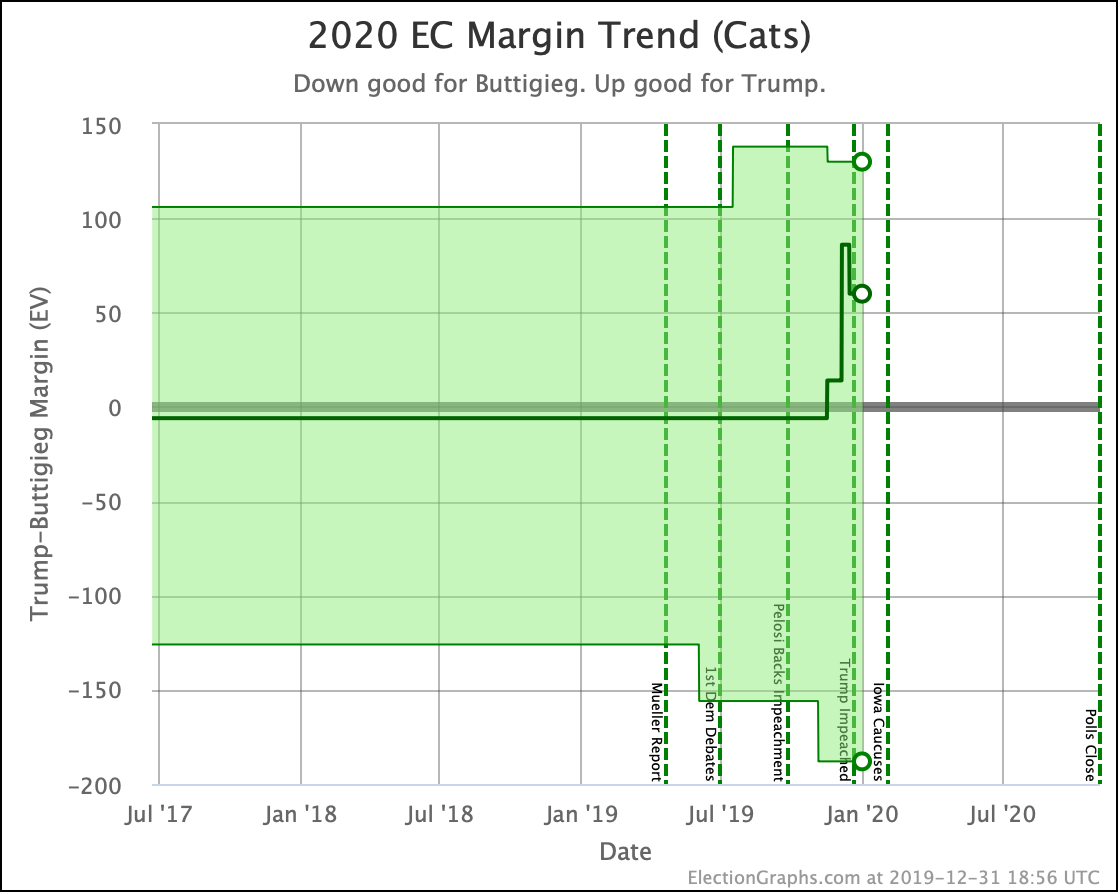
How does this look in the more sophisticated probabilistic view that knows that being 1% ahead in a state is different than being 2% ahead in a state?
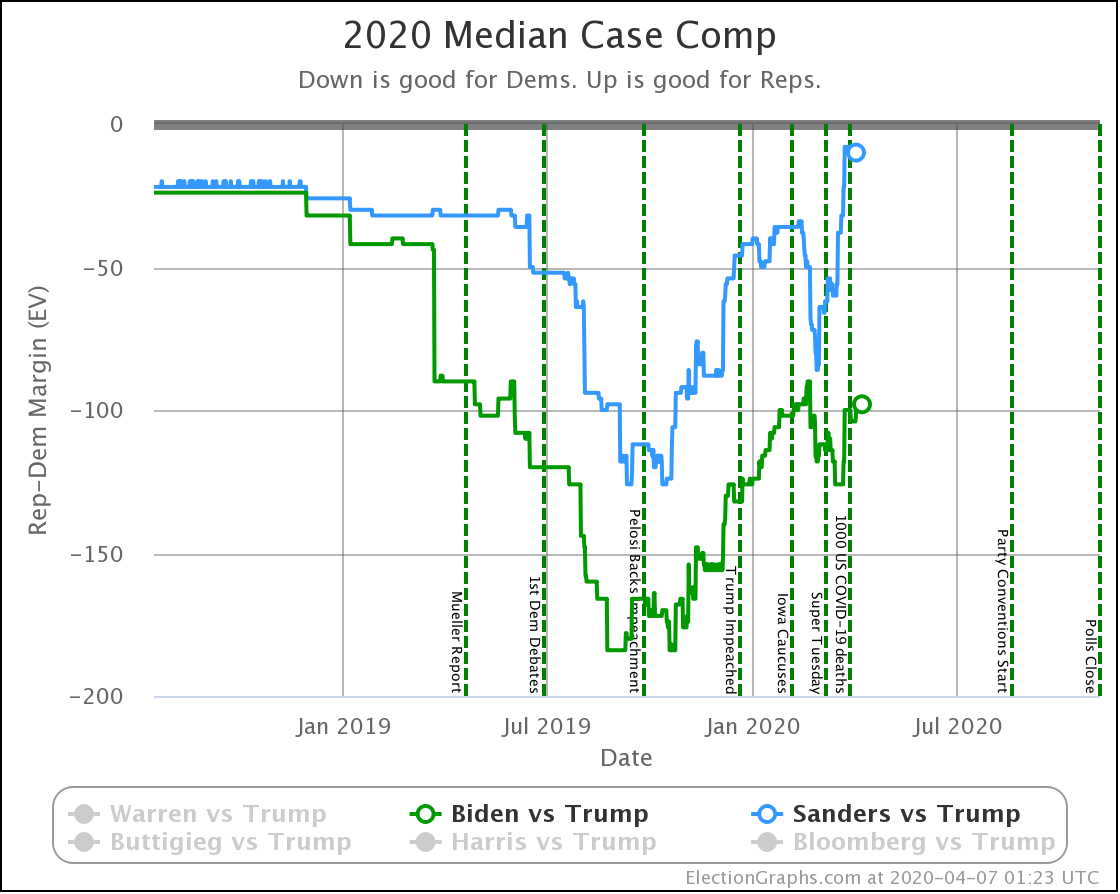
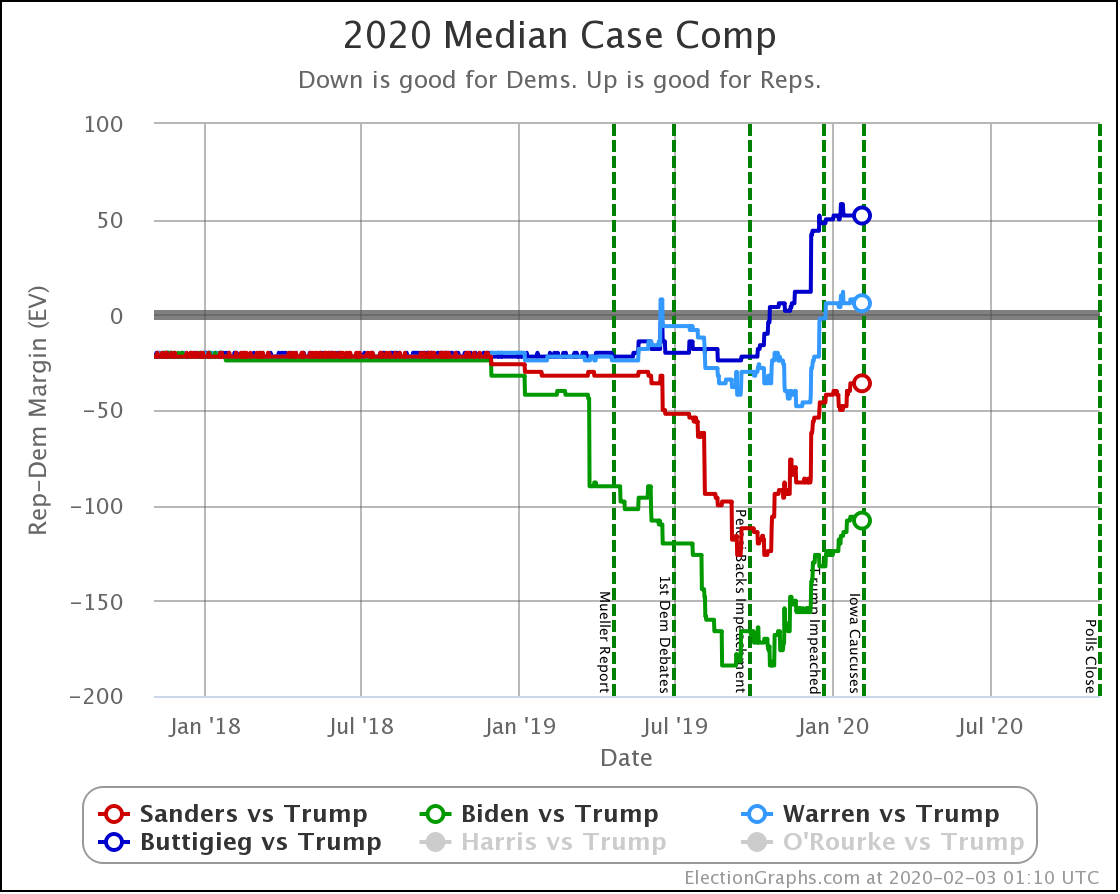
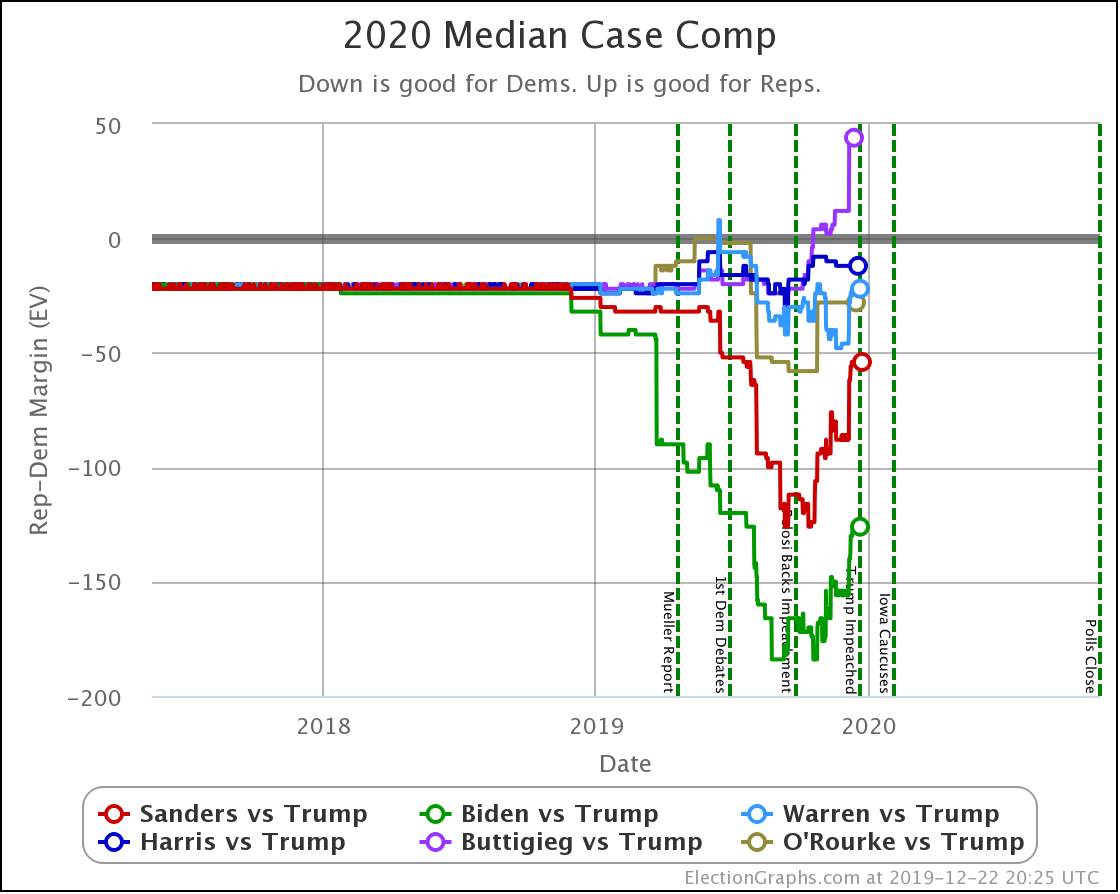
| Dem | 16 Mar | 7 Apr | 𝚫 |
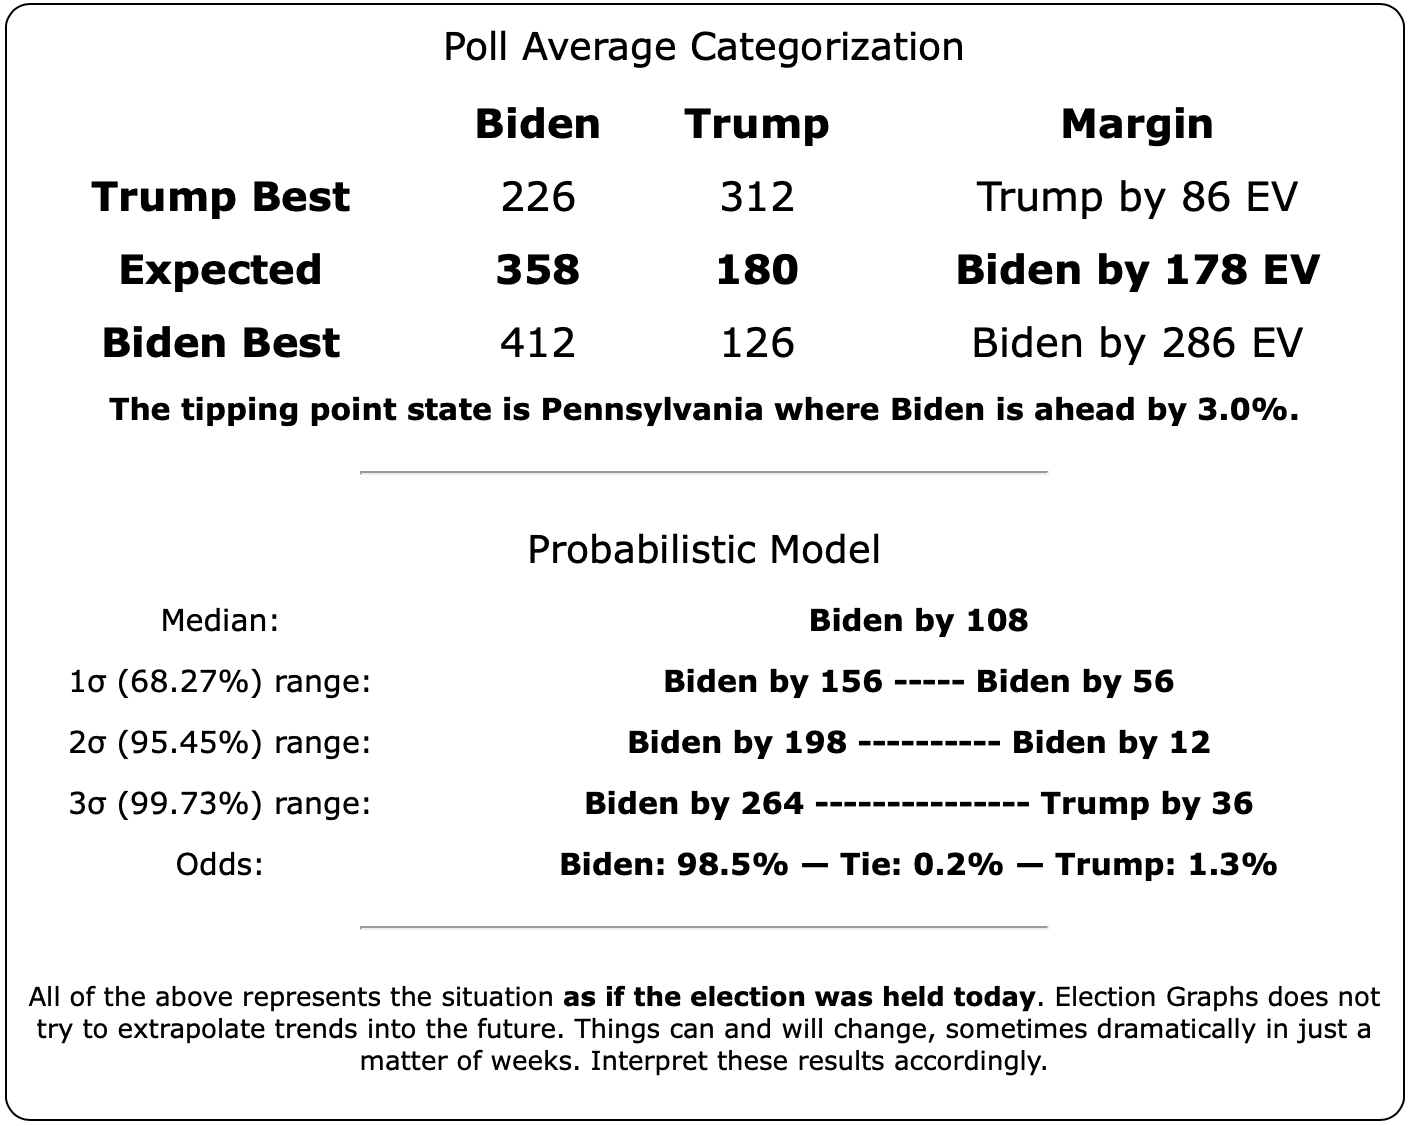
| Biden | +116 | +98 | -18 |
| Sanders | +64 | +10 | -54 |
Because there are so many states that were just barely on the Democratic side of the line, the median cases in the probabilistic view are both narrower than the more naive view. This is because it would be very easy for those states to go the other direction.
The impact from the polls these last three weeks is similarly a bit smaller. But directionally the same. Weakening for both Democrats, with a bigger fall for Sanders.
And the median case for Sanders is now very close indeed. Still winning, but only by a very slim electoral vote margin.
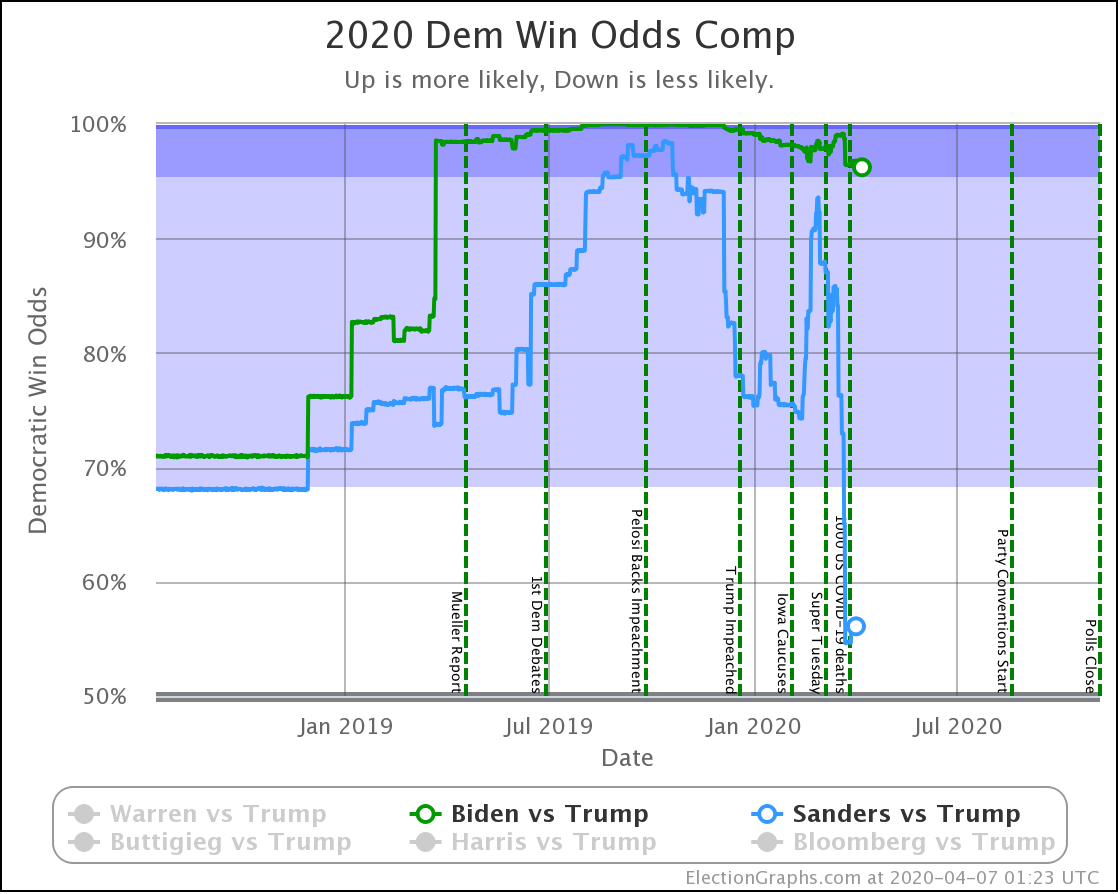
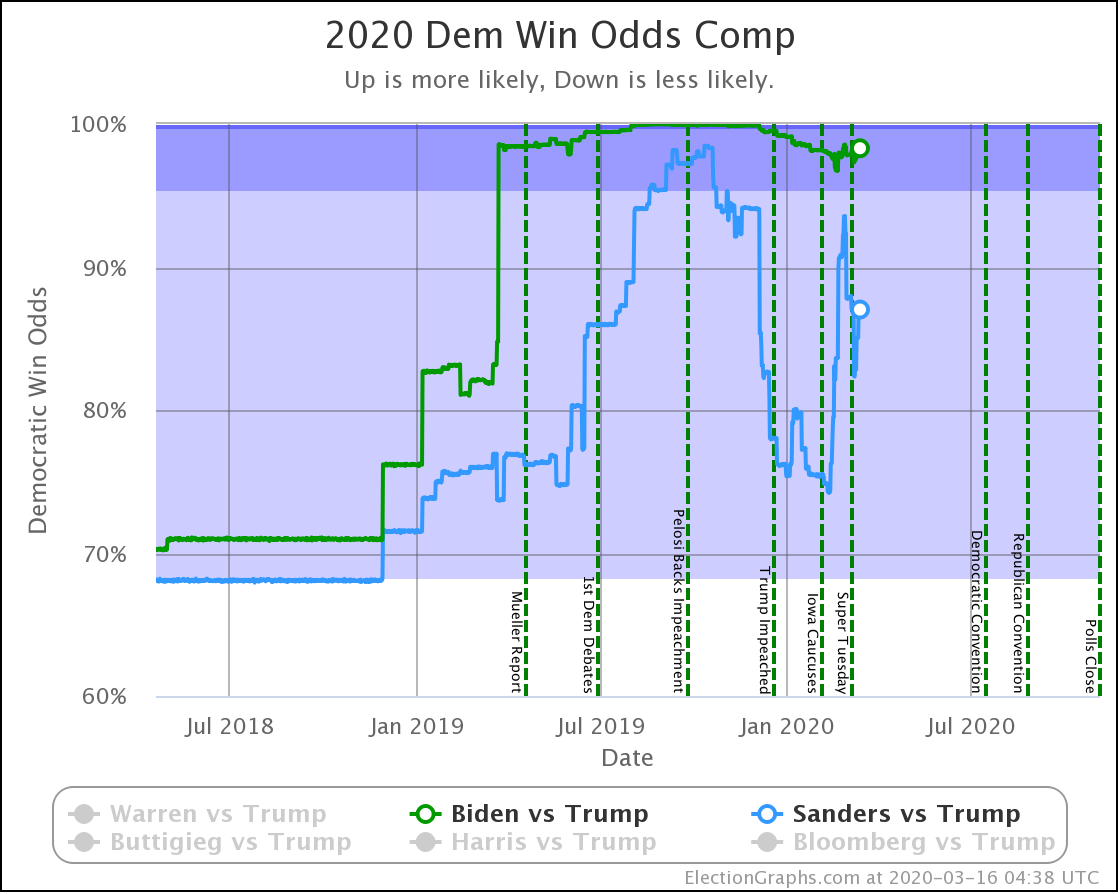
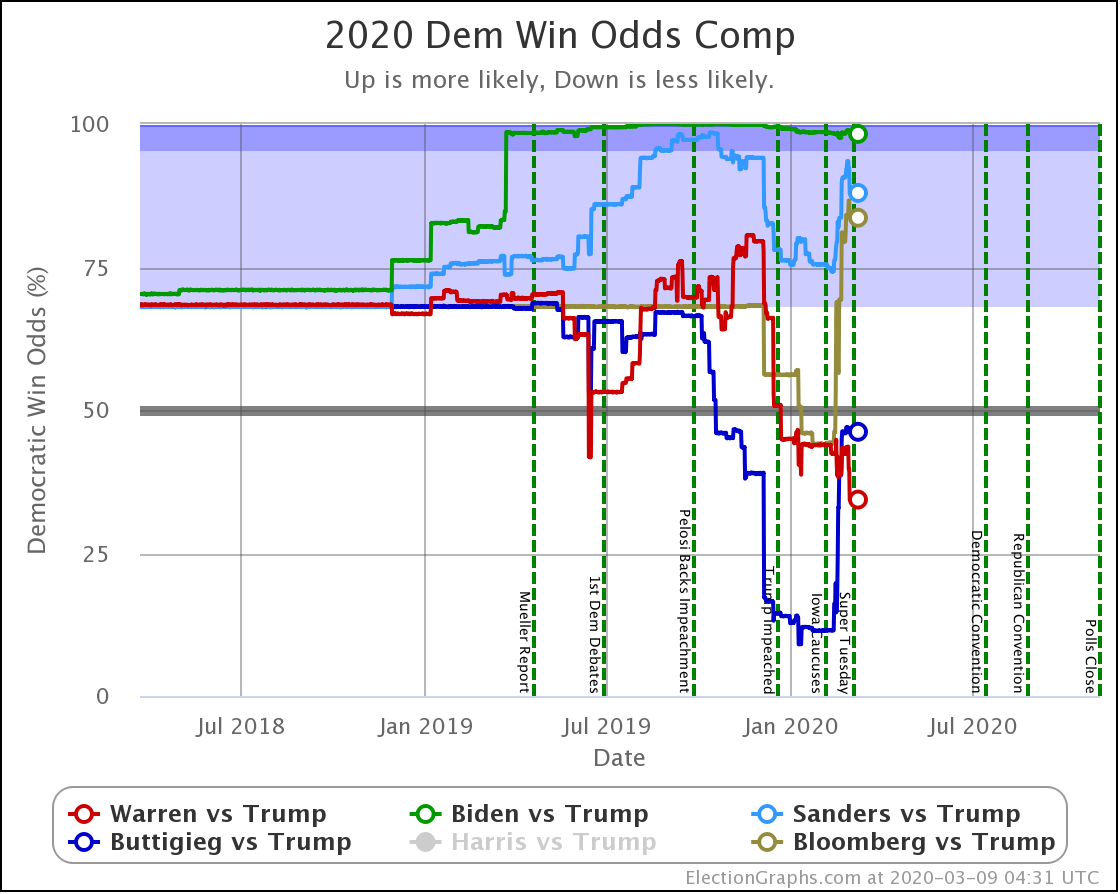
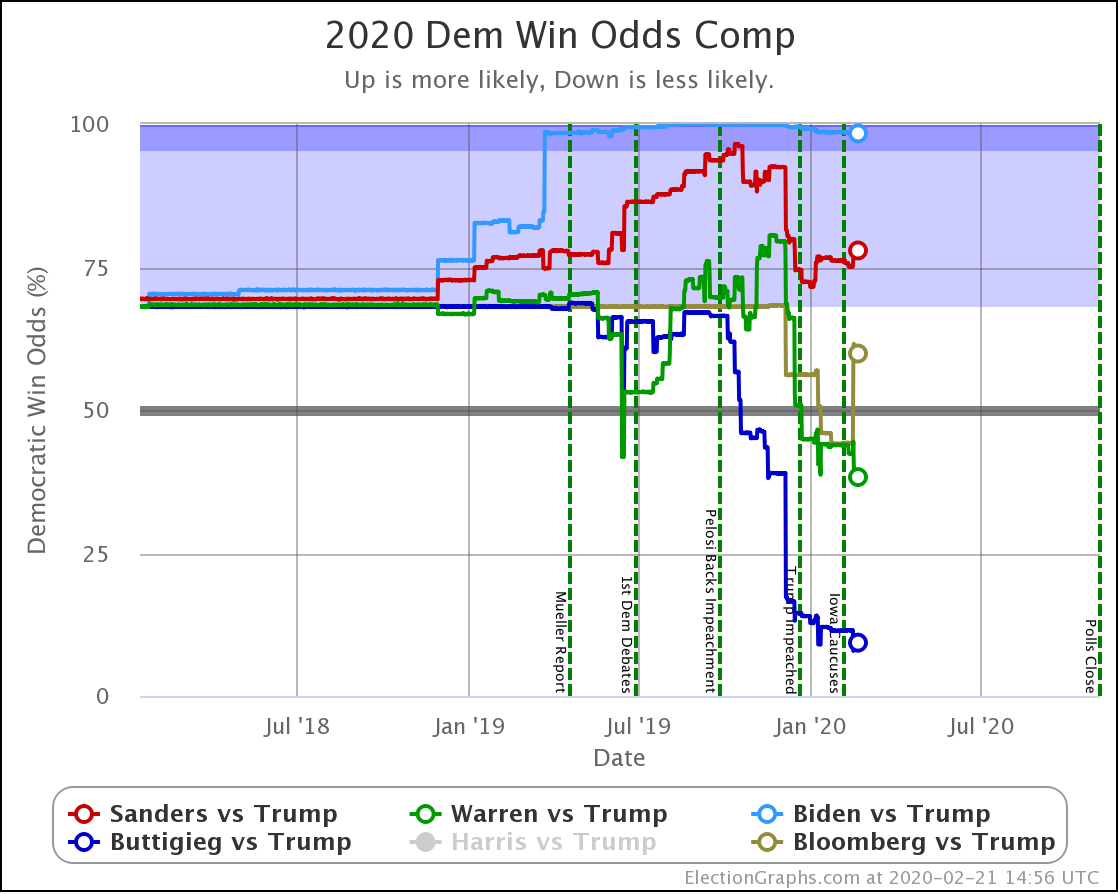
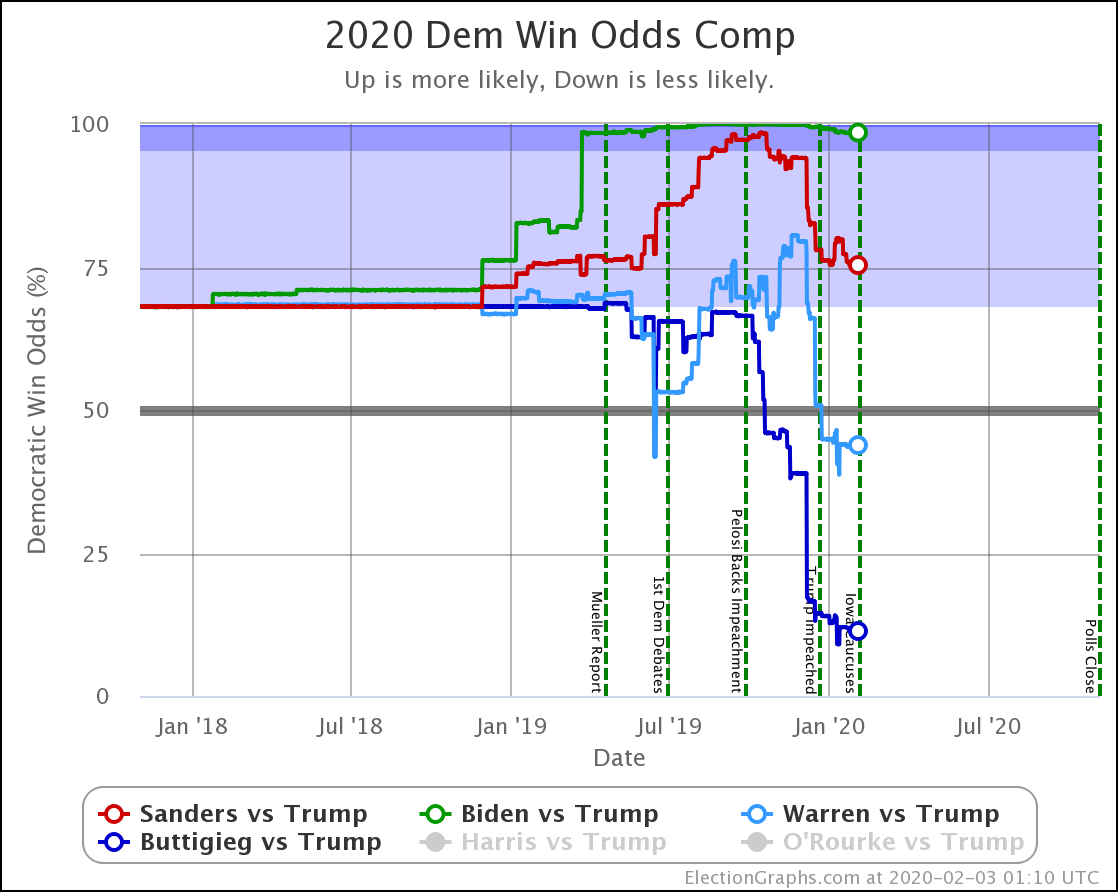
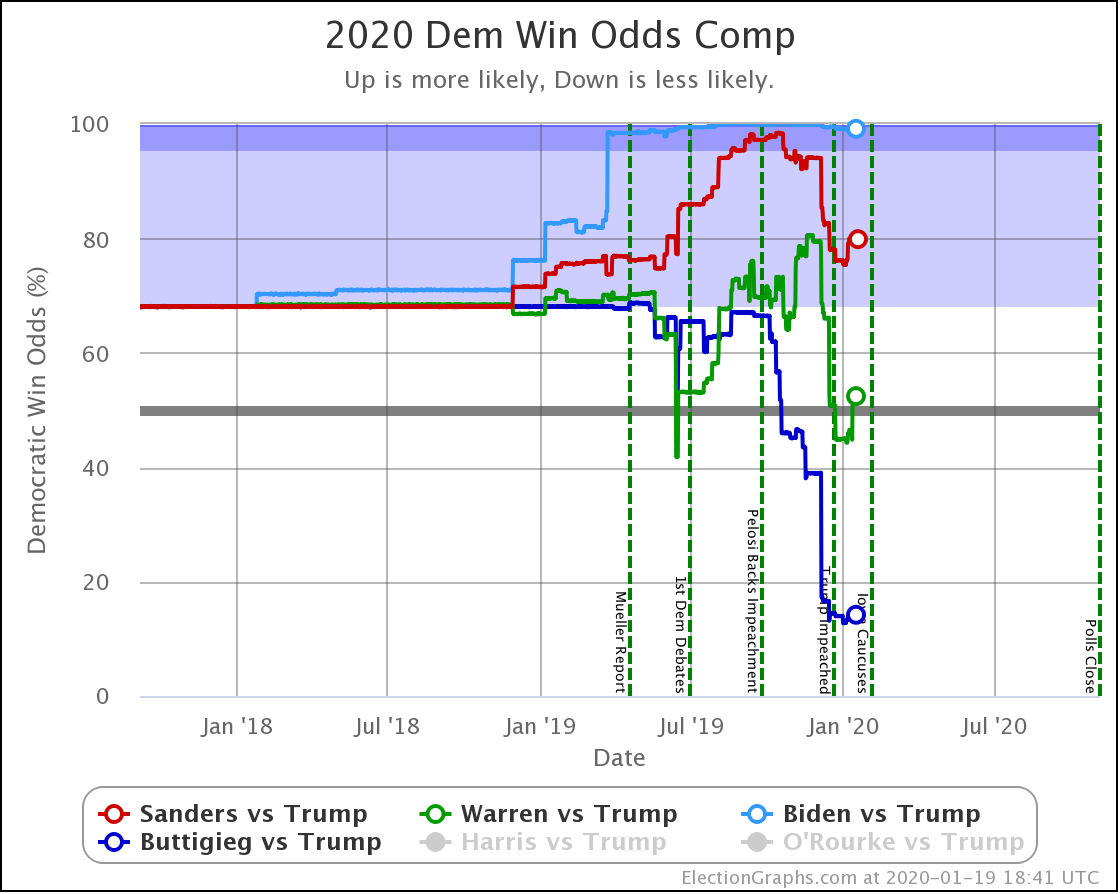
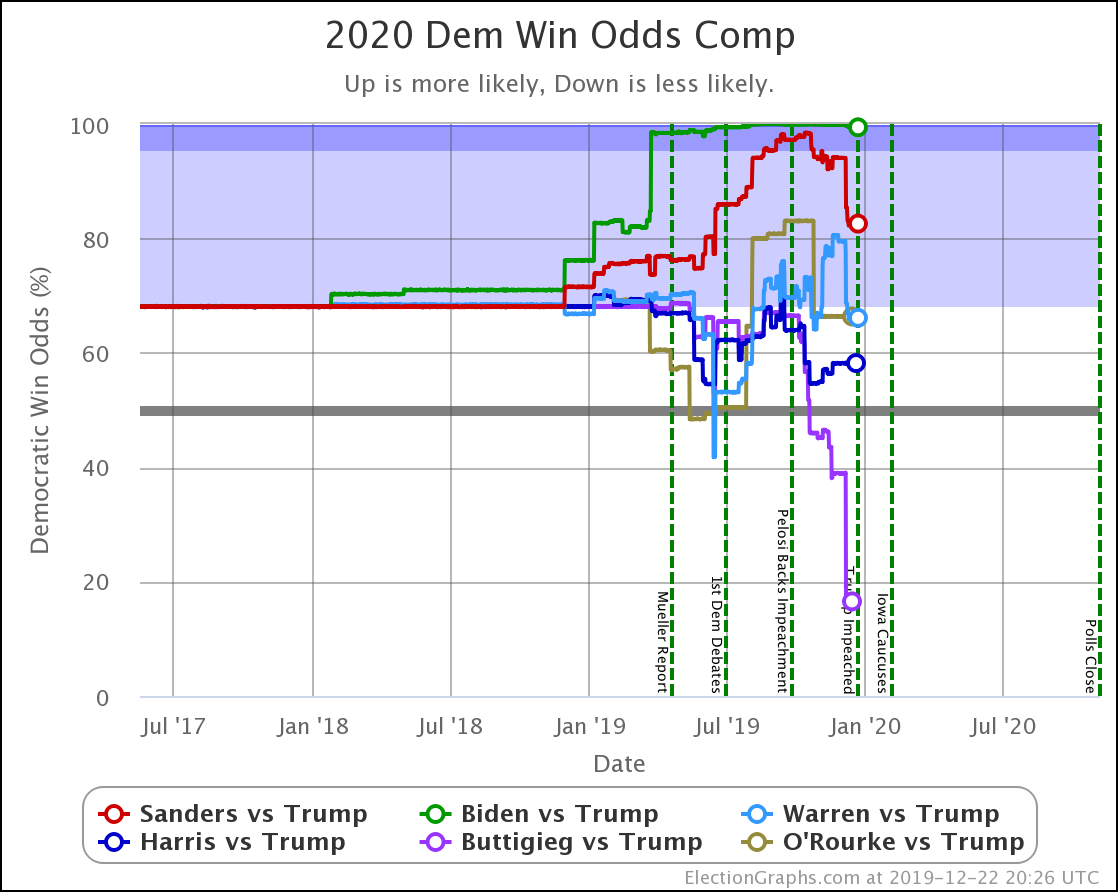
| Dem | 16 Mar | 7 Apr | 𝚫 |
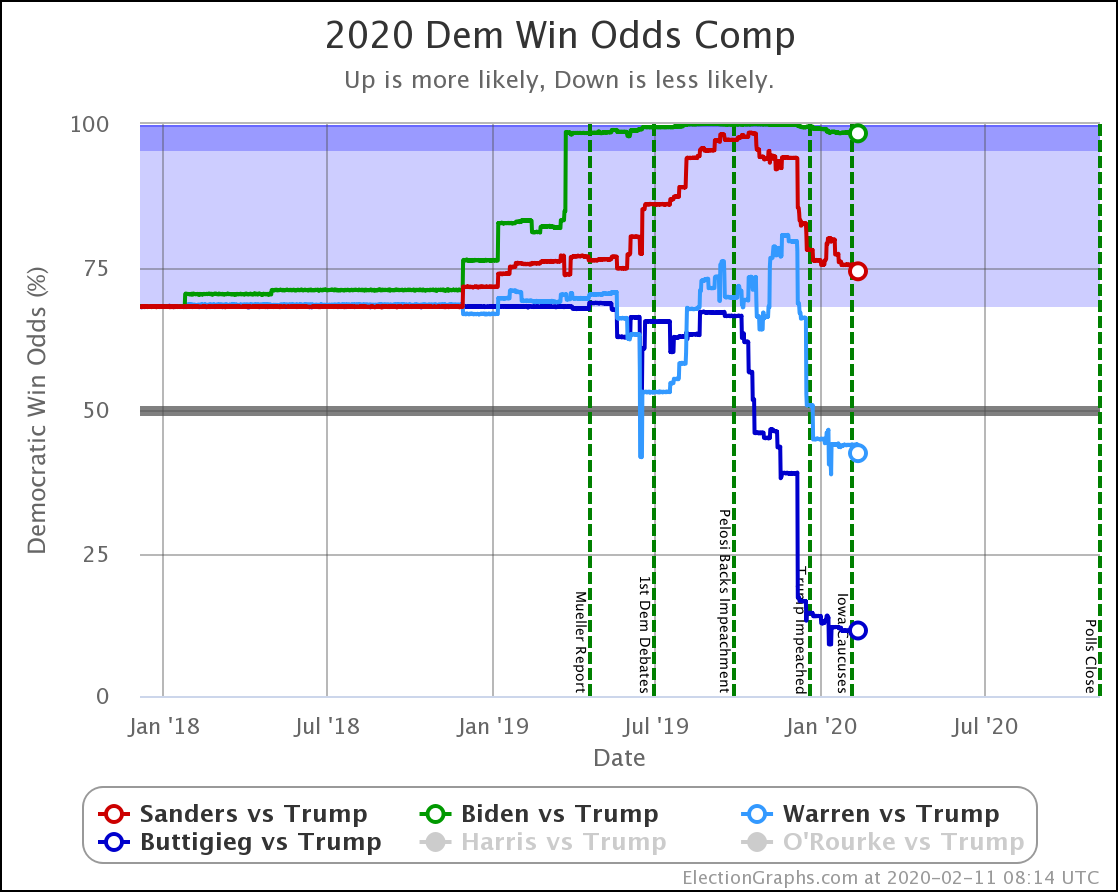
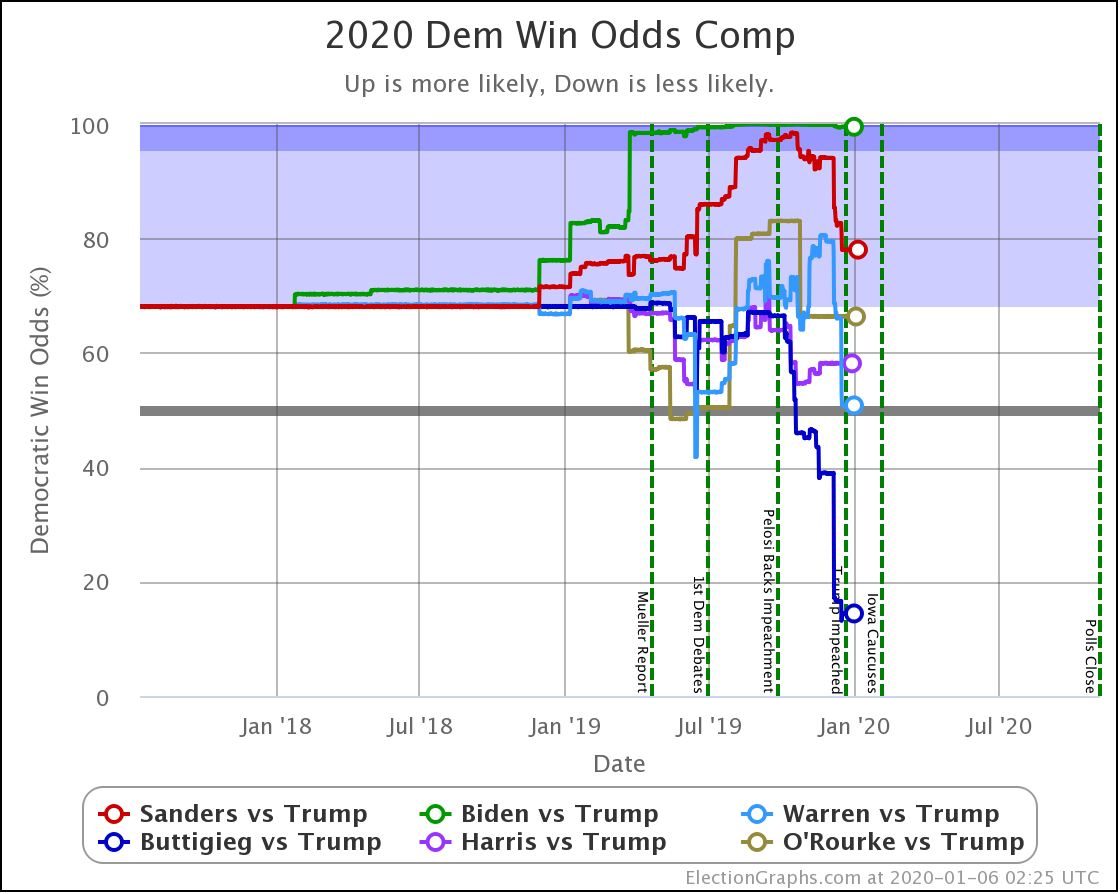
| Biden | 98.3% | 96.2% | -2.1% |
| Sanders | 87.0% | 56.1% | -30.9% |
In terms of the odds of winning, the impact is much more dramatic. Sanders moves from a position that wasn't quite as strong as Biden, but still very respectable, to being barely a better bet than a coin toss.
While Biden drops a bit as well, to his worst position in over a year, the change for Sanders is a very large drop in a very short time to his worst performance since 2020 polling began. It is a stunningly large drop.
Or is it?
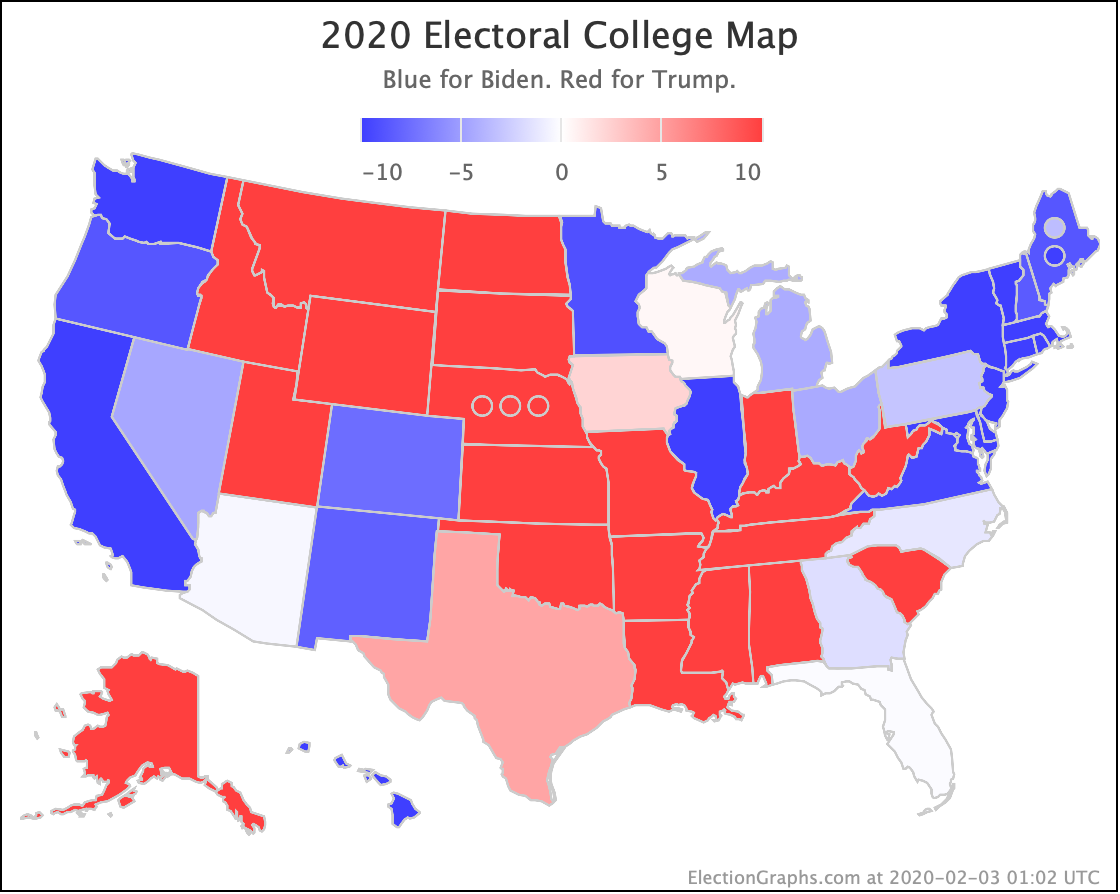
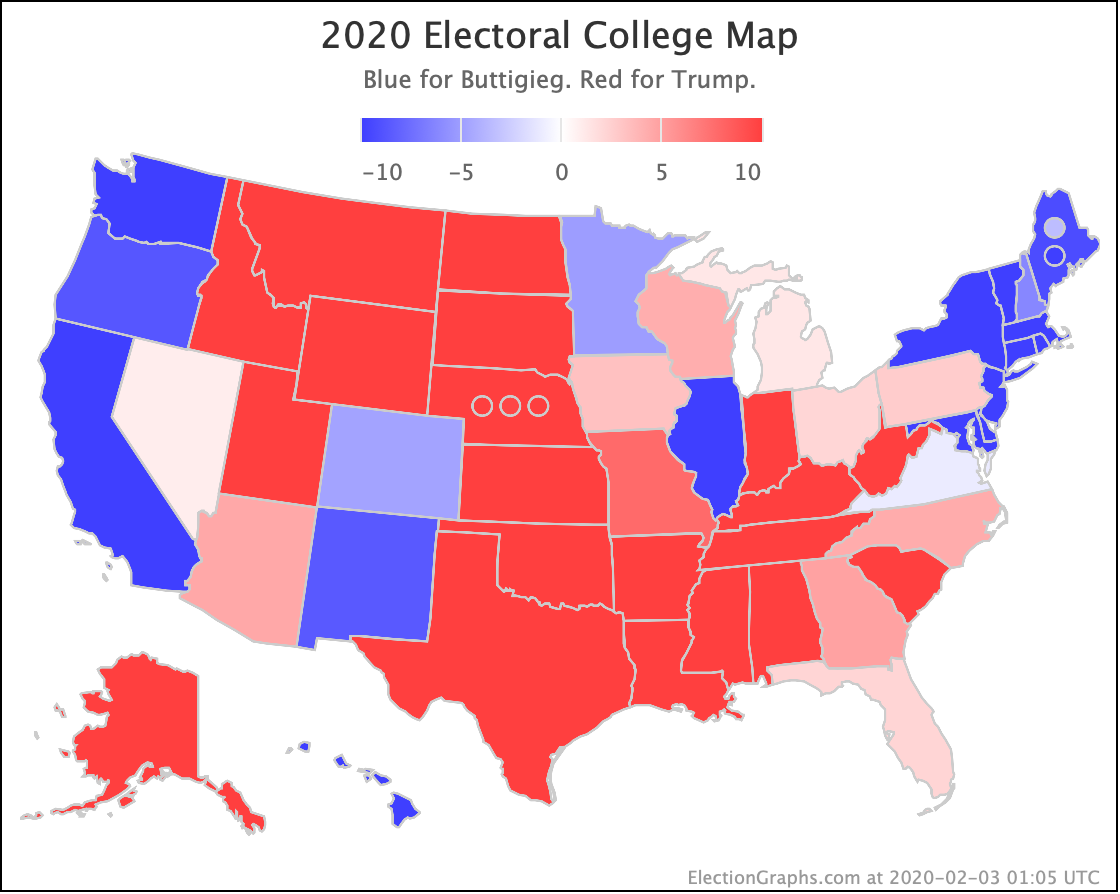
Remember, everything presented here is "if the election is held today." It shows the odds based on the historical accuracy of the Election Graphs averages as they stand when the election happens. So, for instance, right now Biden leads Florida by 2.5%. That translates into a 69.8% chance of Biden winning the state… if Biden's lead remains 2.5%.
These odds do not take into account the chances of the lead in the state changing over time. We provide a snapshot in time, not a projection into the future.
If there are enough close states, then small moves in those states can make a big difference quickly.
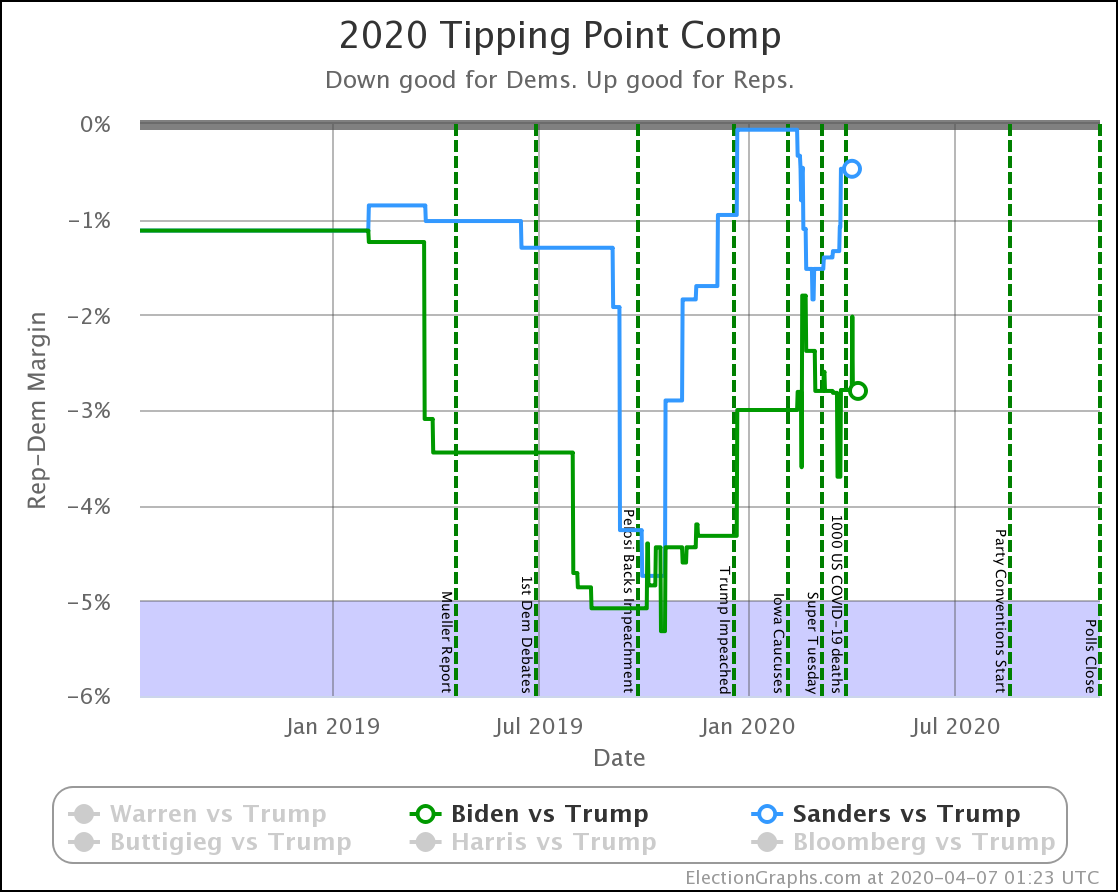
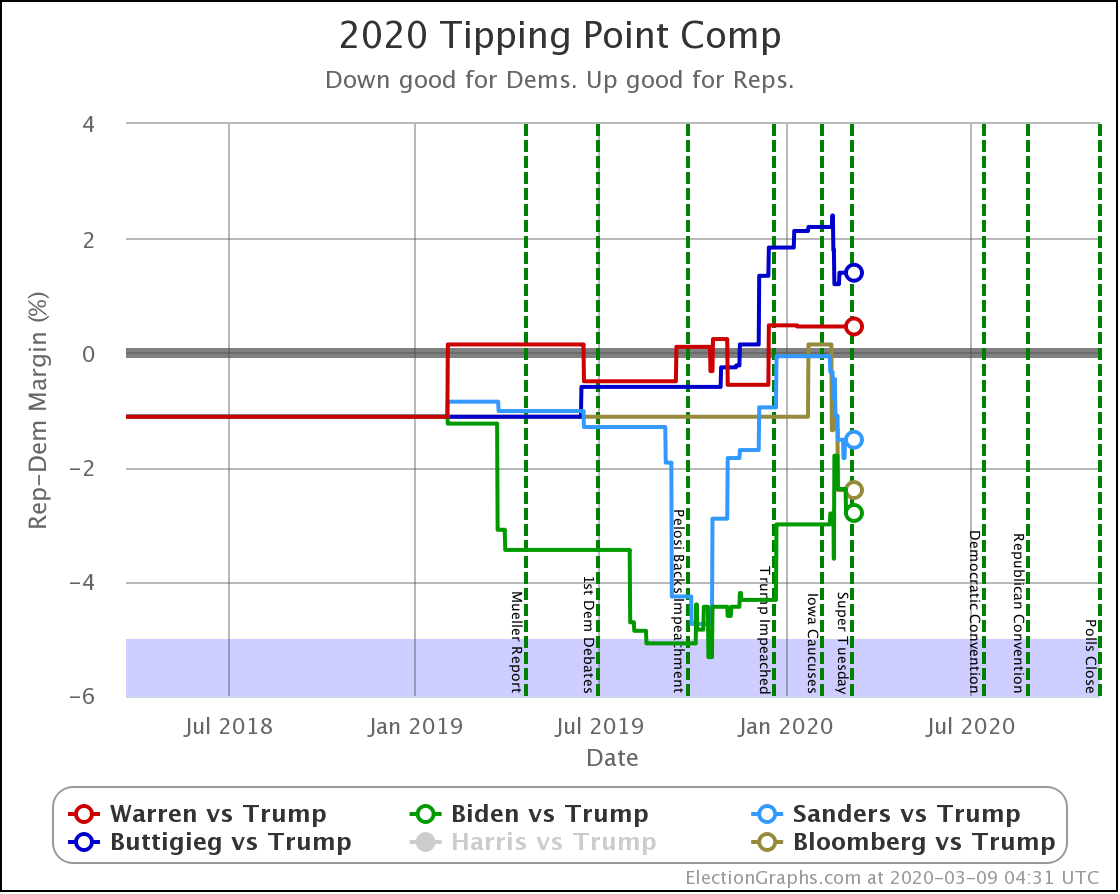
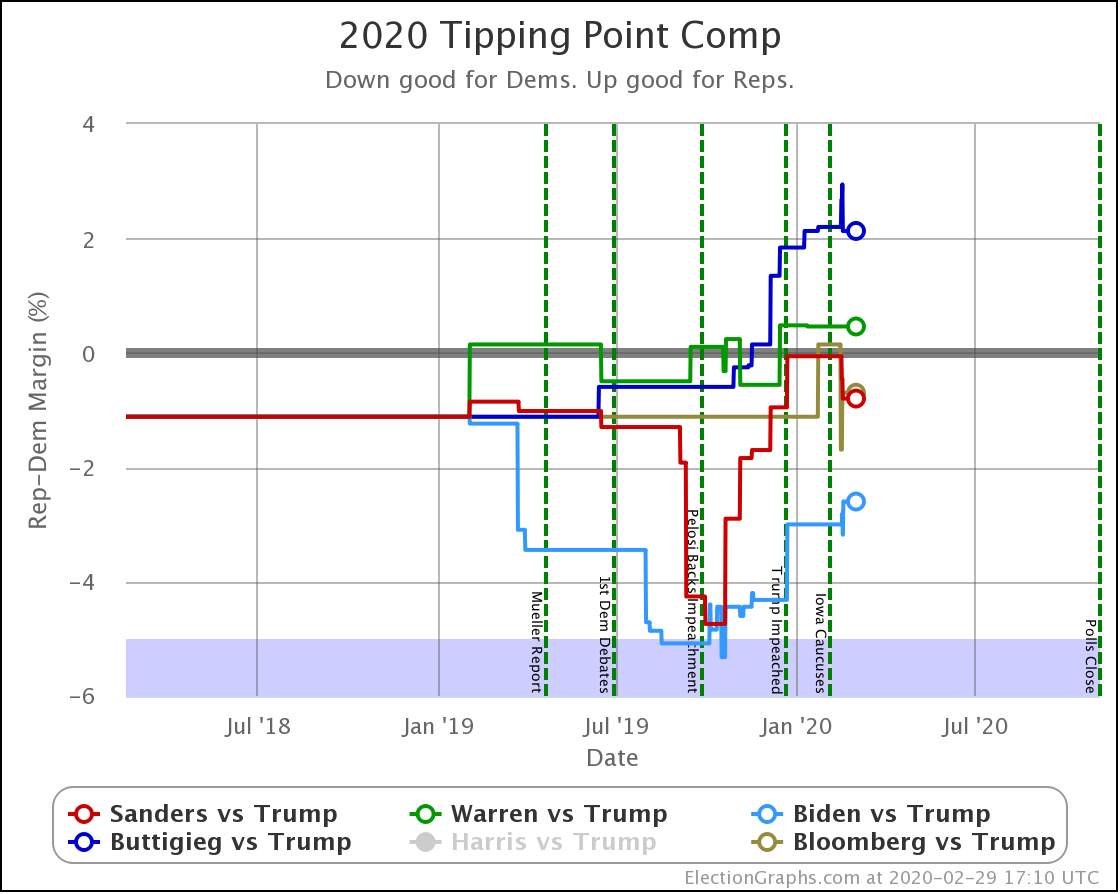
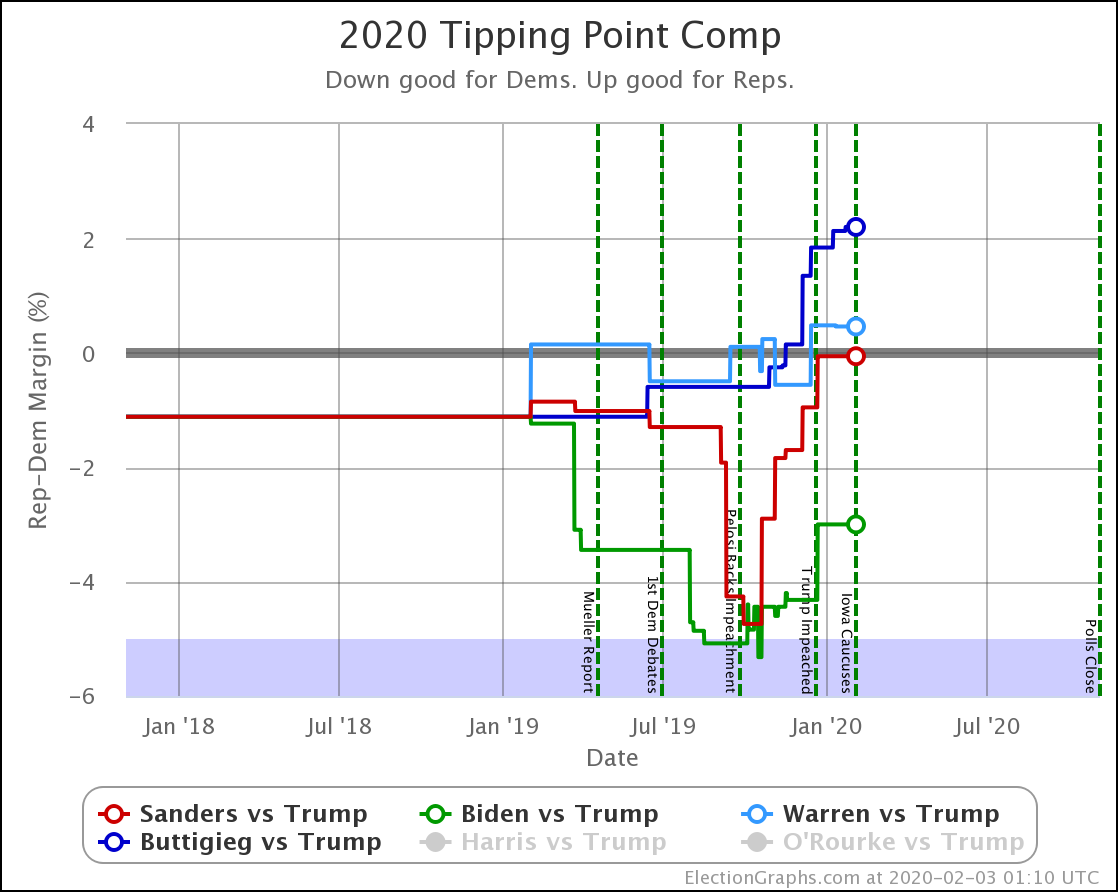
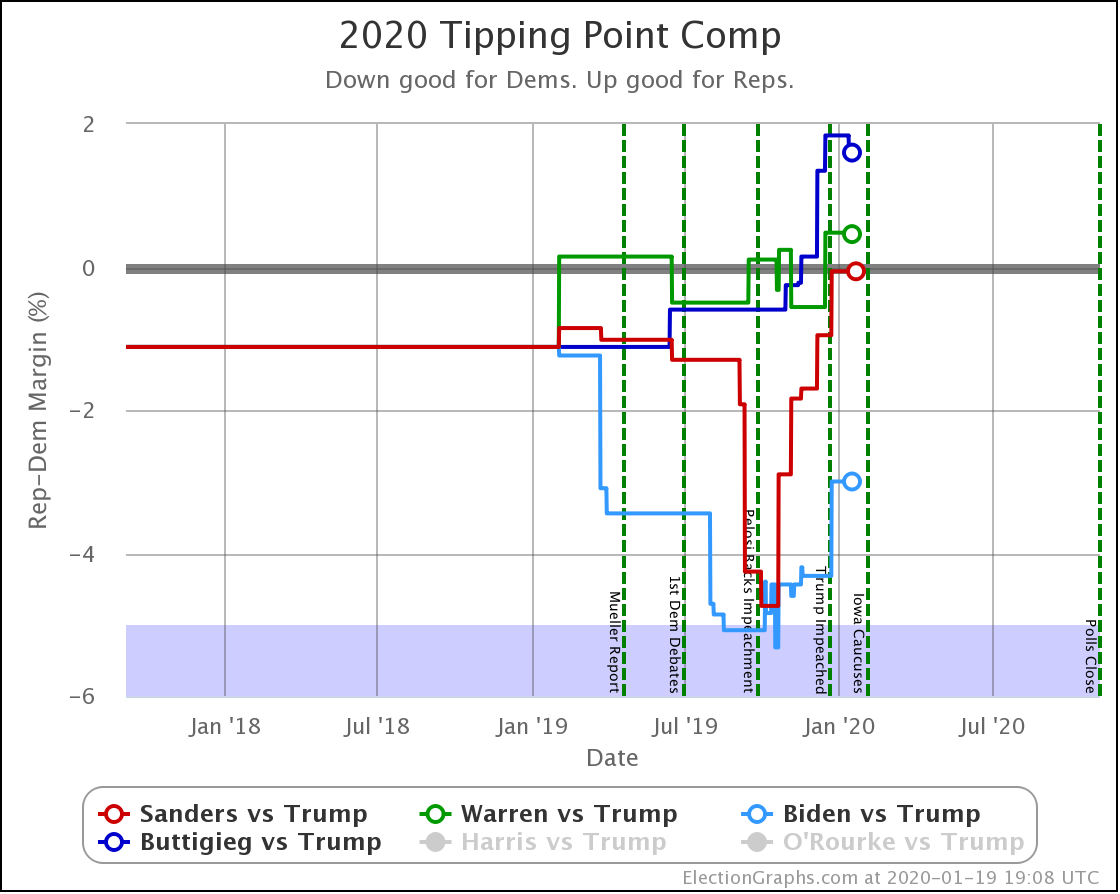
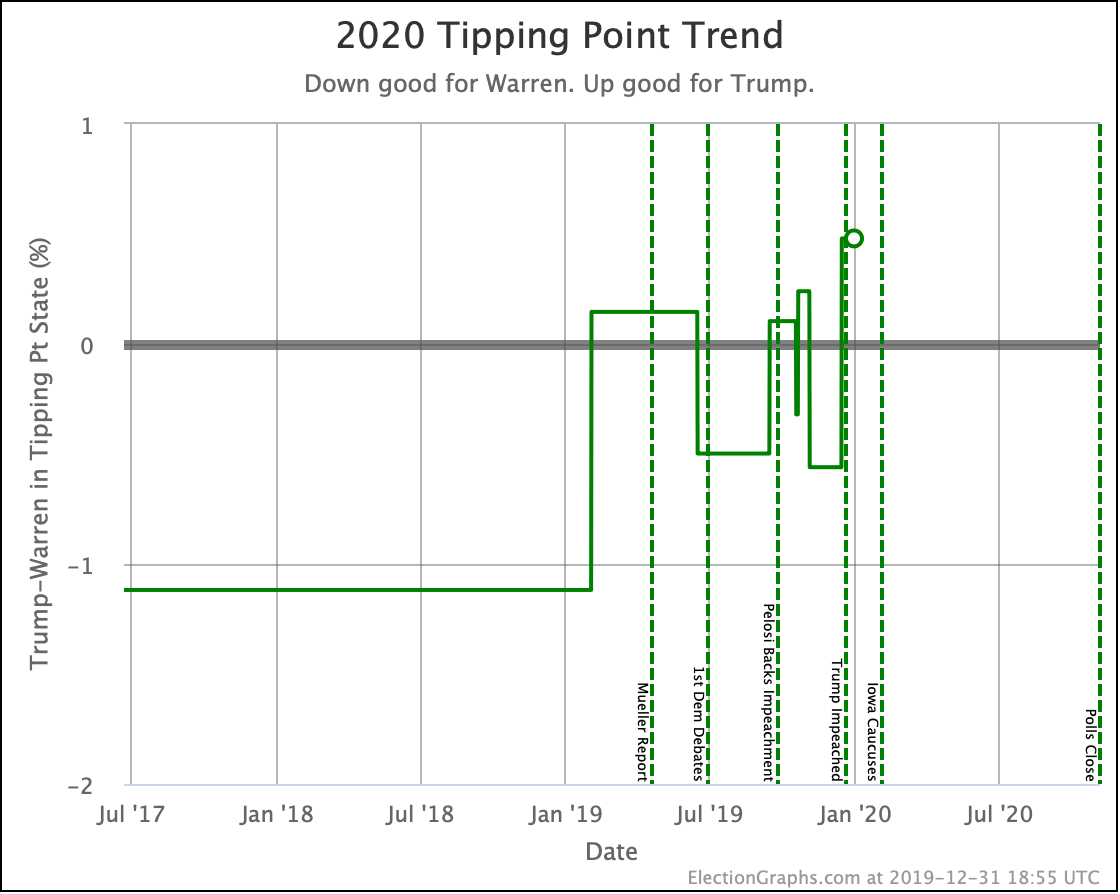
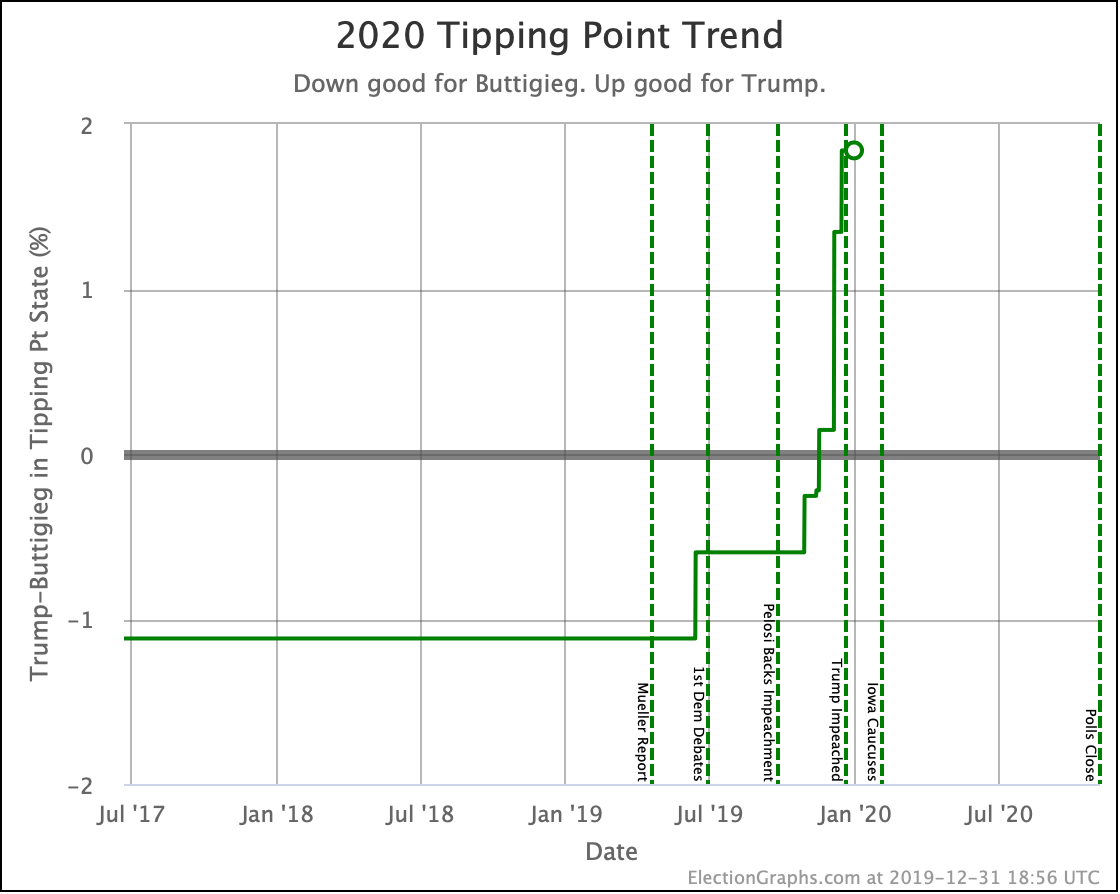
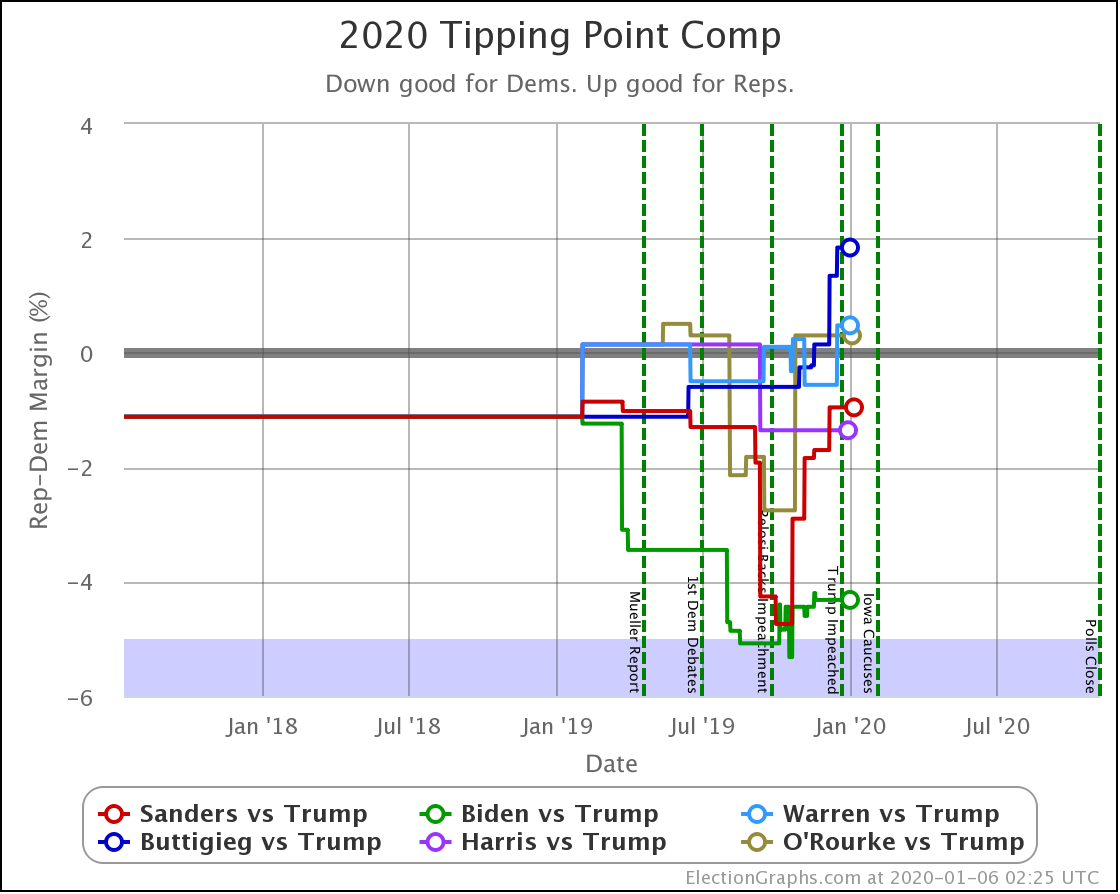
| Dem | 16 Mar | 7 Apr | 𝚫 |
| Biden | +2.8% | +2.8% | Flat |
| Sanders | +1.4% | +0.5% | -0.9% |
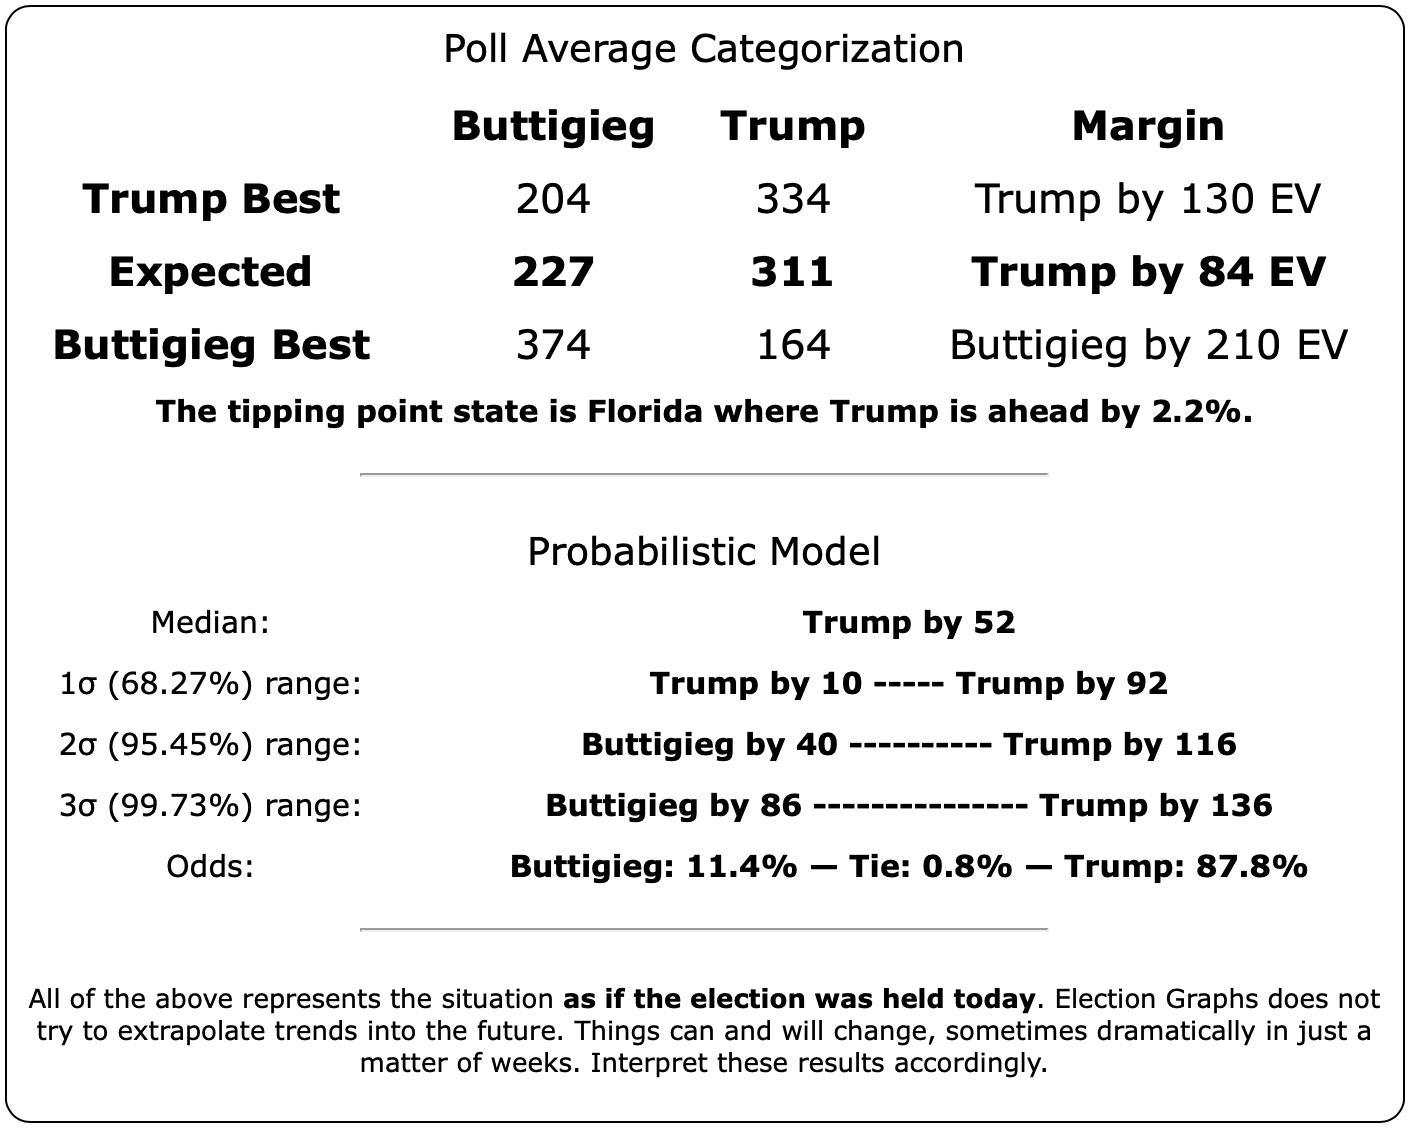
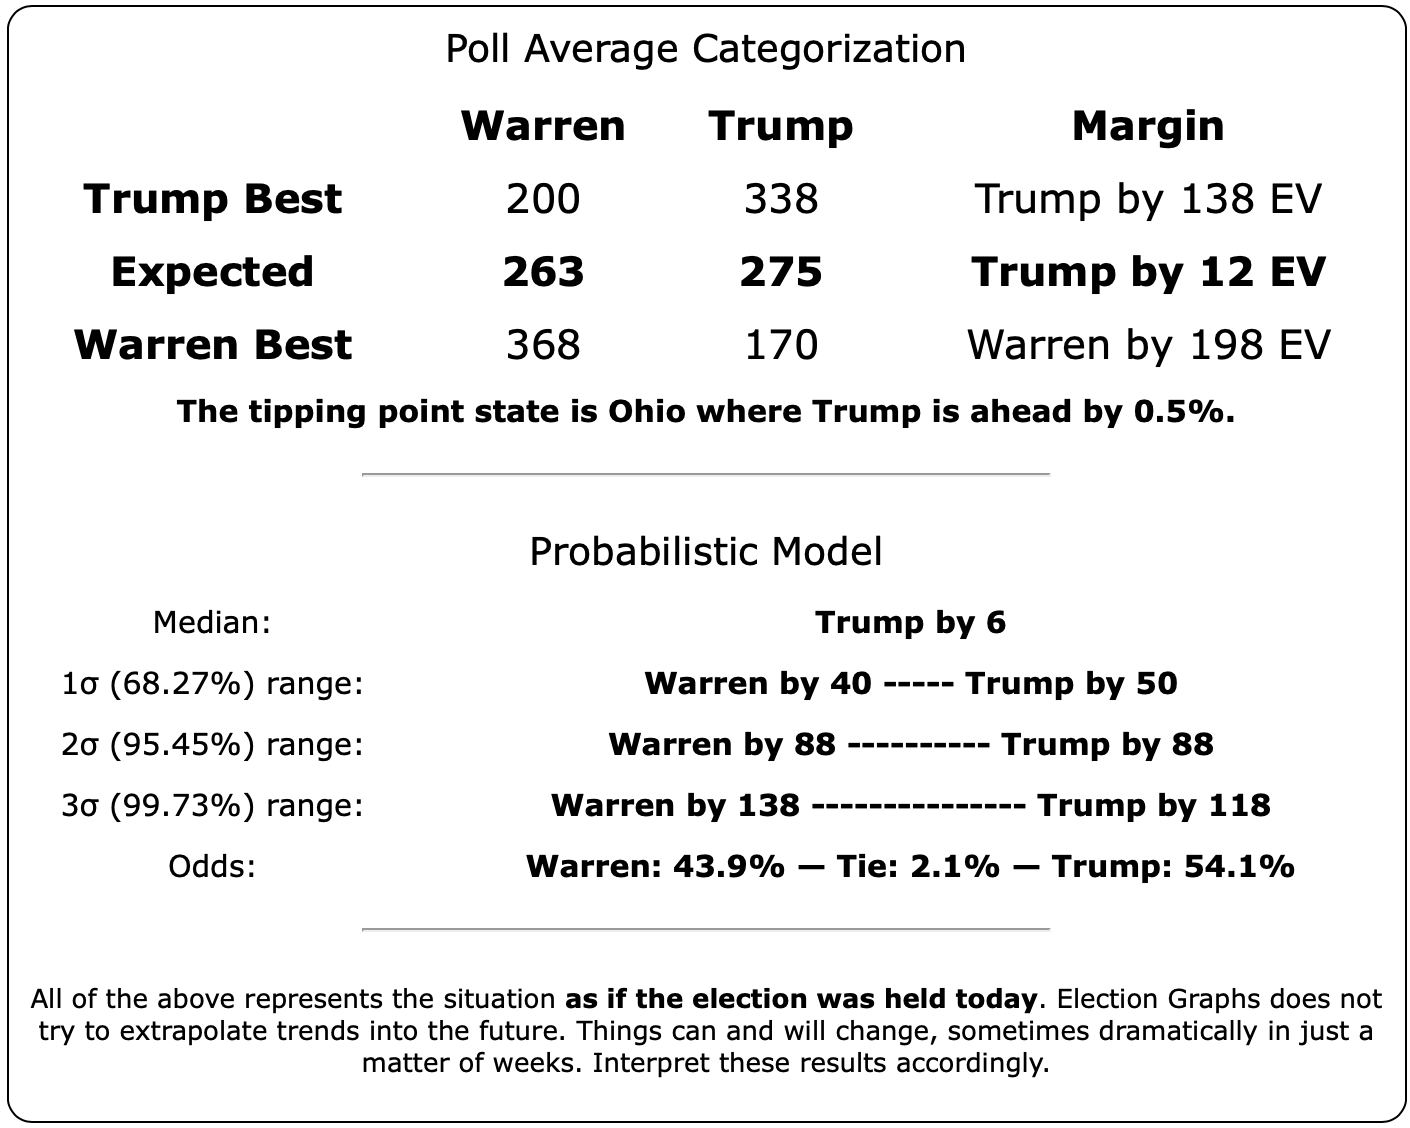
The tipping point is the metric we use to understand how big a change it would take to flip the winner.
Three weeks ago Sanders's tipping point was only 1.4%. So a very small shift in the critical states would be enough to put Trump in the lead nationally. The last three weeks provided more than half of that shift.
Sanders now teeters on the edge of losing his overall lead to Trump. Sanders winning against Trump now relies on an incredibly slim 0.5% lead in the poll average in Ohio. A tiny movement in one state would result in a Trump win.
Of course, it seems like maybe the 56.1% chance of winning reflects that. That leaves a 42.0% chance of a Trump win (and a 1.9% chance of a tie). But no, that only reflects the chance of a Trump win given that Sanders leads Ohio by 0.5% and his margins in all the other states. We don't try to estimate the chances of moves in the polls in one direction or the other.
So what about Biden's 96.2% chance of winning? How secure is that?
Not very. The tipping point is only 2.8%.
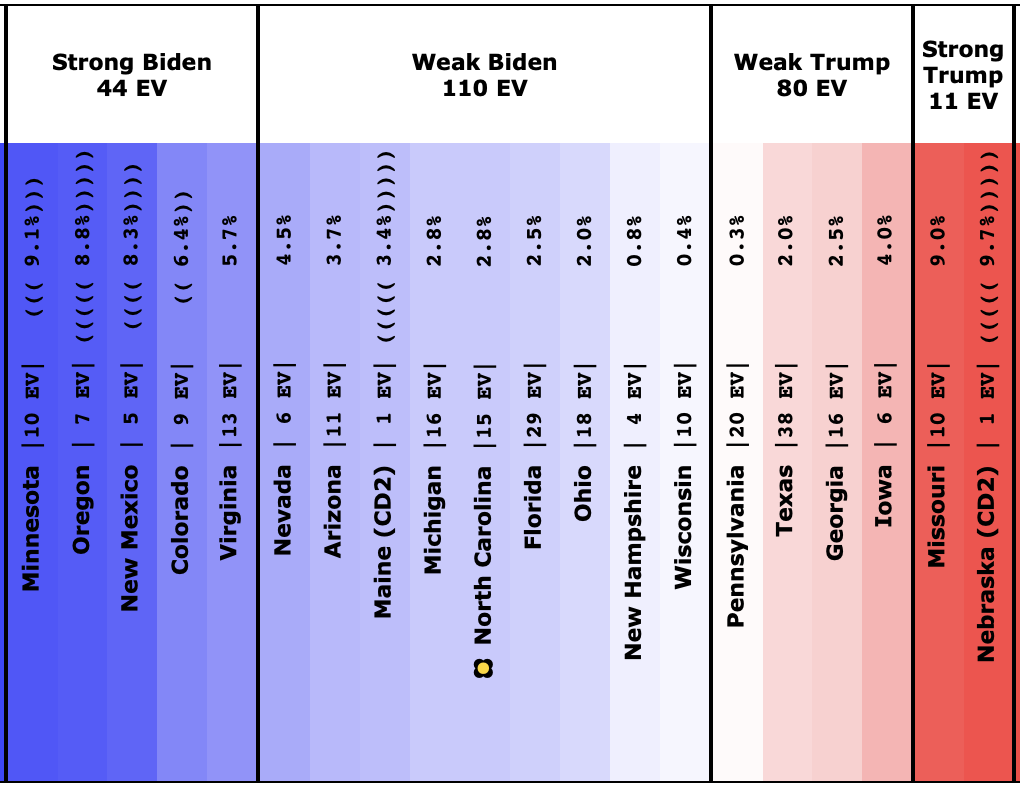
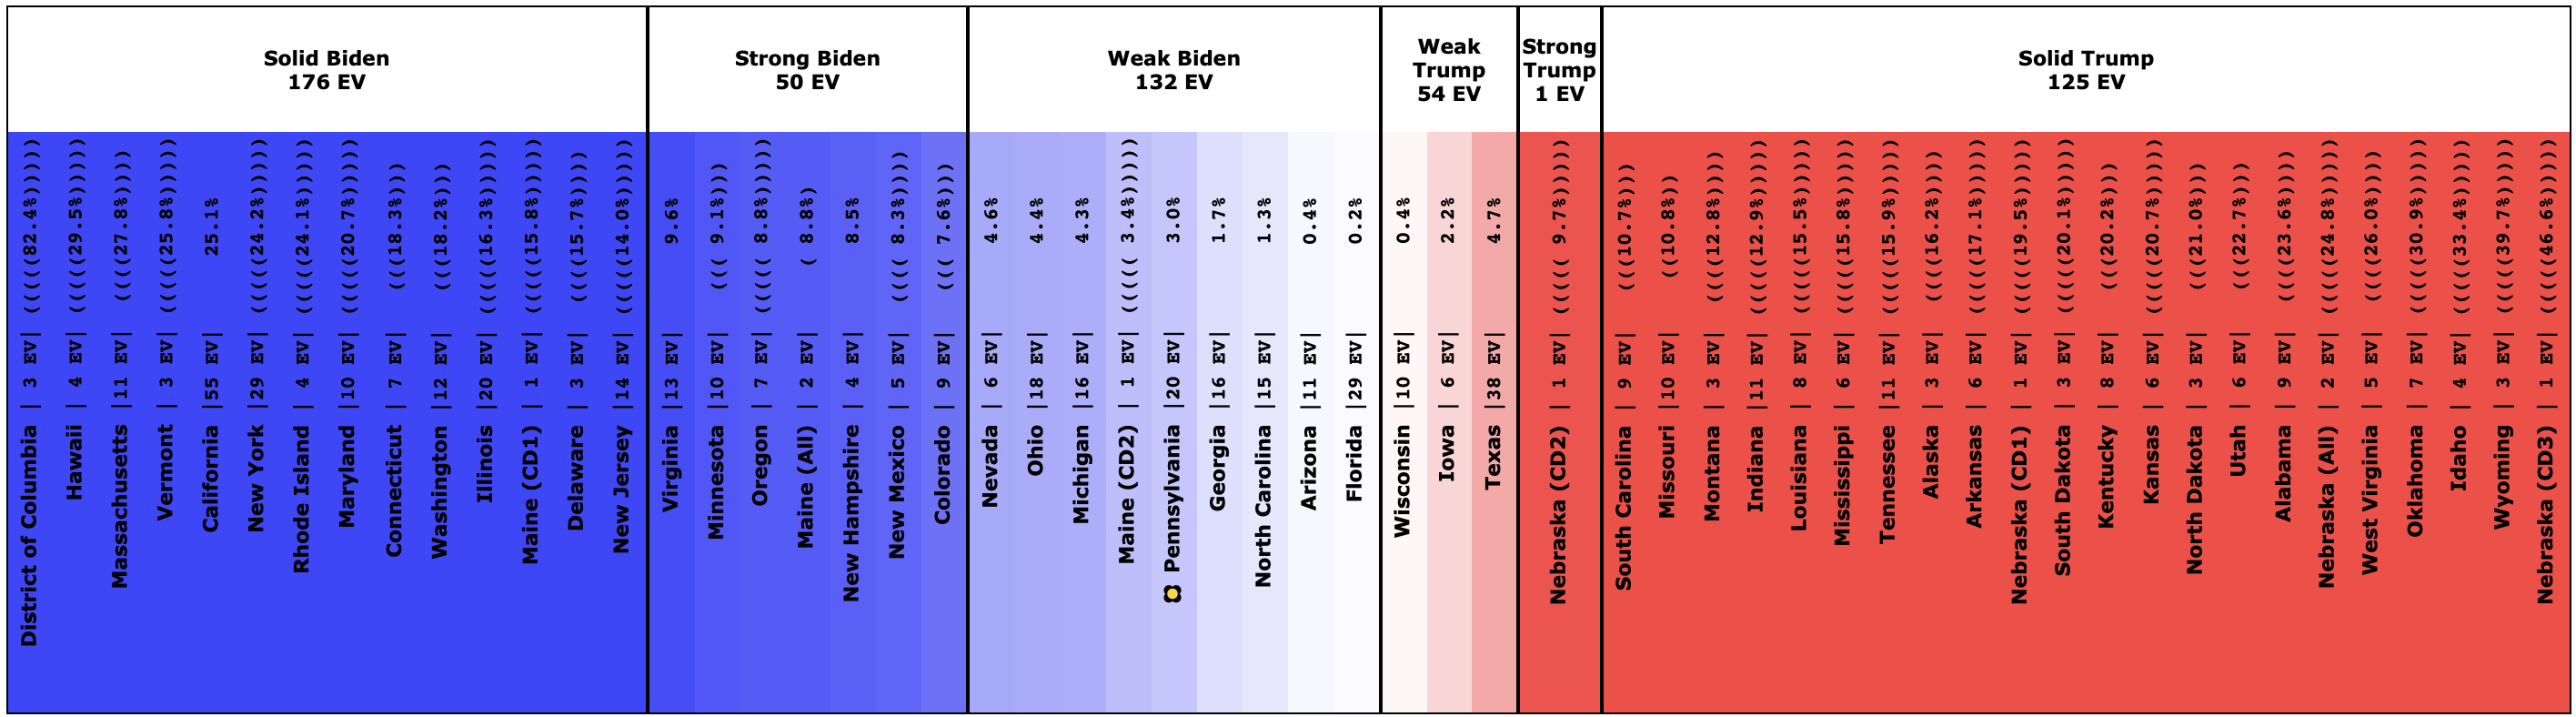
Looking at the specific states, it is not just one state that has to flip like the Sanders case. Instead, five states have to flip to the Trump side to change the winner. Which seems like a lot.
But the margins are really small. All of these states are super close. Biden leads, but barely. If the polls were like this on election day, Biden would very likely win. That's what the 96.2% represents.
But there is a long way to go between now and election day.
210.2 days until polls start to close.
For more information:
This post is an update based on the data on the Election Graphs Electoral College 2020 page. Election Graphs tracks a poll-based estimate of the Electoral College. The charts, graphs, and maps in the post above are all as of the time of this post. Click through on any image for current interactive versions of the chart, along with additional details.
Follow @ElectionGraphs on Twitter or Election Graphs on Facebook to see announcements of updates. For those interested in individual poll updates, follow @ElecCollPolls on Twitter for all the polls as I add them. If you find the information in these posts informative or useful, please consider visiting the donation page.