Time for another blog update. As always, if you are impatient for one of these updates, the 2020 pages on Election Graphs are updated nearly every day as new polls come in.
The last update here was 10 days ago on August 25th. If you didn't notice it at the time, please check that last post for a CORRECTION I added on the 26th. The fixes mentioned on that correction are the baseline used here, rather than the originally posted numbers.
Here are the high-level changes since that last post:
| Model | Metric | 25 Aug | 5 Sep | 𝚫 |
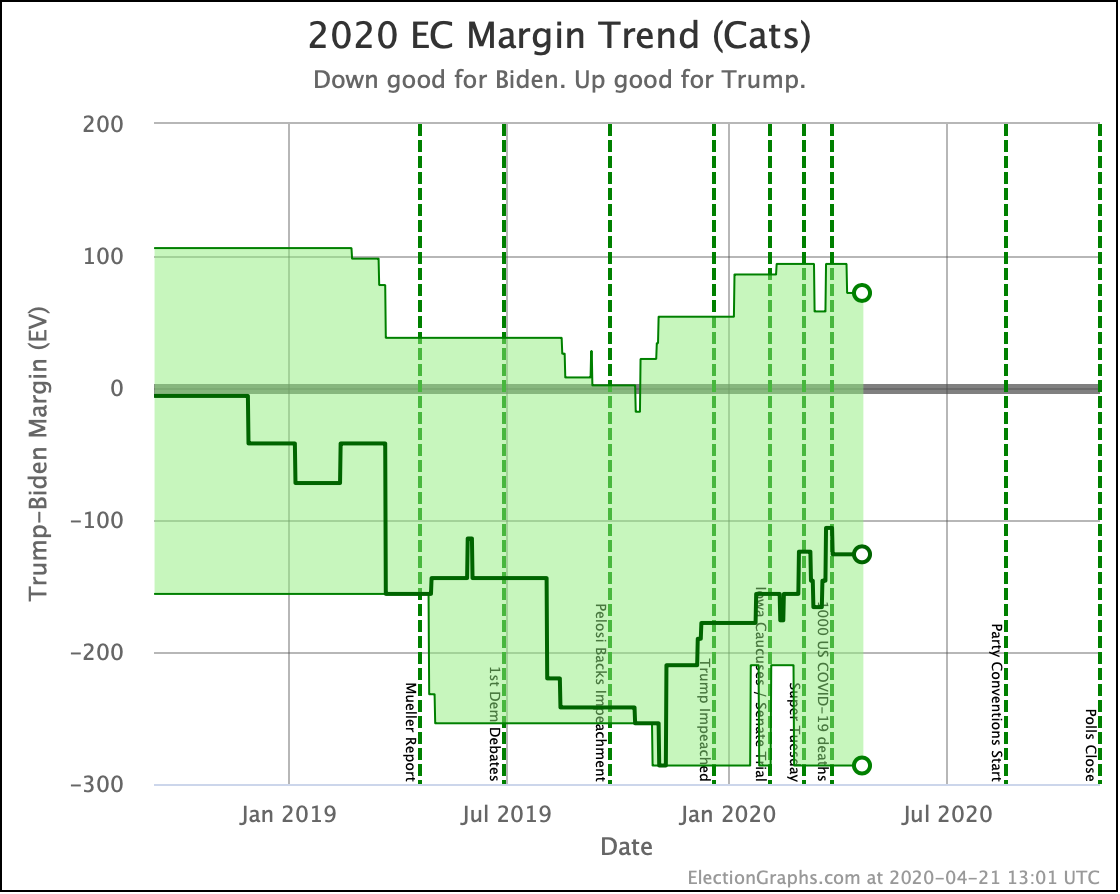
| Categories | Trump Best Expected Biden Best |
Biden +6 Biden +146 Biden +288 |
TIED Biden +220 Biden +288 |
Trump +6 Biden +74 FLAT |
| Tipping Point | Biden +6.0% | Biden +3.3% | Trump +2.7% | |
| Probabilities | Trump 2σ Median Biden 2σ |
Biden +50 Biden +148 Biden +258 |
Biden +38 Biden +152 Biden +254 |
Trump +12 Biden +4 Trump +4 |
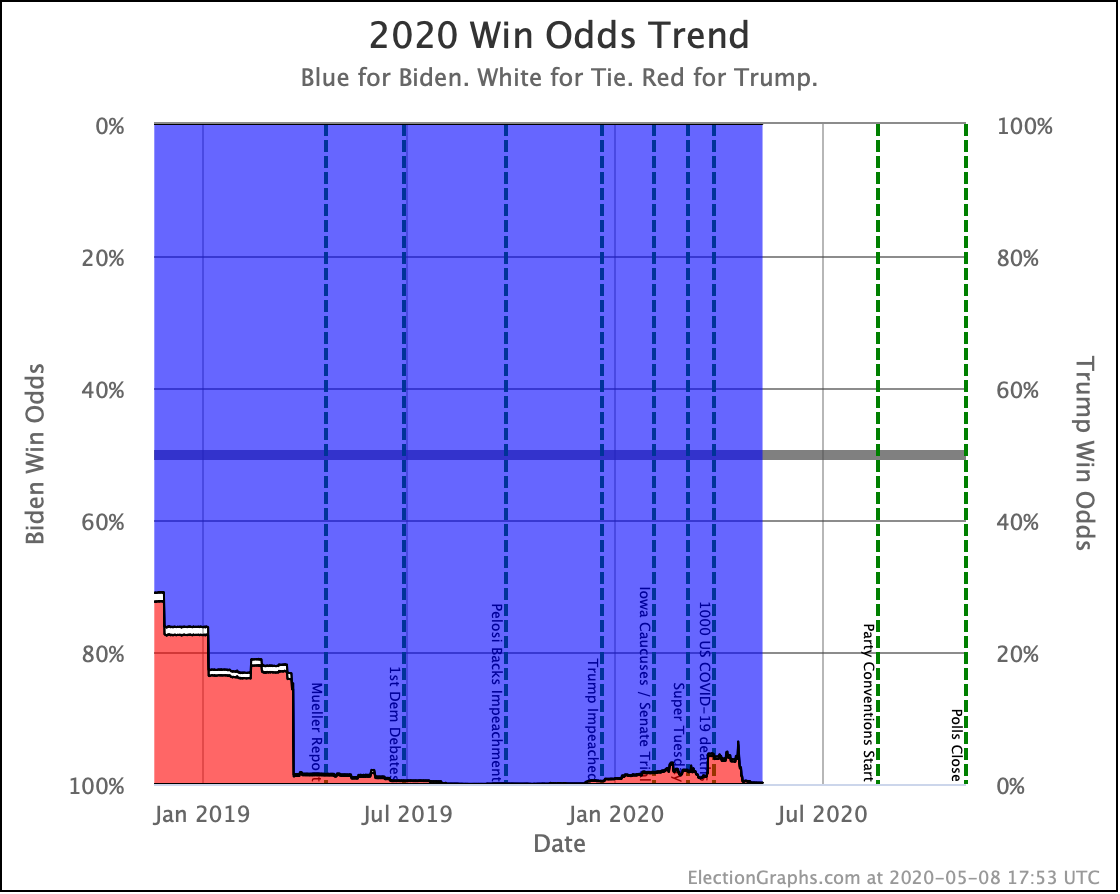
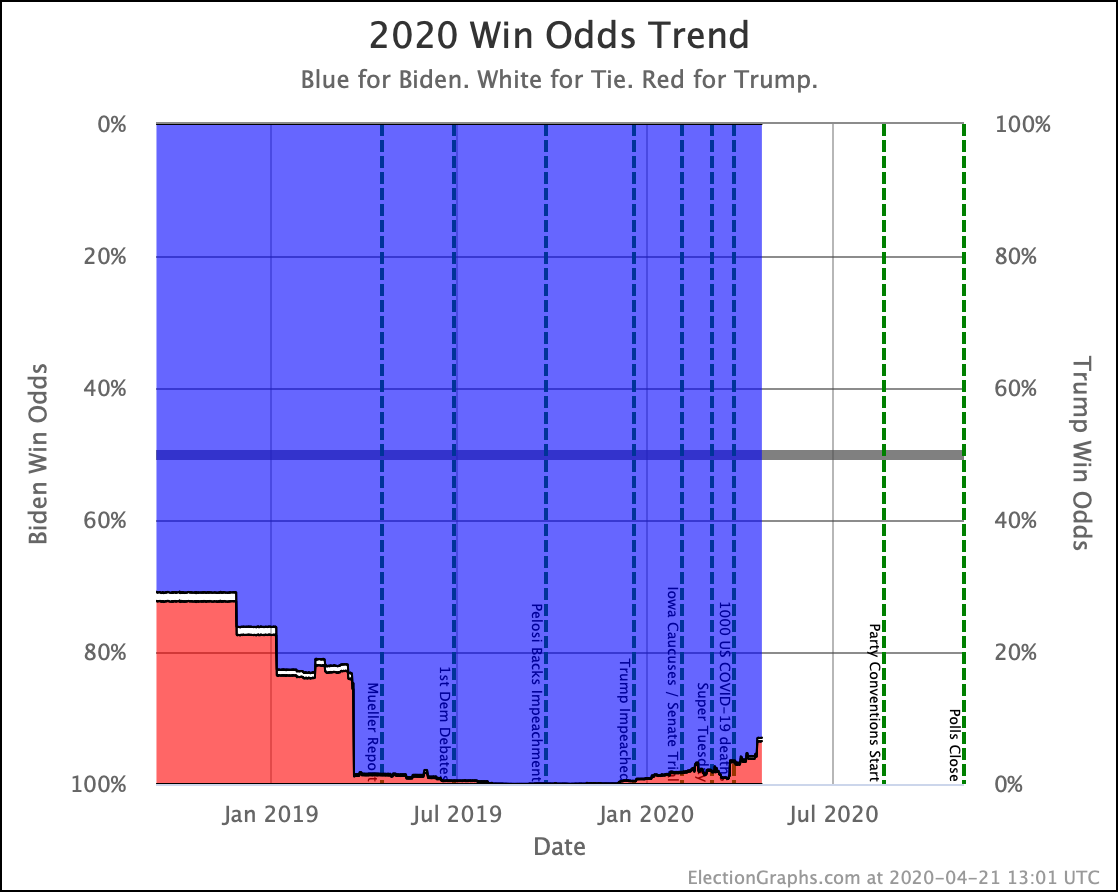
| Trump Win Tie Biden Win |
0.1% 0.0% 99.9% |
0.2% 0.1% 99.7% |
+0.1% +0.1% -0.2% |
This week's TL;DR: Biden is still significantly ahead, and if he wins every state where he leads the polls, he wins by a larger margin than before. However, he is has weakened in a lot of the close states, meaning Trump has more possible paths to a comeback than he did before, and Biden's lead is more precarious than it was.
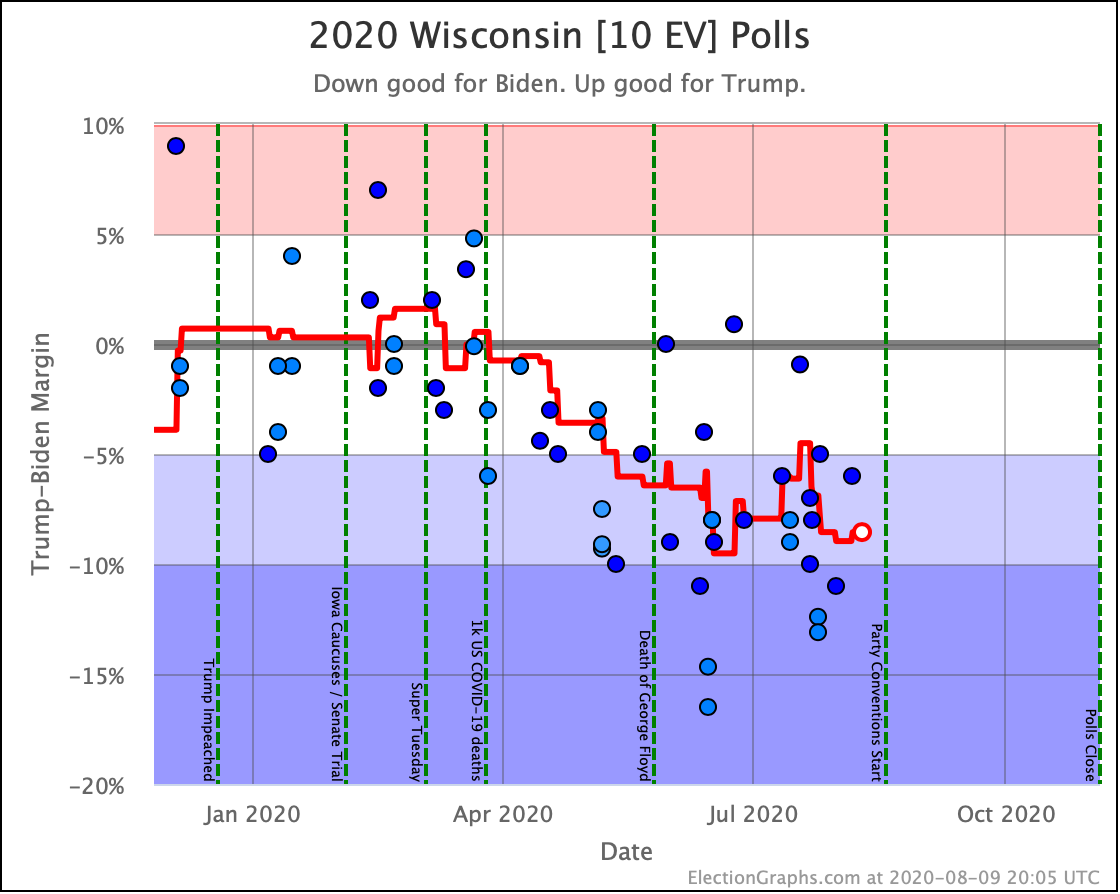
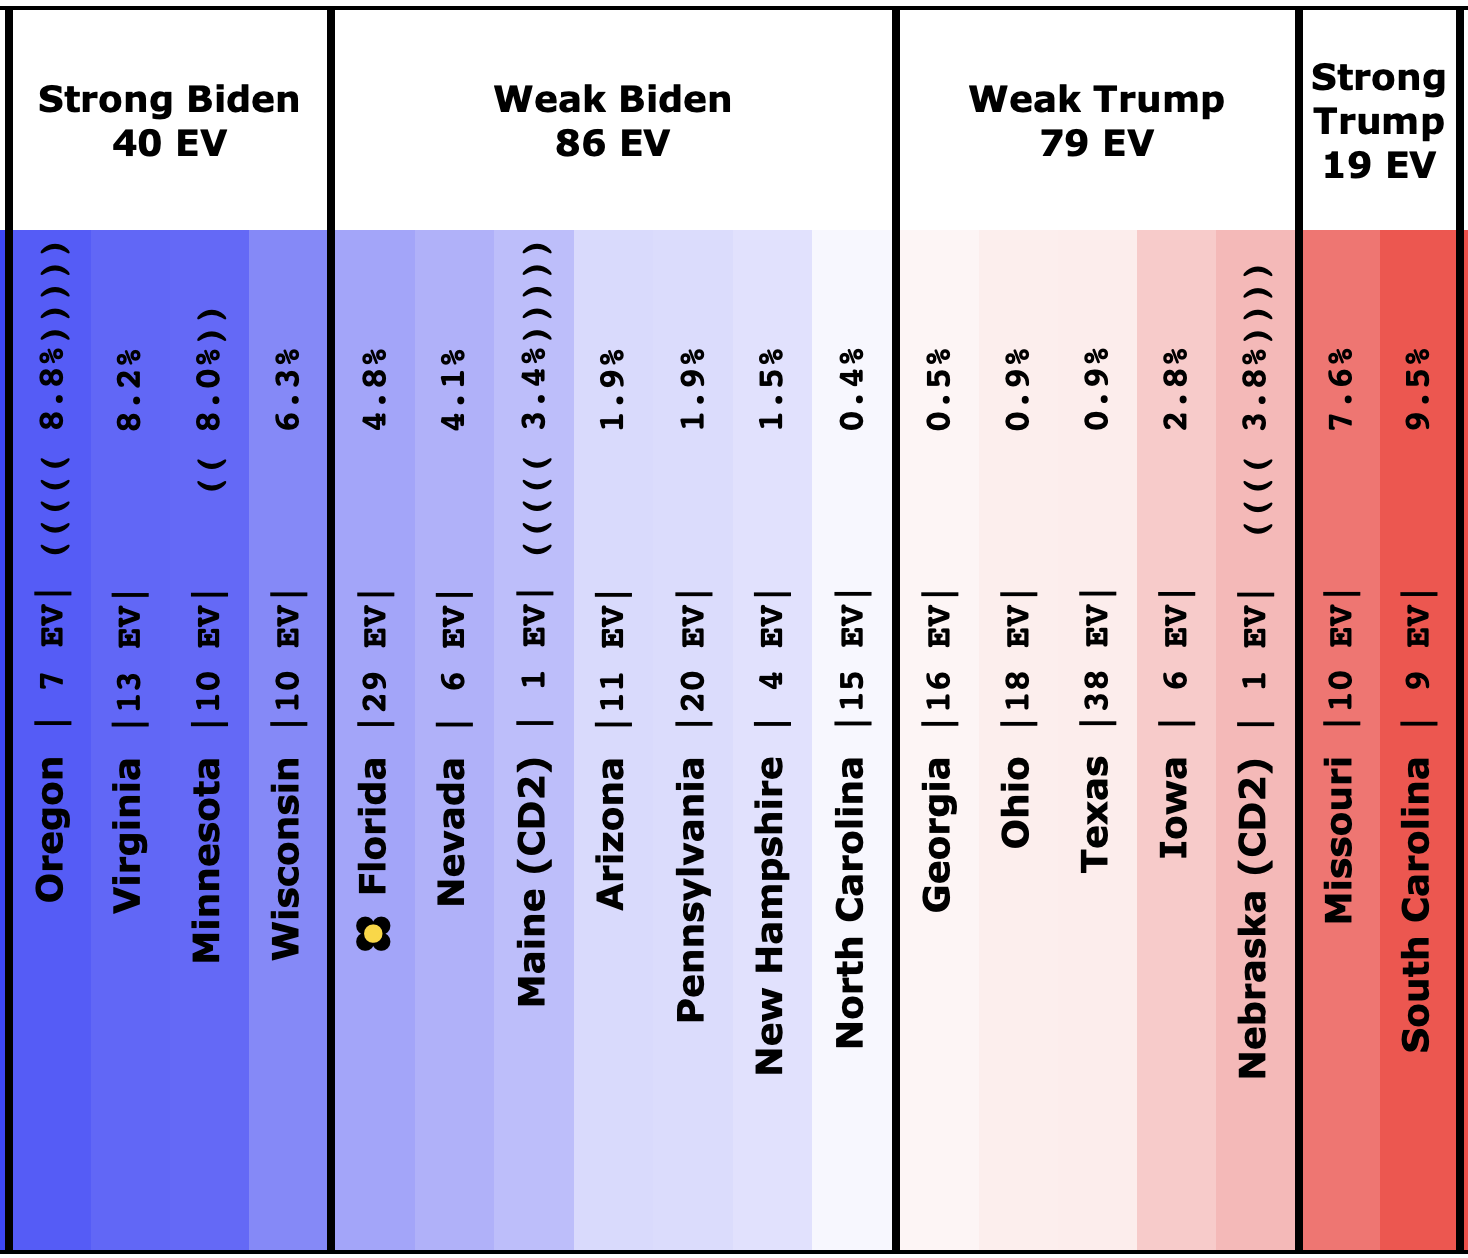
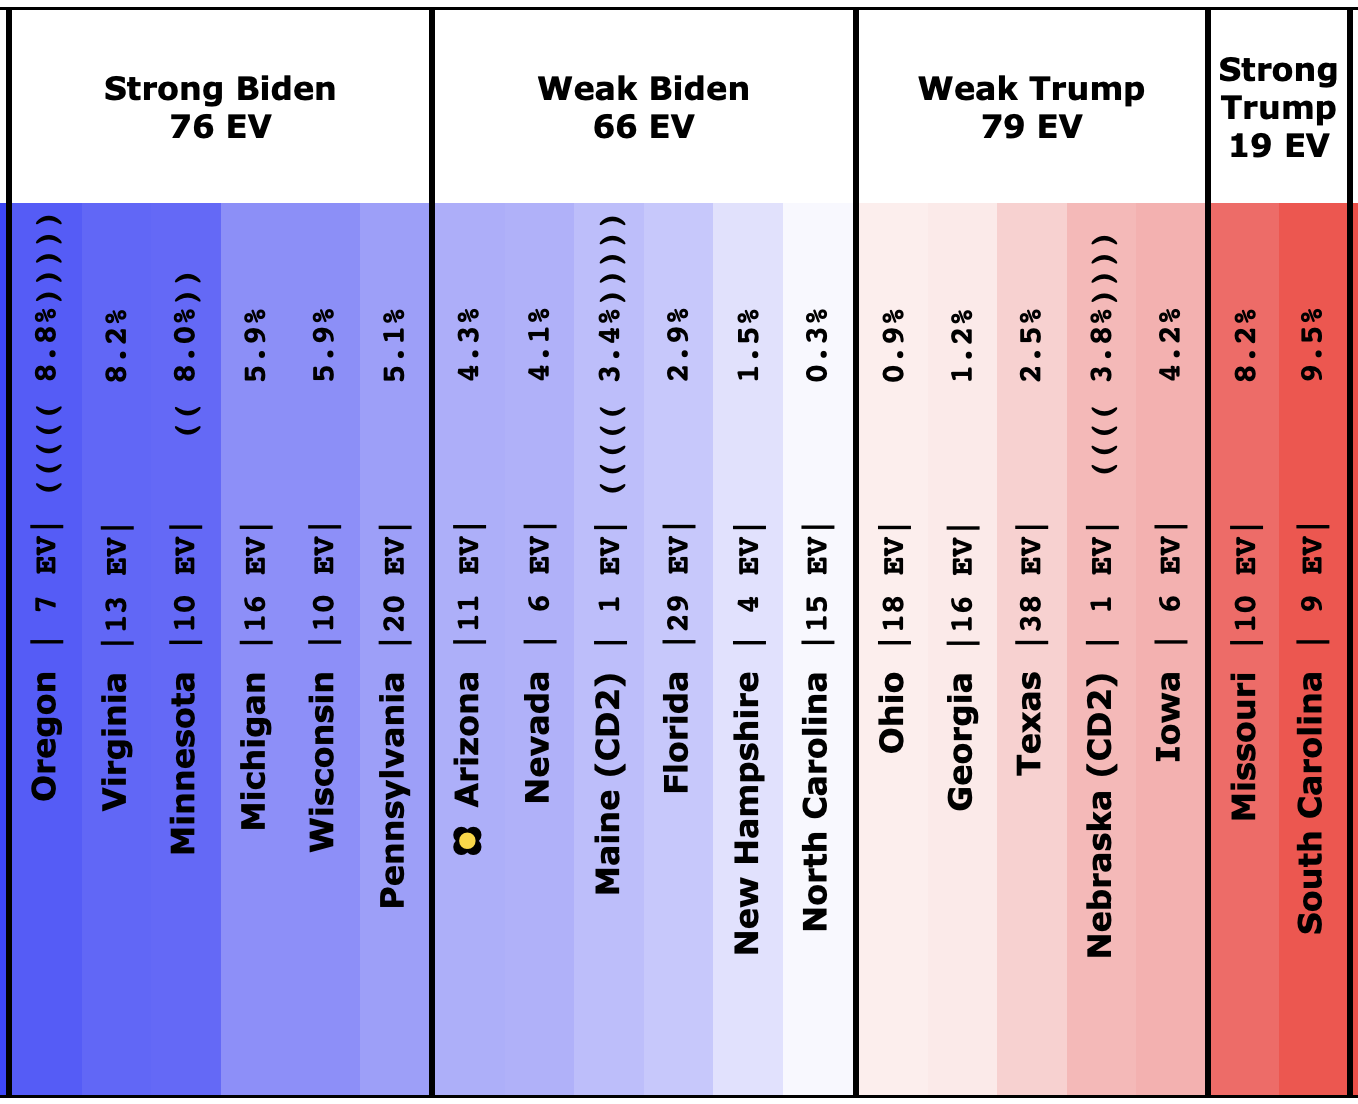
A bunch of states moved in and out of "Weak Biden" and "Weak Trump" in these 10 days, so let's look at those first:
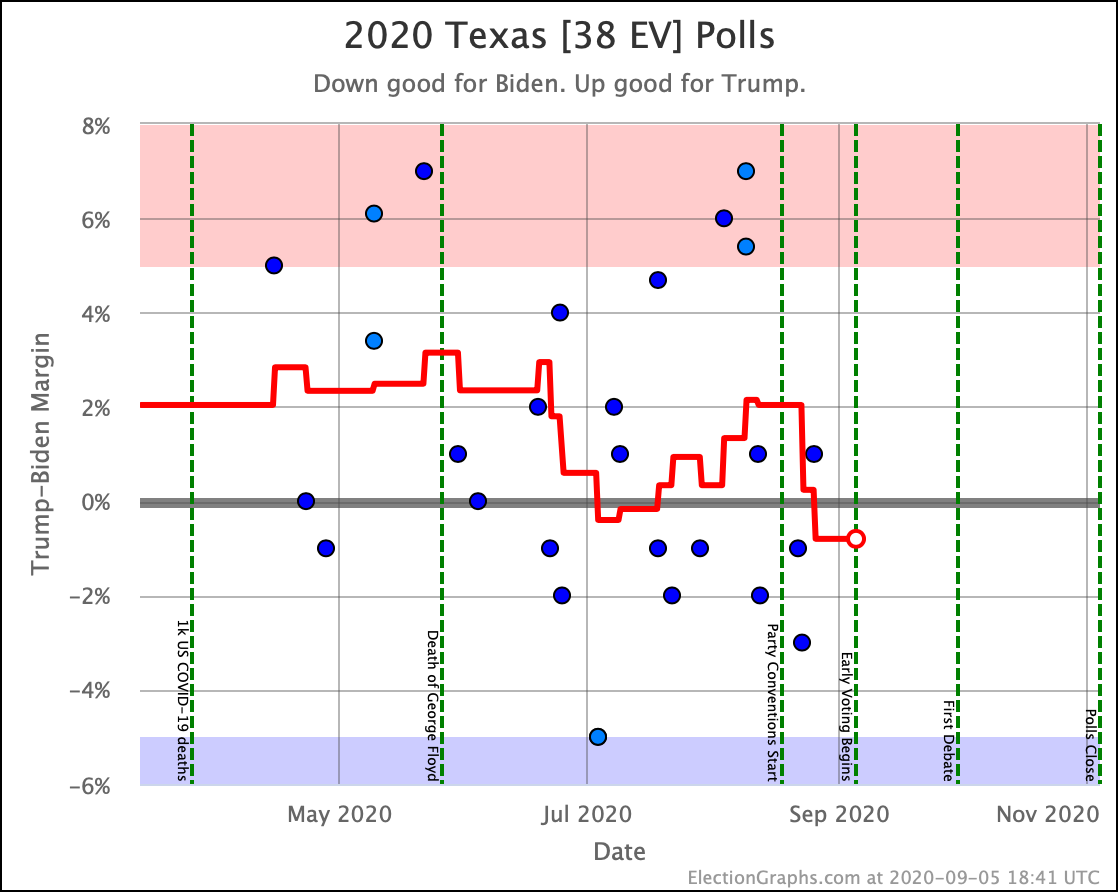
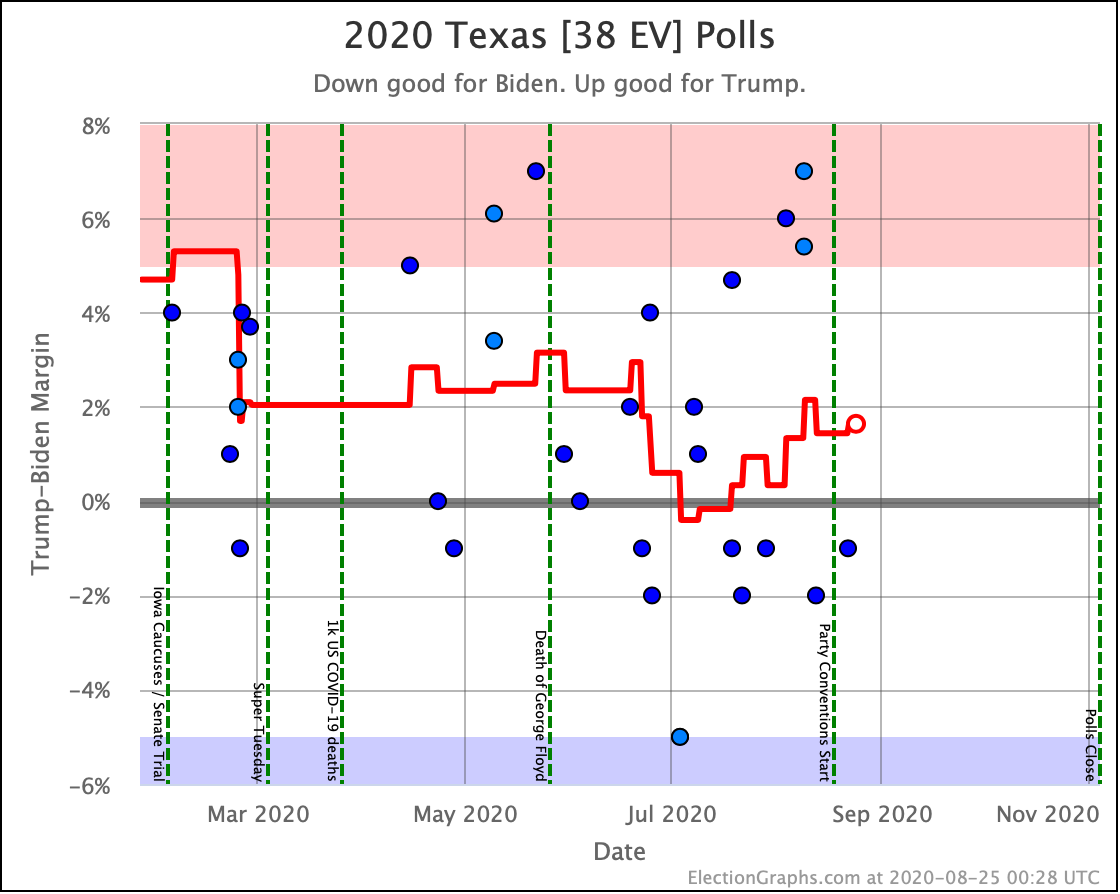
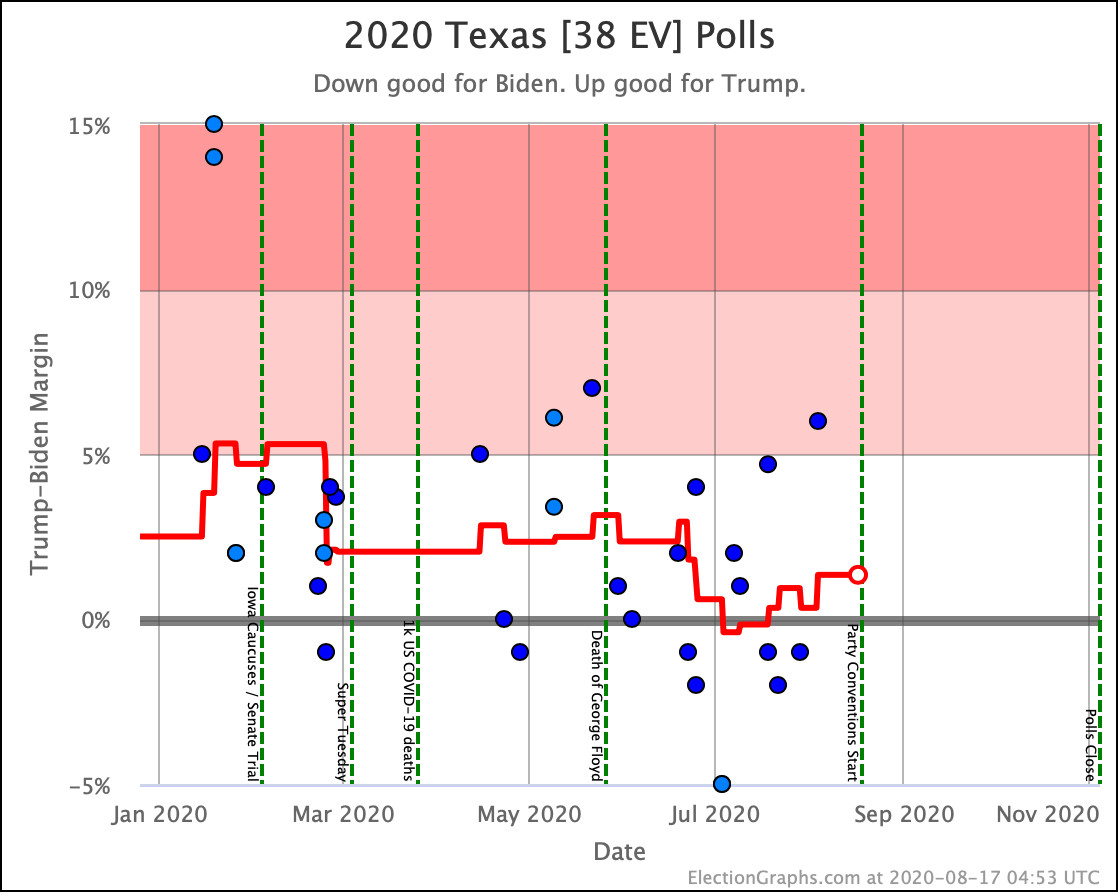
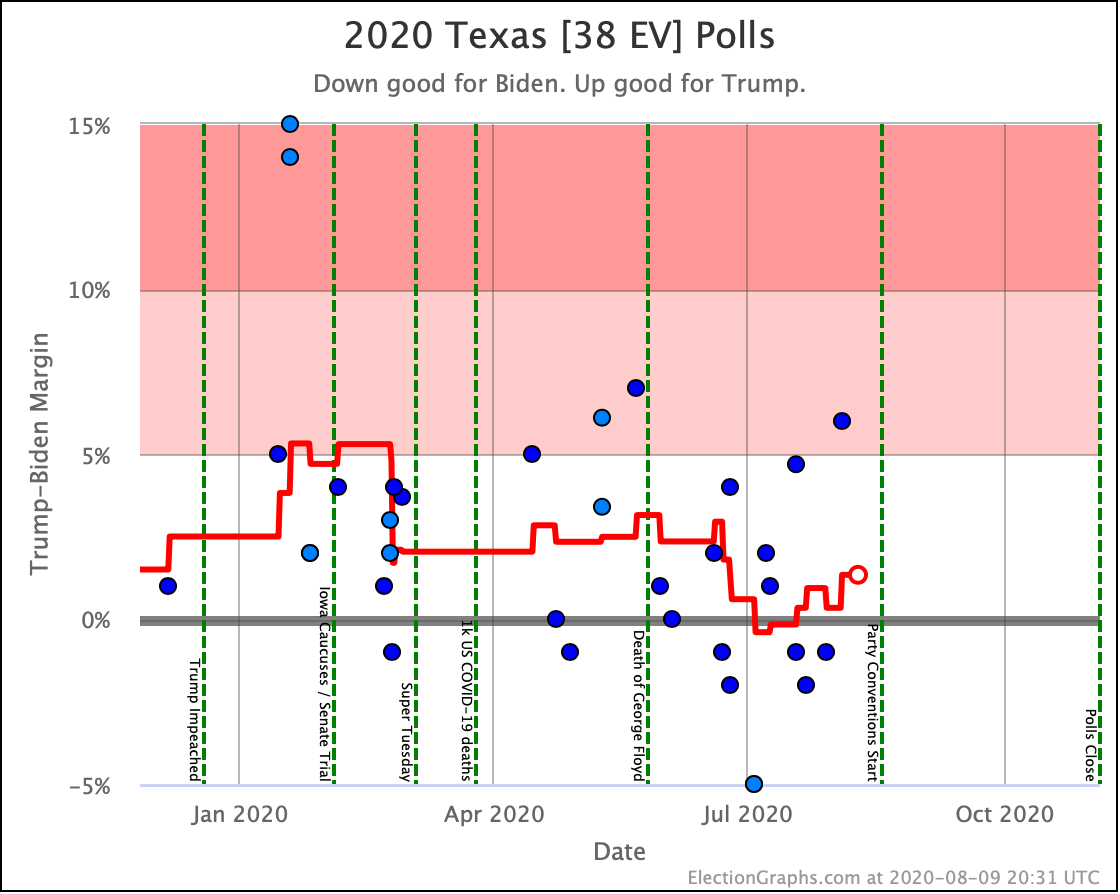
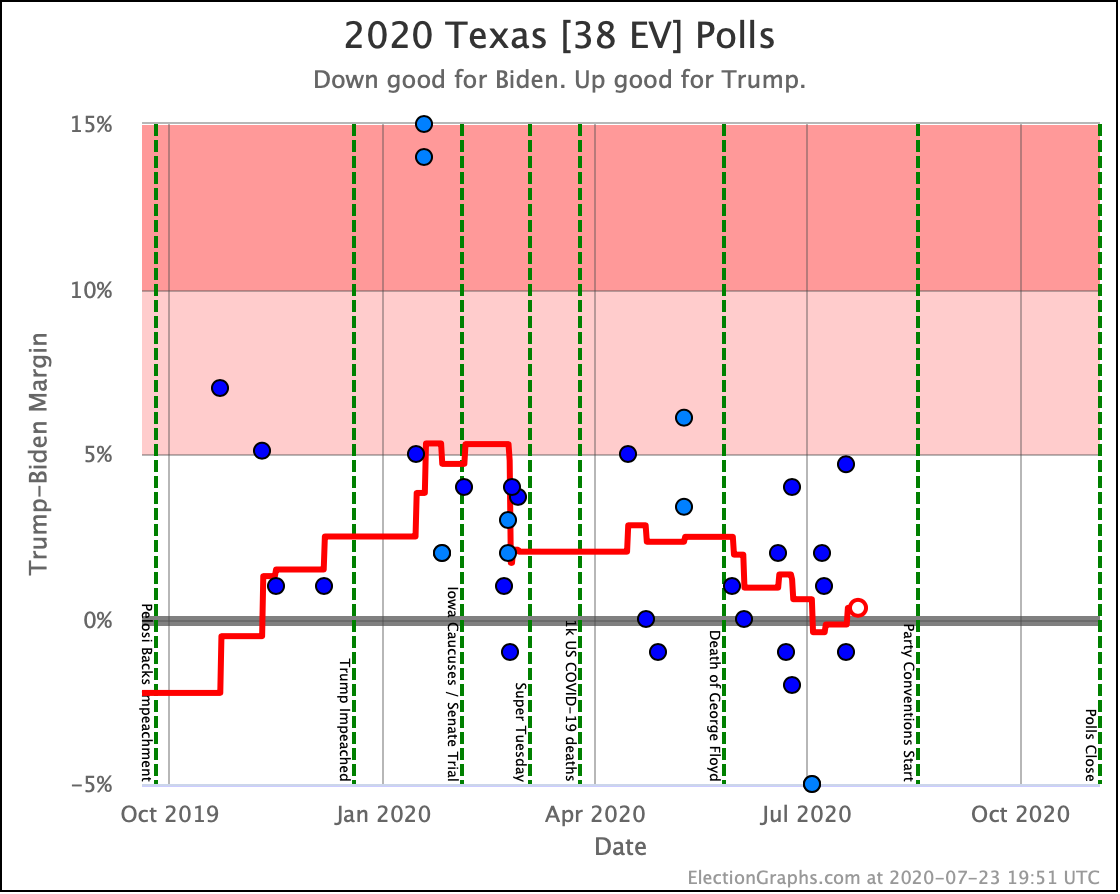
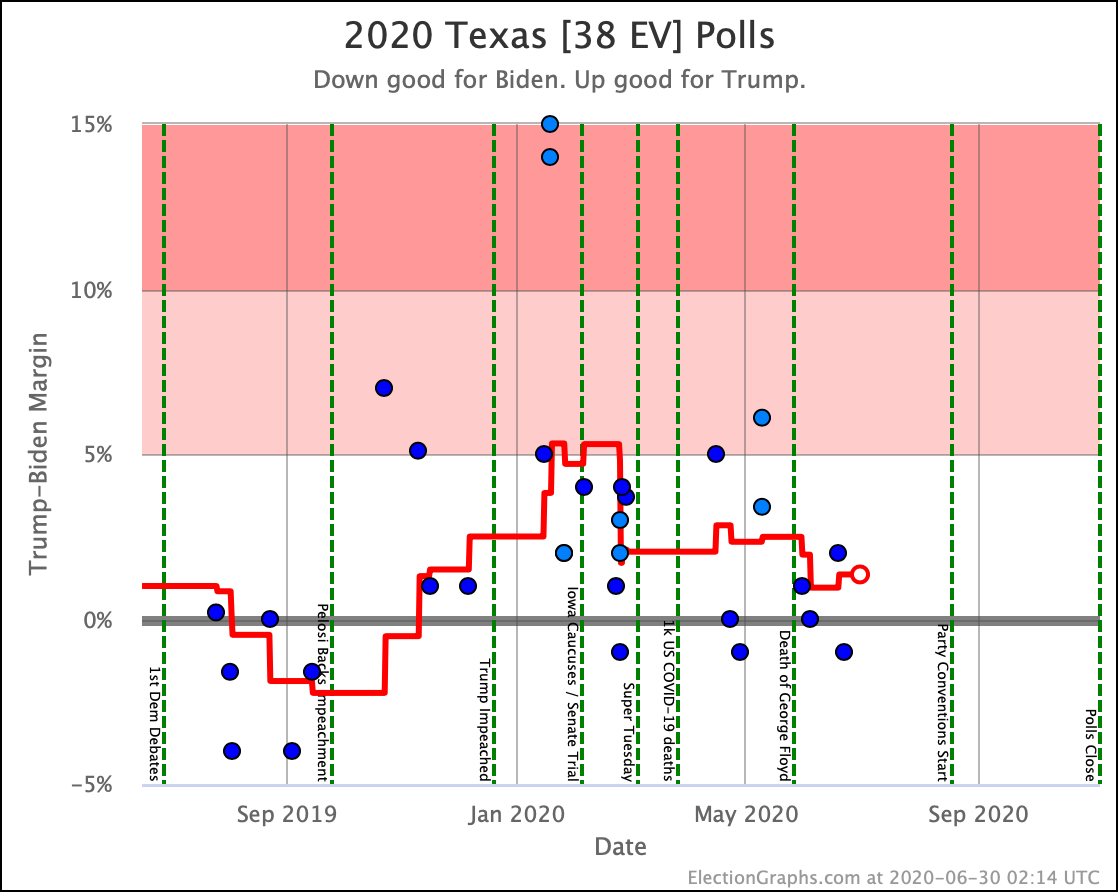
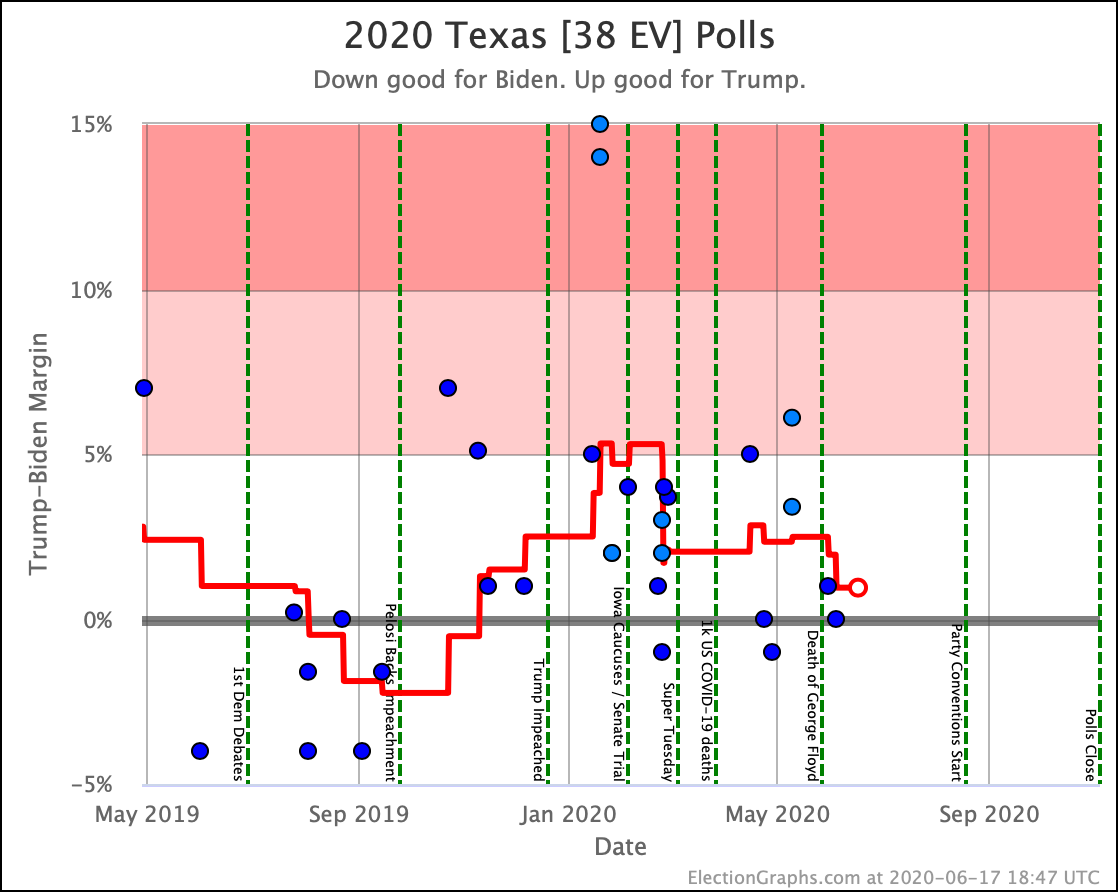
First up, Texas. The big one. The average in Texas has once again moved from just barely Trump, to just barely Biden. Biden now holds a thin 0.8% lead in our average. In terms of probabilities, we have it 54.2% Biden, 45.8% Trump. If the election was today.
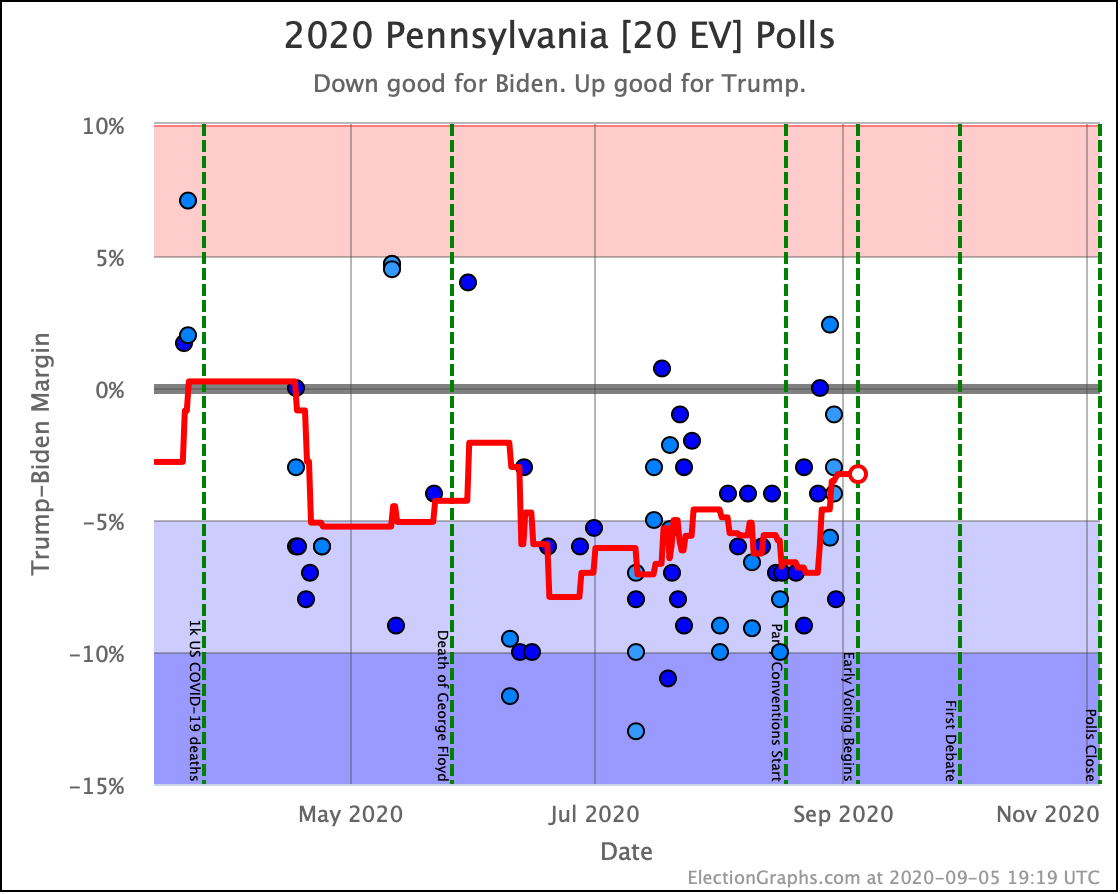
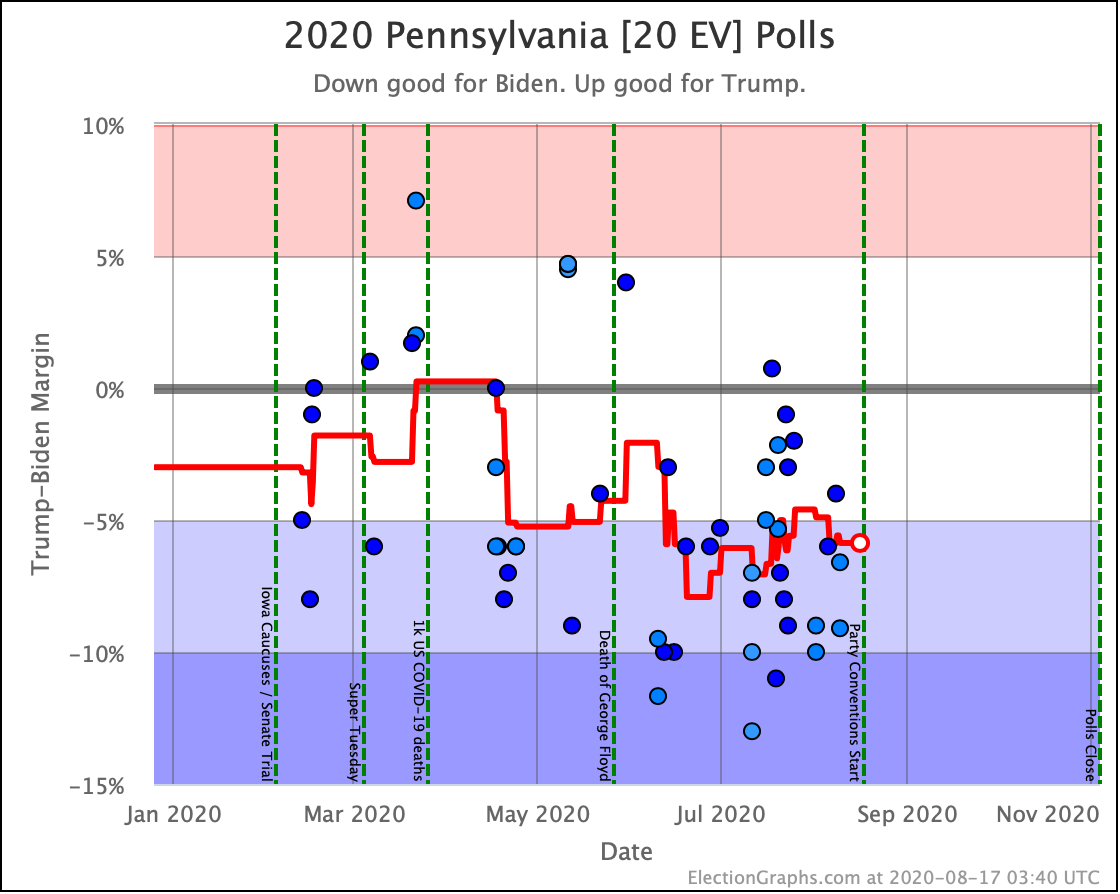
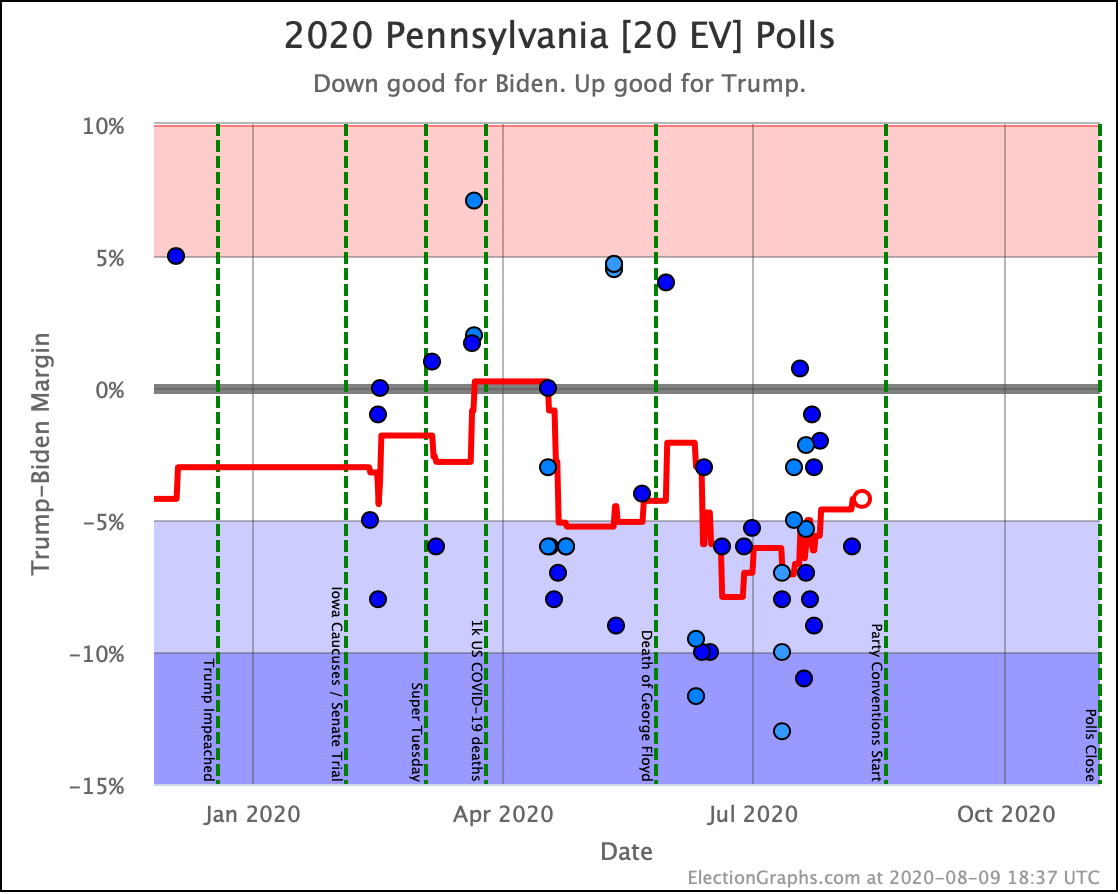
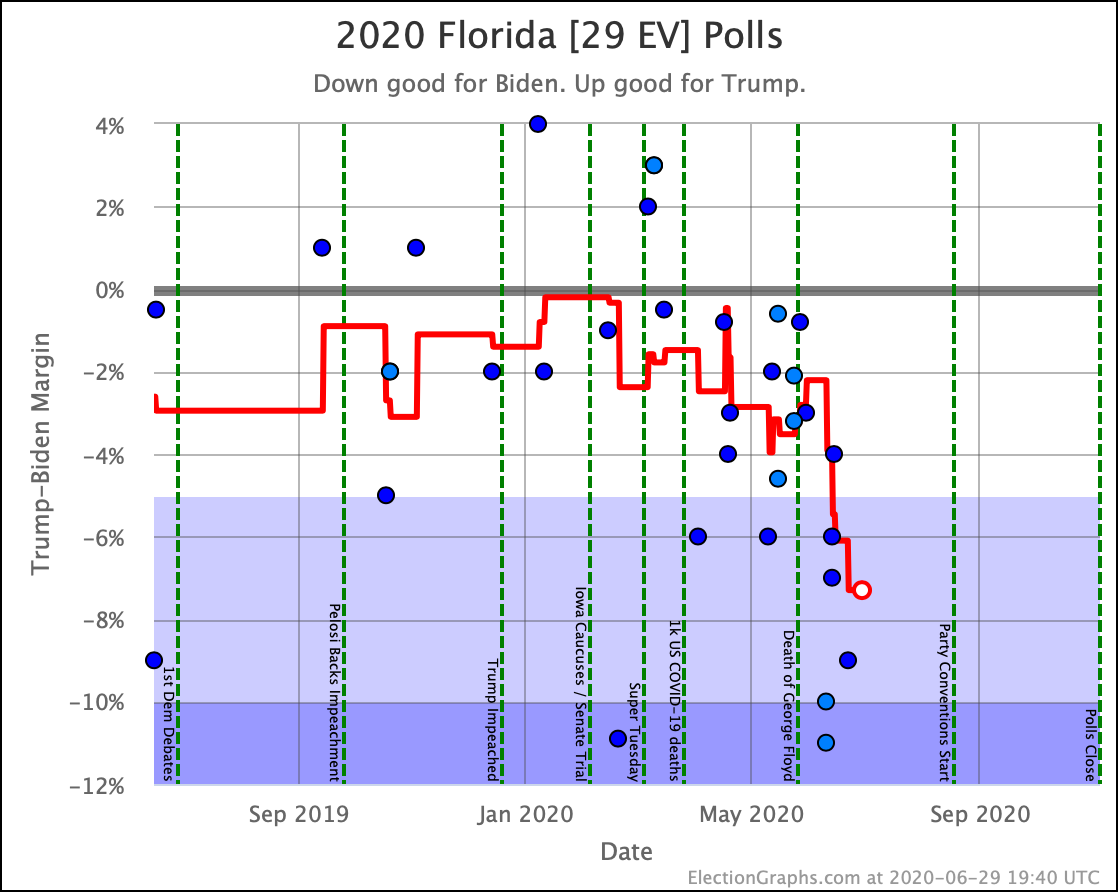
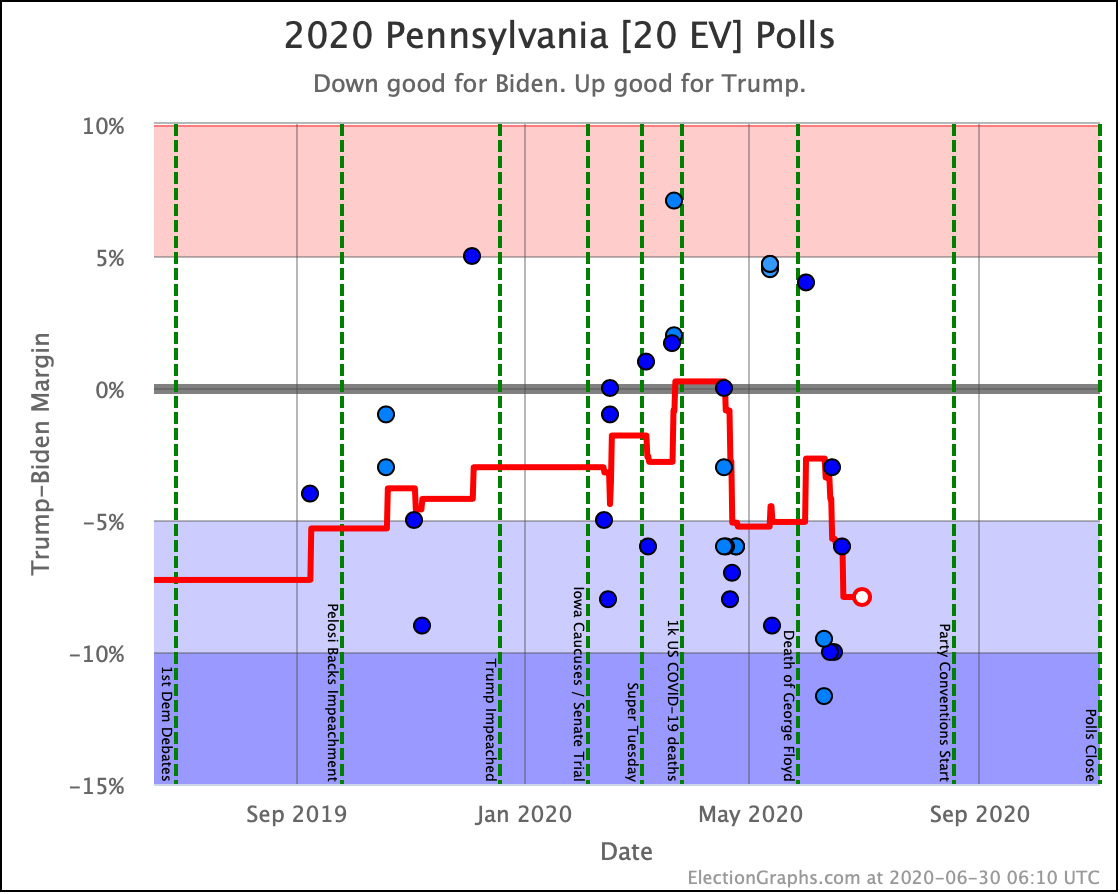
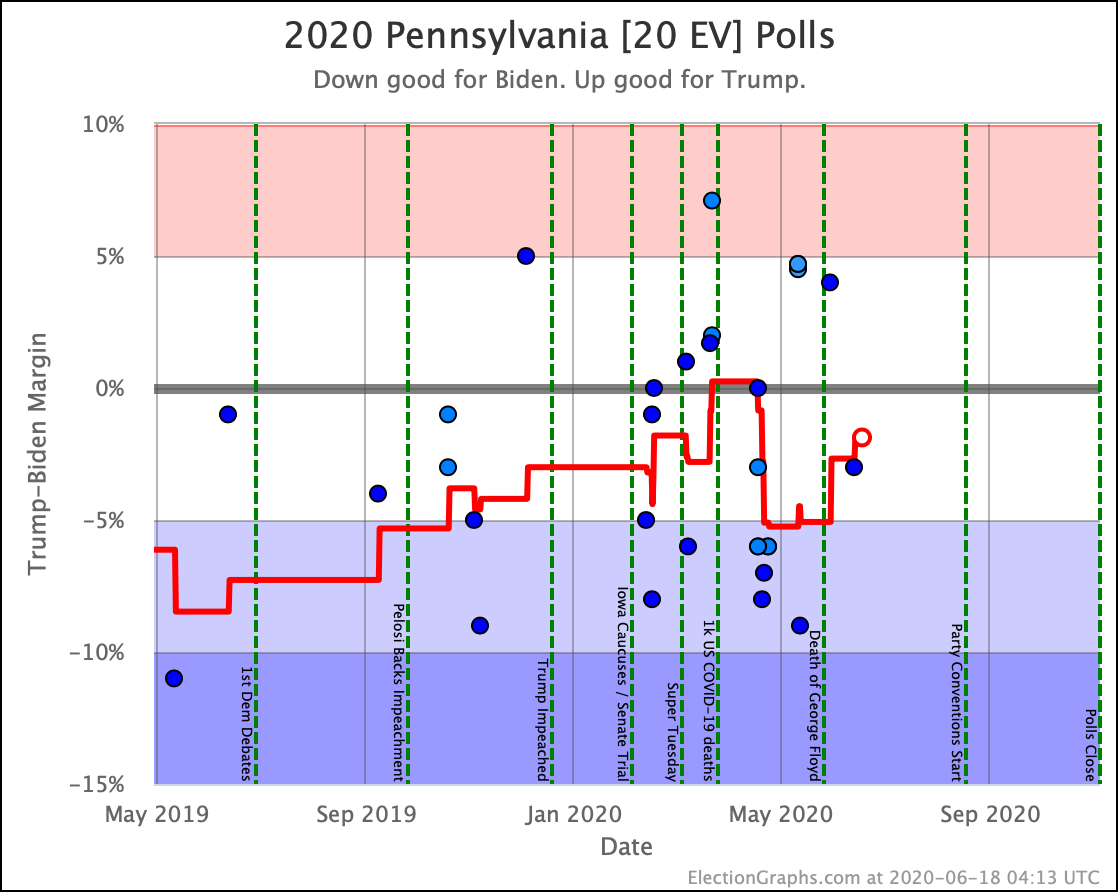
Then Pennsylvania. Biden had been looking pretty strong there, with a lead as high as 7.0% as recently as August 25th. But Trump has gained since then, and Biden's lead here has slipped to only 3.3%, which translates into a 79.4% chance of winning. But Trump winning Pennsylvania is back on the table as a reasonable possibility.
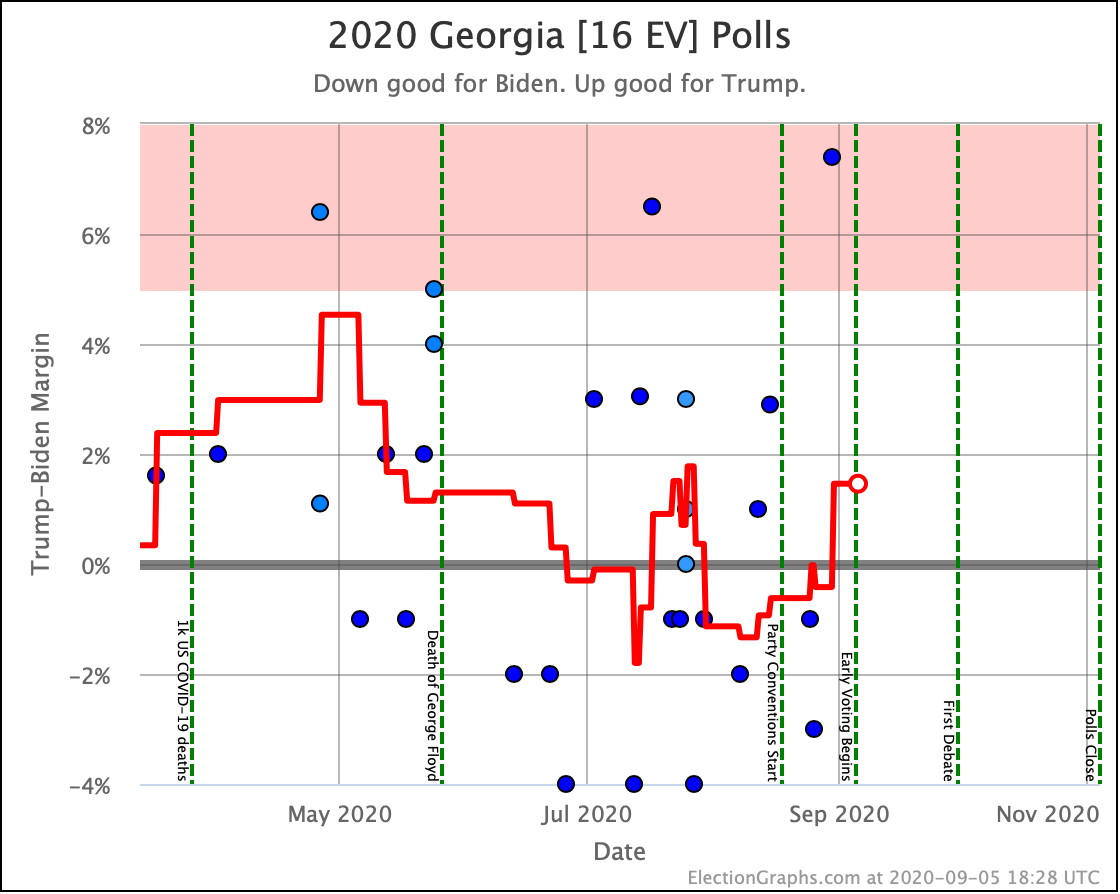
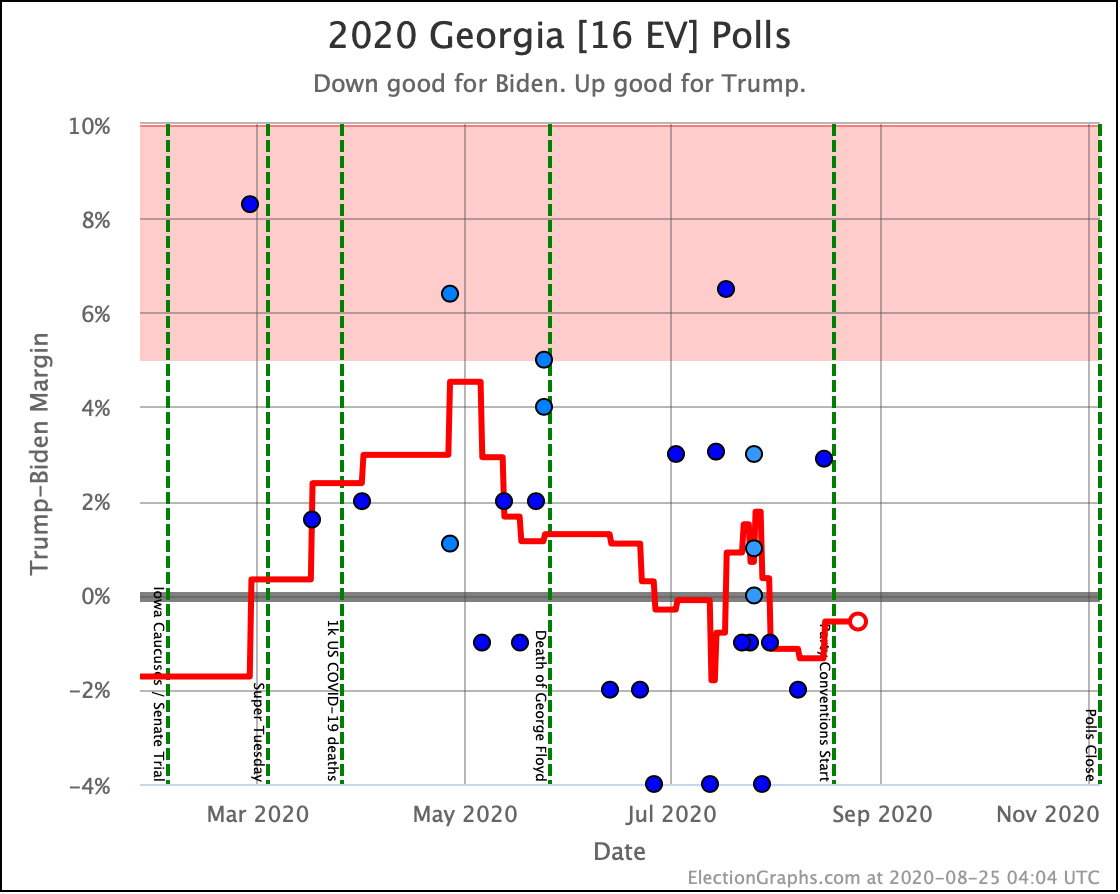
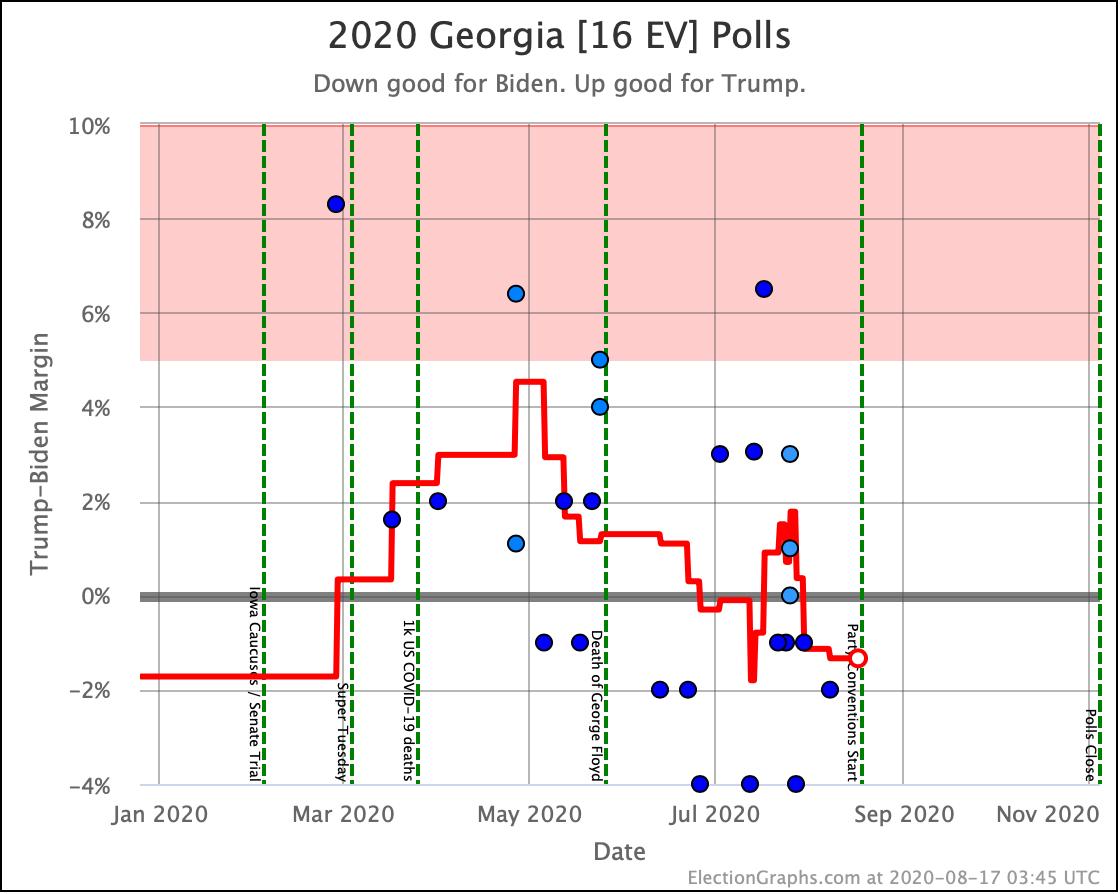
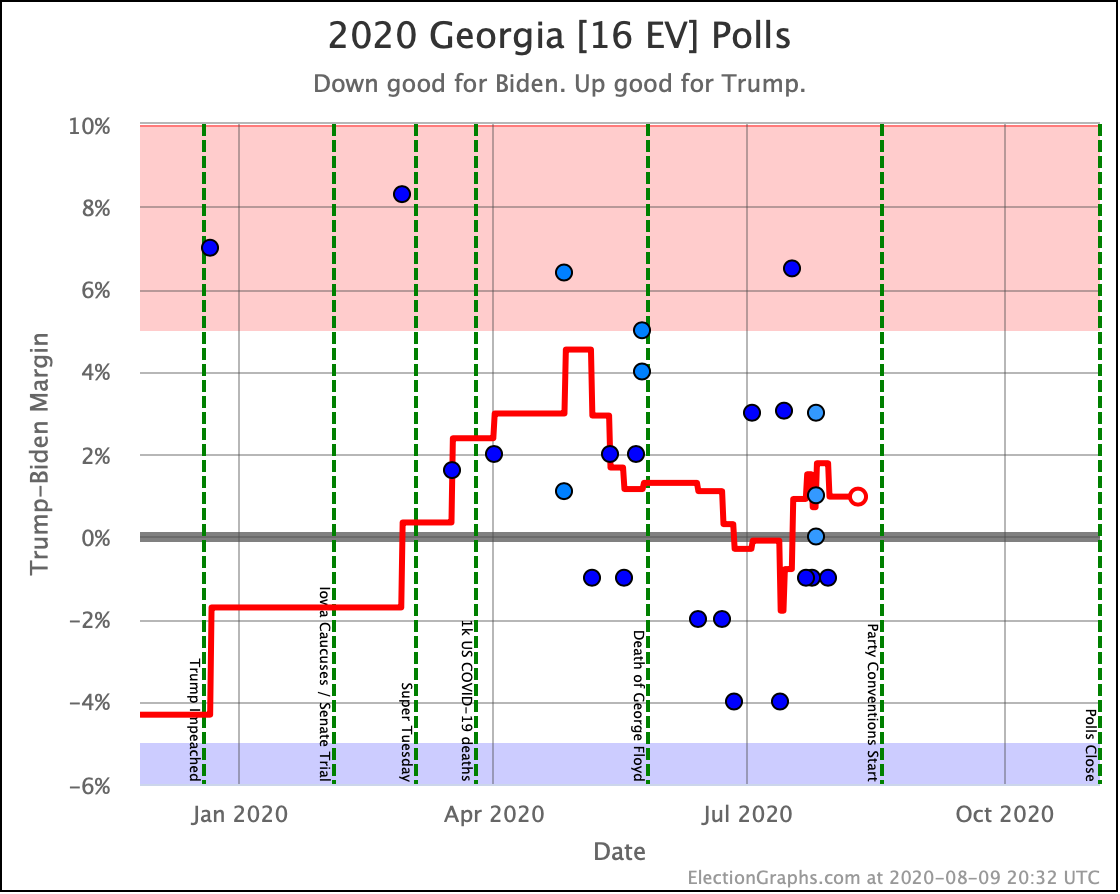
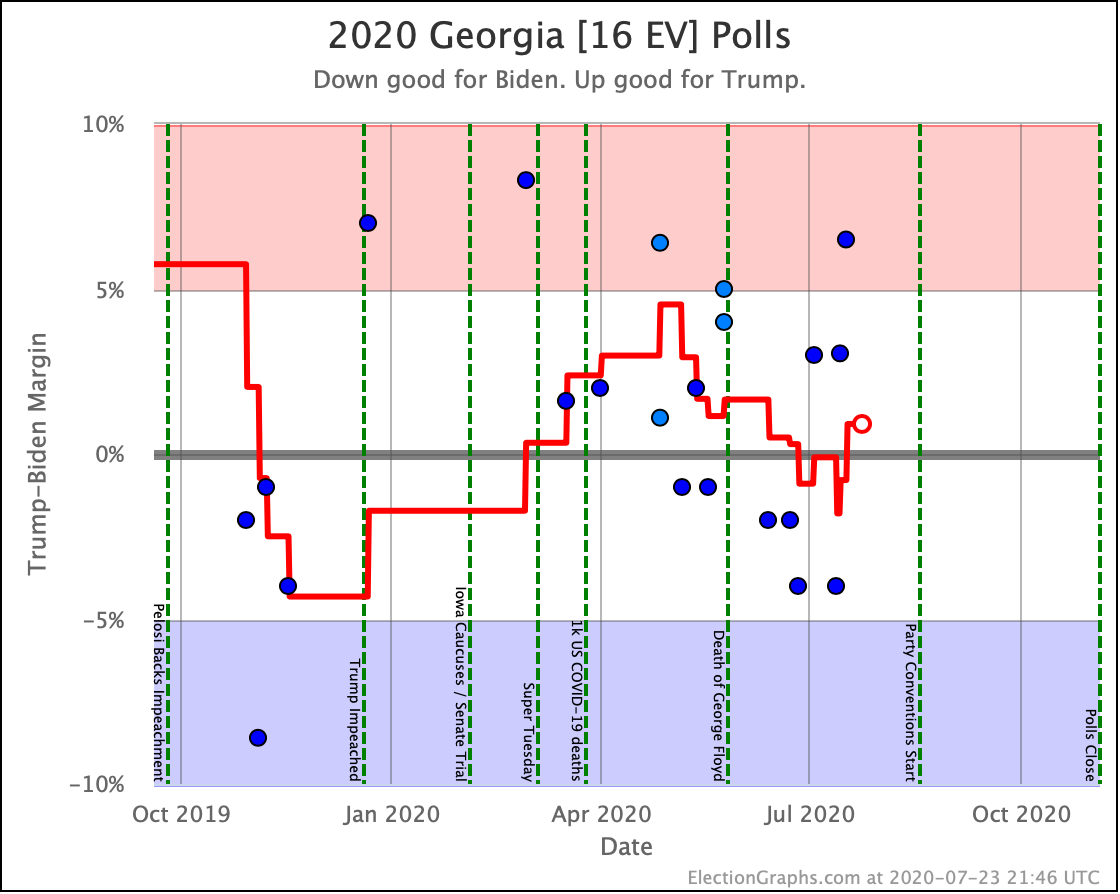
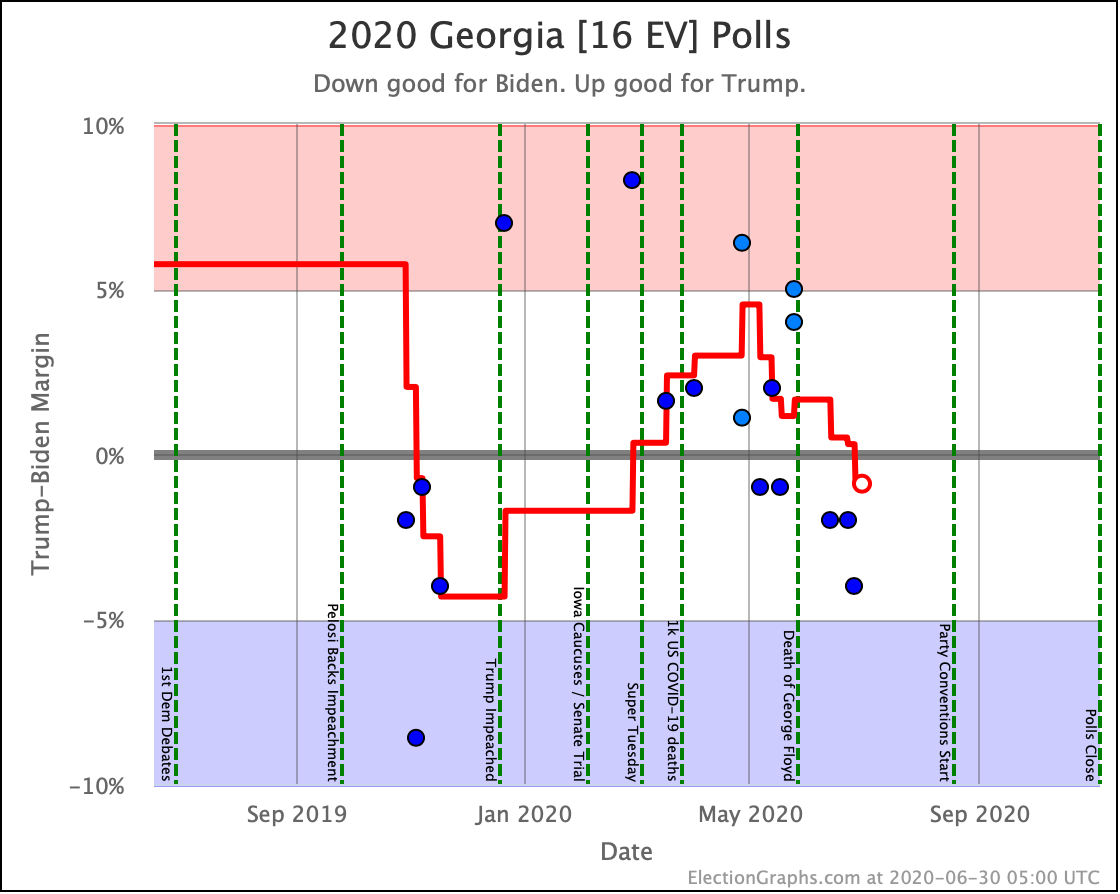
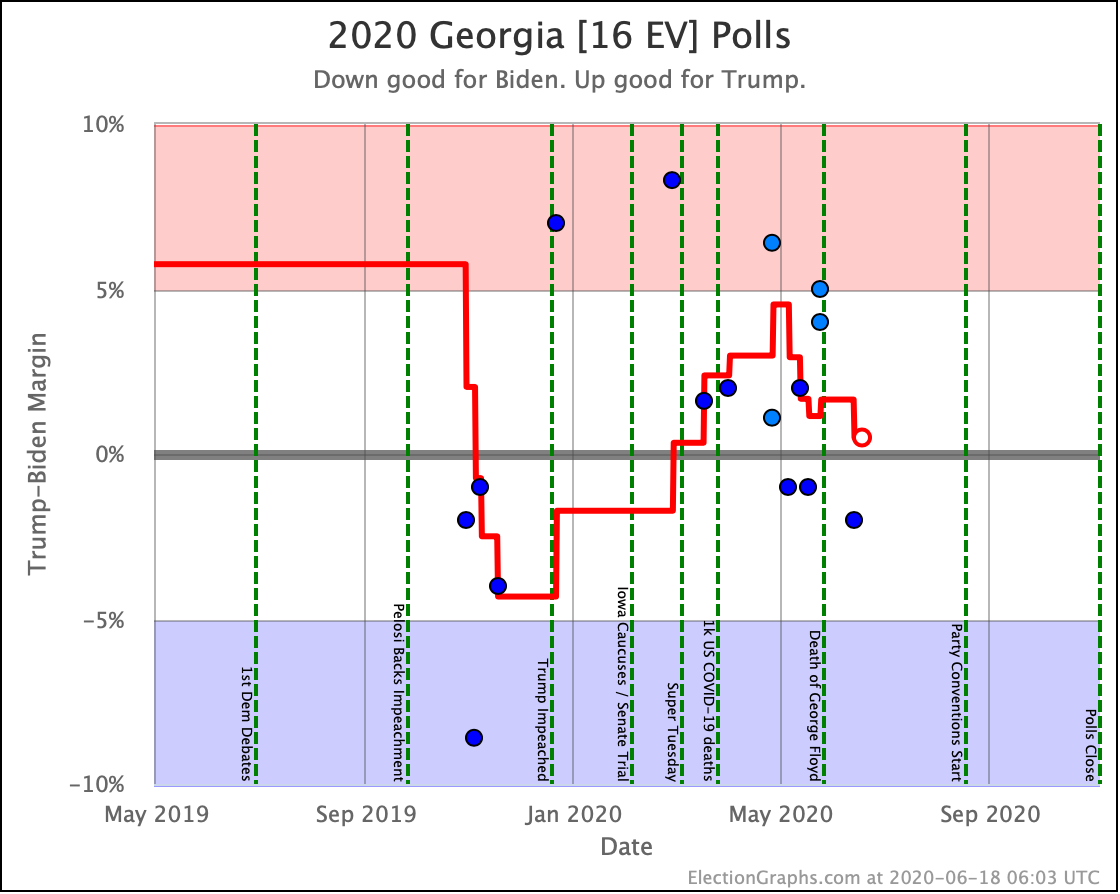
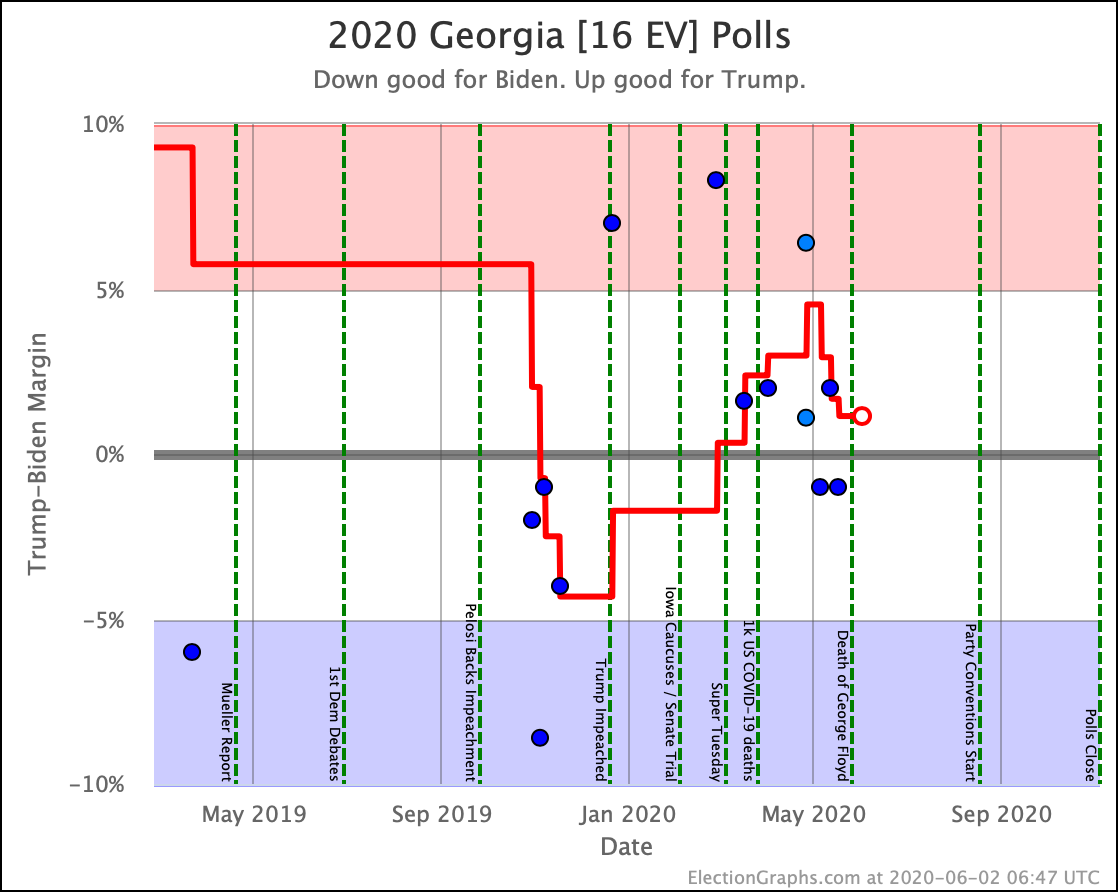
Georgia is perpetually close, and once again crosses the centerline, this time moving from Biden to Trump. Election Graphs now has Trump leading by 1.5%, which is a 71.6% chance of a Trump victory.
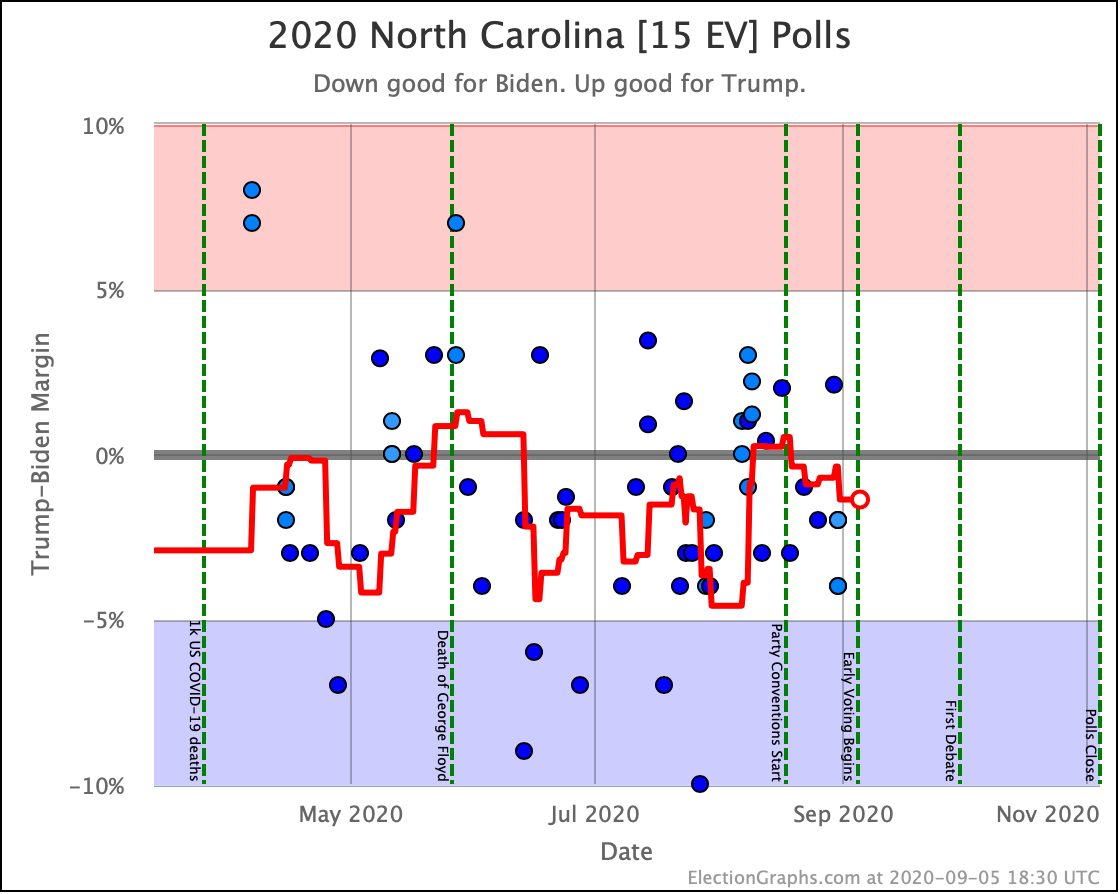
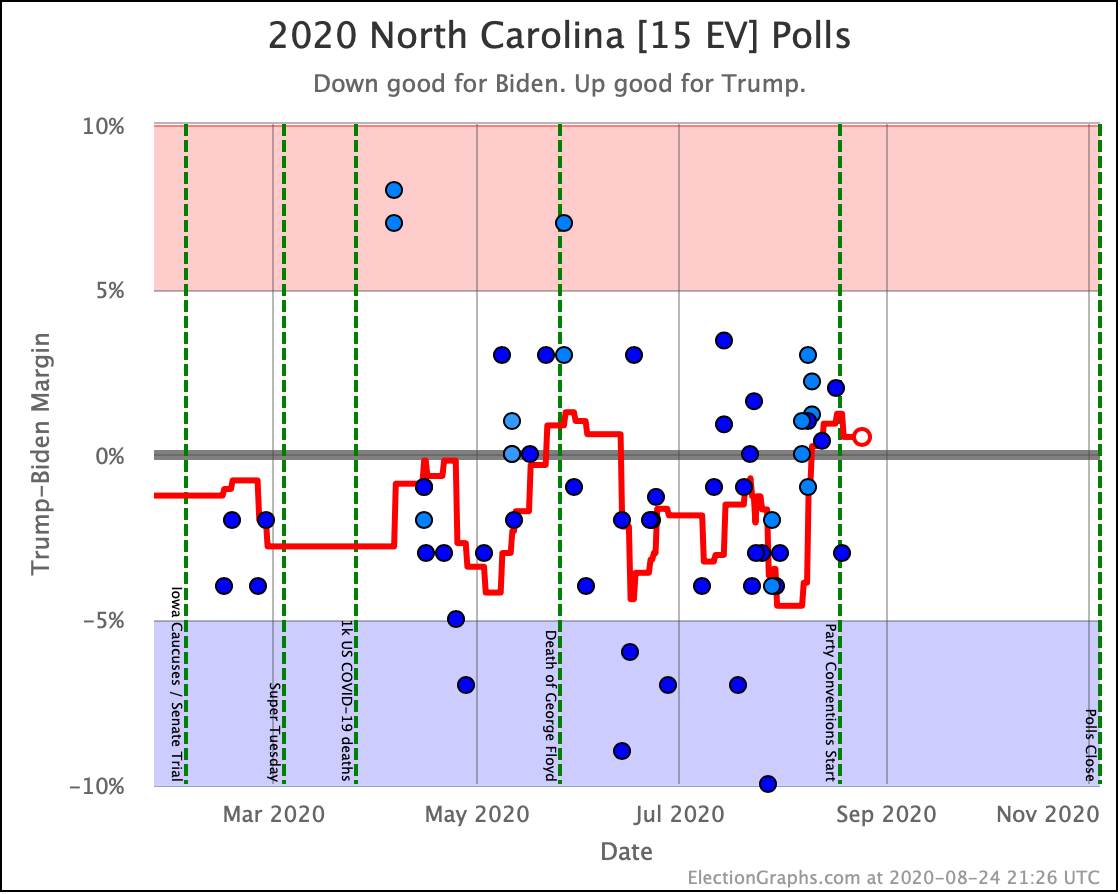
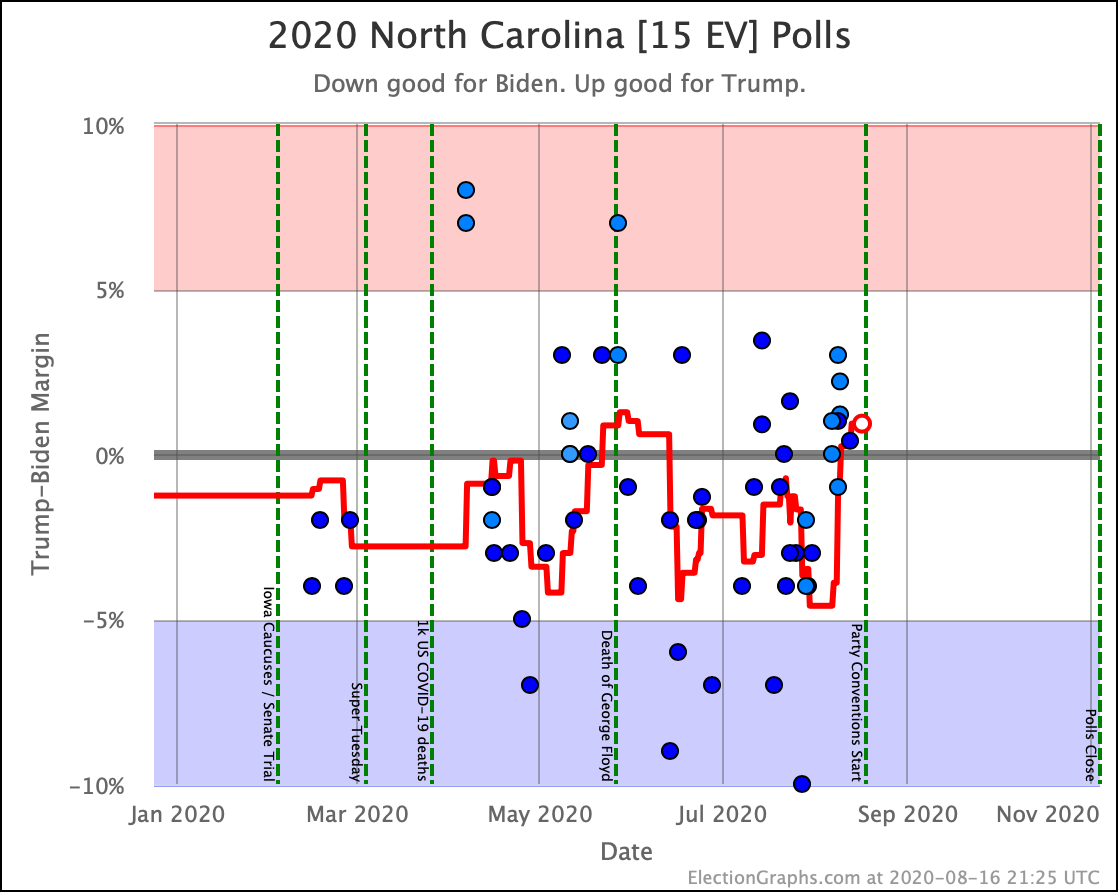
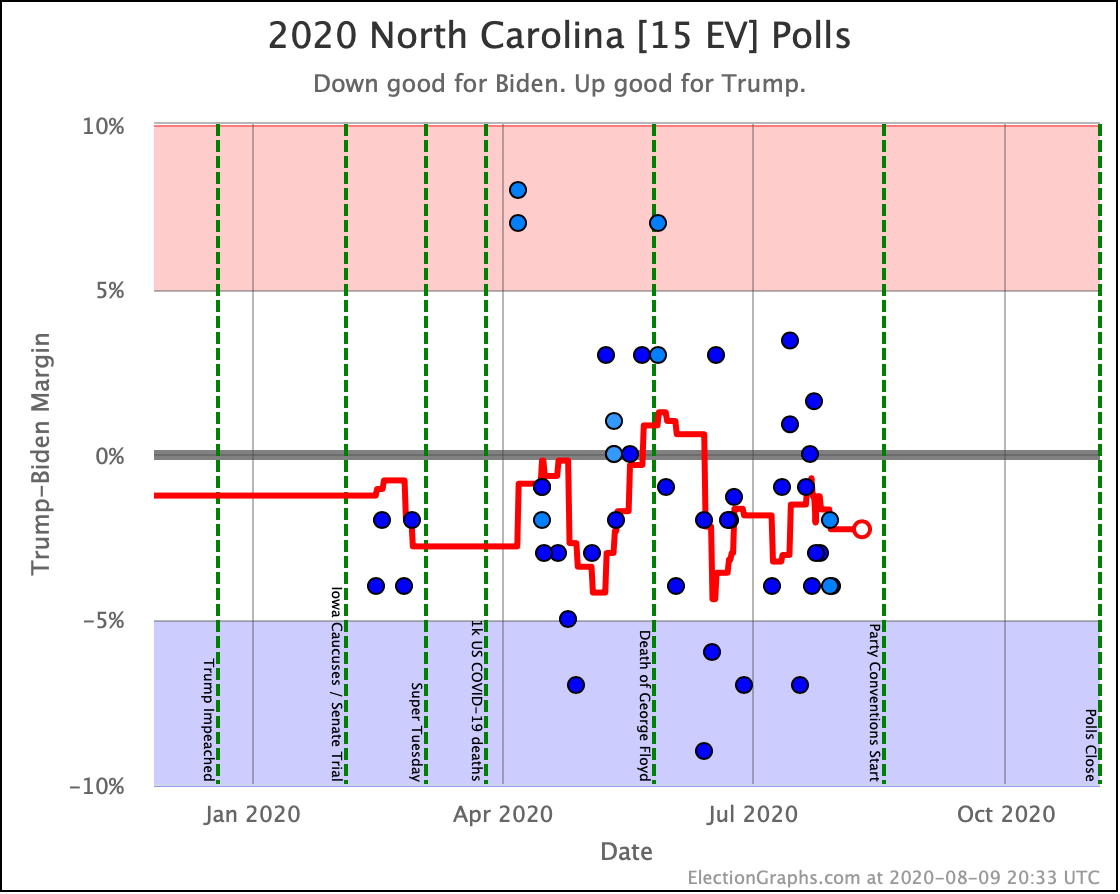
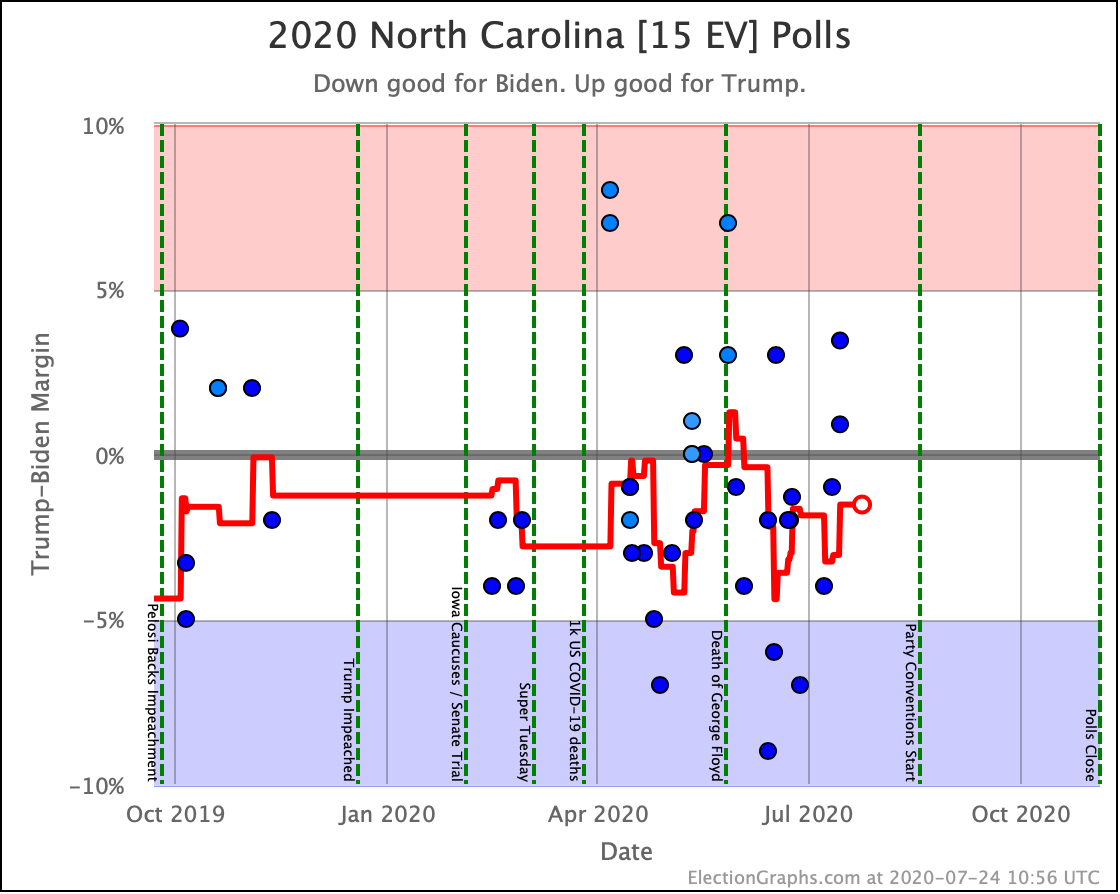
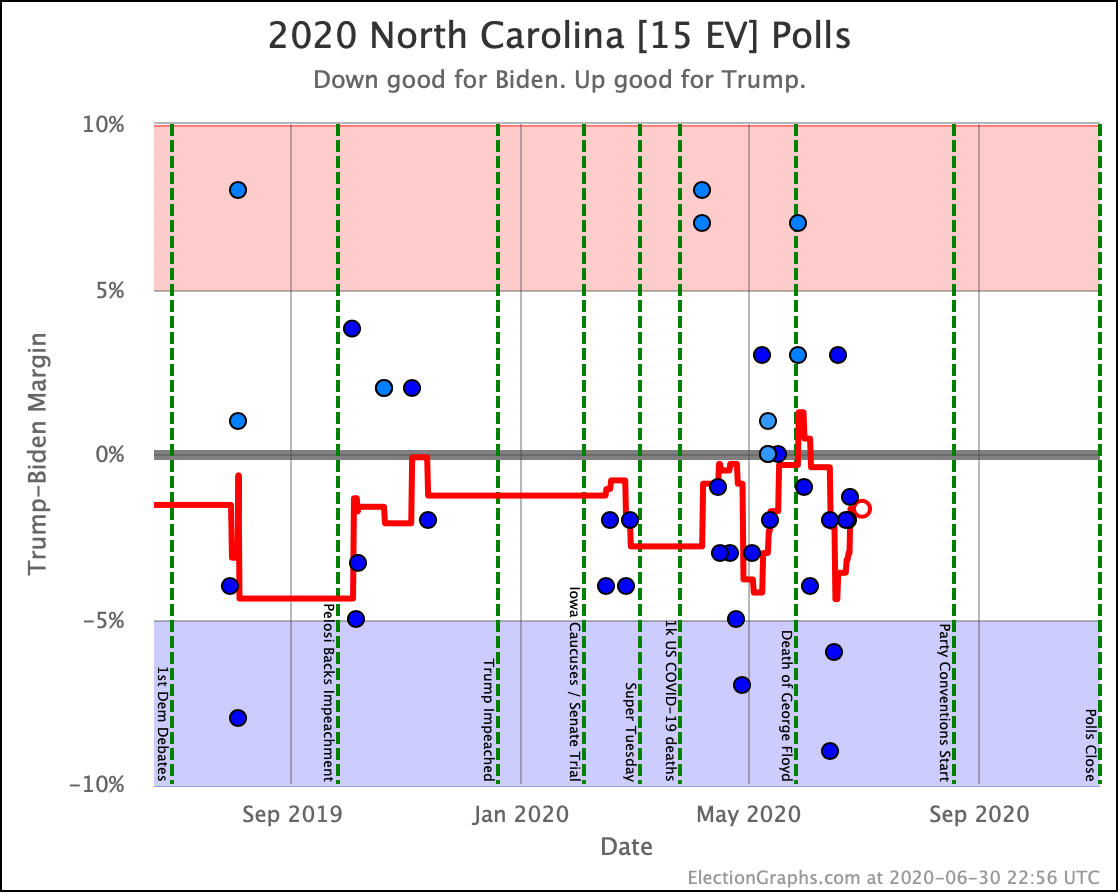
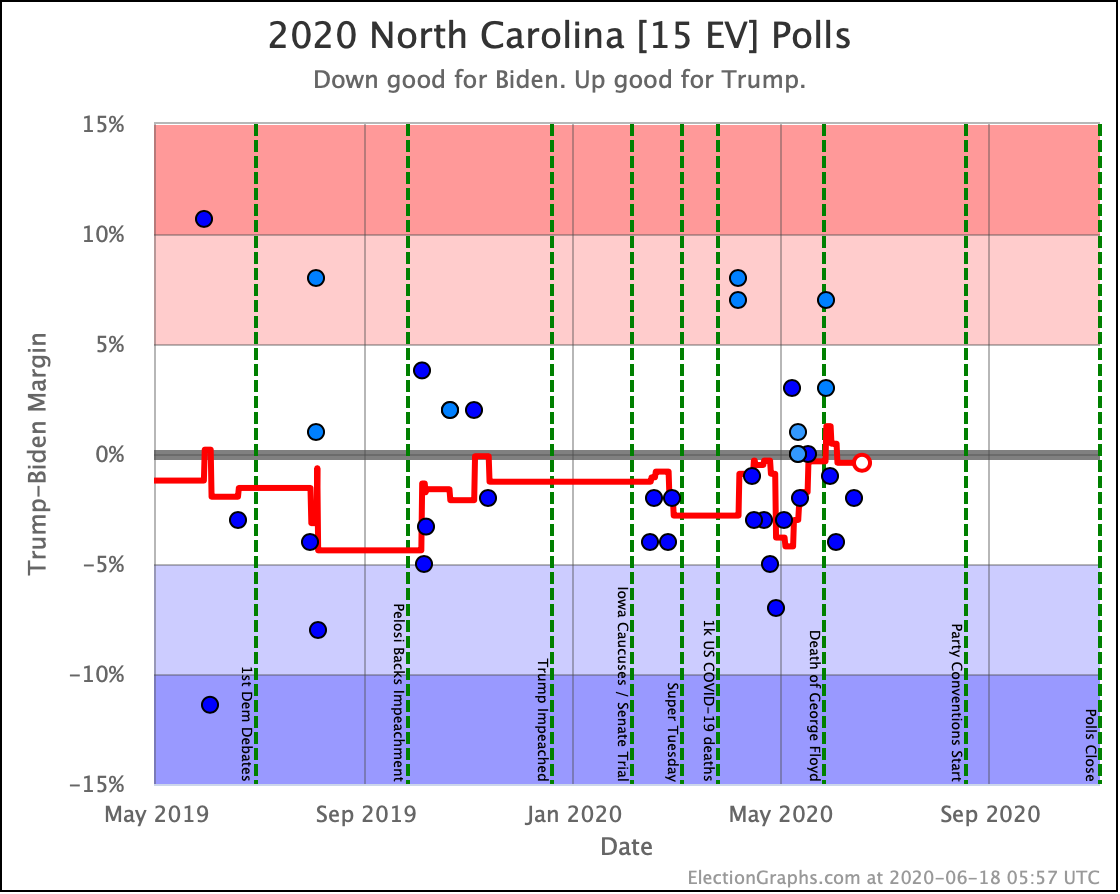
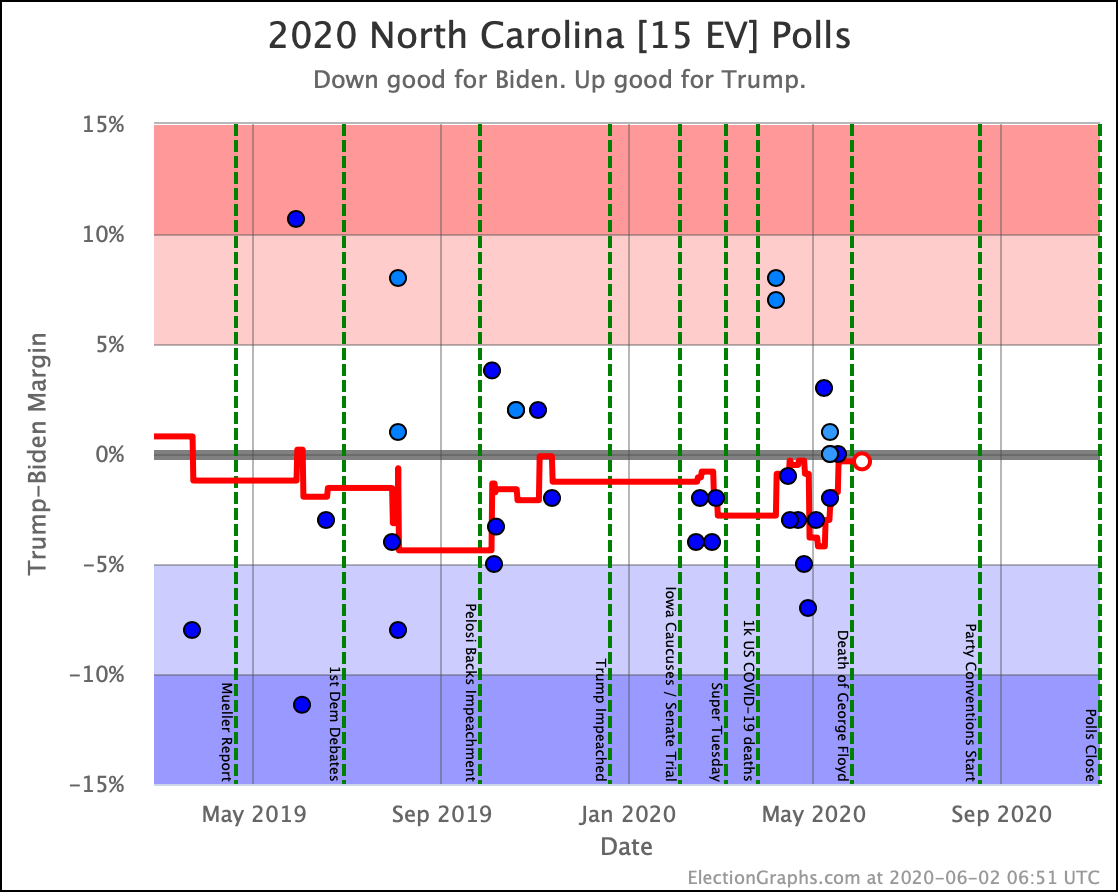
Meanwhile, North Carolina goes the other way. After only a very short time on the Trump side, North Carolina is back to "Weak Biden", which is where it has been for most of the last few months. We have Biden up by 1.4%, which is a 63.3% chance of a Biden win.
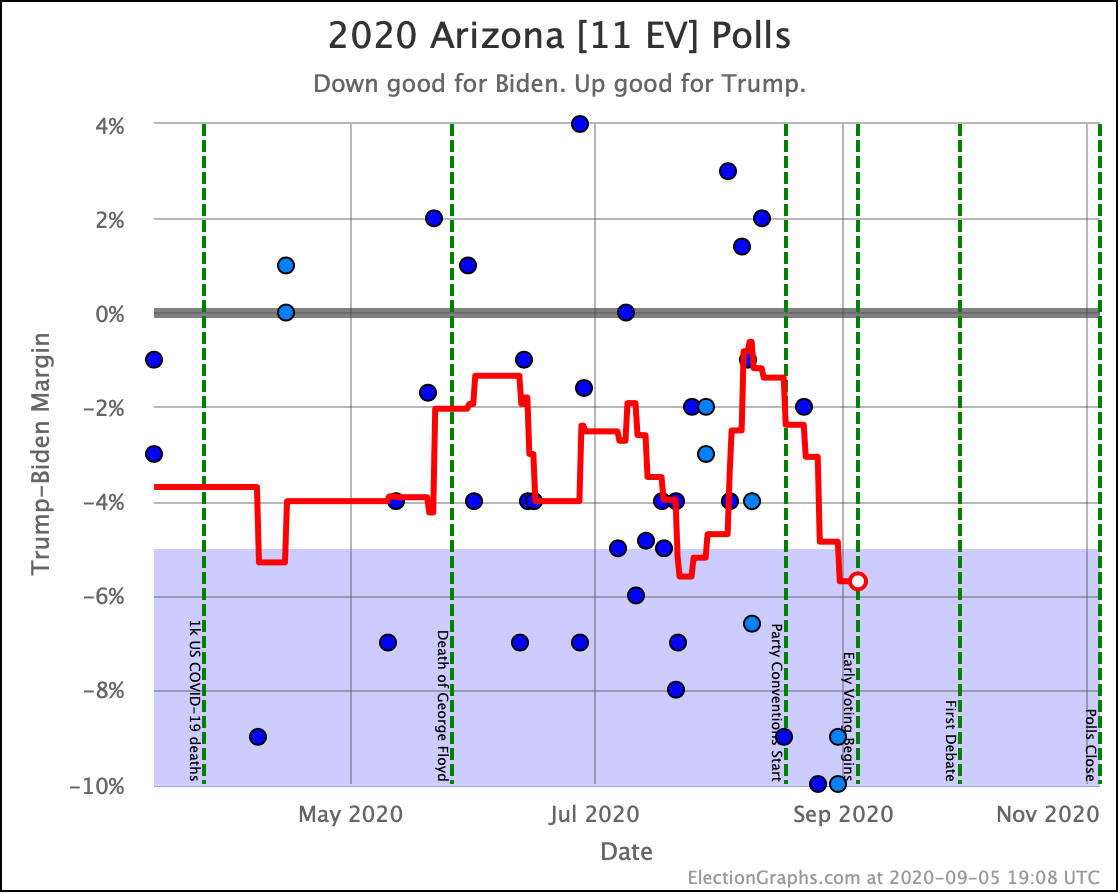
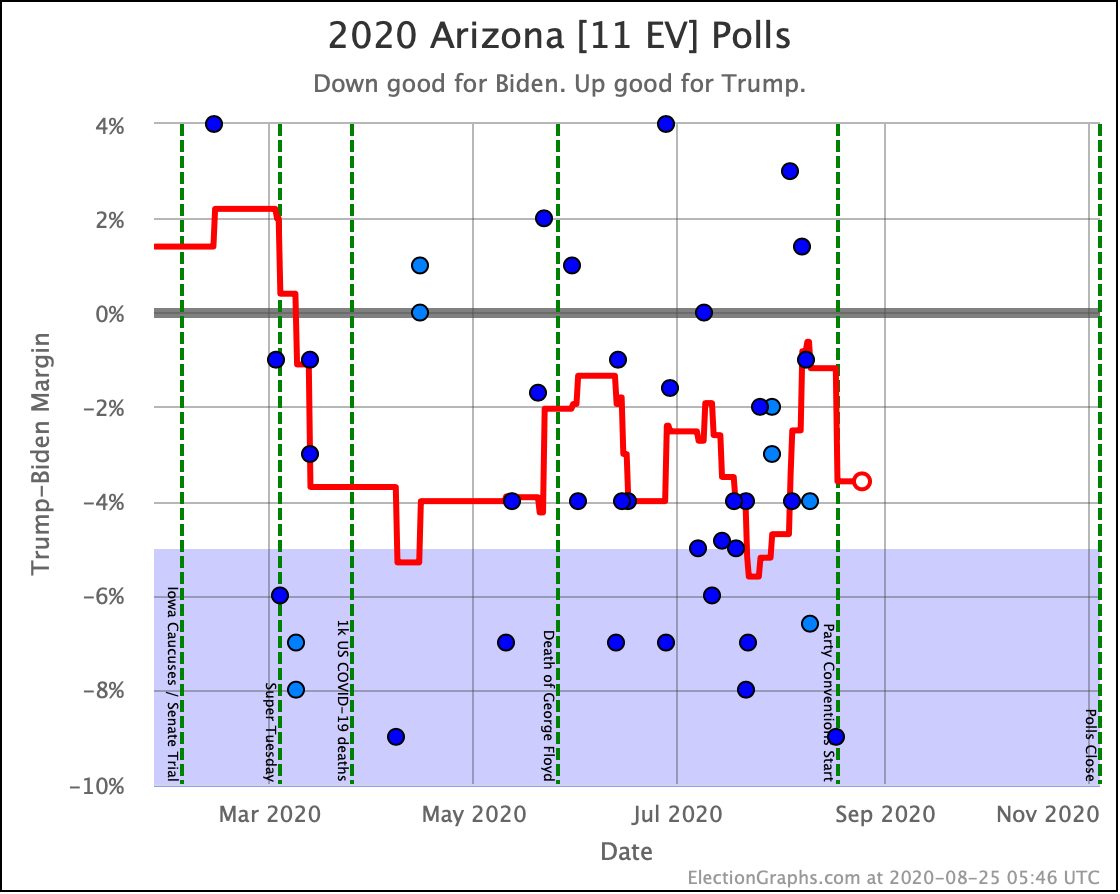
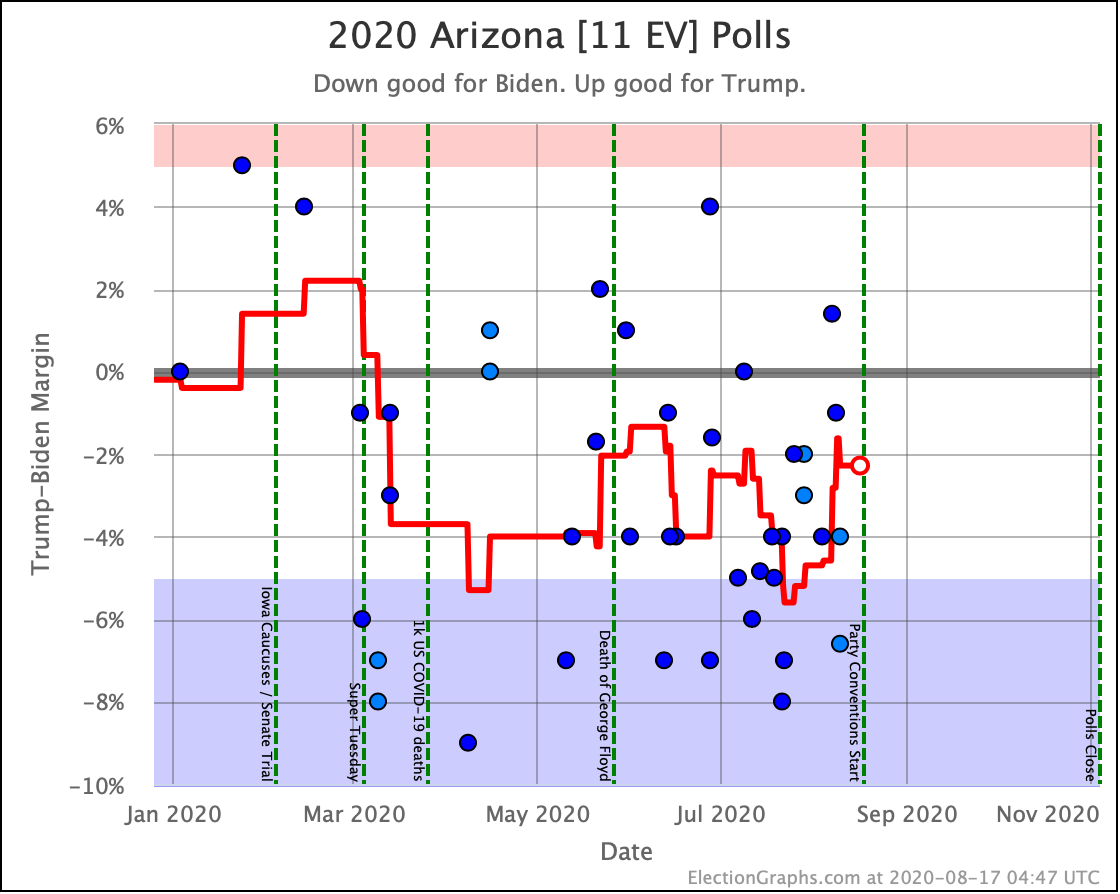
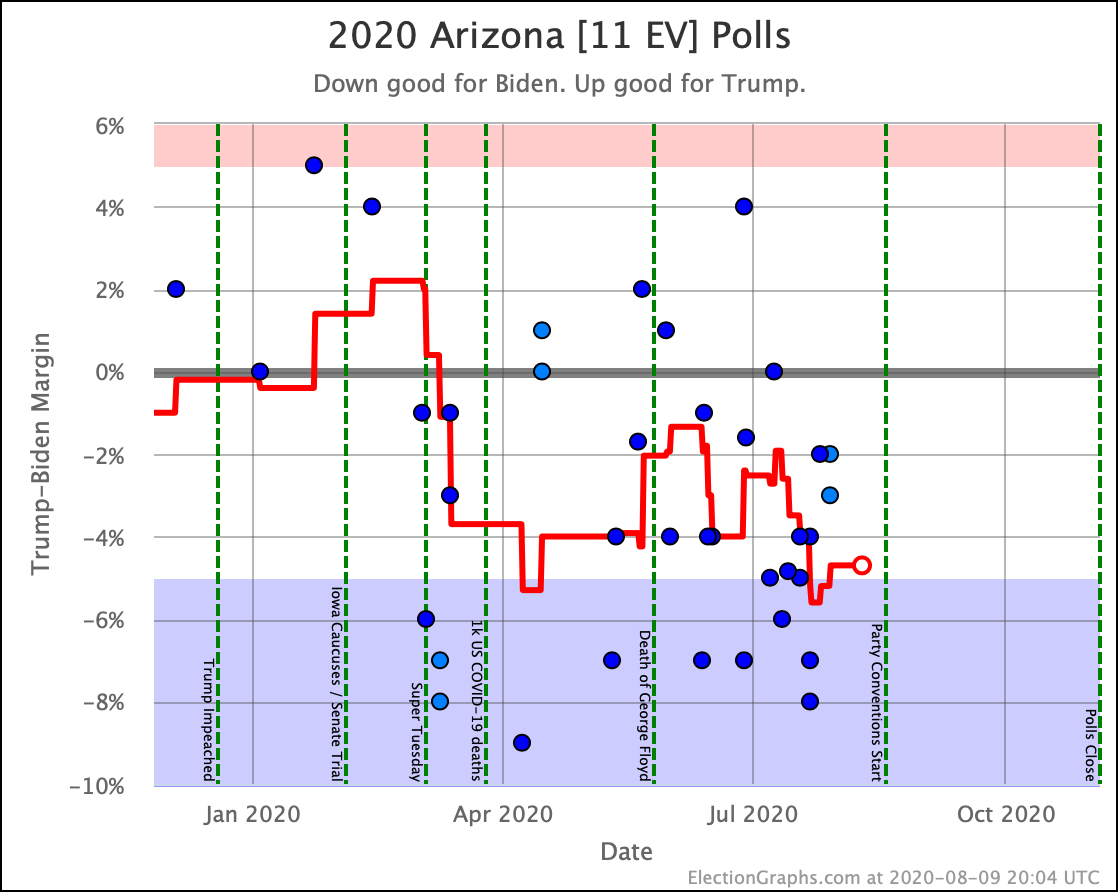
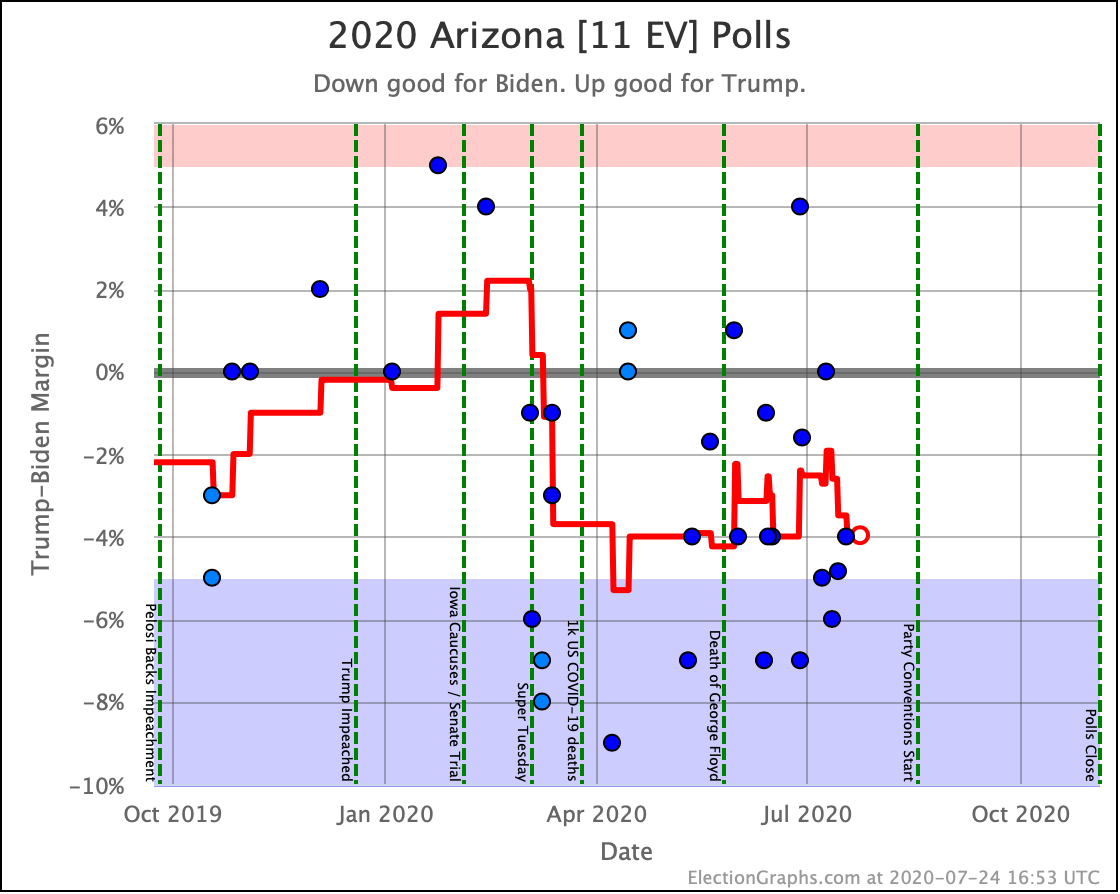
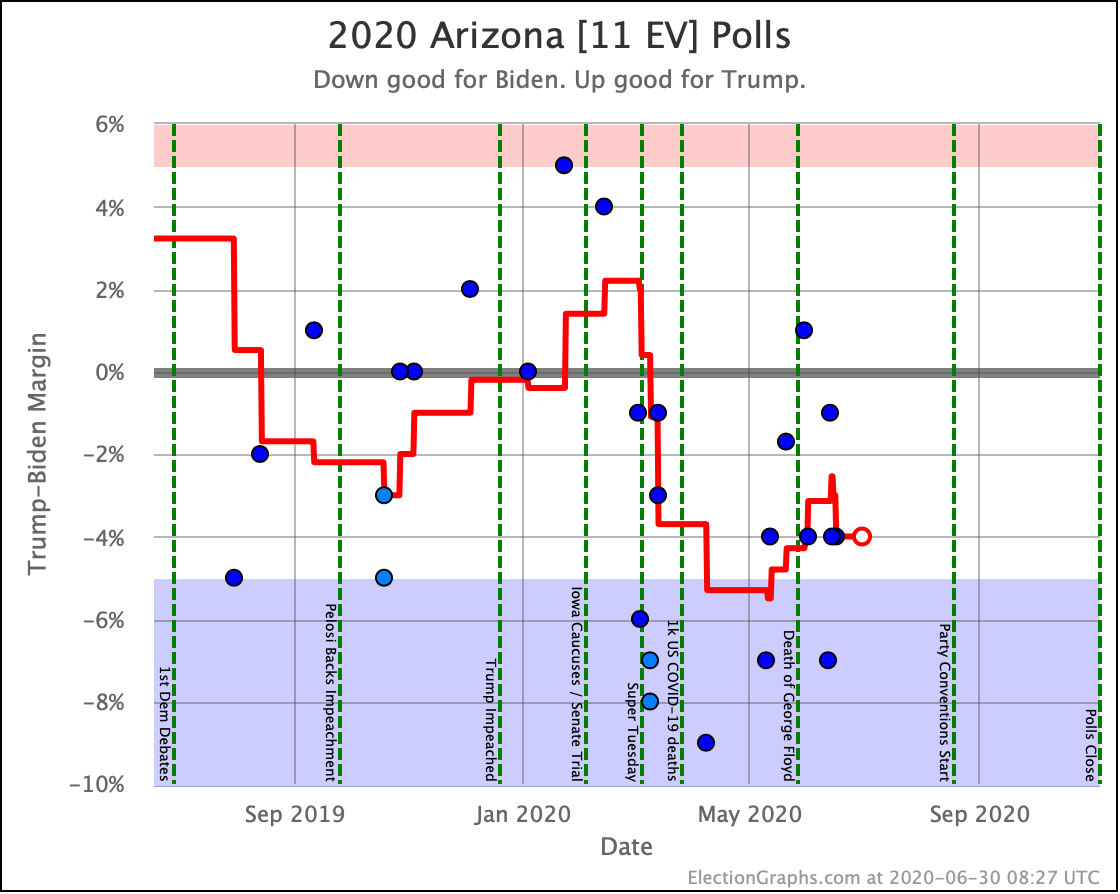
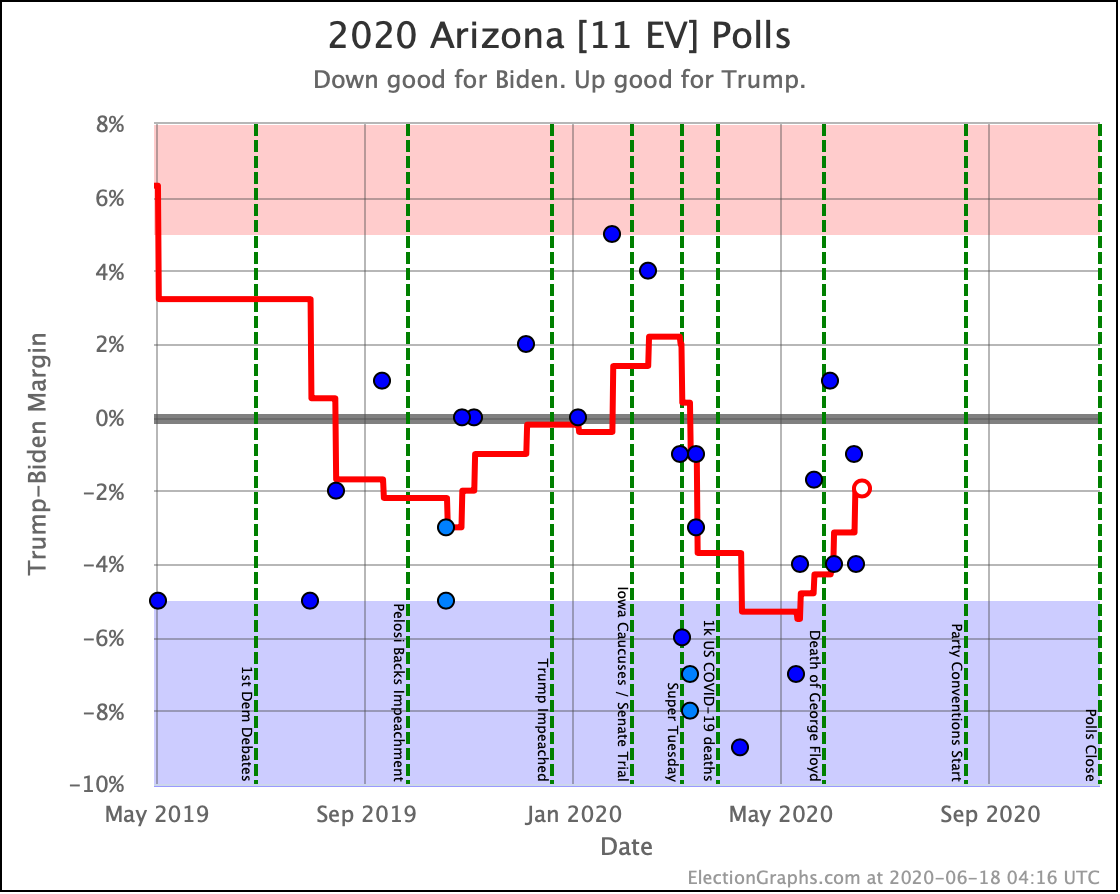
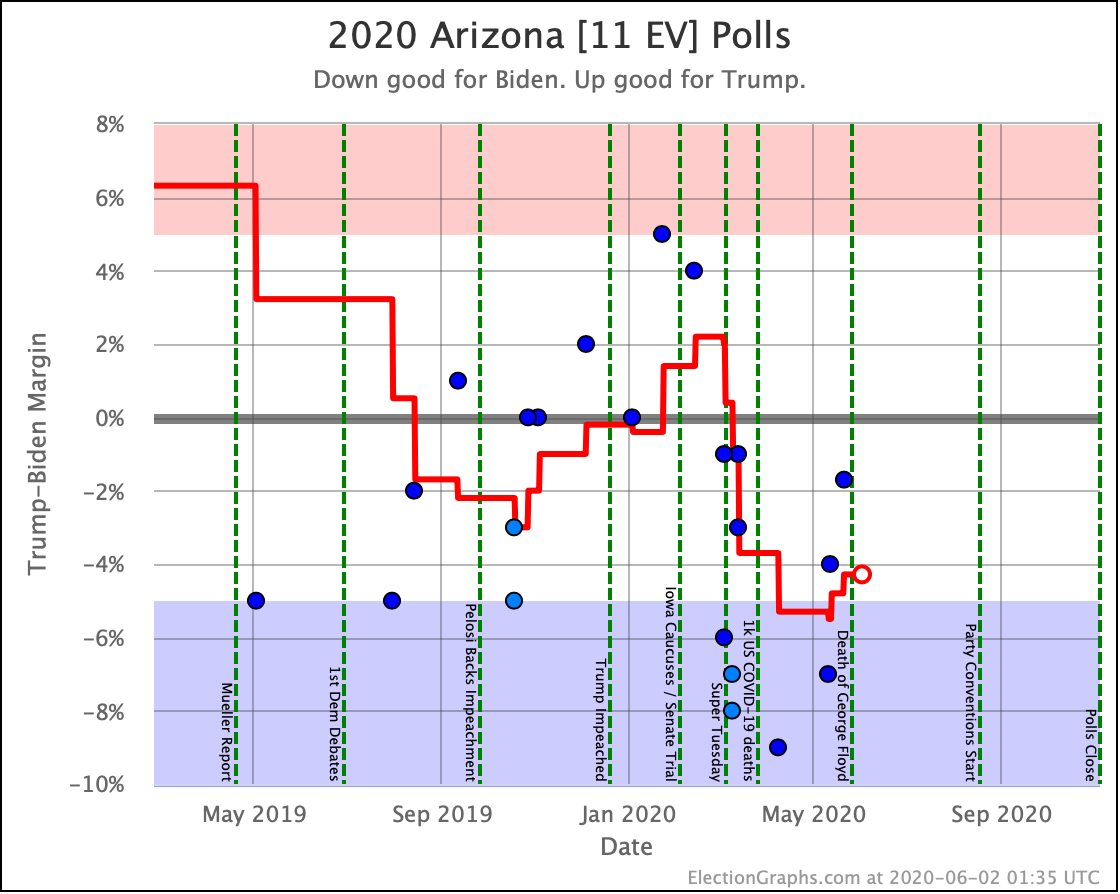
Biden's lead in Arizona increases, moving it to the "Strong Biden" category. Biden now leads there by 5.7% in our average, which is a 93.5% chance of winning.
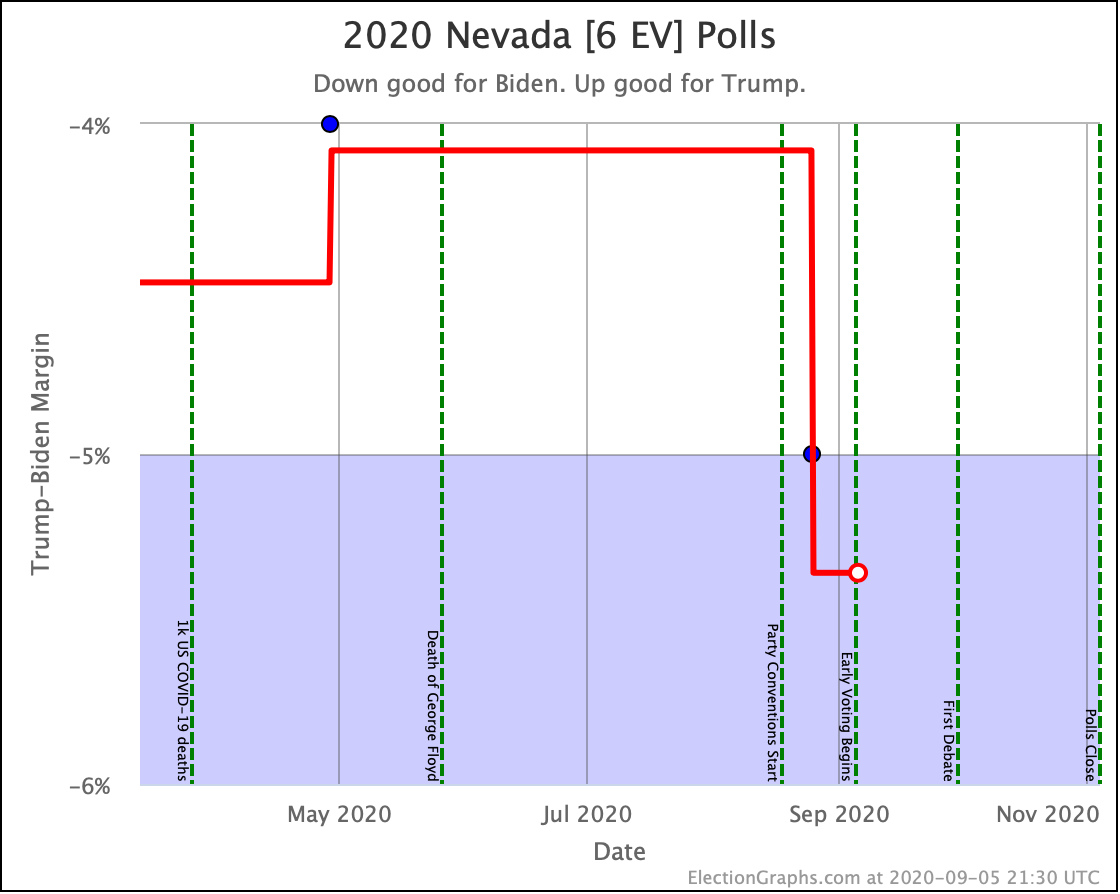
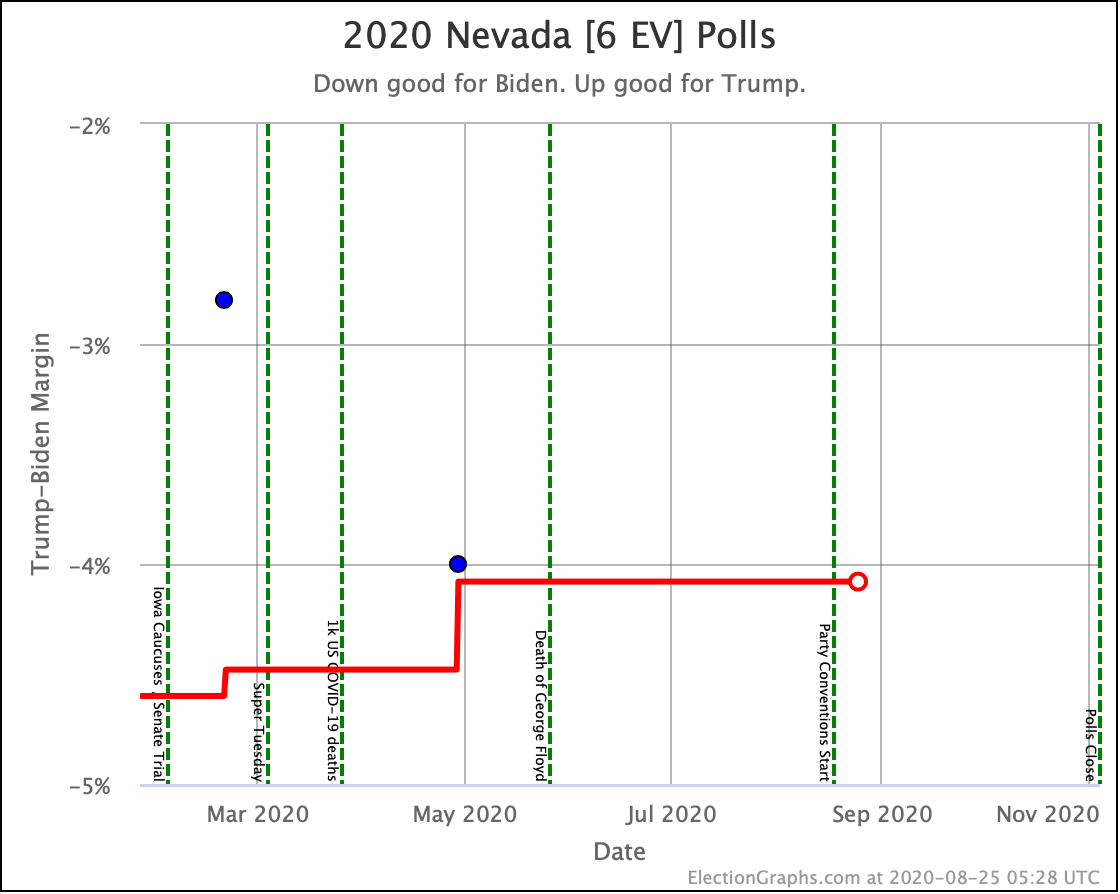
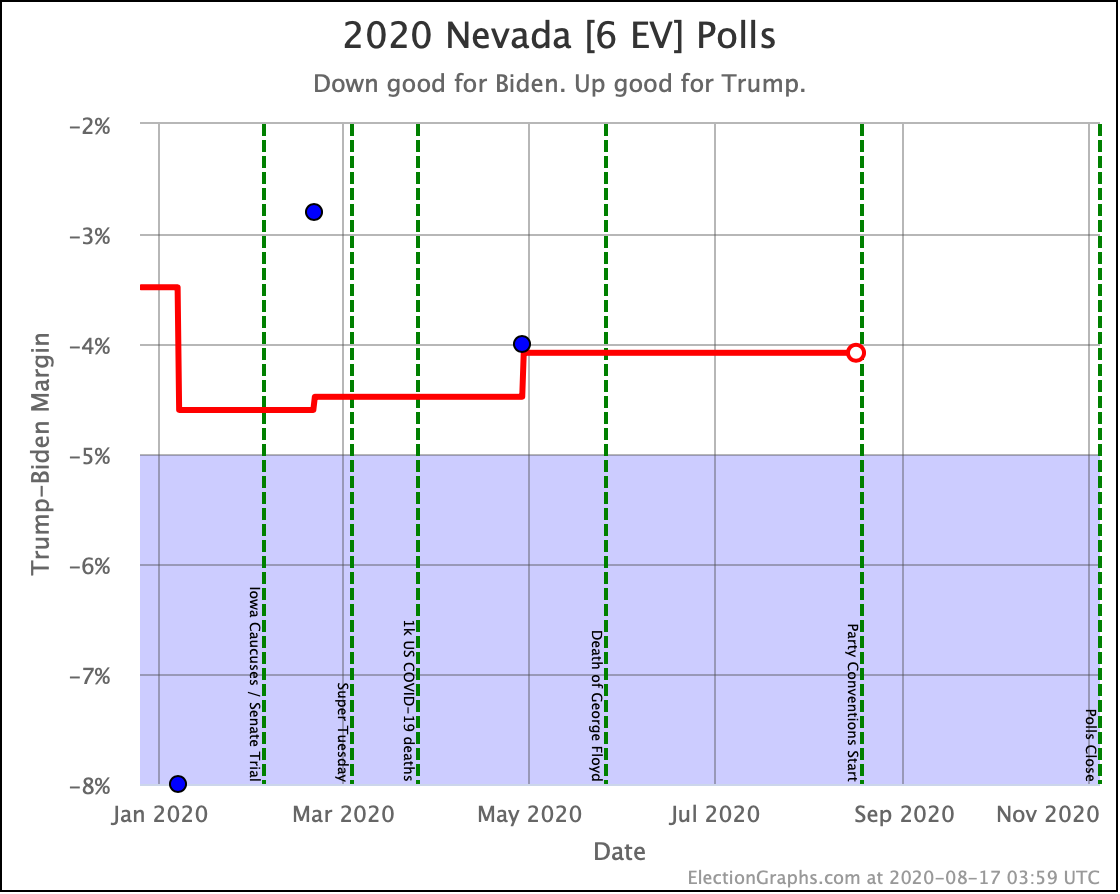
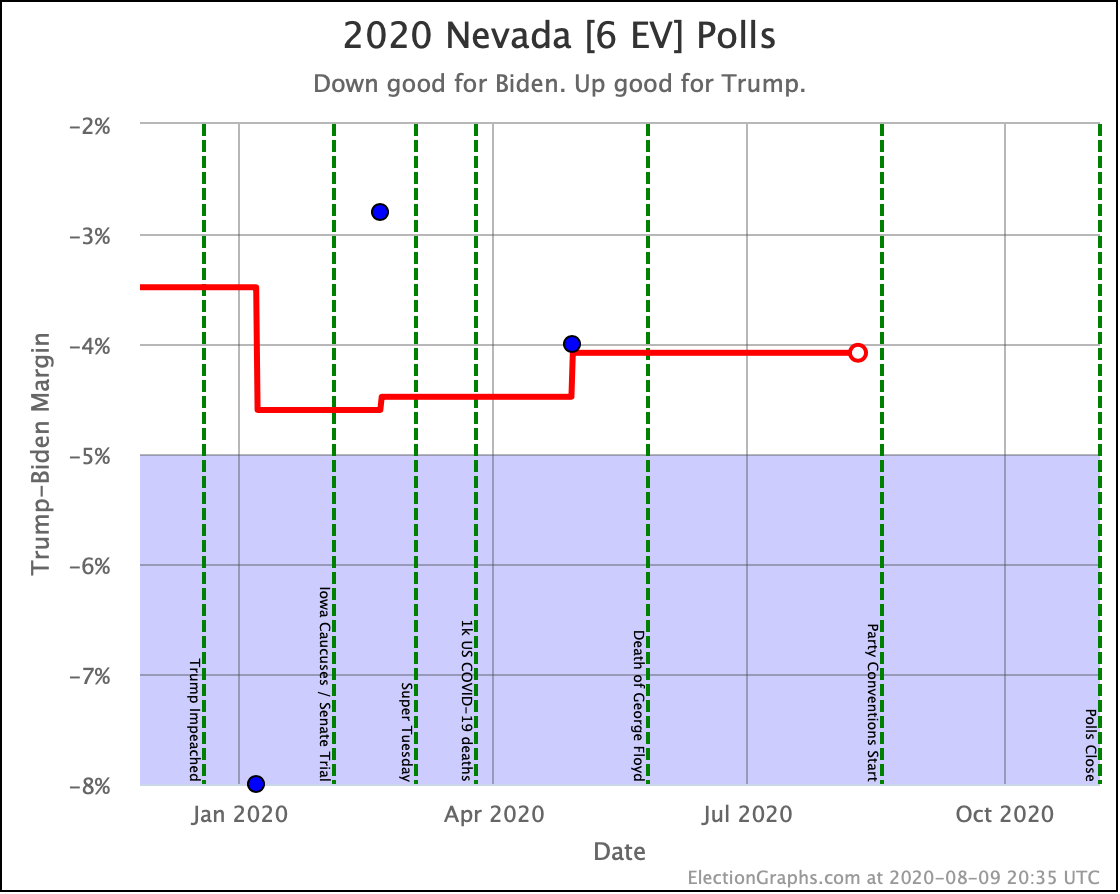
There have not been many Nevada polls. We have to go back almost 10 months to get the five polls for our average. But with the latest poll, Biden's lead jumps to 5.4% or a 92.5% chance of winning the state.
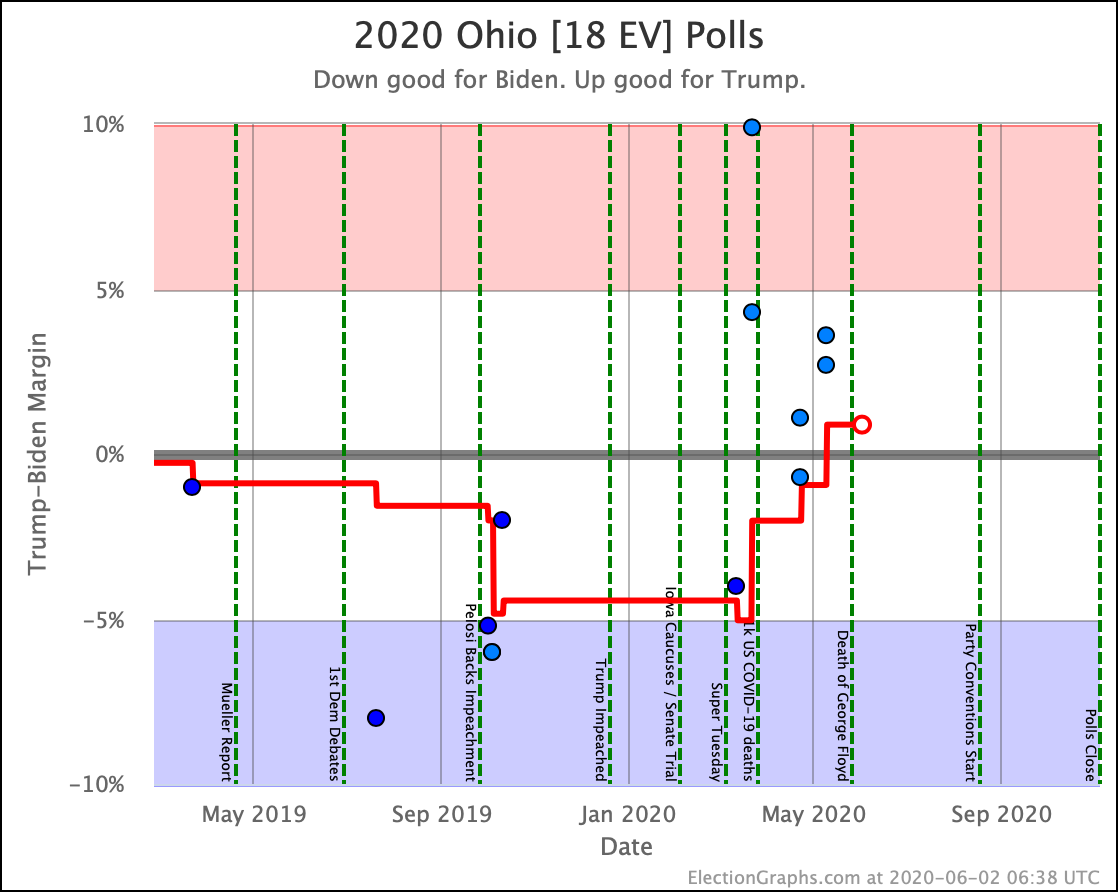
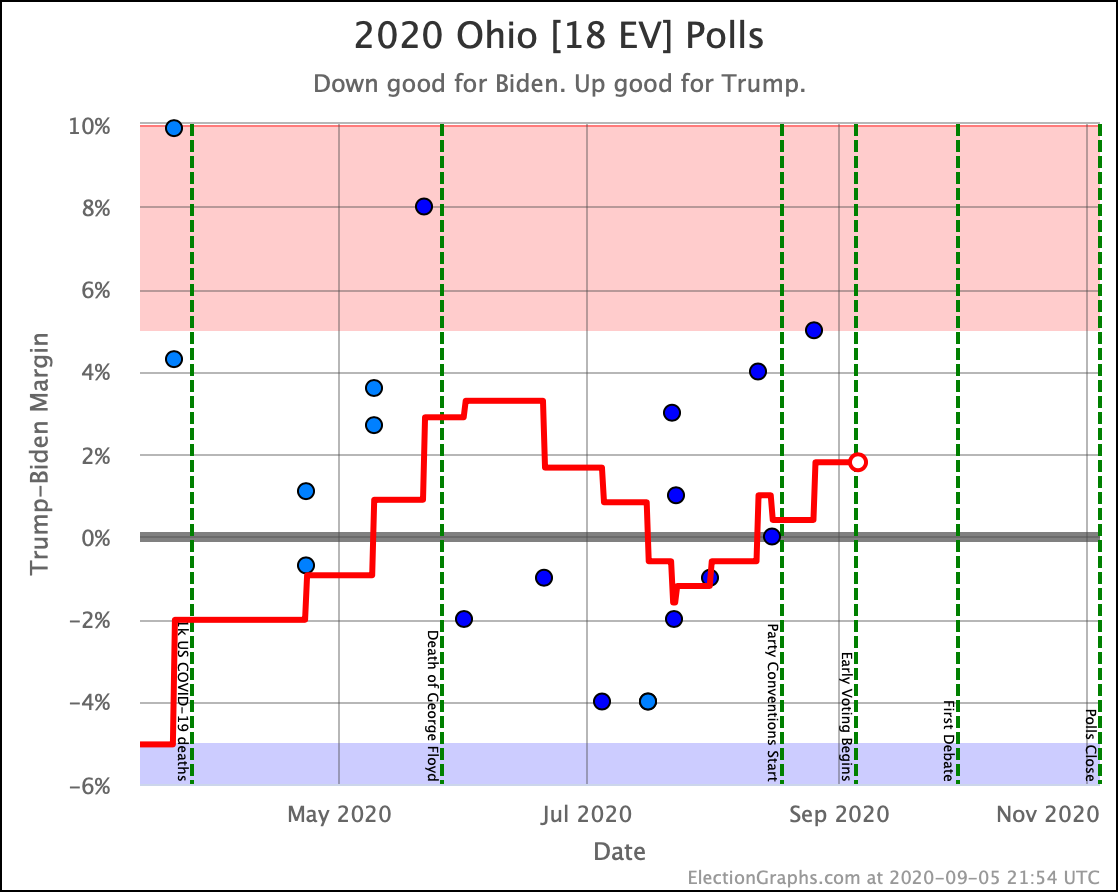
Texas, Georgia, and North Carolina crossed the center line. Texas (38 EV) and North Carolina (15 EV) moved toward Biden, while Georgia (16 EV) moved toward Trump. That is a net movement of 37 EV toward Trump, or a 74 EV increase in Biden's expected margin.
Pennsylvania, Arizona, and Nevada on the other hand, impacted what we call Trump's "Best Case". That would be where he wins every single state that he leads our averages, plus every state where he is behind by less than 5%. Pennsylvania (20 EV) moved toward Trump, while Arizona (11 EV) and Nevada (6 EV) moved toward Biden, for a net improvement for Trump of 3 EV, or 6 EV of net margin.
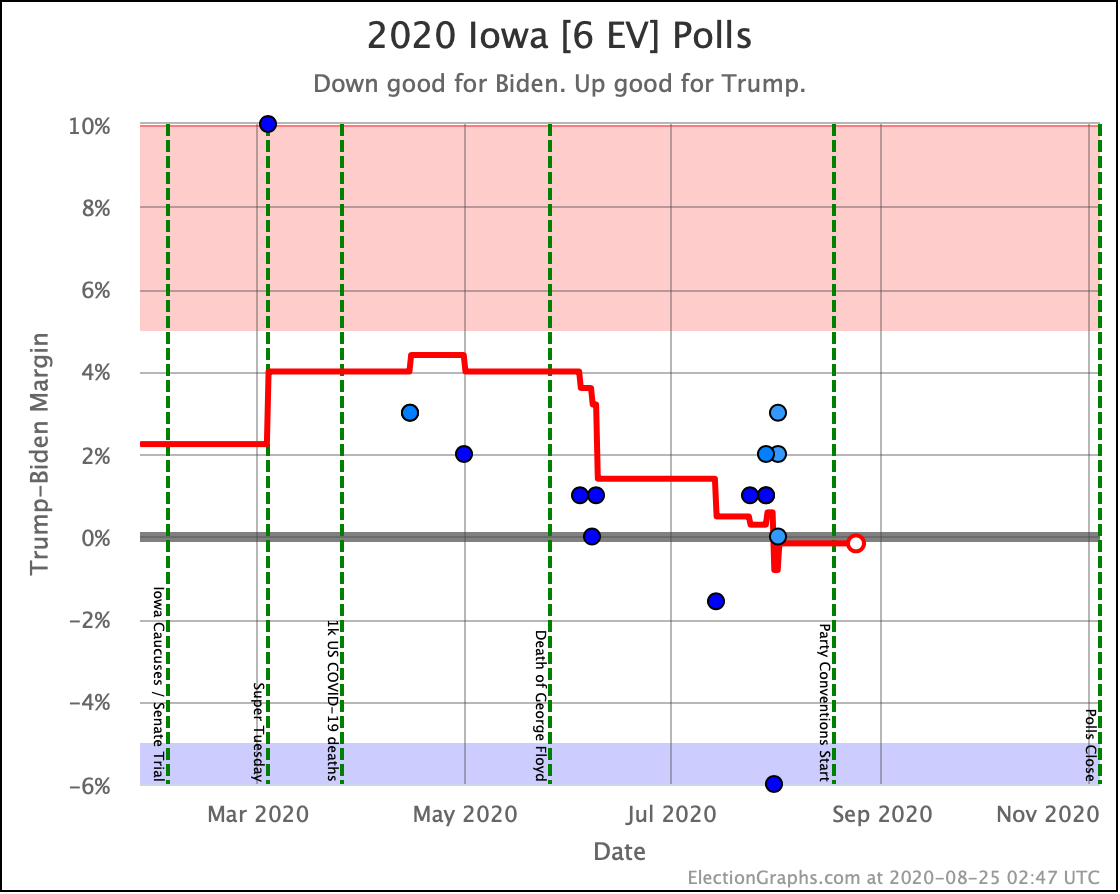
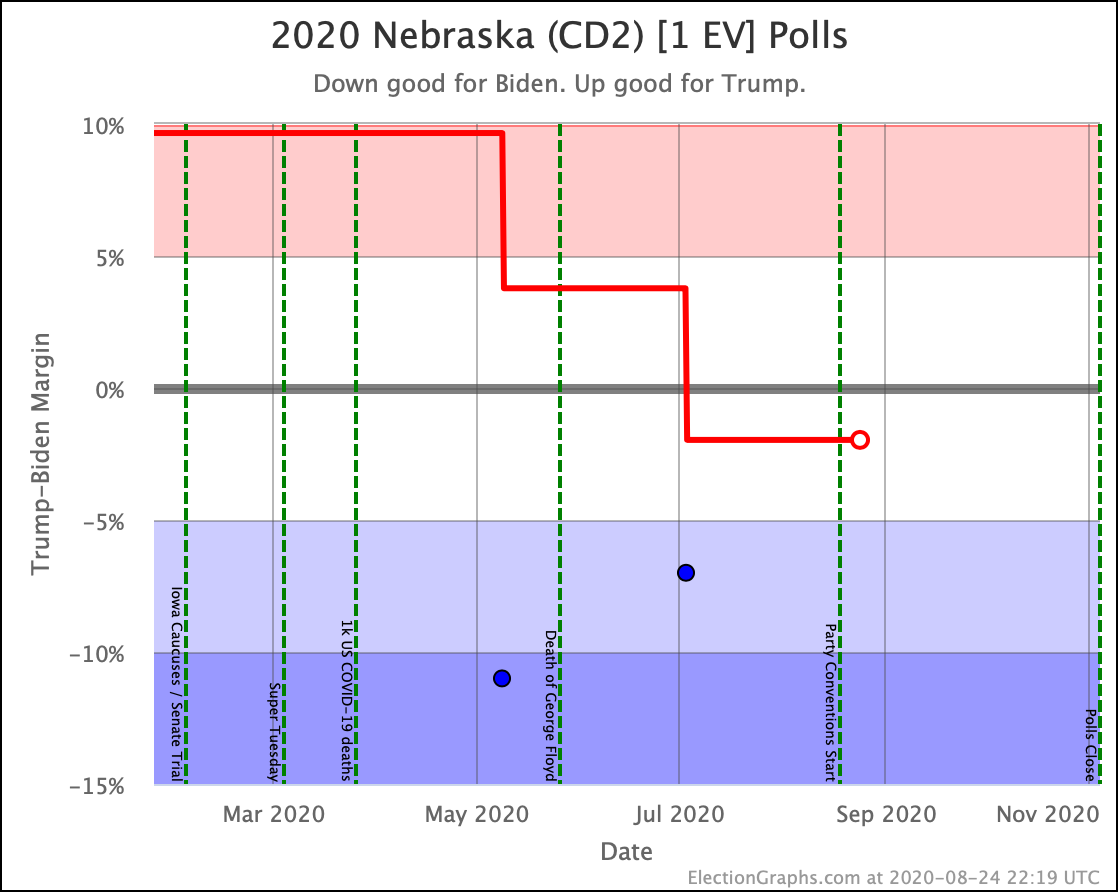
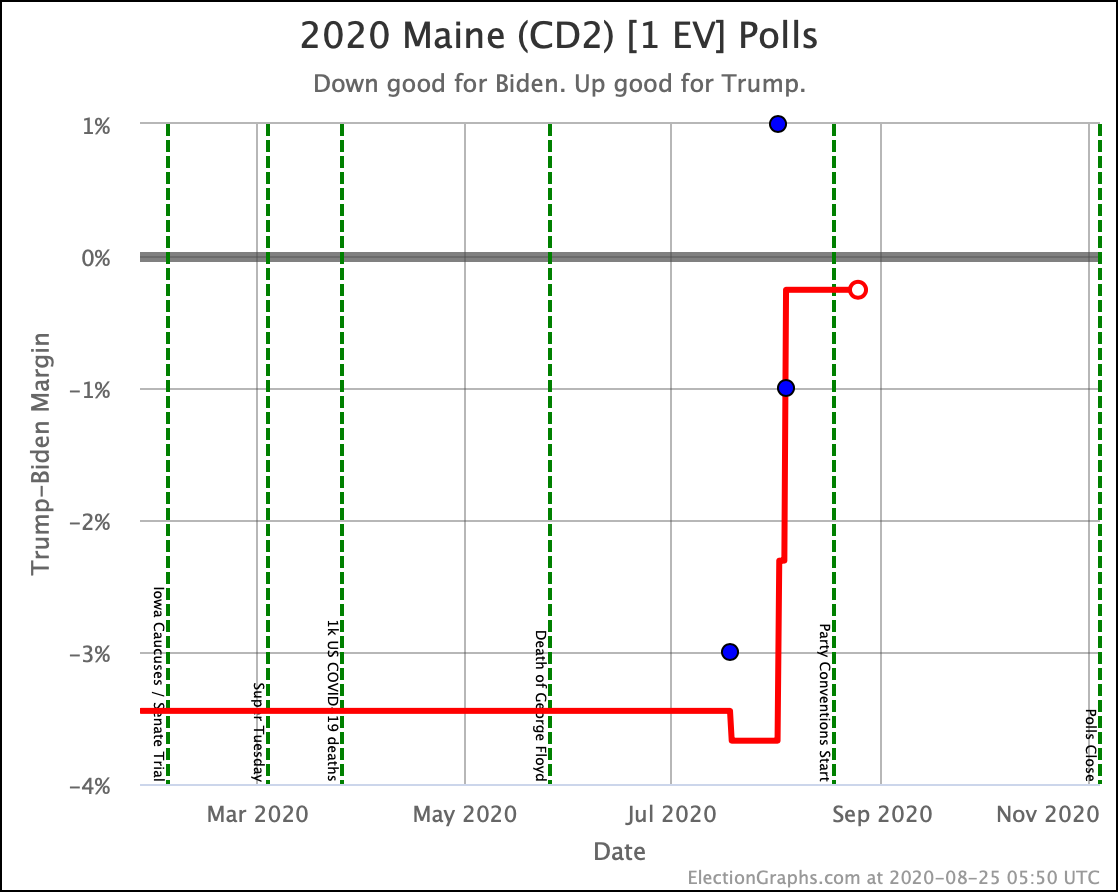
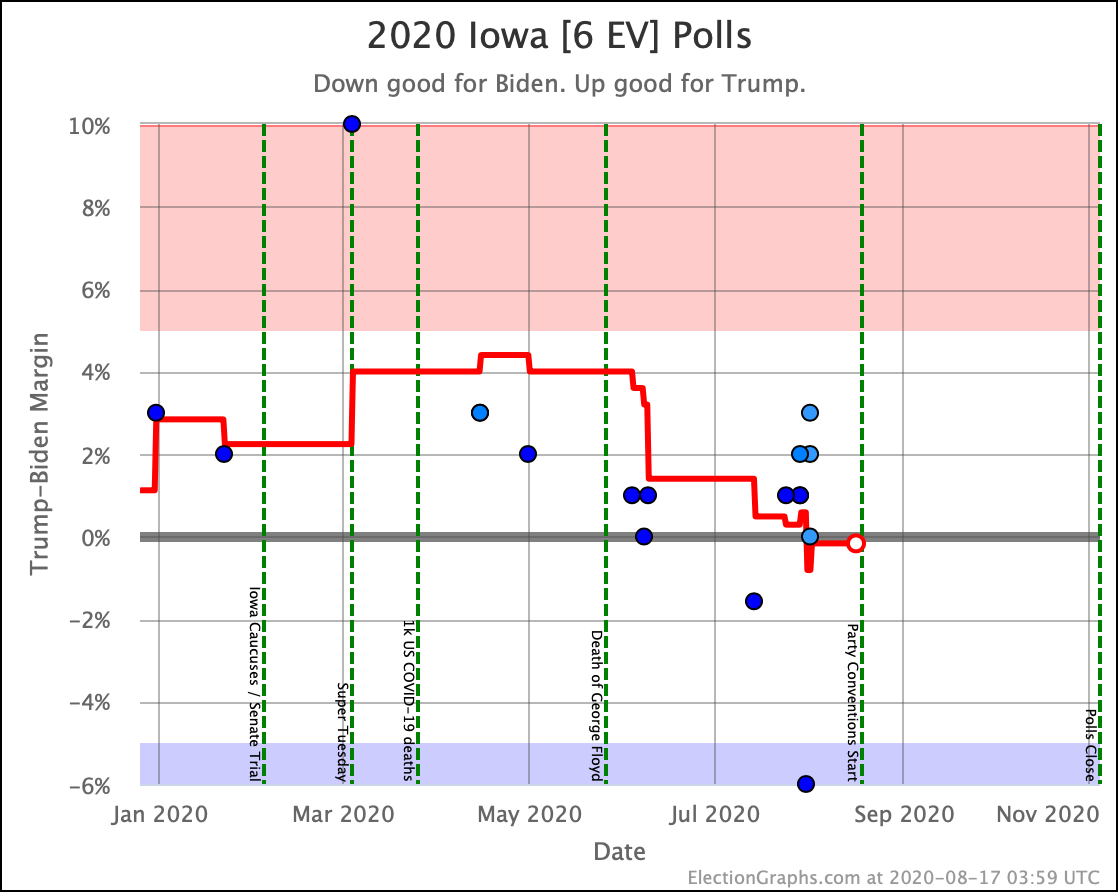
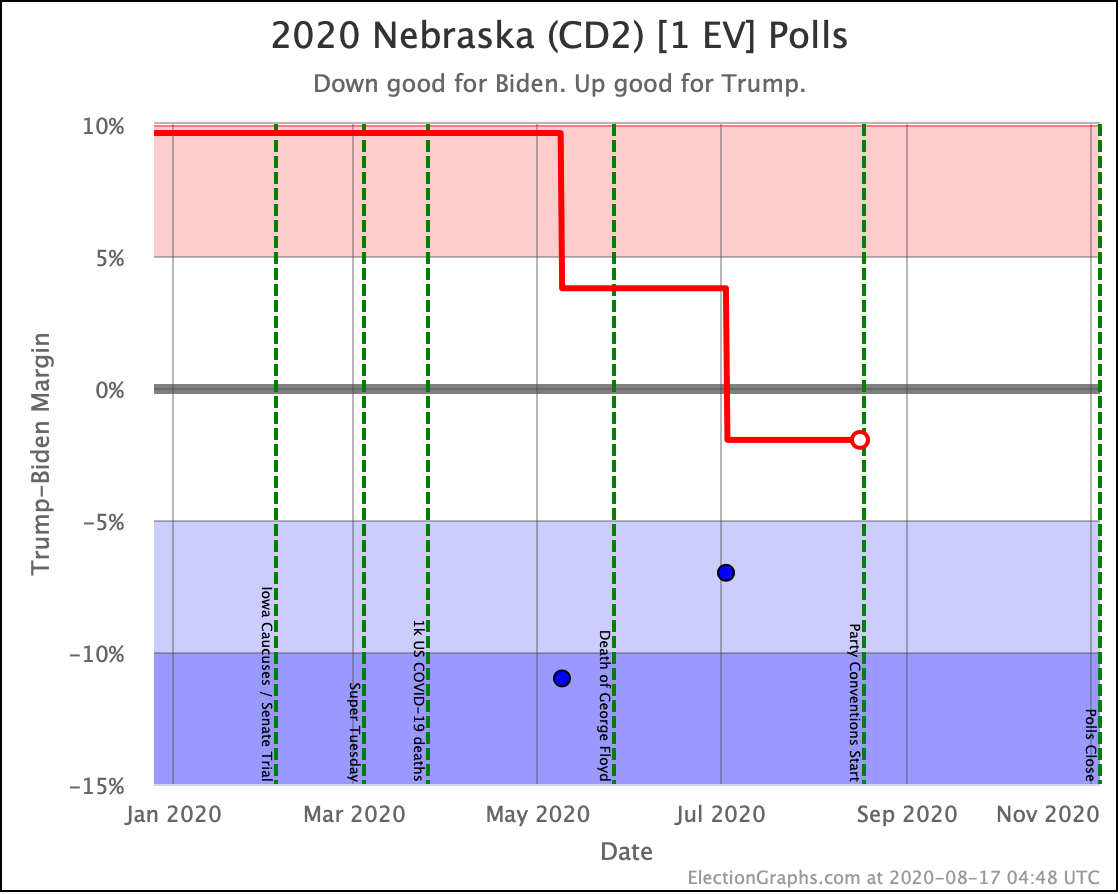
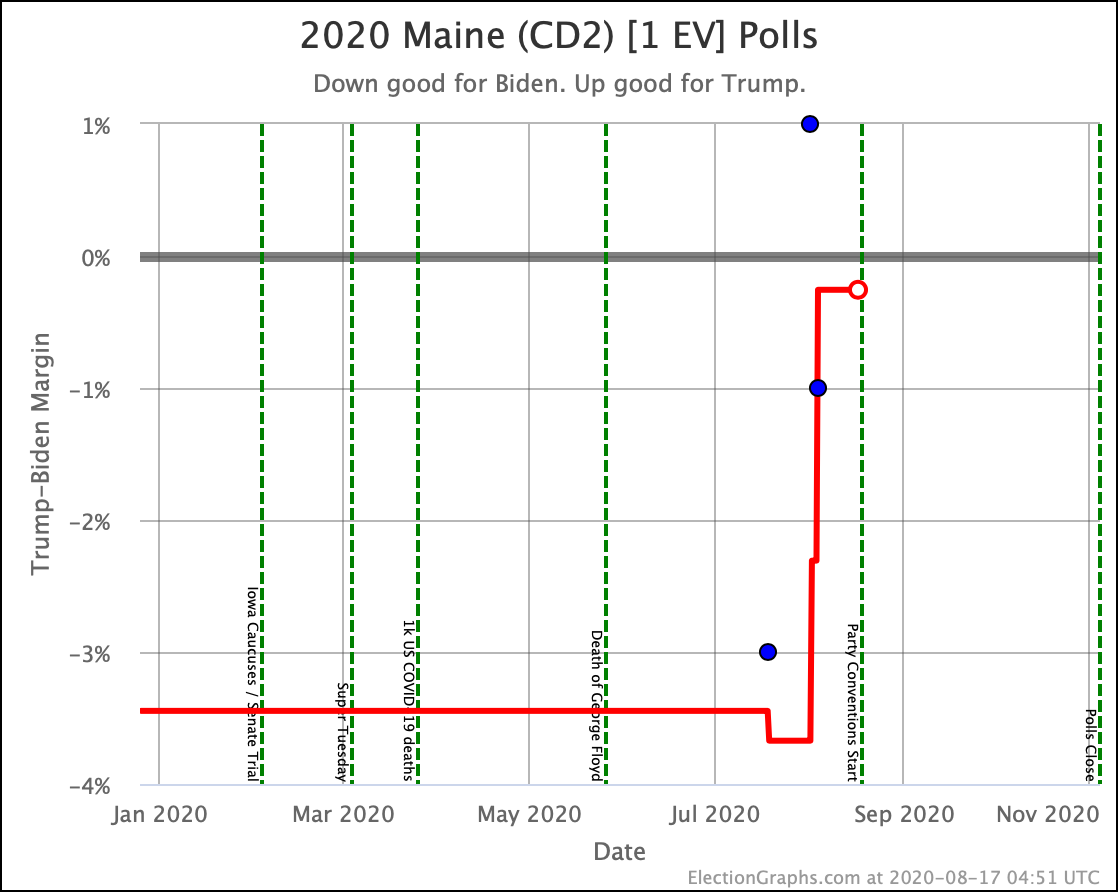
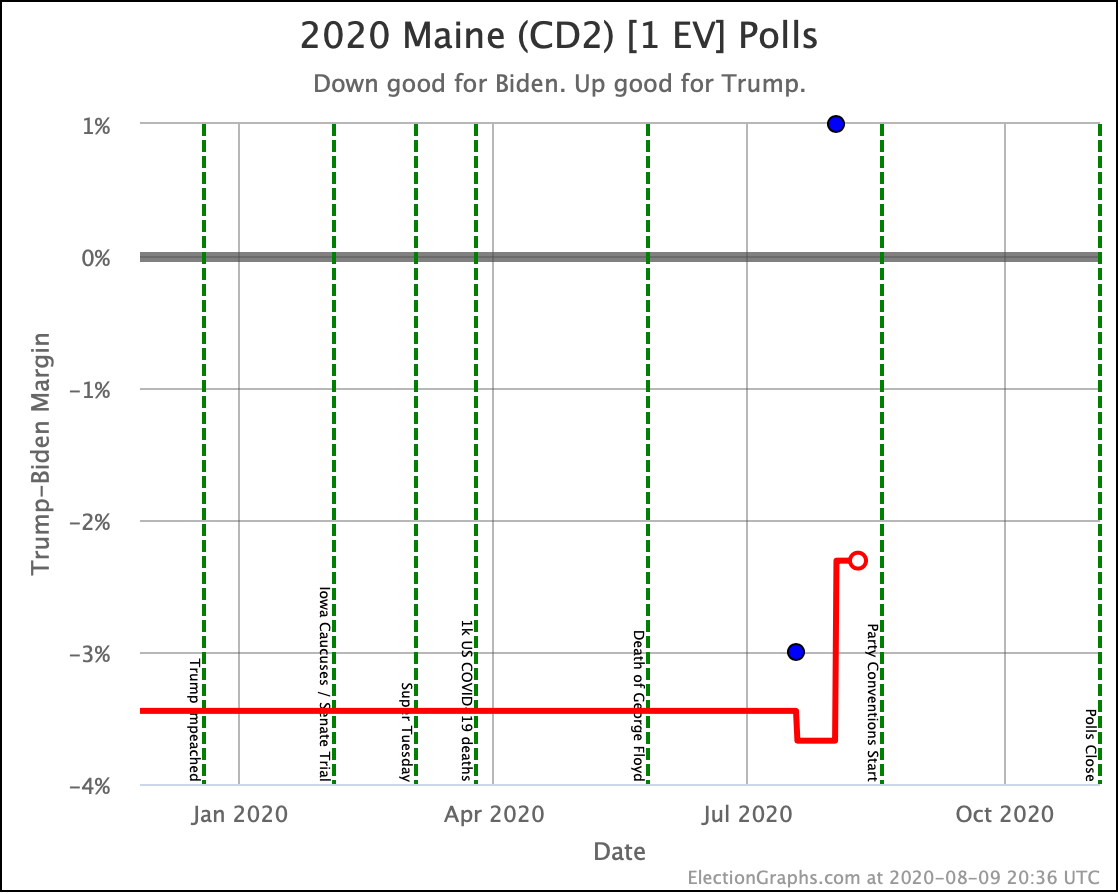
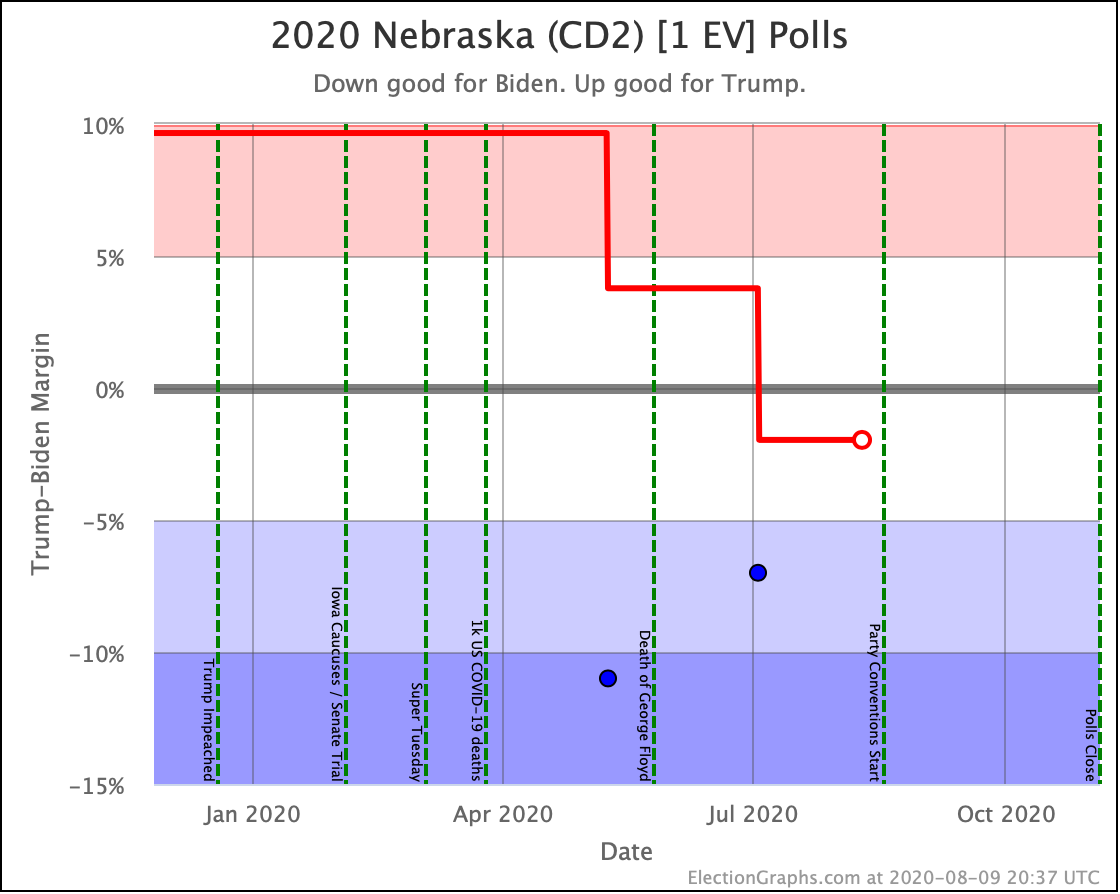
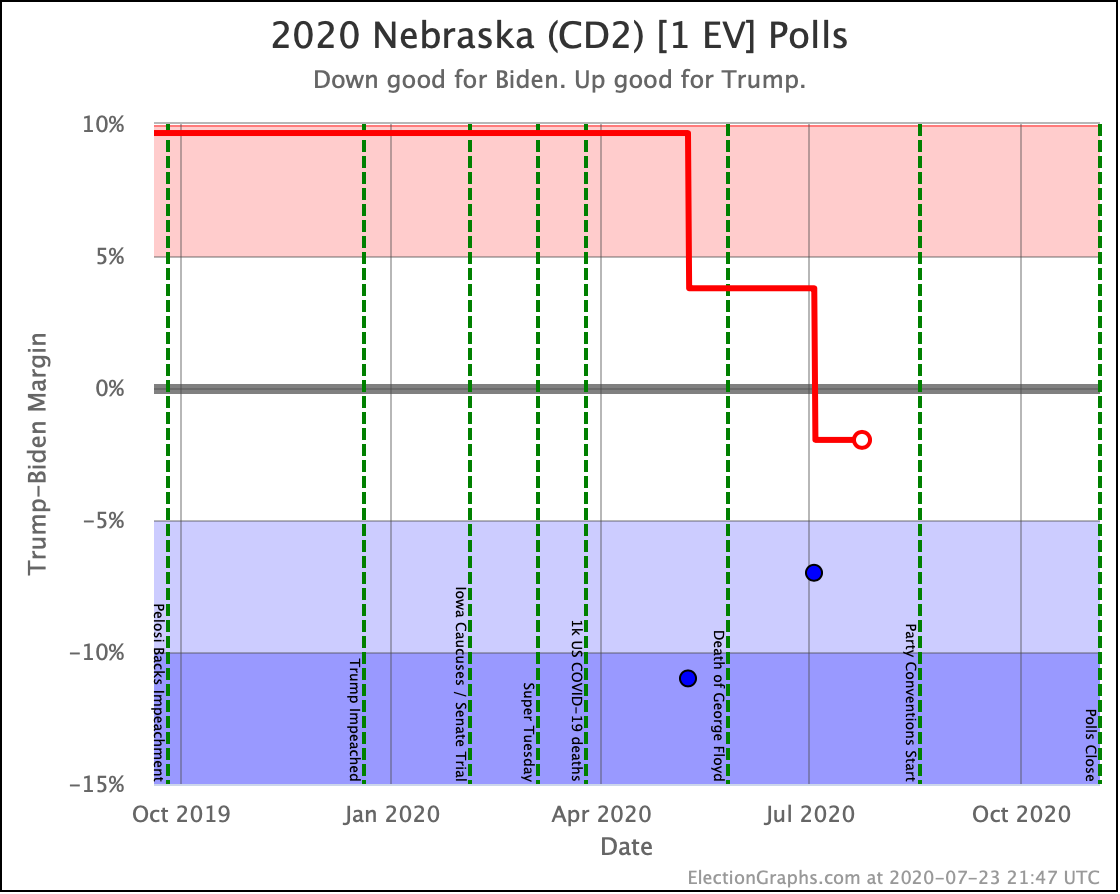
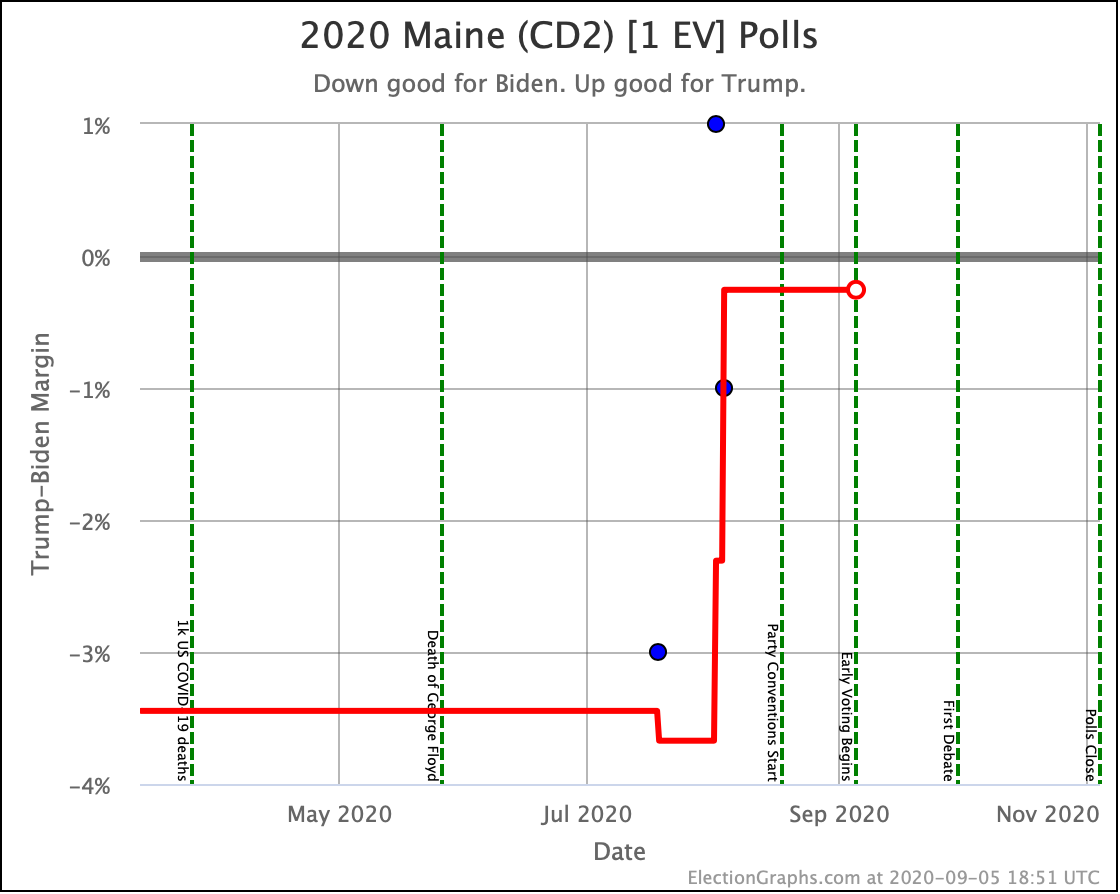
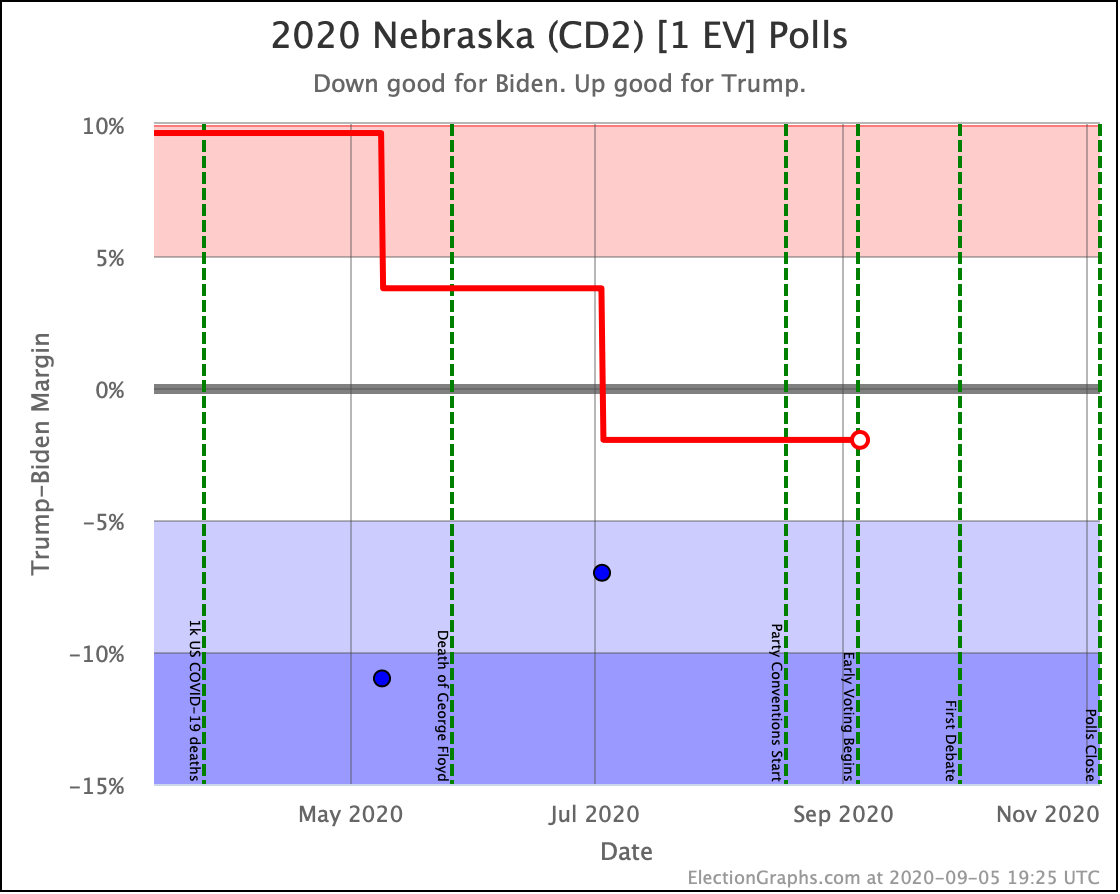
In our categorization view, this ends up putting Trump's best case at an actual 269-269 tie, which would throw the election into the House of Representatives. To get to that Trump would need to win all that states he is ahead in, all five states where Biden is ahead by less than 5%, and also both Maine's 2nd congressional district and Nebraska's 2nd congressional district. But if that happened… tie.
As always though, we want to look beyond the simple categorization of states based on the averages. So a few more states to look at.
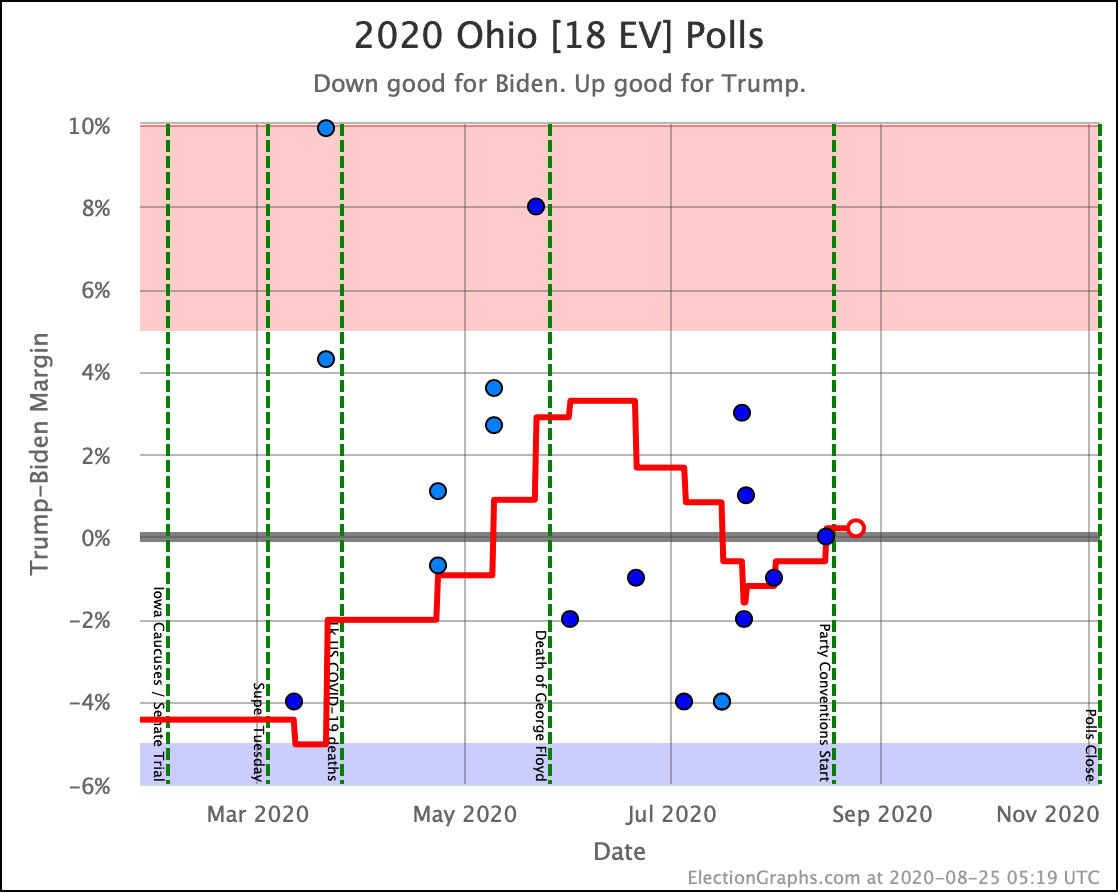
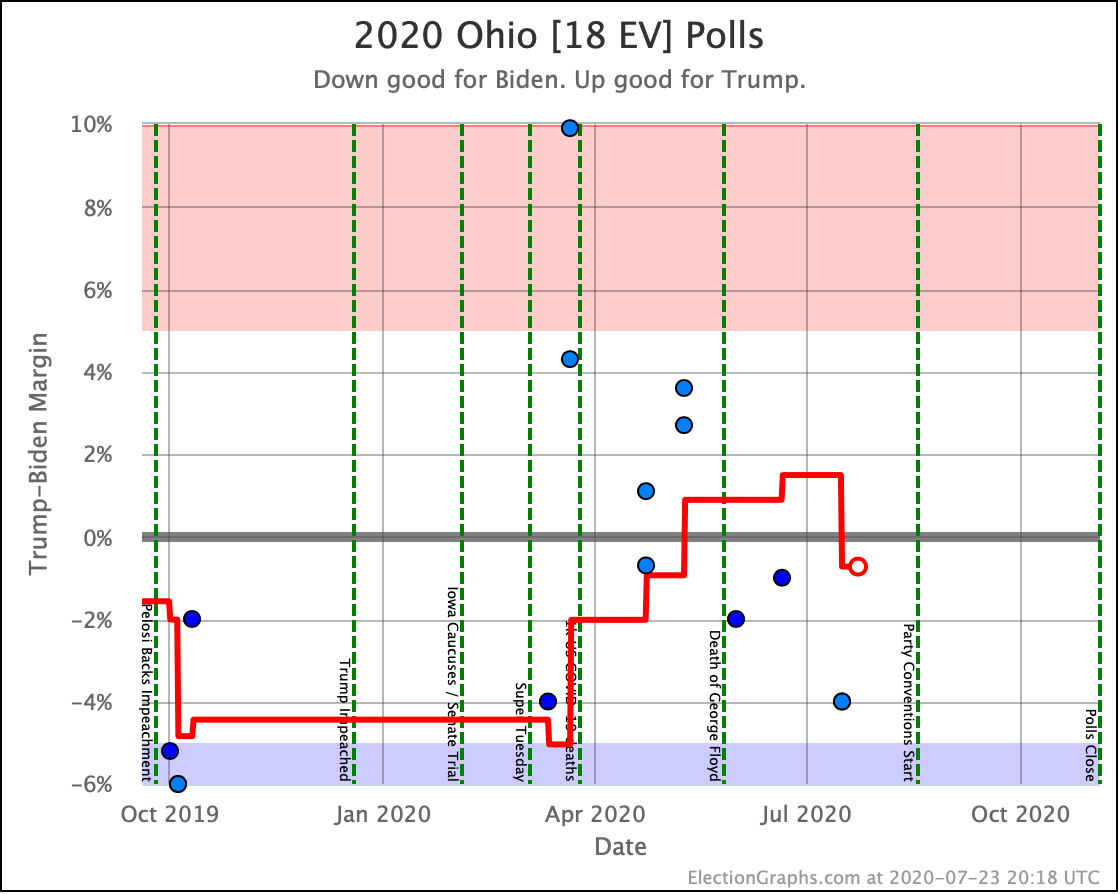
In addition to the states above that changed categories and stayed there, there were three additional states that moved in or out of "Weak Biden" and "Weak Trump", but then moved back again, leaving no net category change in the last 10 days, even though the actual average moved around a bit. In some cases, you can't even see the category change in the charts anymore, because the timing of the polls actually erased the change. But here they are anyway:
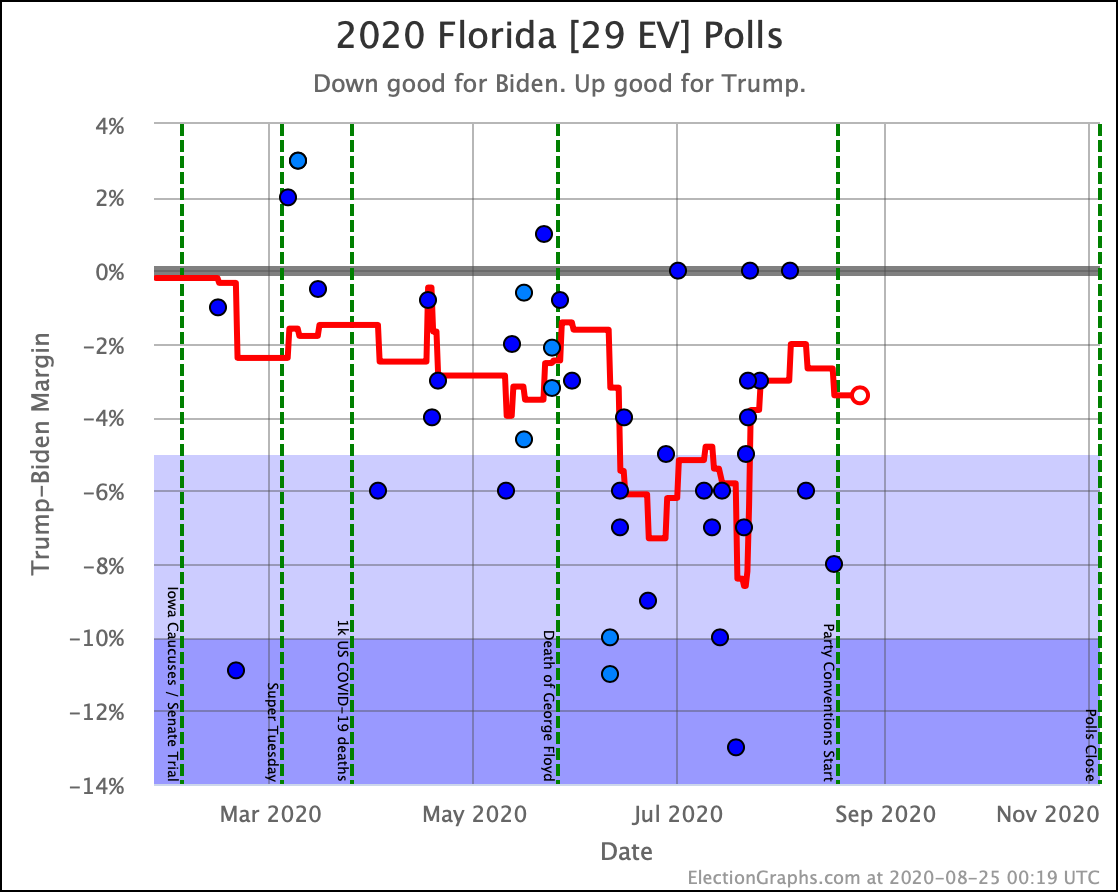
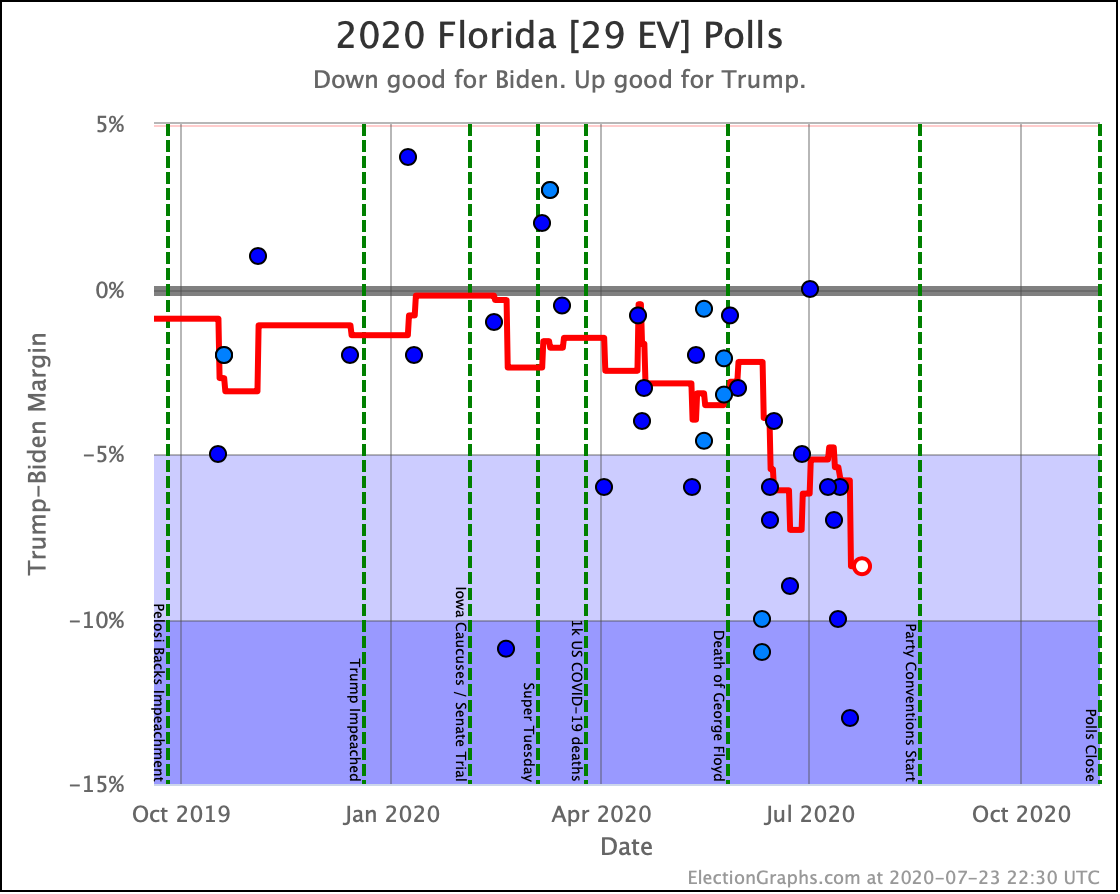
And finally, the locations with margins under 5% that didn't change categories at all this time around:
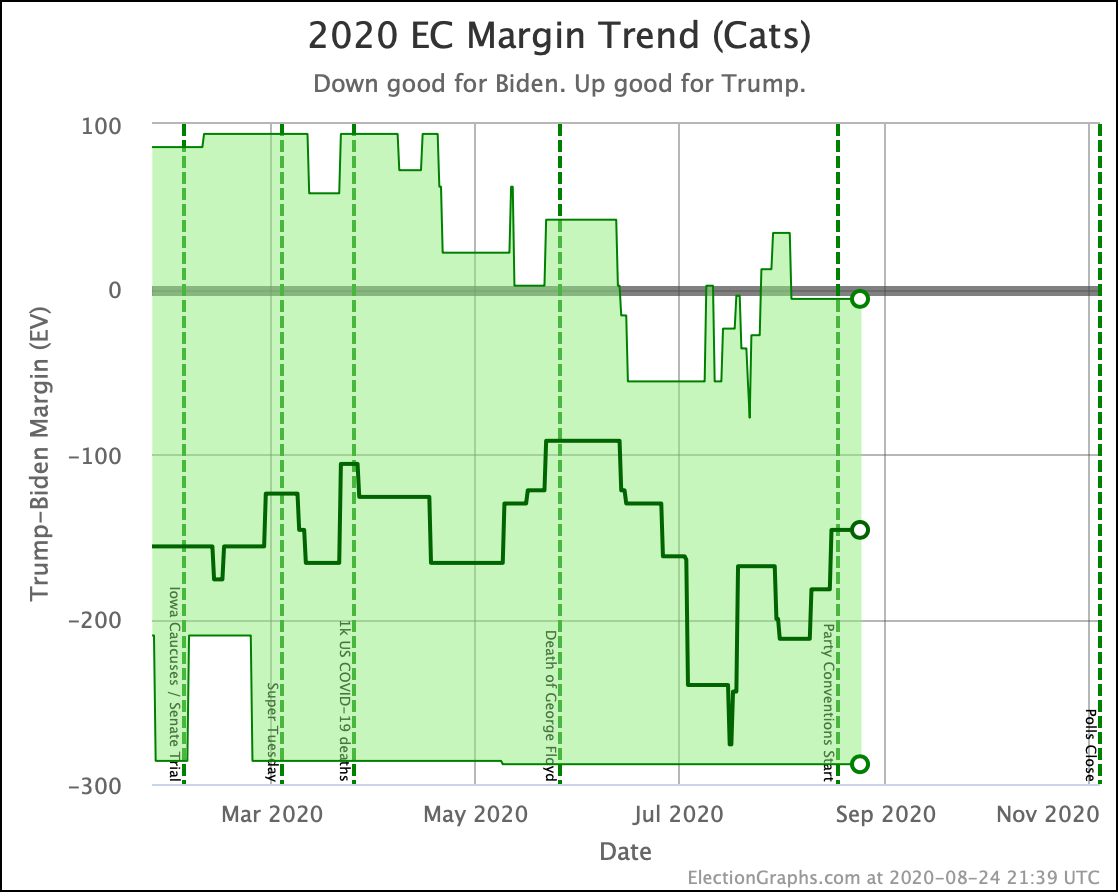
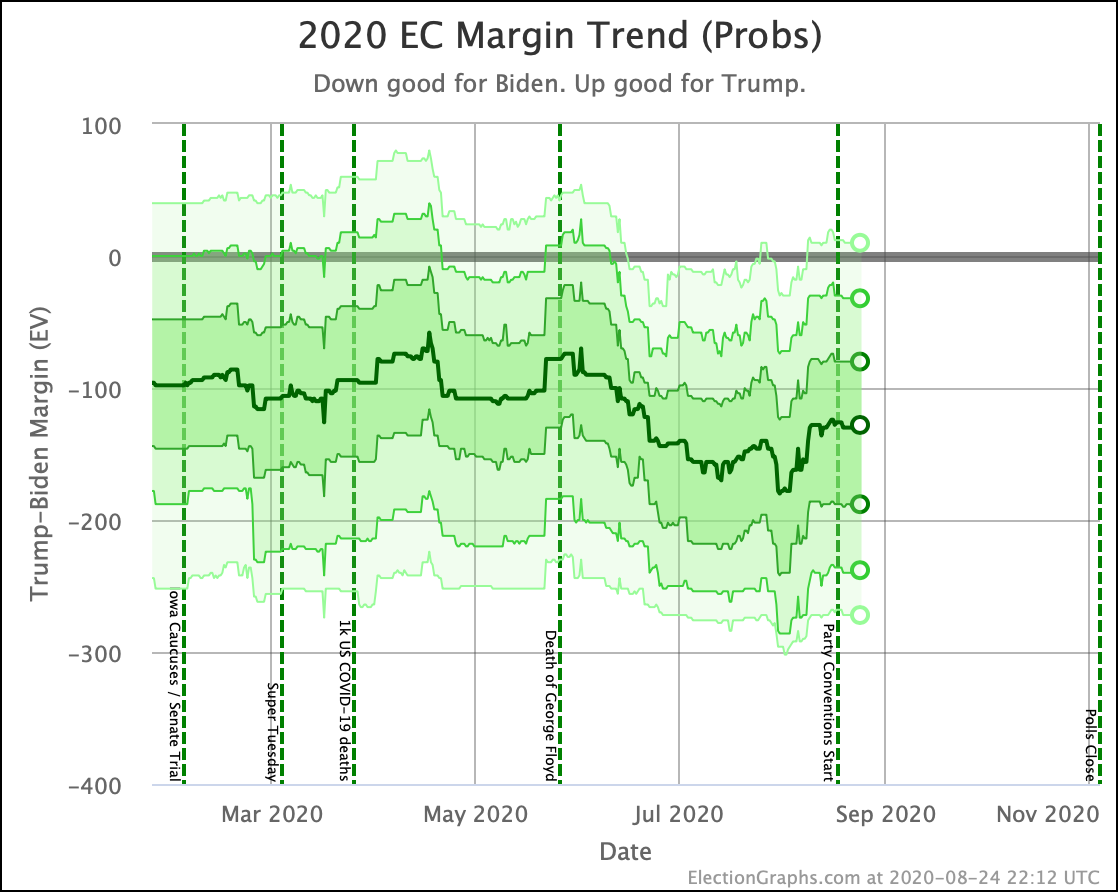
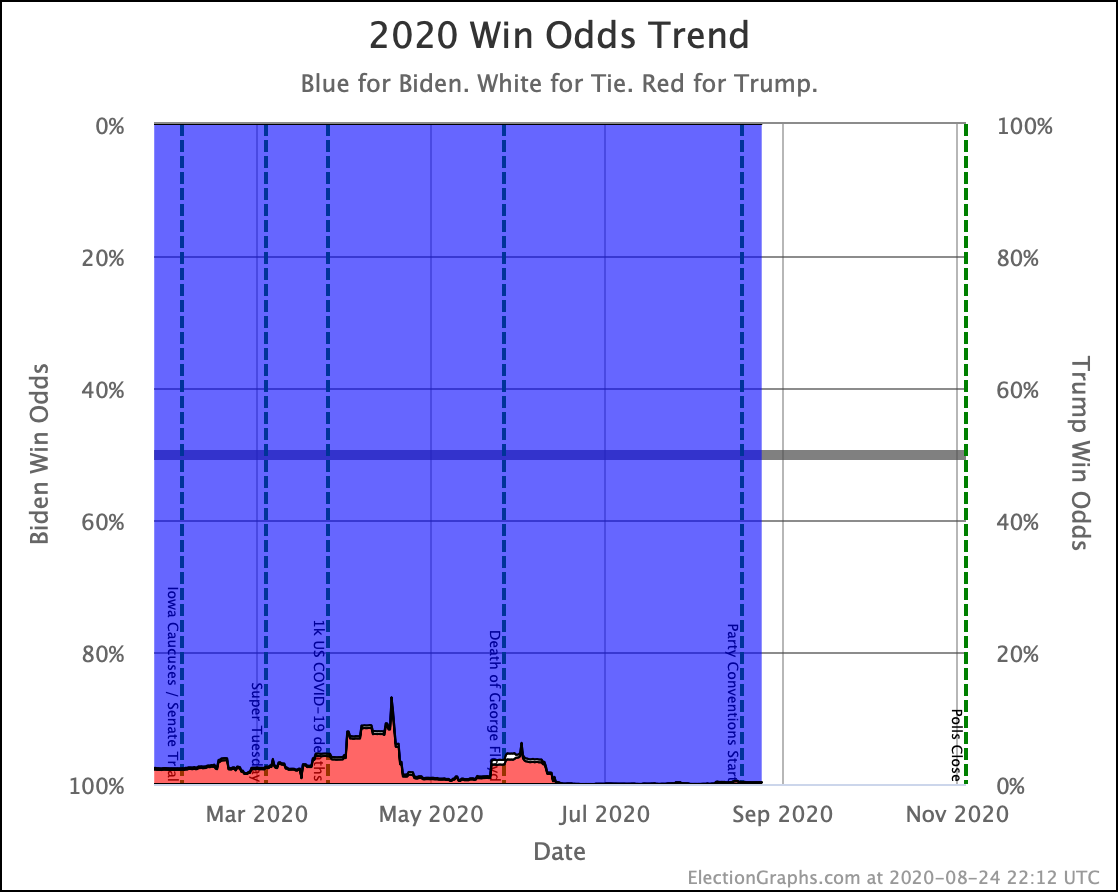
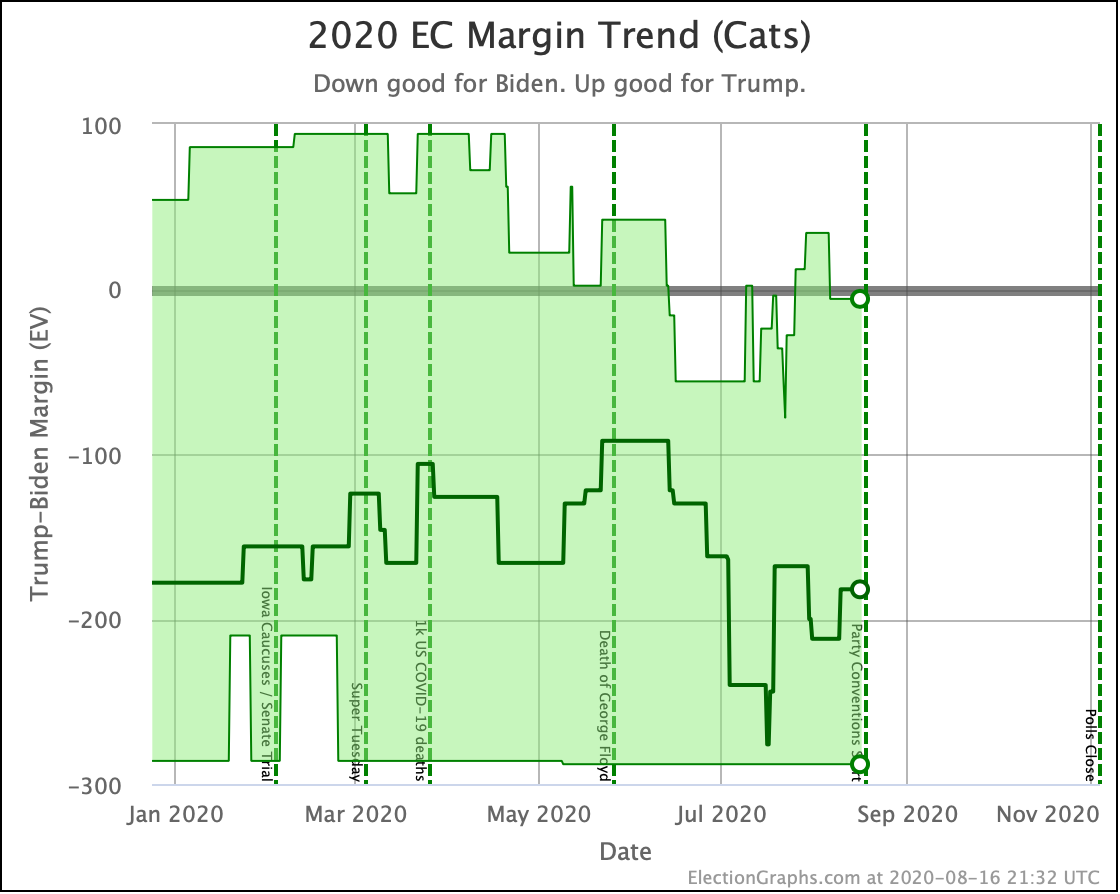
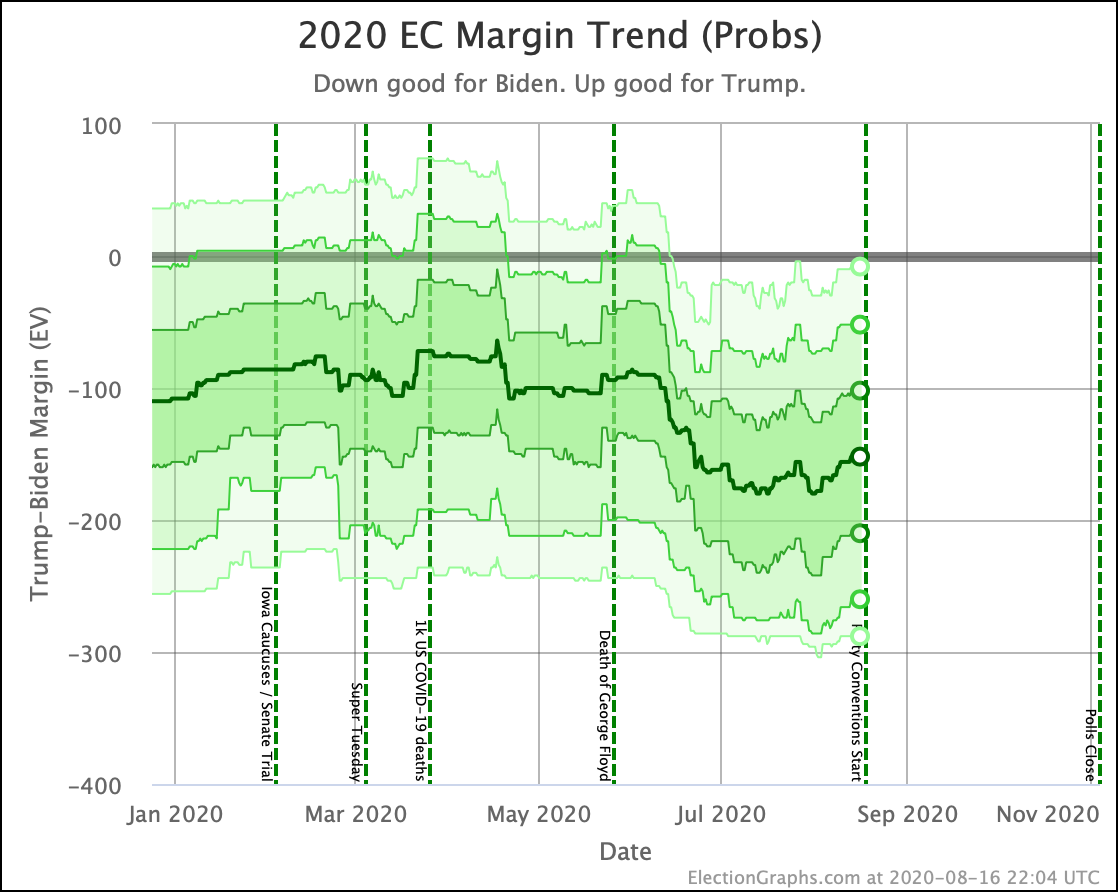
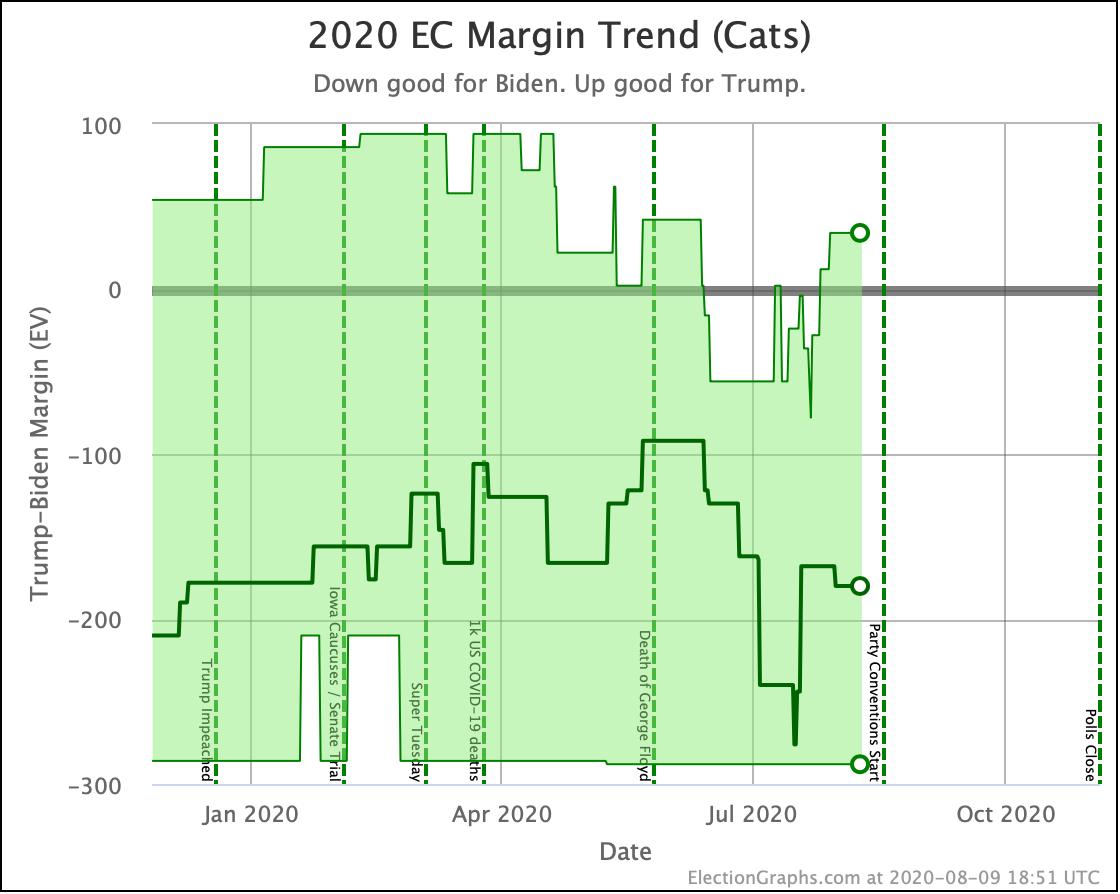
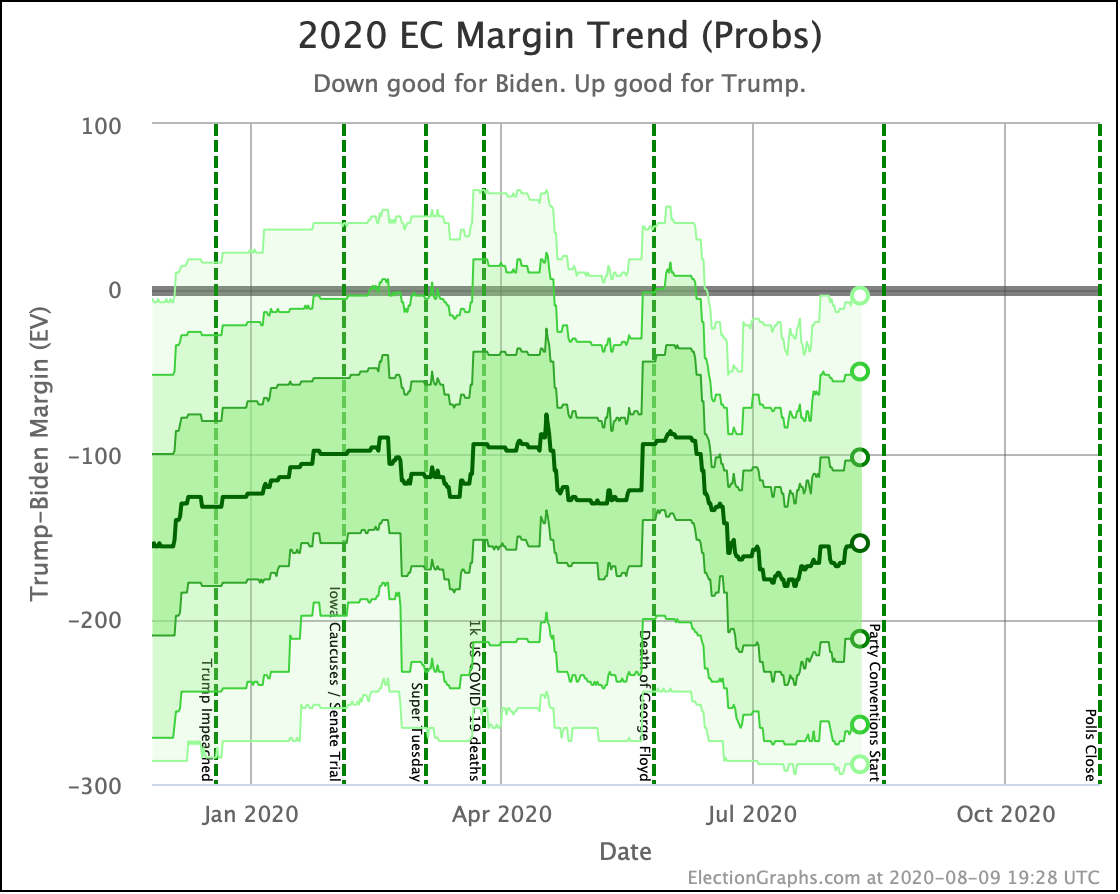
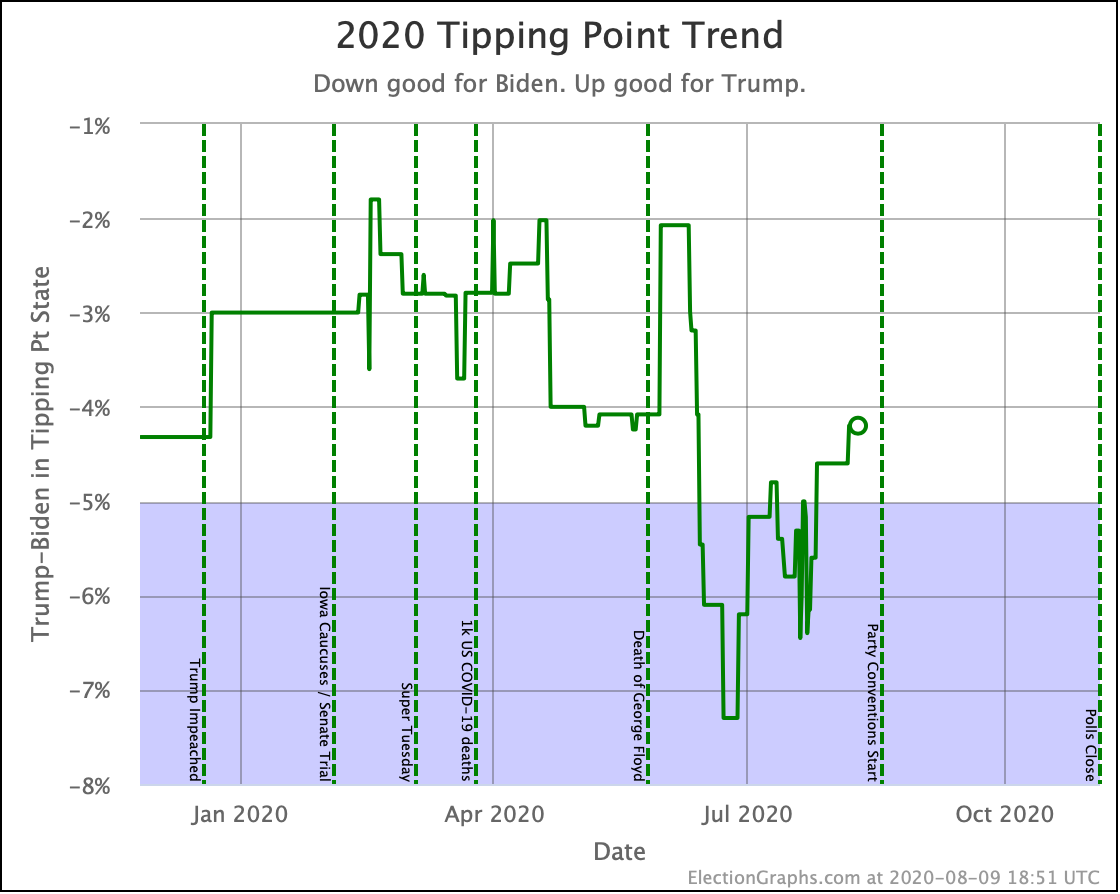
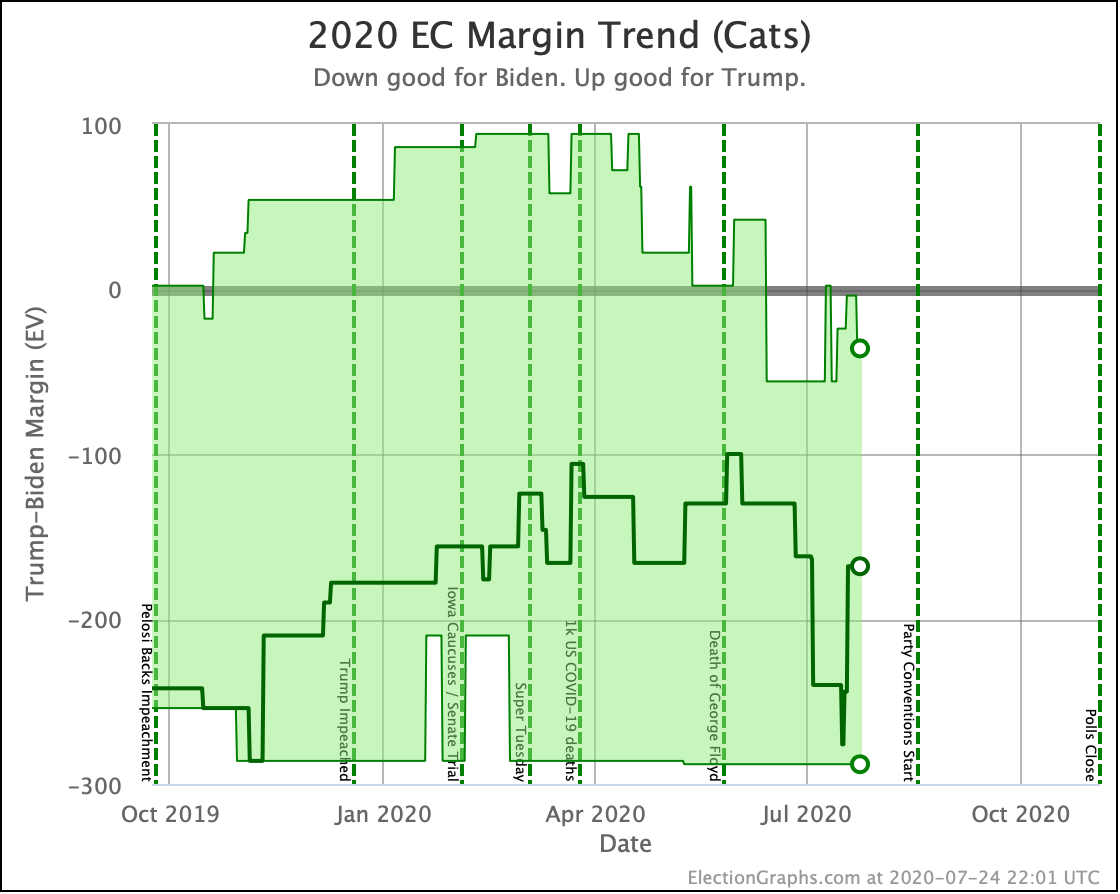
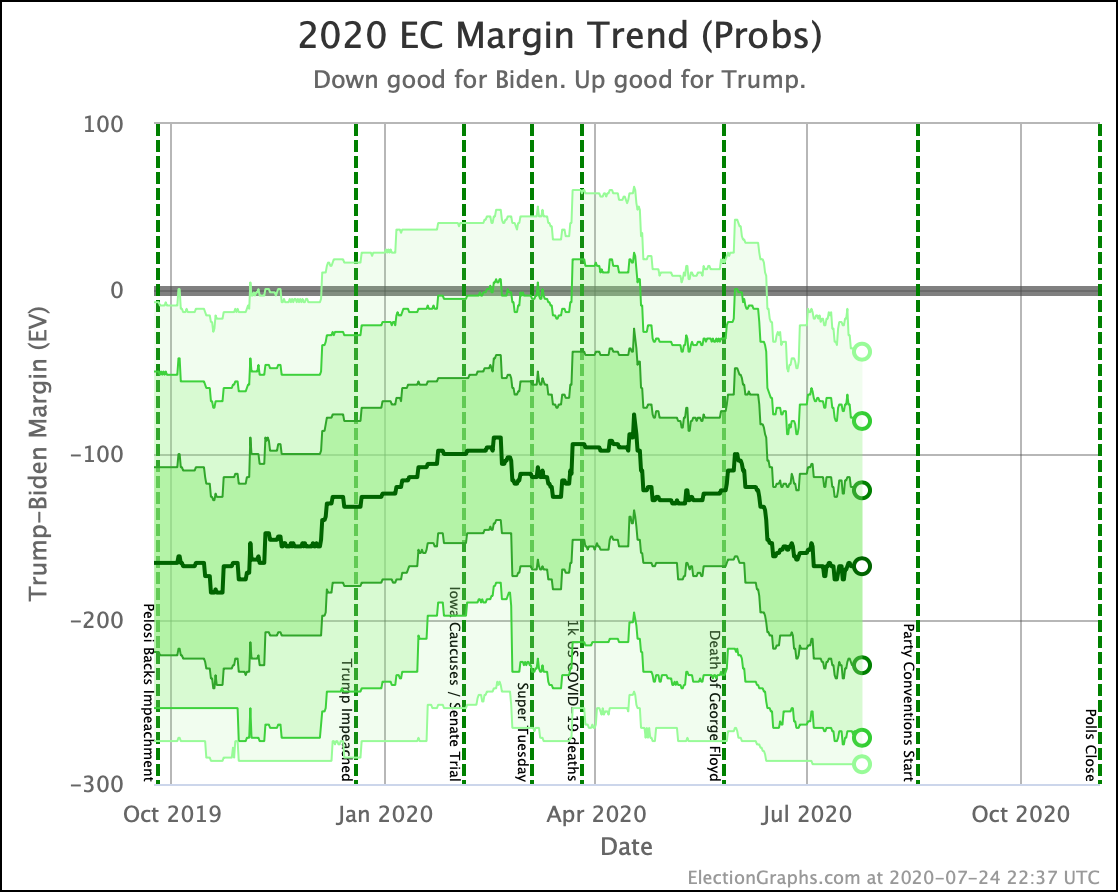
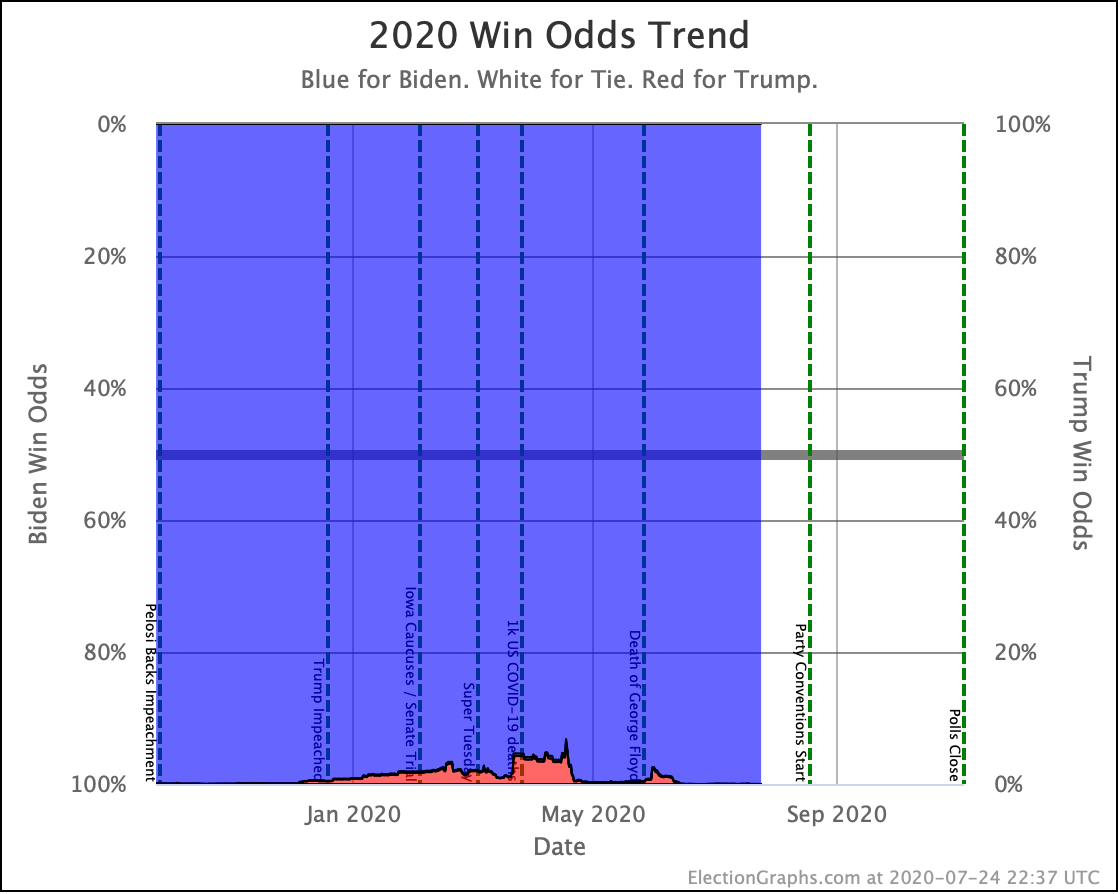
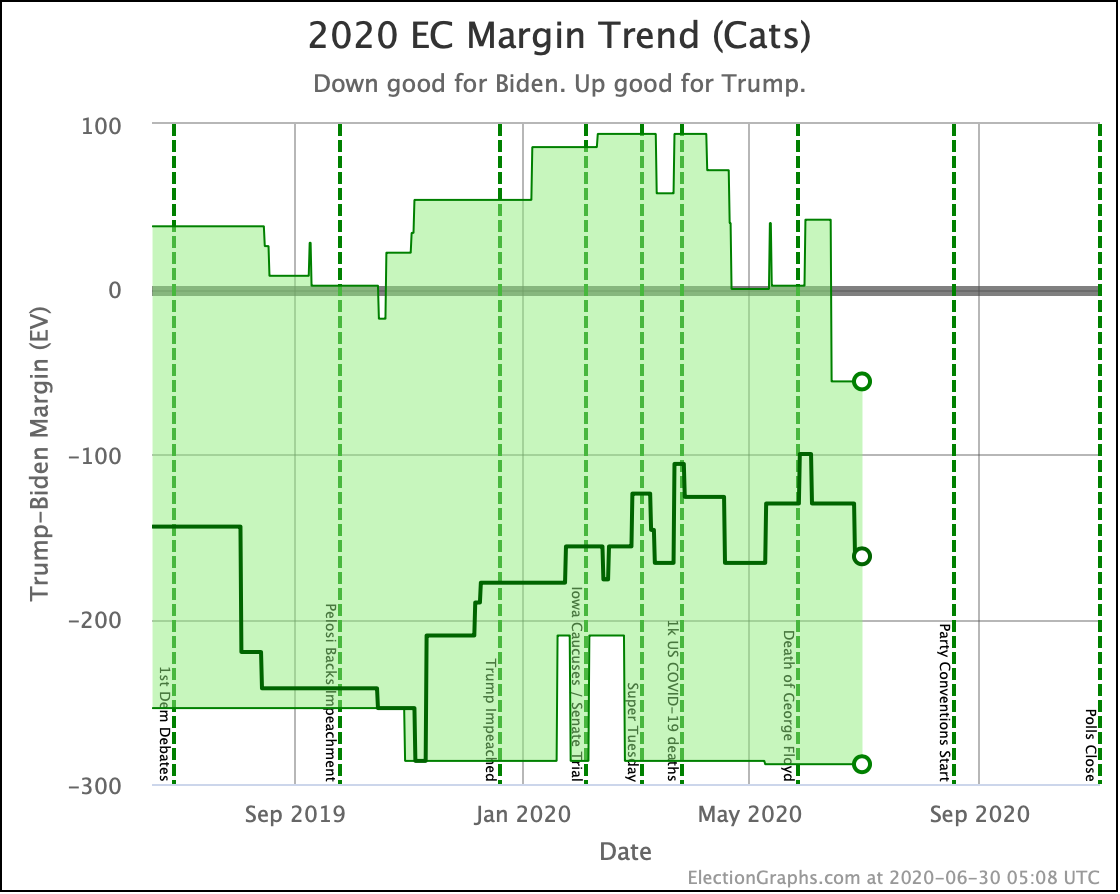
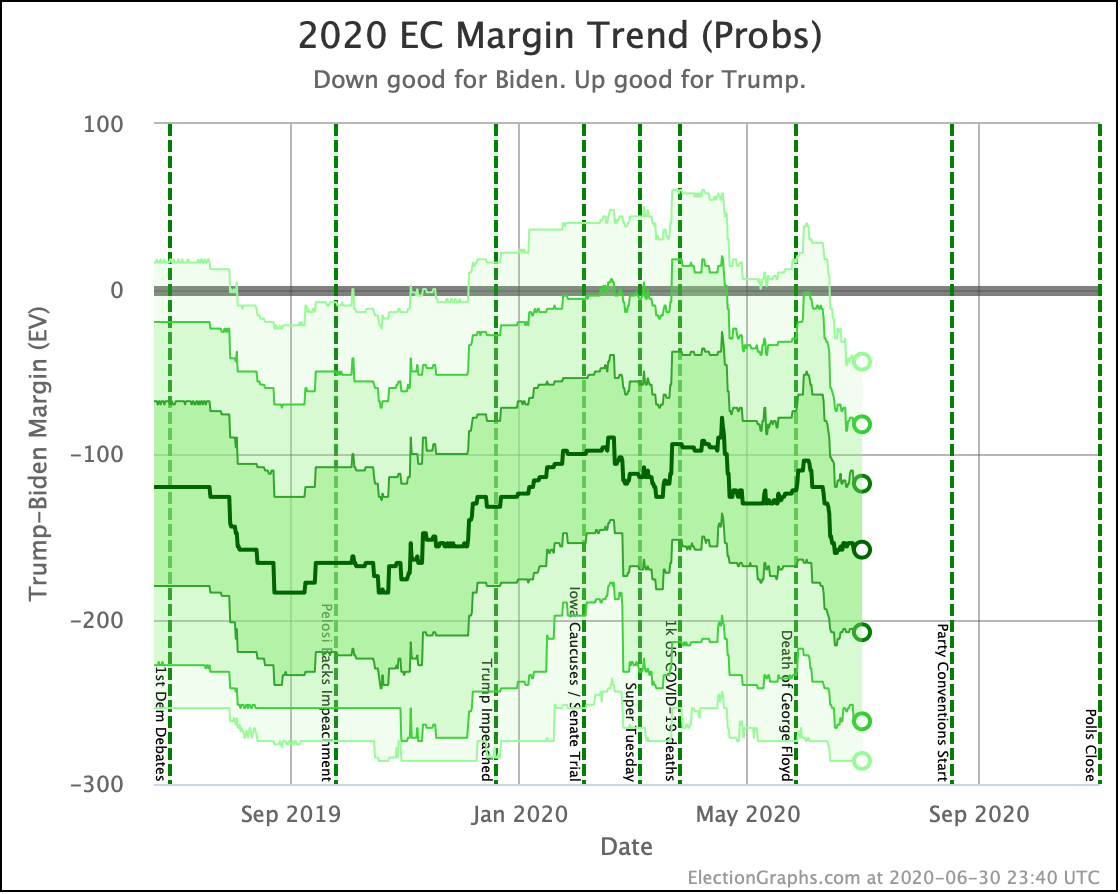
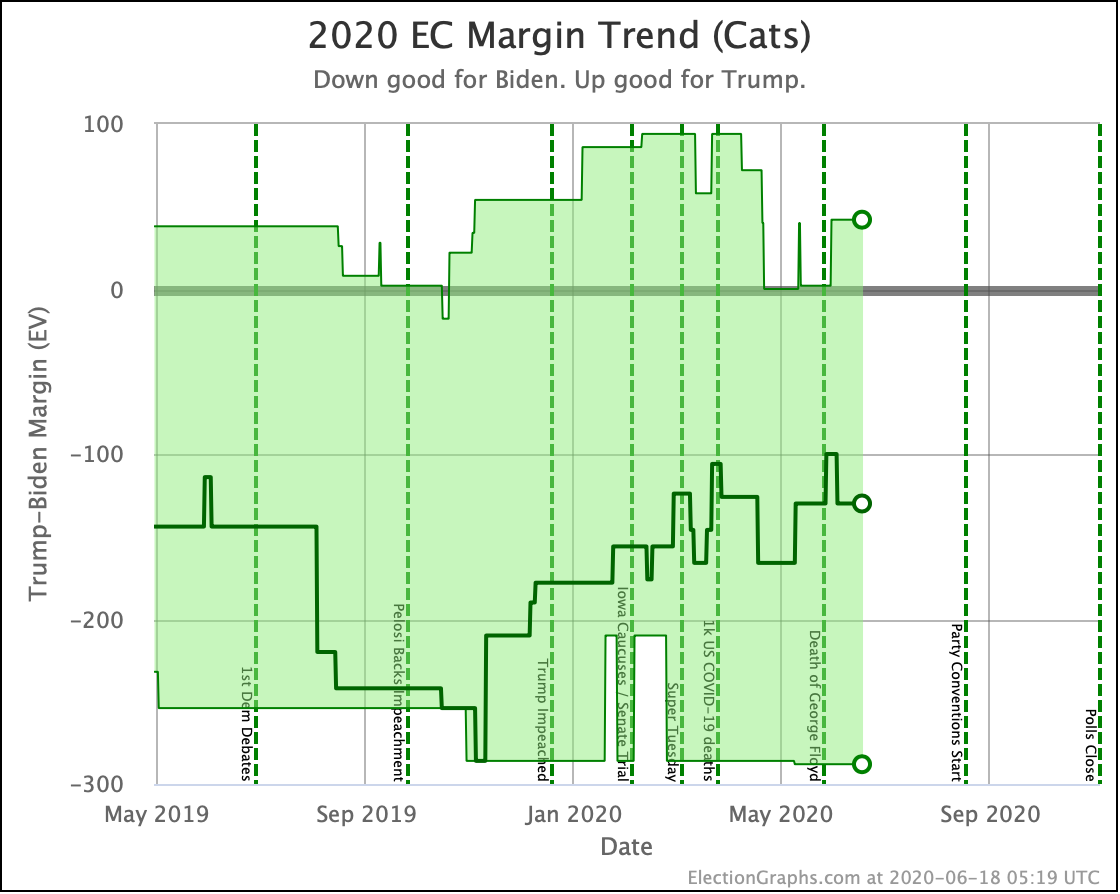
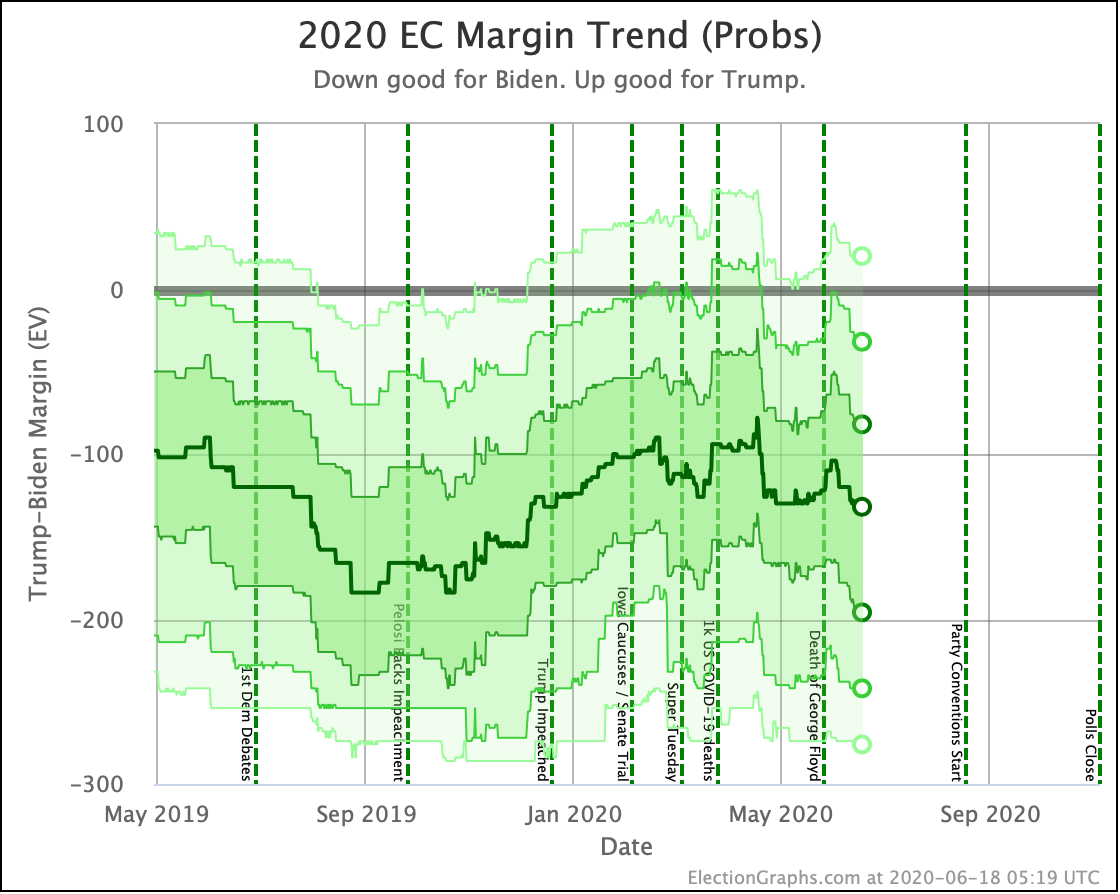
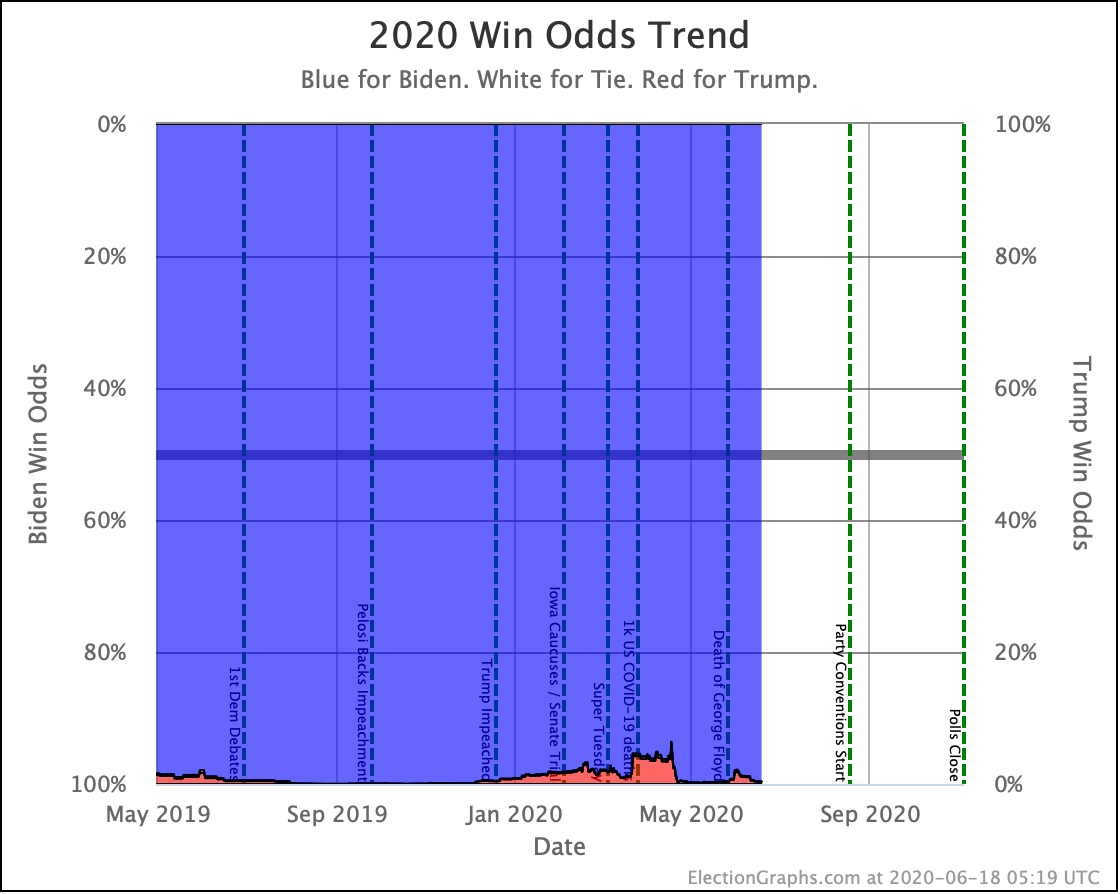
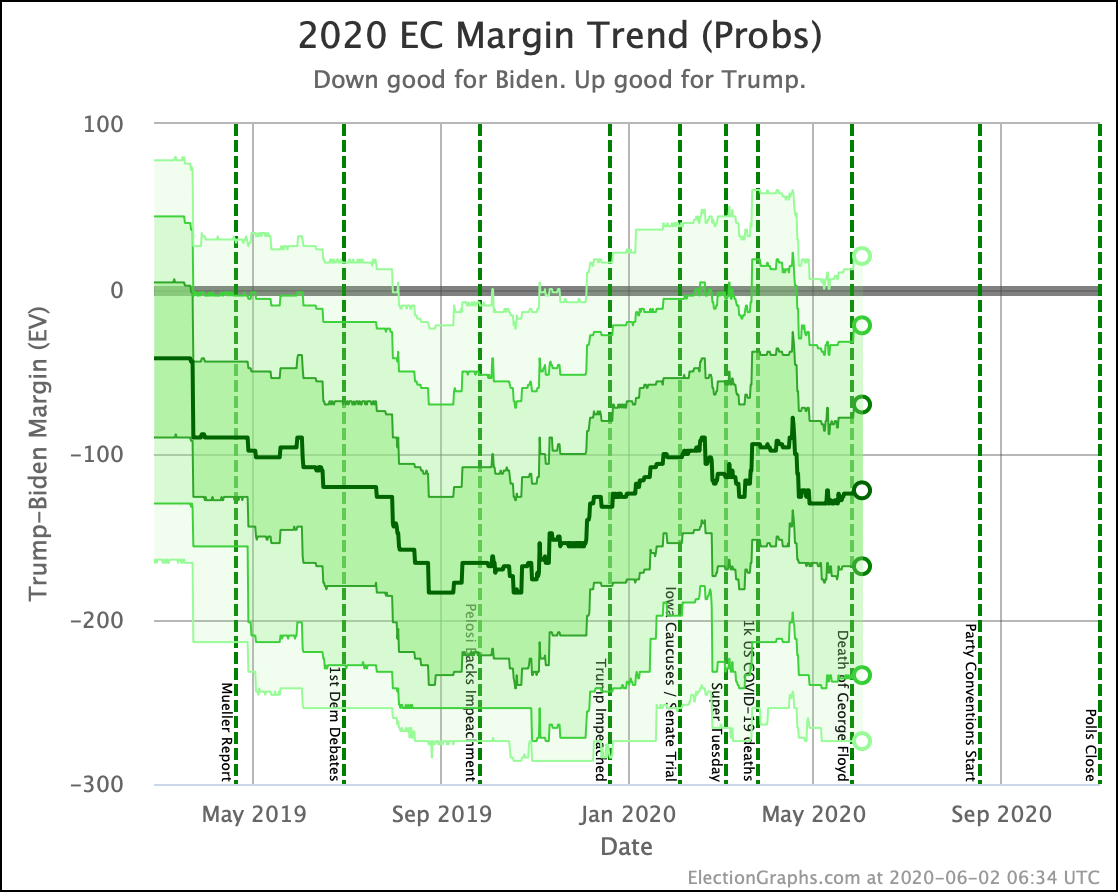
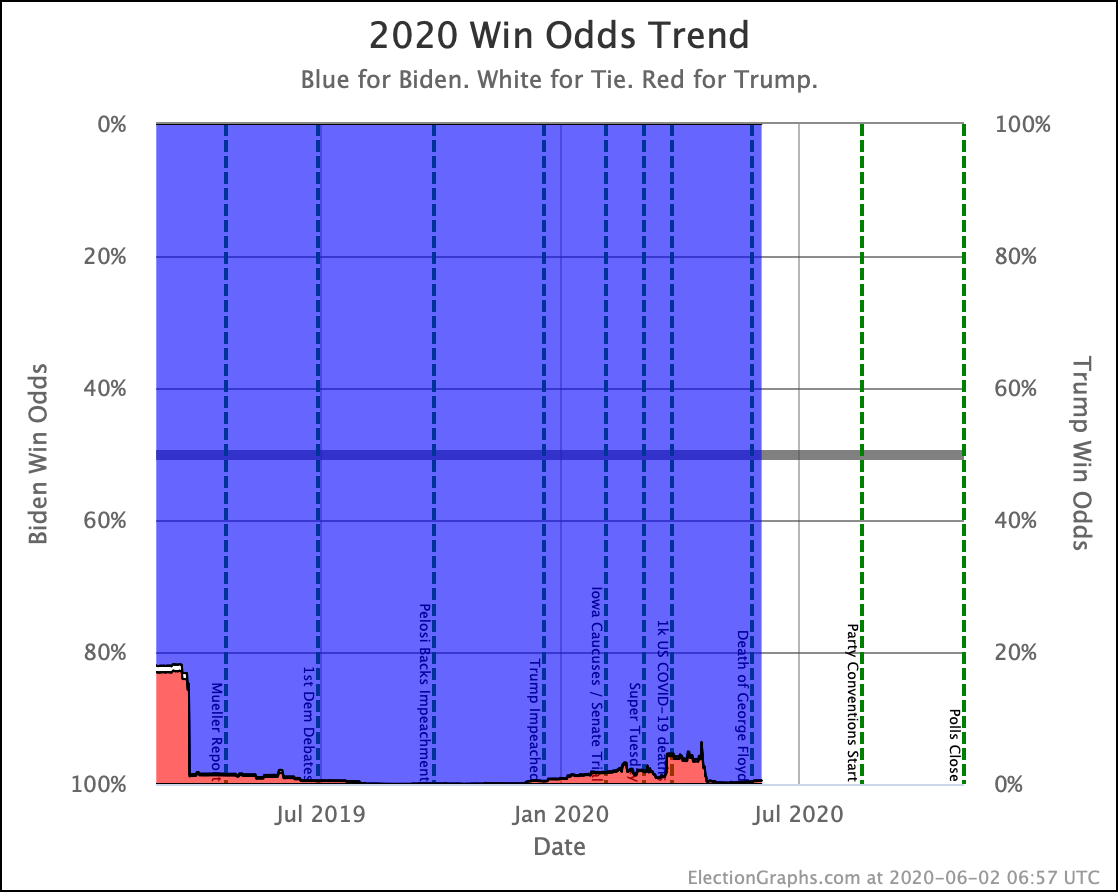
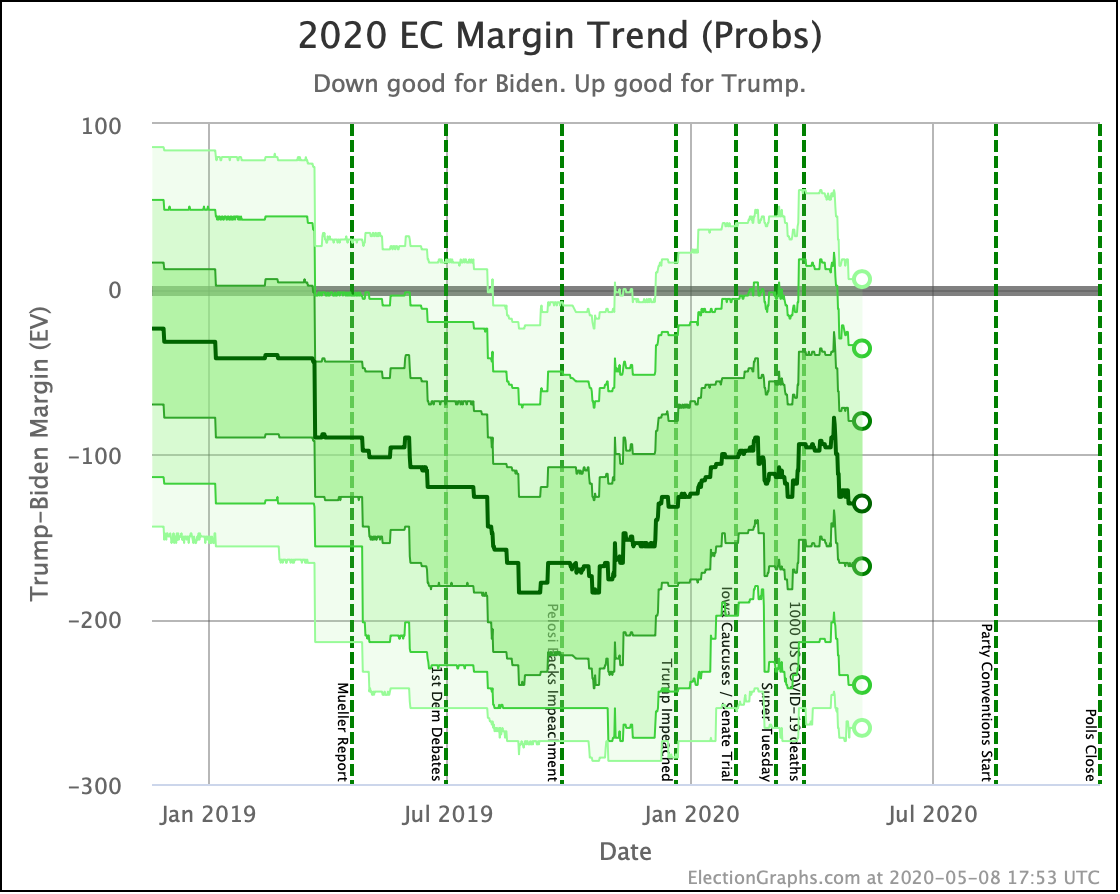
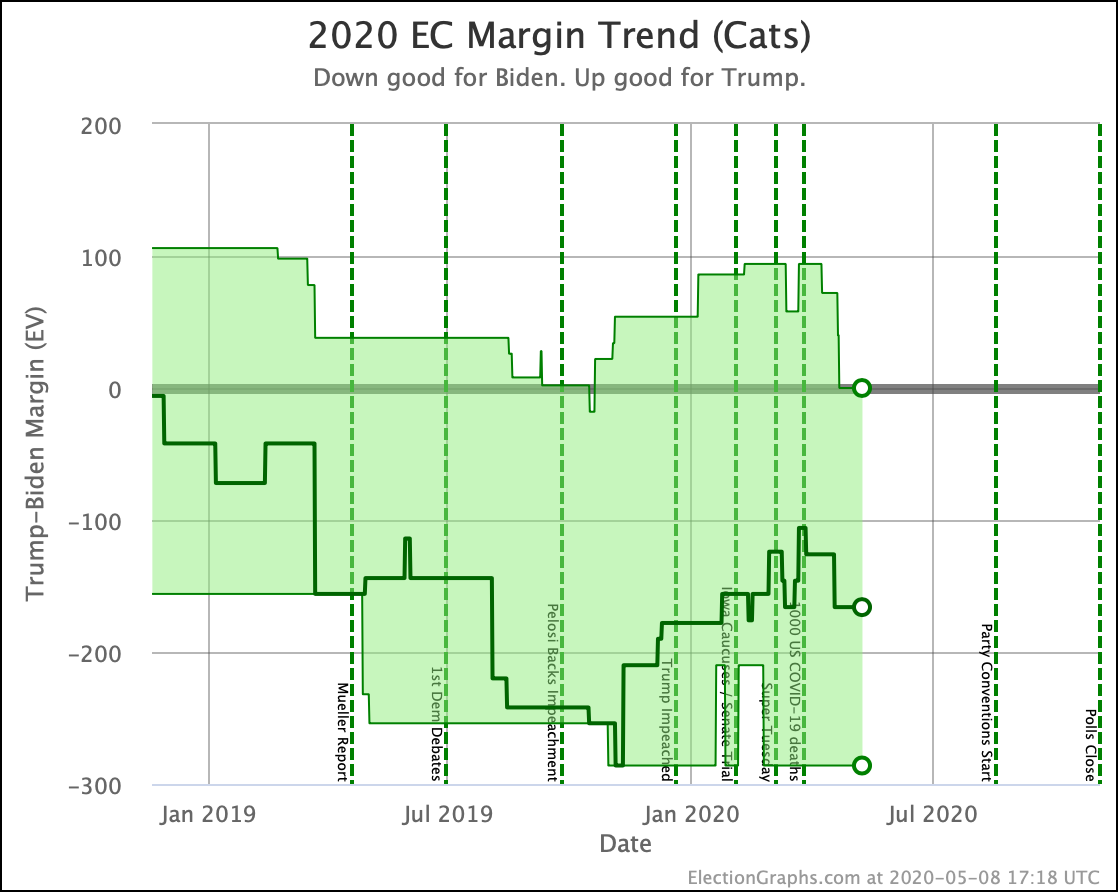
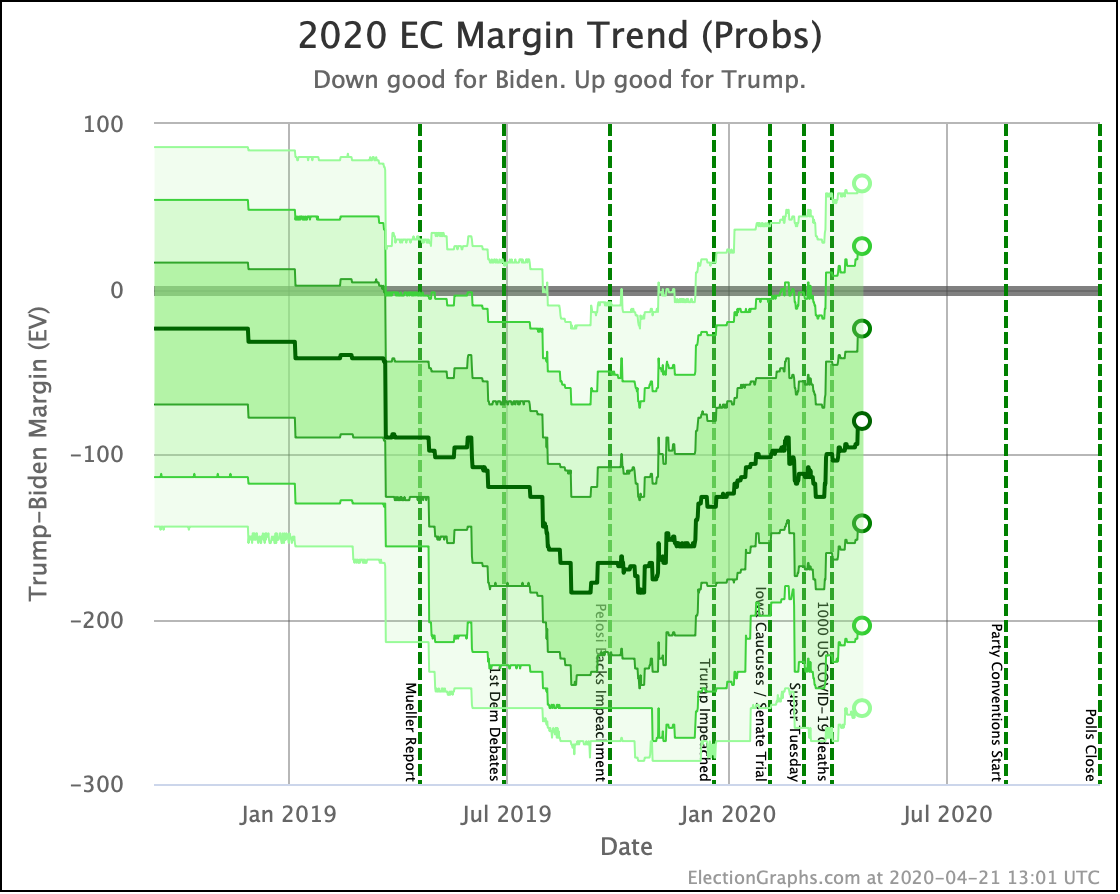
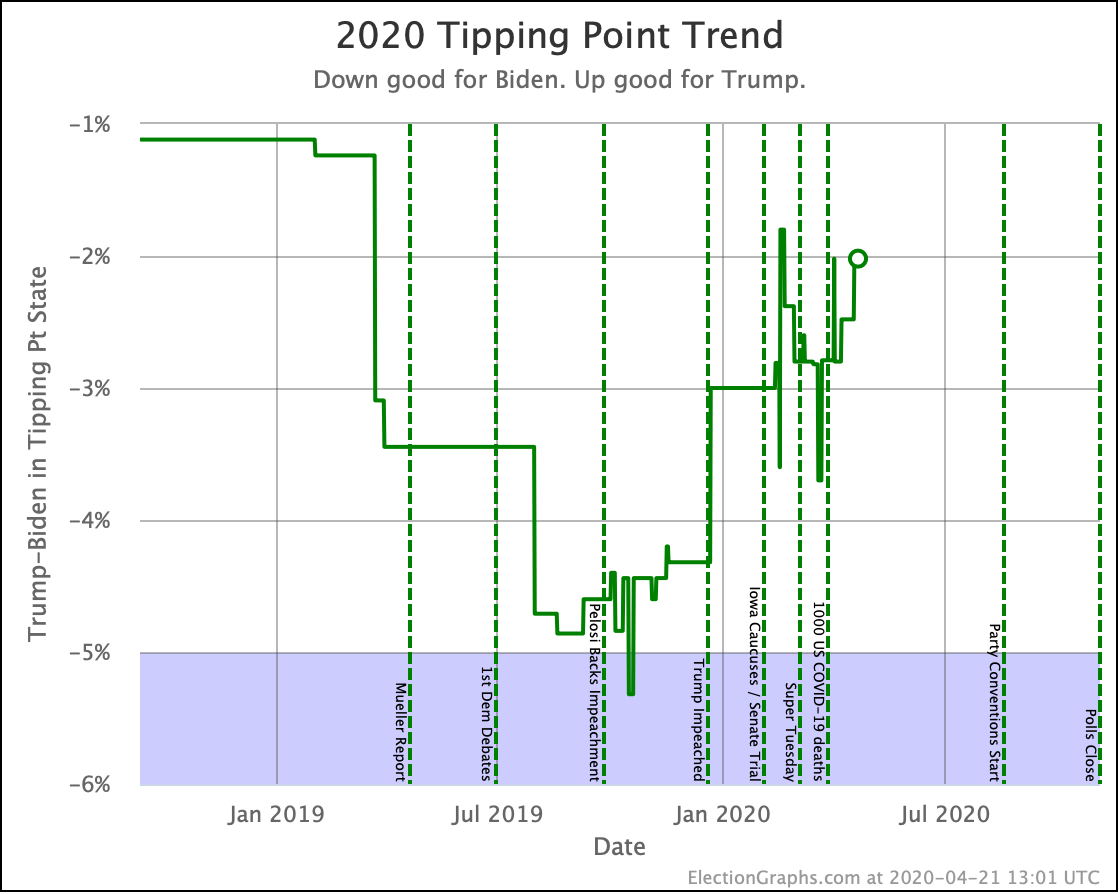
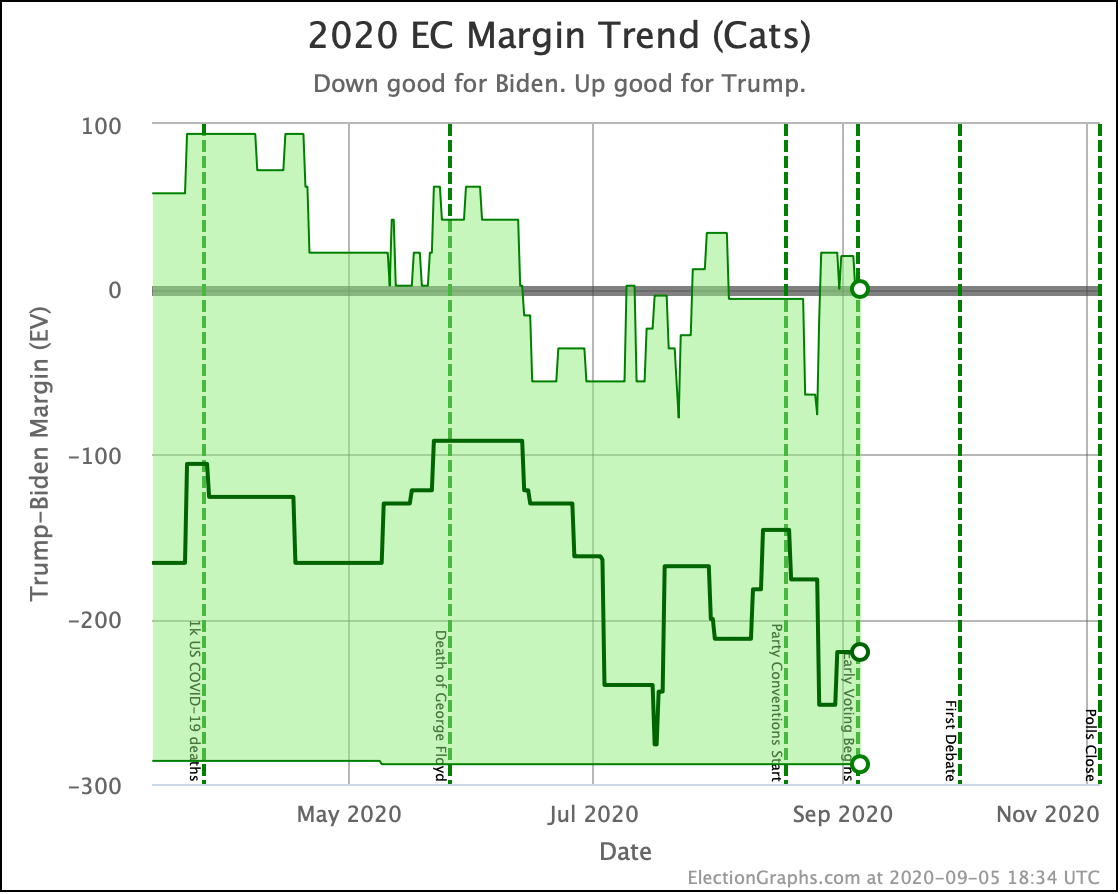
Putting all of this together into our probabilistic model, you get this trend:
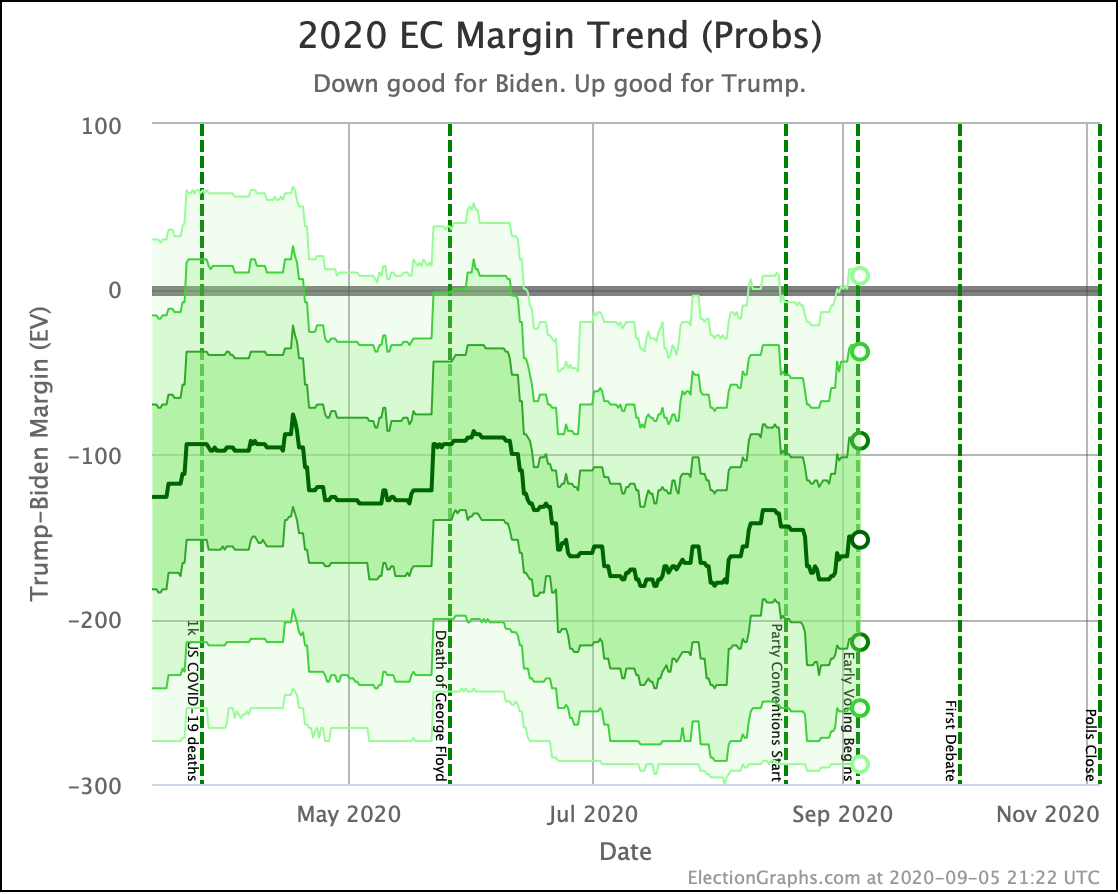
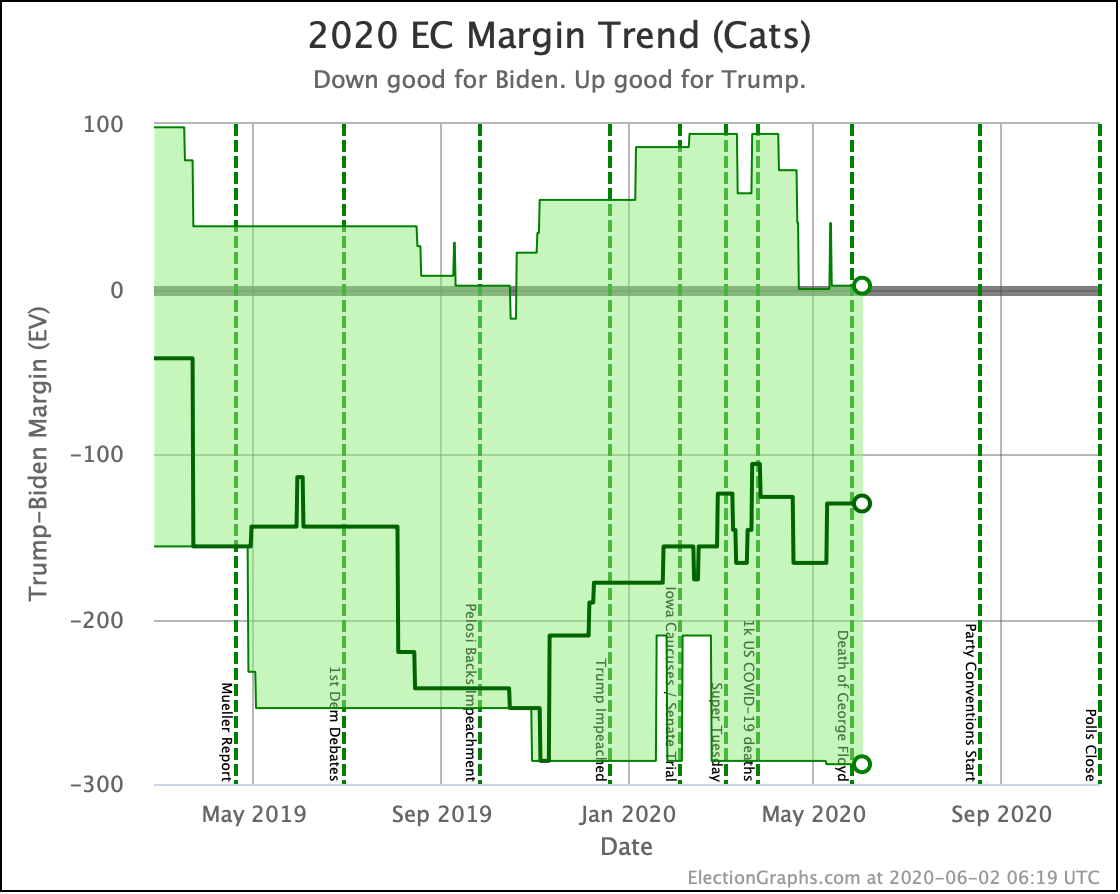
Looking at the center median line, we can see a move toward Biden as the Democratic Convention happened, with that leveling off, then a move back toward Trump again starting as the Republican convention was going on. As of right now, Biden is a little bit better off in this view than he was right before the conventions started.
Basically though, we been in the same sort of range since the bigger movement toward Biden in June. The median has not left the Biden by 134 to Biden by 180 zone since the end of June.
We HAVE, on the other hand, seen the upper end of these probabilistic bands increase. These are the lines showing the best scenarios for Trump. They bounce around a lot but have generally been creeping upward since the end of June.
This basically indicates a pattern where Biden's electoral college lead has been pretty steady but has been getting more precarious, as leads in a variety of states diminish.
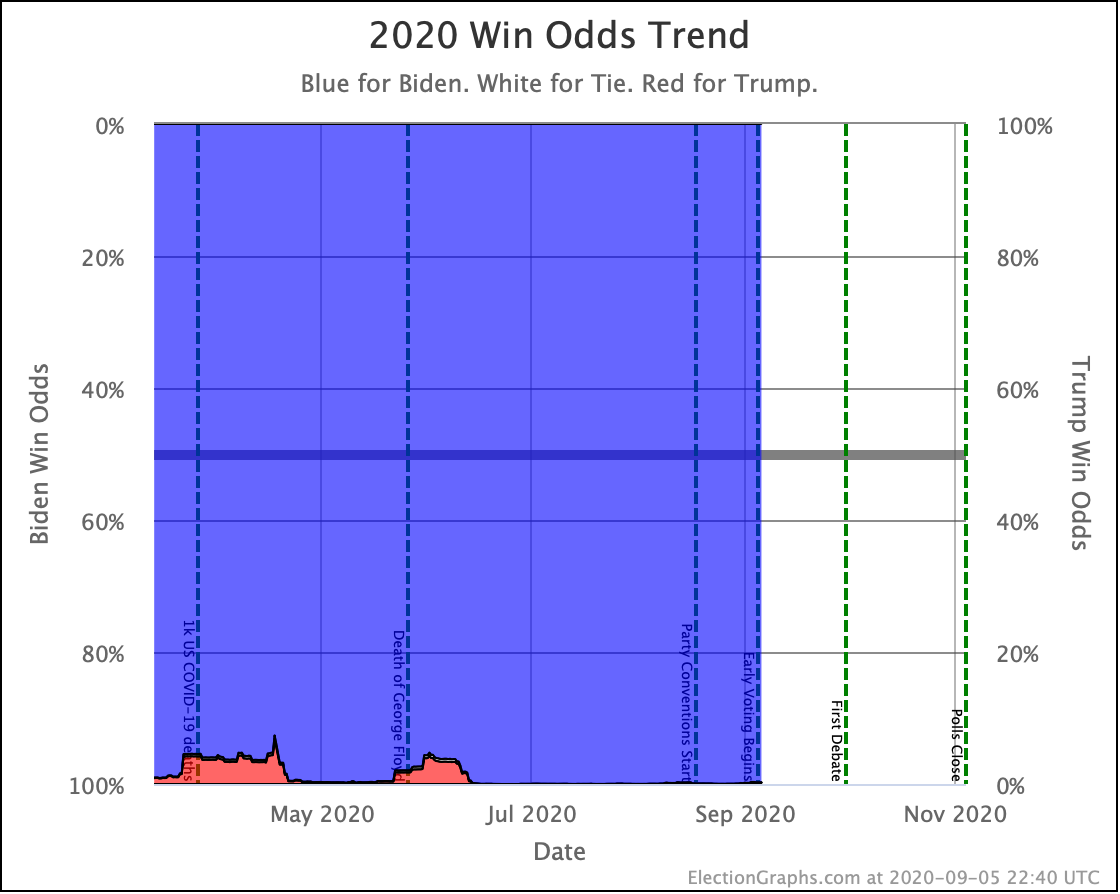
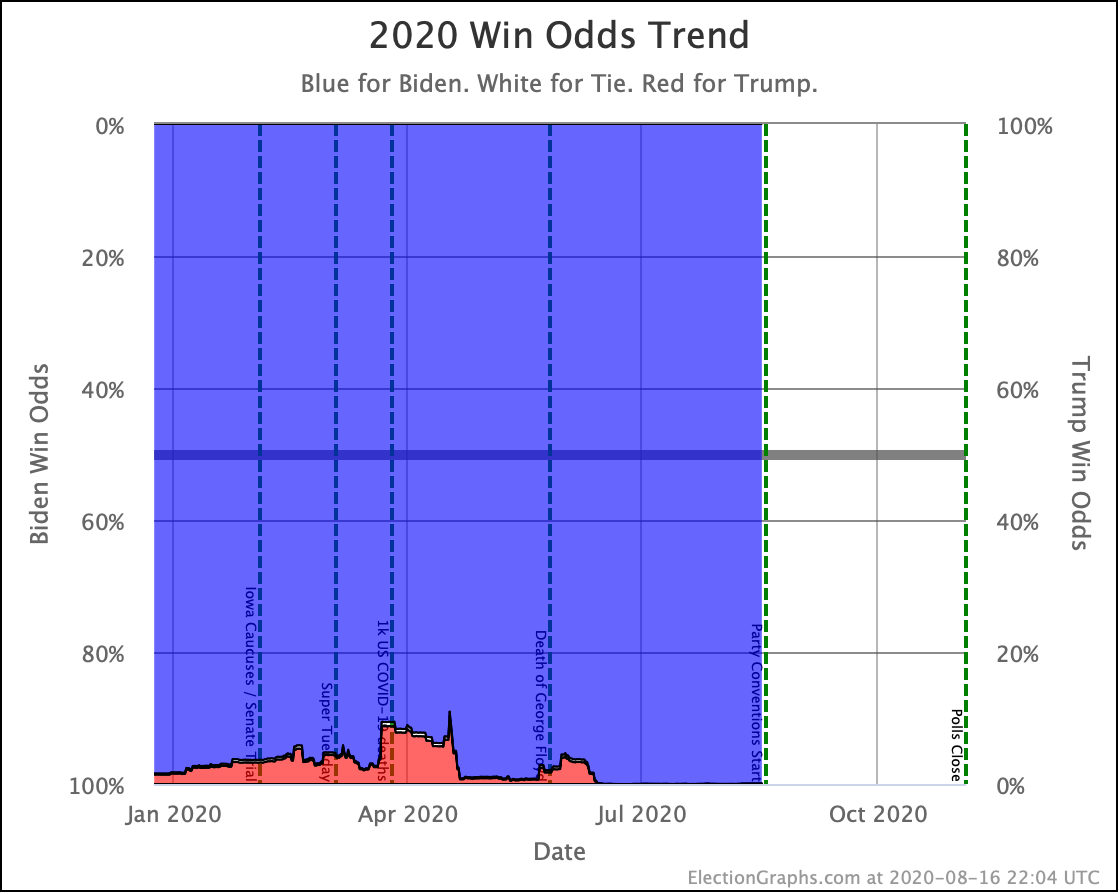
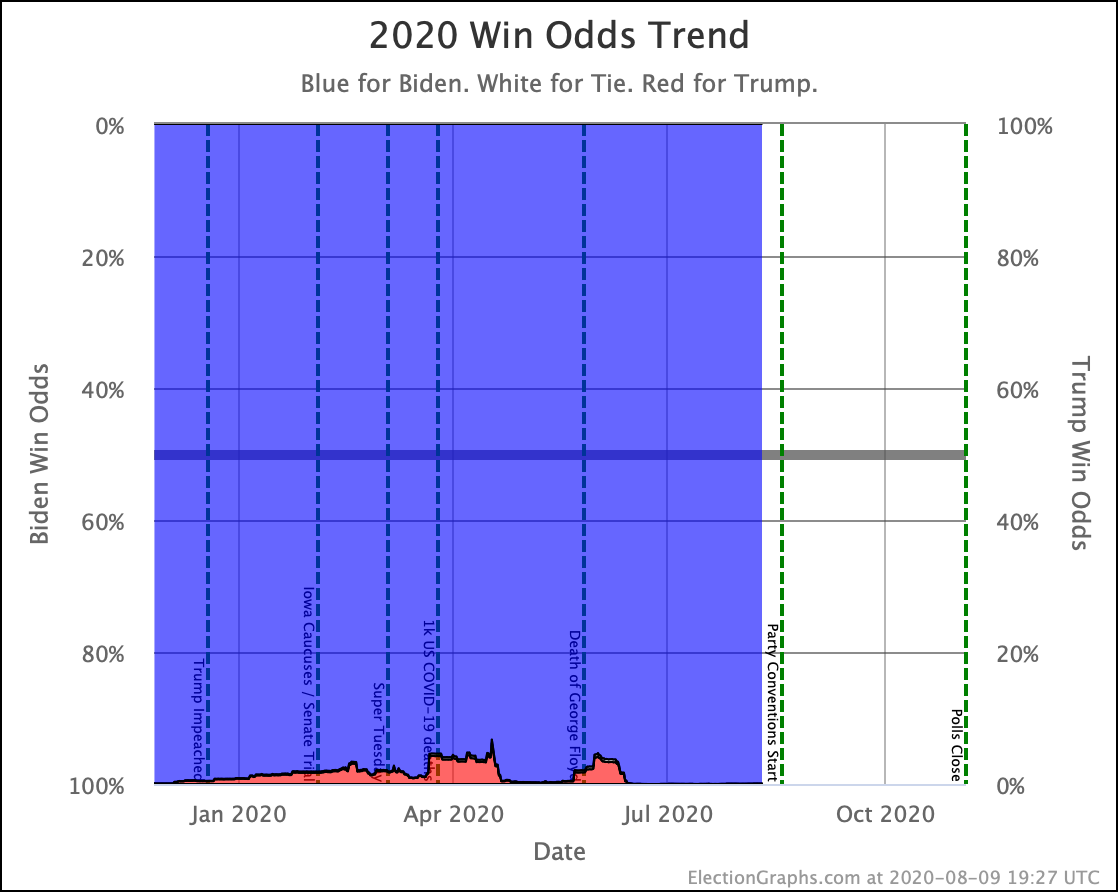
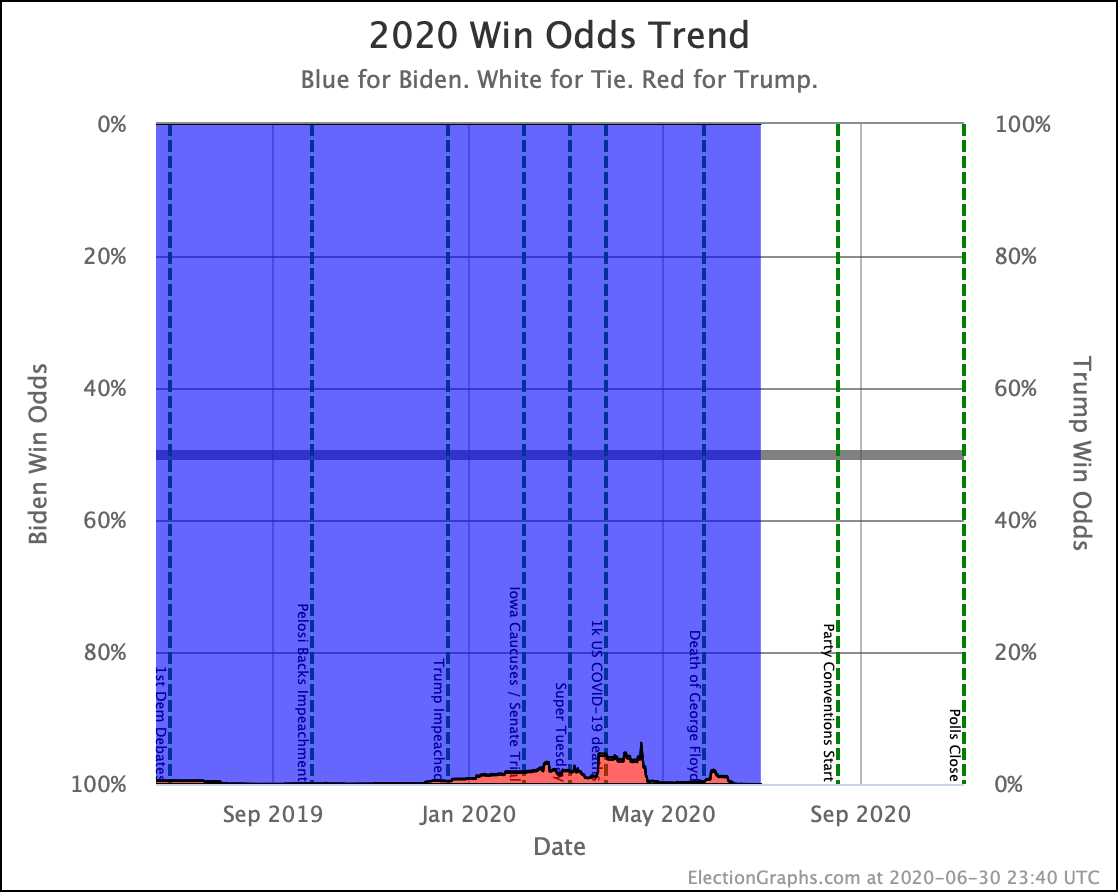
The simulations now have Biden at a 99.7% to win to Trump's 0.2%. The remaining 0.1% is that 269-269 tie possibility.
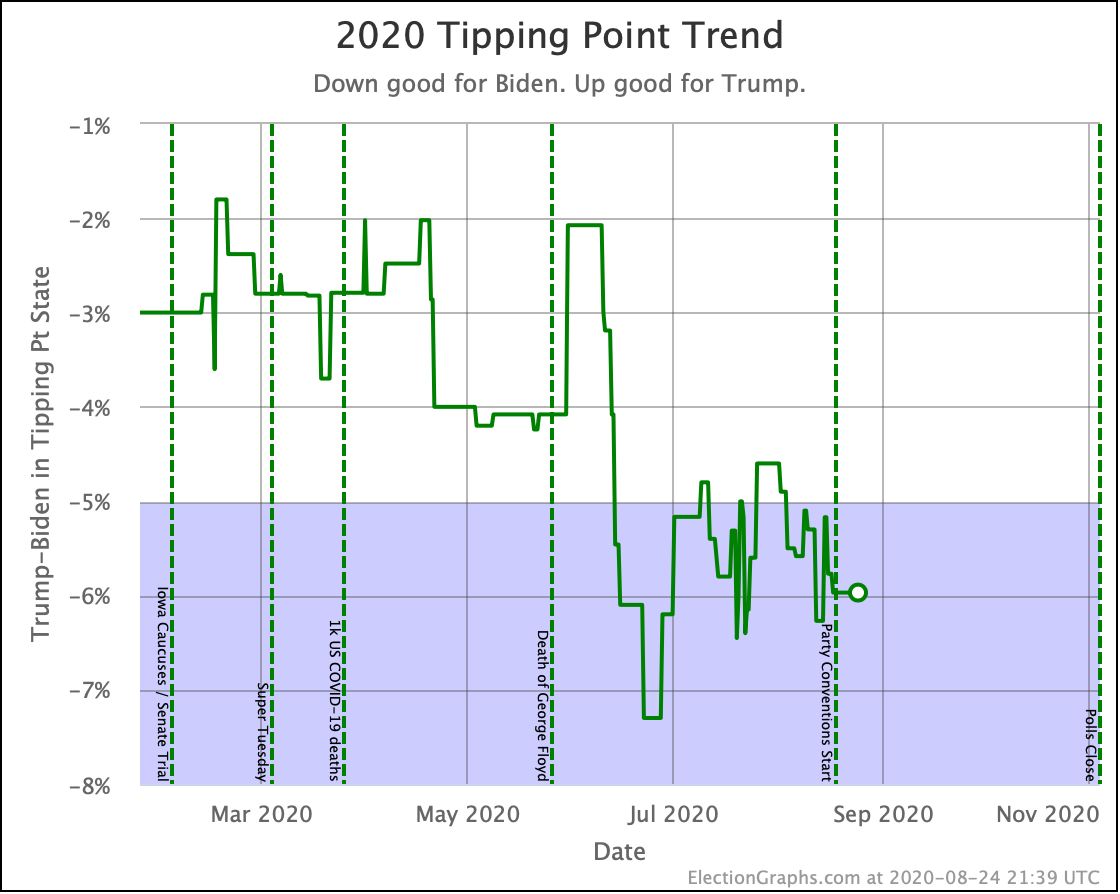
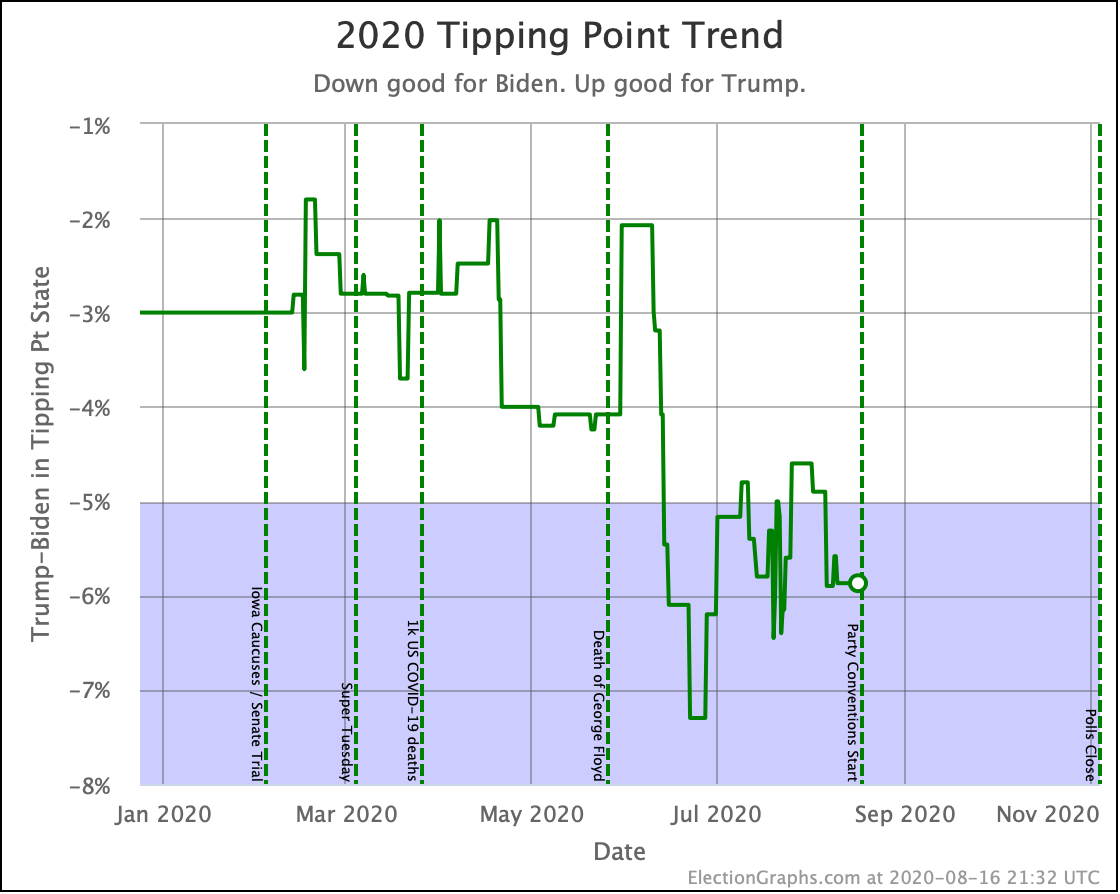
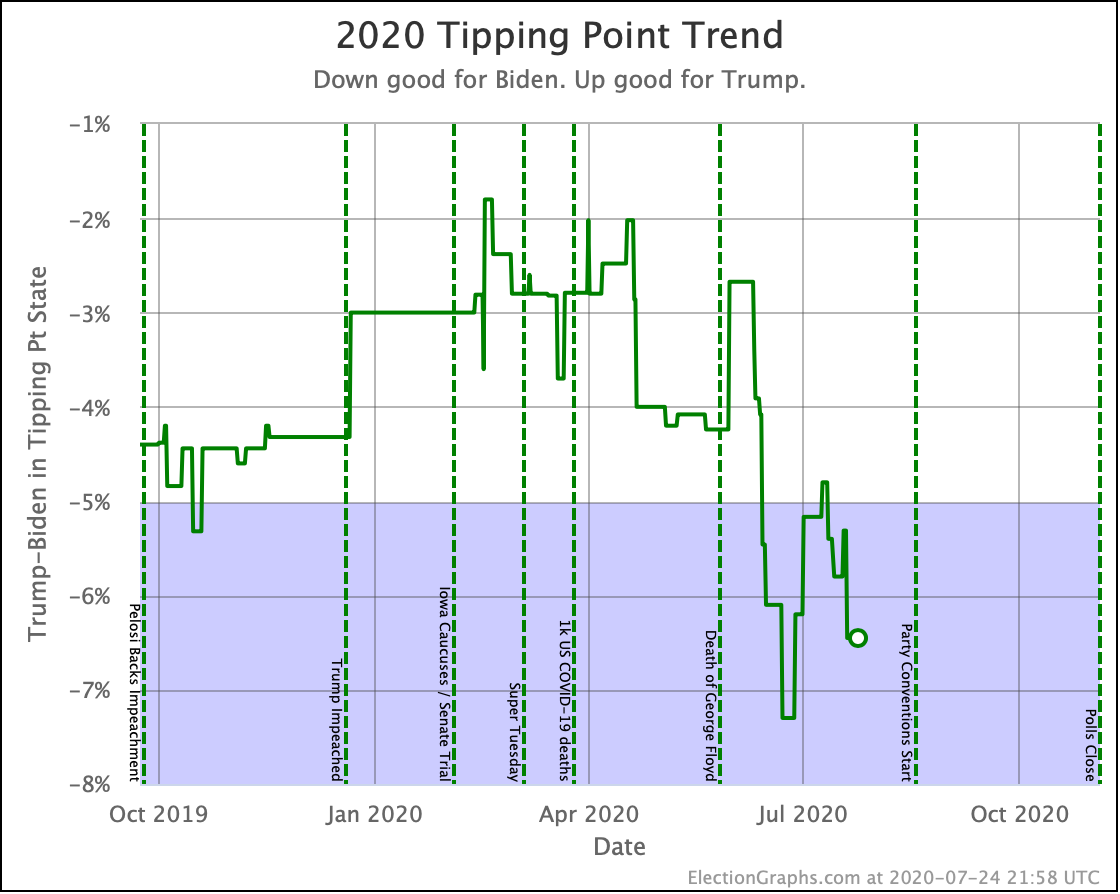
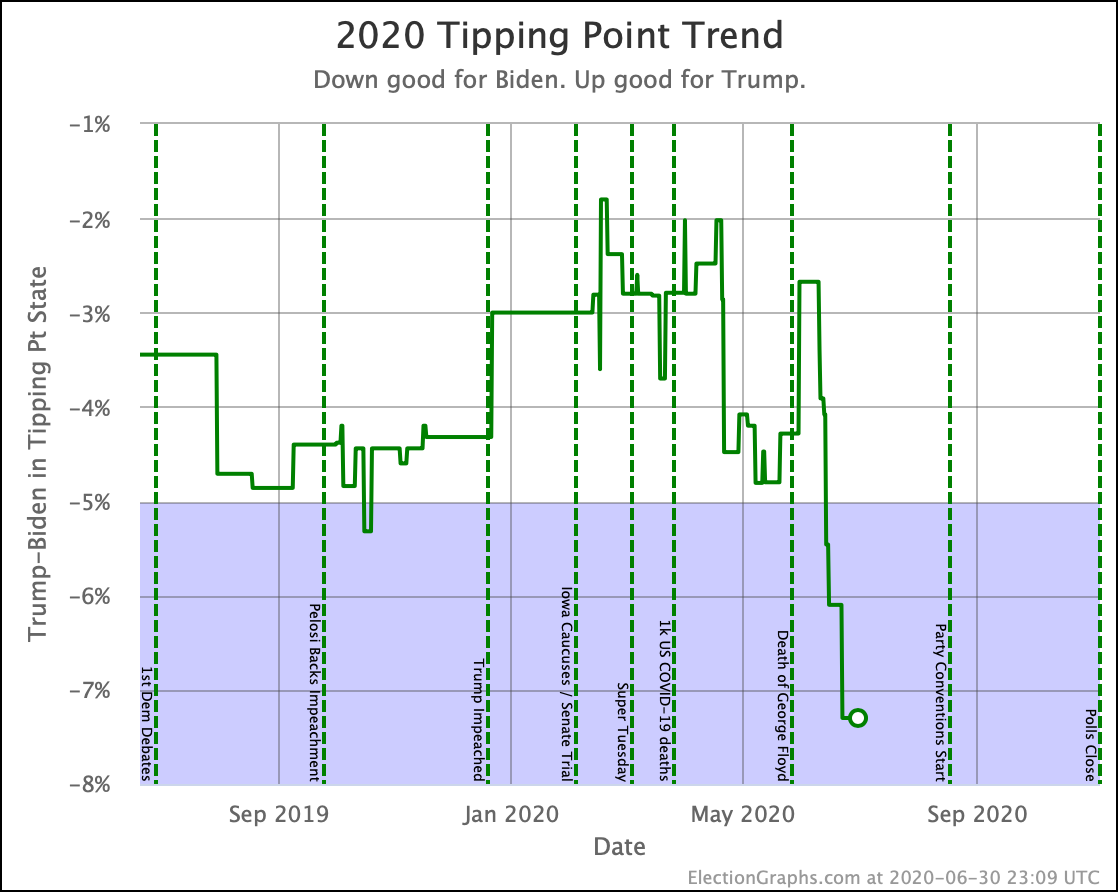
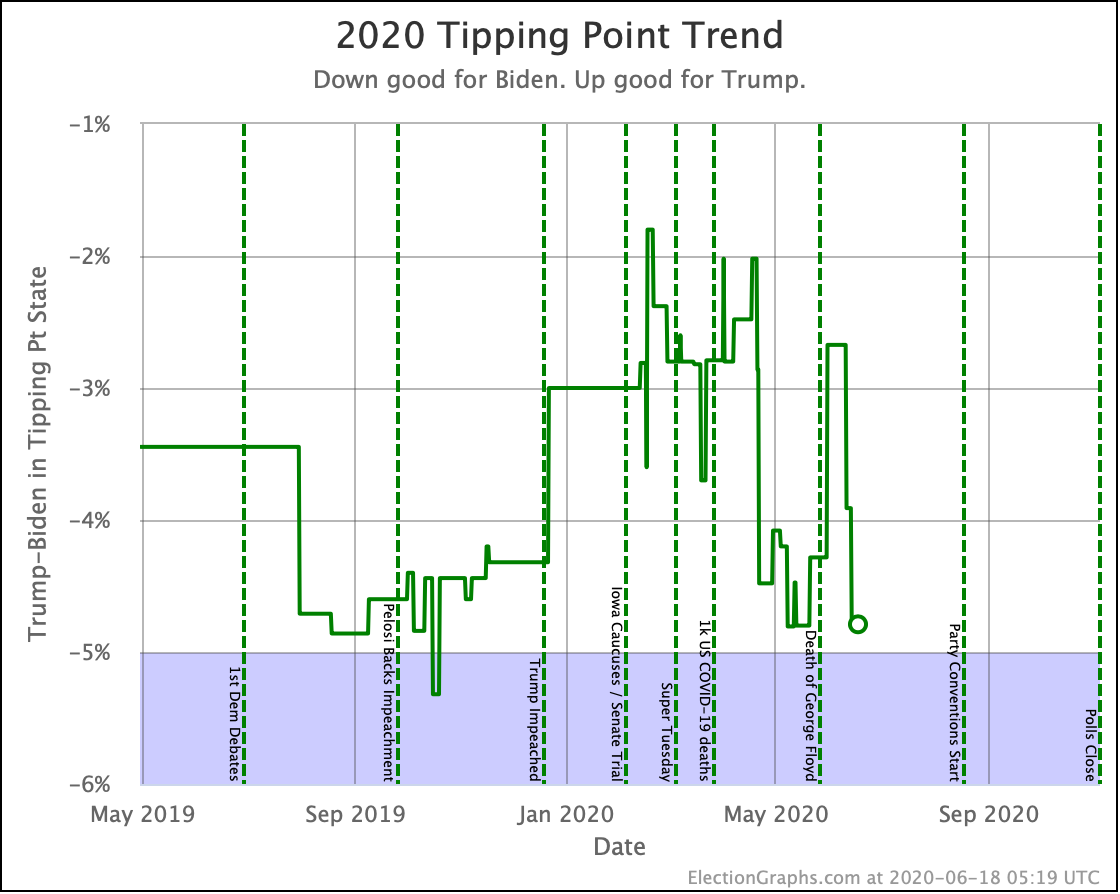
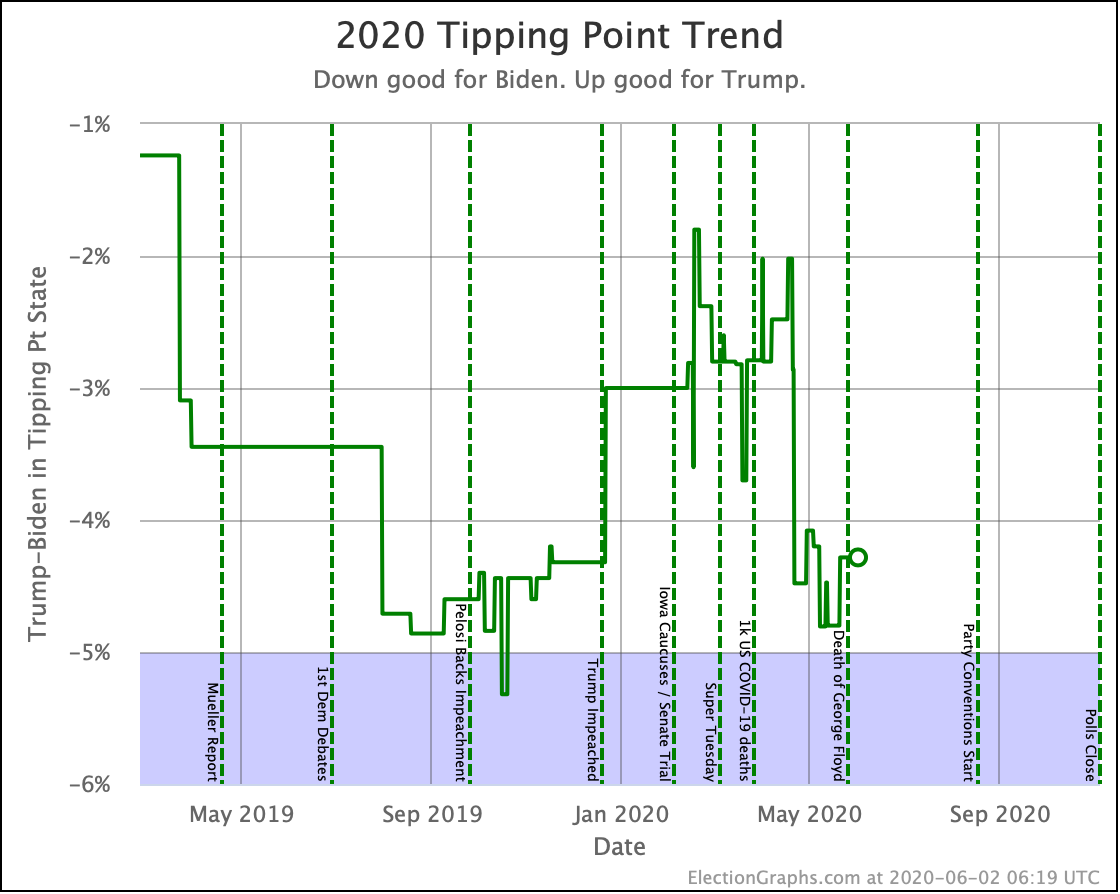
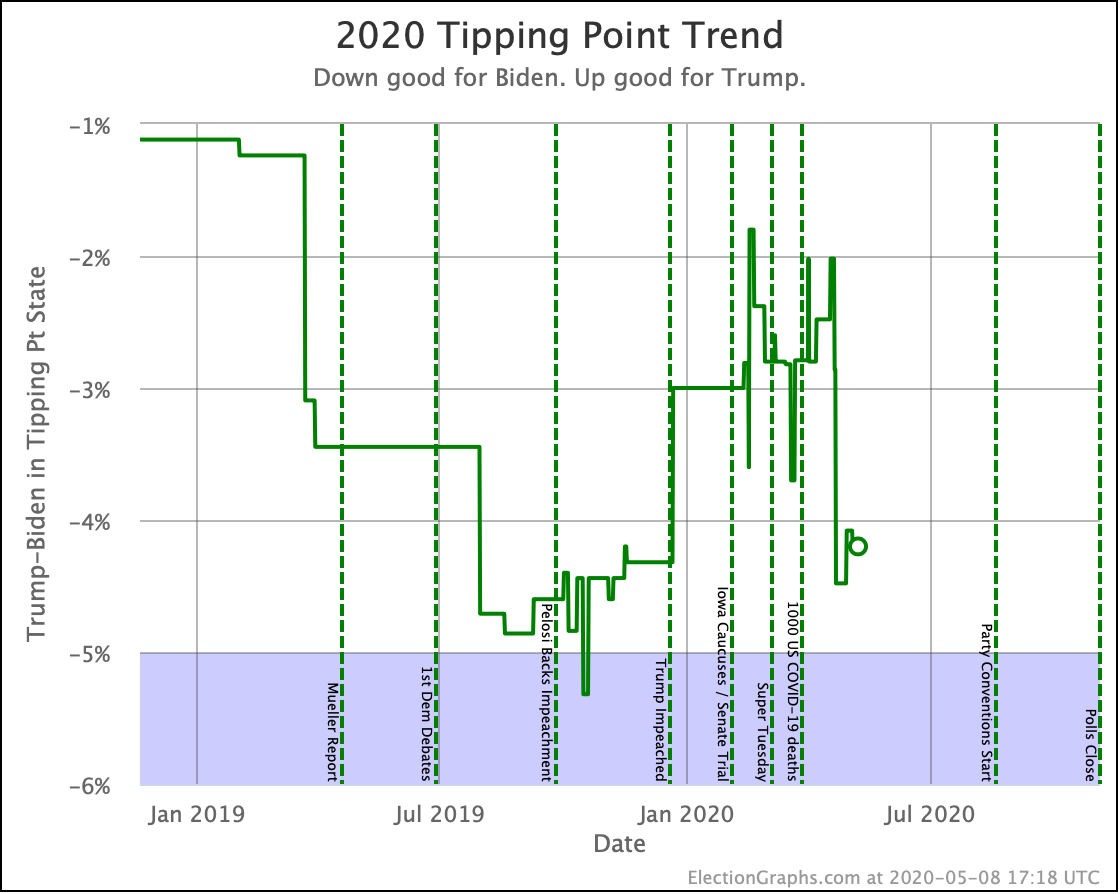
This is if the election was today of course, and the election is not today. I mentioned that the increases in the upper end of Trump's range indicate that perhaps Biden's lead is a little less solid than the margins would imply. This brings us to the tipping point:
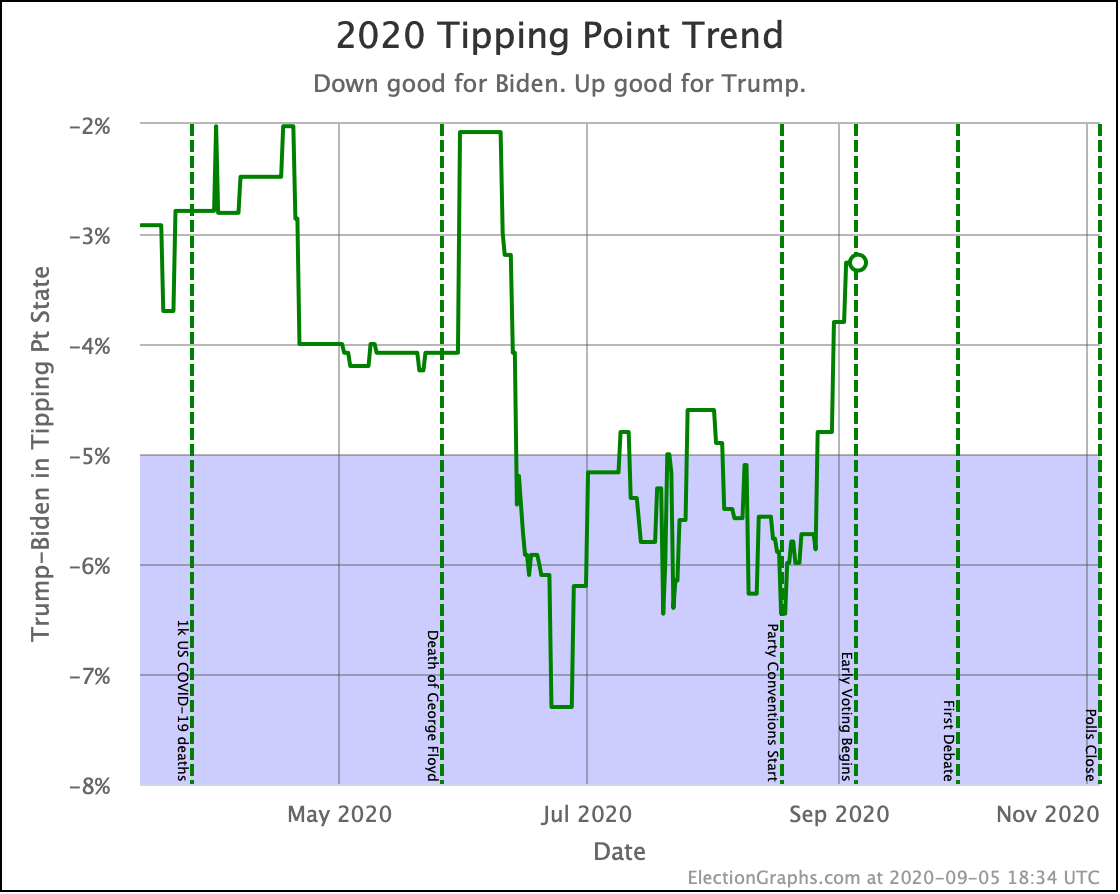
Biden's tipping point has cratered since the conventions began, going from 6.5% on August 18th to only 3.3% now.
If Biden wins every state he leads, he wins by a very impressive 379 electoral votes to Trump's 159. That is a 220 EV margin. That would be a larger electoral college margin victory than any election since Clinton's defeat of Dole in 1996 with exactly that margin.
But Biden's margin in Pennsylvania, the state that currently puts him over the edge, is only 3.3%. You only need that small movement in the "Weak Biden" states to flip the election. Or a polling error of that magnitude.
In June we saw the tipping point move 5% in two weeks. We have just under two months left until the election.
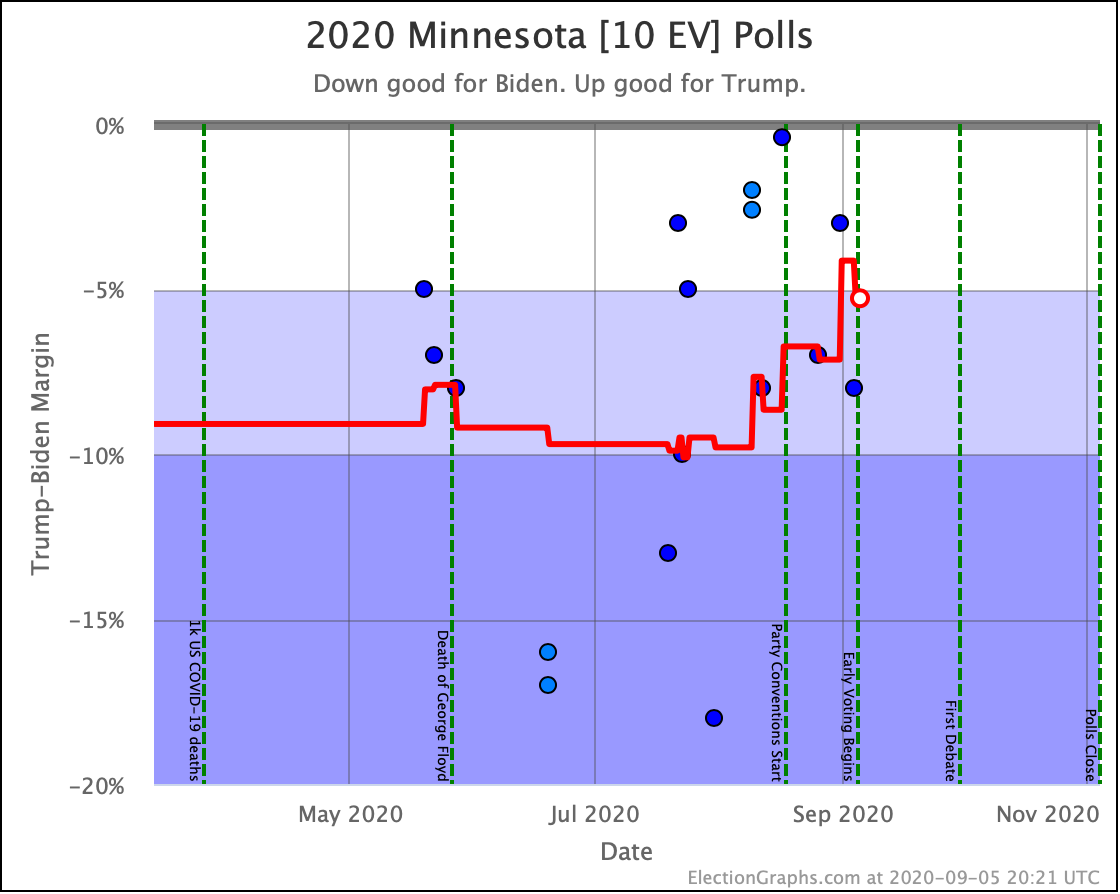
(OK, if you look closely, you'll notice a 3.3% move would only get us to that 269-269 tie, it would currently take a 5.3% move to actually also flip Minnesota and have an outright Trump win, but the point stands…)
The RCP average of national polls currently shows a 7.0% Biden lead. Comparing to the 3.3% tipping point, this implies that the structure of the electoral college is currently giving Trump a 3.7% head start, up significantly from 1.6% in the last update. Like 2016 and 2000, the situation where Trump loses the popular vote but wins the electoral college is a live possibility.
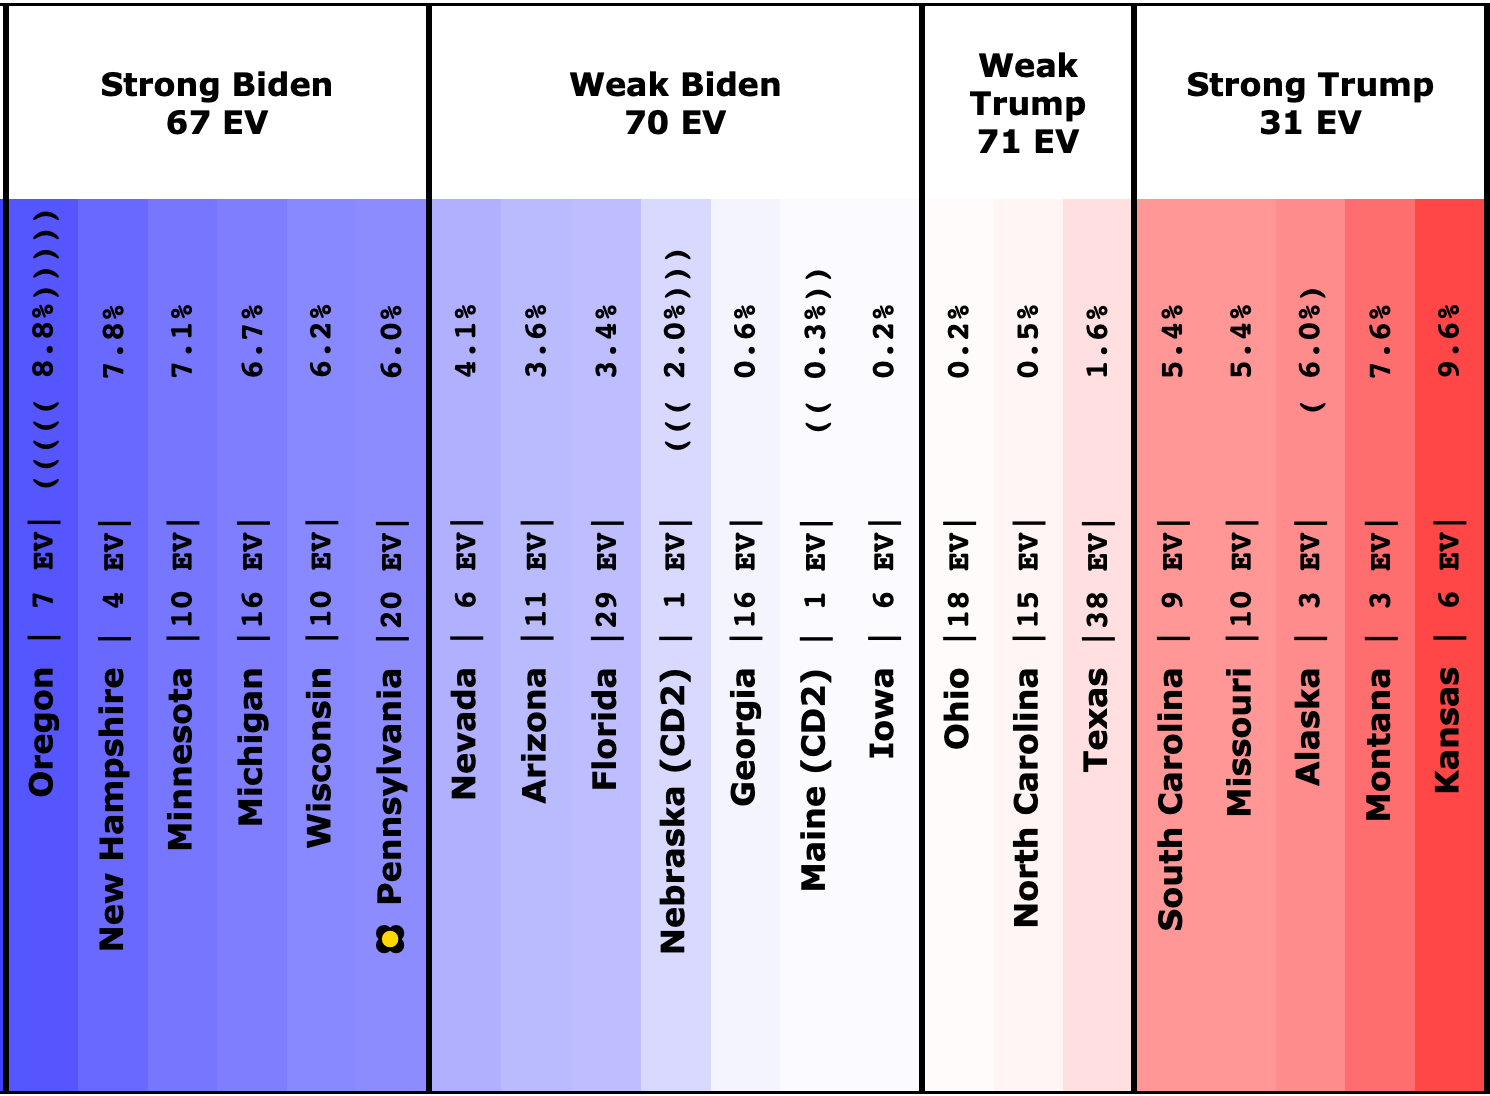
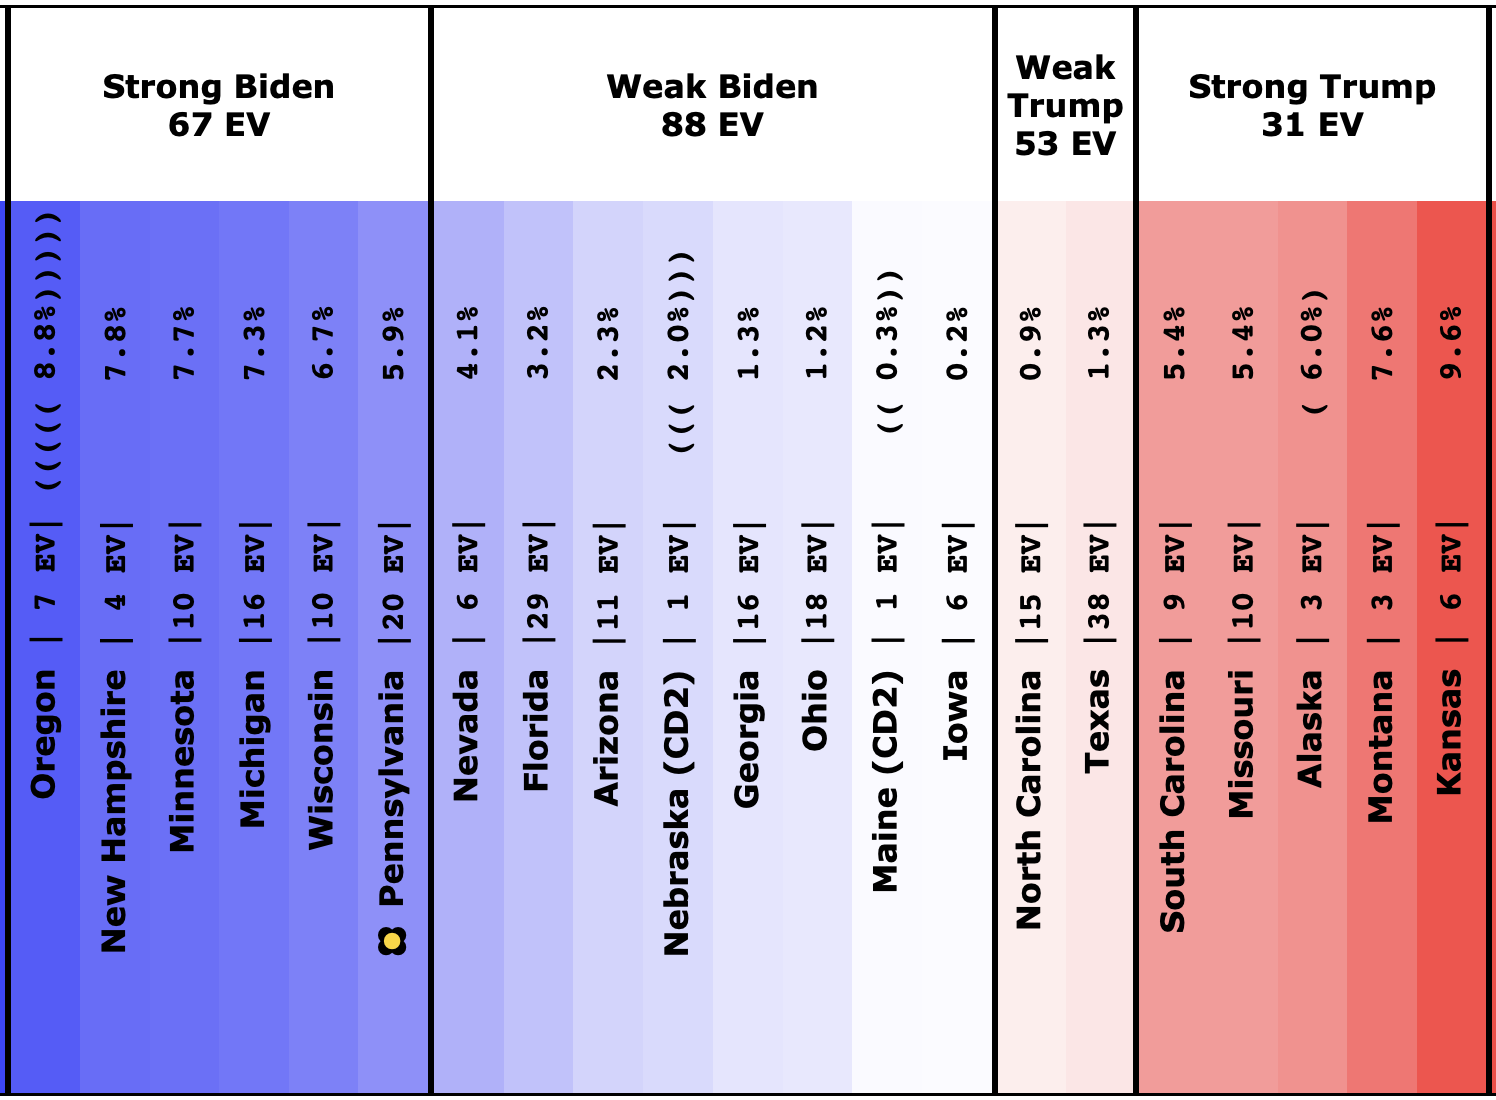
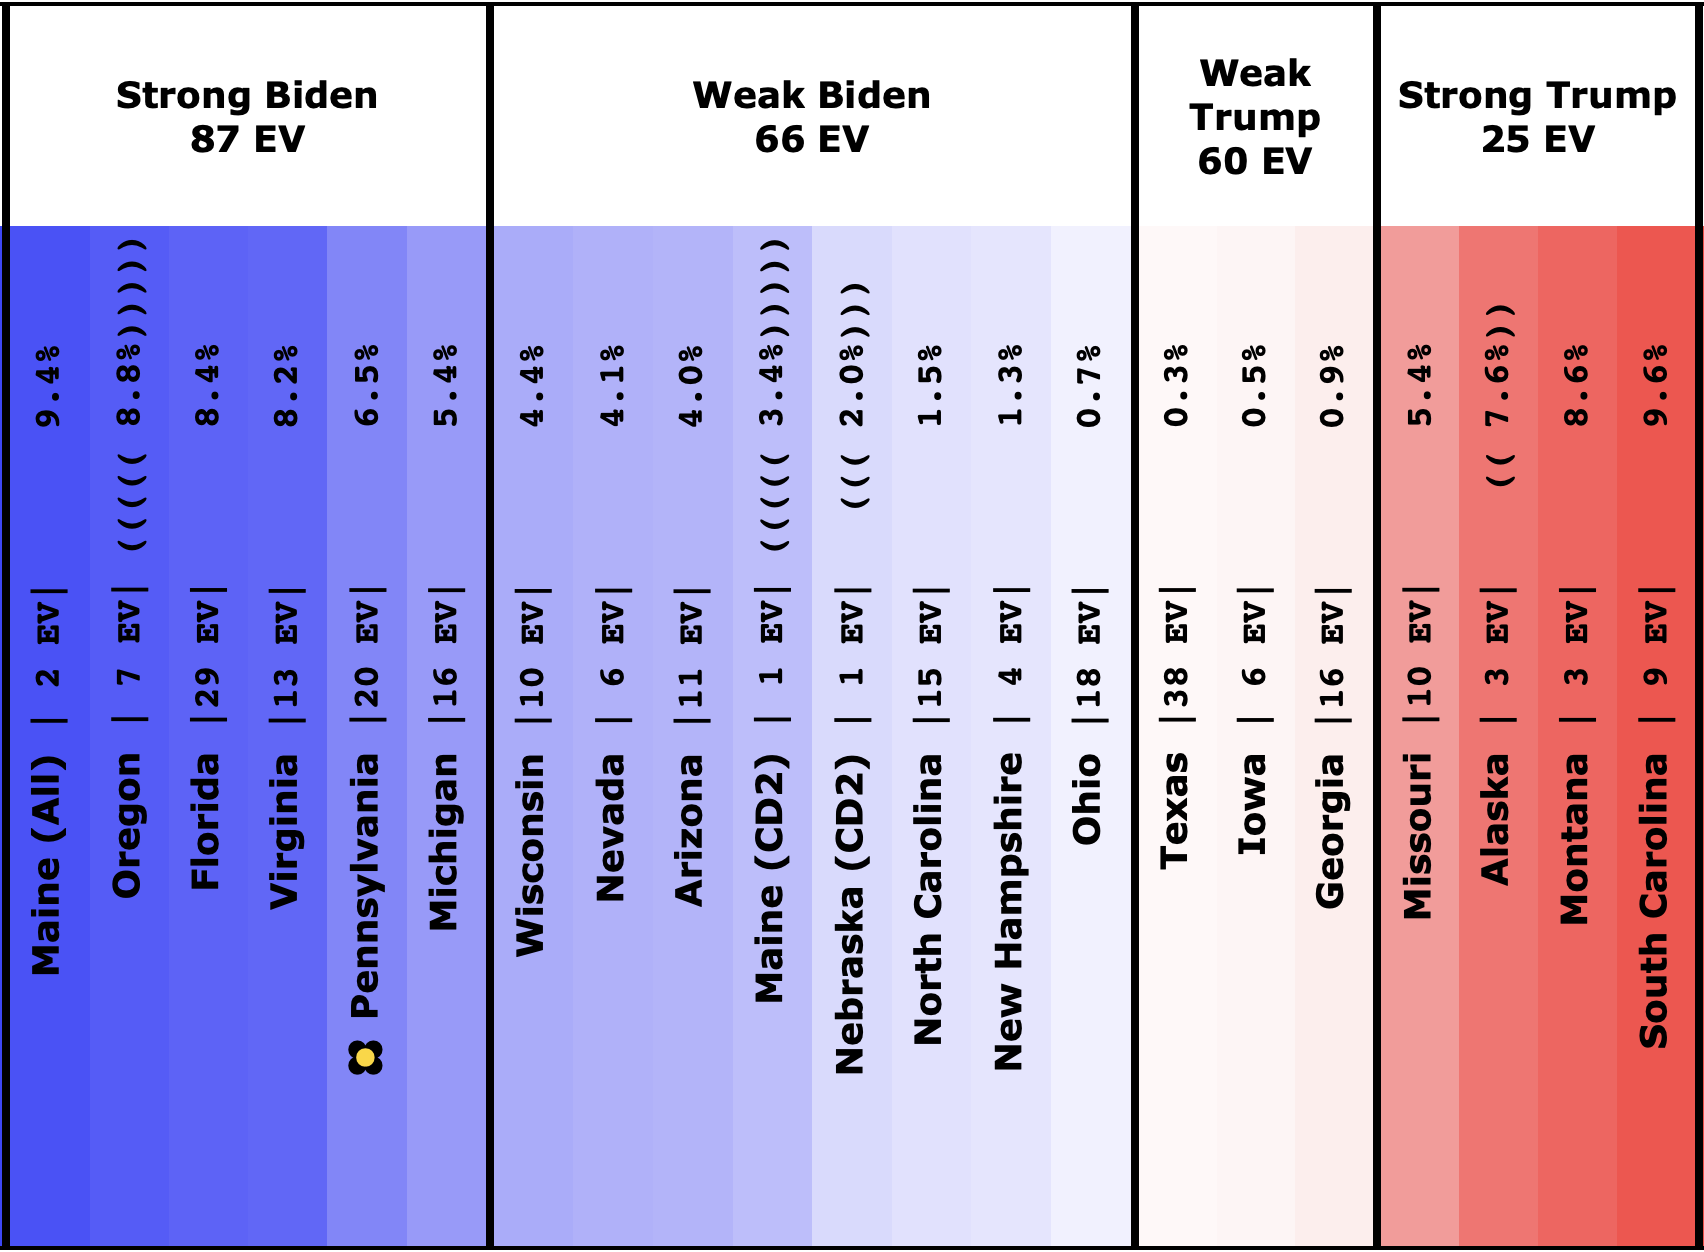
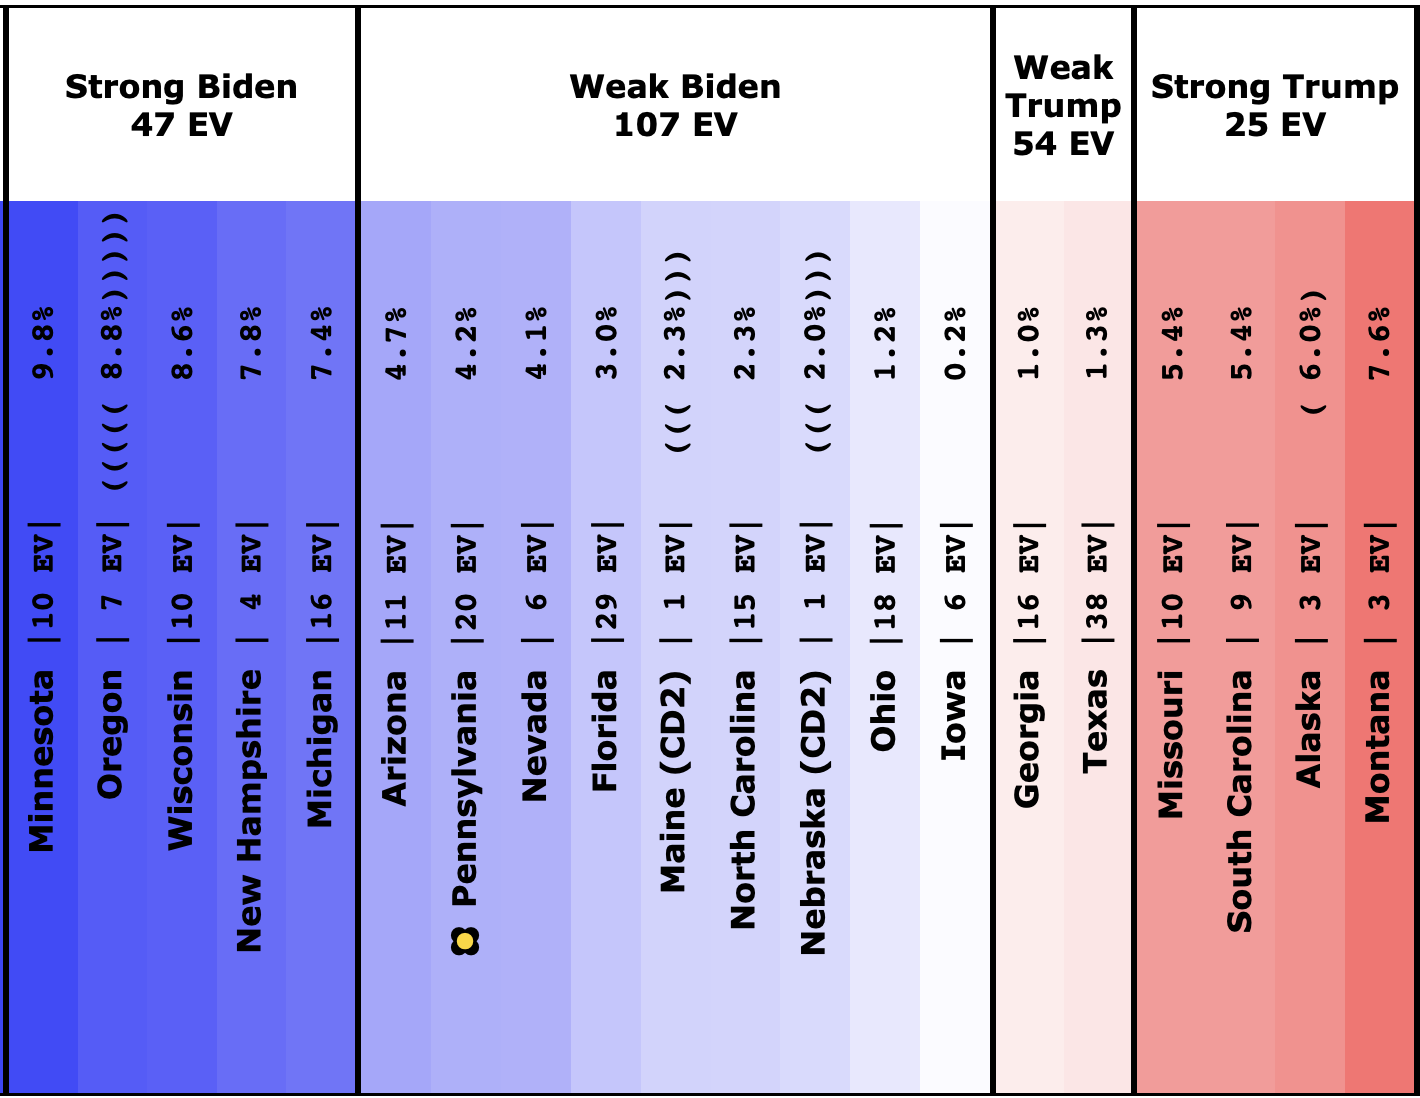
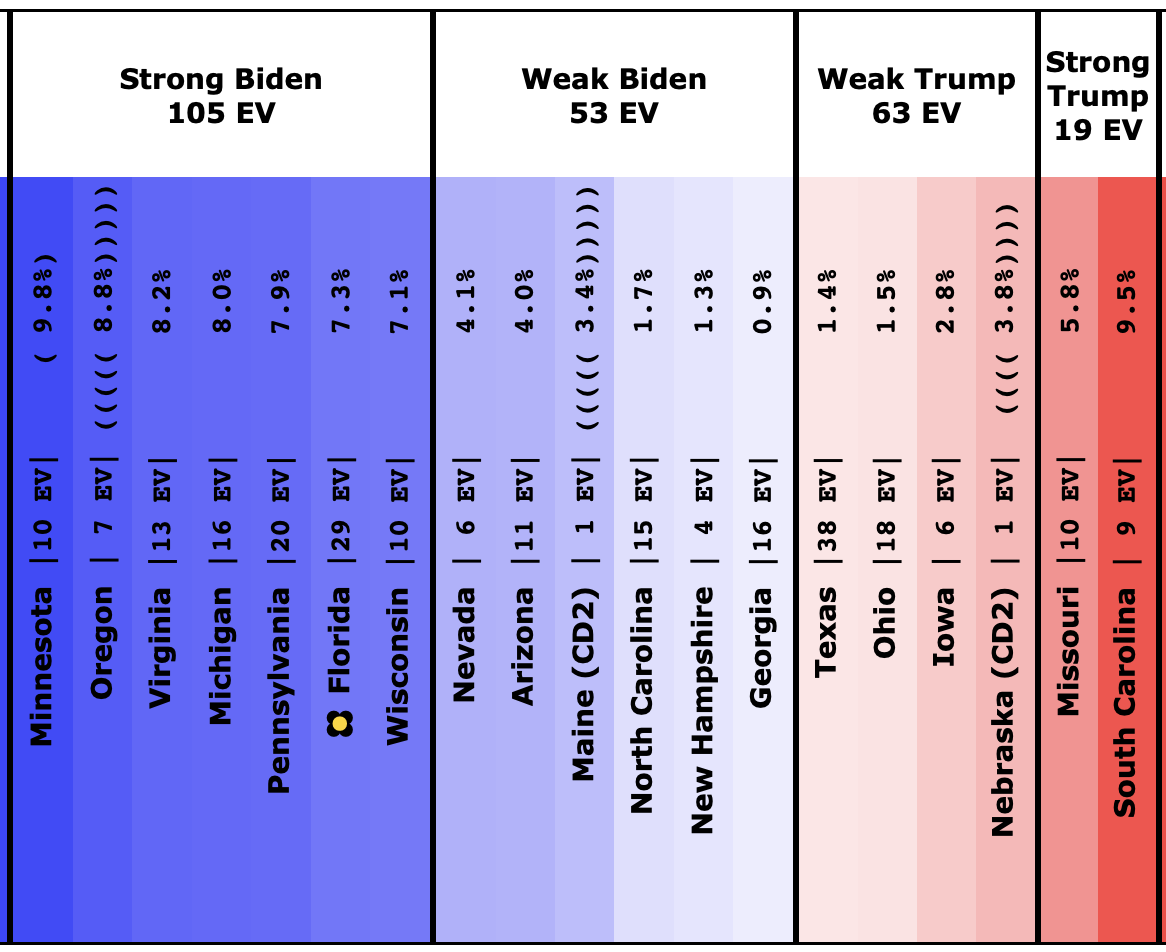
The spectrum of states where the margin is less than 10% now looks like this:
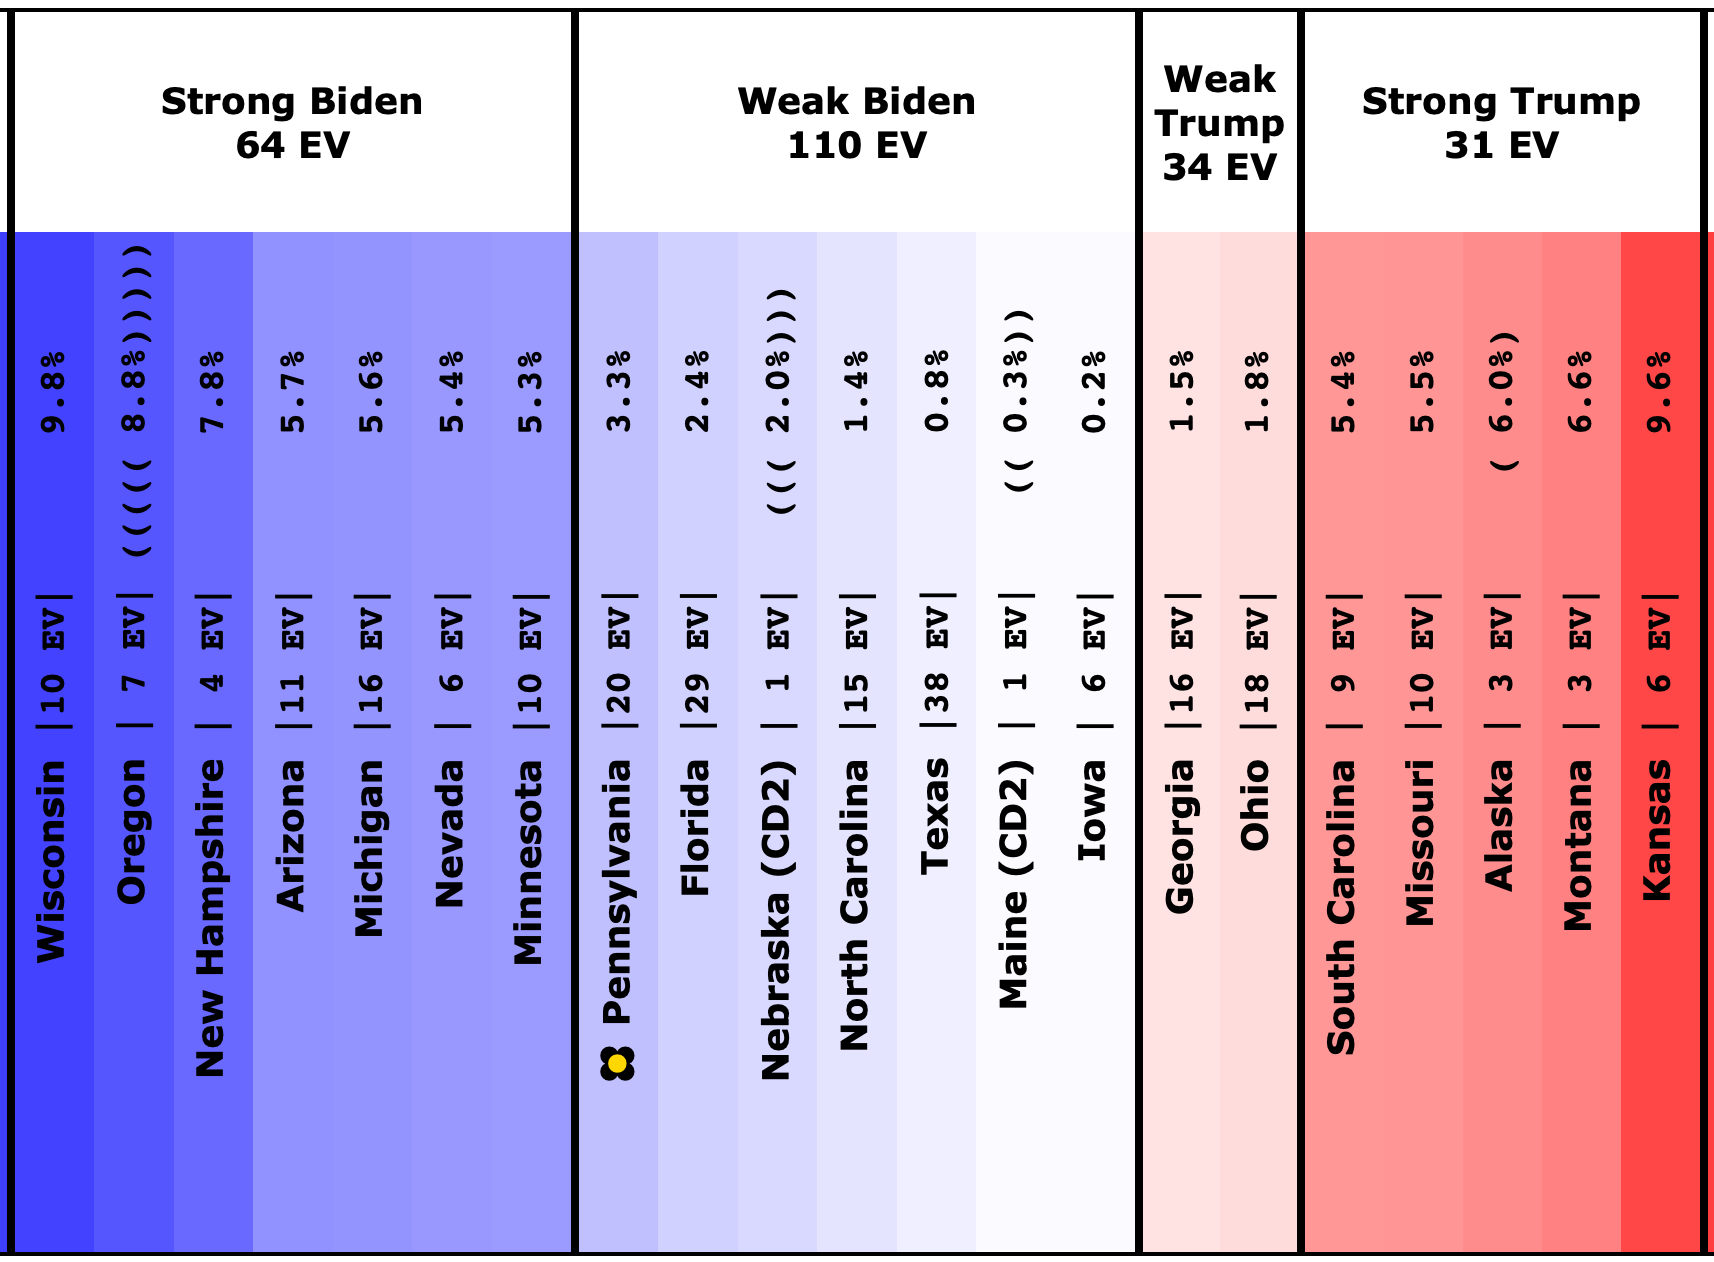
To win, Trump needs all the close states. But all of those states are VERY close. It isn't that big of a stretch from where things are right now.
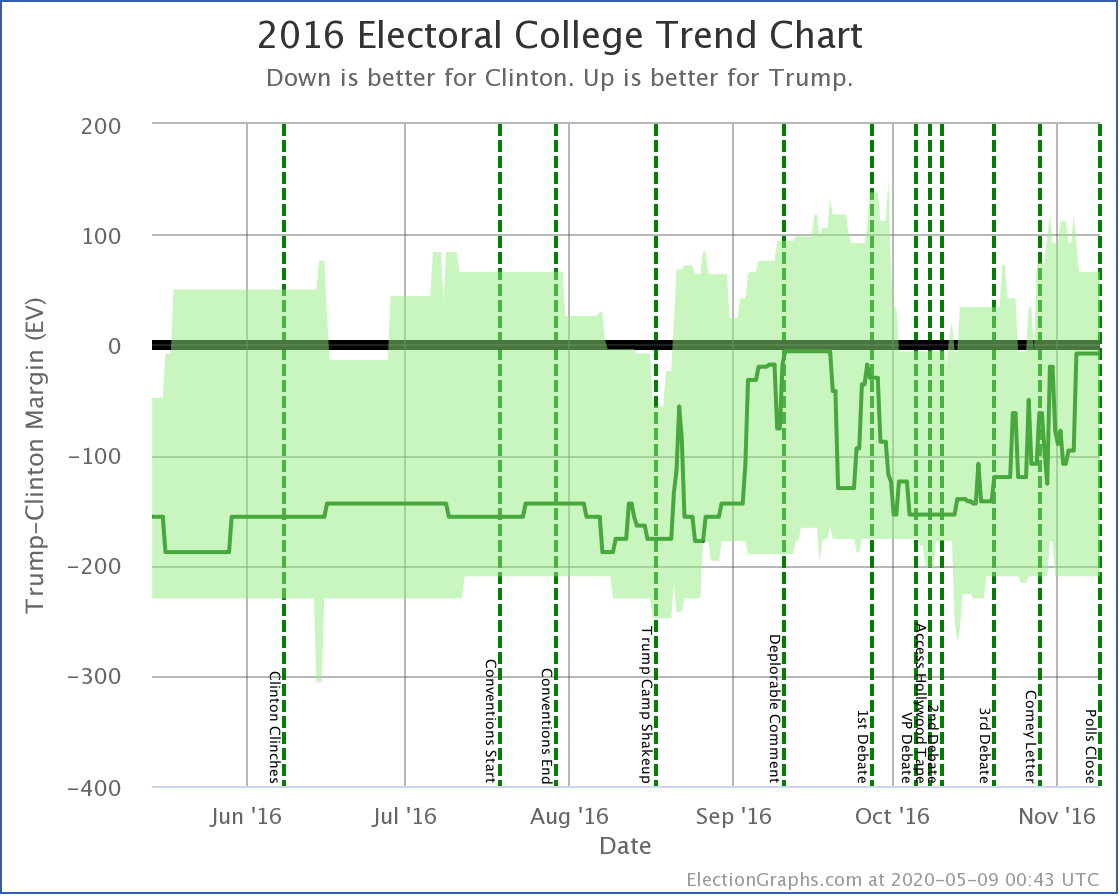
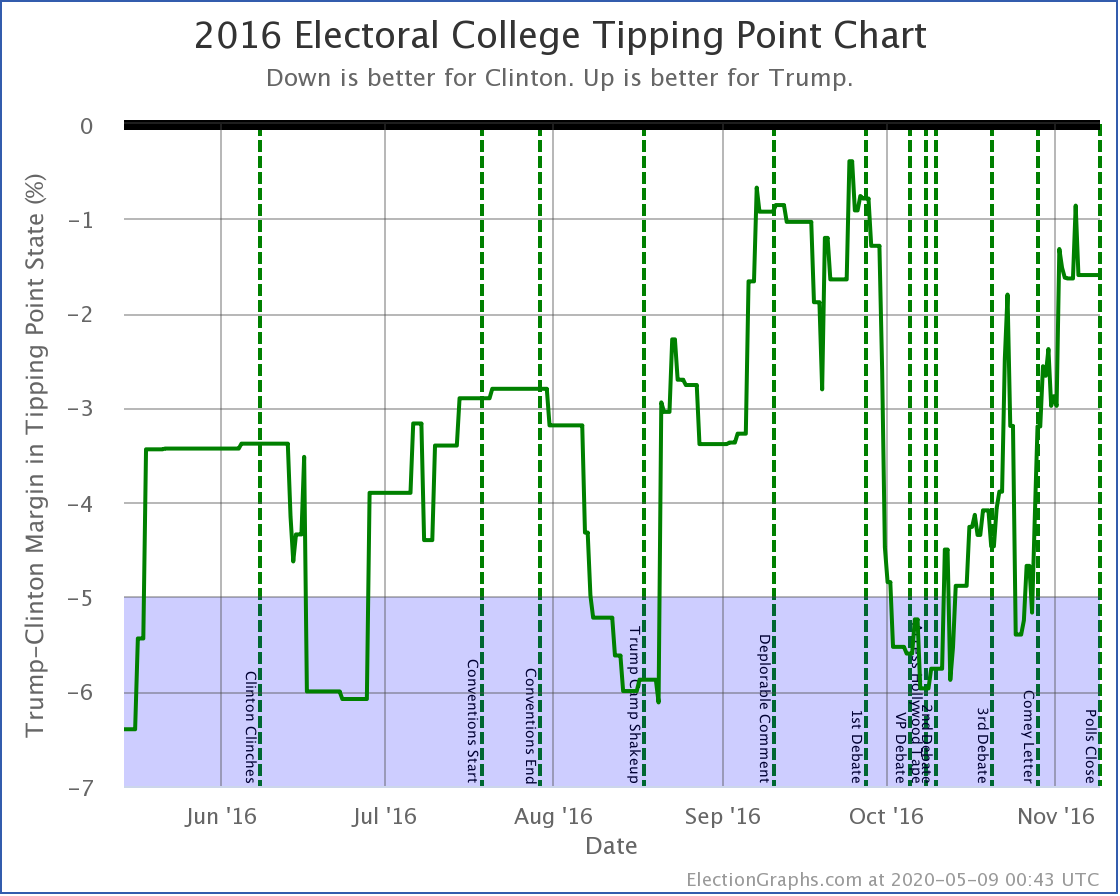
Now comparing to this time in 2016:
| <59 Days Out> | 2016 | 2020 |
|---|---|---|
| Expected Case | Clinton by 5 | Biden by 220 |
| Tipping Point | Clinton by 0.9% | Biden by 3.3% |
This point in 2016 was Clinton's late-summer low point, before surging back to a strong lead in October, which then of course completely slipped away in the last month.
The best Clinton saw in the Expected Case in the last 59 days was a 154 electoral vote margin in October. Biden is a lot stronger than that at the moment.
Clinton's best Tipping Point in the last 59 days was 6.0% in early October though. Biden was stronger than that in mid-August, but he isn't anymore.
People argue that the presidential race is much more stable this year than it was in 2016. There are fewer undecided people. And both candidates have less "soft" support that can easily slip away. This does seem to be true. So maybe the chances of a lot of movement are less than there were.
But the amount of movement you need to change the outcome right now isn't all that large.
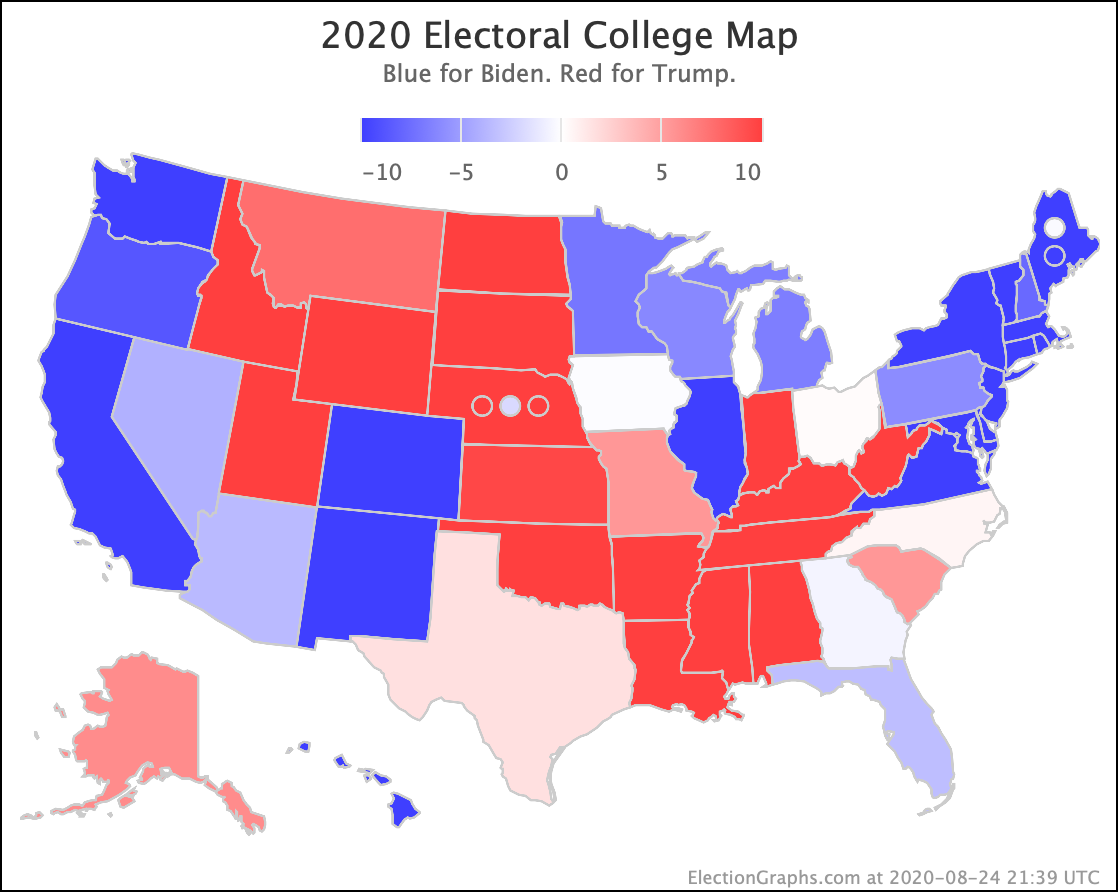
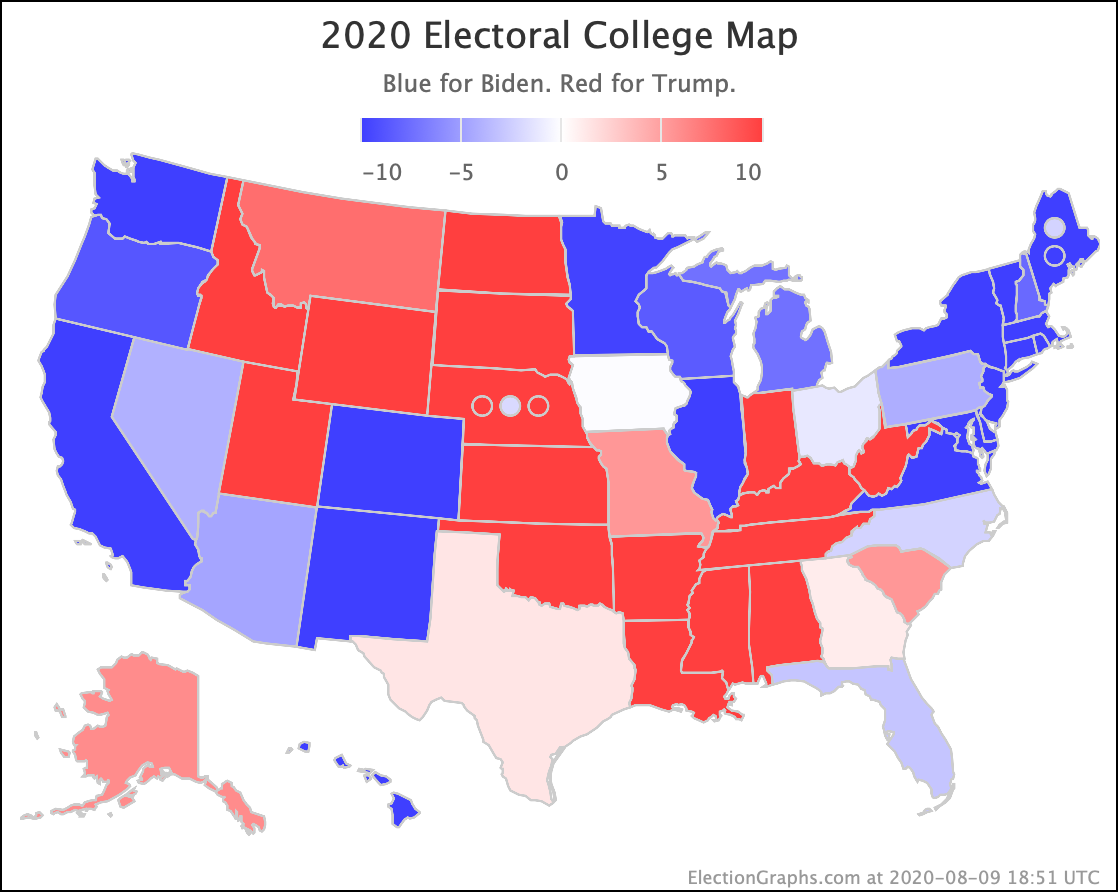
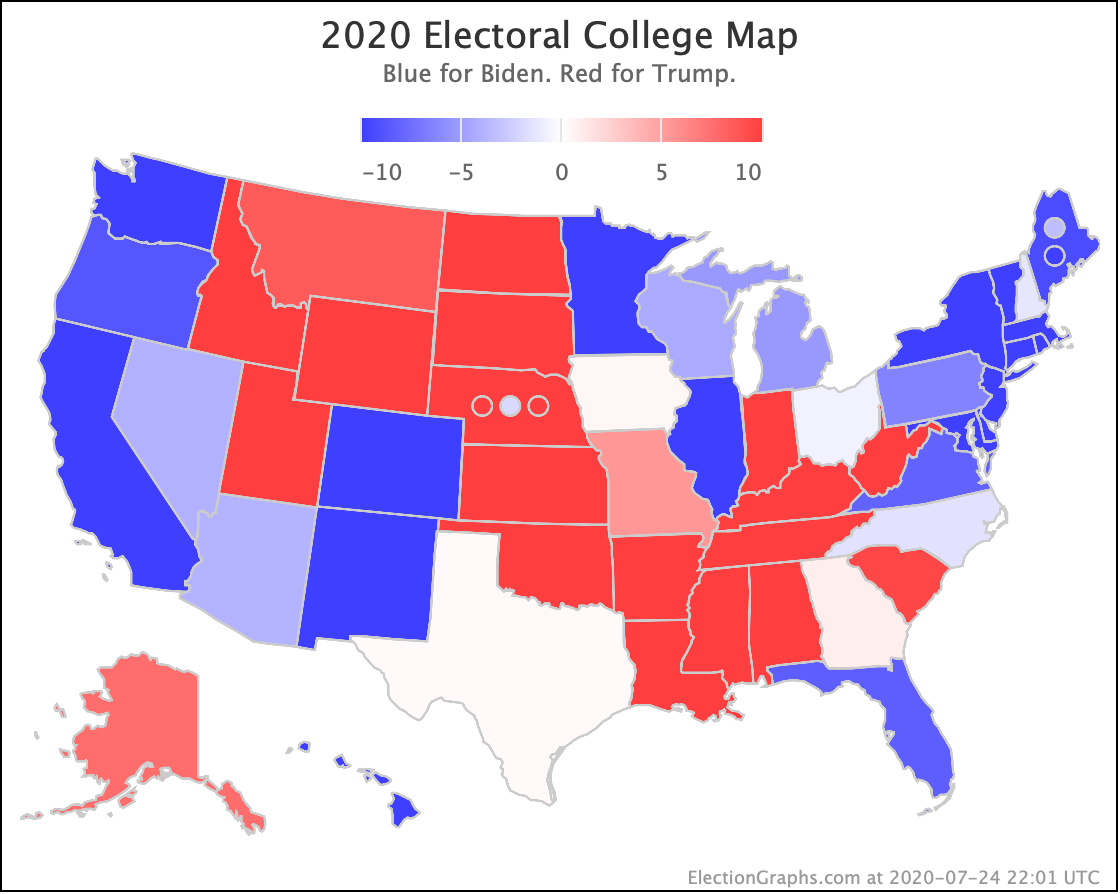
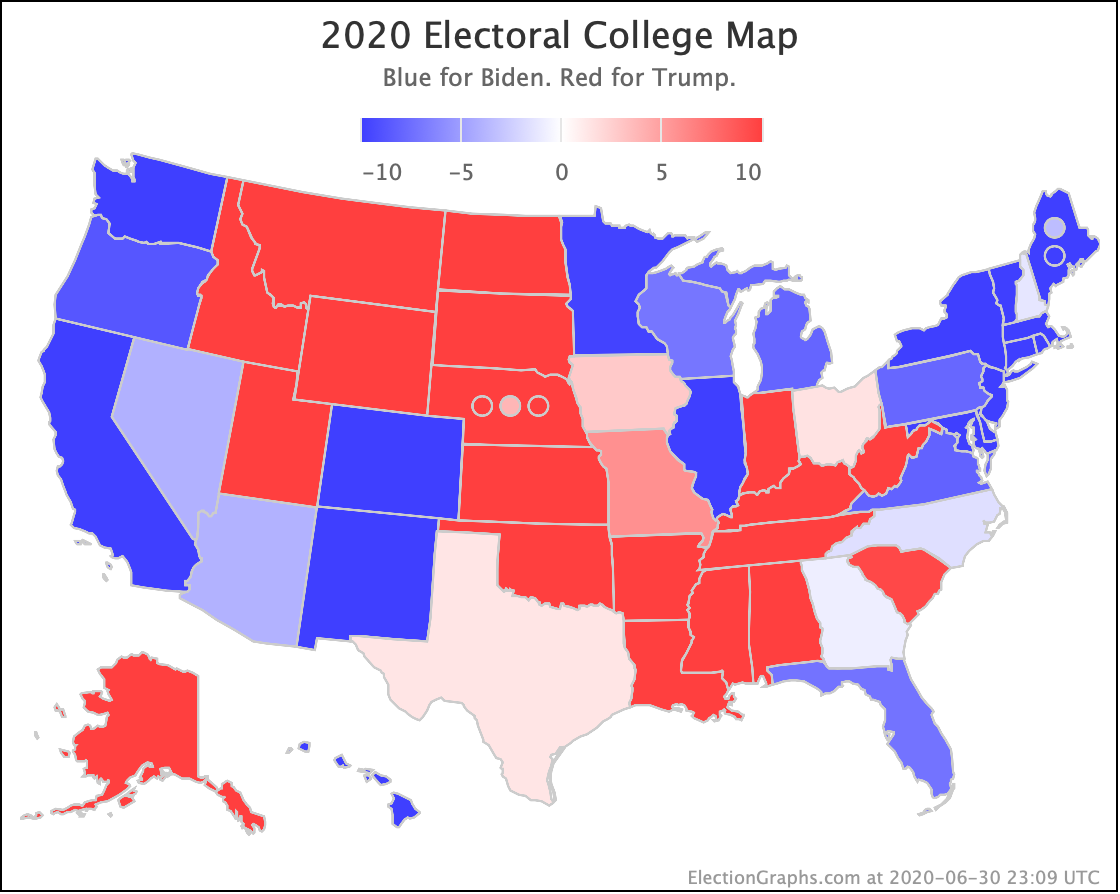
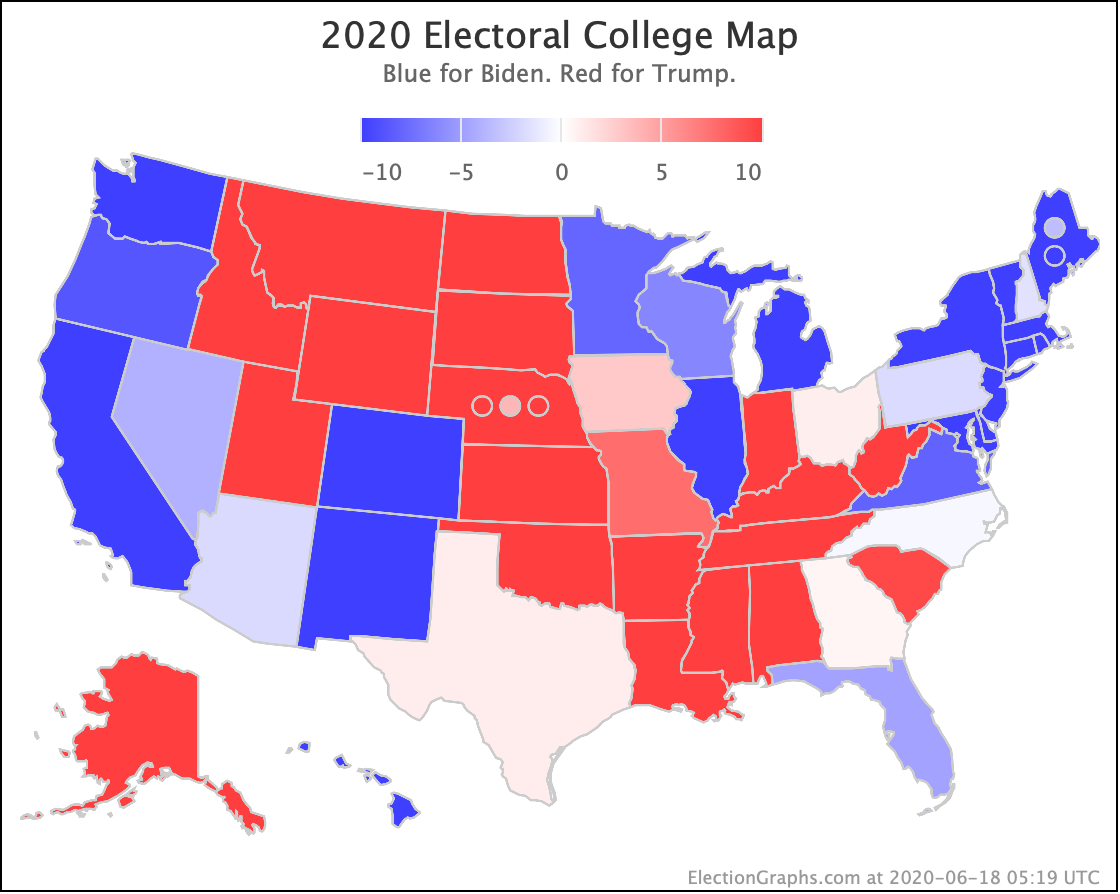
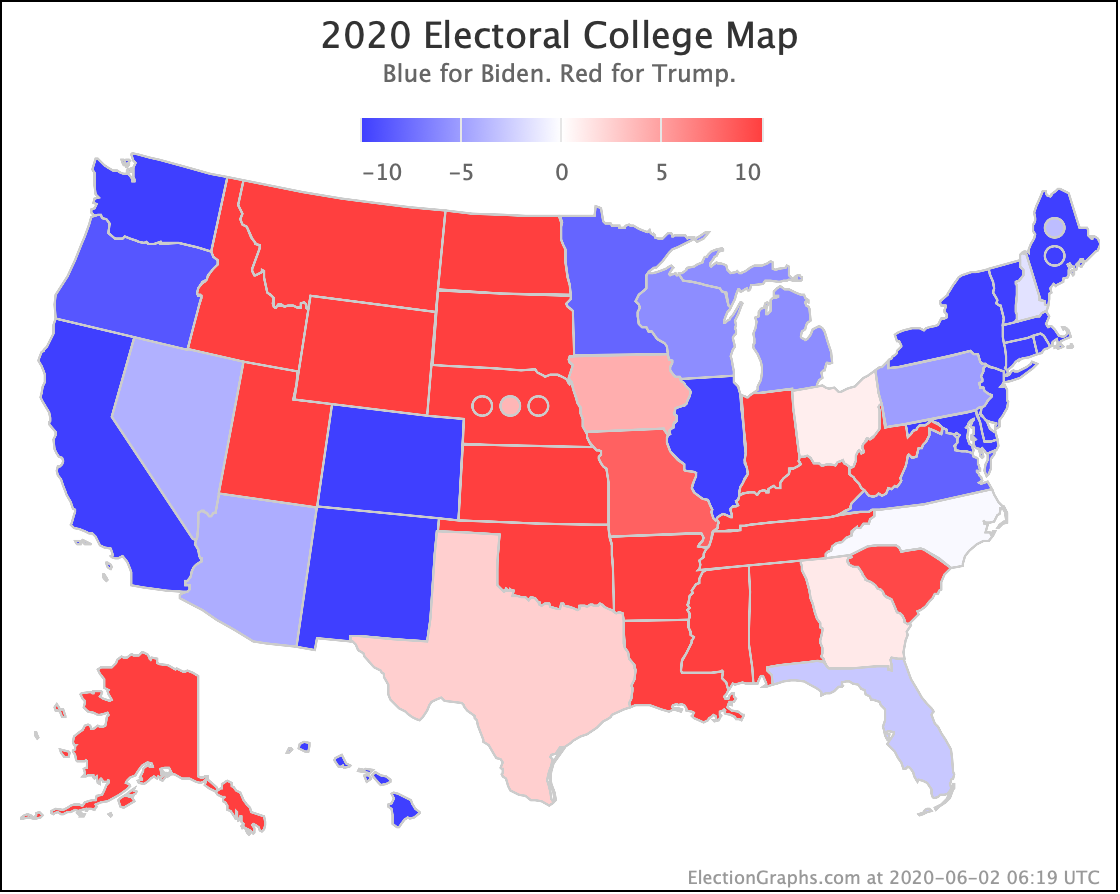
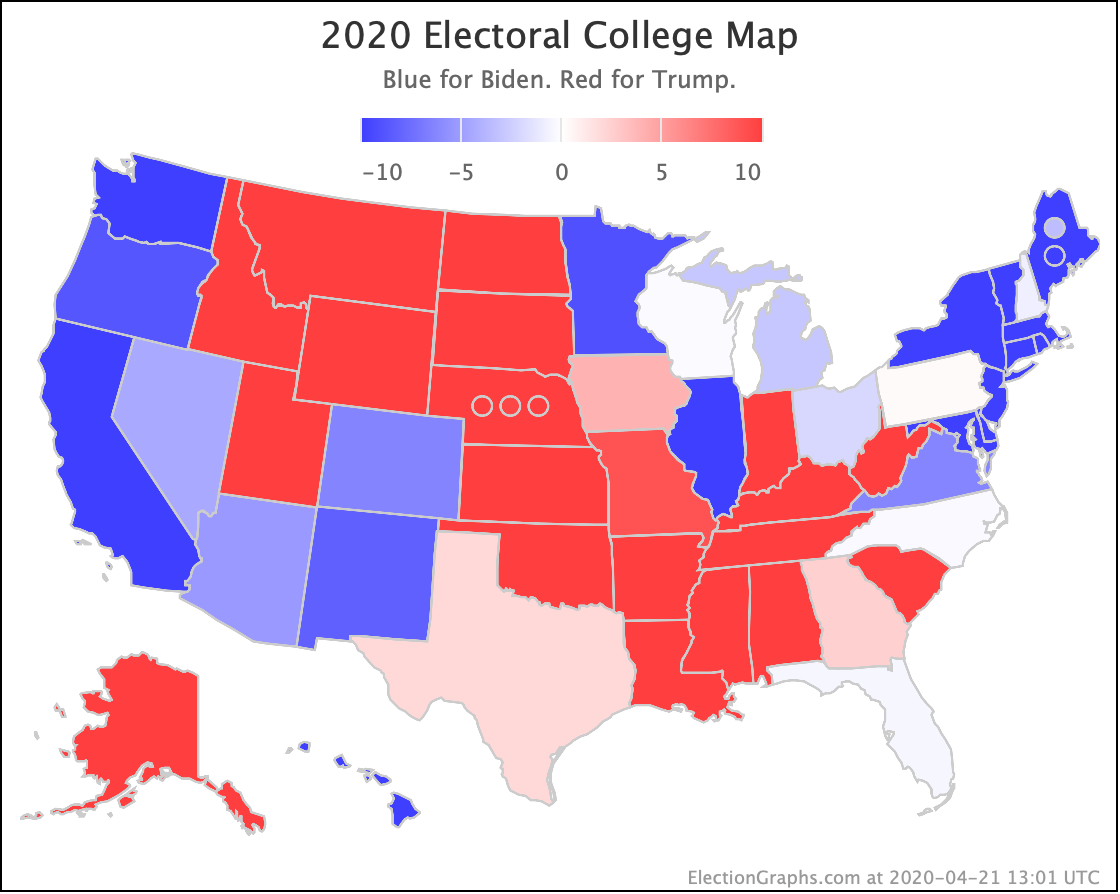
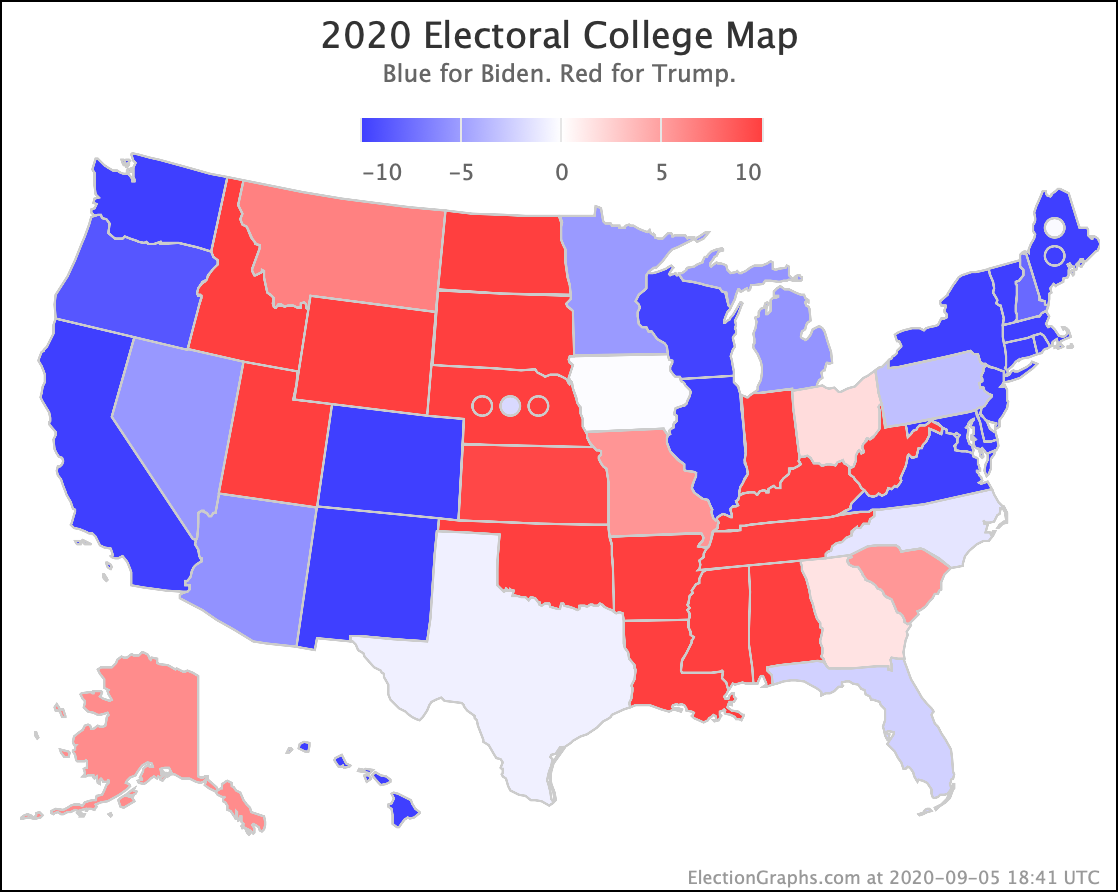
The map below is where things stand today. Keep watching!
59.0 days until the first results start coming in for Election 2020.
For more information:
This post is an update based on the data on the Election Graphs Electoral College 2020 page. Election Graphs tracks a poll-based estimate of the Electoral College. The charts, graphs, and maps in the post above are all as of the time of this post. Click through on any image for current interactive versions of the chart, along with additional details.
Follow @ElectionGraphs on Twitter or Election Graphs on Facebook to see announcements of updates. For those interested in individual poll updates, follow @ElecCollPolls on Twitter for all the polls as I add them. If you find the information in these posts informative or useful, please consider visiting the donation page.