Time for another update for the blog. As always, if you are impatient for one of these updates, the 2020 pages on Election Graphs are updated nearly every day as new polls come in.
The last blog update was 8 days ago on August 9th.
Here are the high-level changes since then:
| Model | Metric | 9 Aug | 17 Aug | 𝚫 |
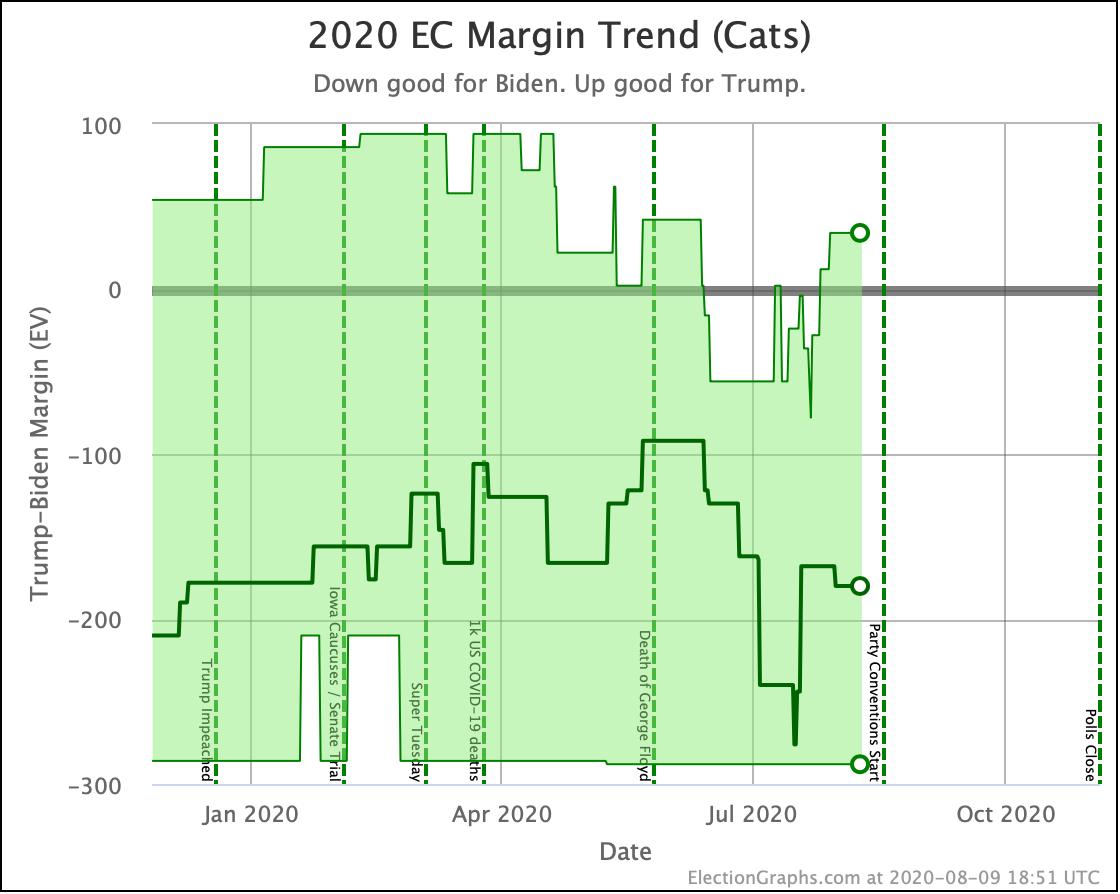
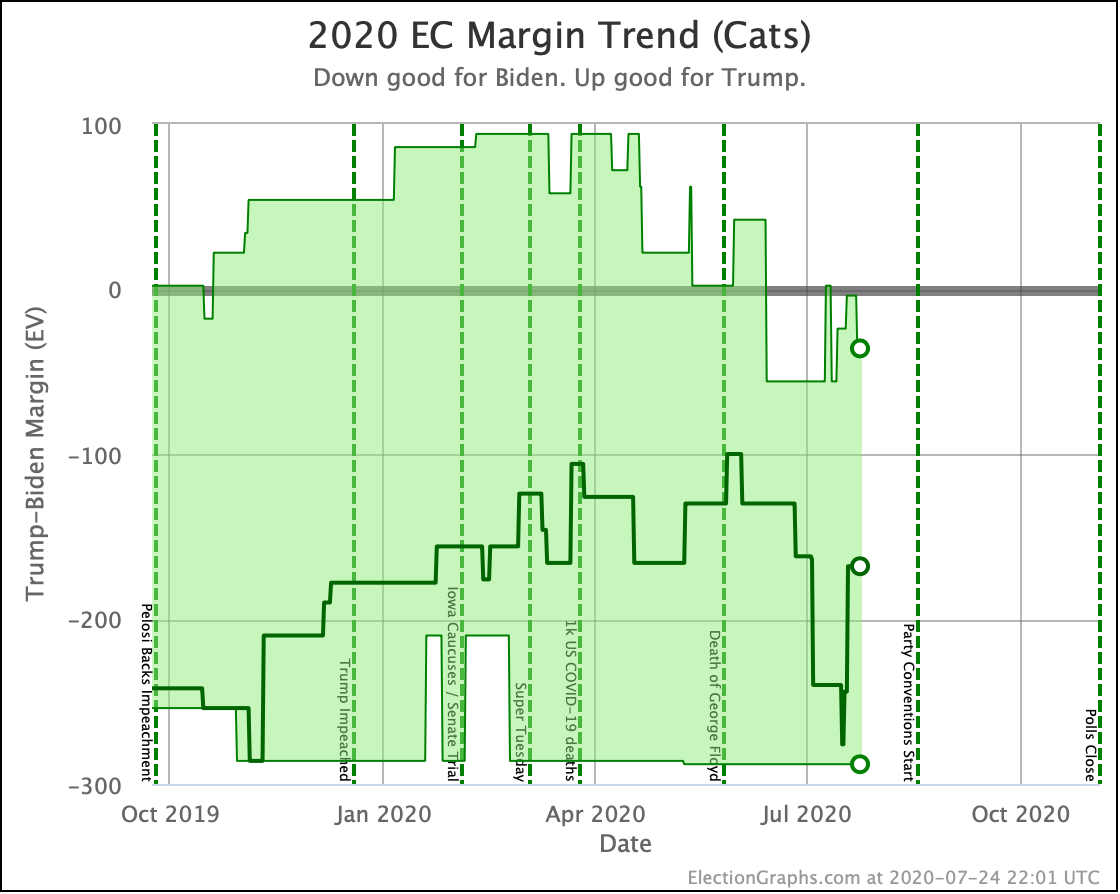
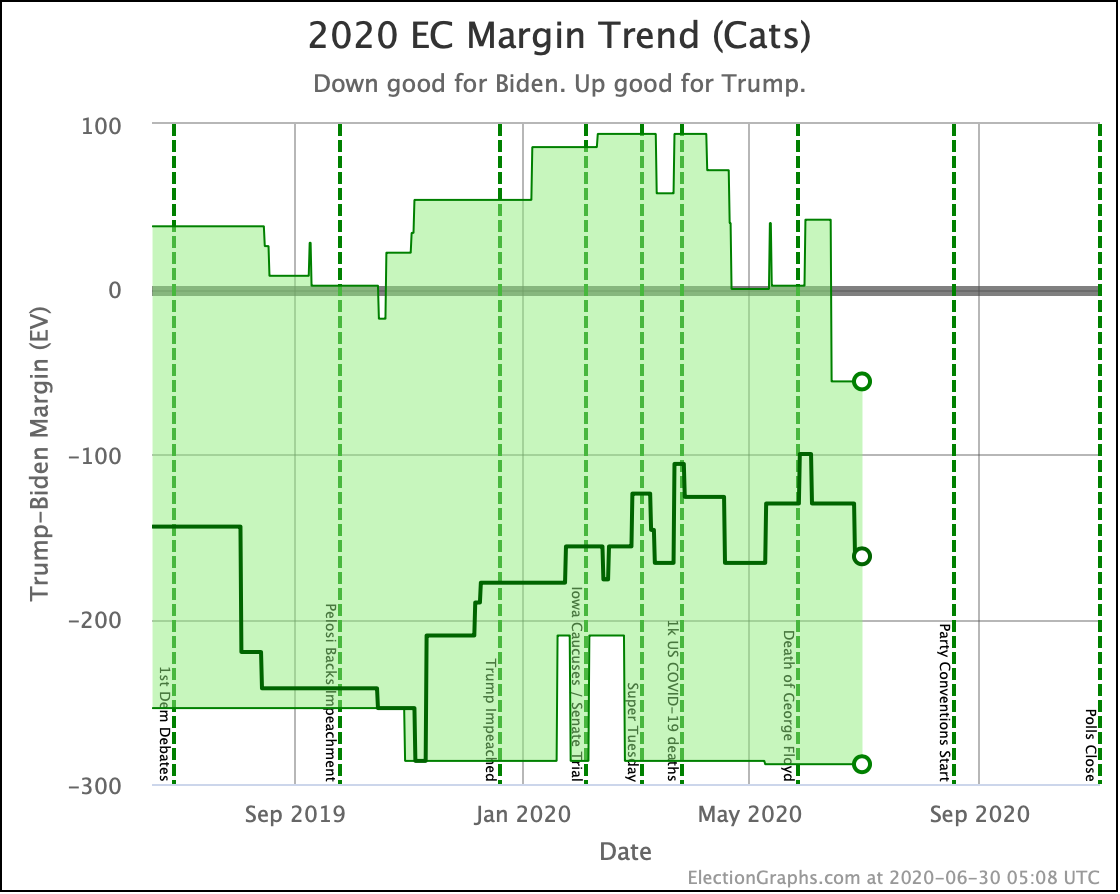
| Categories | Trump Best Expected Biden Best |
Trump +34 Biden +180 Biden +288 |
Biden +6 Biden +182 Biden +288 |
Biden +40 Biden +2 FLAT |
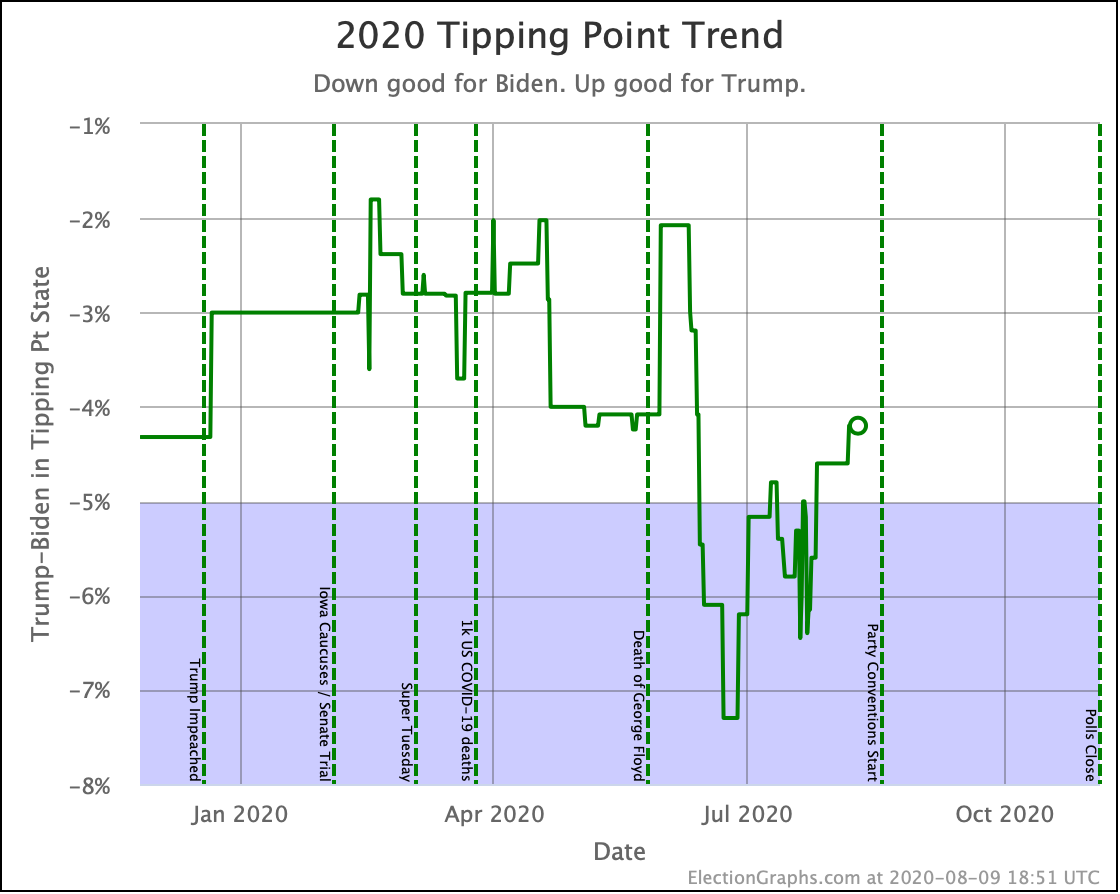
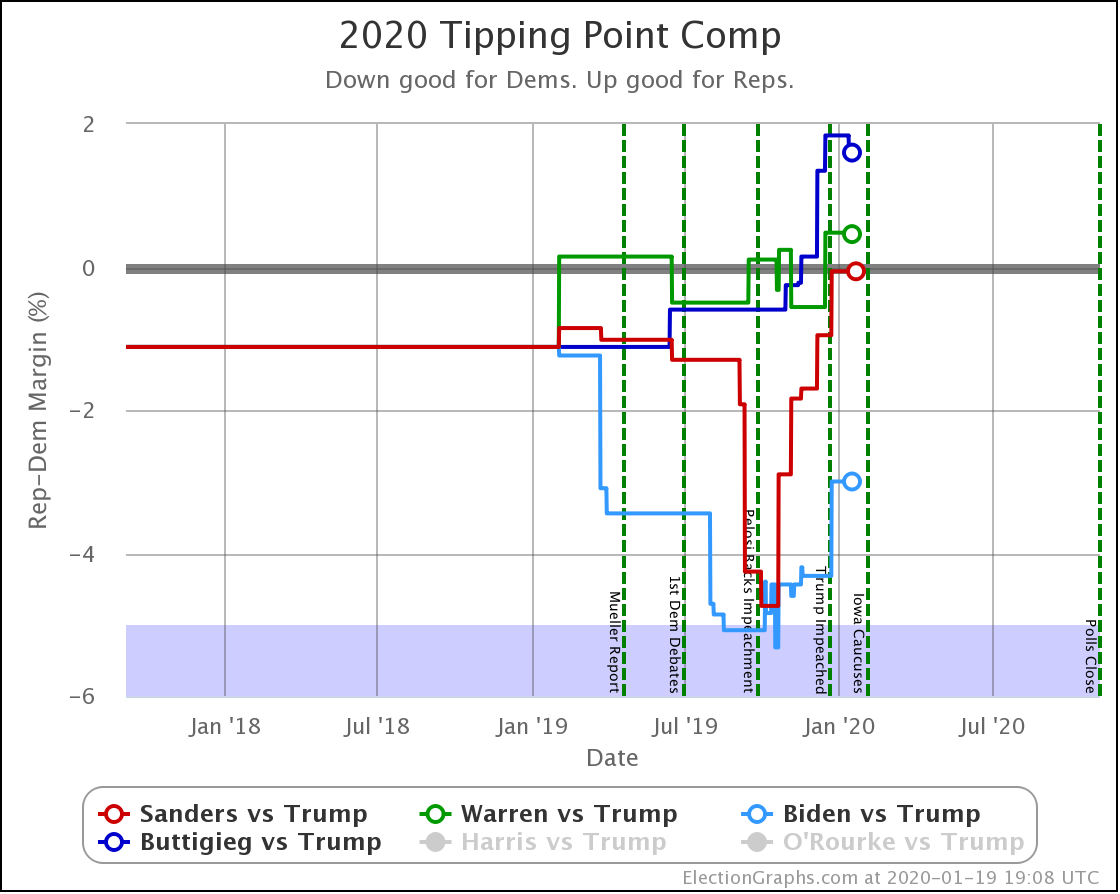
| Tipping Point | Biden +4.2 | Biden +5.9% | Biden +1.7% | |
| Probabilities | Trump 2σ Median Biden 2σ |
Biden +50 Biden +154 Biden +264 |
Biden +52 Biden +152 Biden +260 |
Biden +2 Trump +2 Trump +4 |
| Trump Win Tie Biden Win |
0.1% 0.0% 99.9% |
0.1% 0.0% 99.9% |
FLAT FLAT FLAT |
The bottom line here is there is not much net change. If you had to pick a winner, Biden is a bit better off than when we made our last post. But really, things haven't moved all that much.
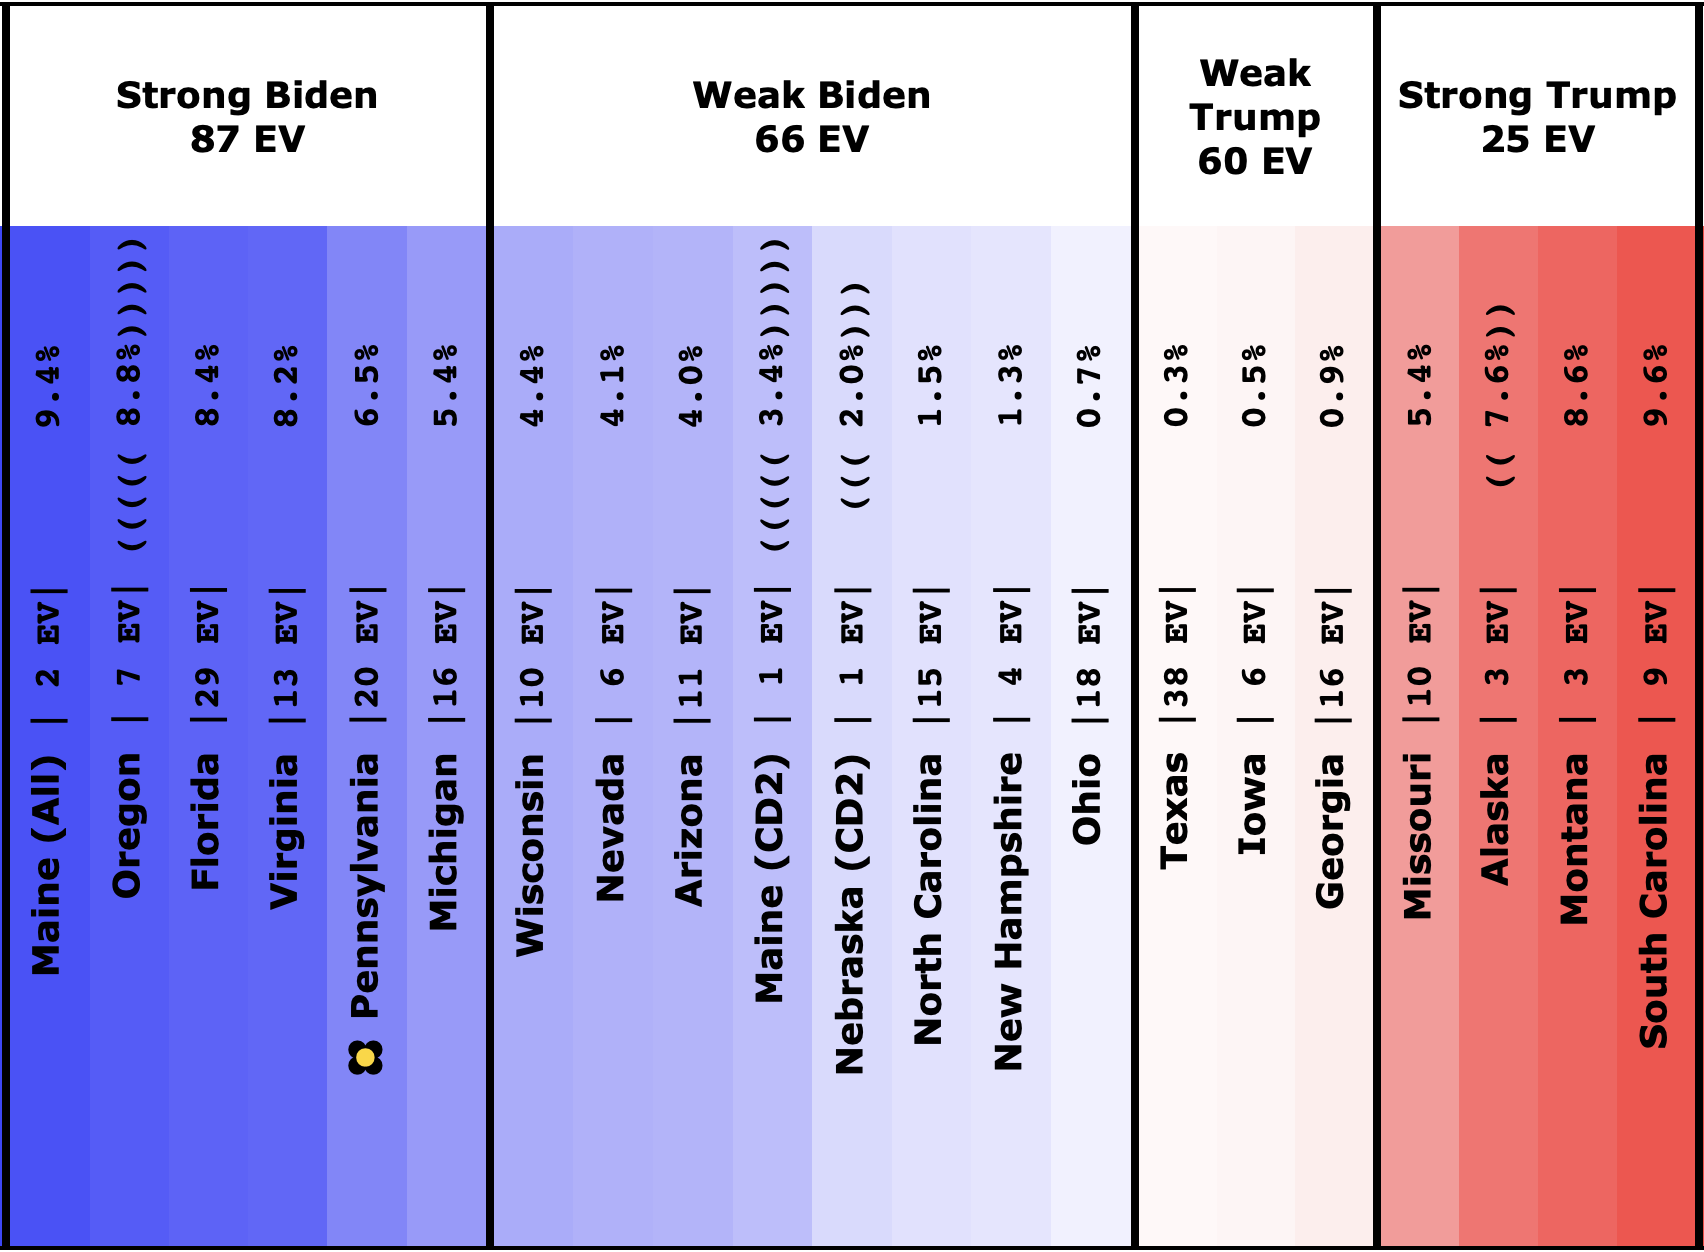
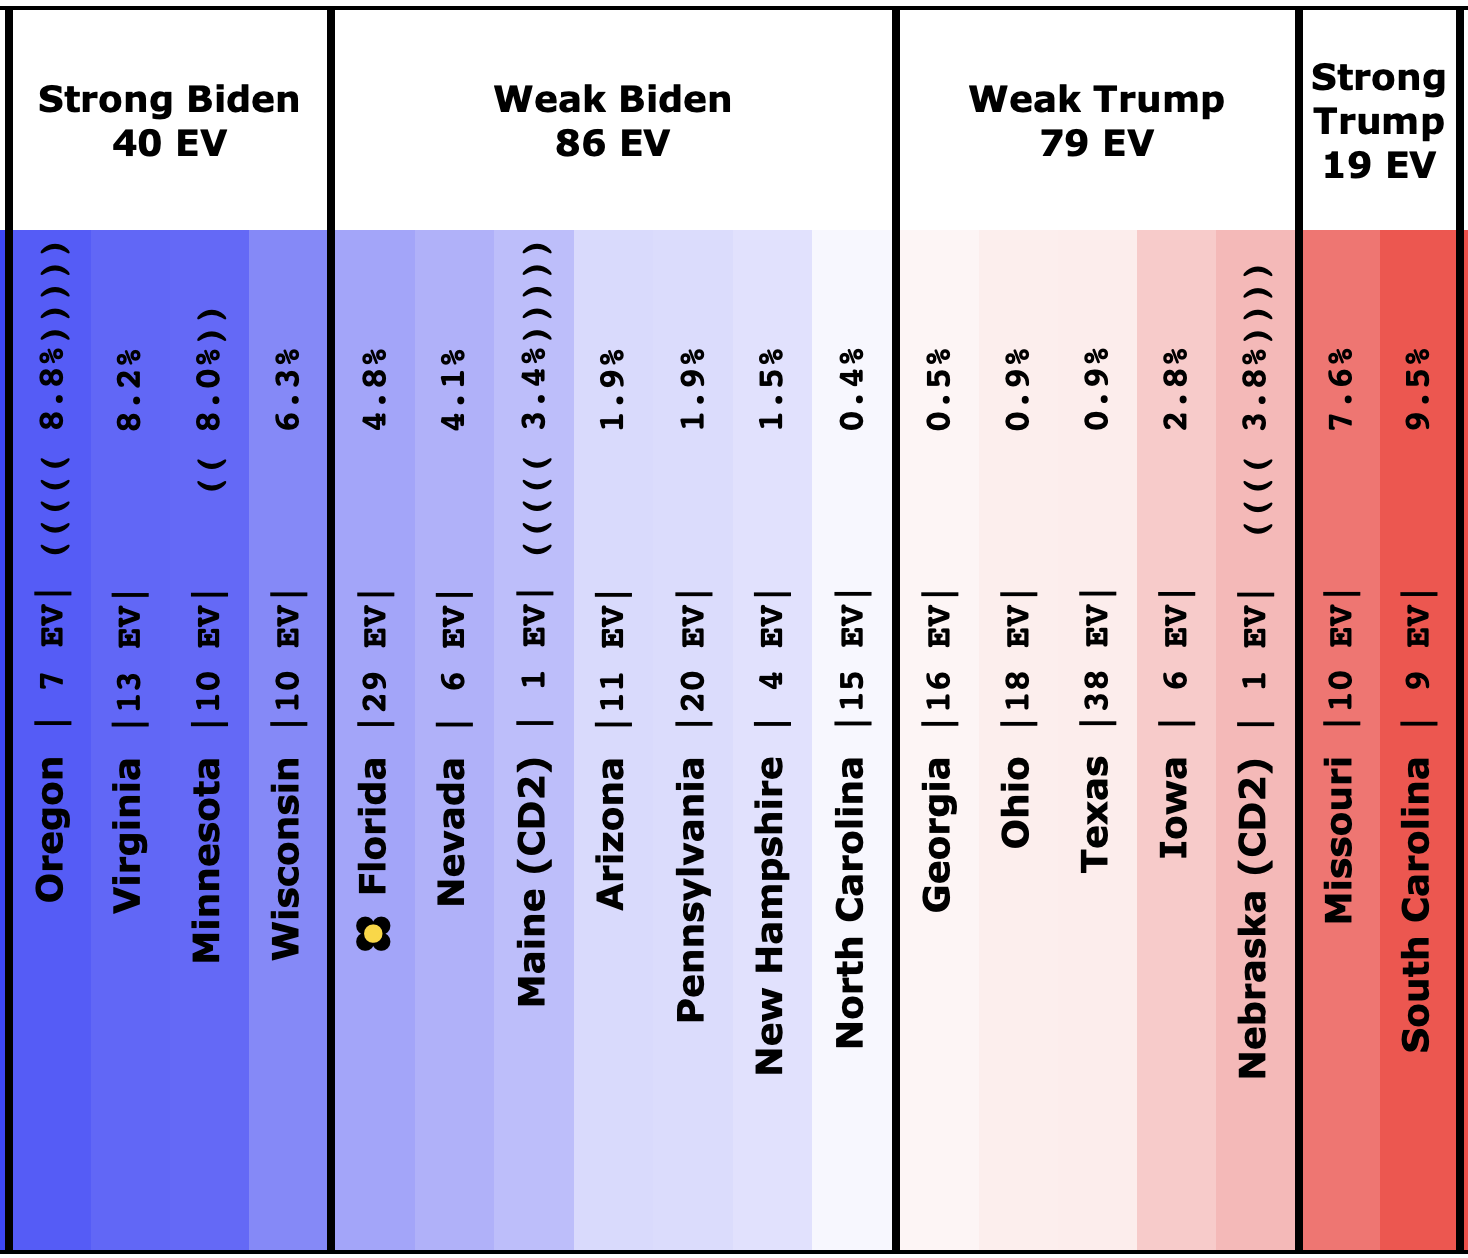
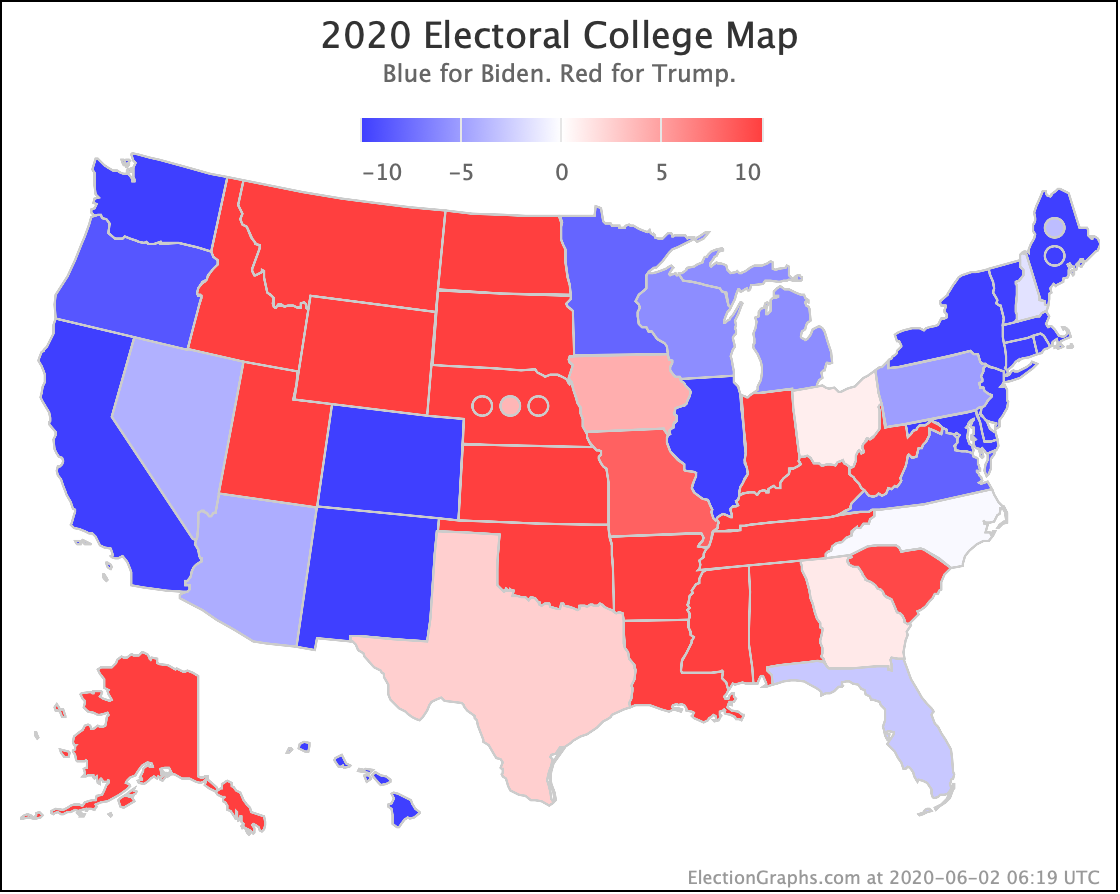
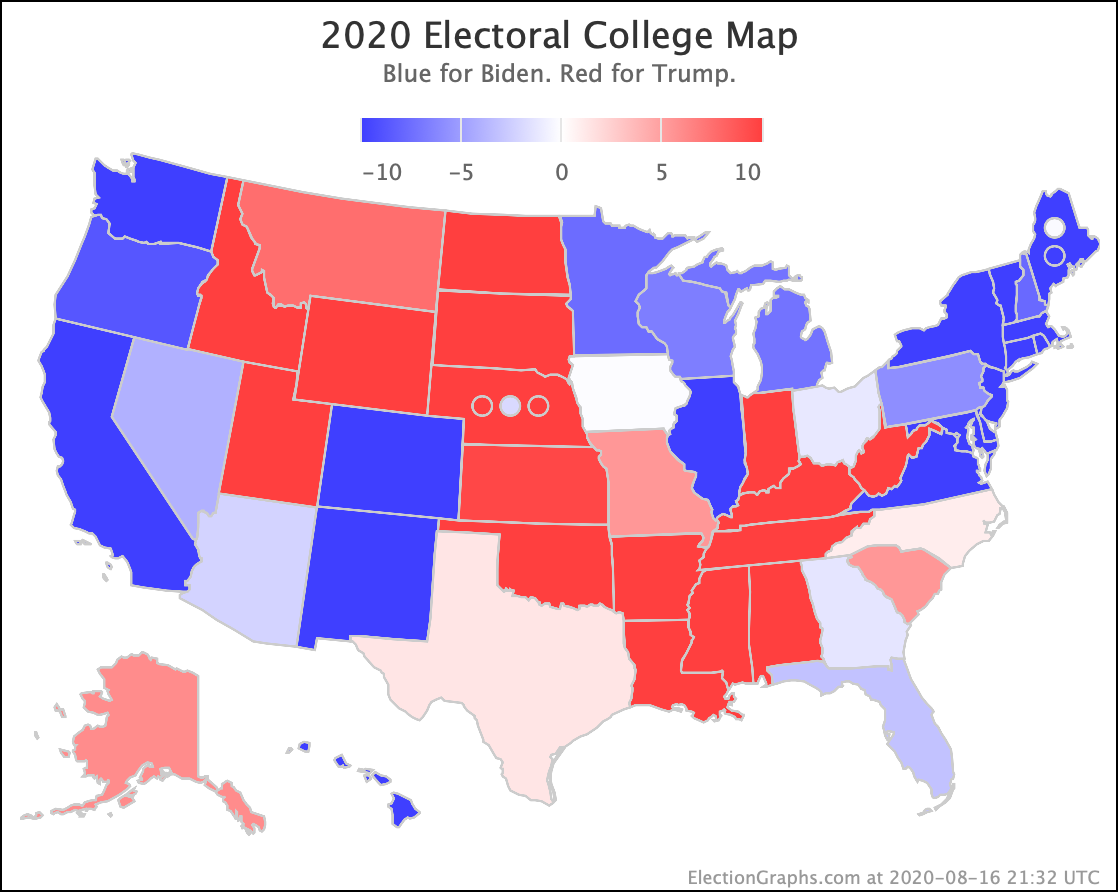
Let's start with the states that actually moved in or out of the "Weak Biden" and "Weak Trump" categories in our categorization view.
There were three:
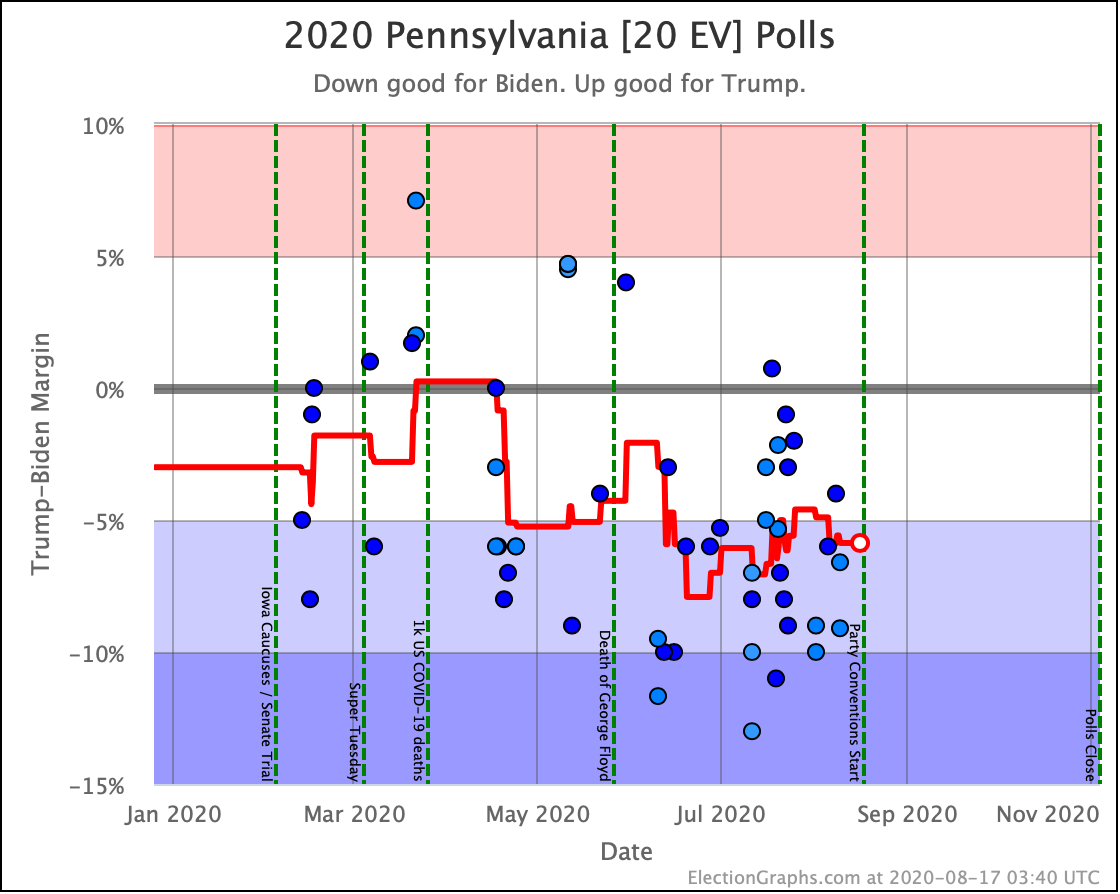
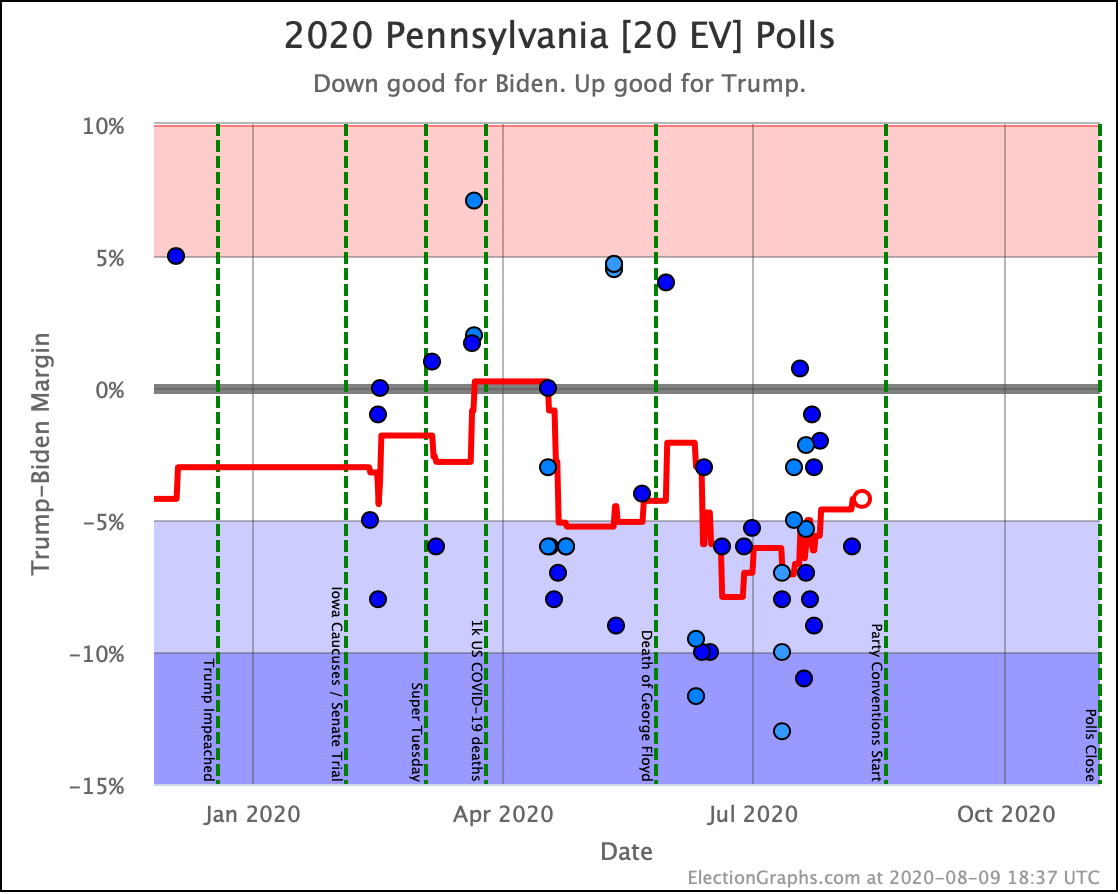
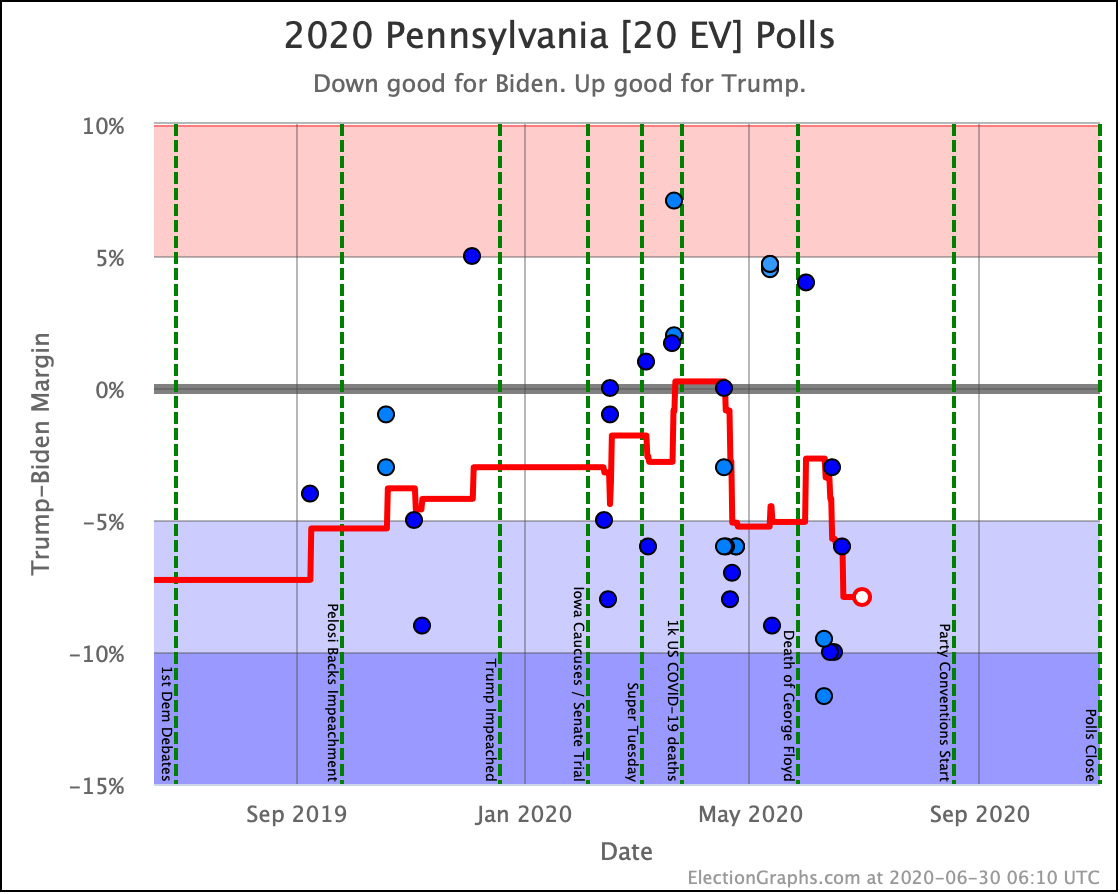
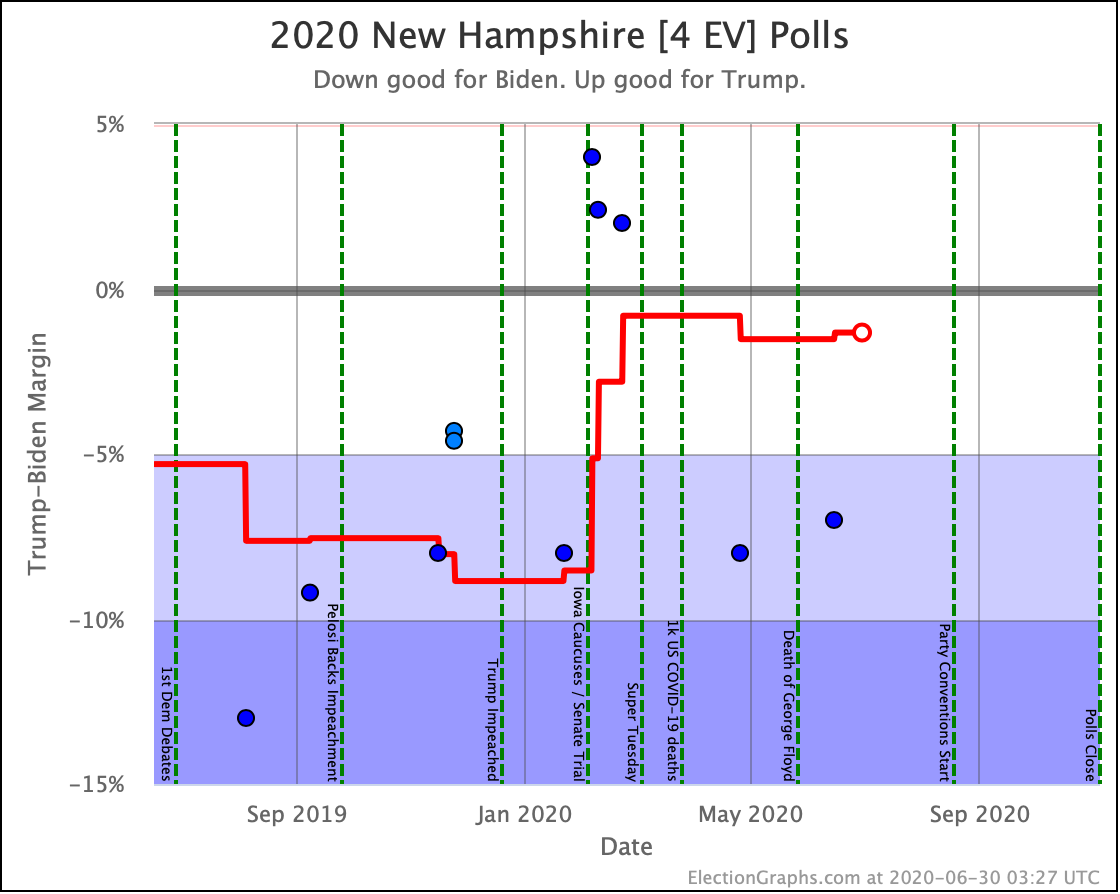
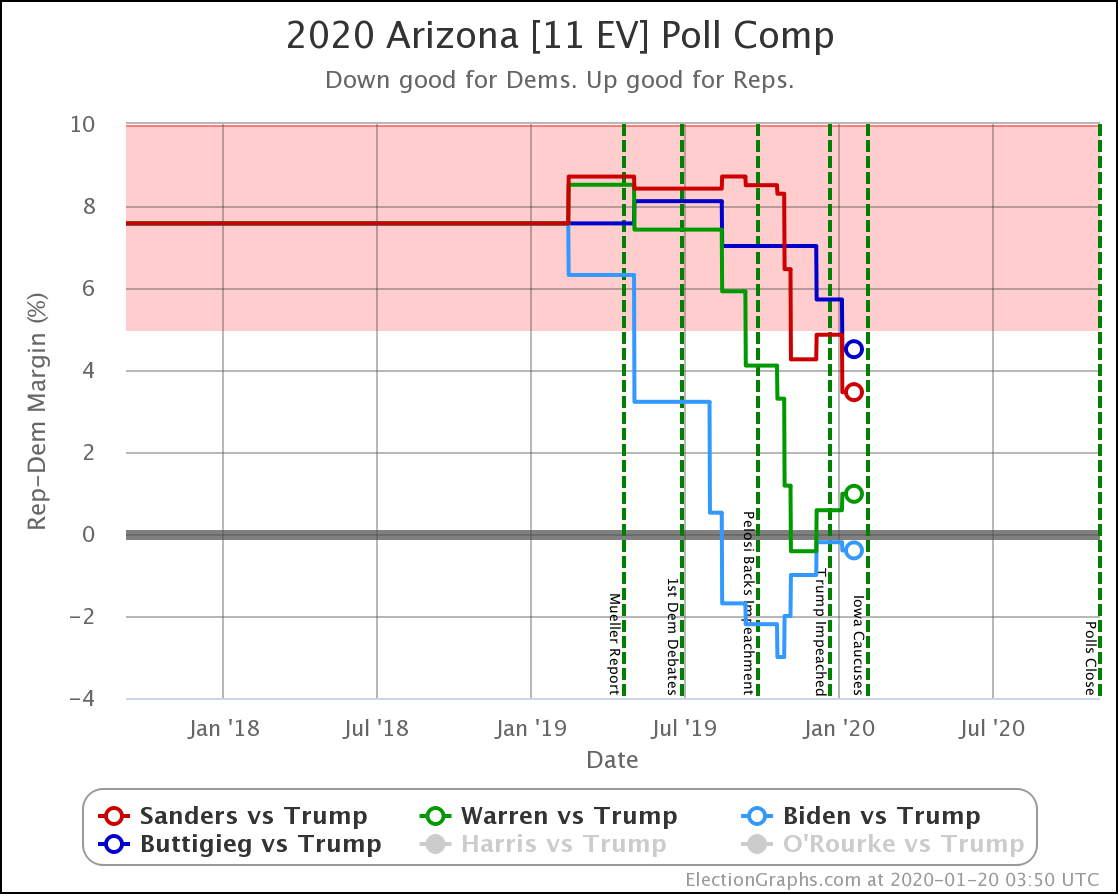
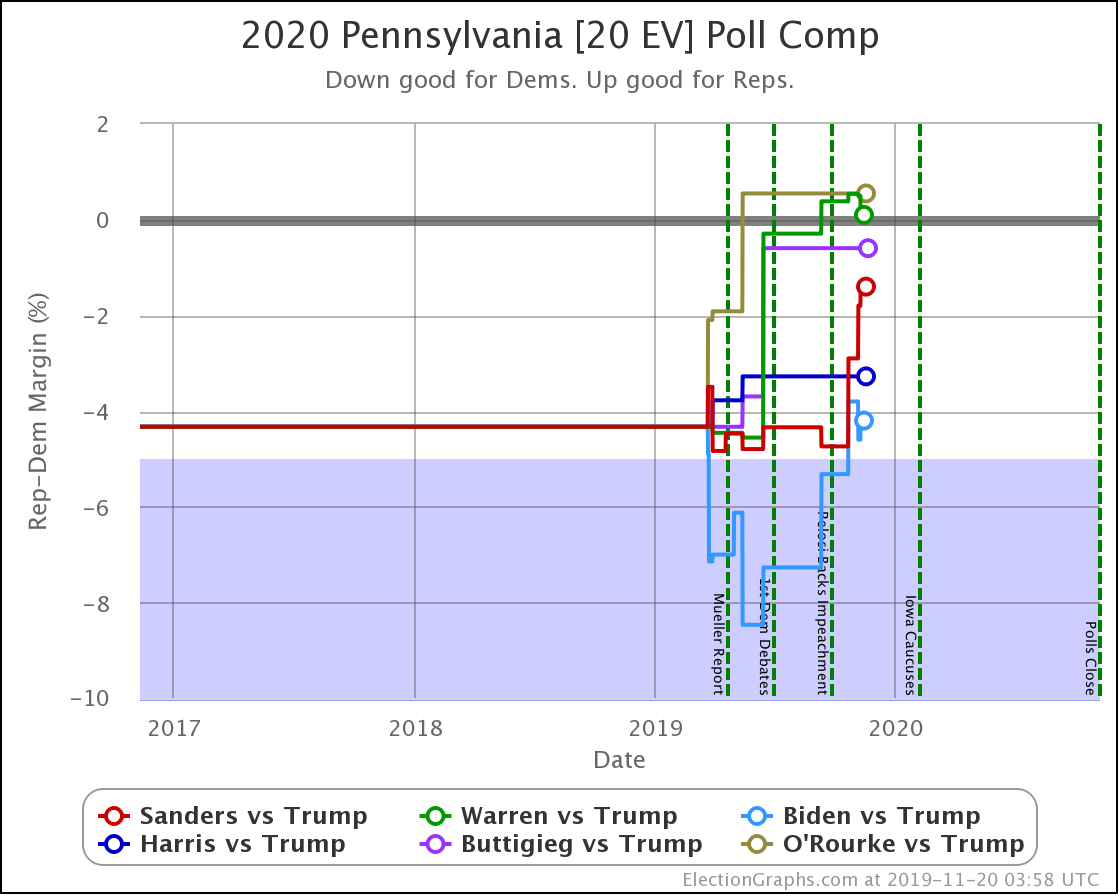
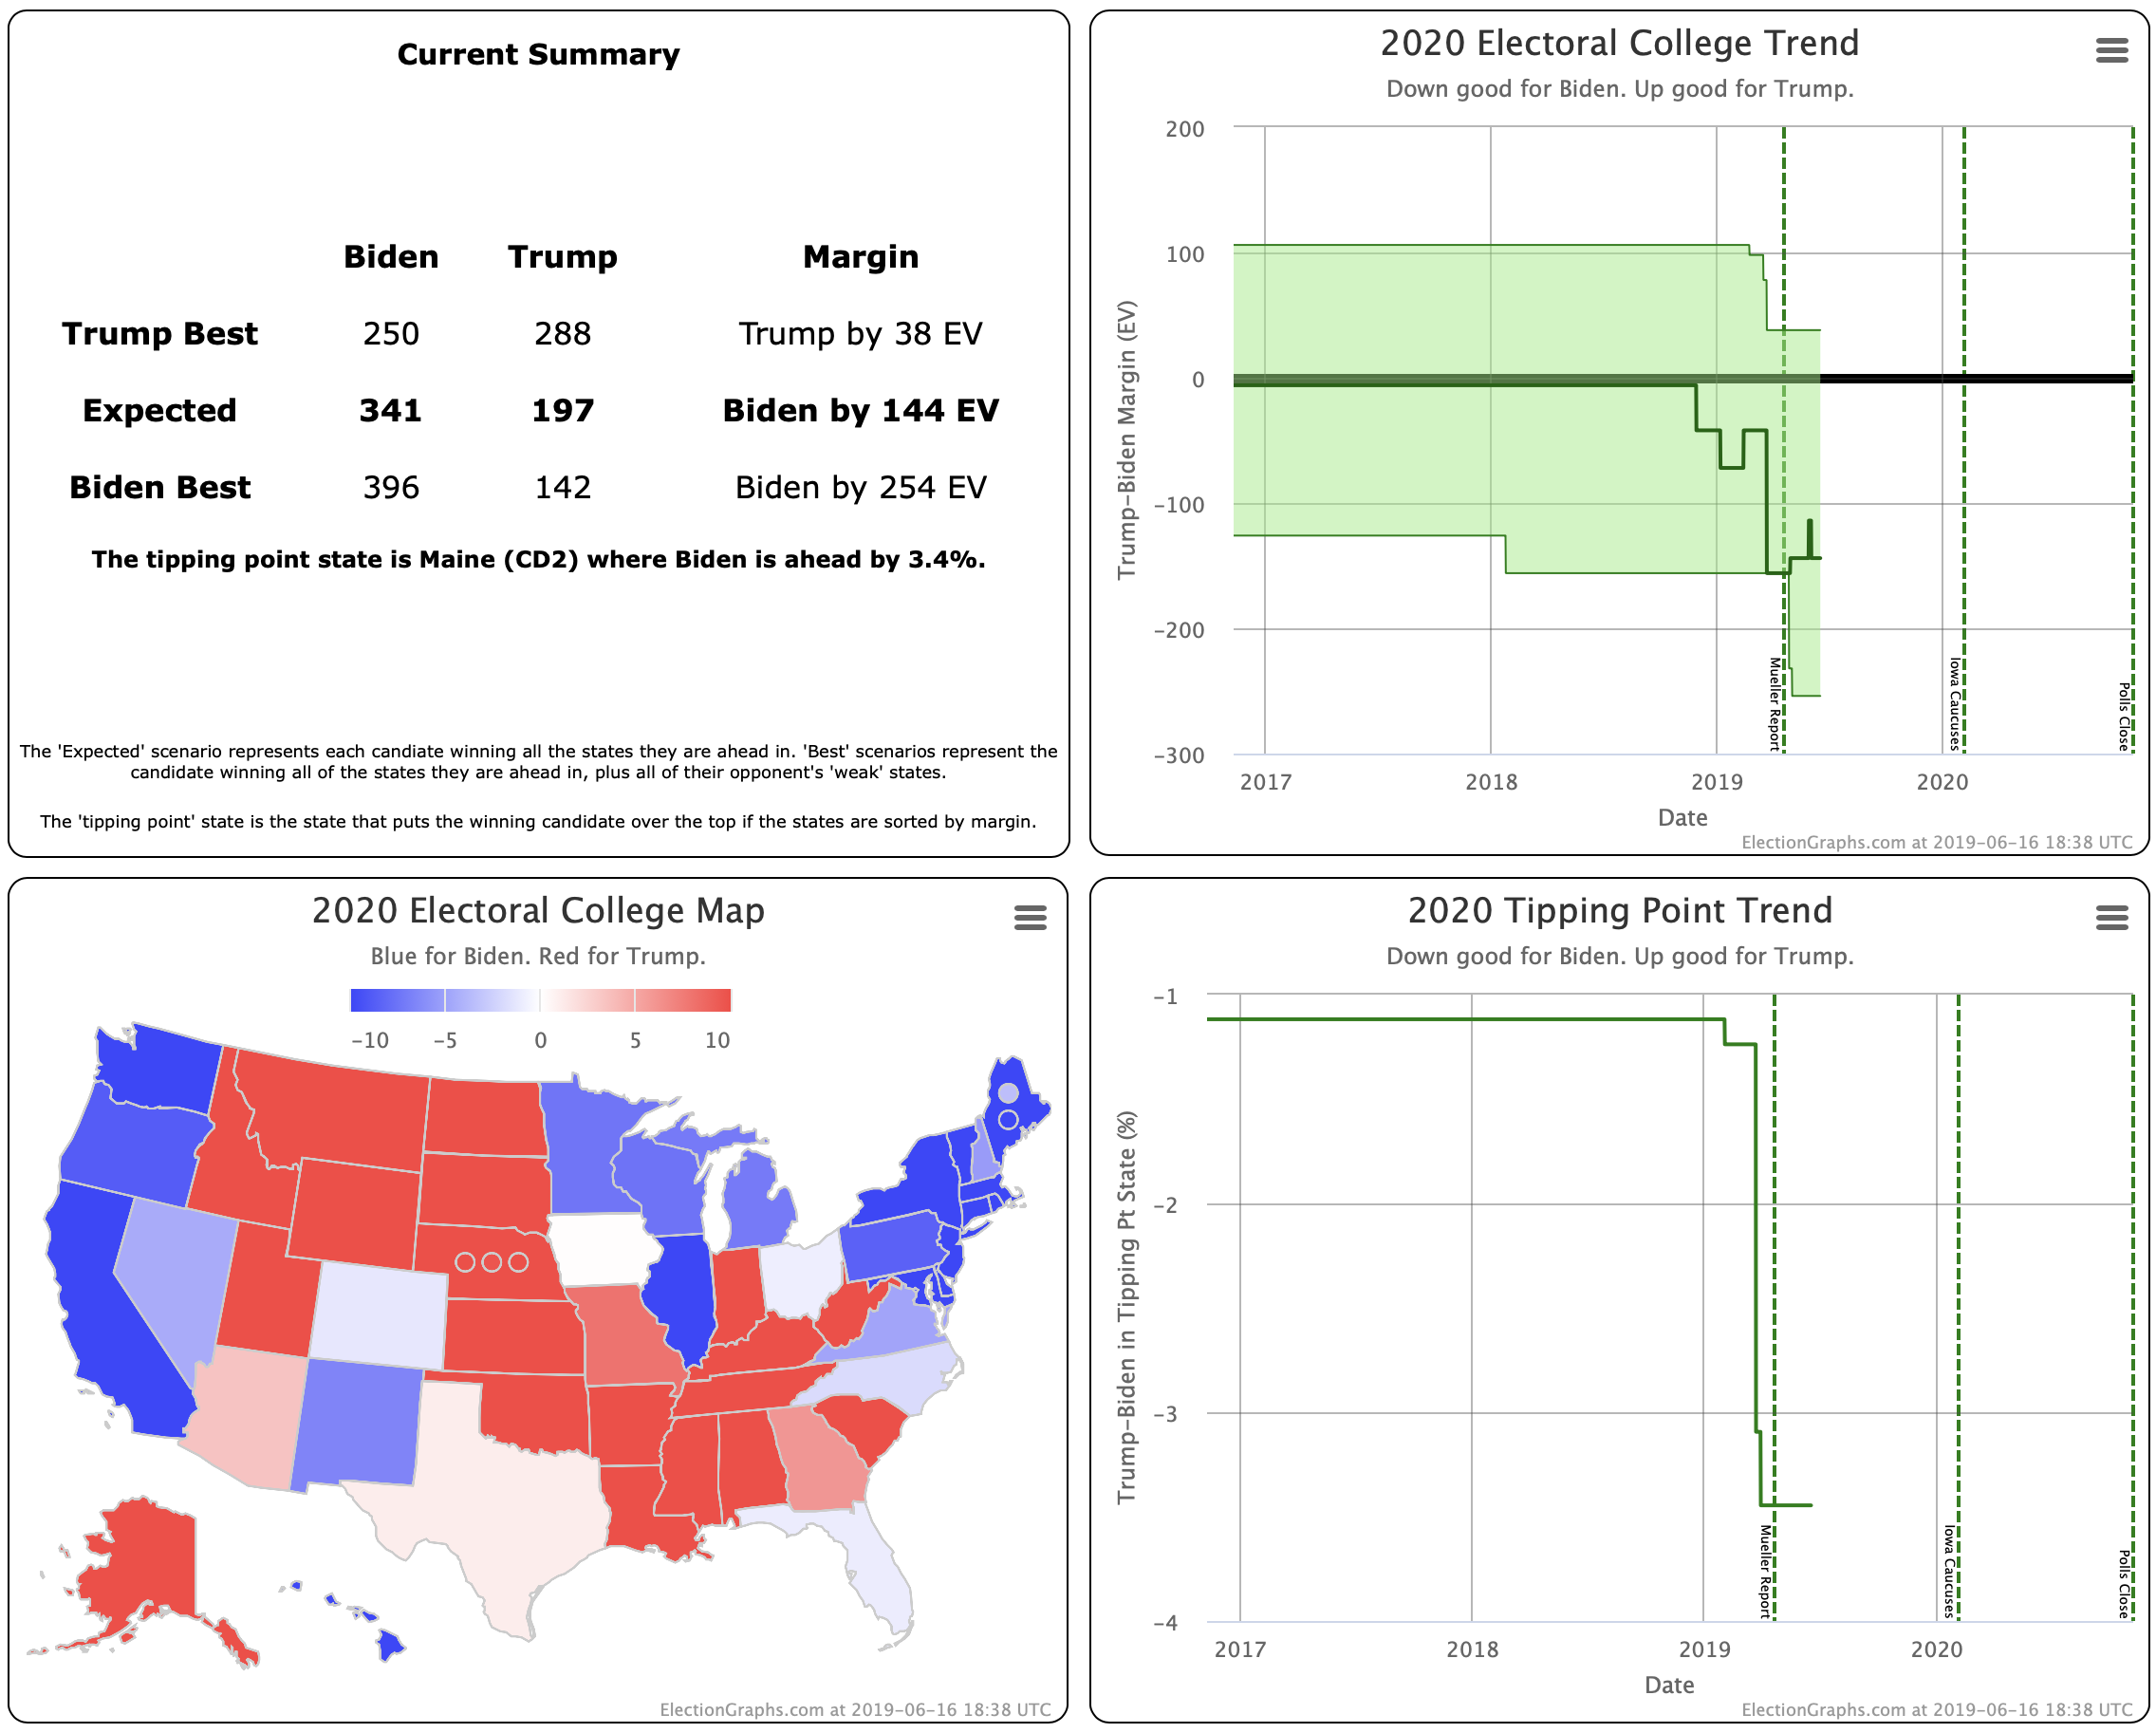
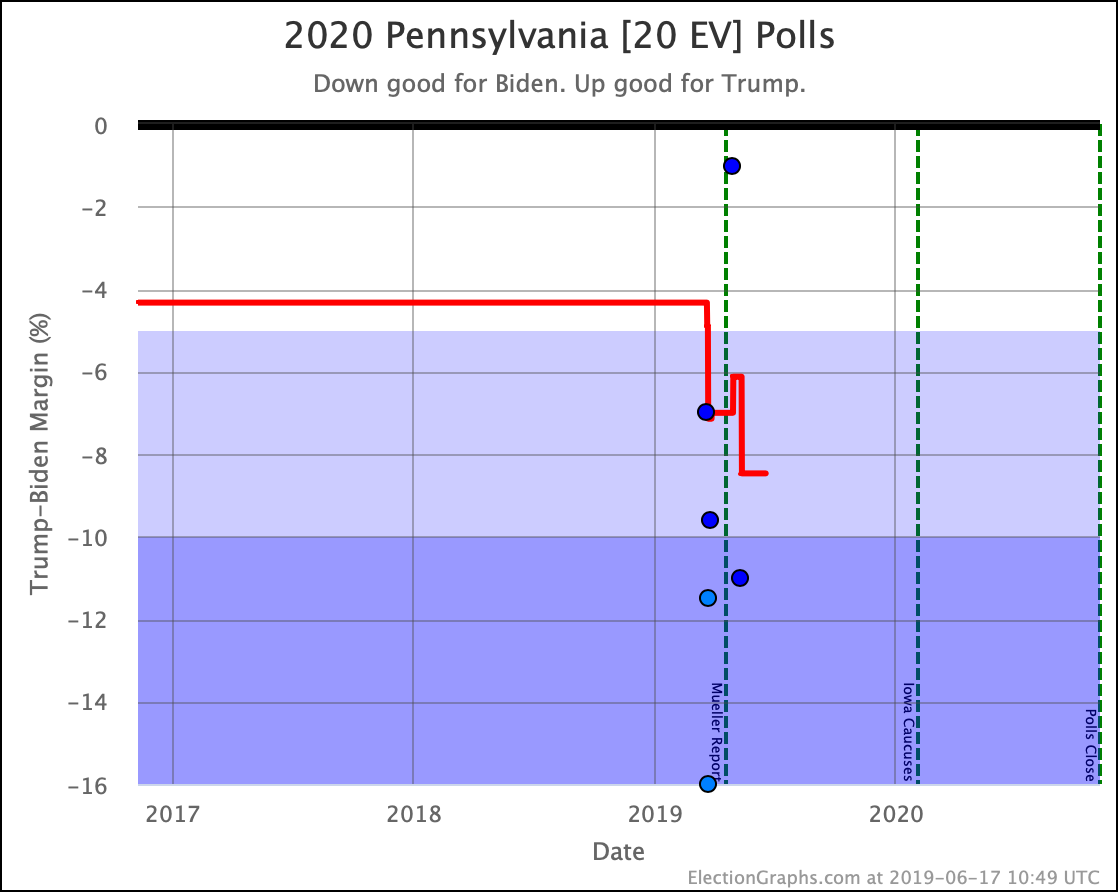
After a brief foray into "Weak Biden" territory, Biden's lead in Pennsylvania increased once again to over 5%, moving the state to our "Strong Biden" category, and removing winning Pennsylvania from what we call Trump's "best case".
With this Trump's best case margin drops 40 electoral votes from a 34 electoral vote win to a 6 electoral vote loss.
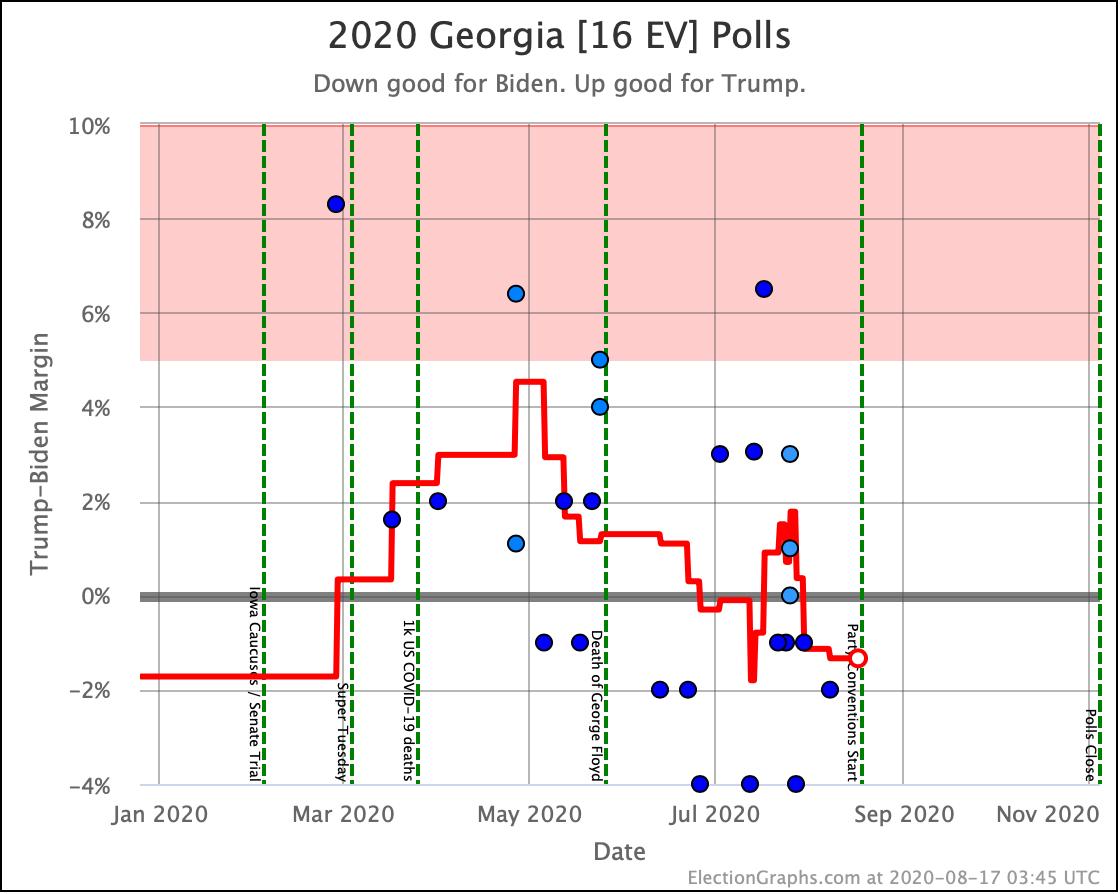
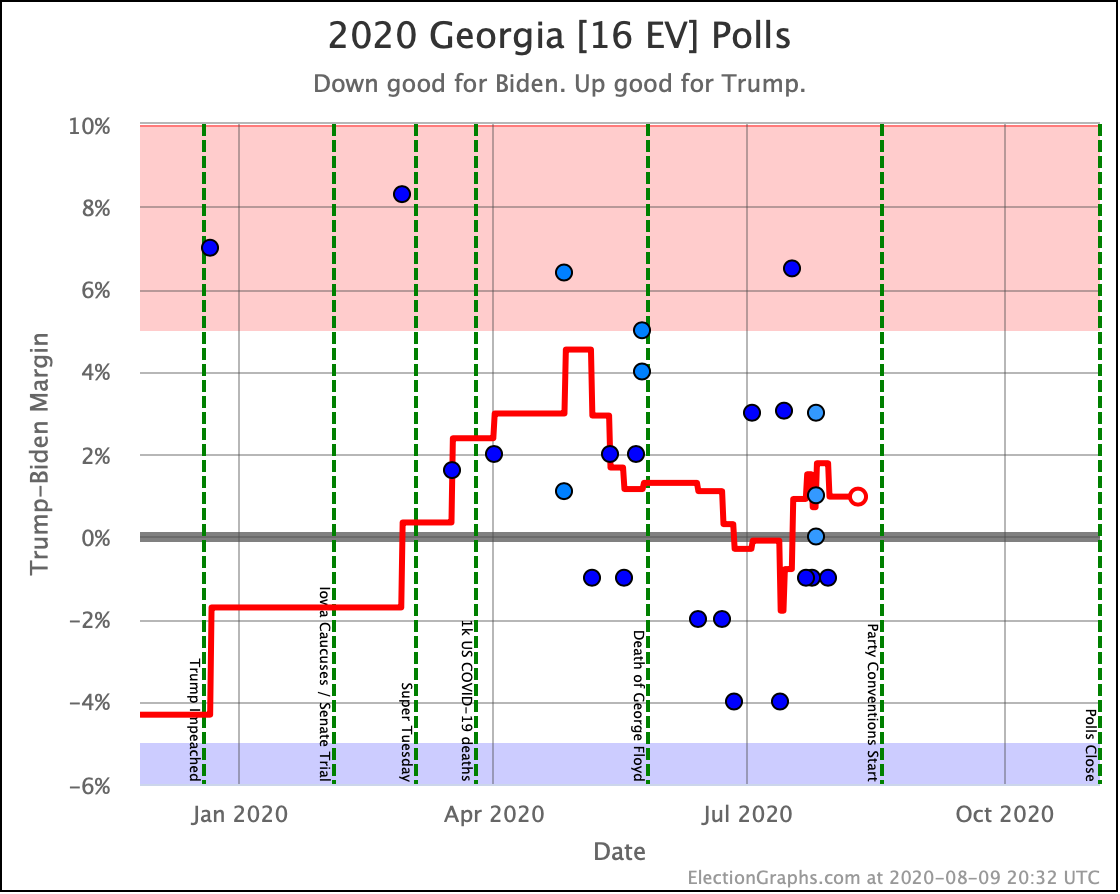
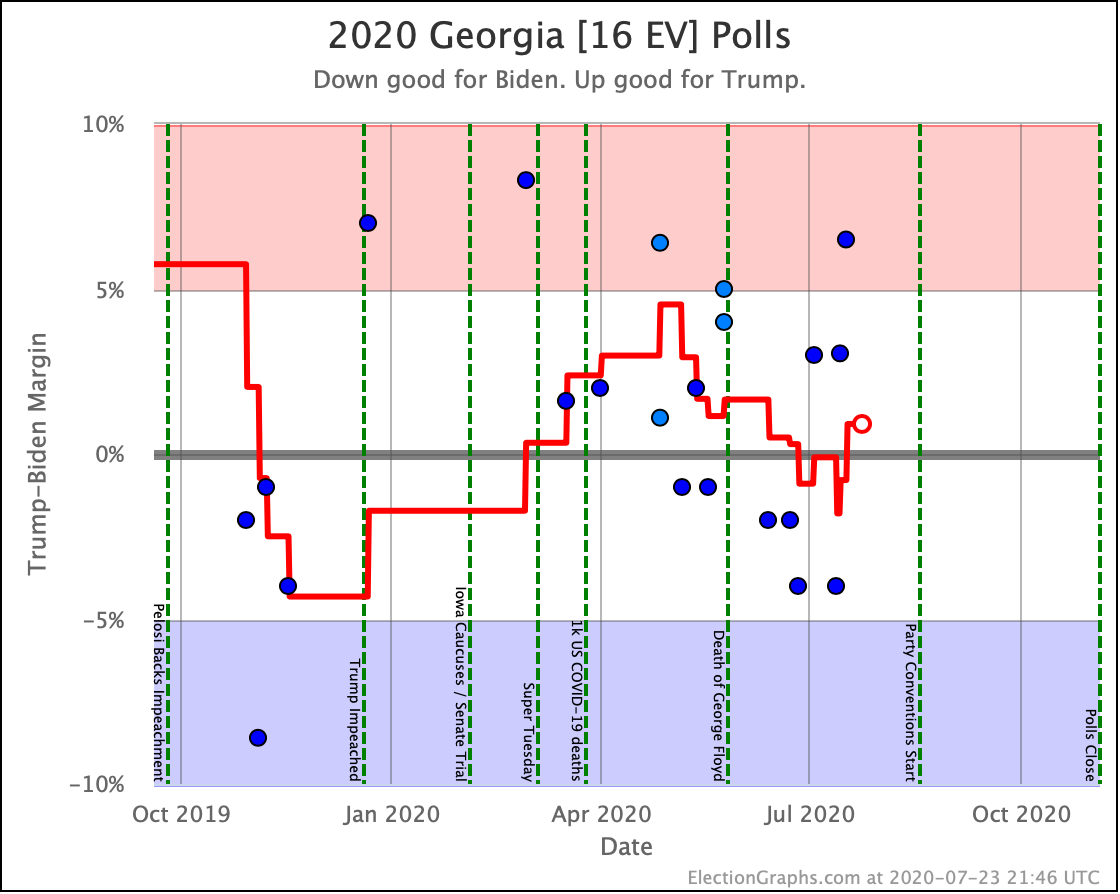
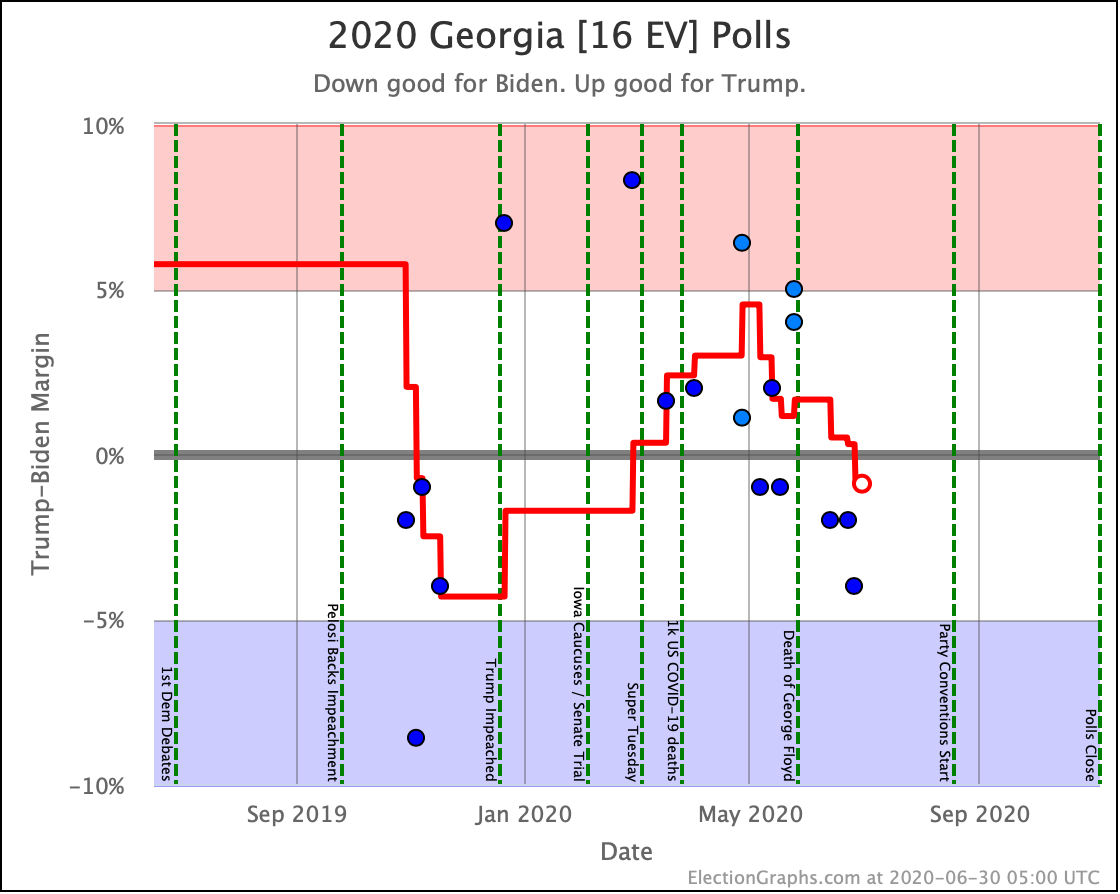
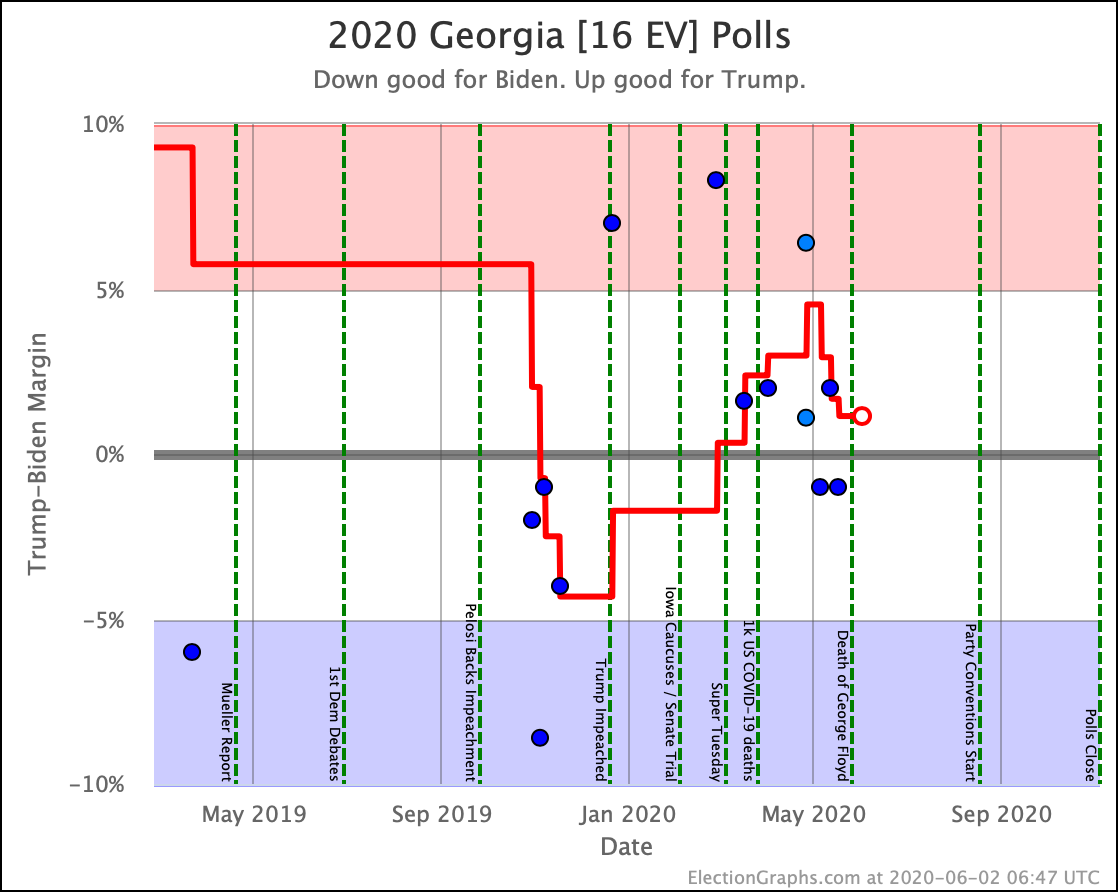
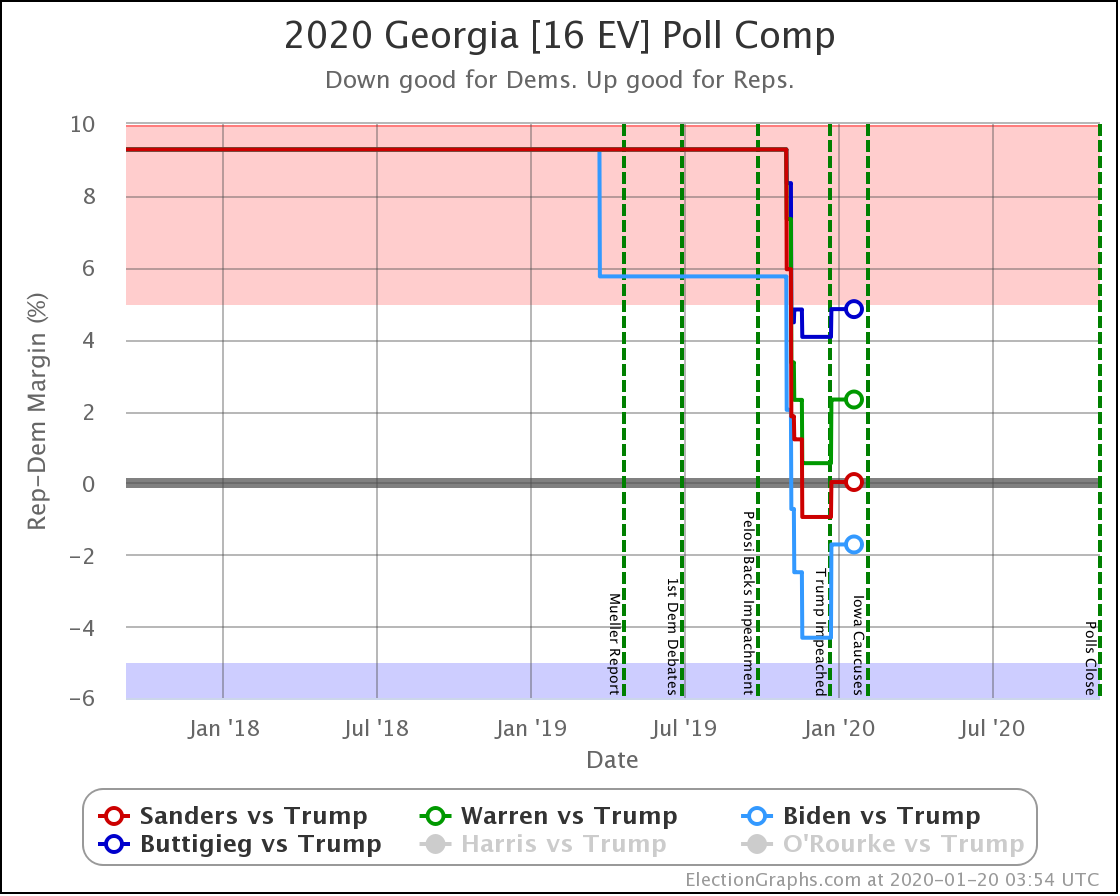
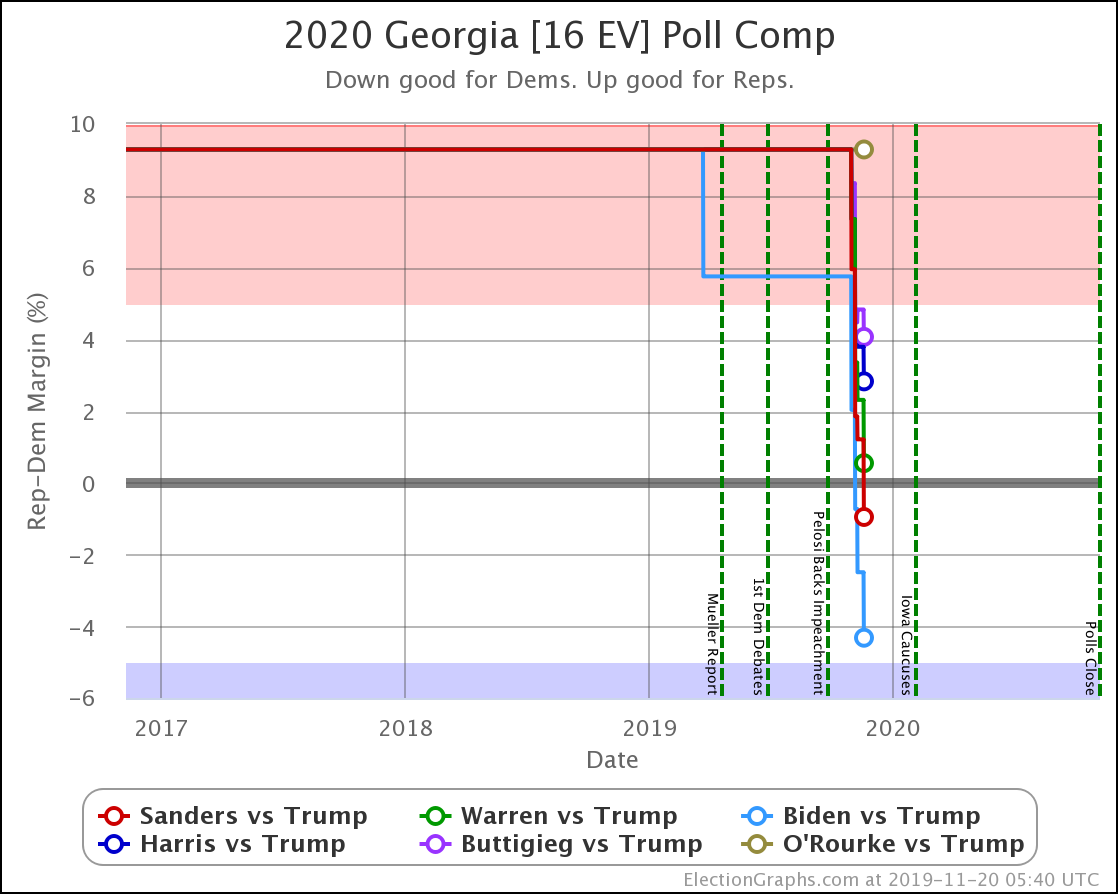
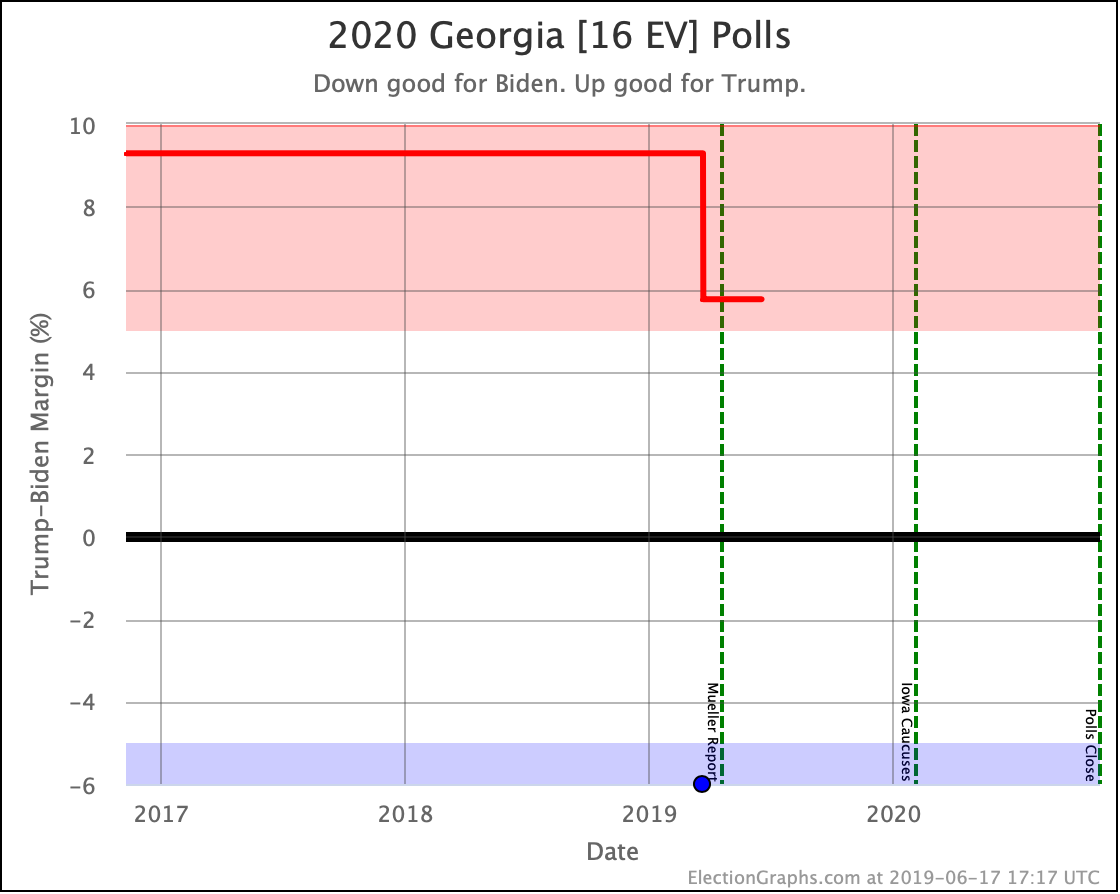
As of our last update, Georgia had moved from just barely Biden to just barely Trump. It didn't last long. Georgia is now once again just barely Biden. "Just barely" is critical here of course. It is really just too close to call.
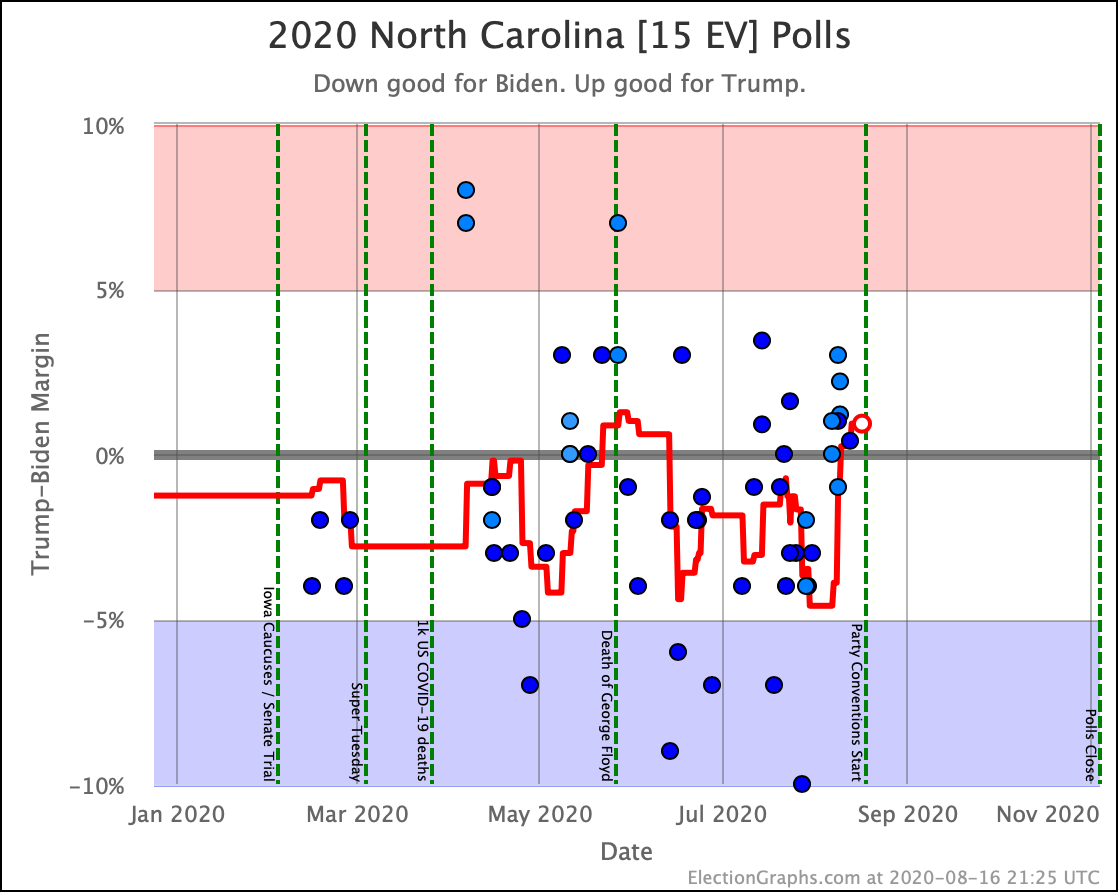
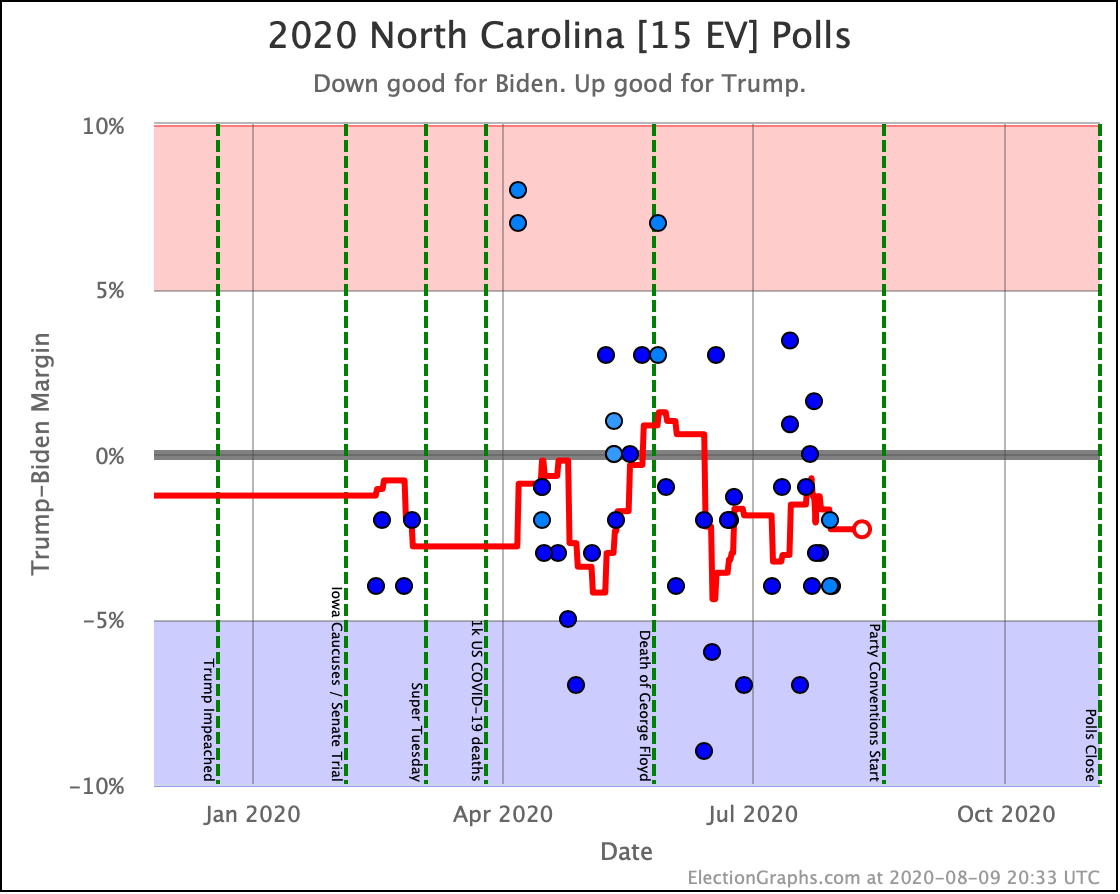
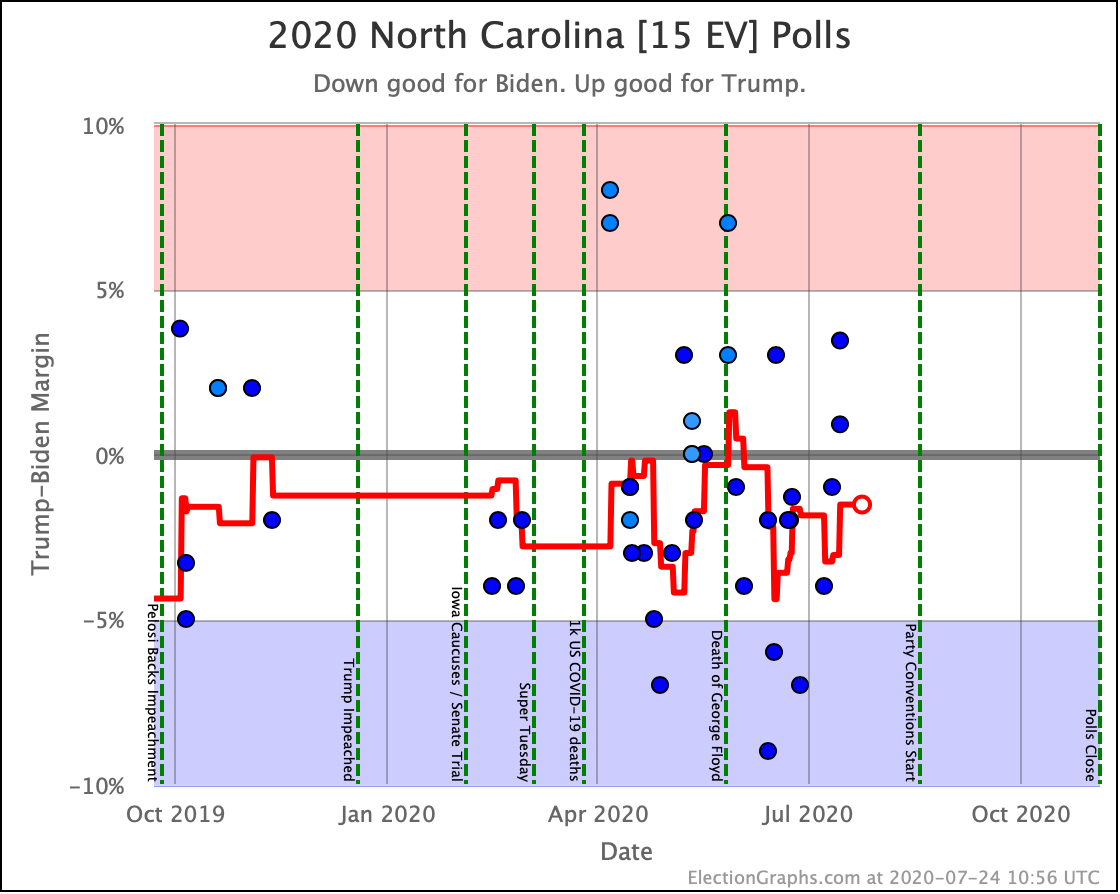
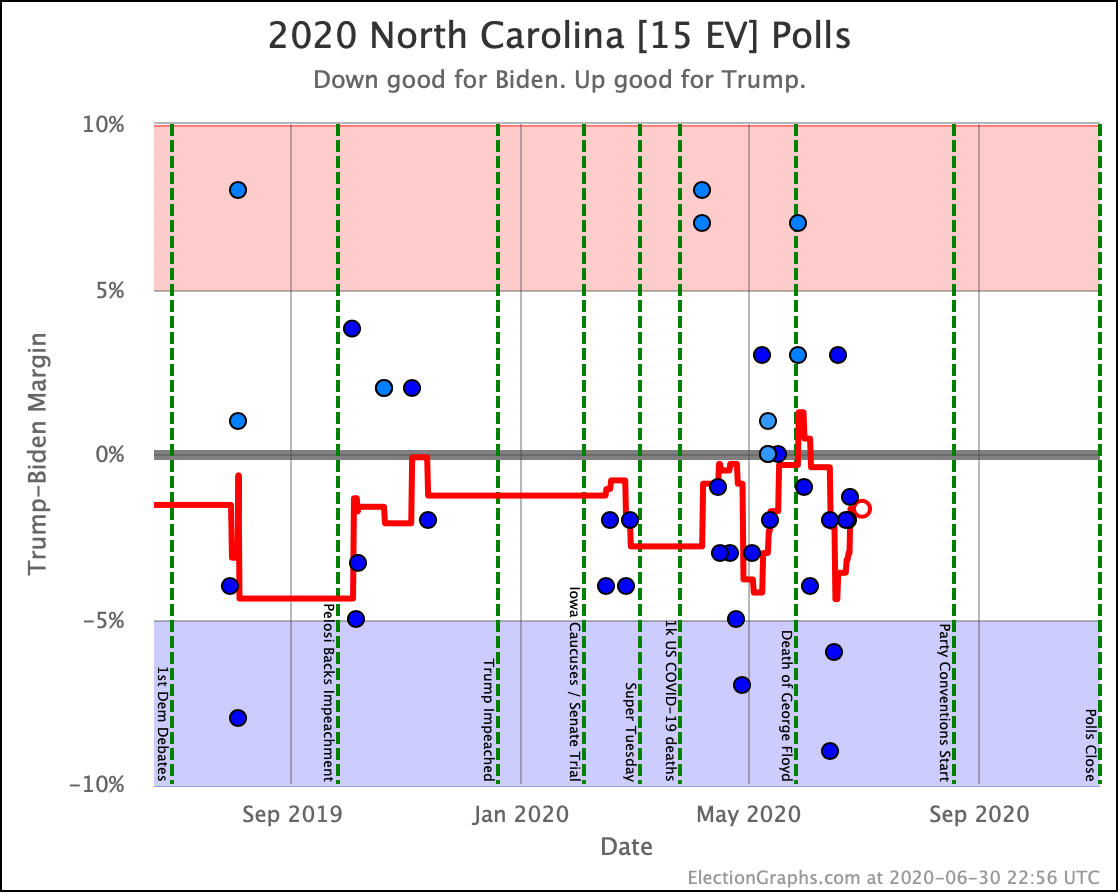
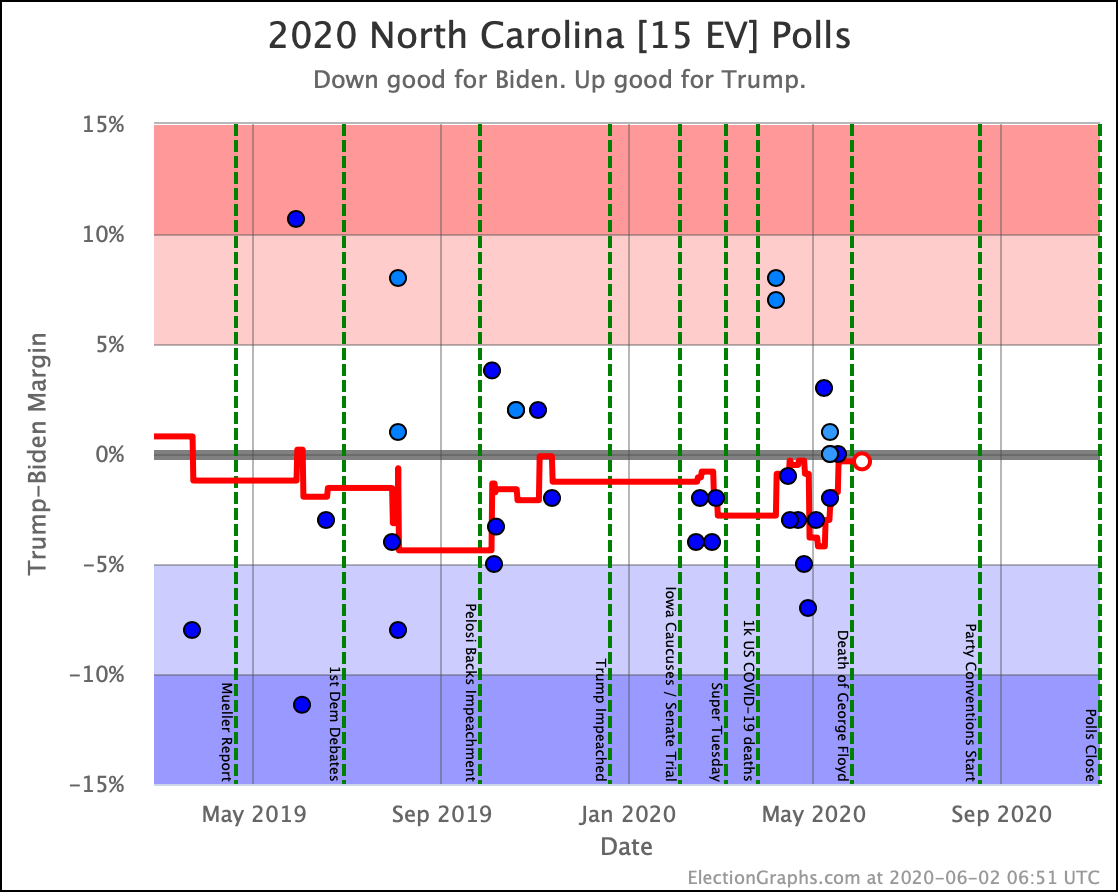
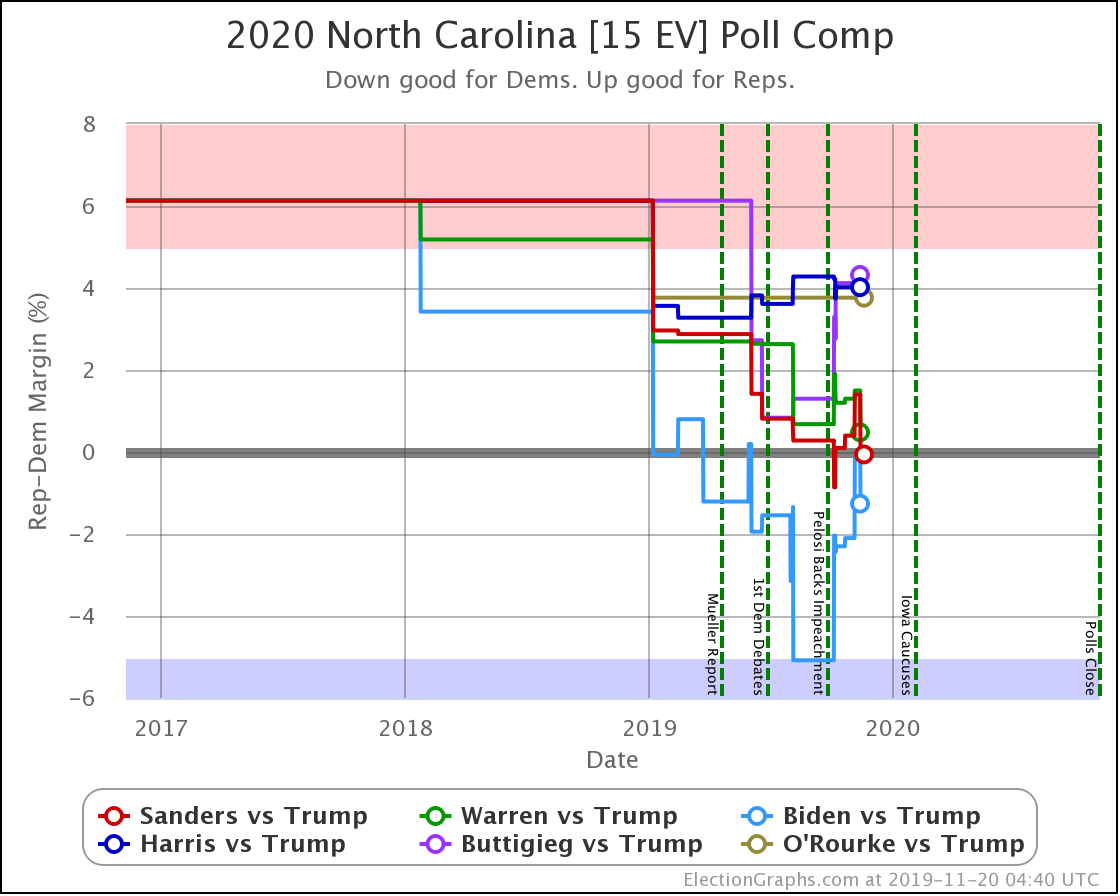
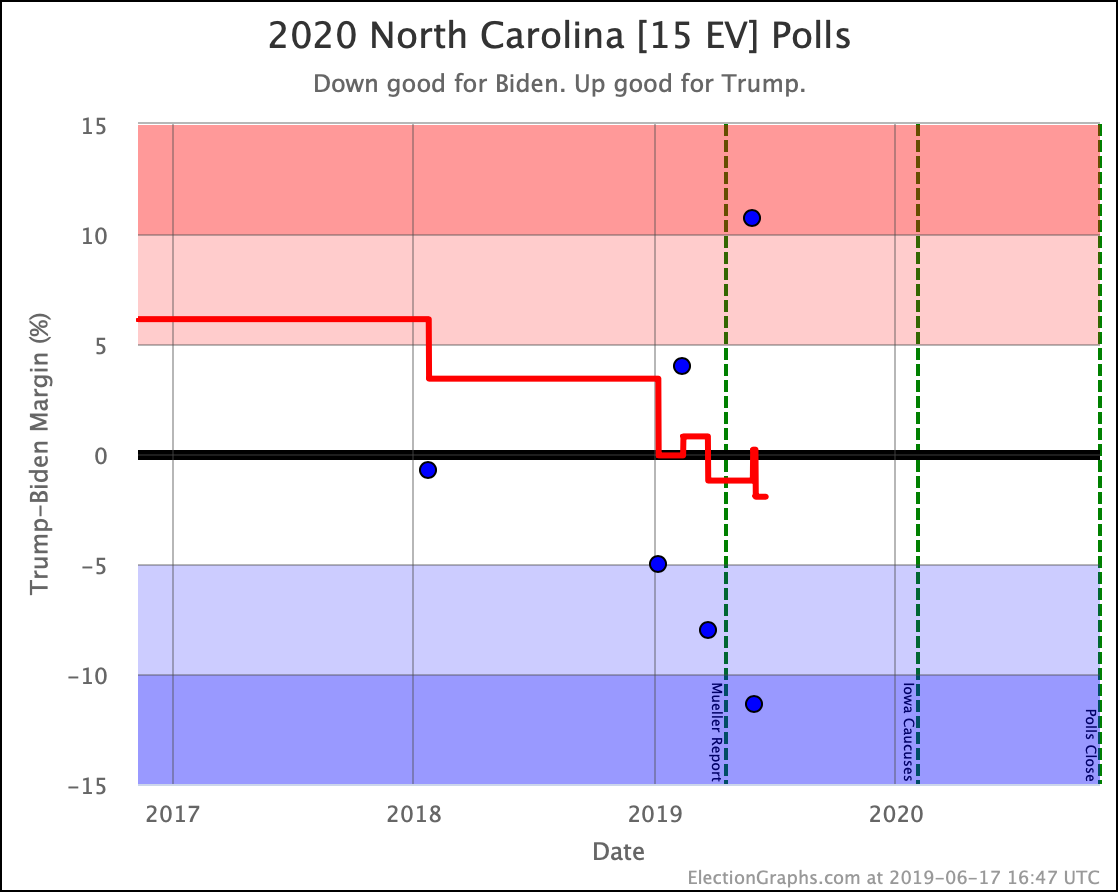
North Carolina had been in the "Weak Biden" category since June, but Trump has led the latest batch of polls and thus has pulled North Carolina back to his side of the line. Narrowly. Once again, the truth is the state is too close to call.
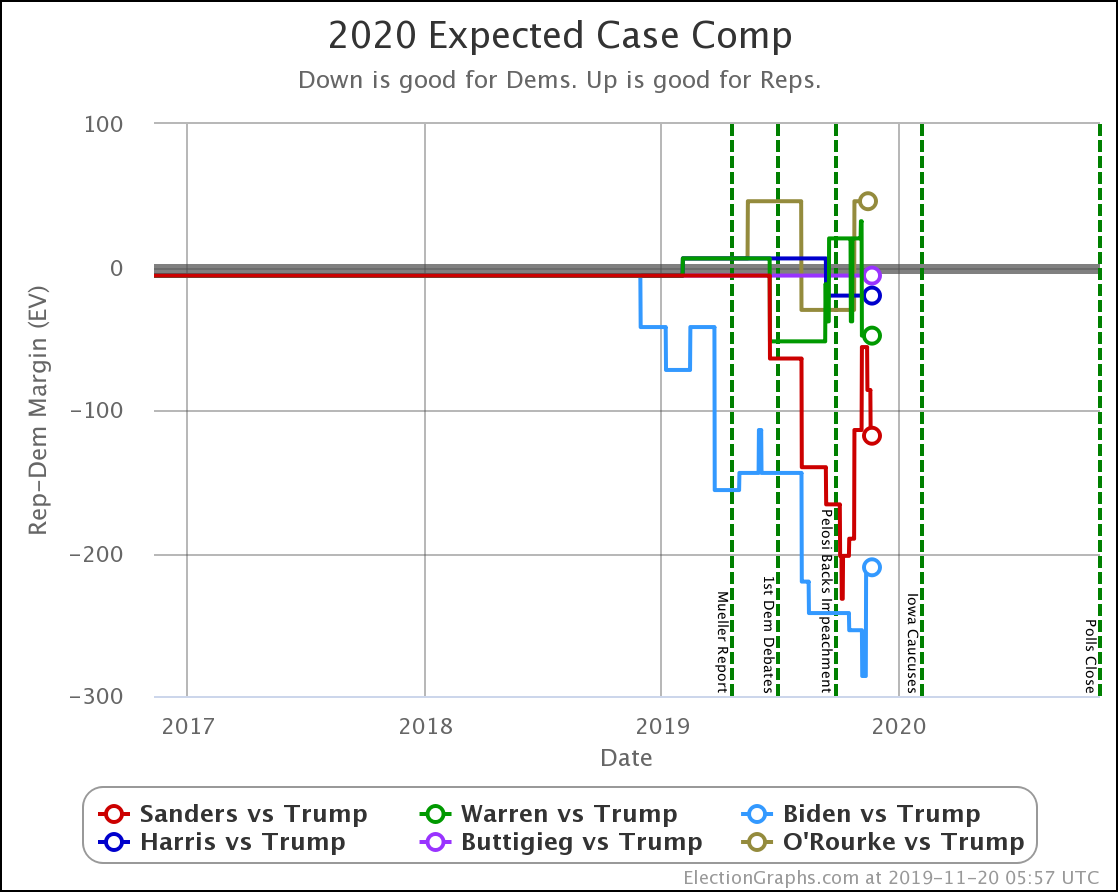
With the Georgia move, Biden's margin increased by 32 electoral votes. But the North Carolina move took away 30 of that. So the net change is a 2 electoral vote improvement for Biden in the "expected case" where every candidate wins exactly the list of states they lead in the Election Graphs averages.
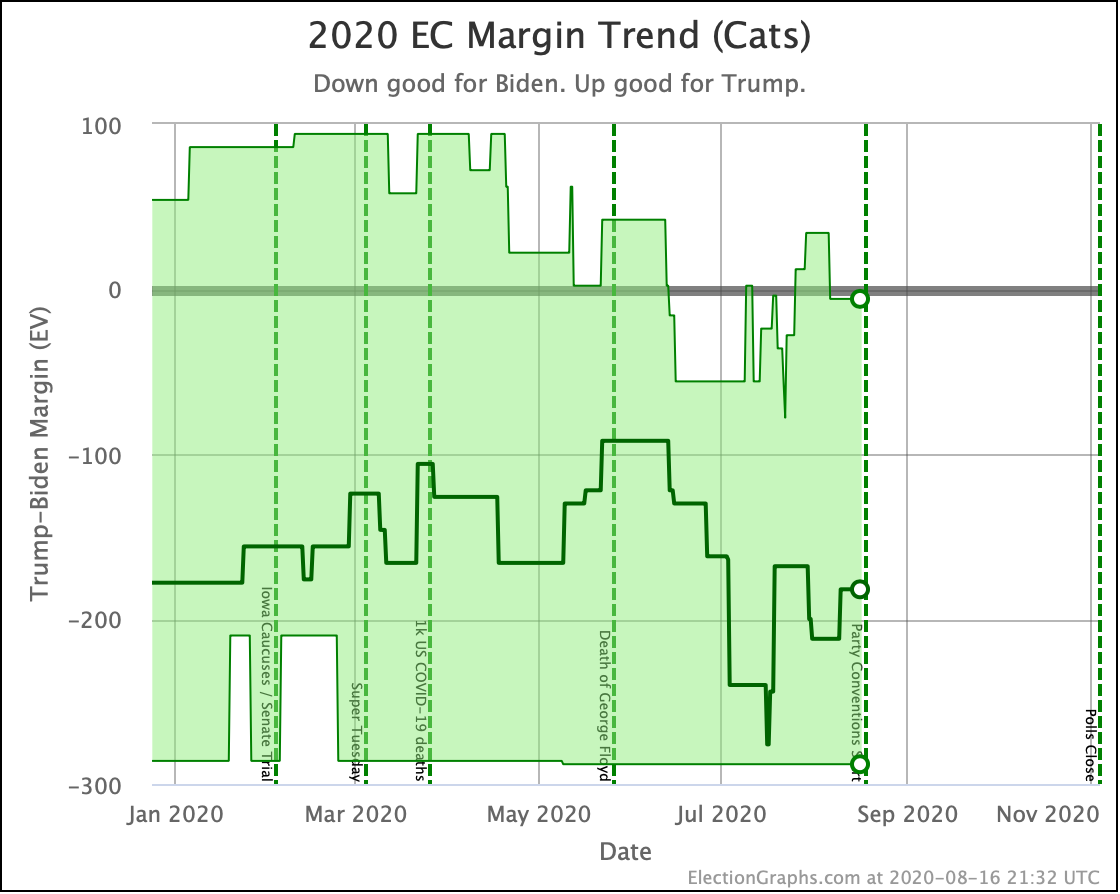
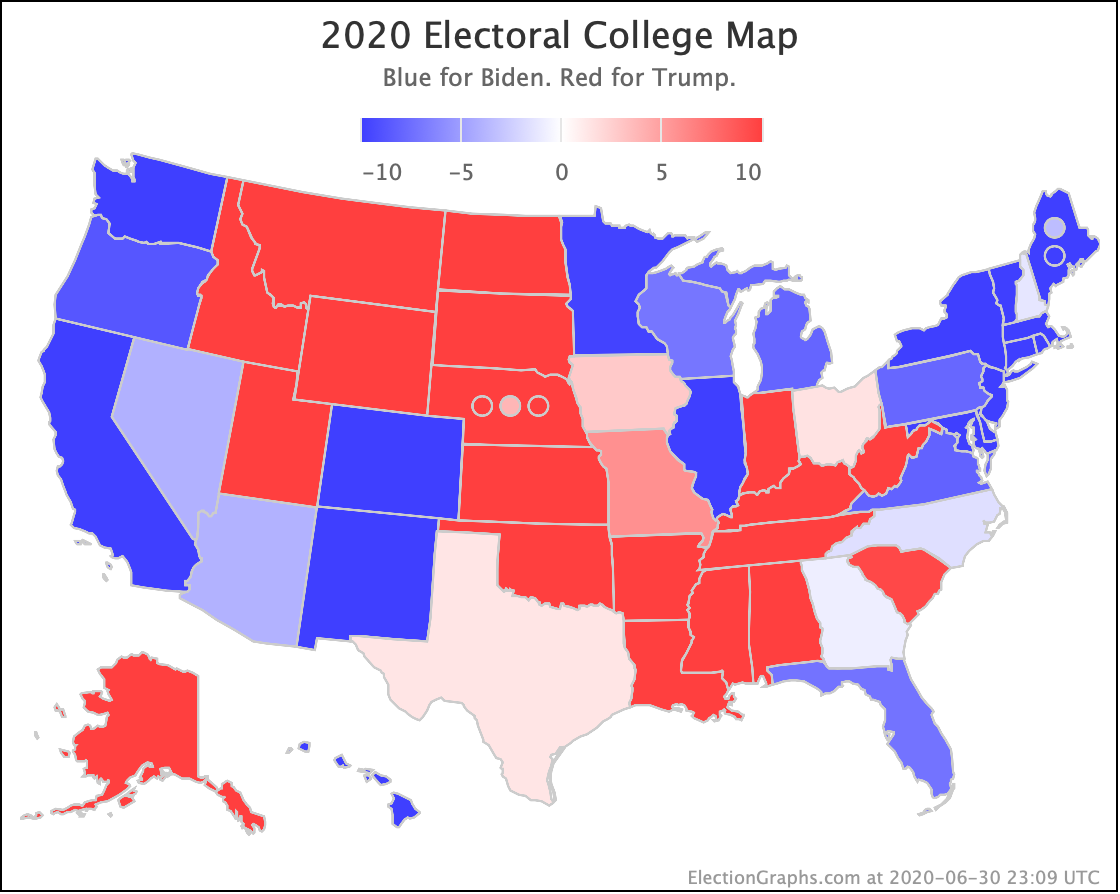
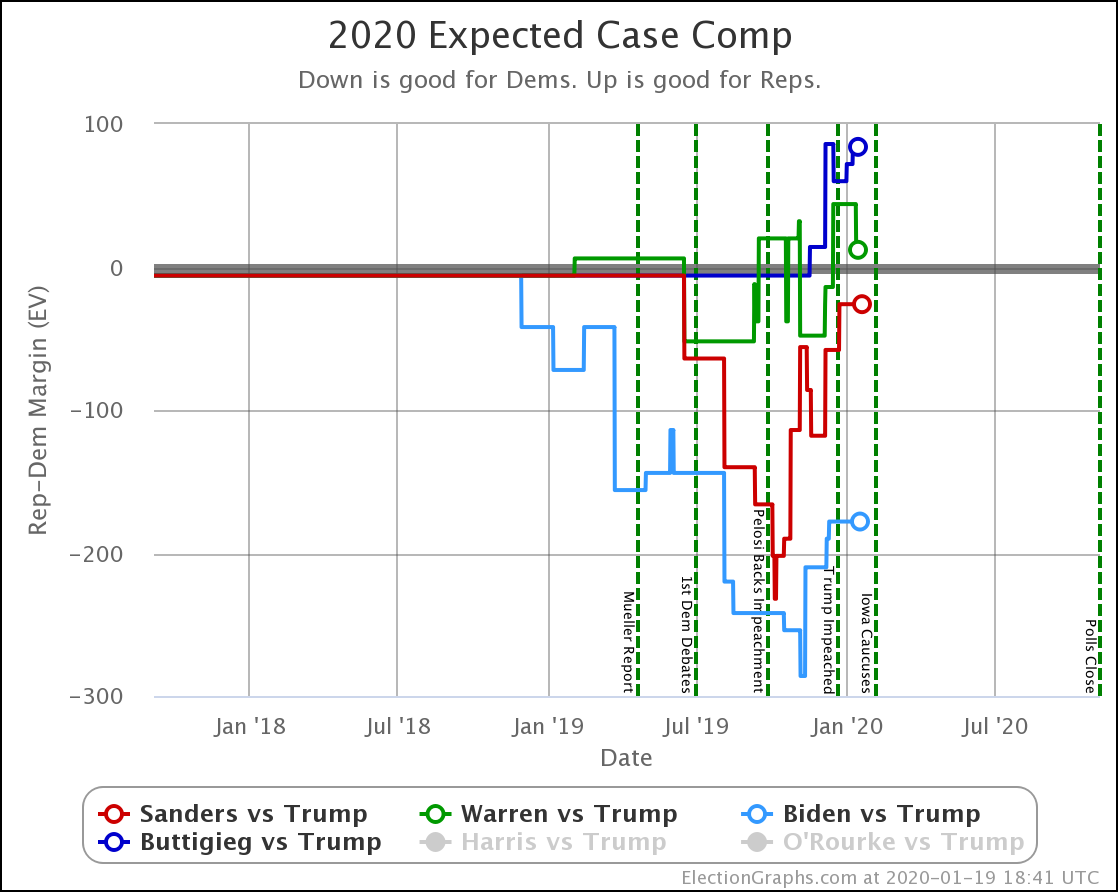
The change in the expected case and in Trump's best case can be seen in the chart above.
Before we look at the probabilistic views, here is a quick no-commentary rundown of all of the other close states (and congressional districts that give electoral votes):
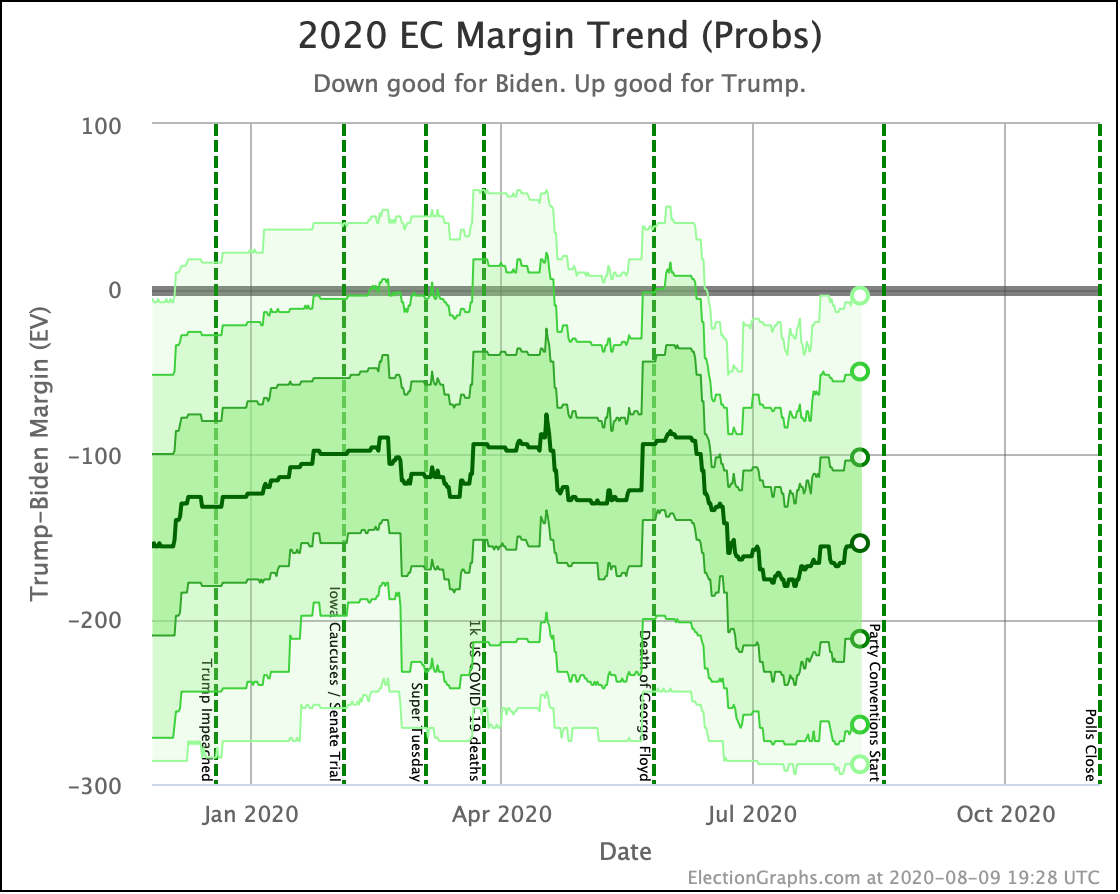
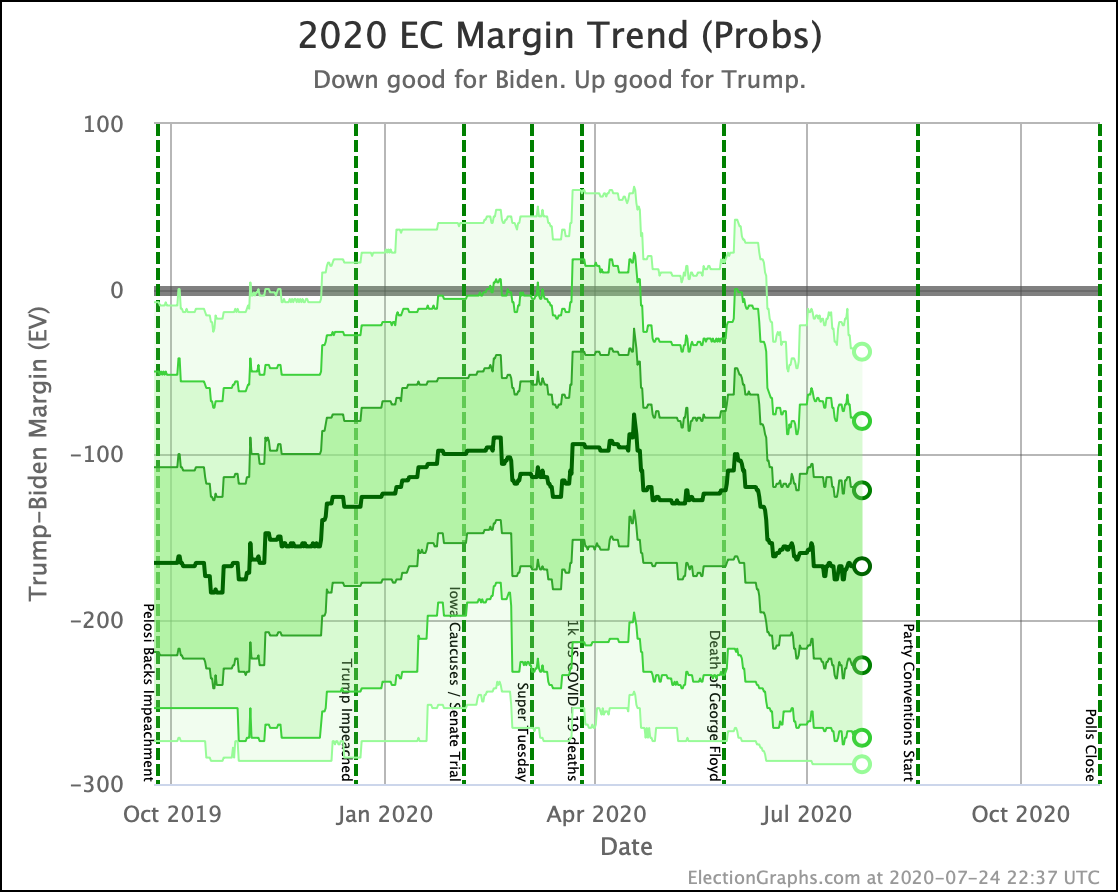
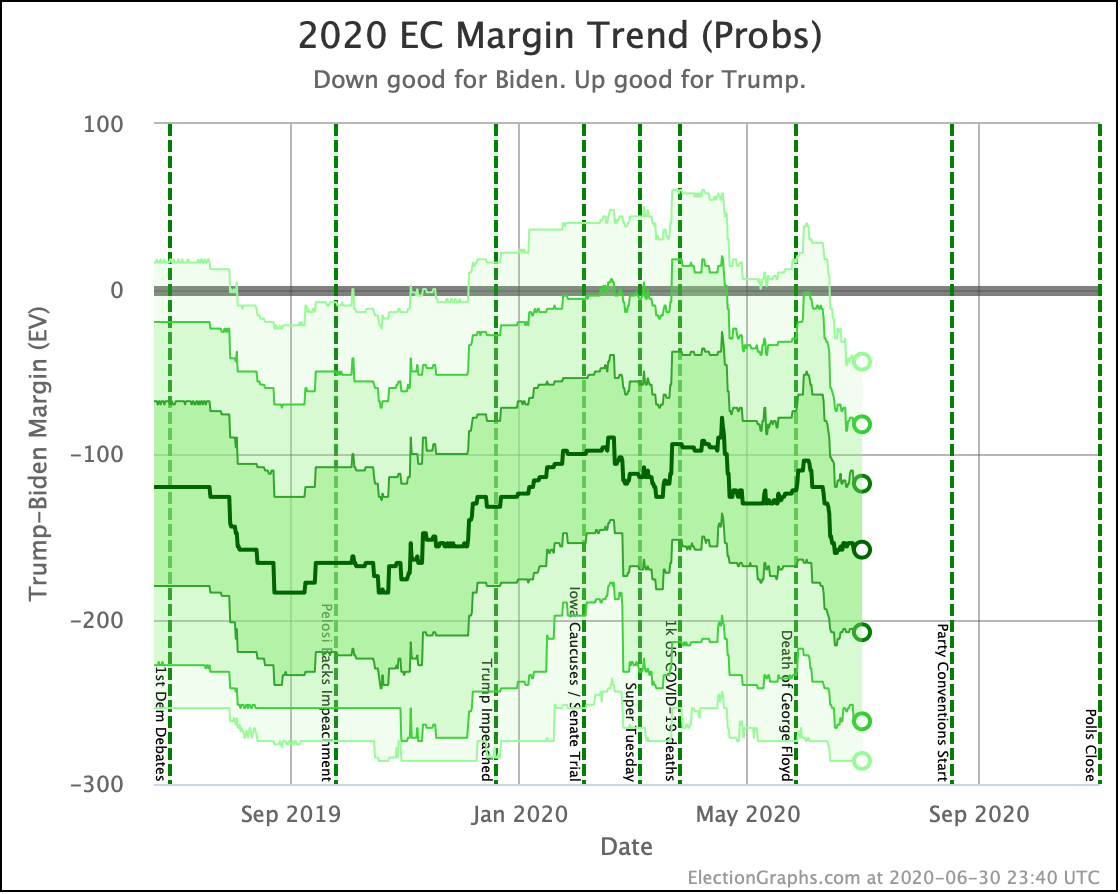
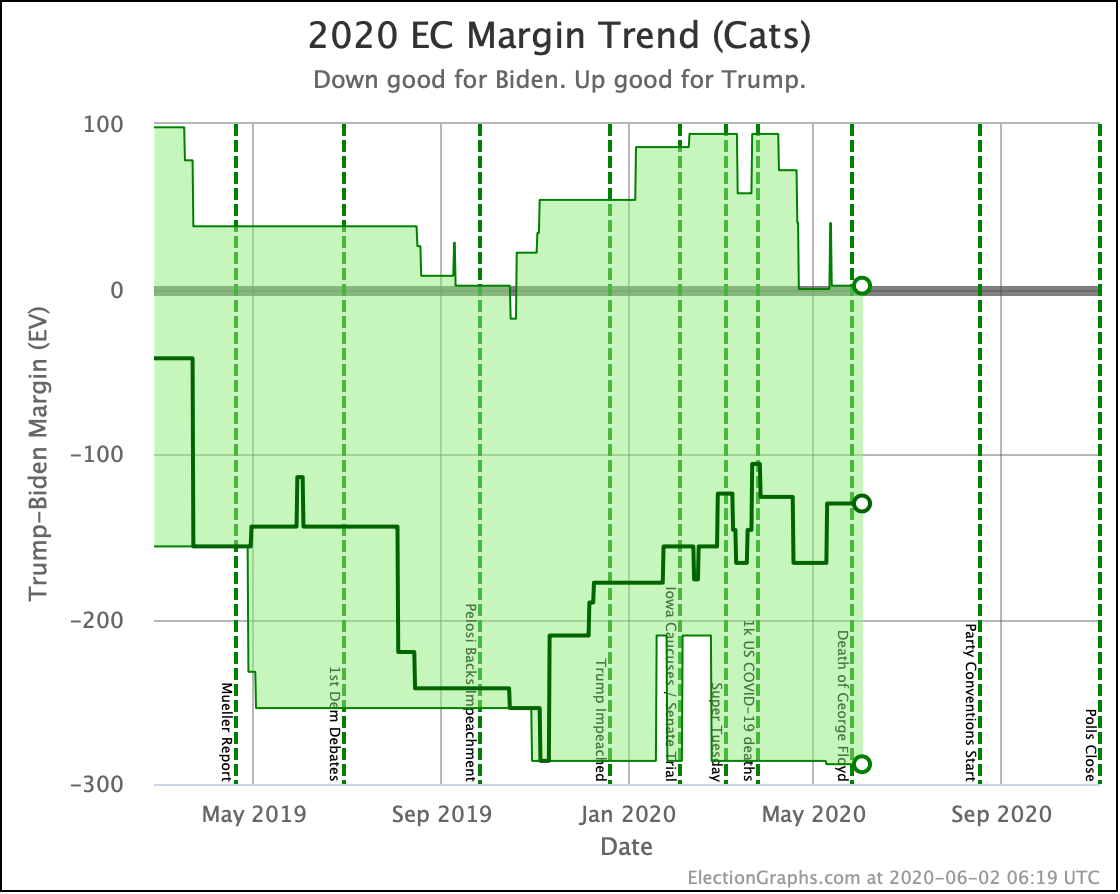
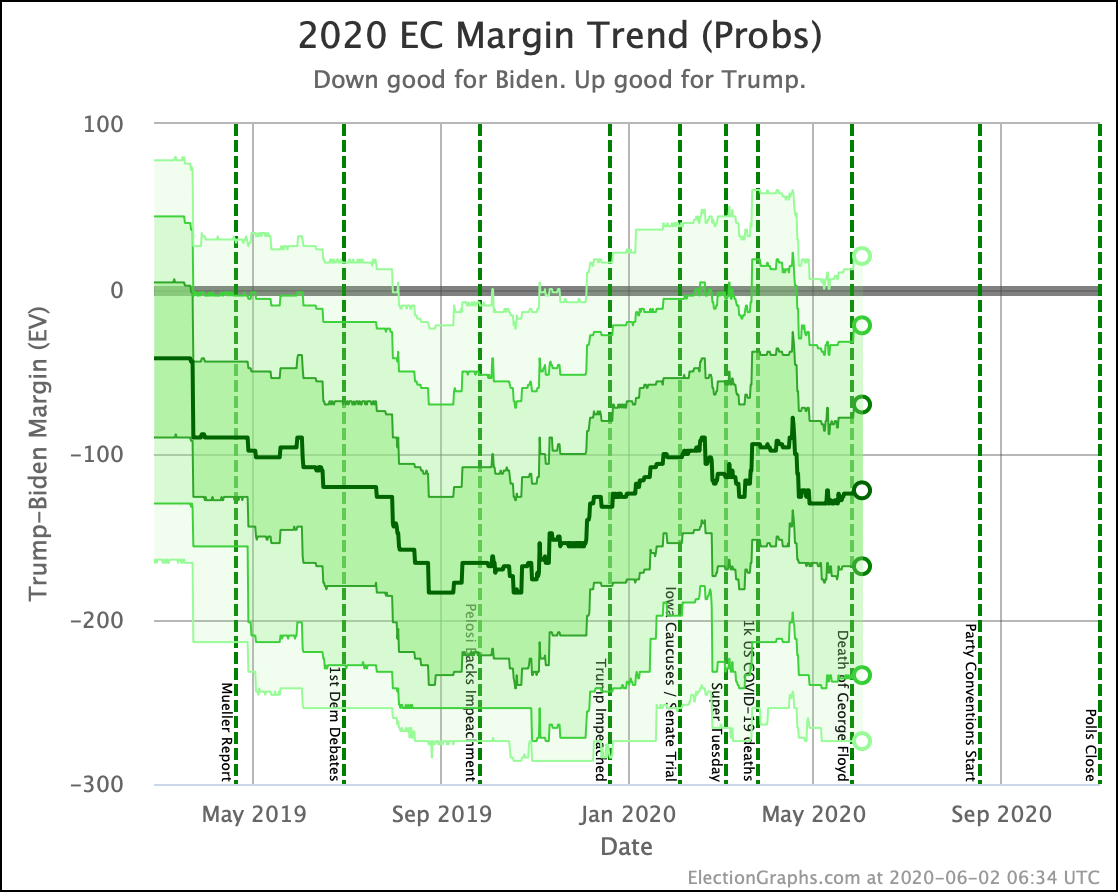
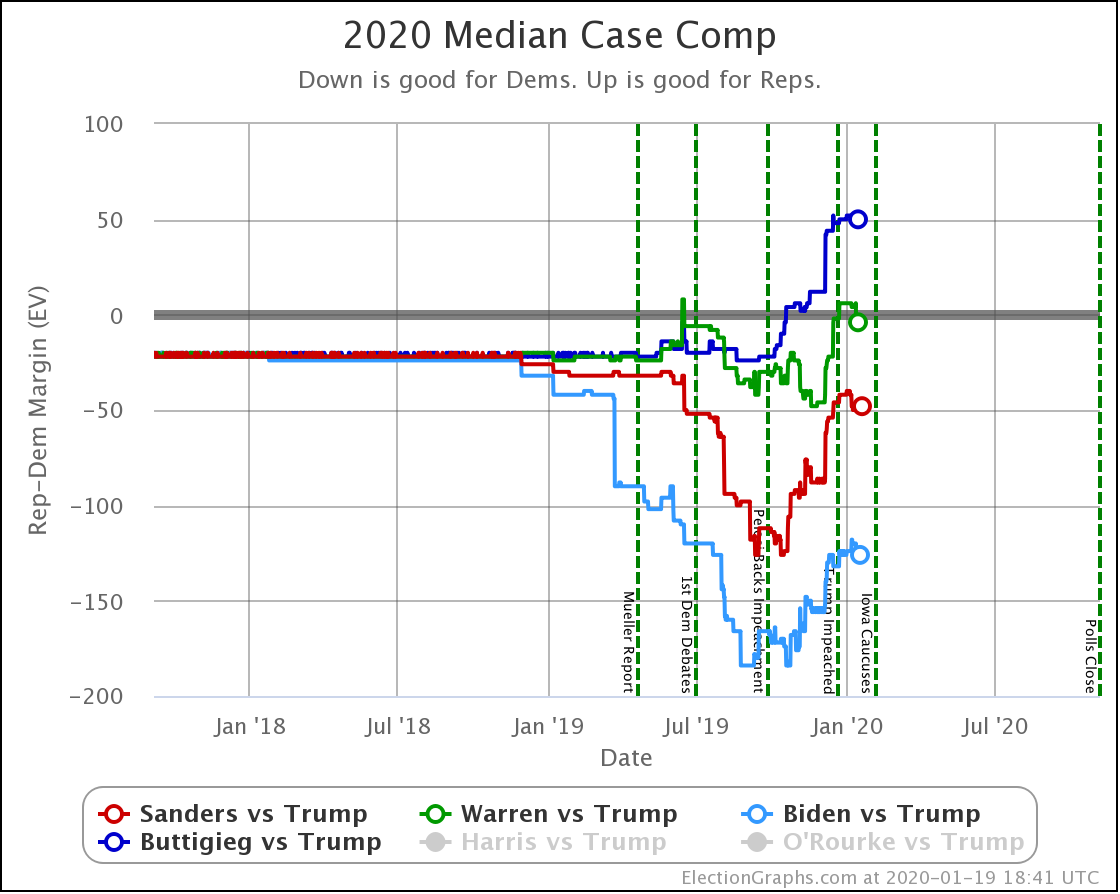
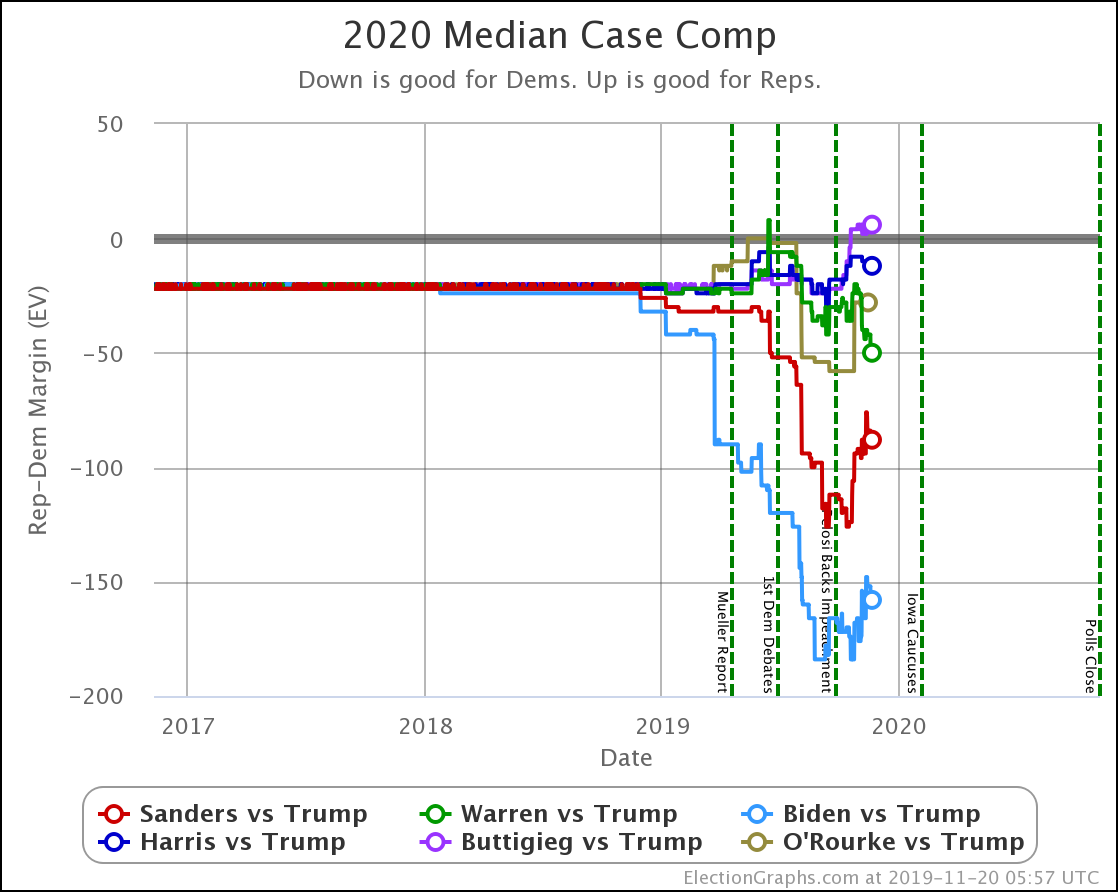
Putting all of this together into our probabilistic model, you get this trend:
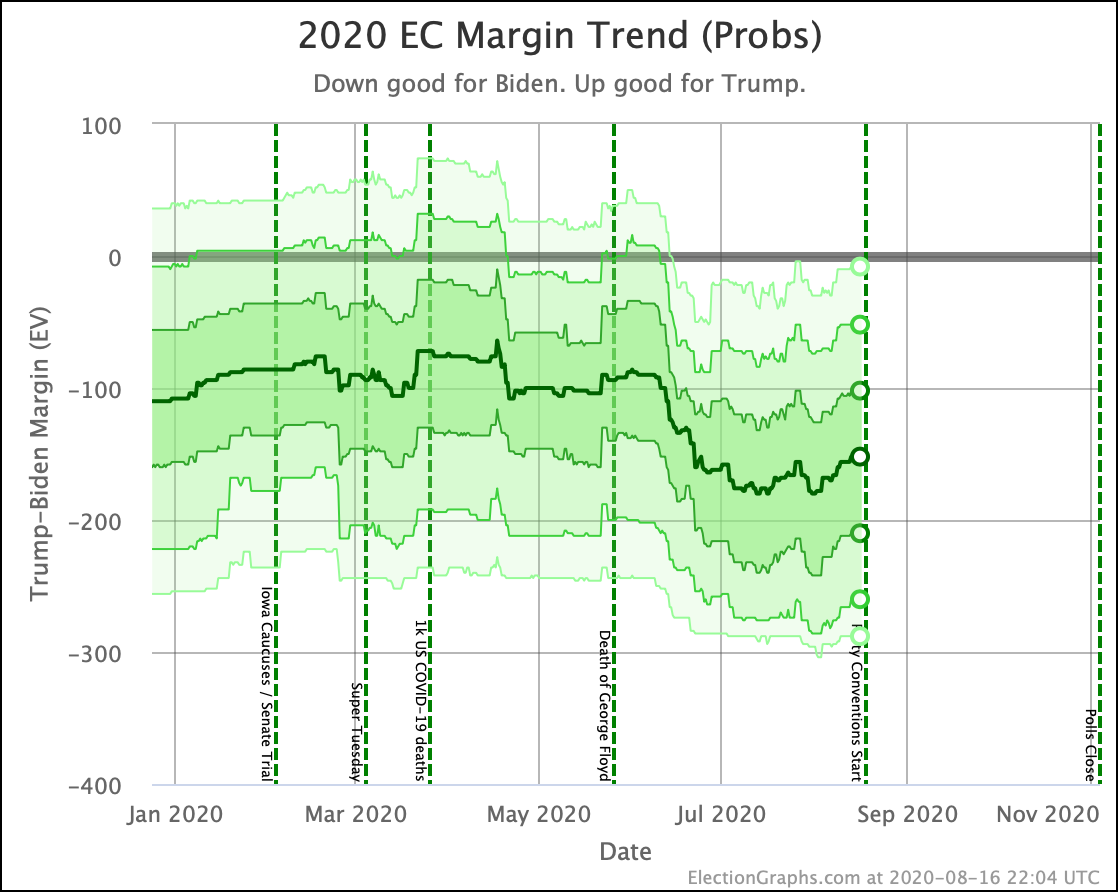
Looking at the center median line, where half the simulated election results were better for Biden, and half were better for Trump, Biden's most recent peak was a 180 electoral vote margin on July 31st. Since then he has slipped down to a 152 electoral vote margin. So the recent movement has been against Biden.
Maybe this trend will continue. Or maybe things will bounce back in Biden's direction again. In this view, it now looks like things have been staying within a fairly narrow band since the end of June. But we're now at the upper end of that band. Trump may break out.
Conventional wisdom is that there are "convention bounces". And we are about to enter two weeks of political conventions. But this year the conventions are essentially back to back. So if there are such bounces, the Trump bounce may just cancel out the Biden bounce too quickly to even be measured reliably in state-level views such as we have on Election Graphs.
The conventions do however tend to be the point at which both campaigns go into overdrive and non-political folks finally start paying attention to the race. So it would not be surprising to have significant events that move the needle.
As usual, we'll just have to wait and see.
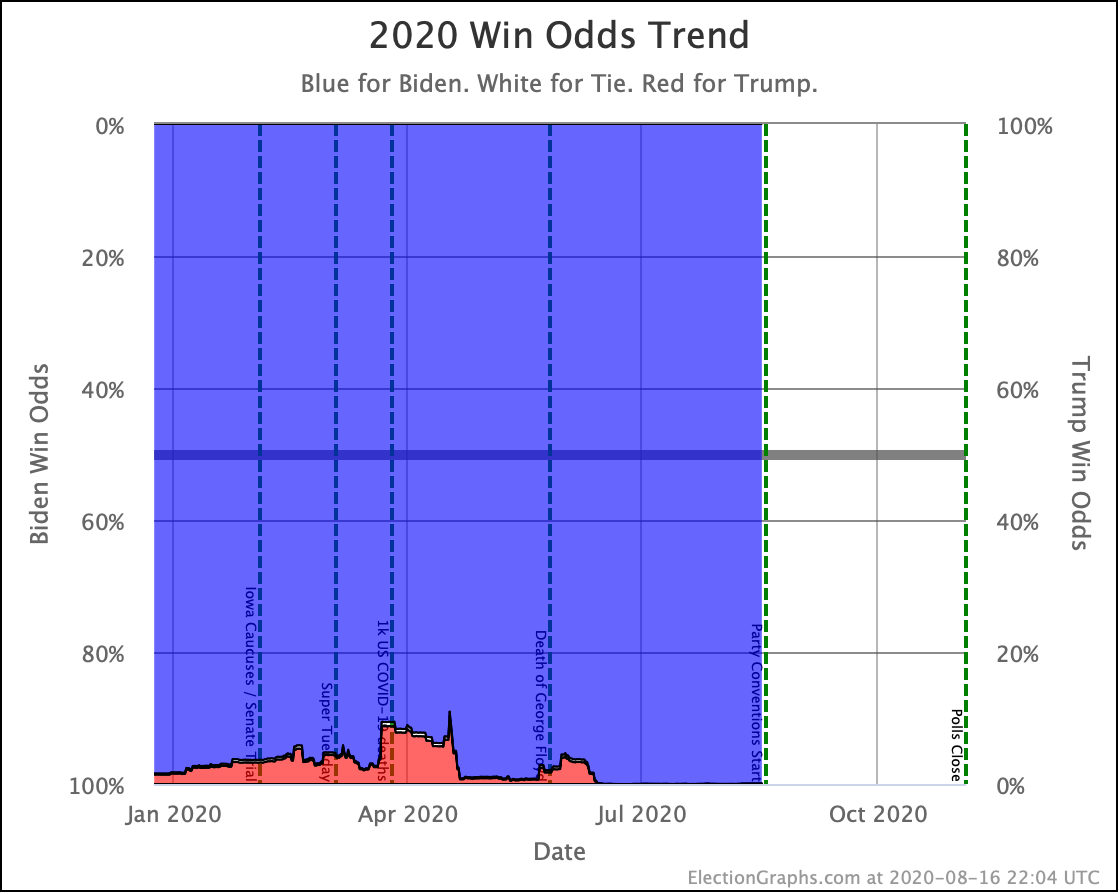
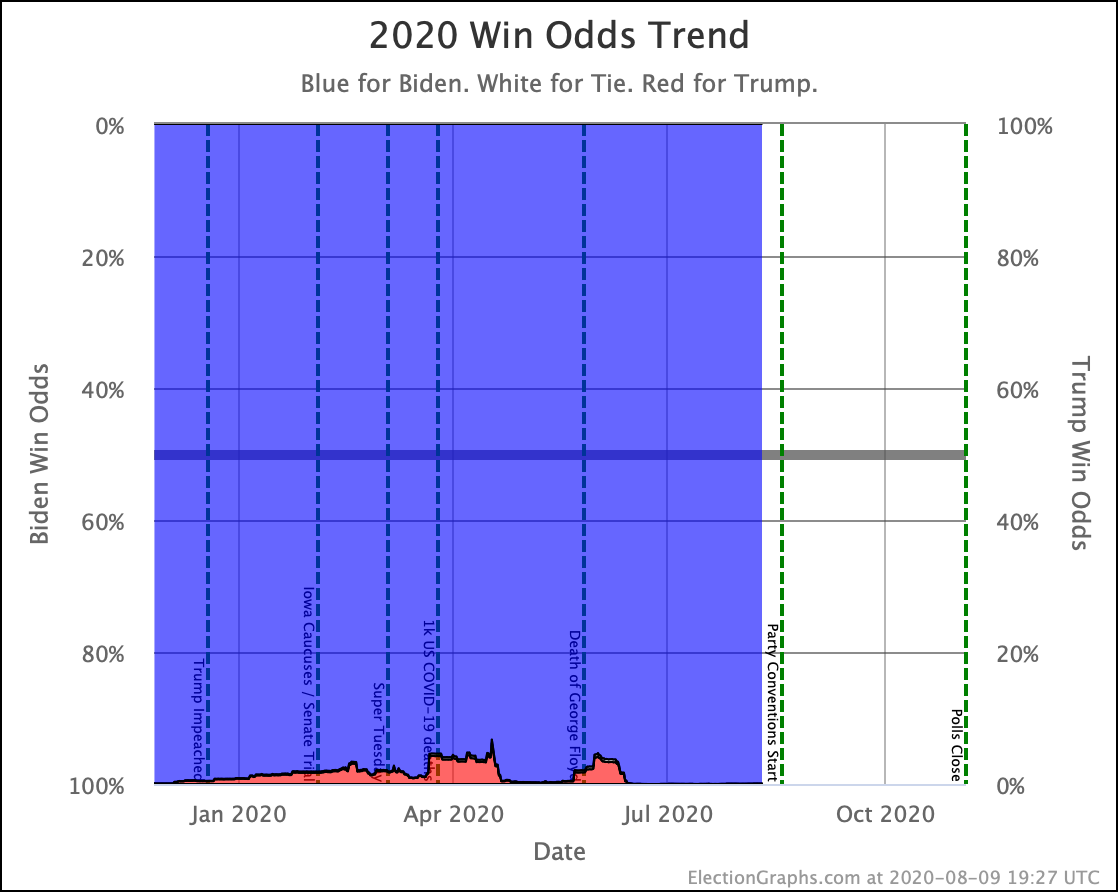
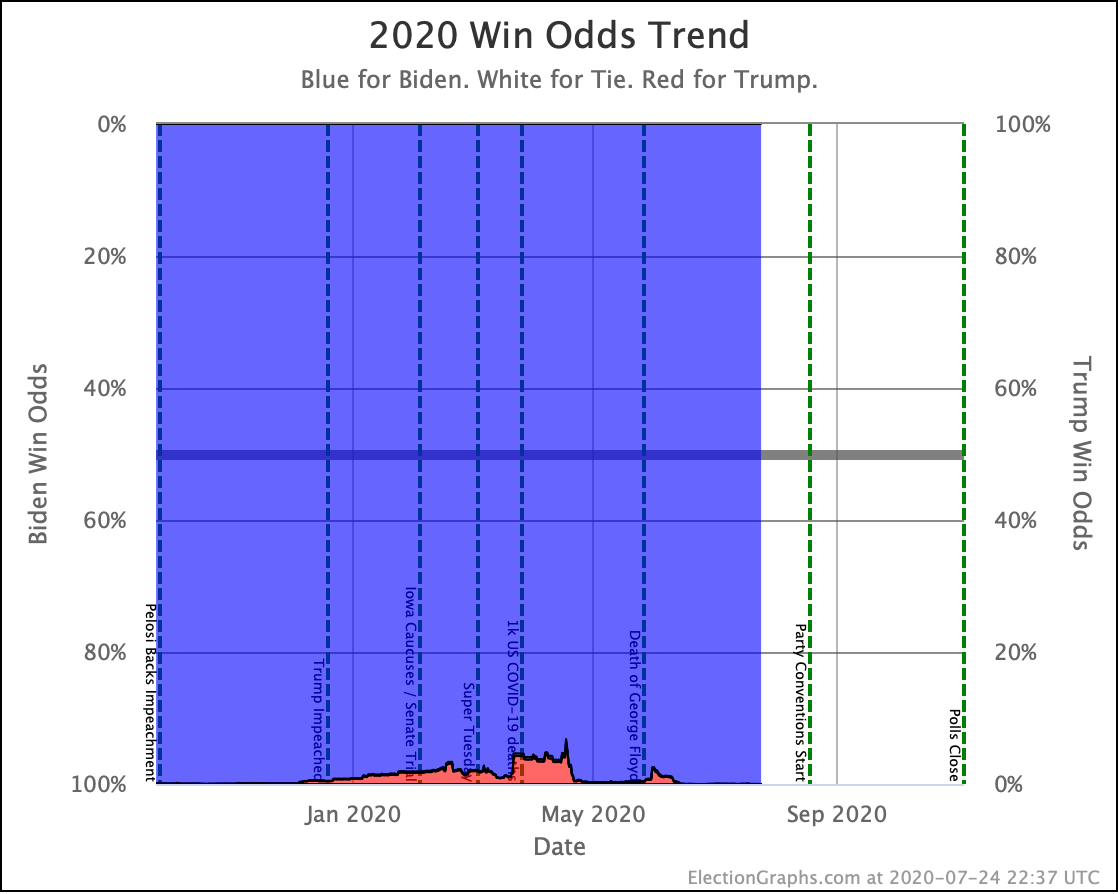
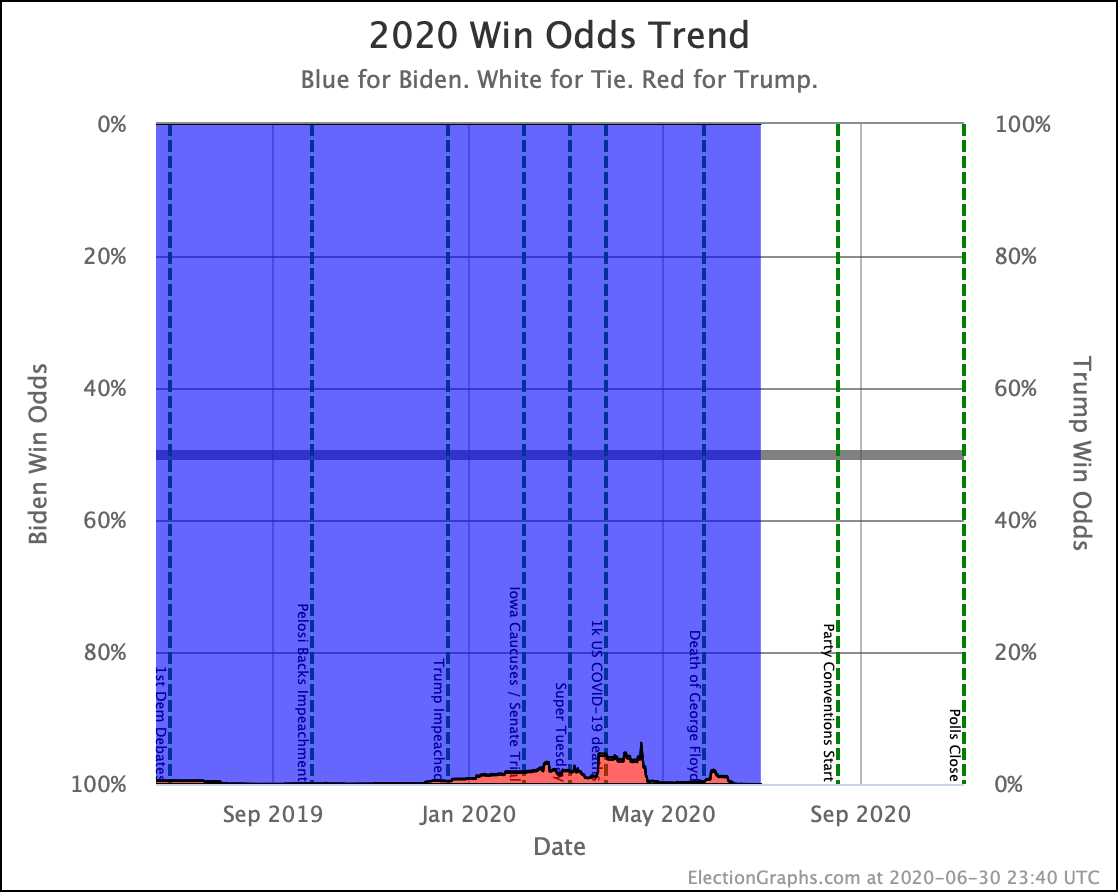
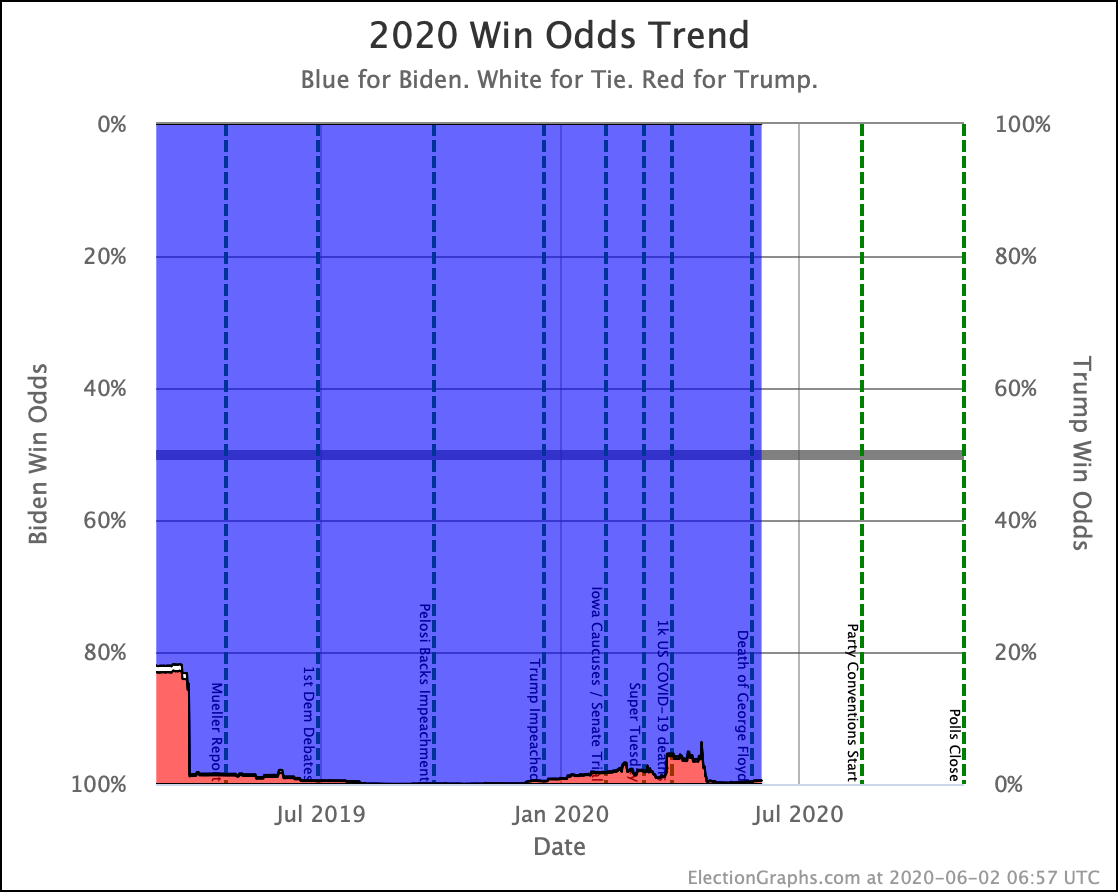
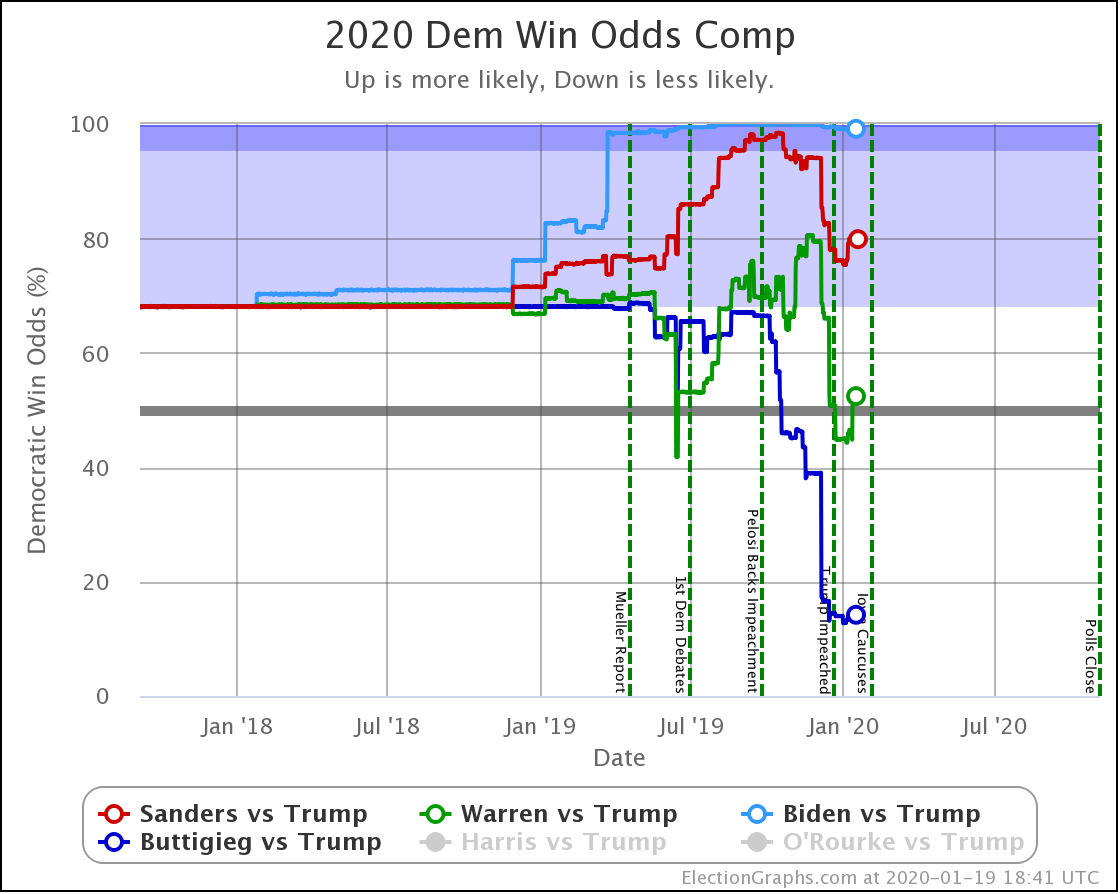
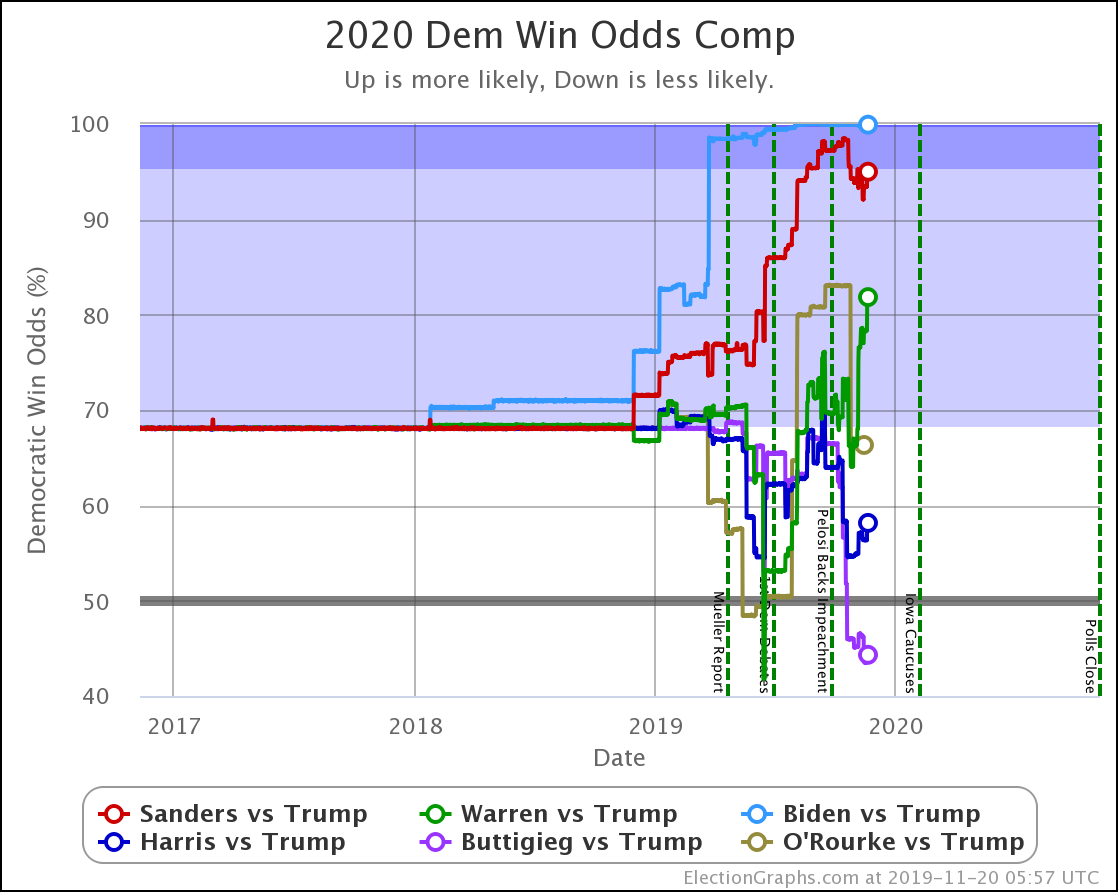
My simulations still have Biden at a 99.9% chance to win. This graph has been quite boring for some time now because Biden has the blue pegged up against the 100% line.
As always, the important caveat that this is if the election was today, which it is not.
There is time for this to change. So how secure is the Biden lead?
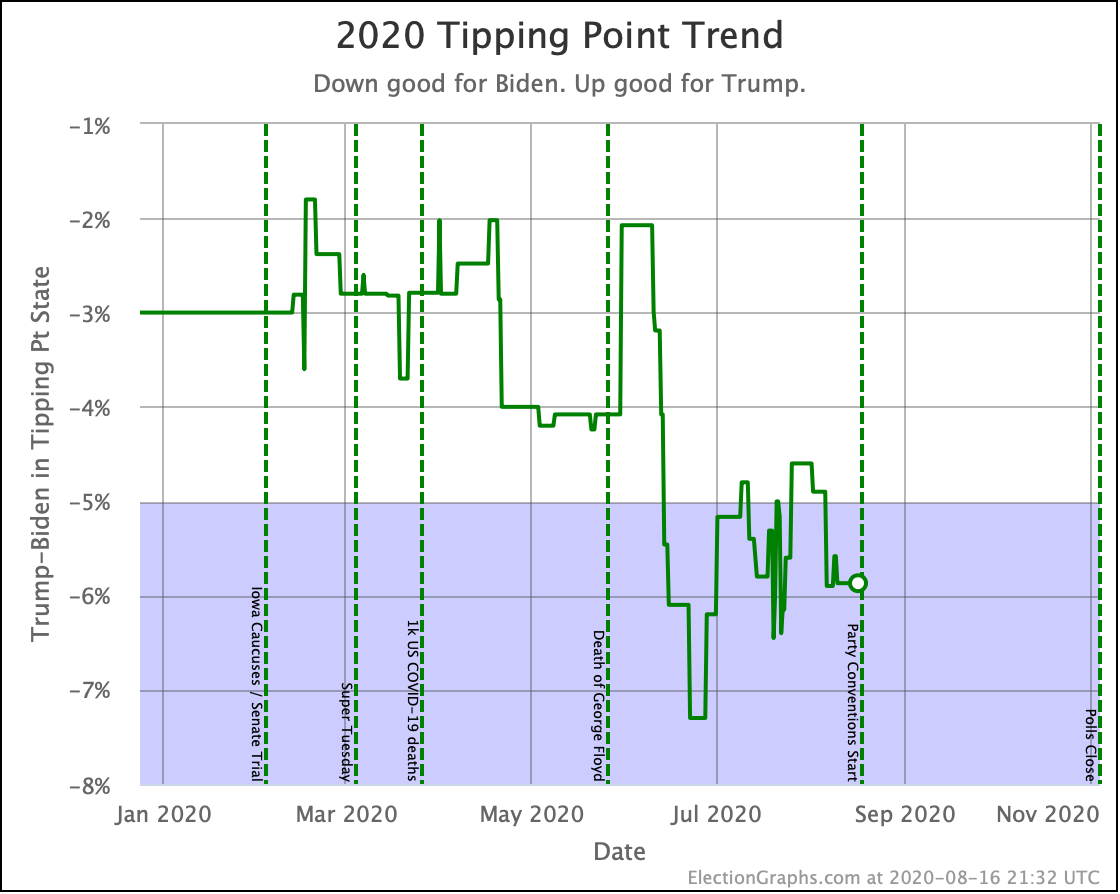
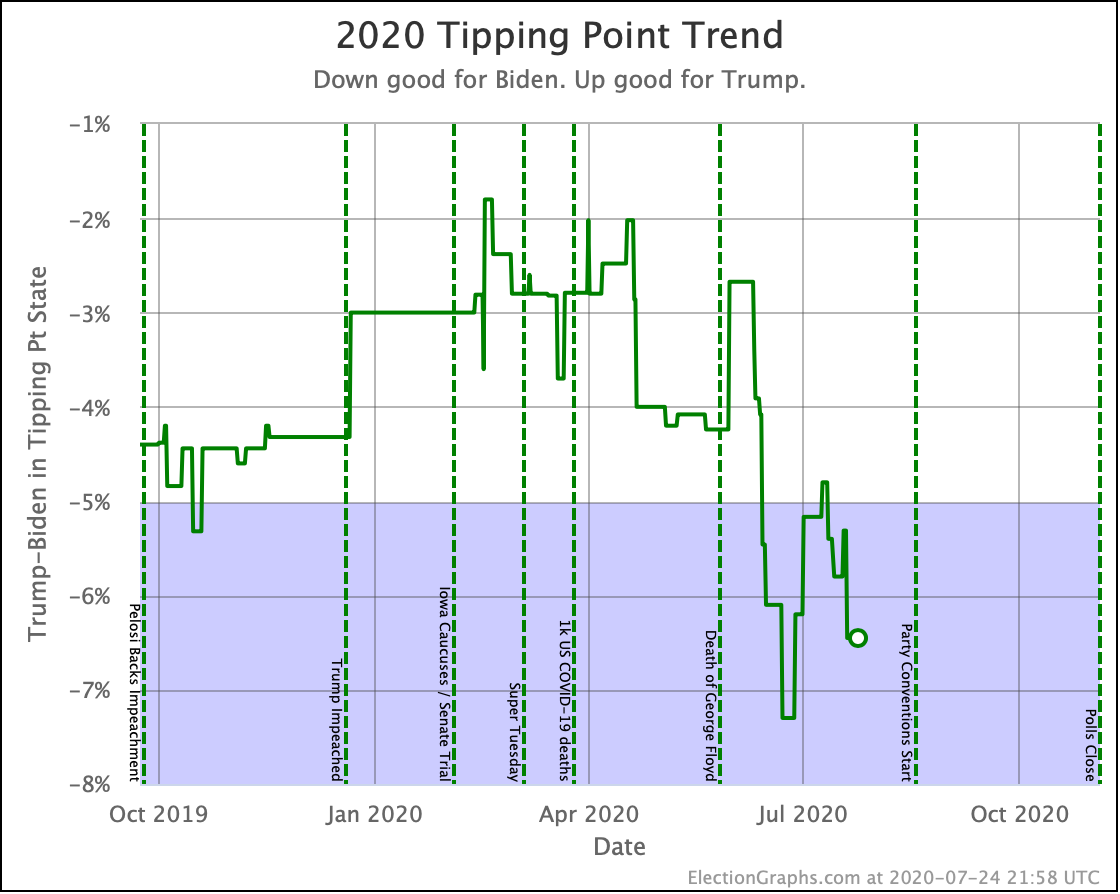
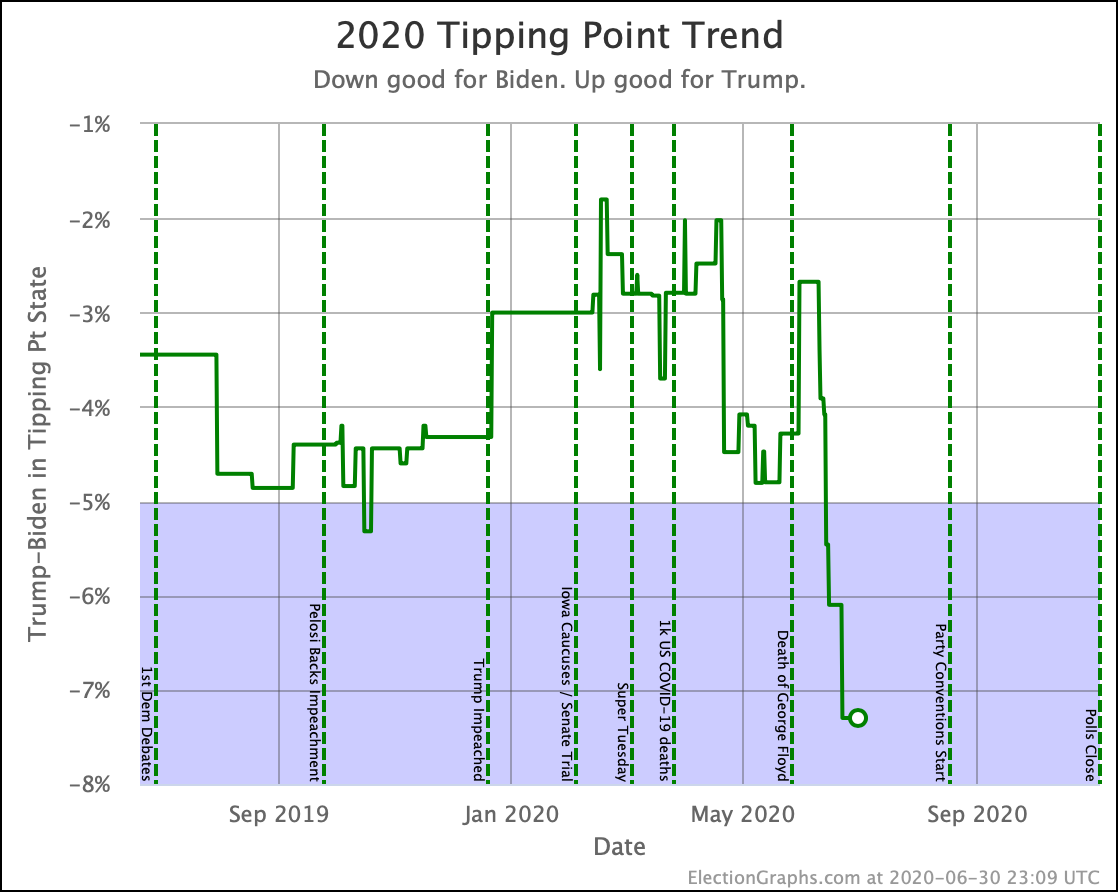
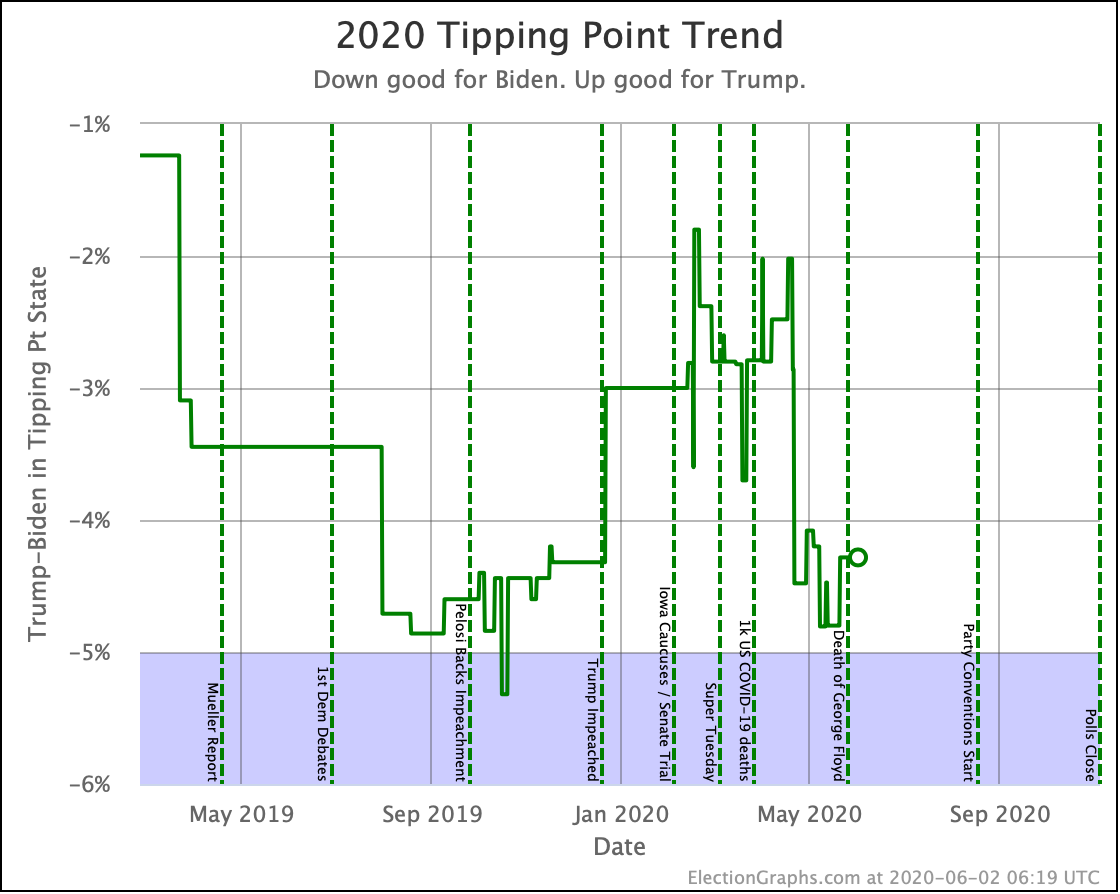
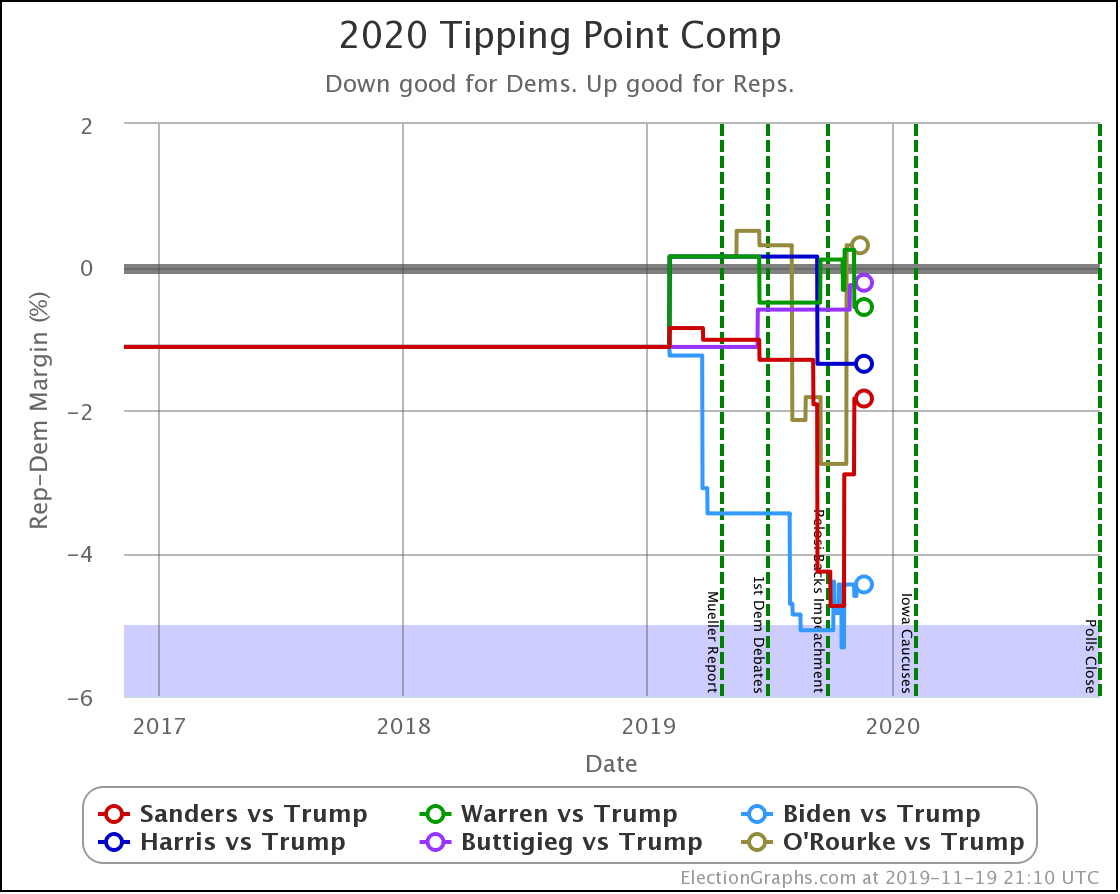
Biden's tipping point lead had dropped down to 4.6%, but it has rebounded to 5.9%. This number basically represents how much polls would have to change nationally to flip the winner if the change was uniform across all states.
By comparison, the RCP average of national polls is currently at a 7.5% Biden lead. So it would take a 7.5% move for Trump to win the popular vote, but only a 5.9% move for Trump to win the electoral college. This implies that the structure of the electoral college is currently giving Trump a 1.6% head start.
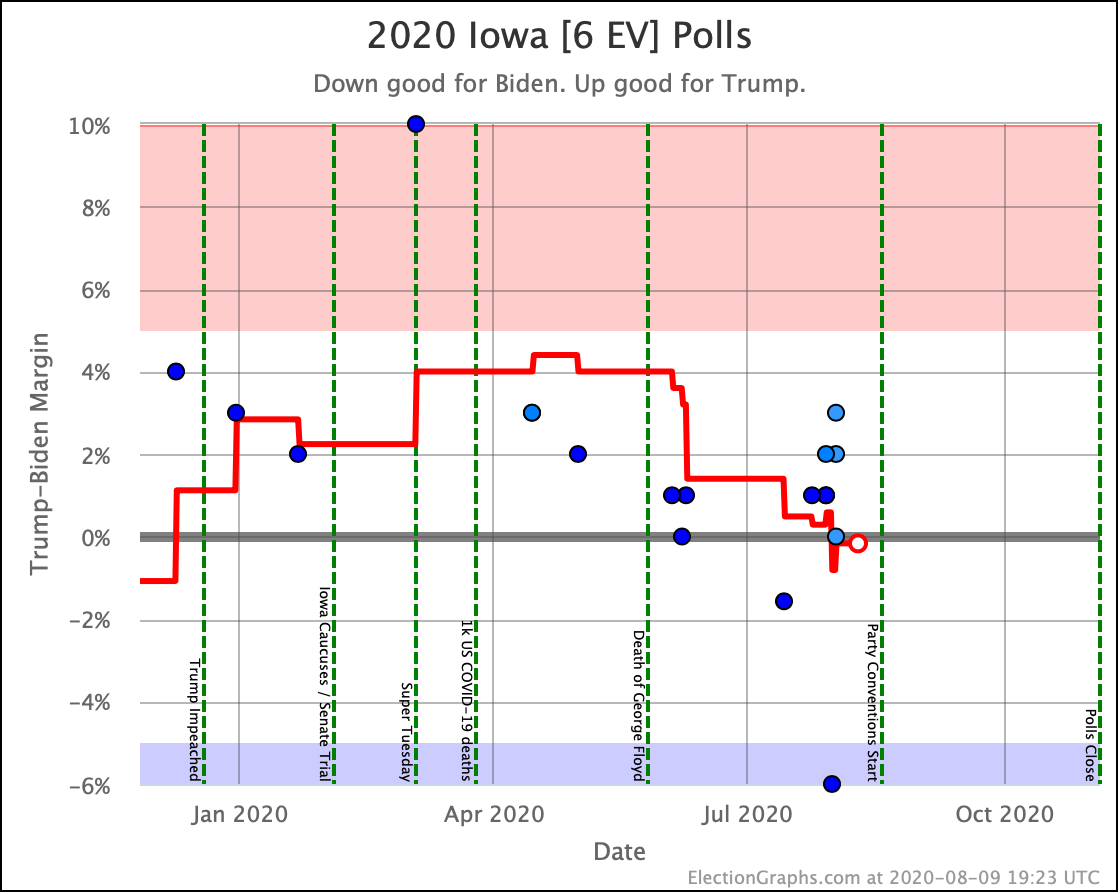
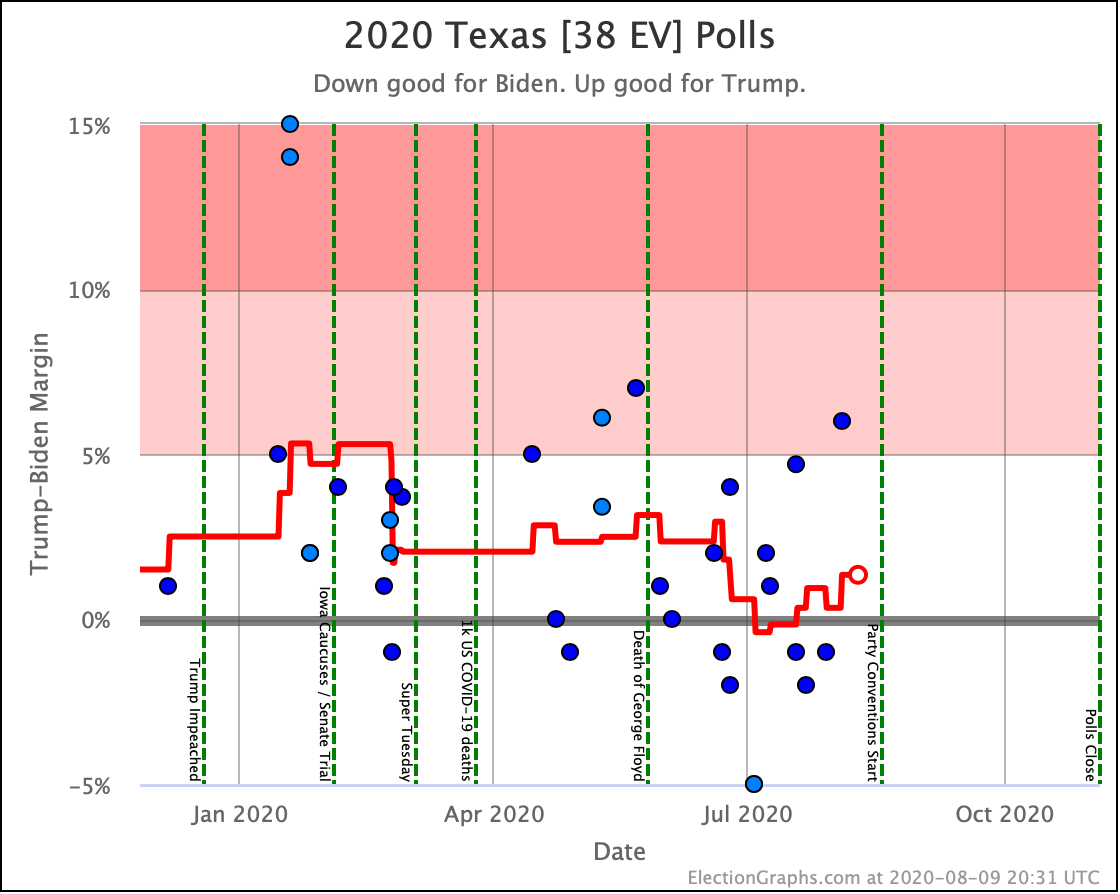
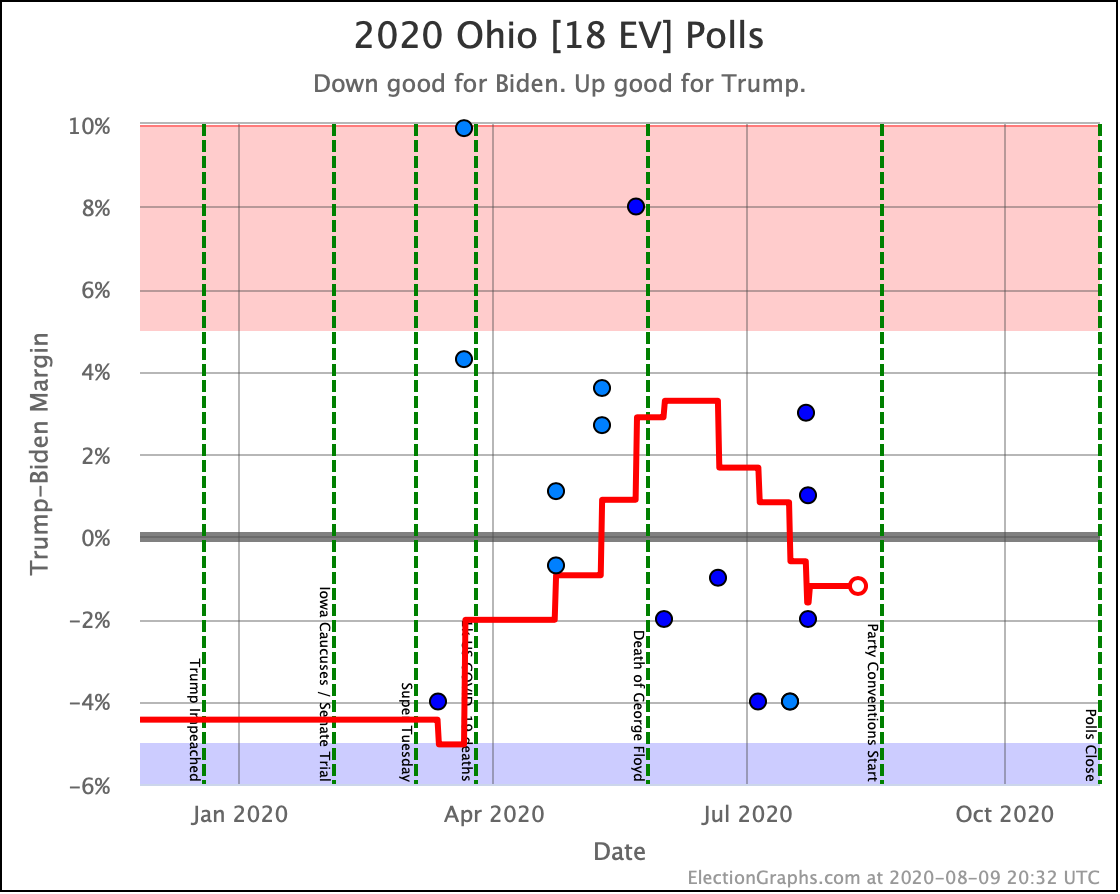
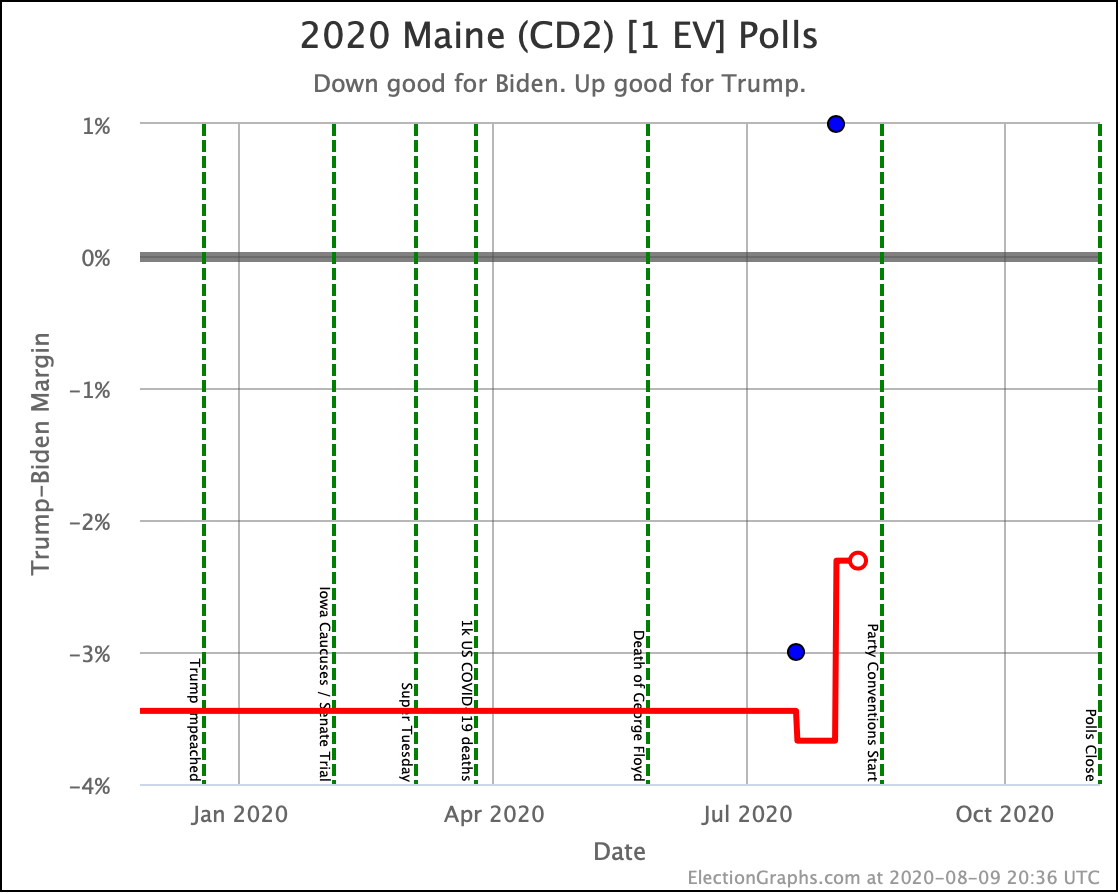
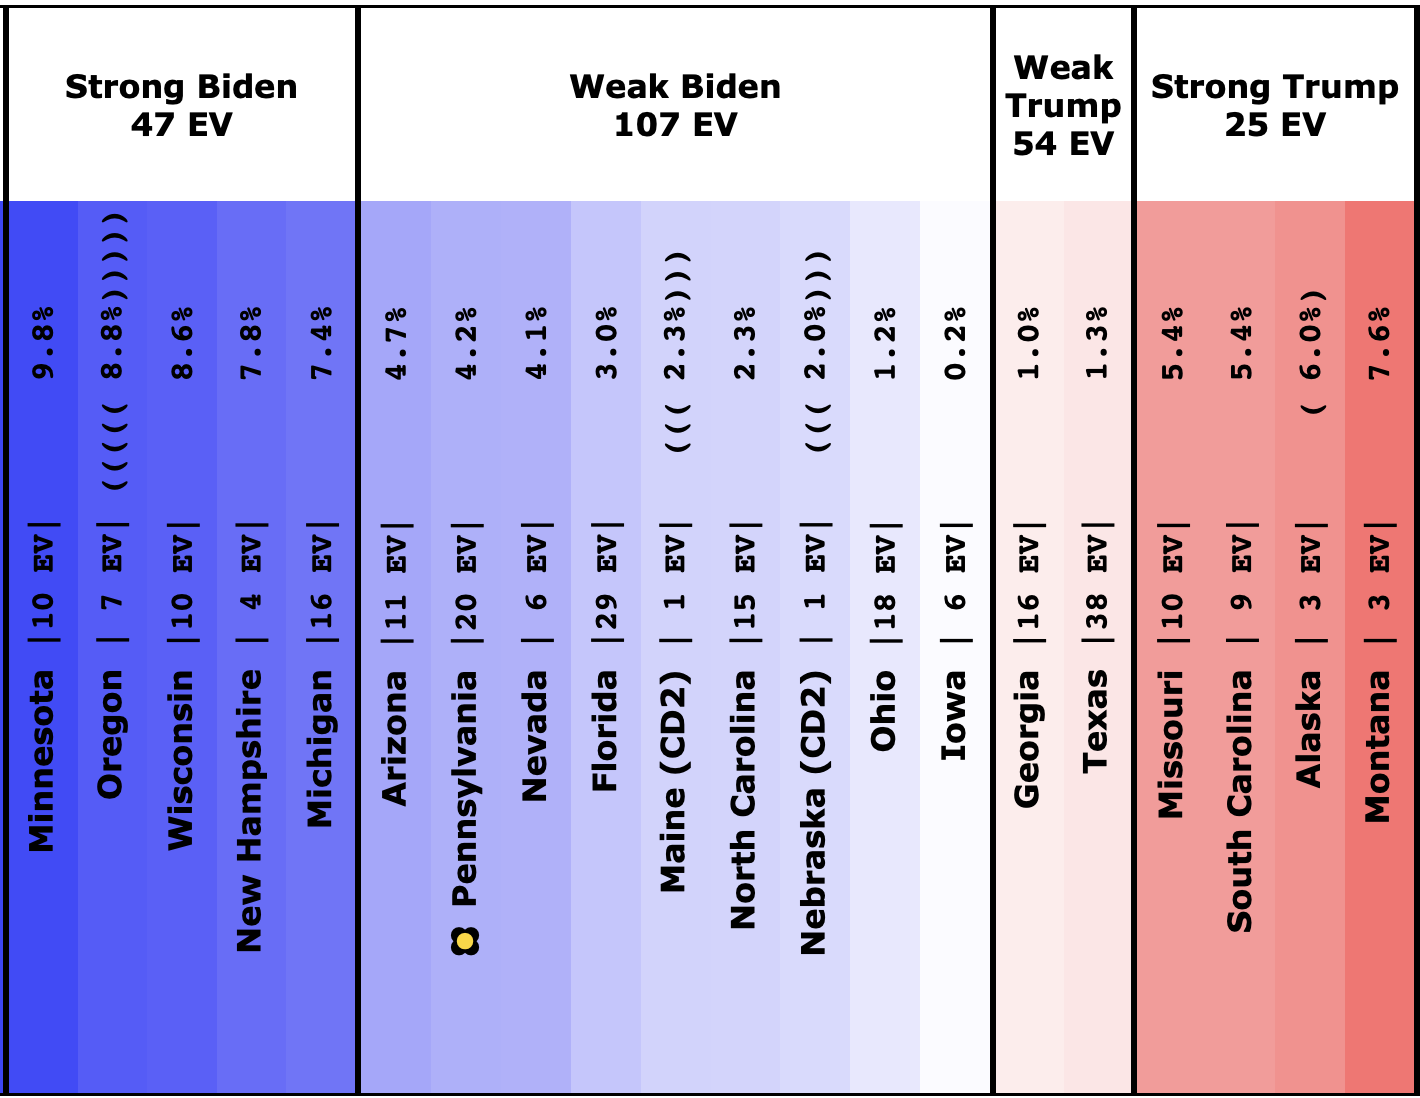
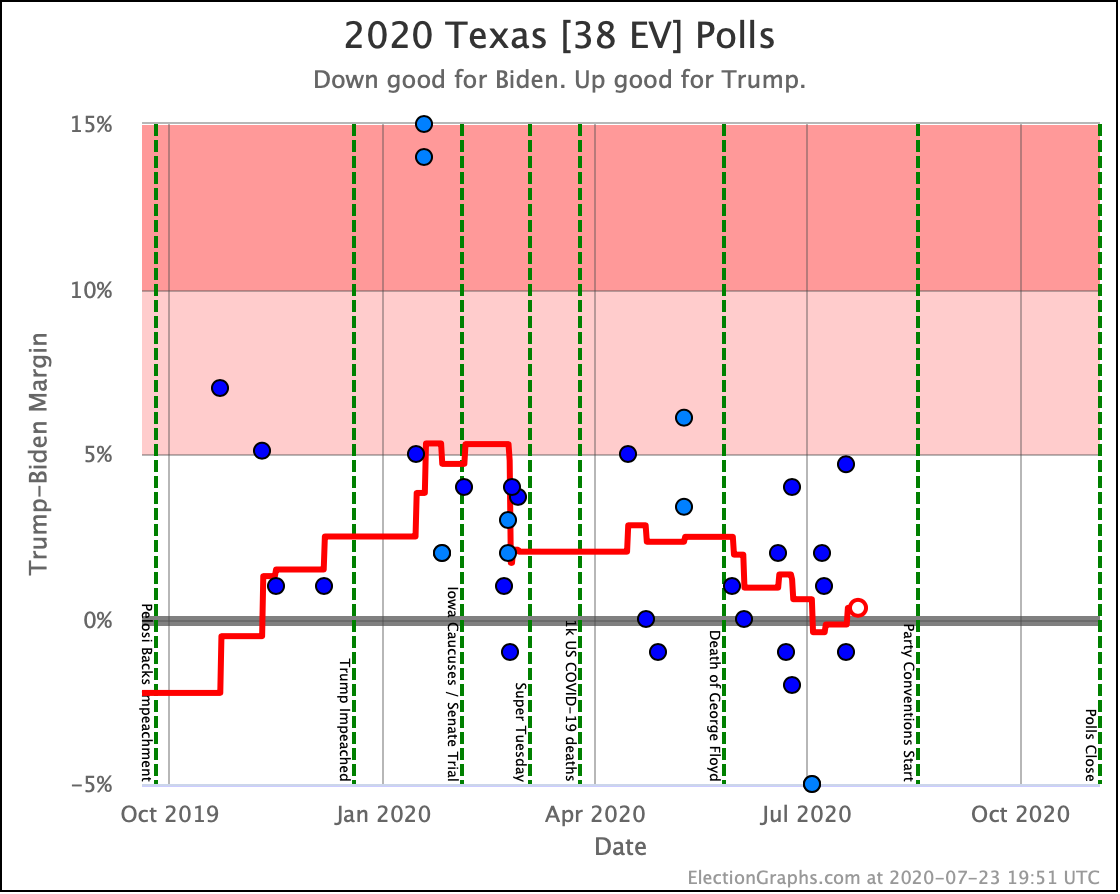
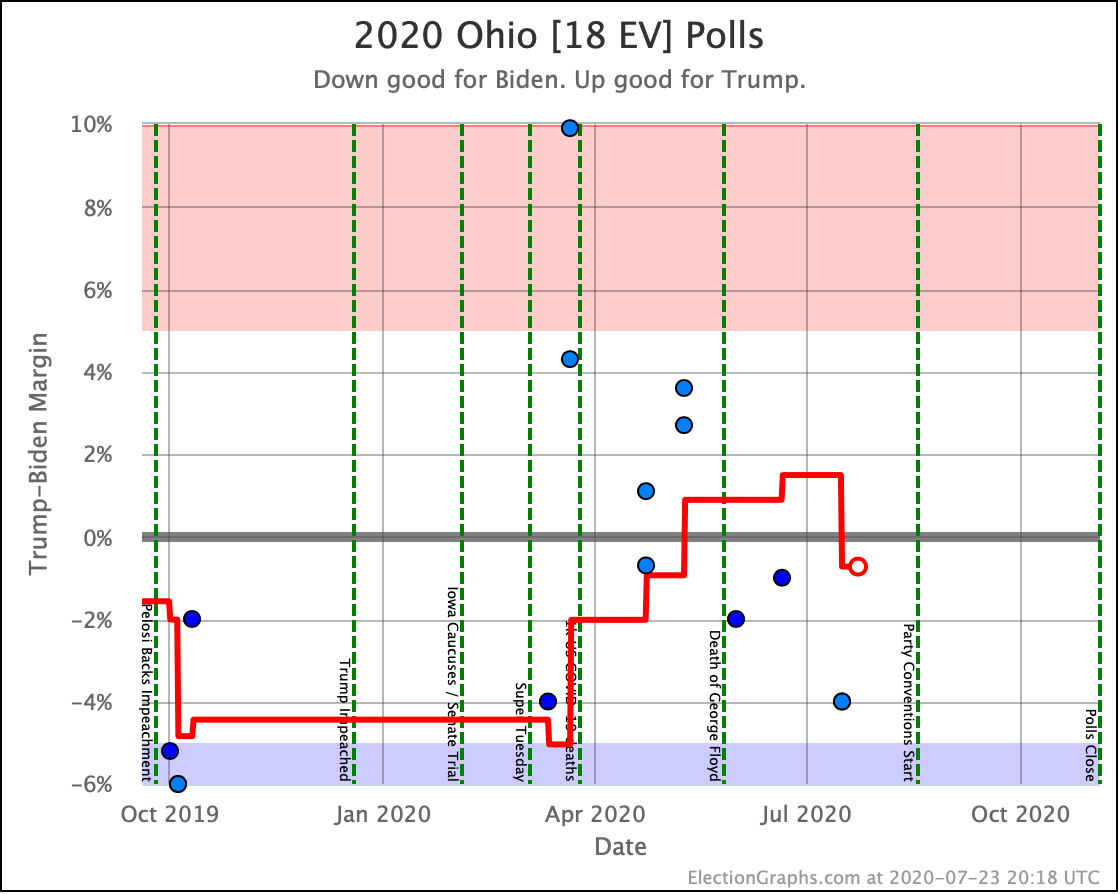
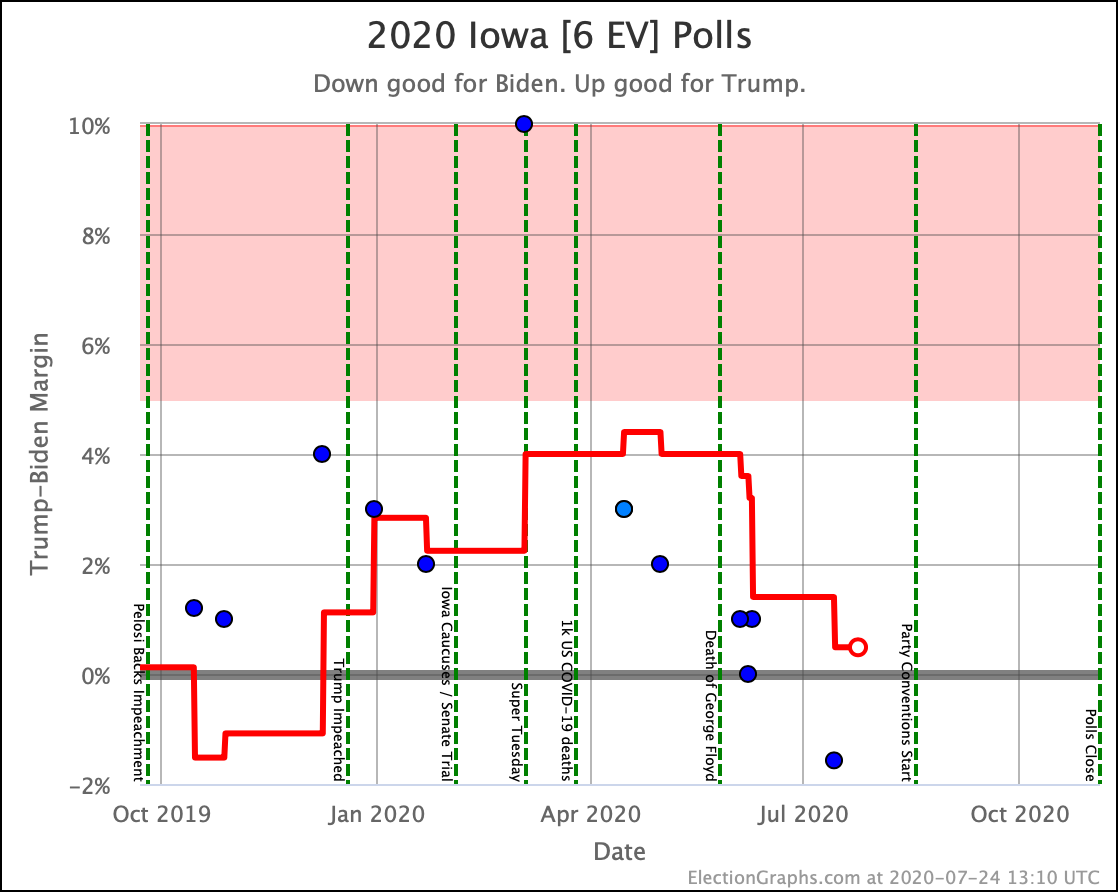
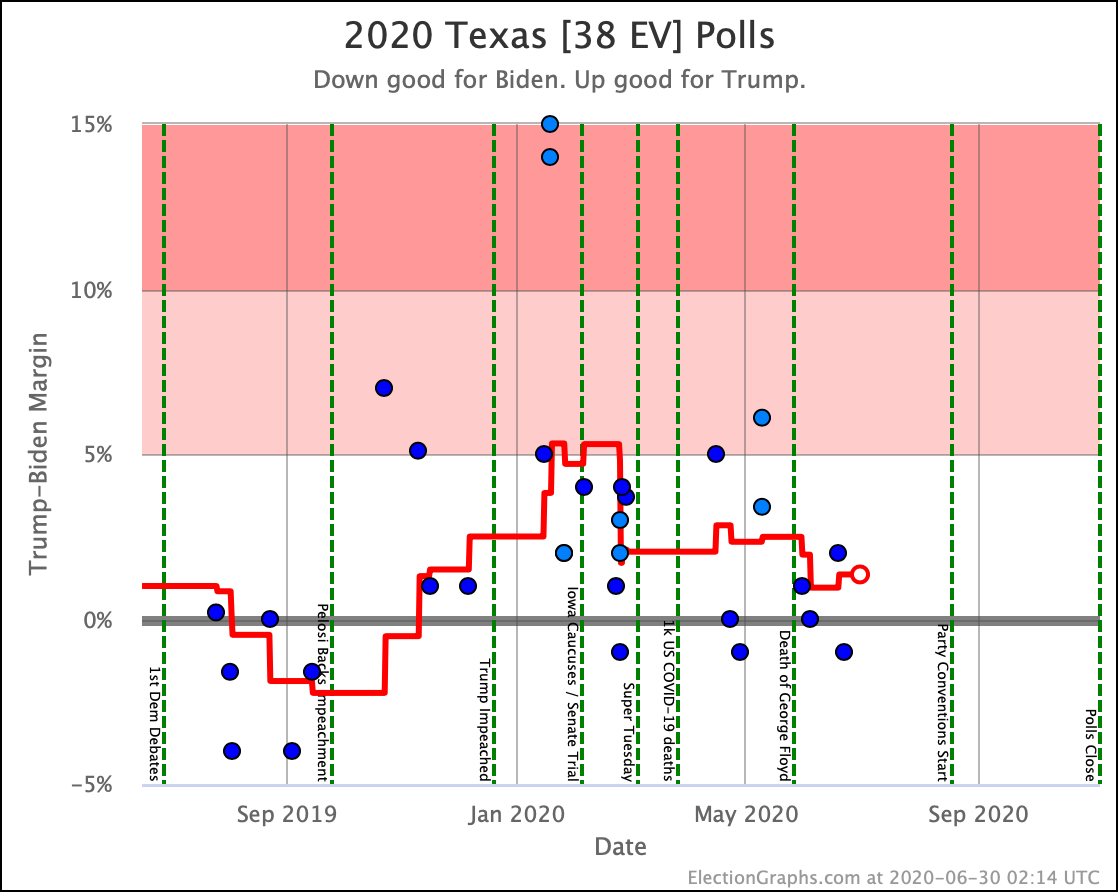
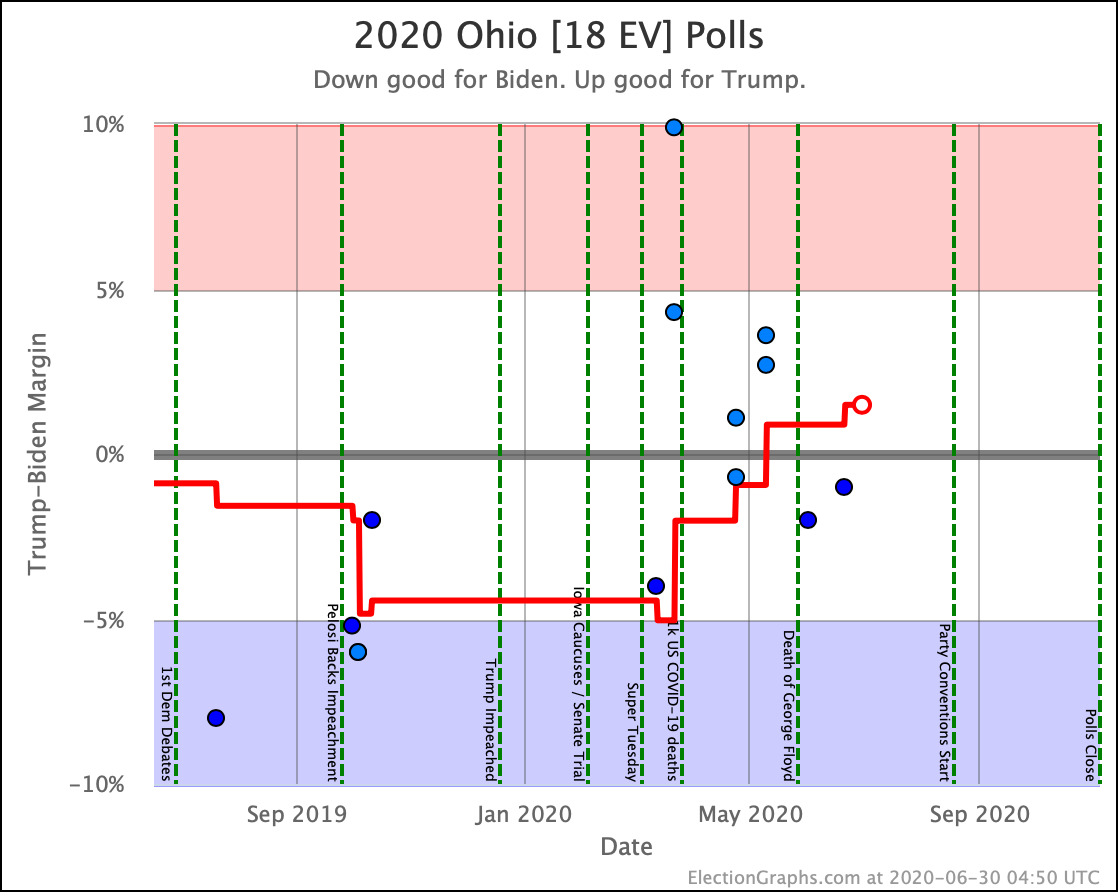
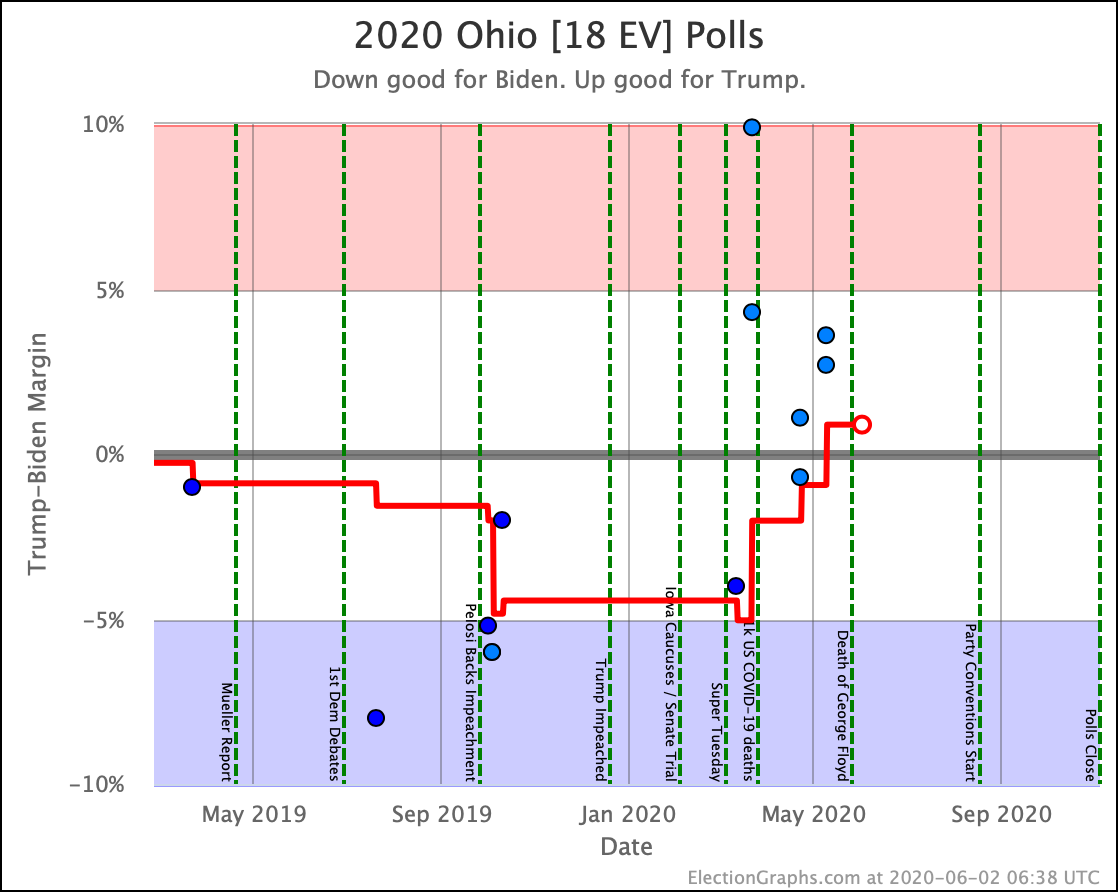
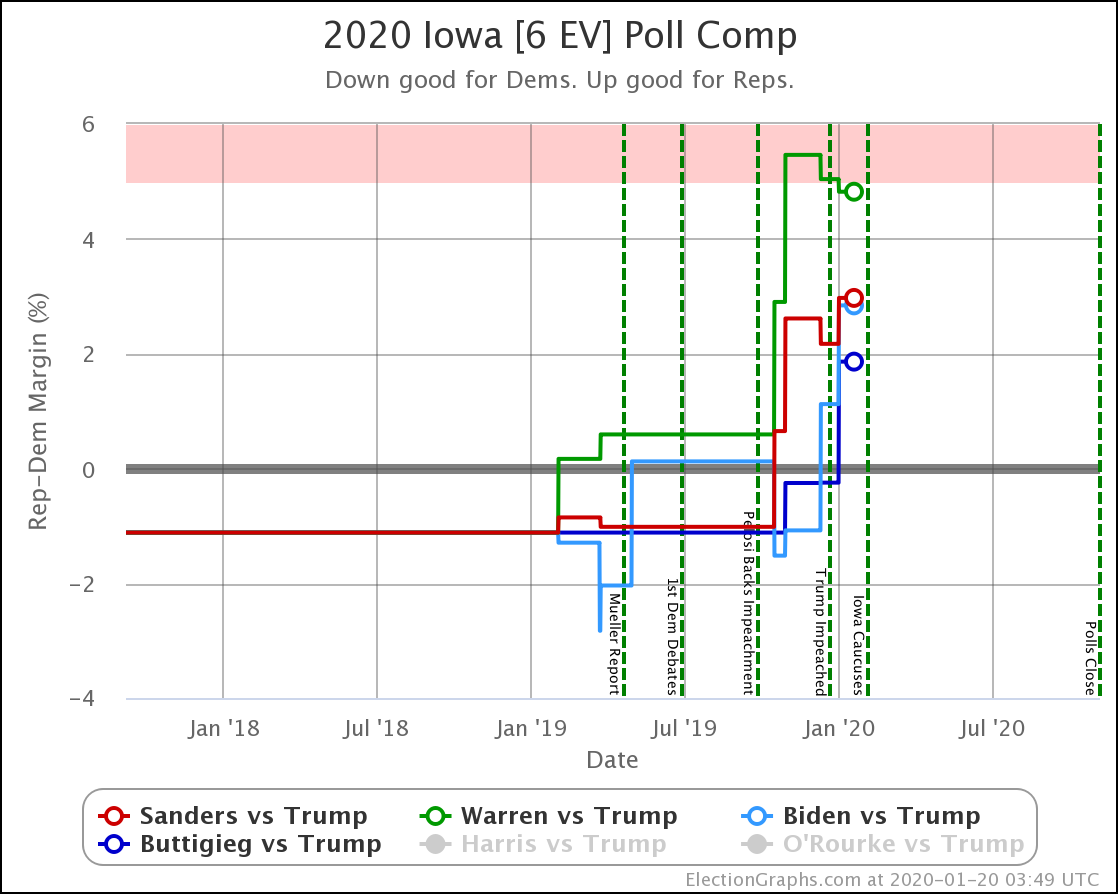
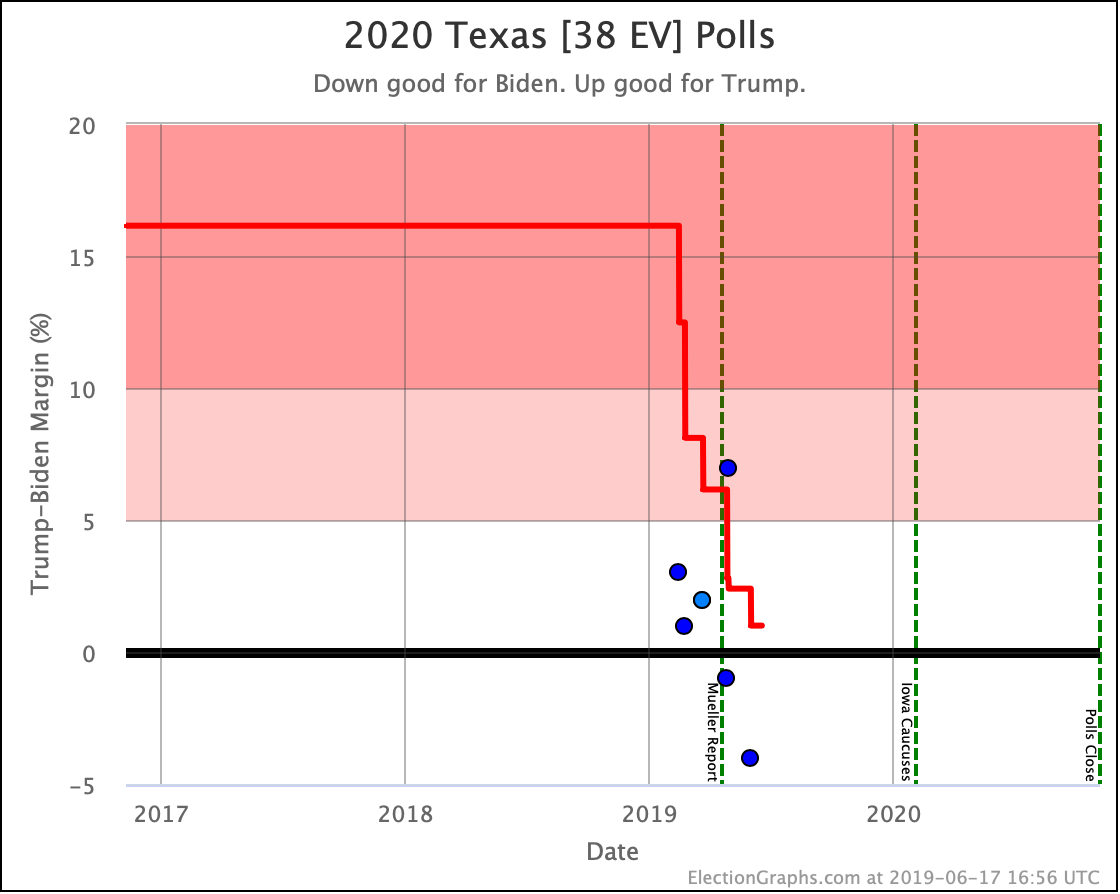
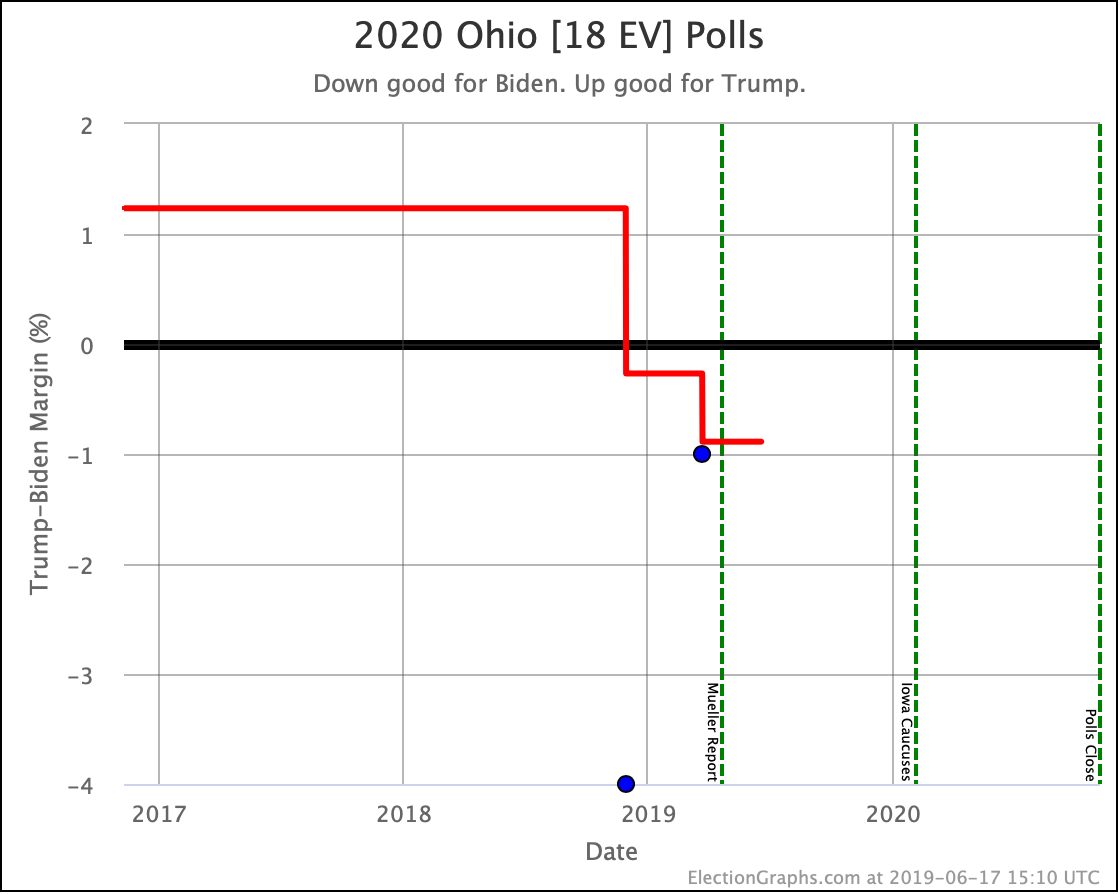
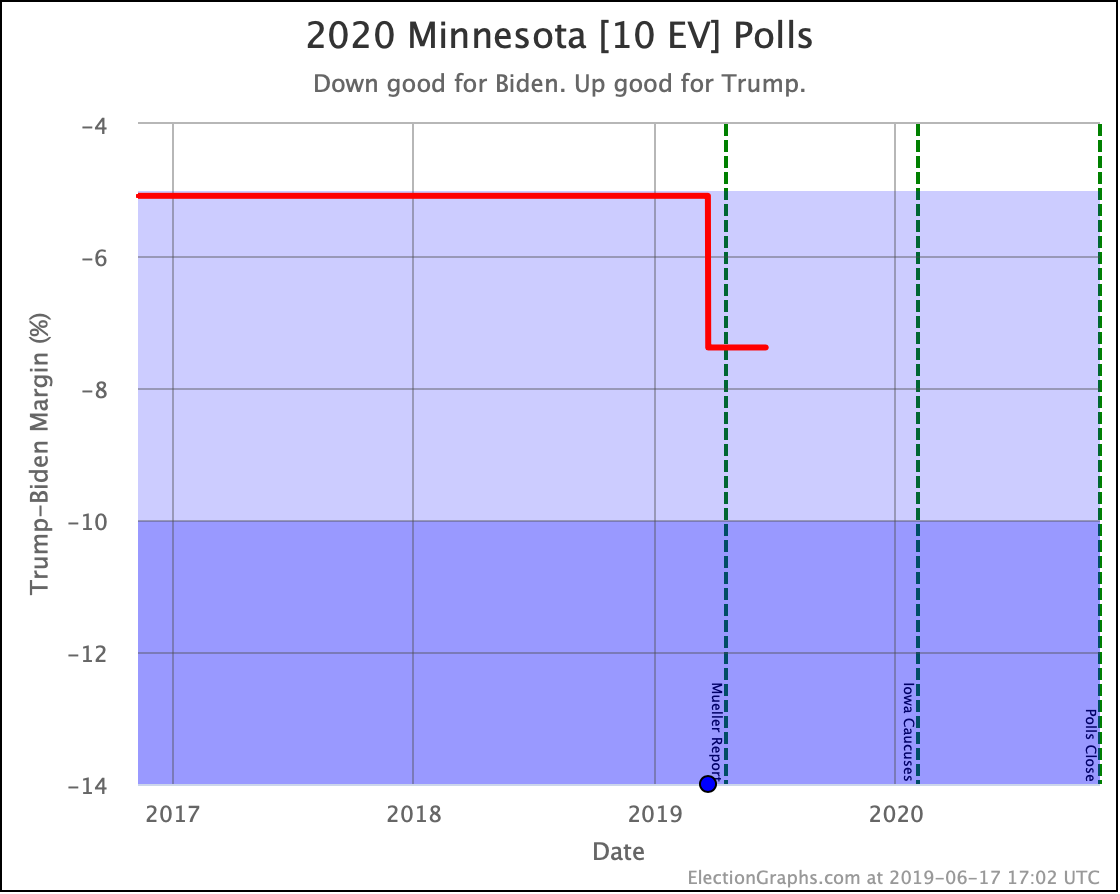
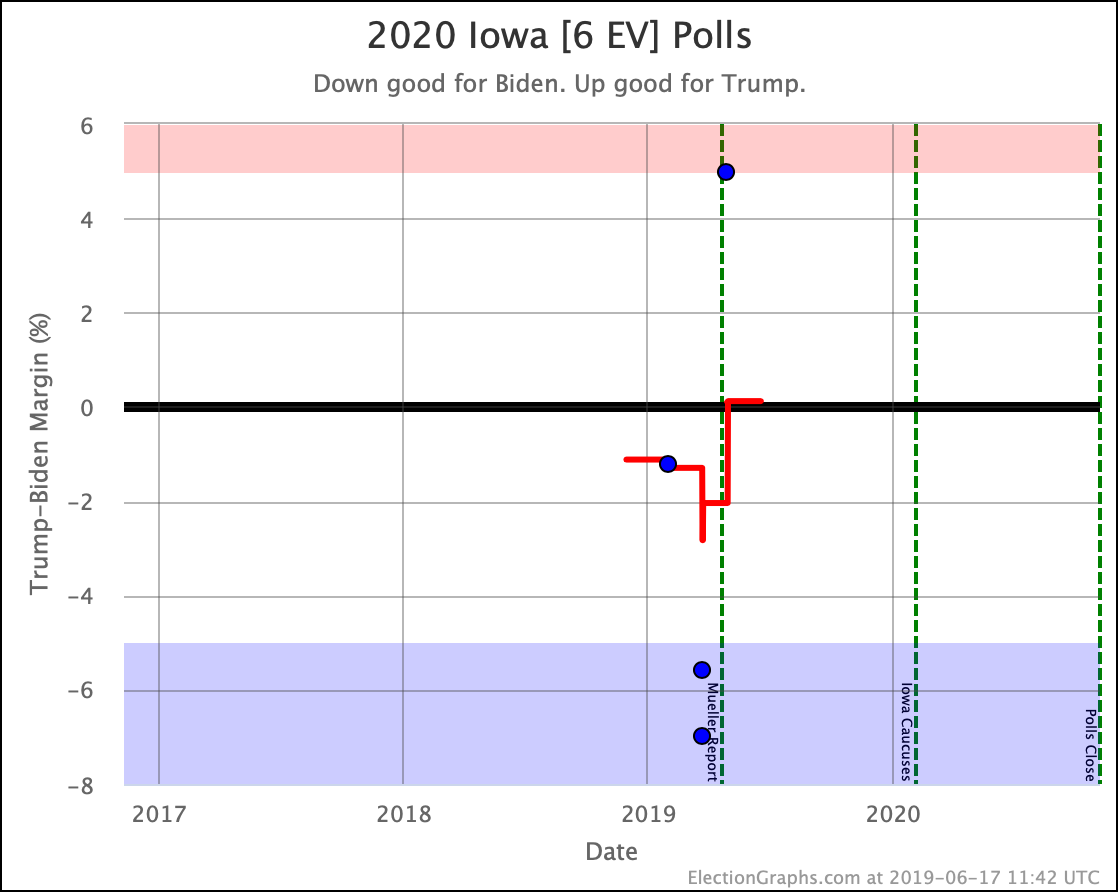
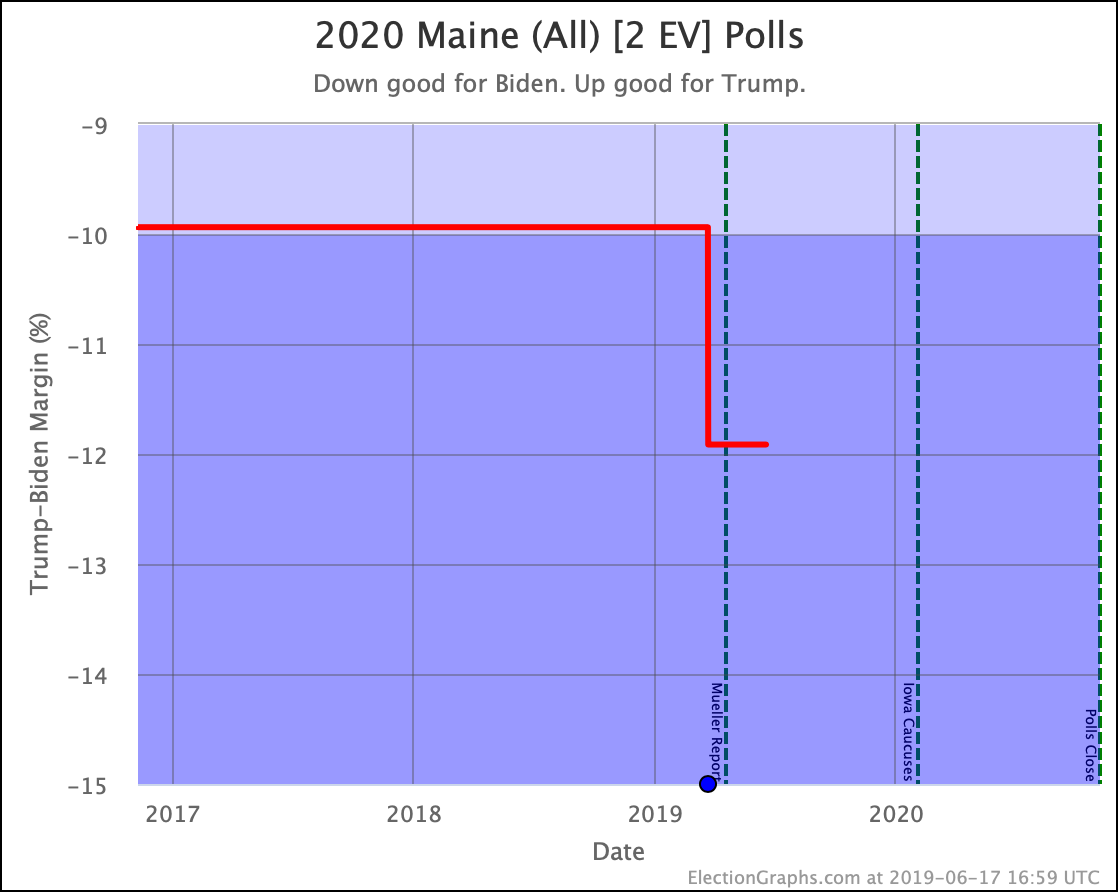
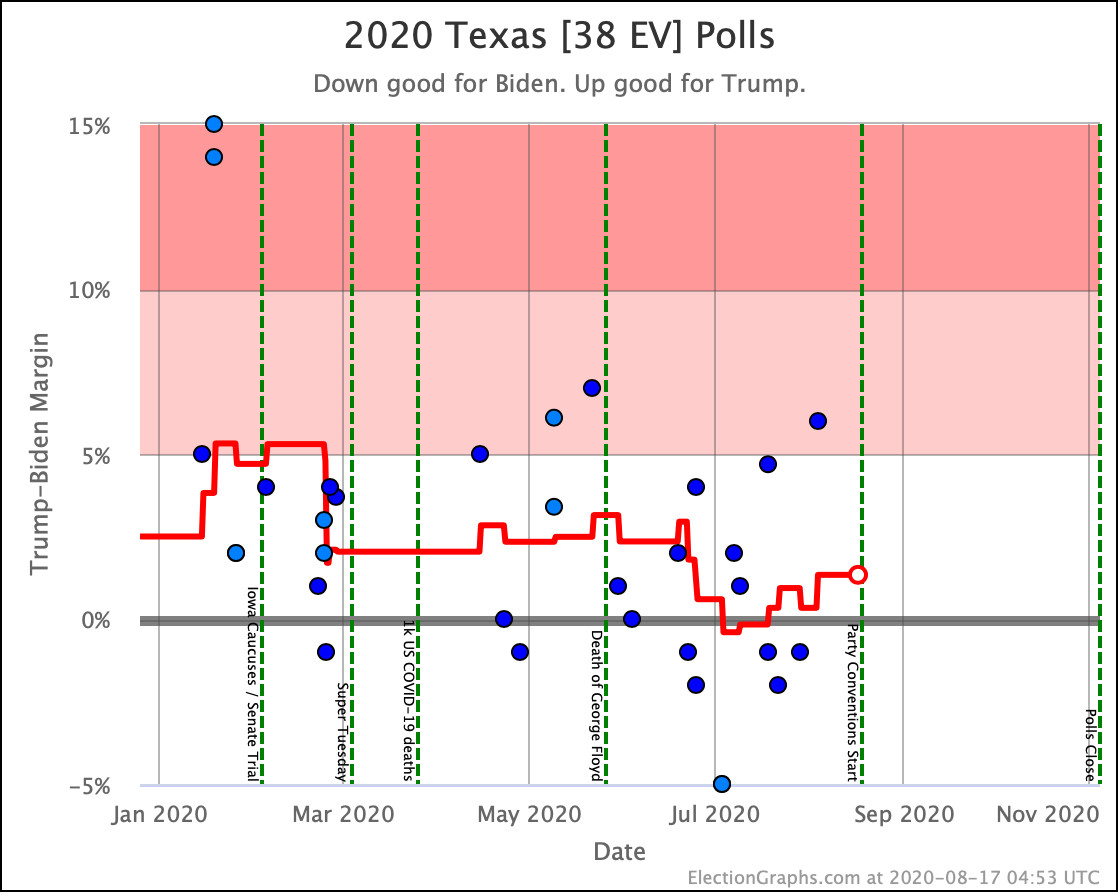
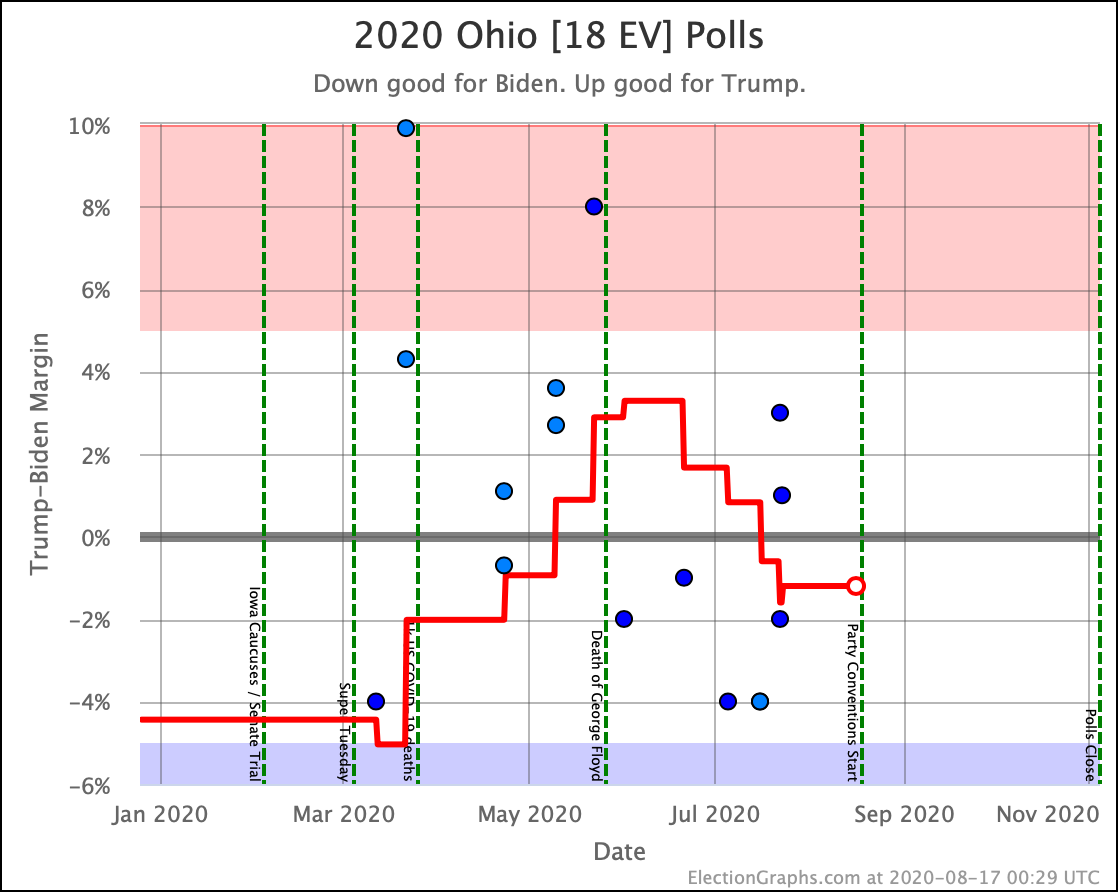
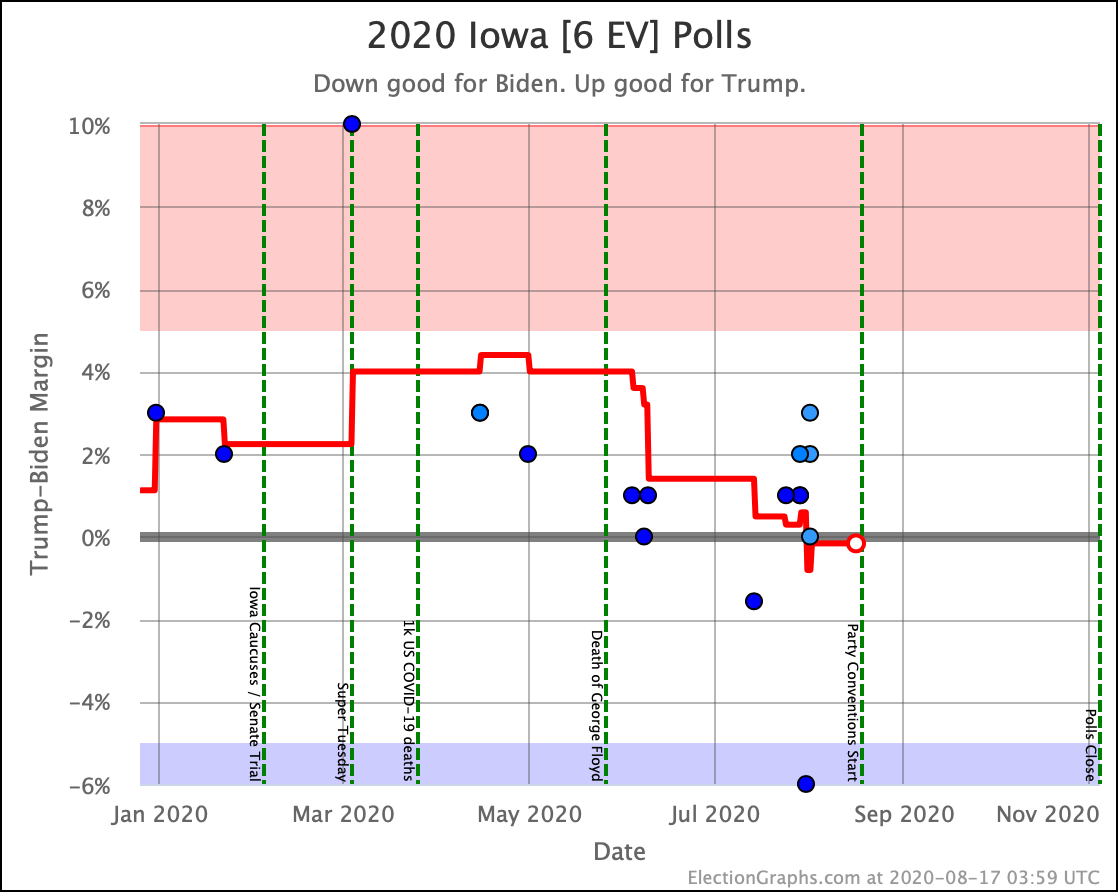
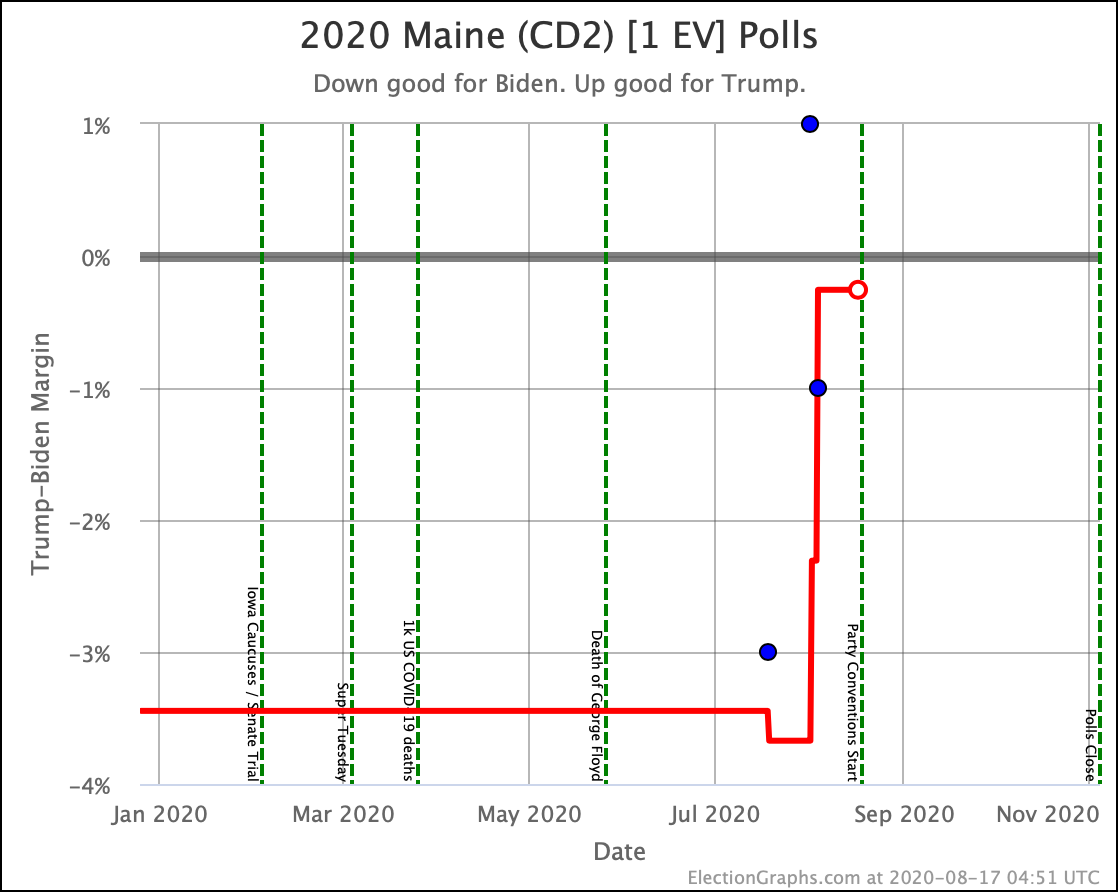
It is tempting to concentrate on the states that are currently closest. At the moment that would be Iowa, Maine CD2, North Carolina, Ohio, and Texas. But at the moment if Biden won those states it would just be gravy on top of a win that had already been secured. And if Trump won those states, it would not be enough to win the election.
The battle for winning the election is around the tipping point. You want to be as far ahead as possible in the states near the tipping point. That is how you secure the win, and that is generally where most efforts should be concentrated.
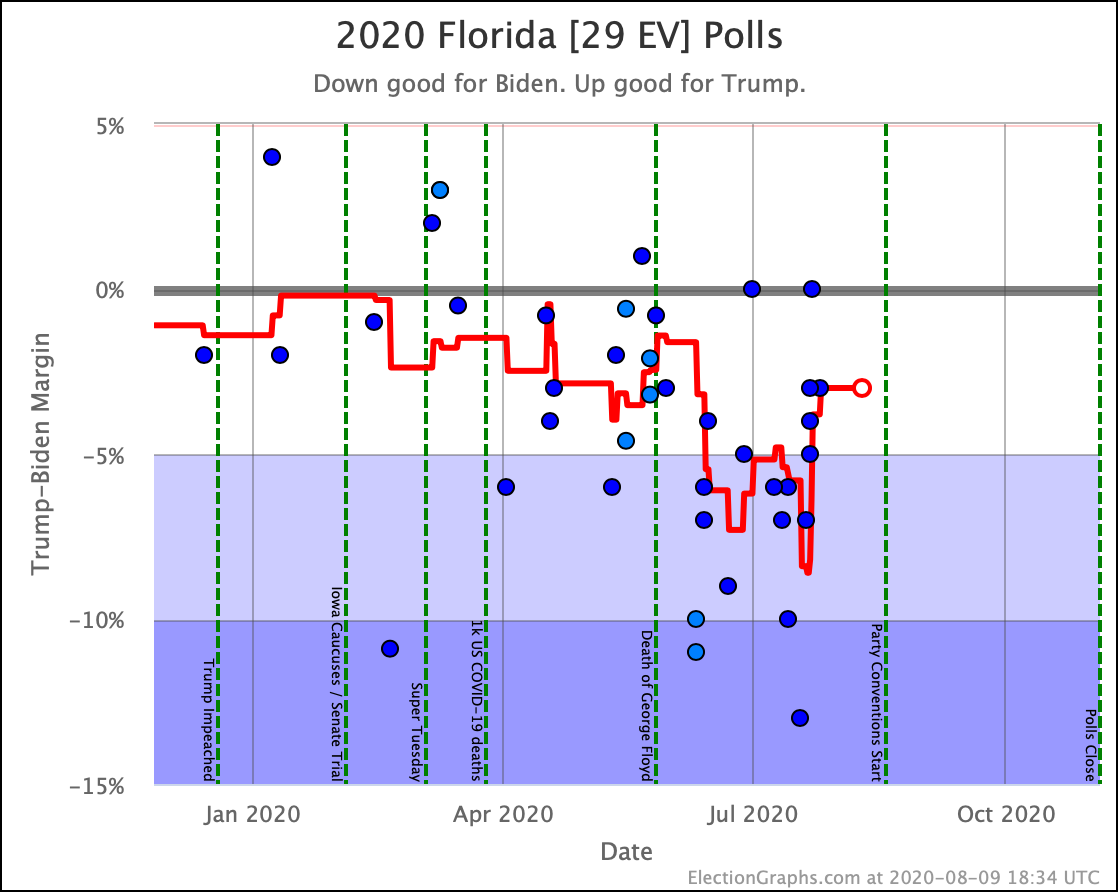
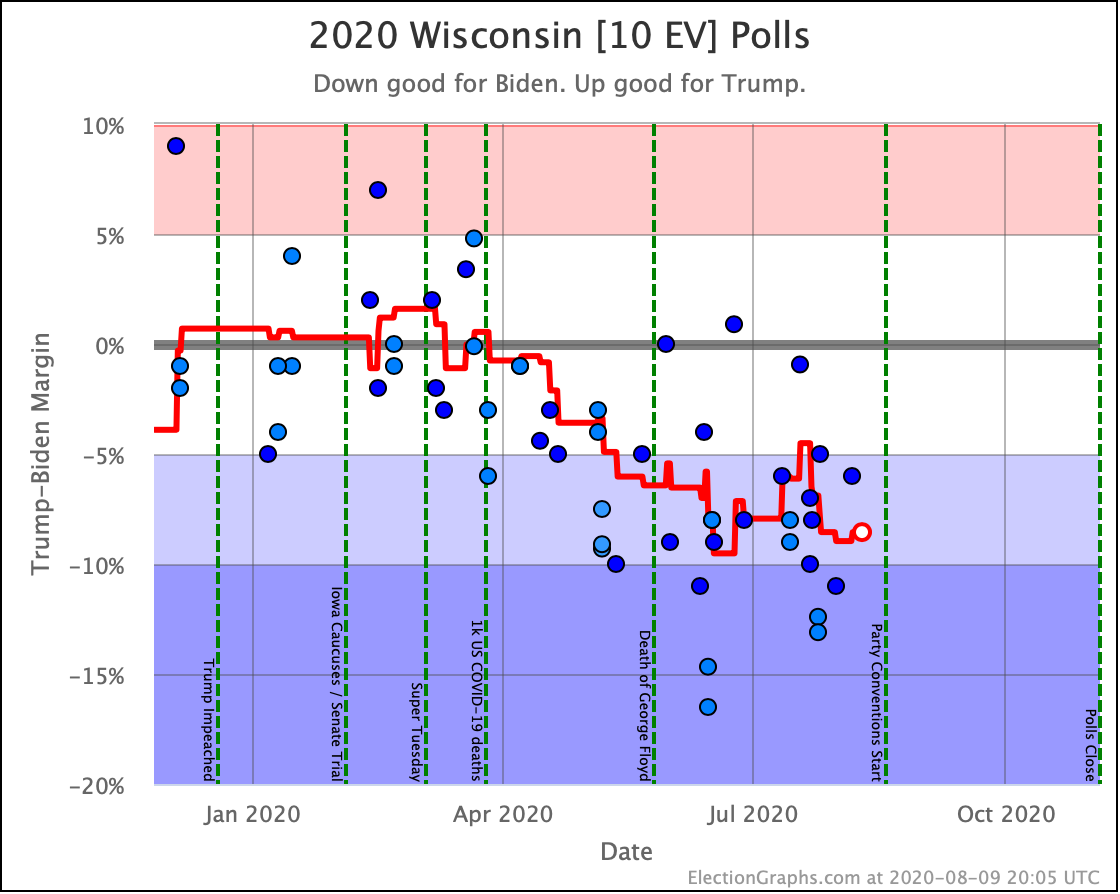
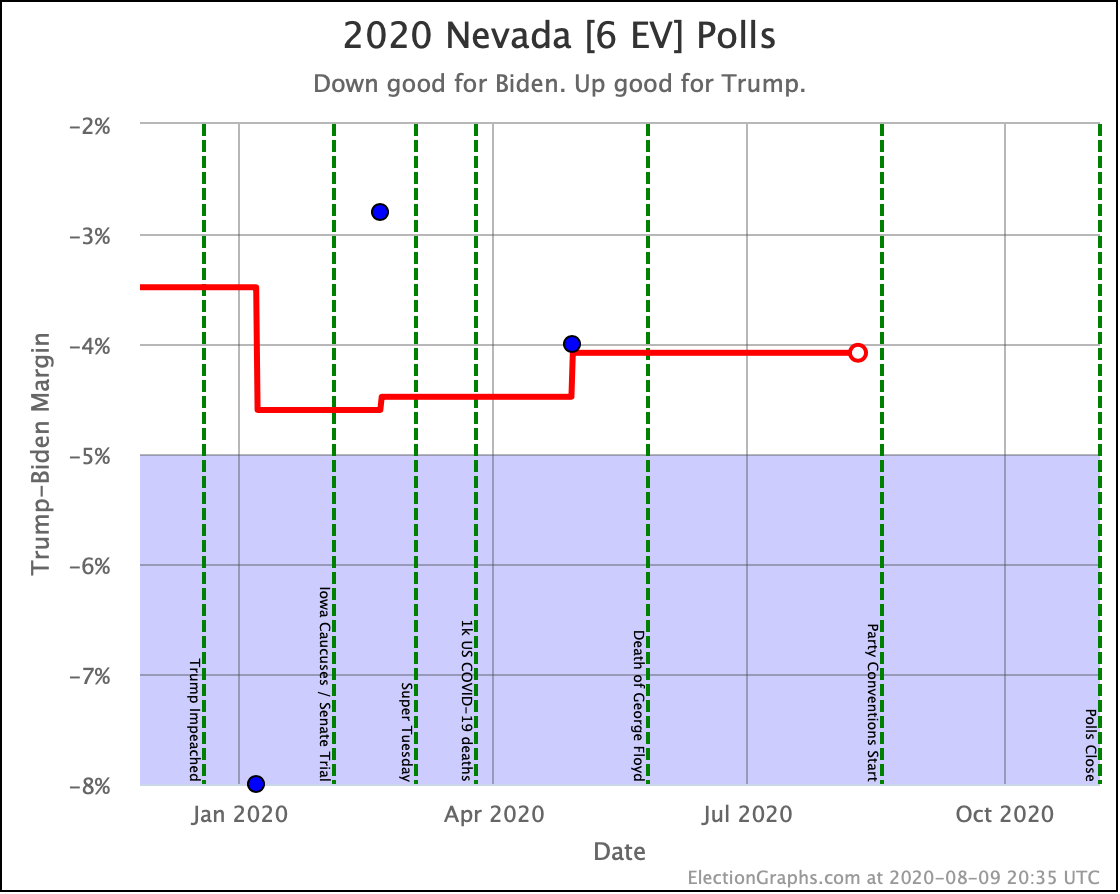
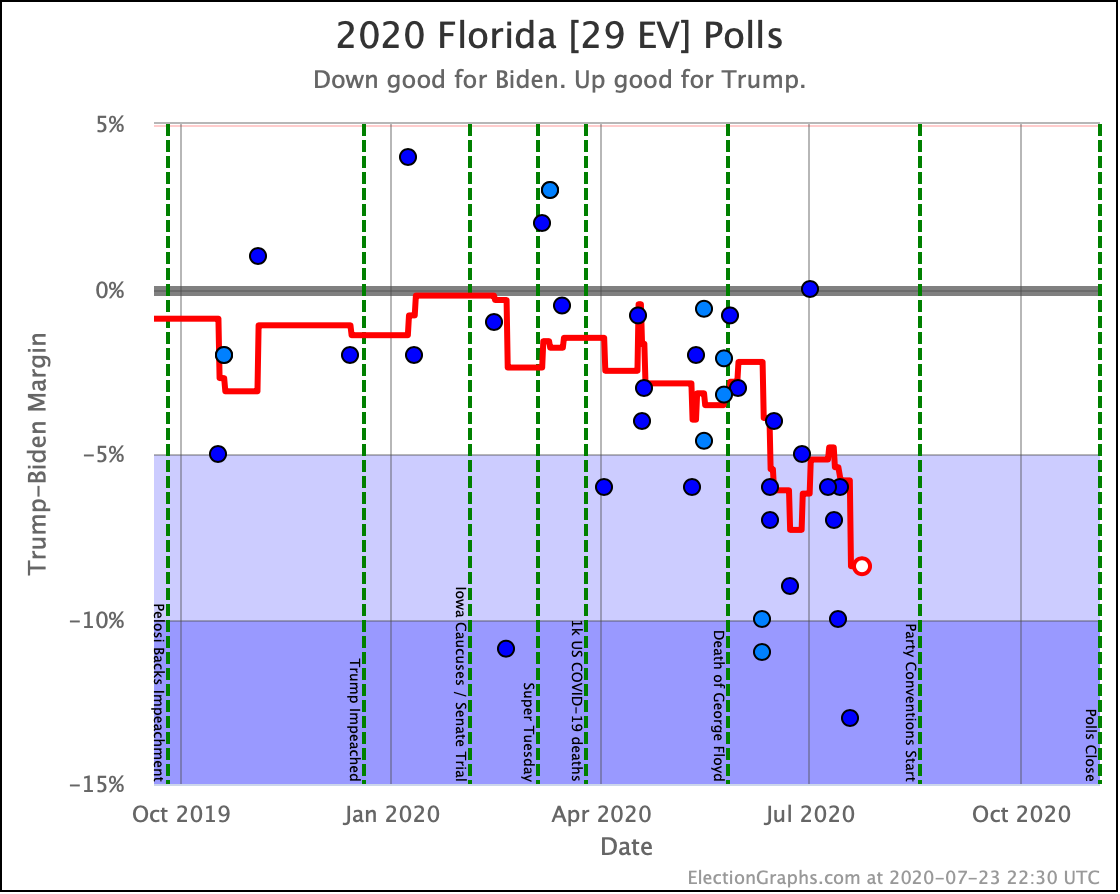
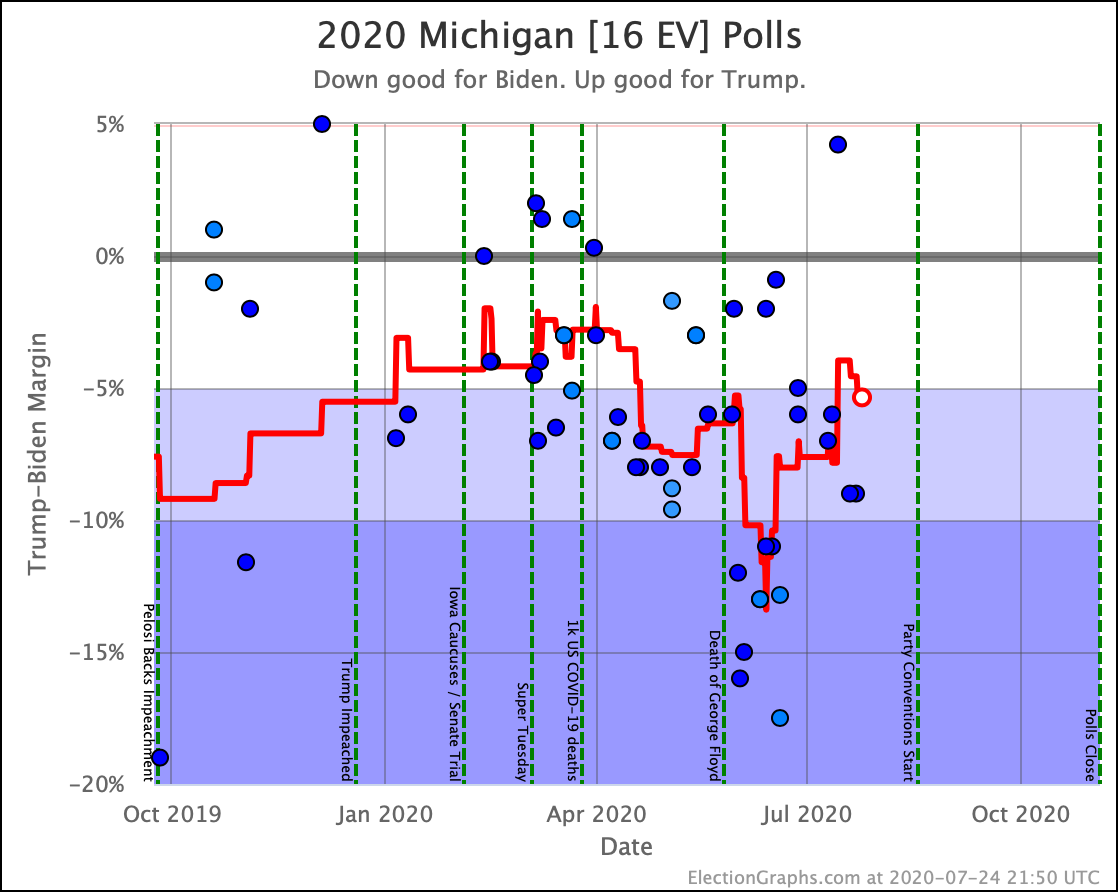
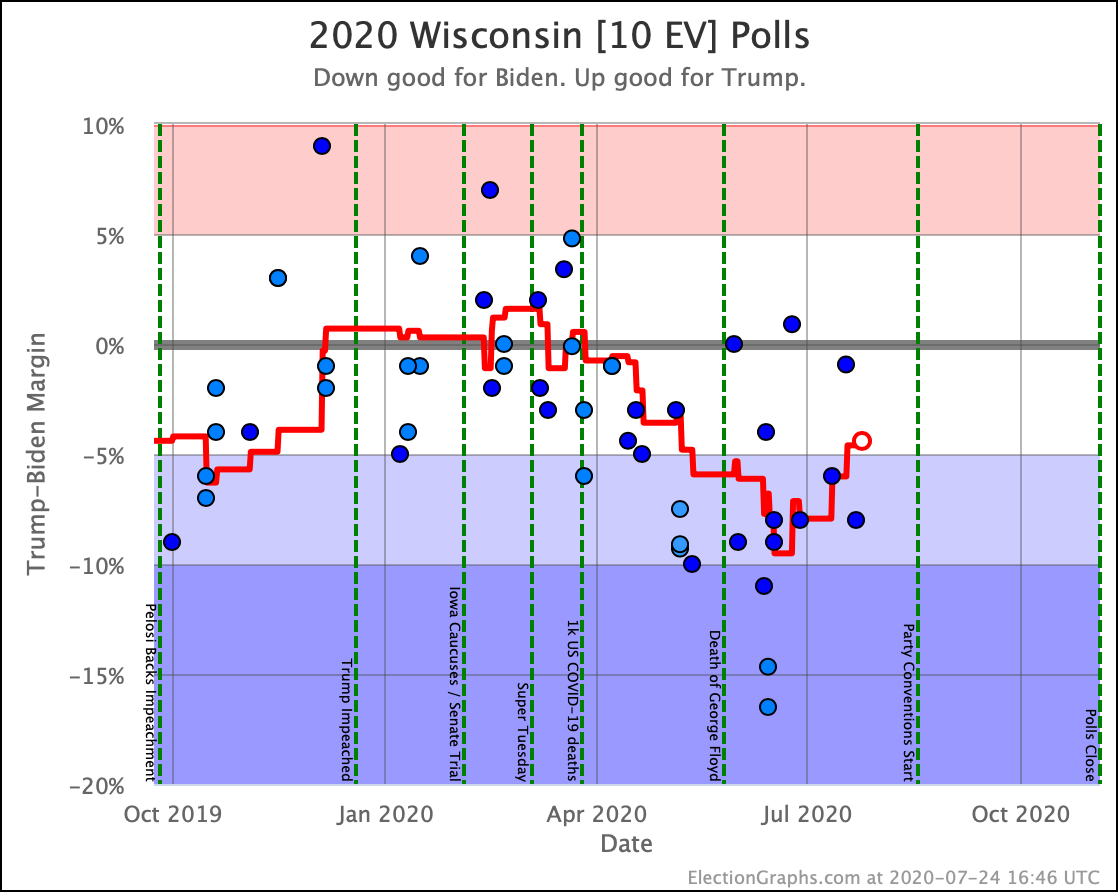
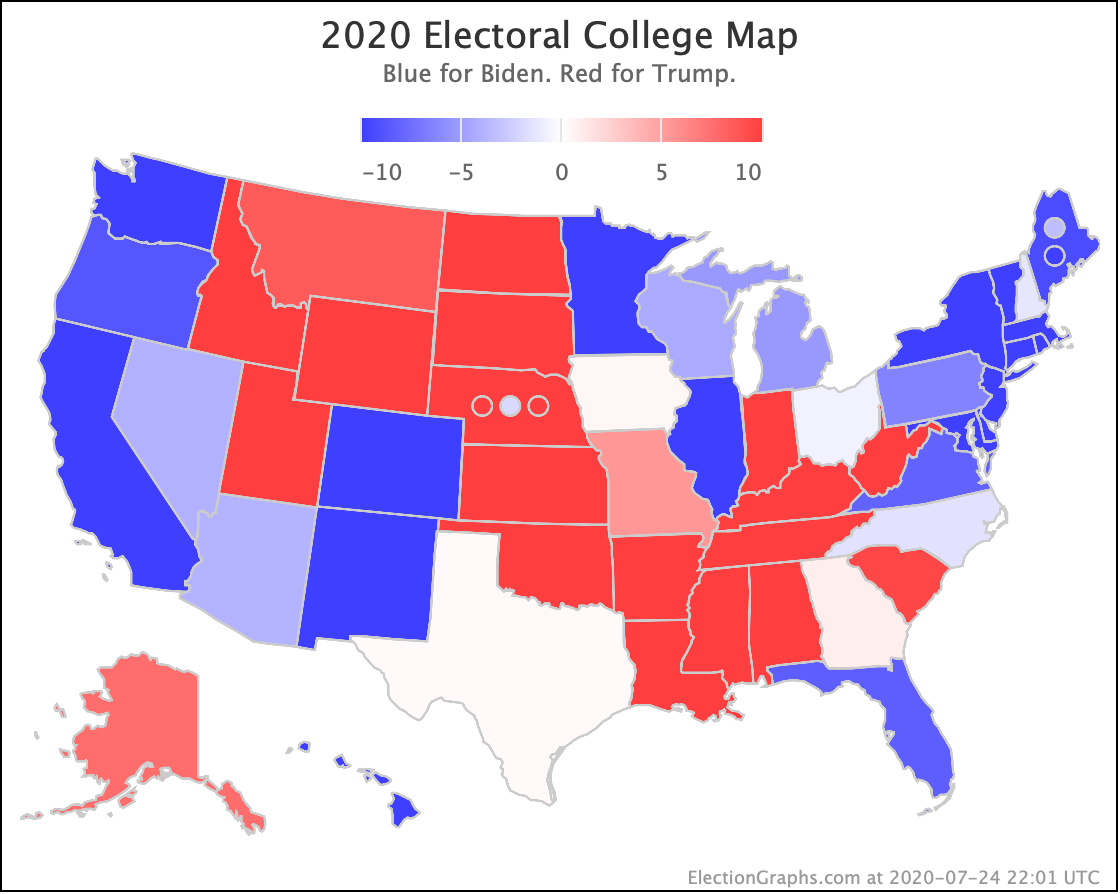
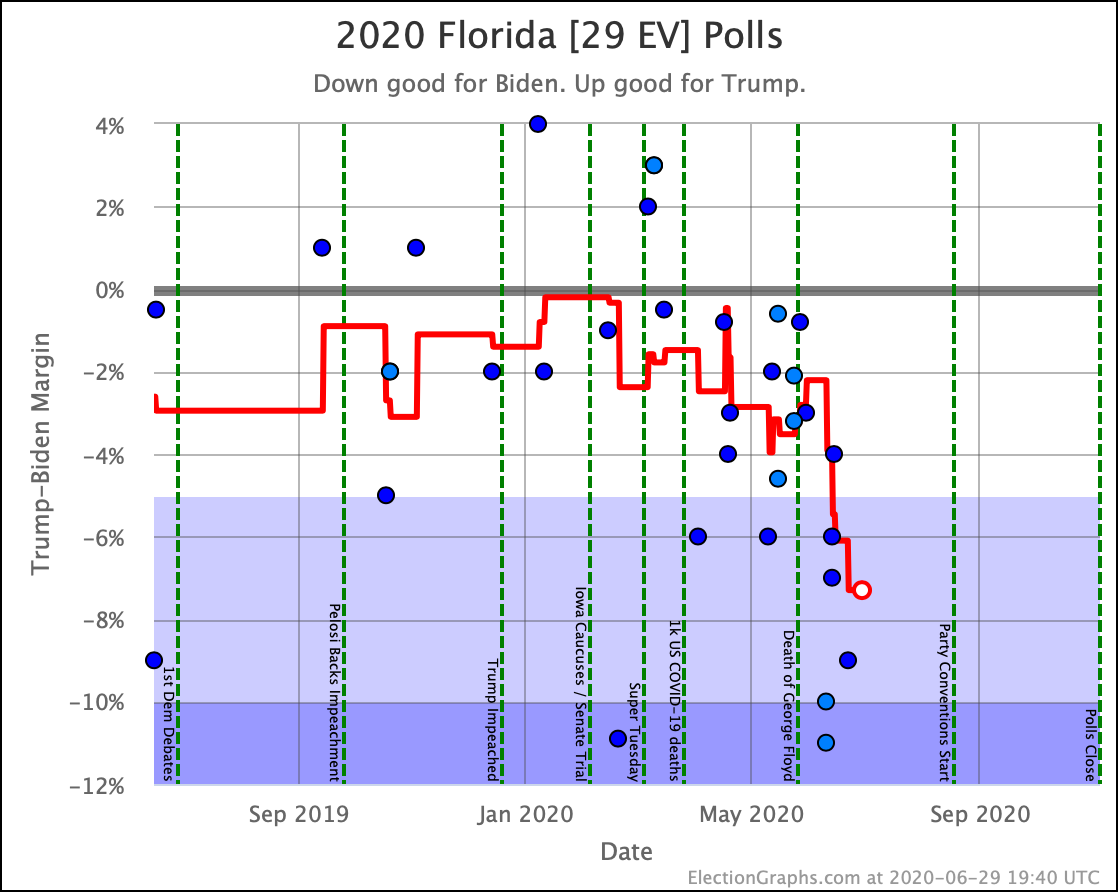
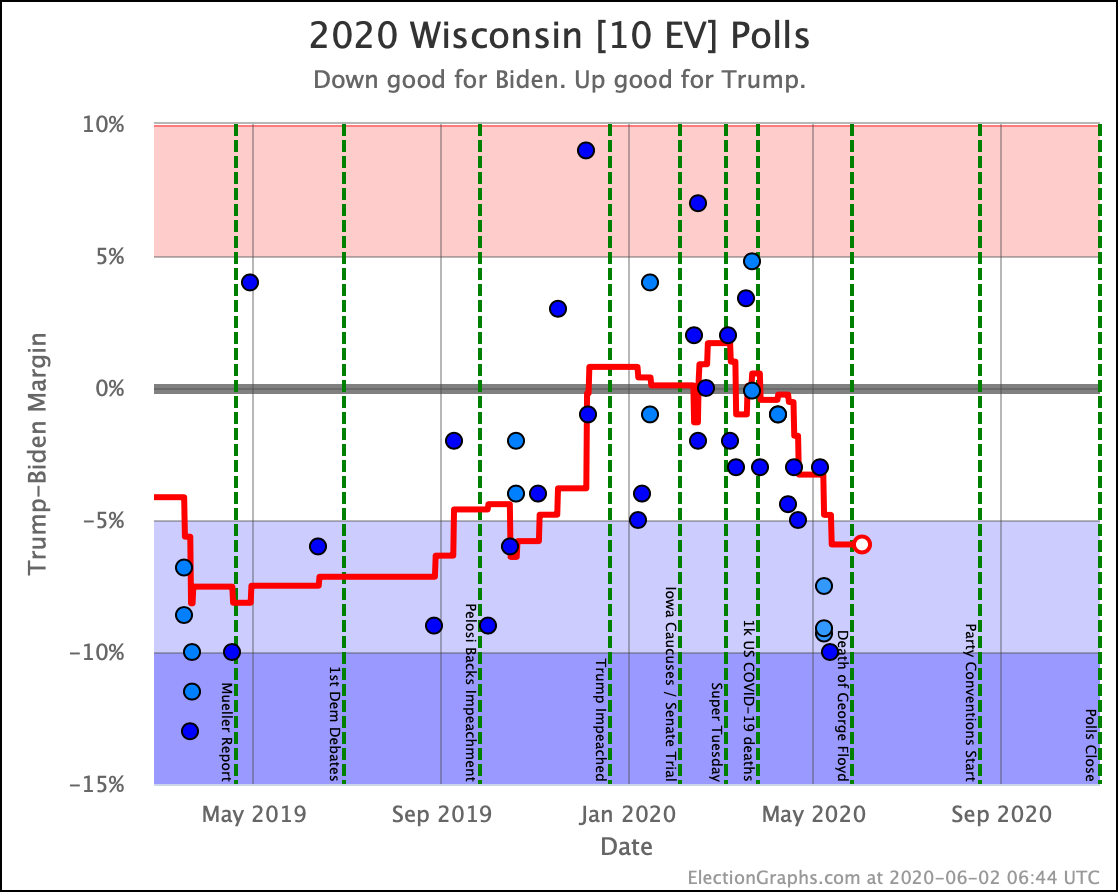
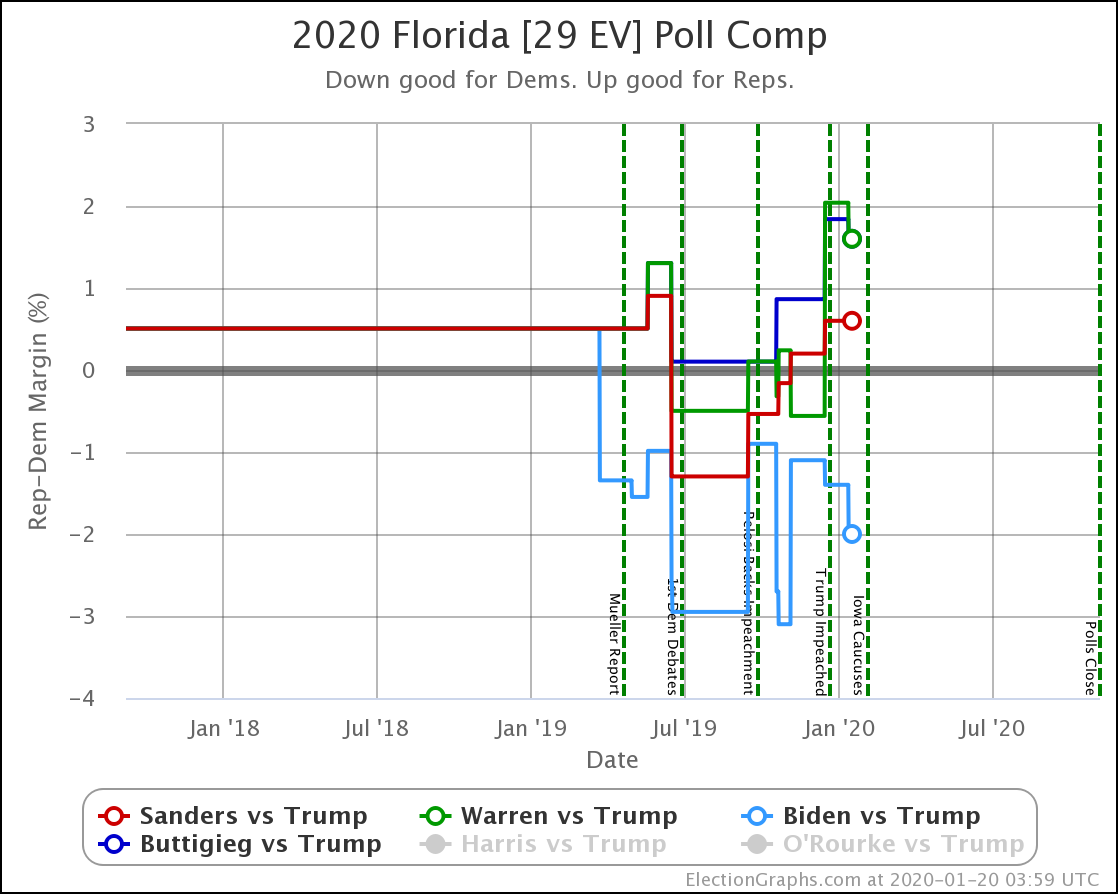
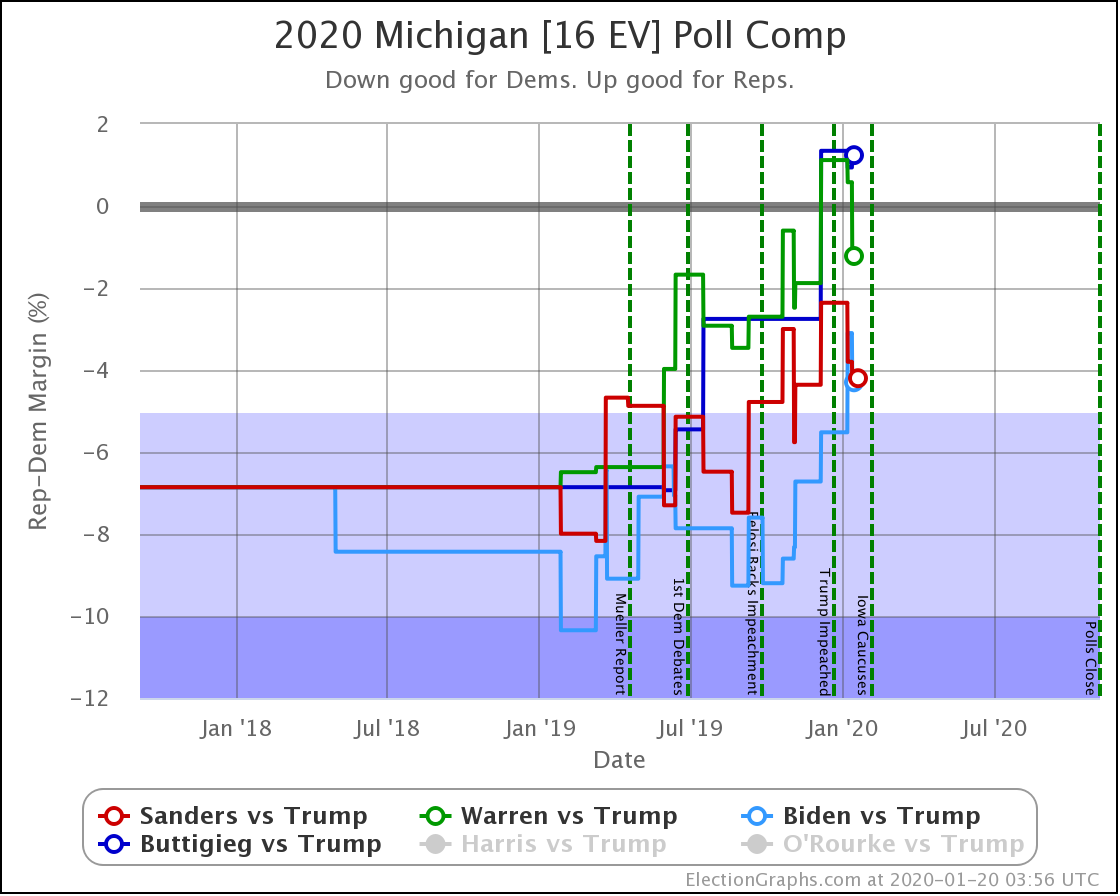
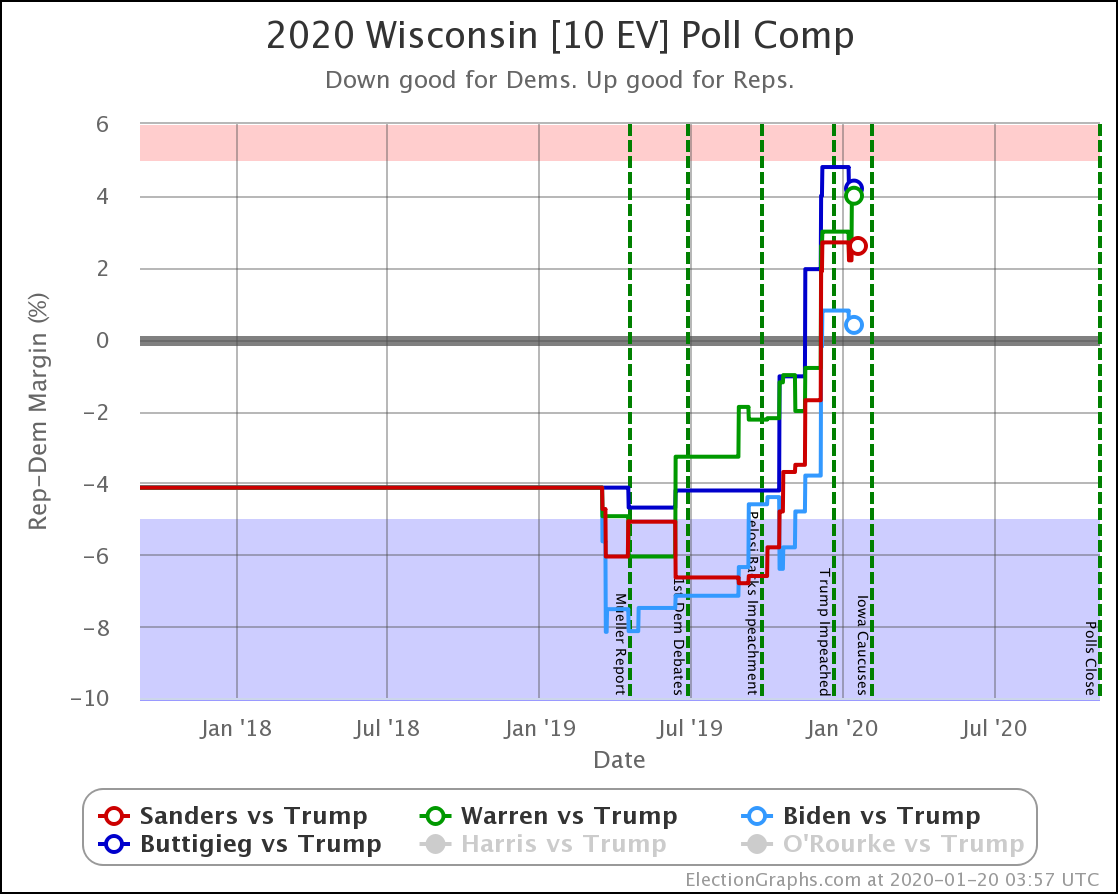
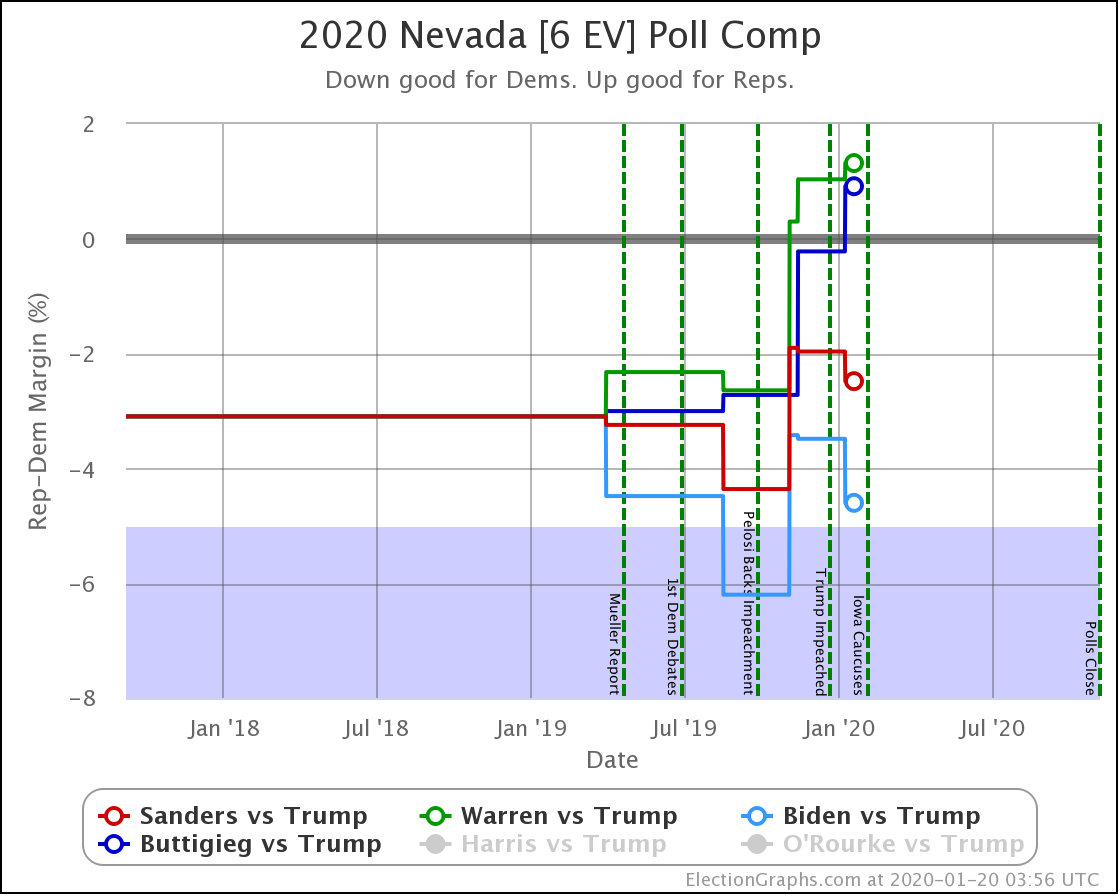
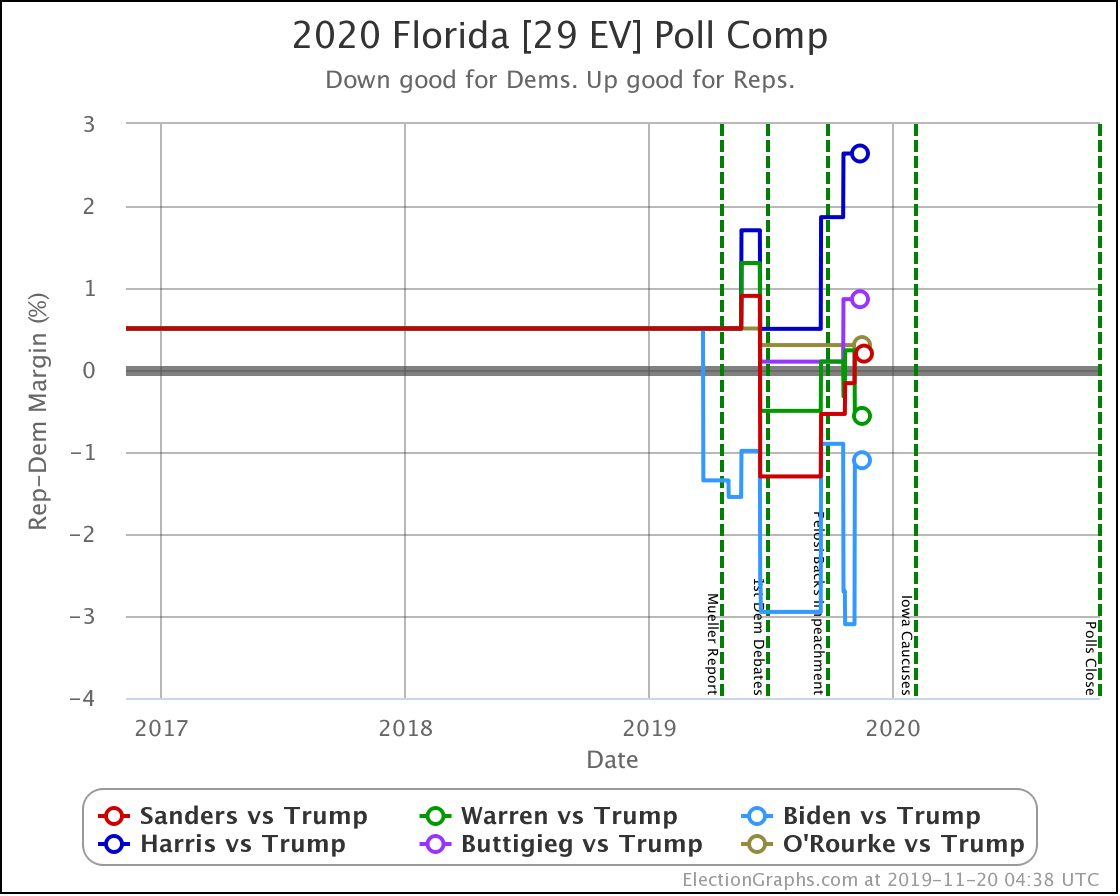
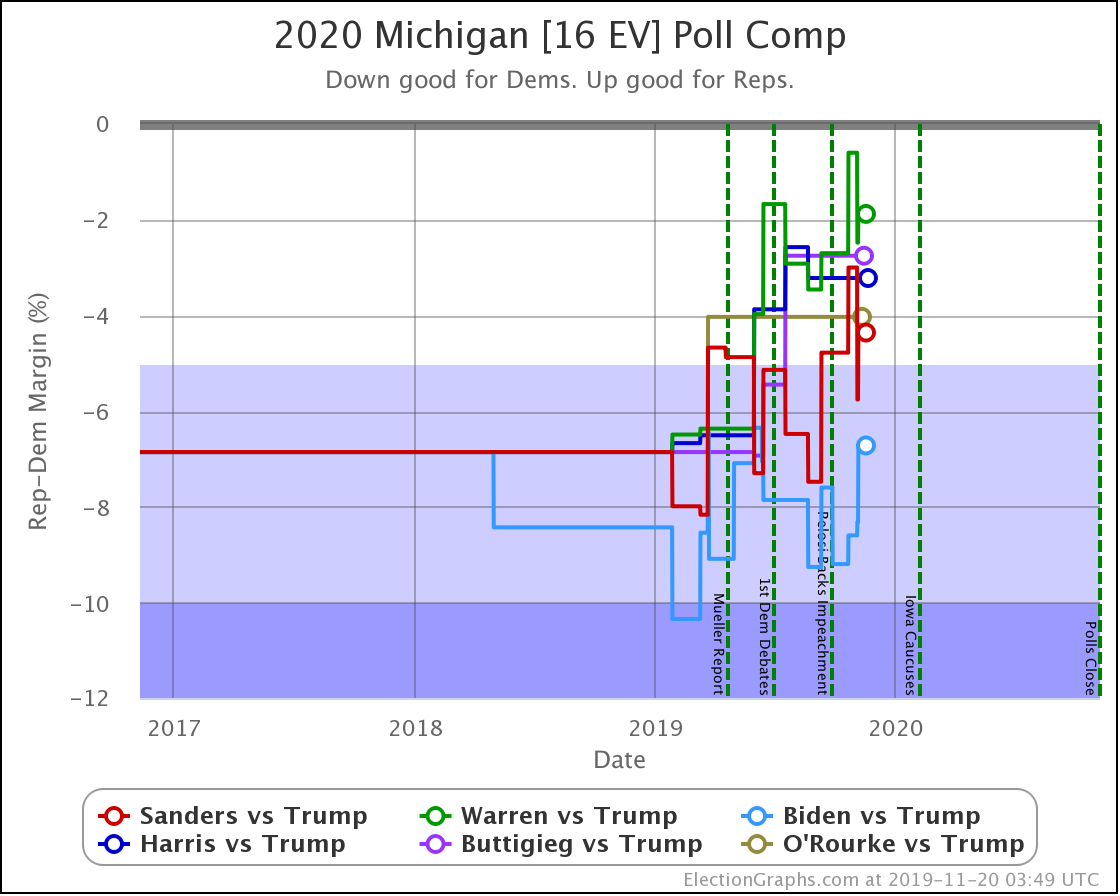
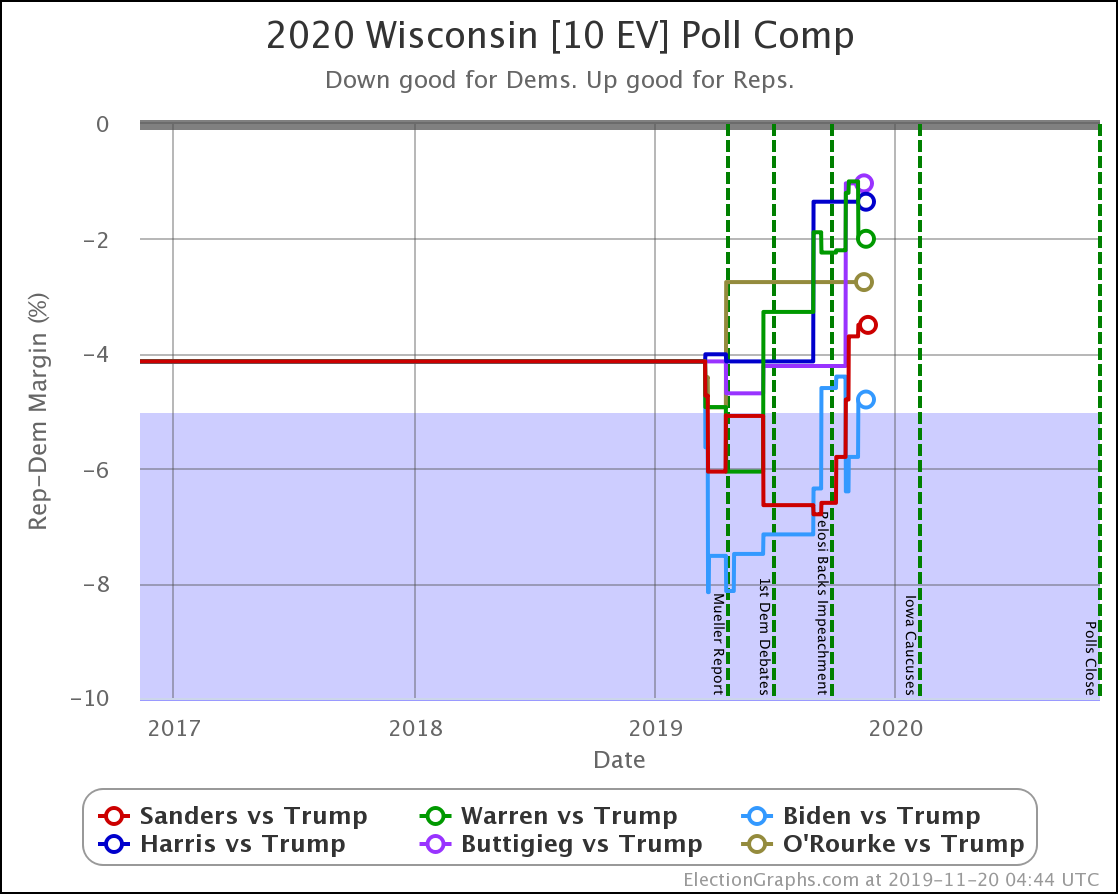
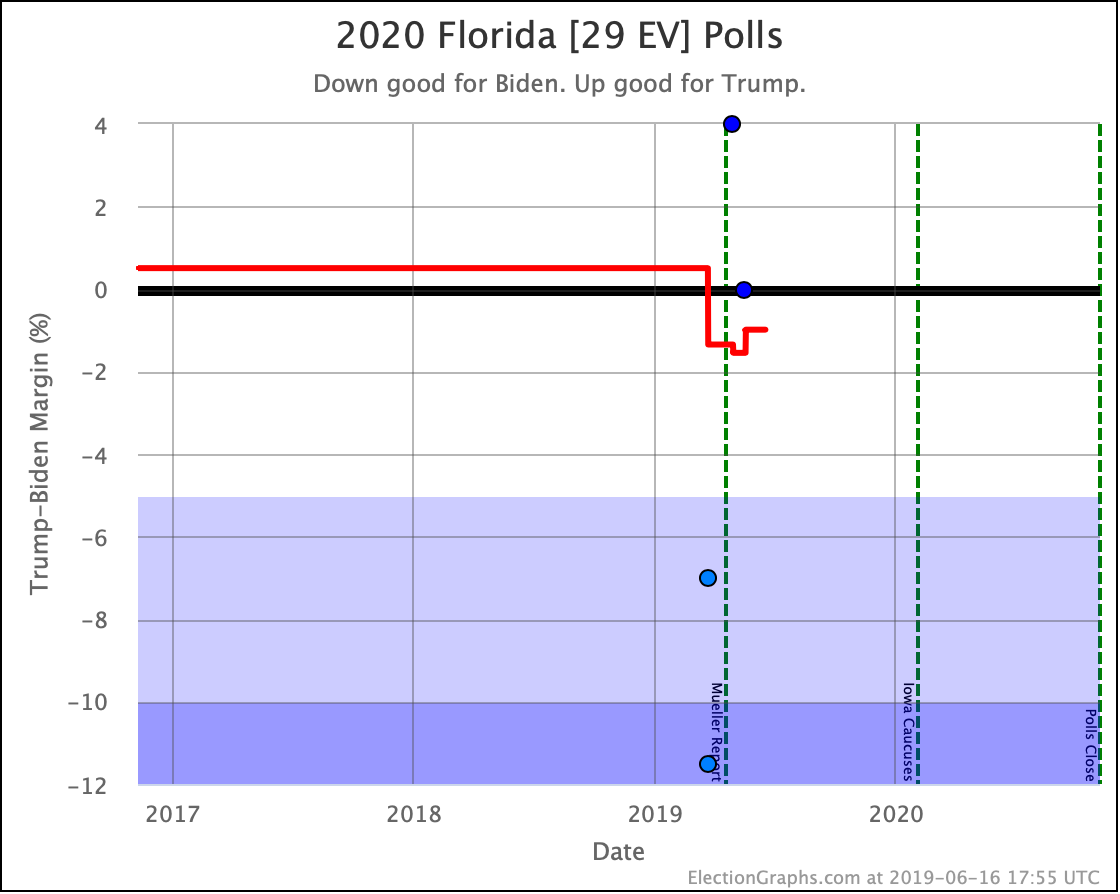
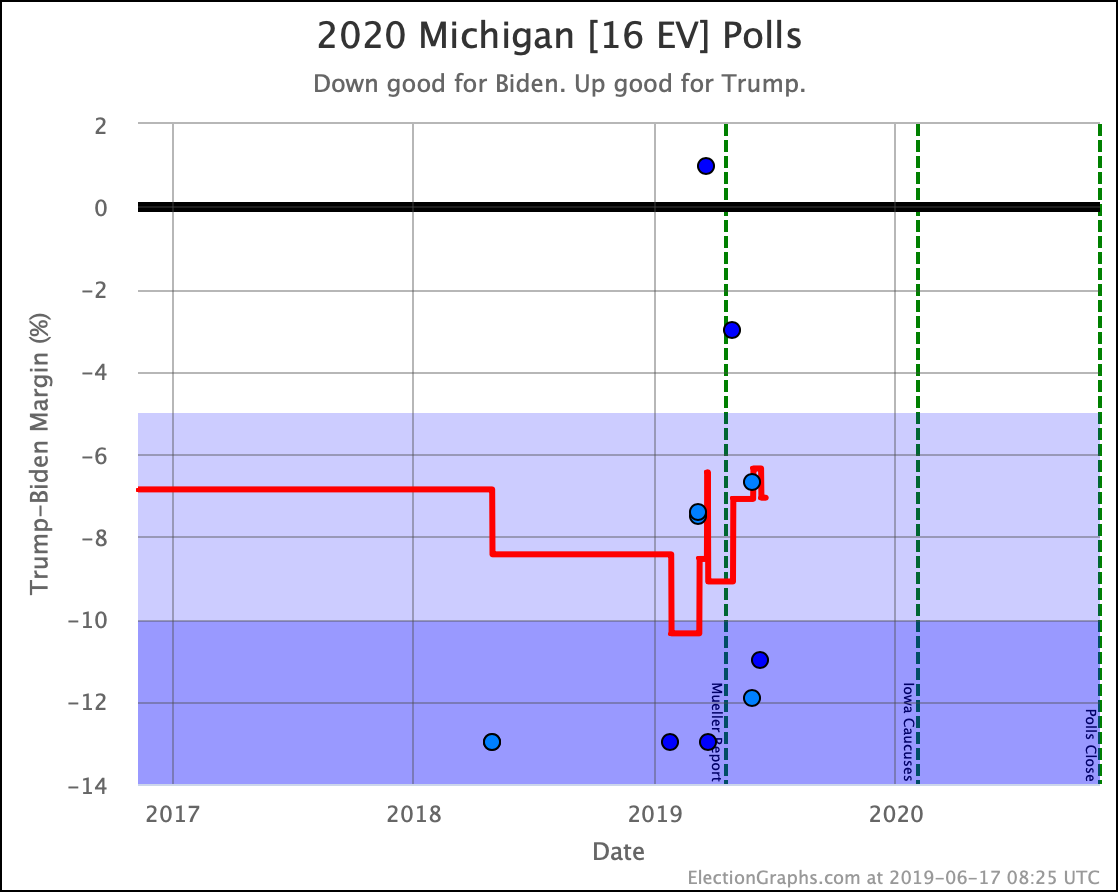
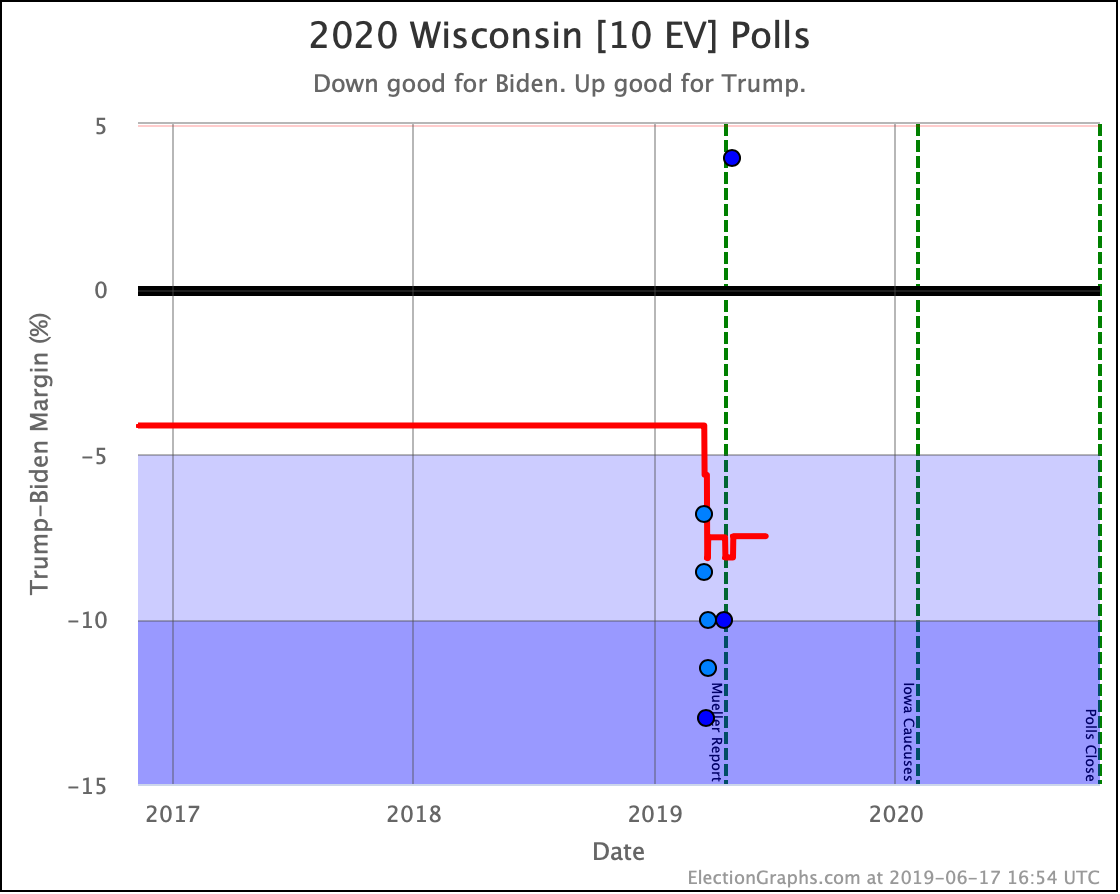
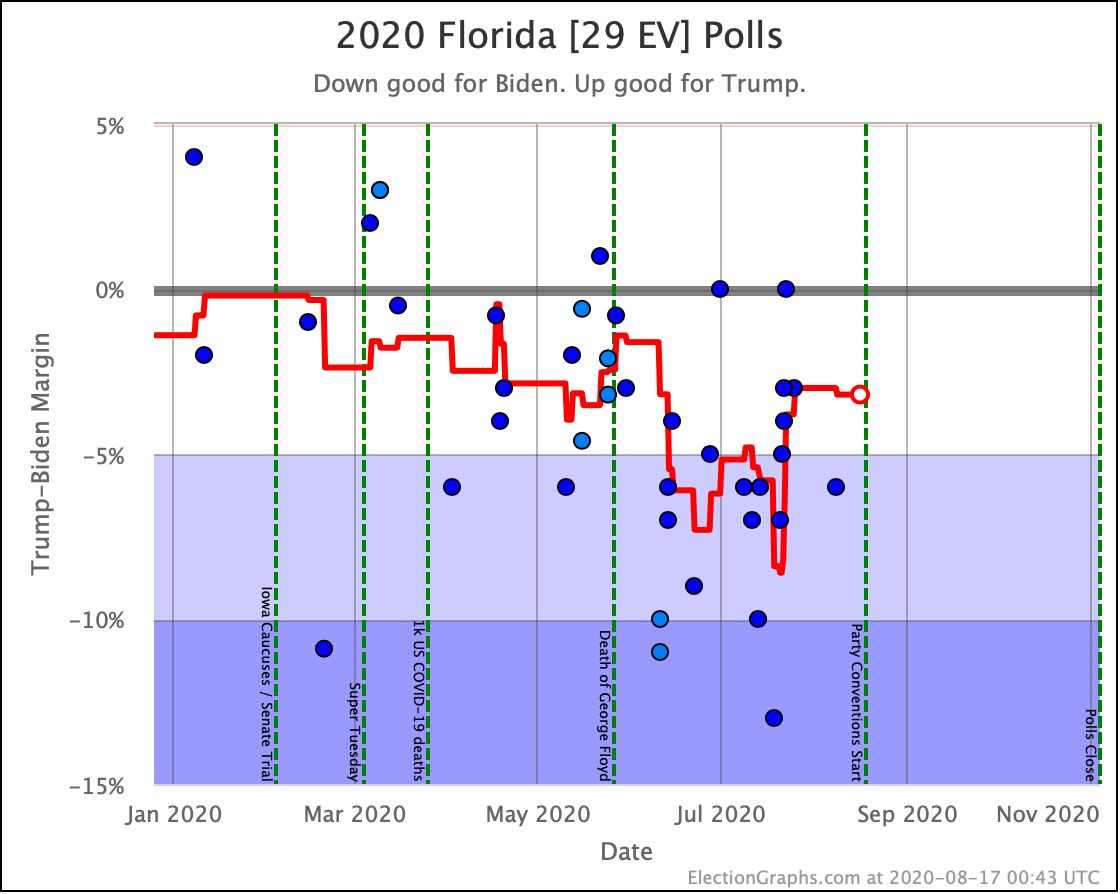
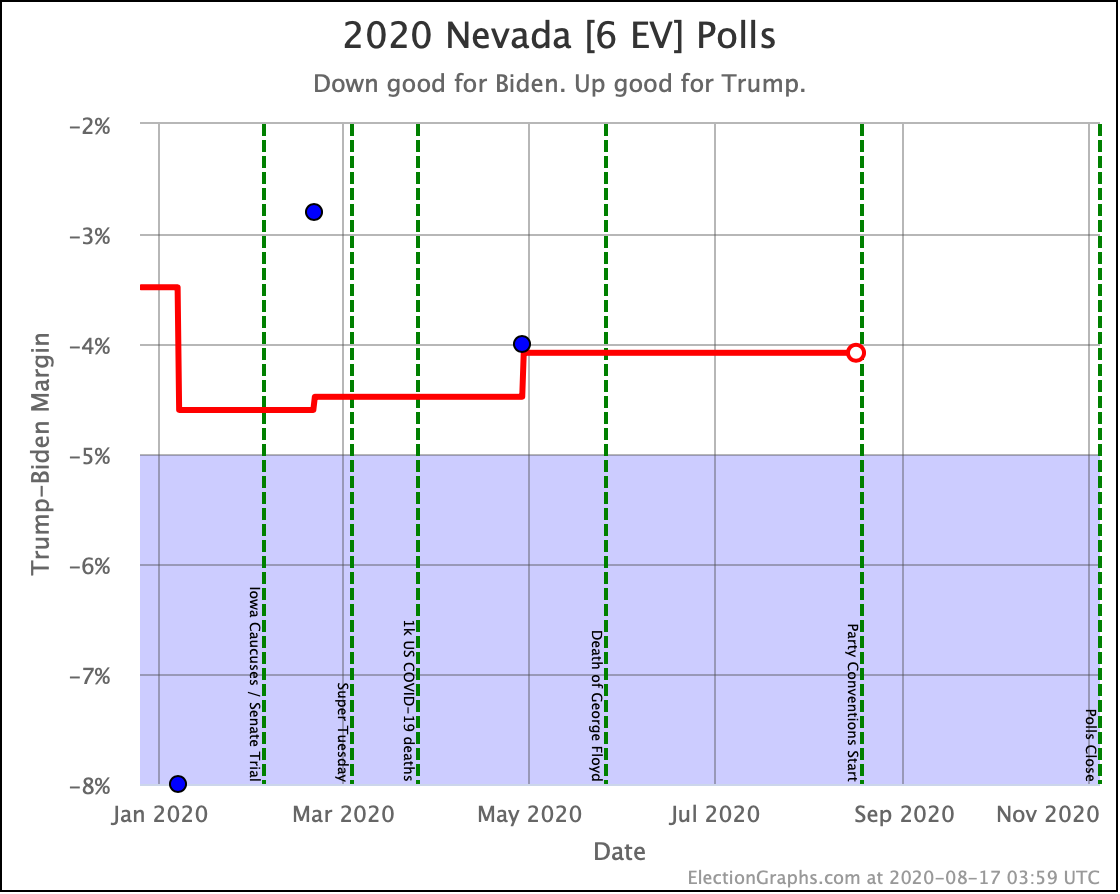
Right now, Pennsylvania is the tipping point. Adding in the two states on either side, you bring in Michigan, Wisconsin, Nevada, and Florida.
This is part of why you see tons of polls in Pennsylvania, Michigan, and Wisconsin even though none of those are particularly close at the moment. And of course, Florida, since it is not that far off from the tipping point, AND it is close at the moment.
It does not however explain why there have only been five polls in Nevada in the LAST YEAR. Come on people! Can we get some polls in Nevada?
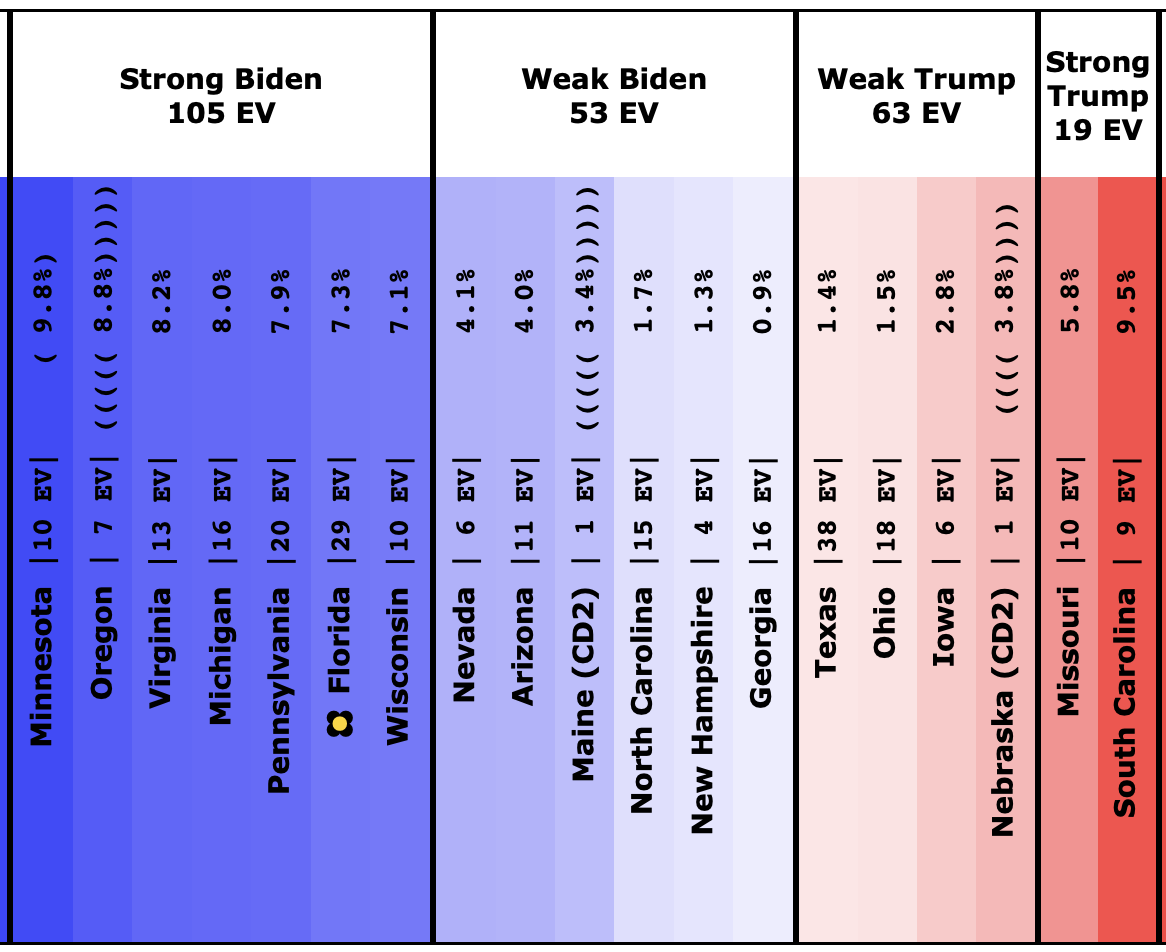
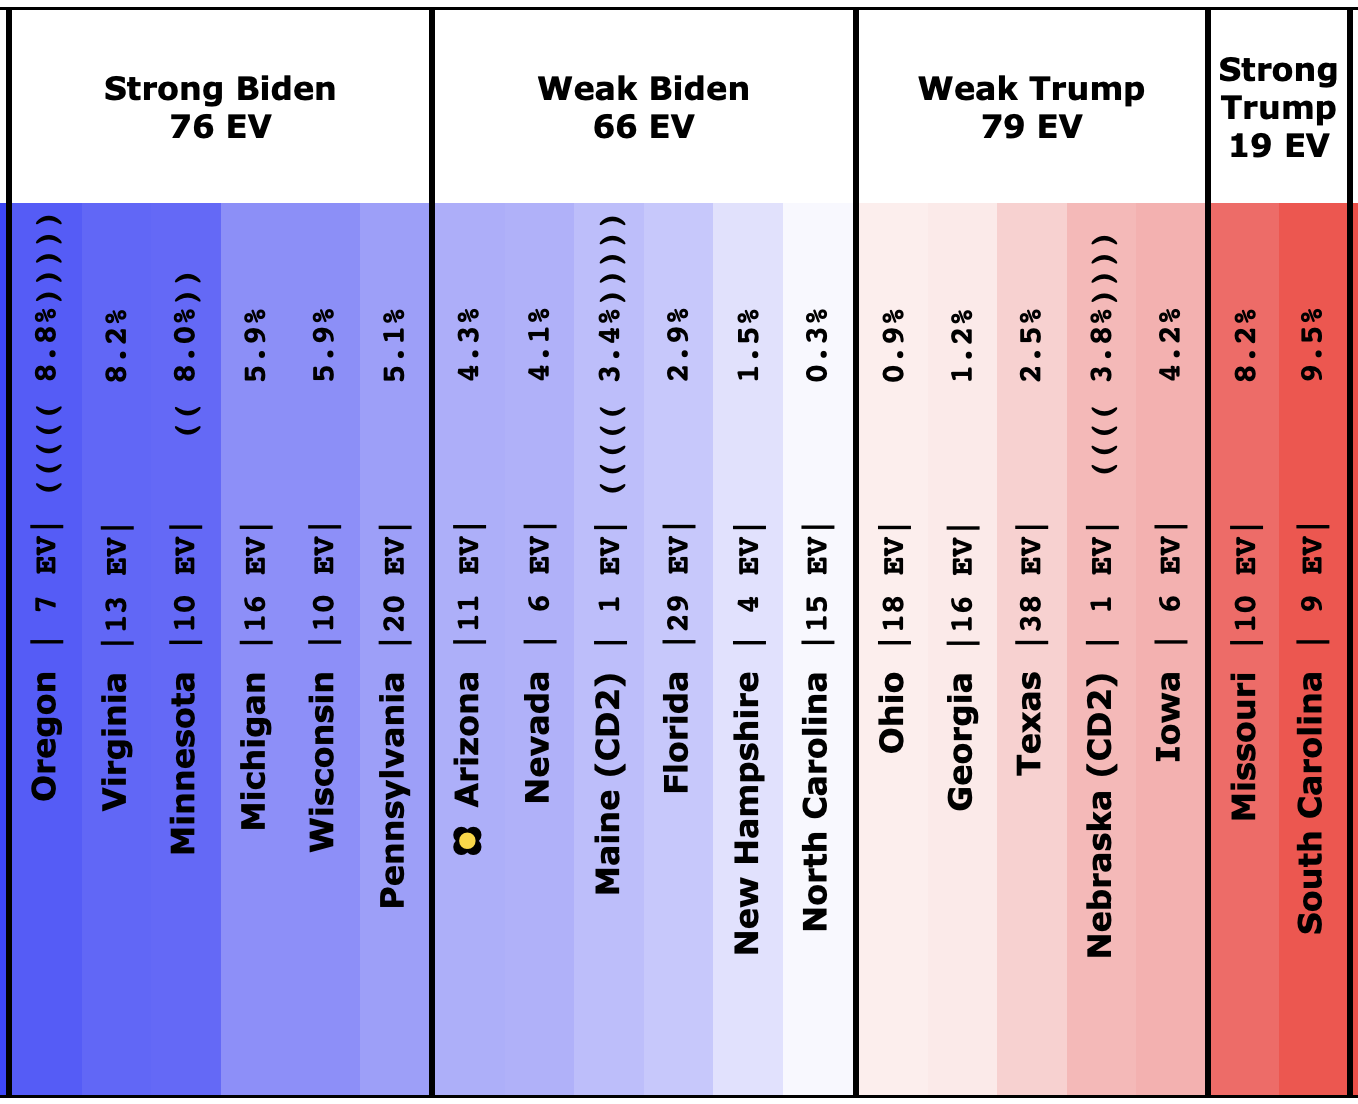
Anyway… you can see how the tipping point fits in with all the other states in the current spectrum of the states in contention:
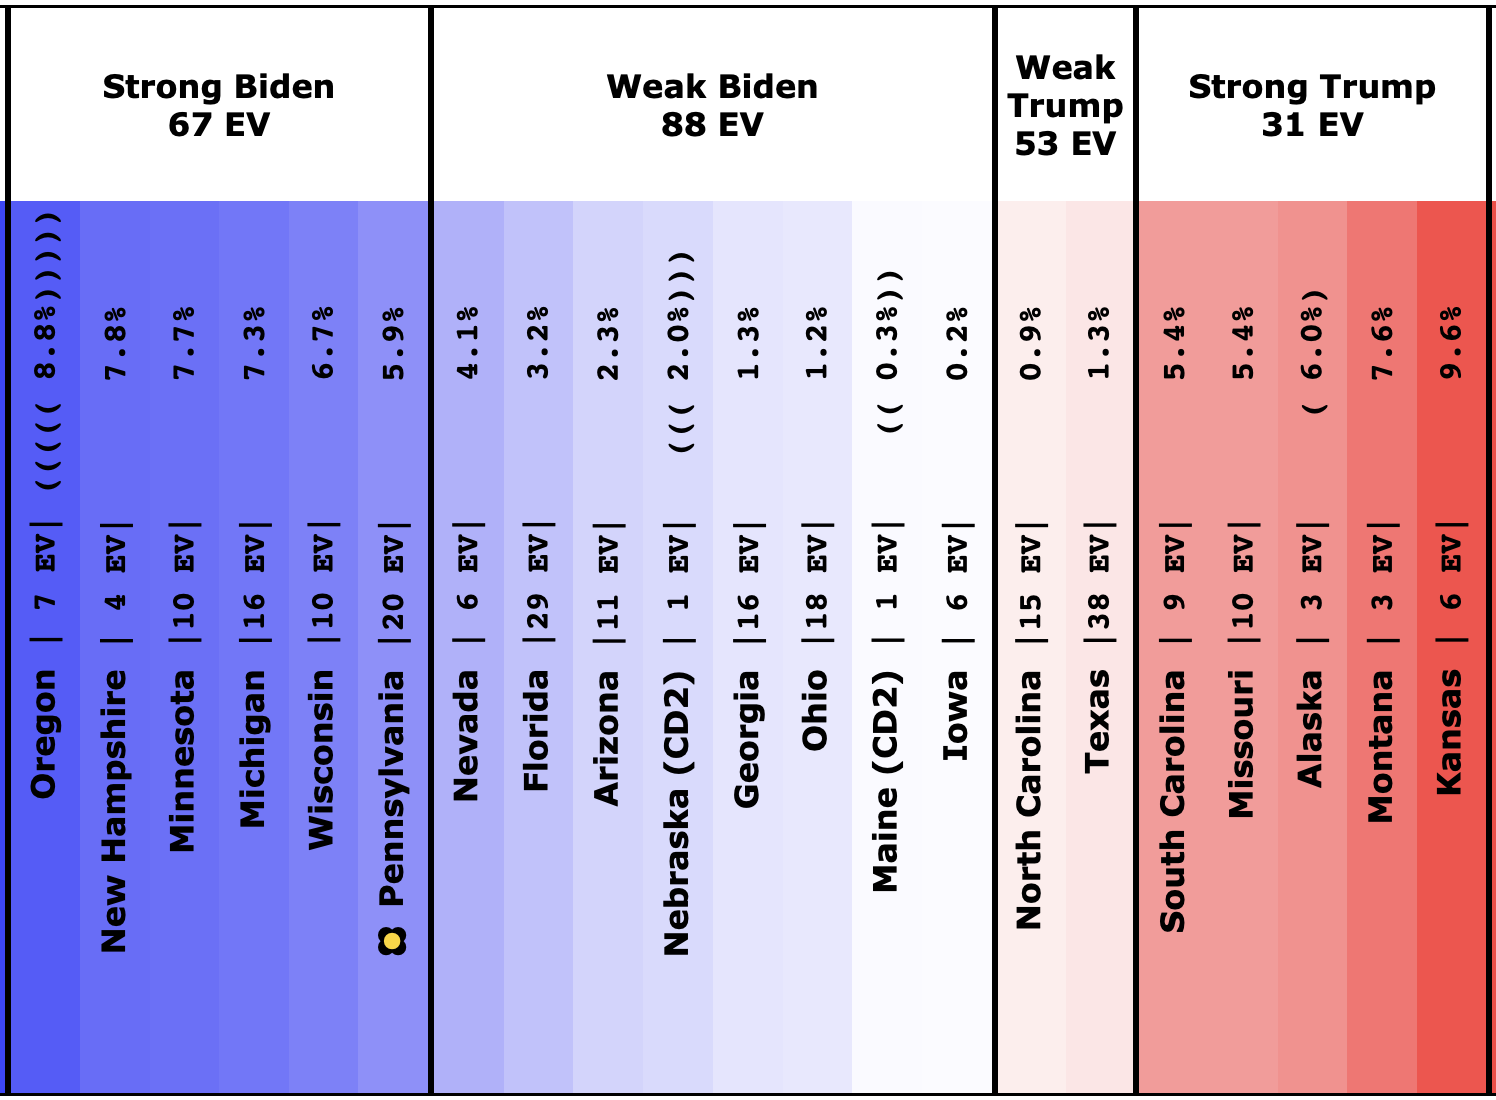
So yeah. As with 2016, watching Michigan, Wisconsin, and Pennsylvania makes sense.
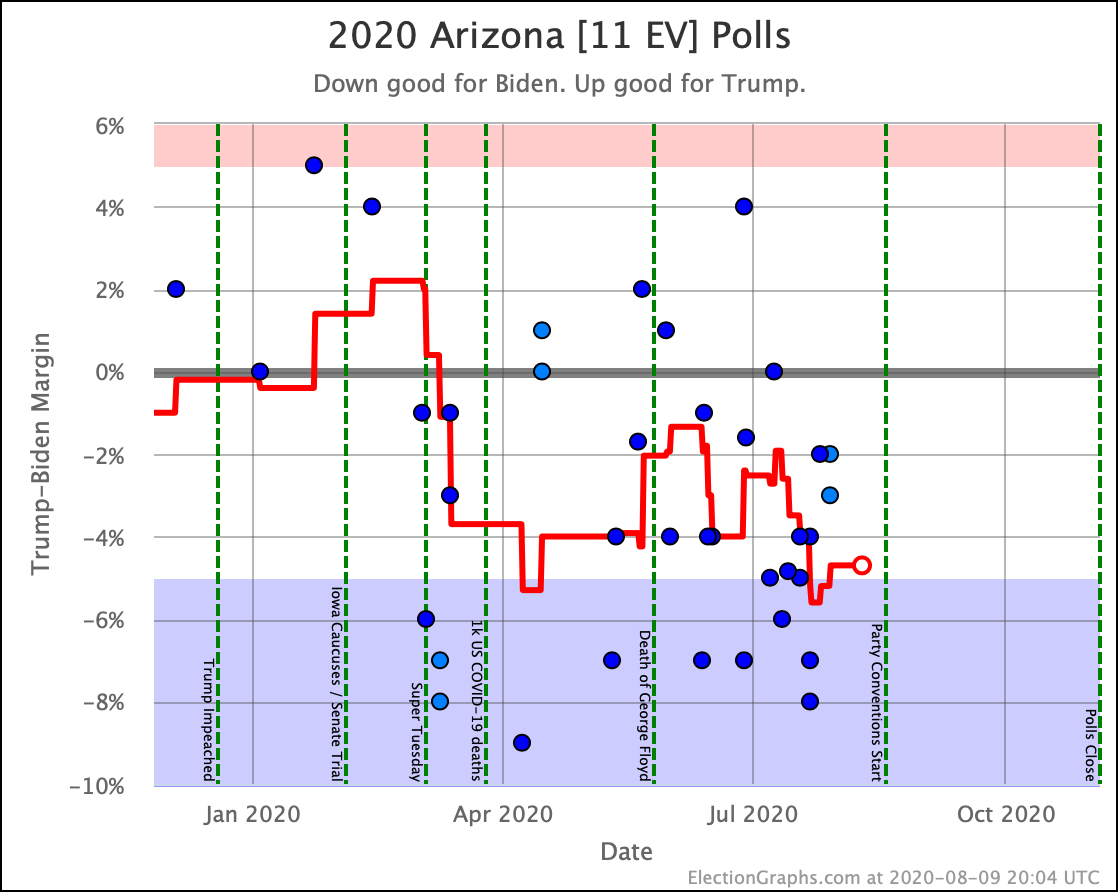
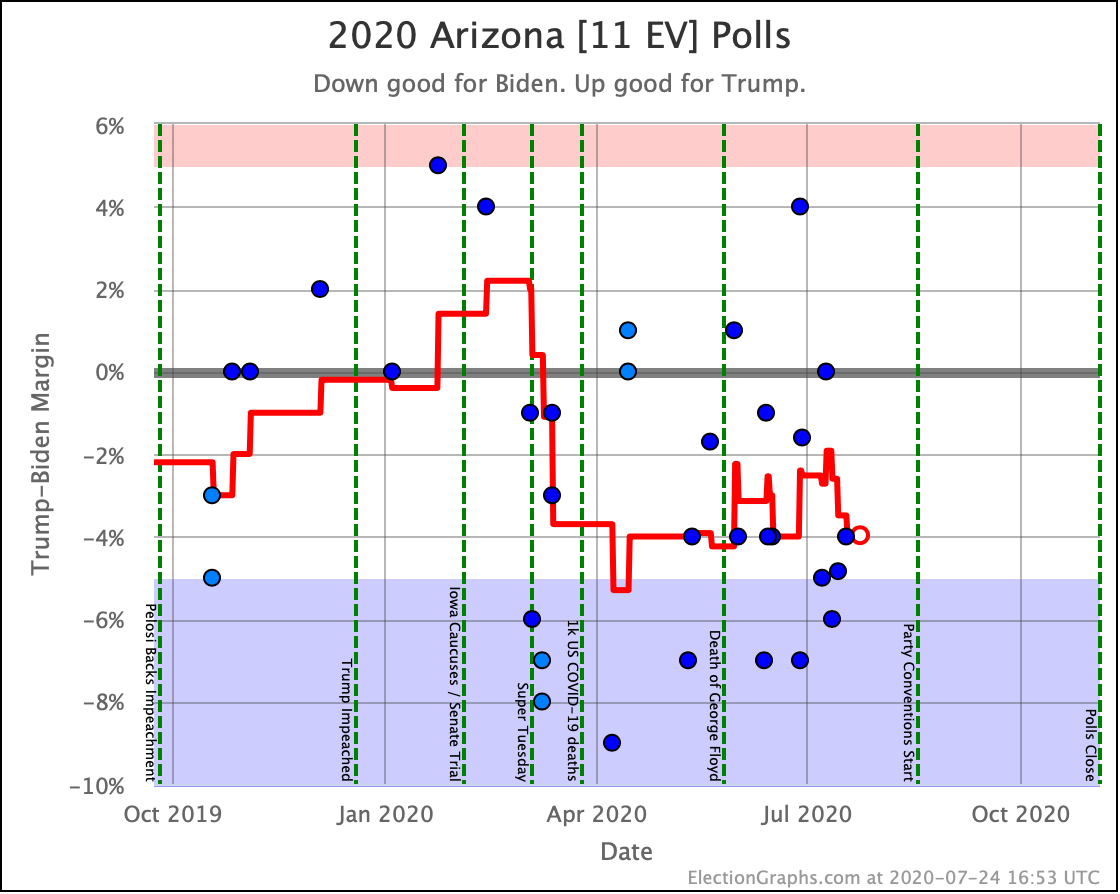
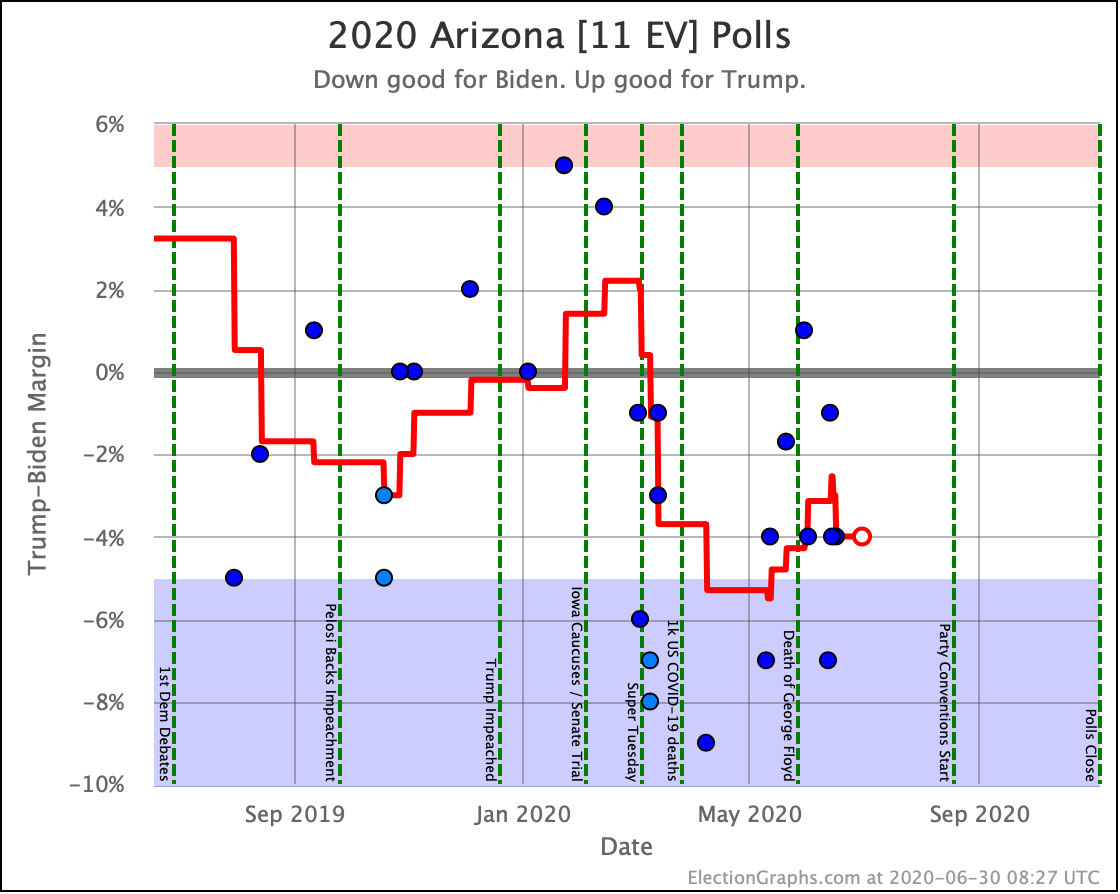
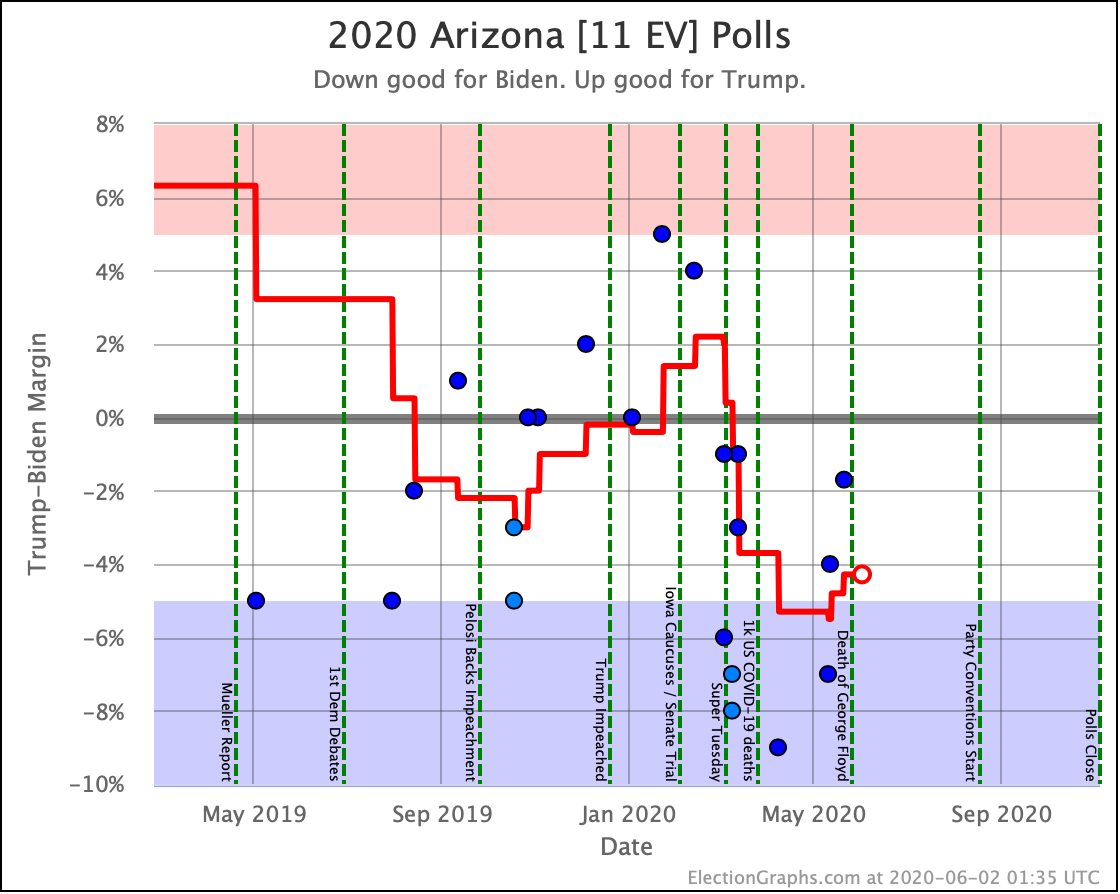
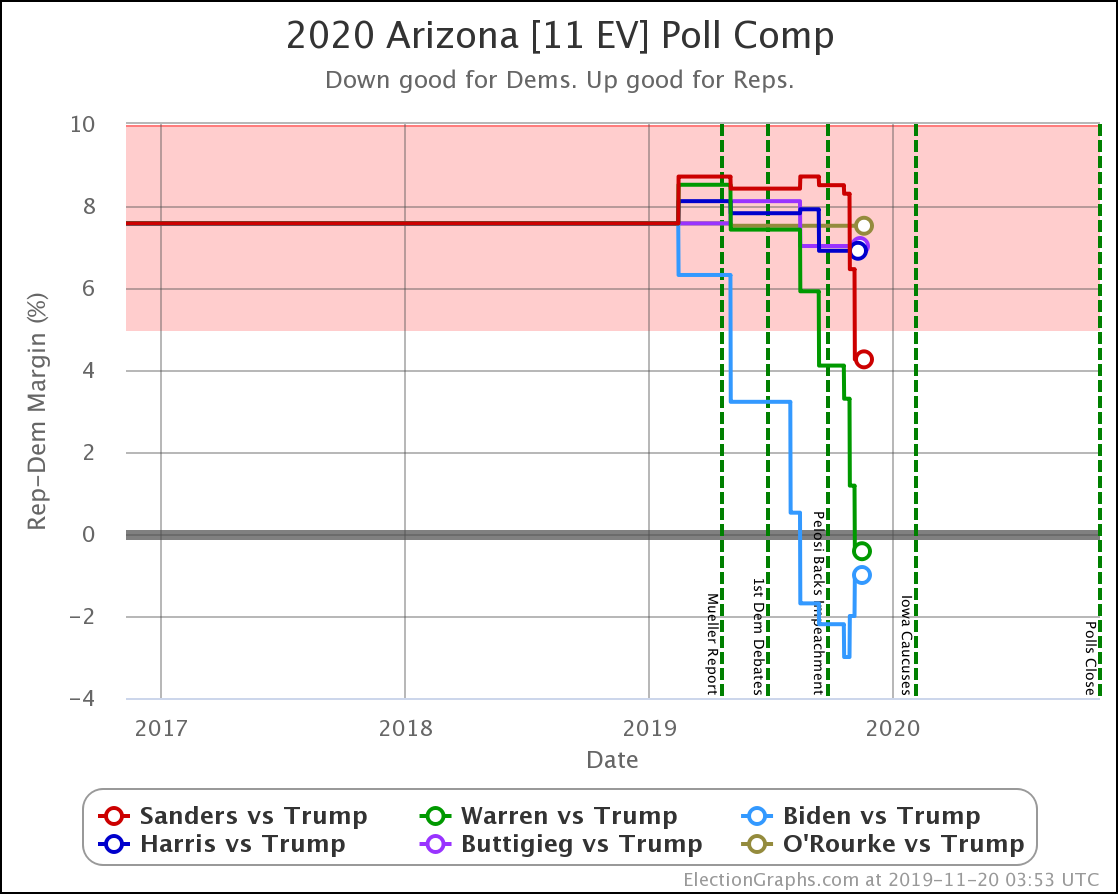
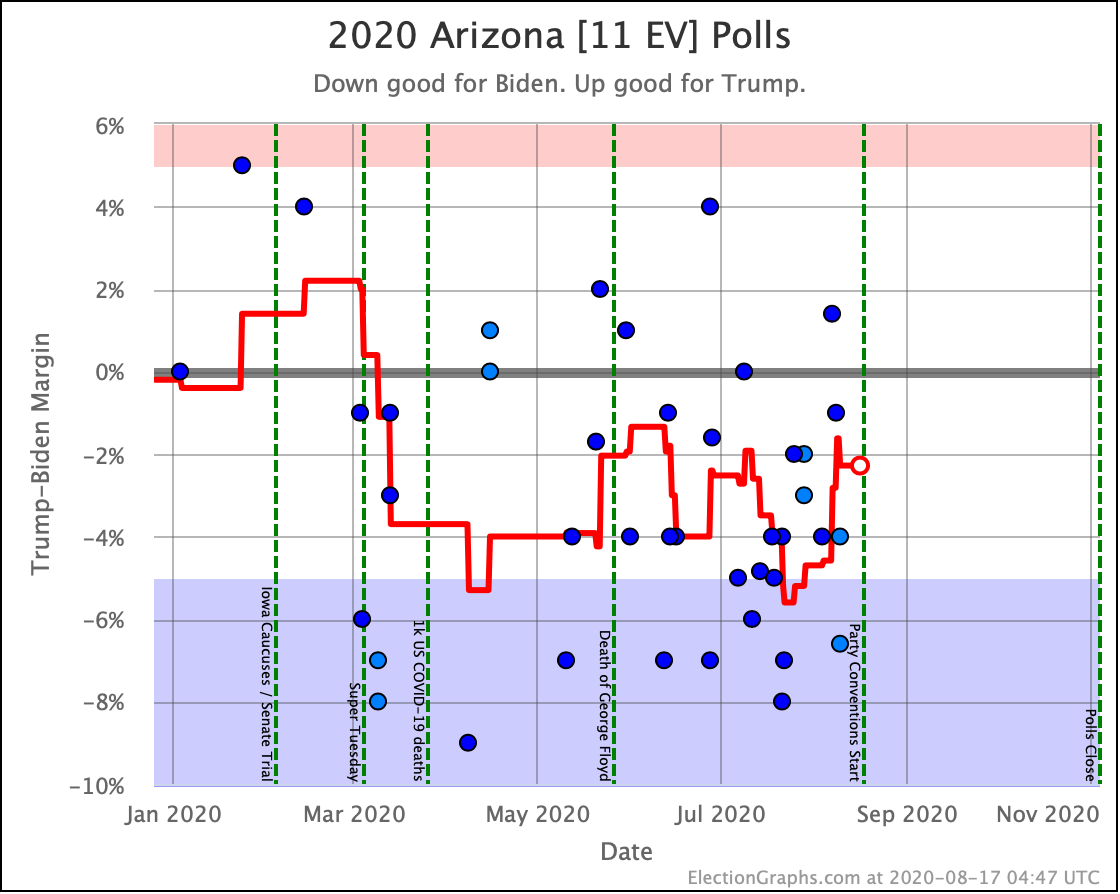
Arizona? Georgia? Ohio? Iowa? North Carolina? Texas?
Those are "stretch goals" for Biden. Great as a bonus, but he needs to concentrate on the bread and butter first.
By contrast, Trump NEEDS all those states… plus some. At the moment Trump can once again win ALL of the close states and still fall slightly short. He needs to also bring Pennsylvania back into the fold to win.
How do the metrics compare to where things were at this time in 2016?
| <79 Days Out> | 2016 | 2020 |
|---|---|---|
| Expected Case | Clinton by 86 | Biden by 182 |
| Tipping Point | Clinton by 3.0% | Biden by 5.9% |
By both metrics, Biden is doing significantly better than Clinton was at the same point in the race four years ago.
The best Clinton saw in the Expected Case in the last 79 days was a 178 electoral vote margin near the end of August. Biden is slightly ahead of that mark as well.
Clinton's best Tipping Point in the last 79 days was 6.0% though, which she didn't hit until October. Biden is below that level, and that 6.0% tipping point lead disappeared in less than a month in 2016.
So that serves as the usual warning of how quickly things can change.
78.7 days until polls start to close on election night, and the conventions are about to begin. The race is about to go into overdrive. Buckle up!
For more information:
This post is an update based on the data on the Election Graphs Electoral College 2020 page. Election Graphs tracks a poll-based estimate of the Electoral College. The charts, graphs, and maps in the post above are all as of the time of this post. Click through on any image for current interactive versions of the chart, along with additional details.
Follow @ElectionGraphs on Twitter or Election Graphs on Facebook to see announcements of updates. For those interested in individual poll updates, follow @ElecCollPolls on Twitter for all the polls as I add them. If you find the information in these posts informative or useful, please consider visiting the donation page.