It has been about 65 days since my last post about the general election. Oops. I've been intending to put these out more often as the election approaches, but haven't quite managed that.
In any case, the last post was shortly after both candidates clinched their nominations and Biden had a widely praised State of the Union speech.
Almost immediately after that blog post, Biden had a run of really good polls, and things started moving in his direction. Then Trump had a run of good polls, and things started moving back again. Then more recently, Biden had another good run with things moving back toward him.
In other words, lots of ups and downs. And to be honest, it is unclear how much of that is driven by ACTUAL movement in people's voting intention, vs how much is just noise in the polls, including a handful of prominent outliers that moved some critical state averages around.
If you look at the net change since that last post though, most metrics have moved toward Biden, although Trump is still leading, and is still significantly outpacing his polling performance in both 2016 and 2020.
If you just wanted a high level summary of where things are, you can stop now. The rest is going to be digging into more specifics.
Here we go.
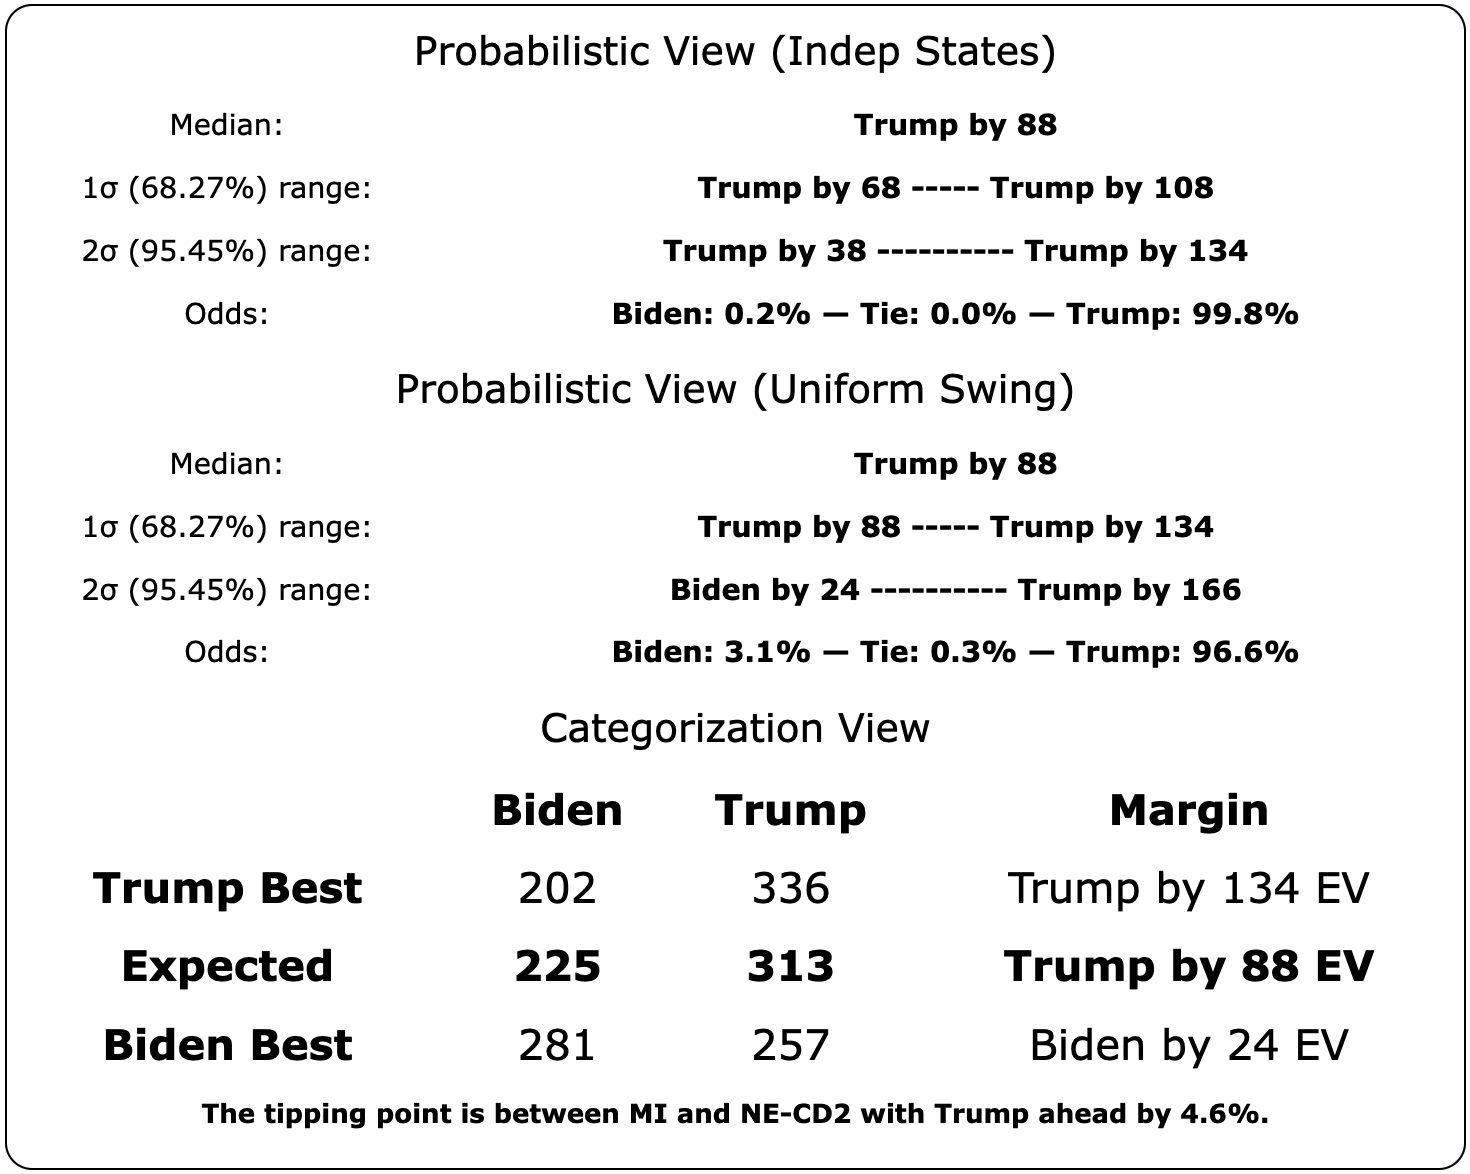
This is the overall summary. Keep in mind, everything here is based on CURRENT poll averages as of May 27th. It is essentially "If the election was today" or alternatively "if nothing changes between now and Election Day". But we know things will change.
I've started some work on adding probabilistic models that take into account the amount of time left before the election, but I've got a lot of work left before those are ready to share any results. In the meantime, just always keep in mind, that things can change dramatically in a few weeks, let alone a few months. Campaigns matter, and news events change opinions.
Having said that, if the election was today, Trump would be strongly favored. Biden would have to be hoping for the polls to be significantly underestimating the Democrat this time, rather than underestimating the Republican as has been the case the last two cycles.
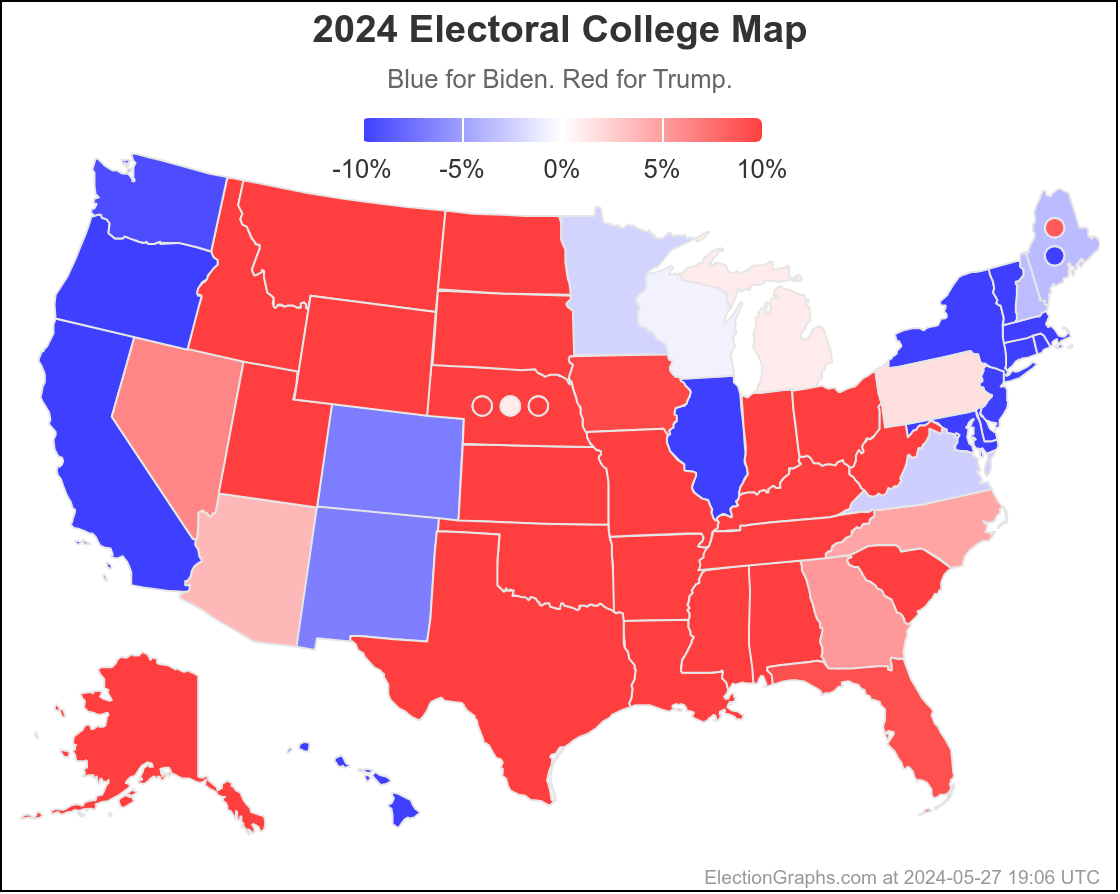
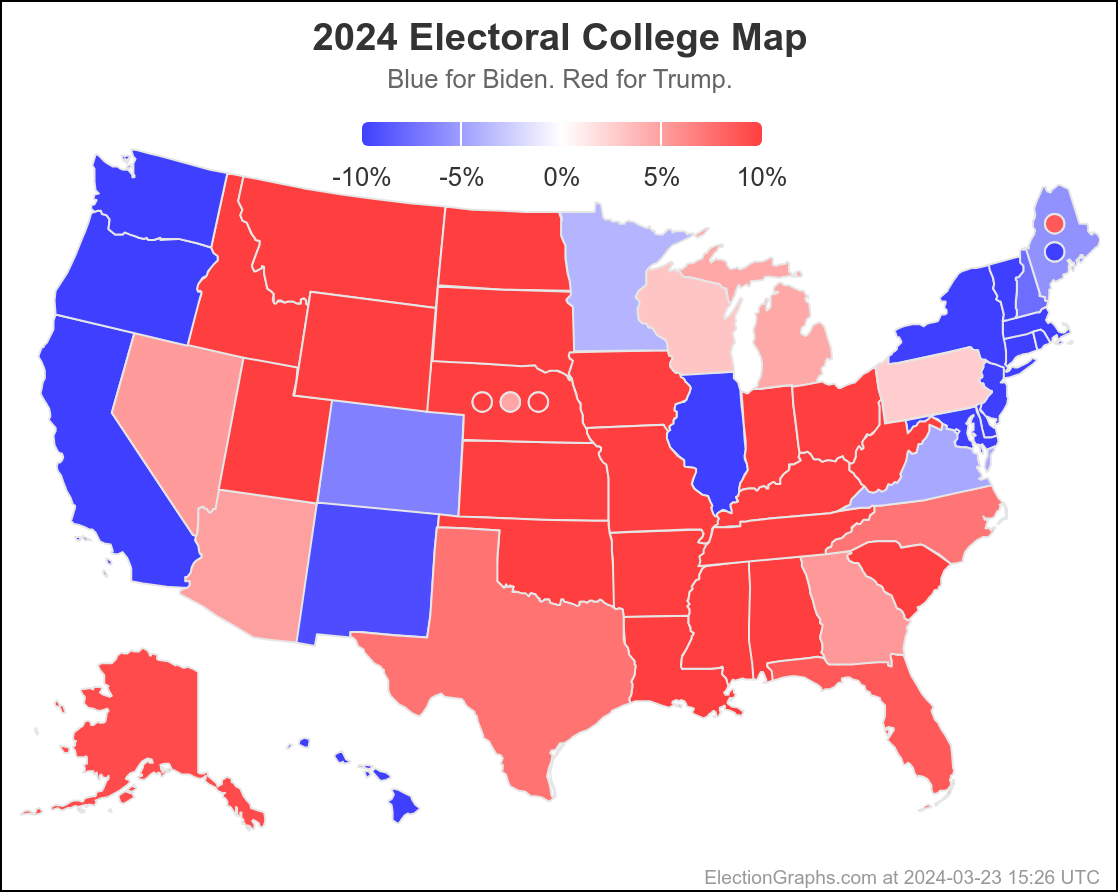
As of now, the map looks like this.
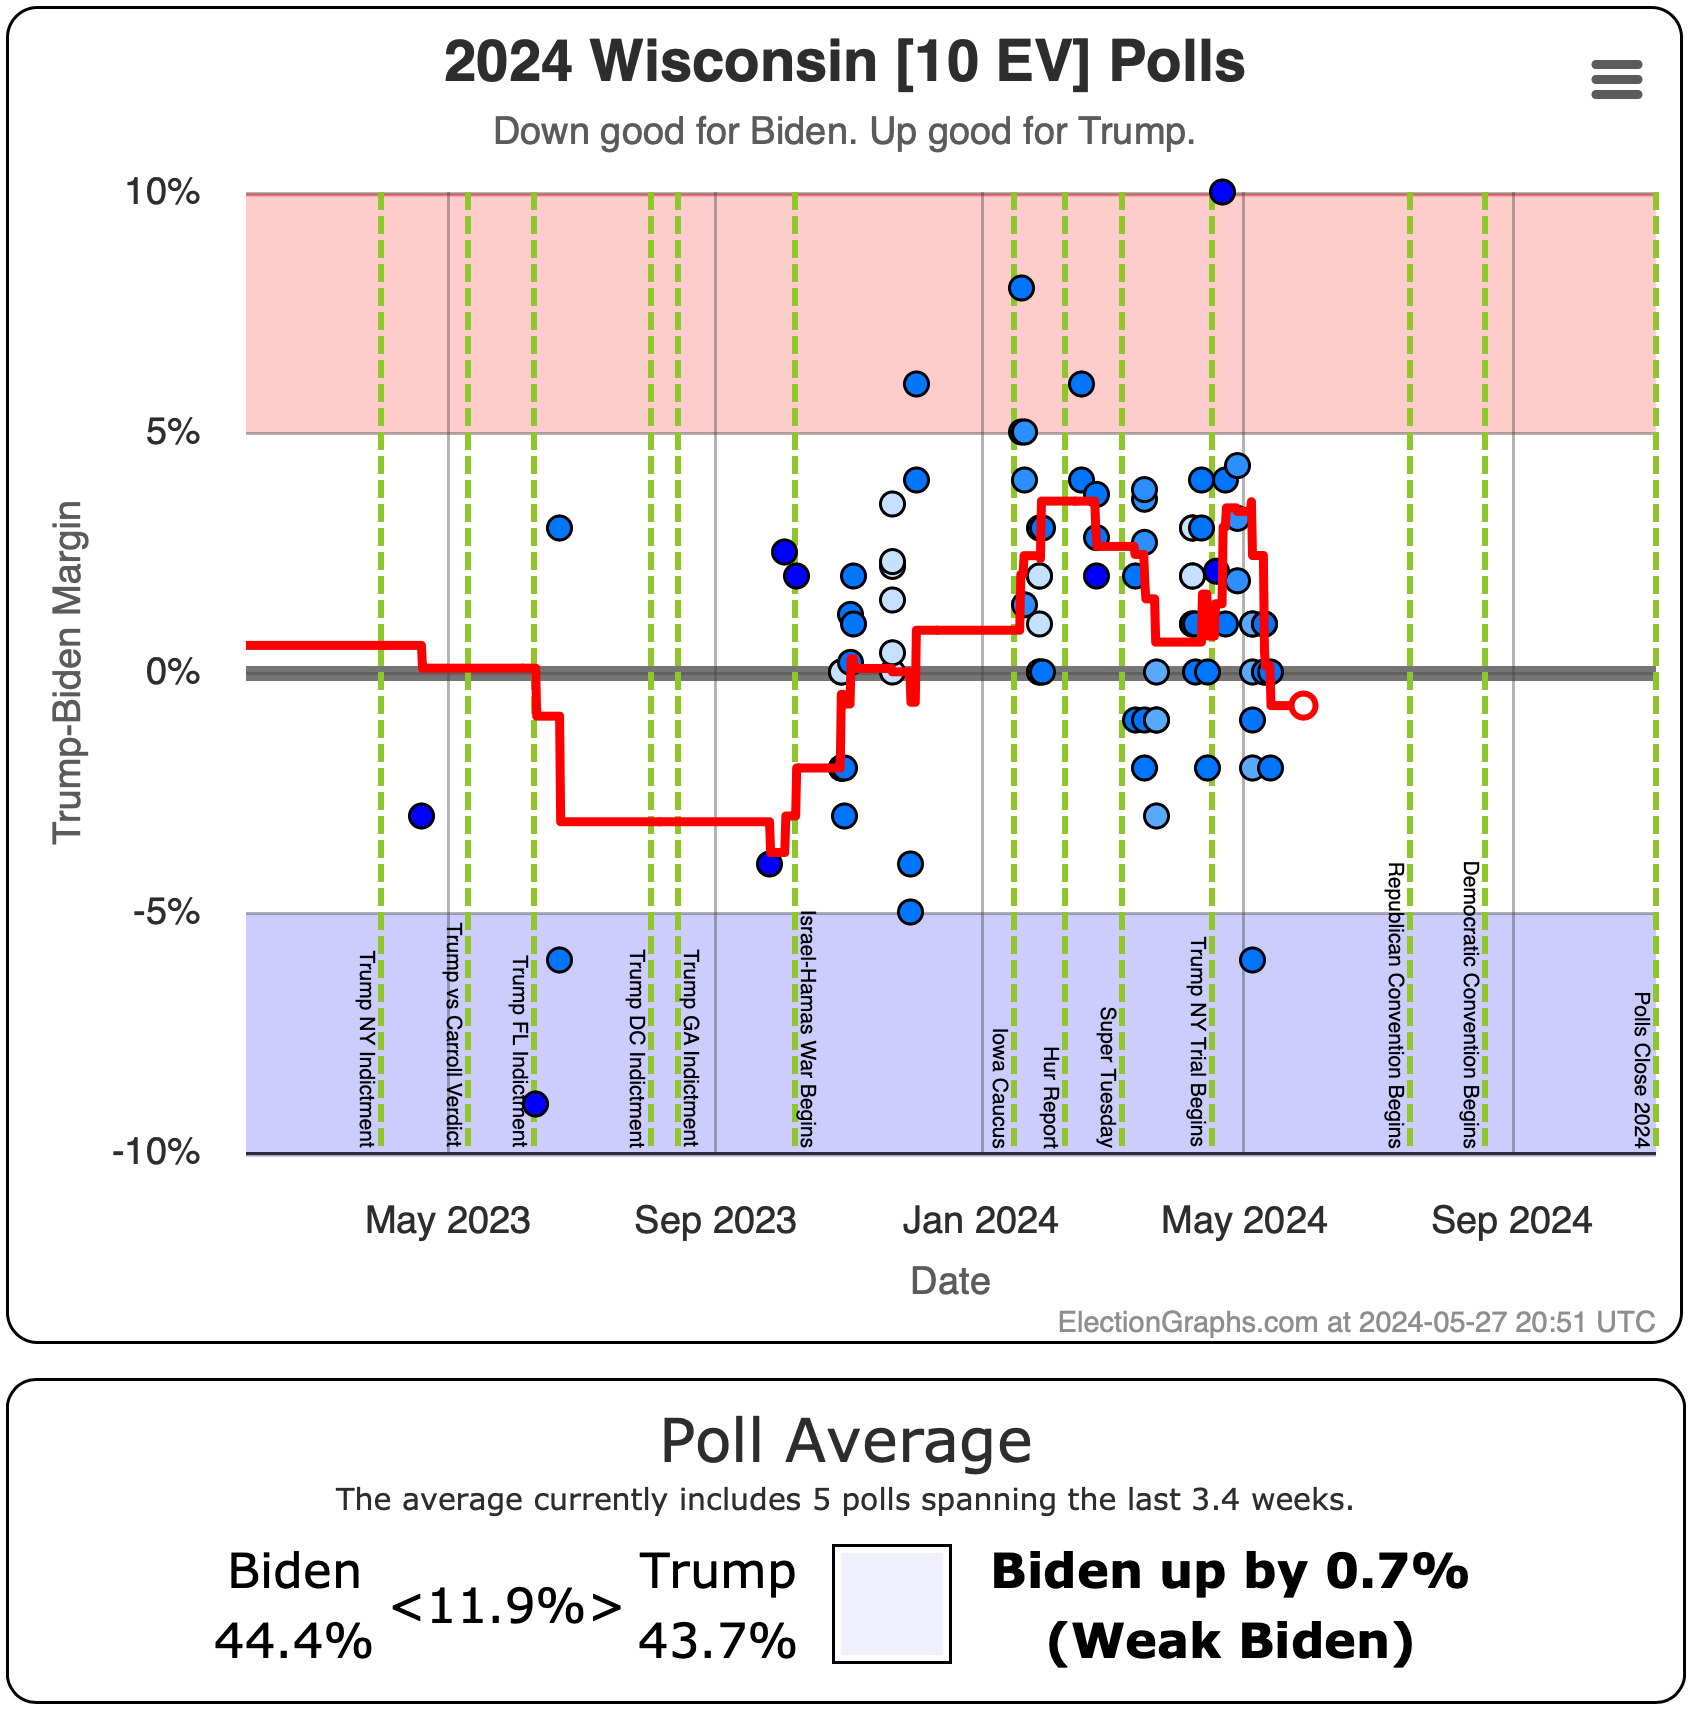
Since last time only one state has crossed the center line. That would be Wisconsin moving from Weak Trump to Weak Biden.
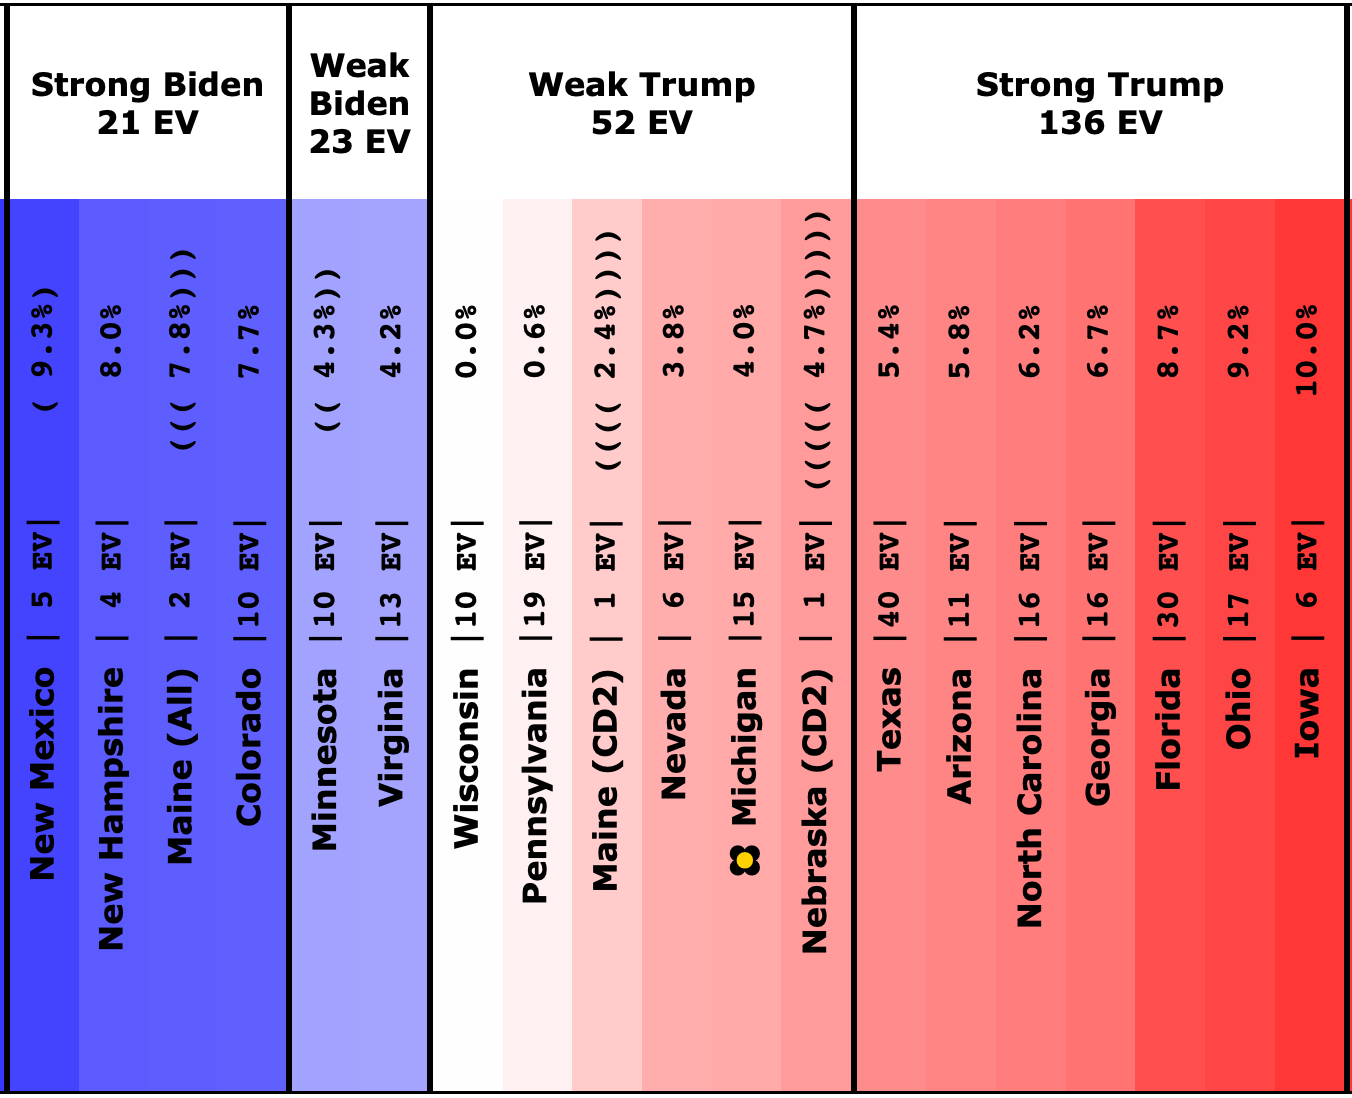
But as we have done the last few updates, lets look at how all of the even remotely close states (any with margins under 10%) have moved since last time.
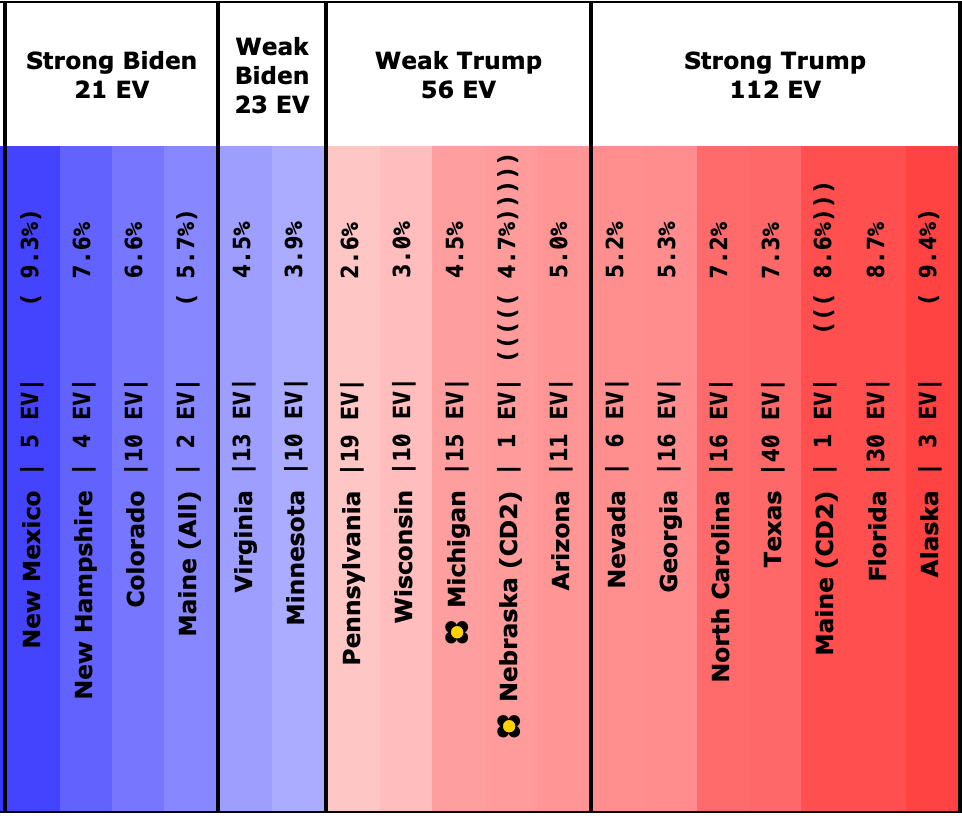
Here is where things were on March 23rd:
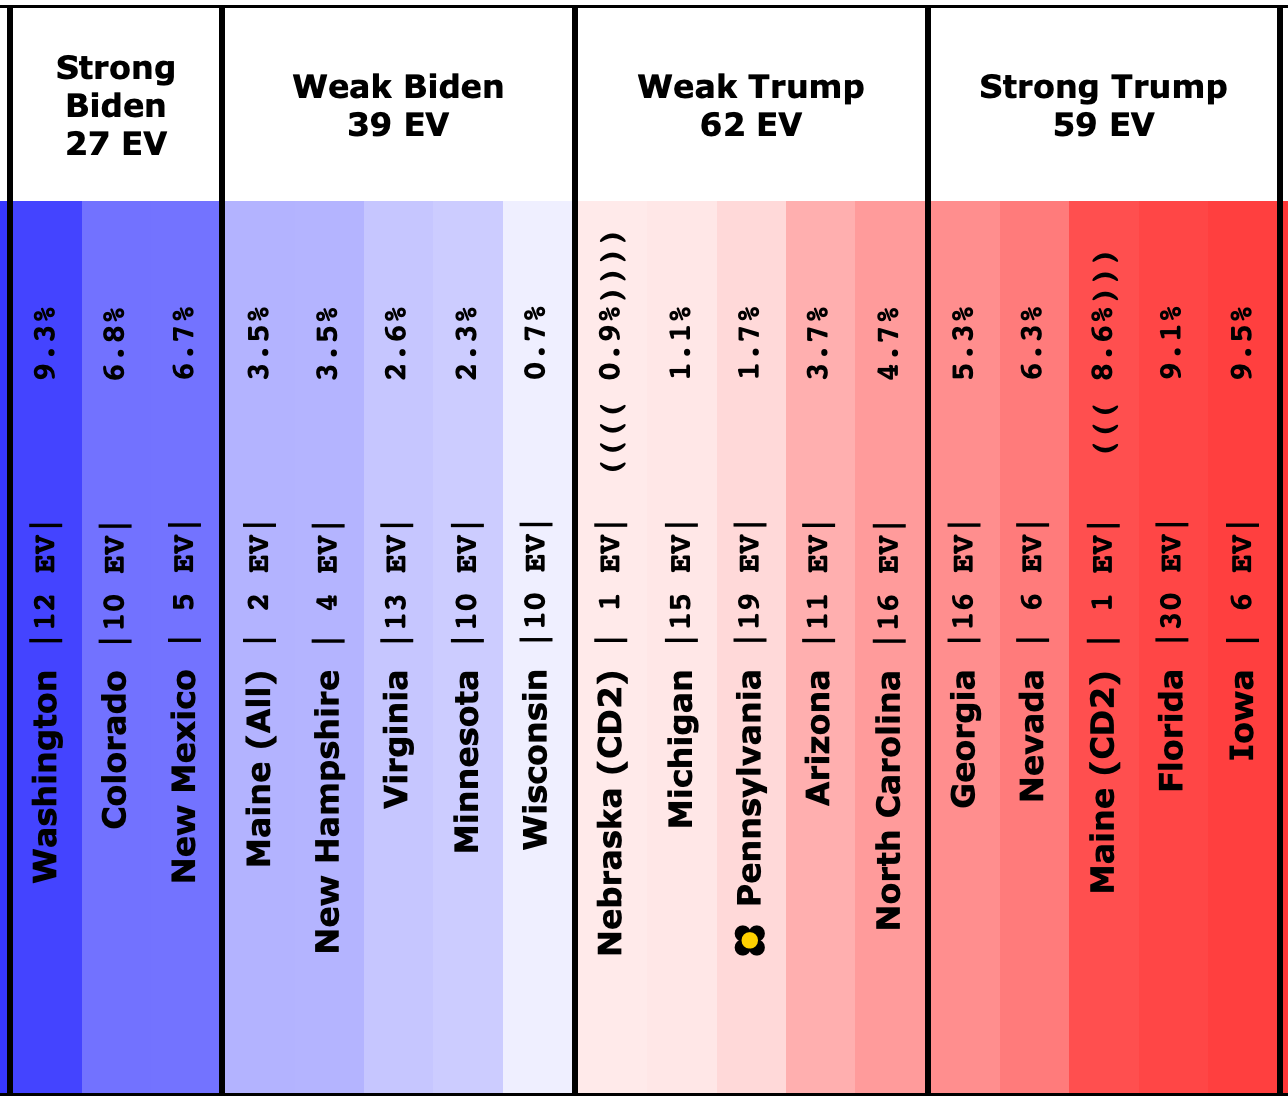
And here they are as of May 28th:
So lets check out all the deltas:
Net movement toward Trump:
- Washington (12 EV): Biden by 13.7% -> Biden by 9.3% (Trump+4.4%)
- New Hampshire (4 EV): Biden by 7.6% -> Biden by 3.5% (Trump+4.1%)
- Texas (40 EV): Trump by 7.3% -> Trump by 10.0% (Trump+2.7%)
- New Mexico (5 EV): Biden by 9.3% -> Biden by 6.7% (Trump+2.6%)
- Maine-All (2 EV): Biden by 5.7% -> Biden by 3.5% (Trump+2.2%)
- Virginia (13 EV): Biden by 4.5% -> Biden by 2.6% (Trump+1.9%)
- Alaska (3 EV): Trump by 9.4% -> Trump by 11.2% (Trump+1.8%)
- Minnesota (10 EV): Biden by 3.9% -> Biden by 2.3% (Trump+1.6%)
- Nevada (6 EV): Trump by 5.2% -> Trump by 6.3% (Trump+1.1%)
- Florida (30 EV): Trump by 8.7% -> Trump by 9.1% (Trump+0.4%)
No net movement:
- Georgia (16 EV): Trump by 5.3%
- Maine-CD2 (1 EV): Trump by 8.6%
Net movement toward Biden:
- Colorado (10 EV): Biden by 6.6% -> Biden by 6.8% (Biden+0.2%)
- Pennsylvania (19 EV): Trump by 2.6% -> Trump by 1.7% (Biden +0.9%)
- Arizona (11 EV): Trump by 5.0% -> Trump by 3.7% (Biden+1.3%)
- Iowa (6 EV): Trump by 11.1% -> Trump by 9.5% (Biden+1.6%)
- North Carolina (16 EV): Trump by 7.2% -> Trump by 4.7% (Biden+2.5%)
- Michigan (15 EV): Trump by 4.5% -> Trump by 1.1% (Biden+3.4%)
- Wisconsin (10 EV): Trump by 3.0% -> Biden by 0.7% (Biden+3.7%)
- Nebraska-CD2 (1 EV): Trump by 4.7% -> Trump by 0.9% (Biden+3.8%)
Now, more of these actually moved toward Trump than toward Biden, so why do I say that overall things have been good for Biden since the last update?
Well, it is because of WHICH states moved toward Biden. Specifically, the key battleground states of Wisconsin, Michigan, and Pennsylvania have all moved in Biden's direction, as well as Nebraska-CD2 (which would be key in some scenarios). Arizona and North Carolina also potentially make a big difference if Biden can actually make them competitive.
It is not great for Biden that New Hampshire, Virginia, and Minnesota are as close as they are. He needs to win those. But pretty much all Biden winning scenarios require keeping Wisconsin on his side of the line now that he has it back there, and pulling Michigan and Pennsylvania over as well.
So the fact that those states have moved in his direction is key in terms of how this race is evolving.
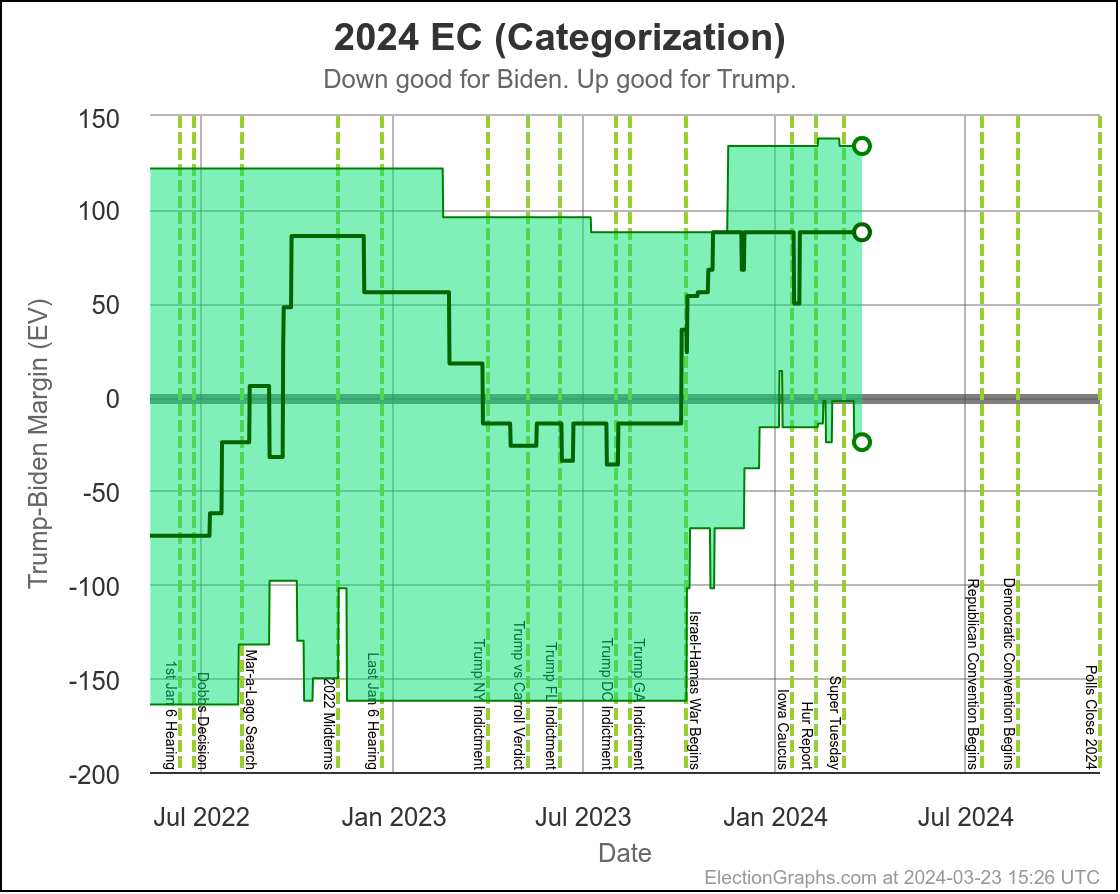
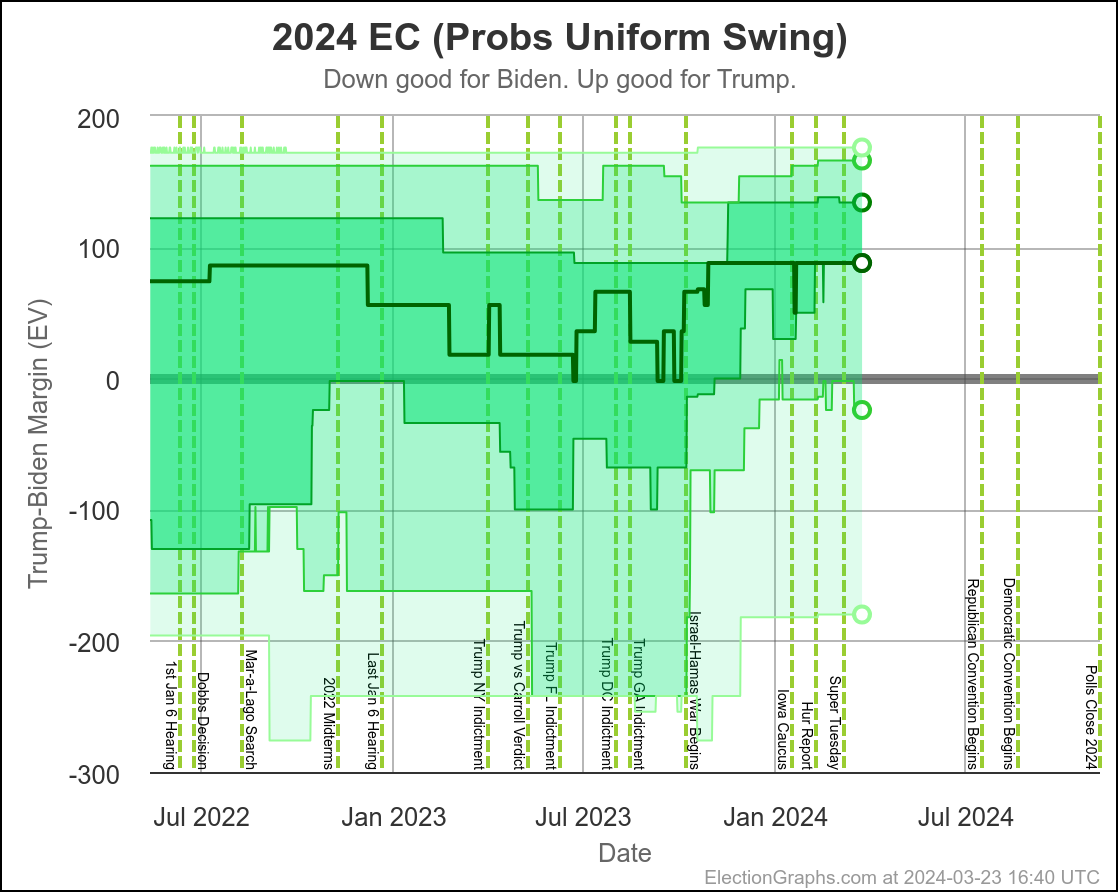
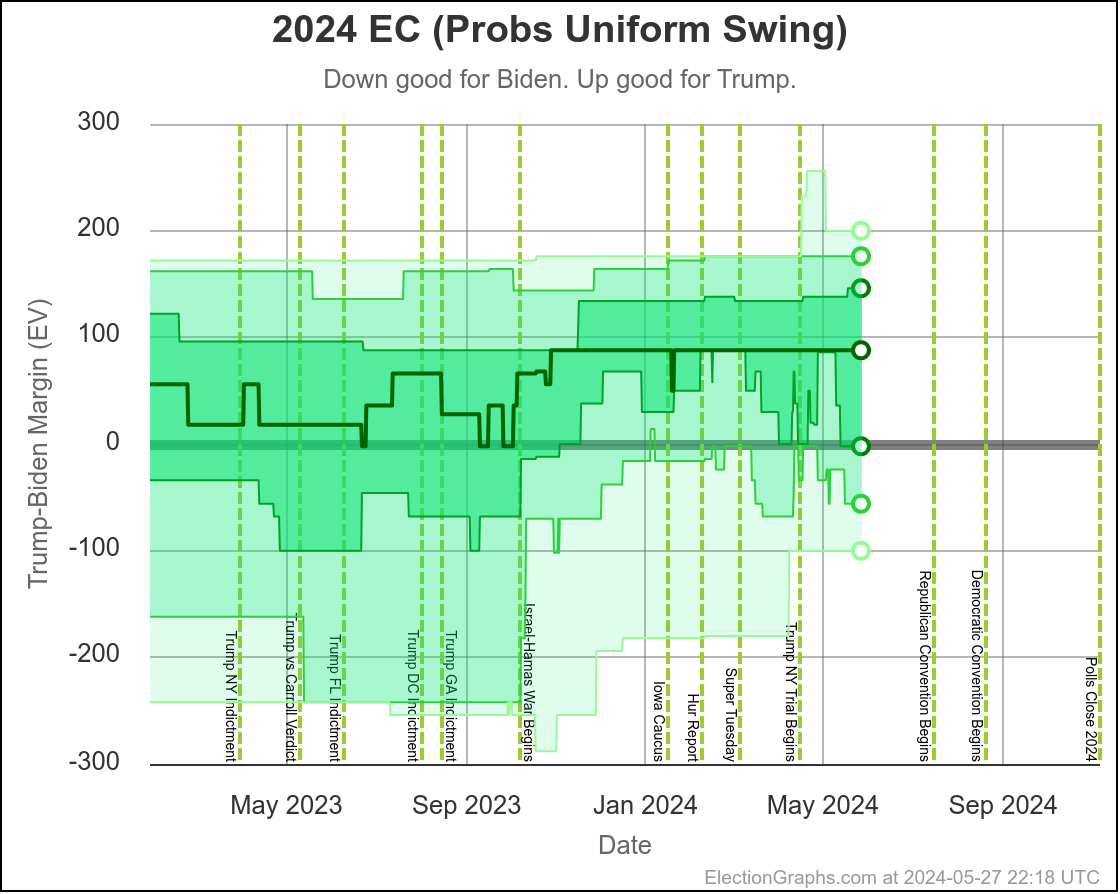
Biden is still behind. Here is the chart showing the range of Electoral college possibilities just taking the polls at face value and assuming anywhere with a margin less than 5% could go either way:
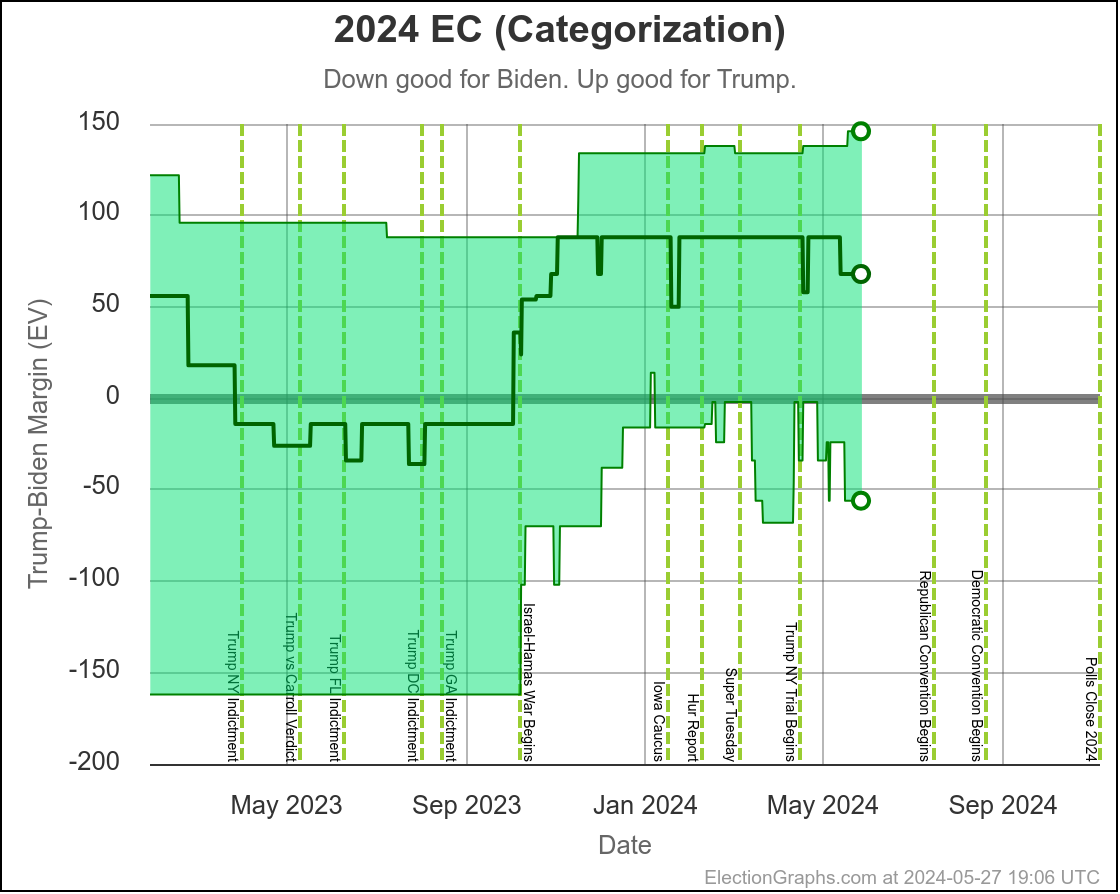
Biden is doing a bit better than he has, but Trump still has a very strong position here. To win here Biden has to keep every state he leads in the polls, plus win Nebraska-CD2, Michigan, and Pennsylvania.
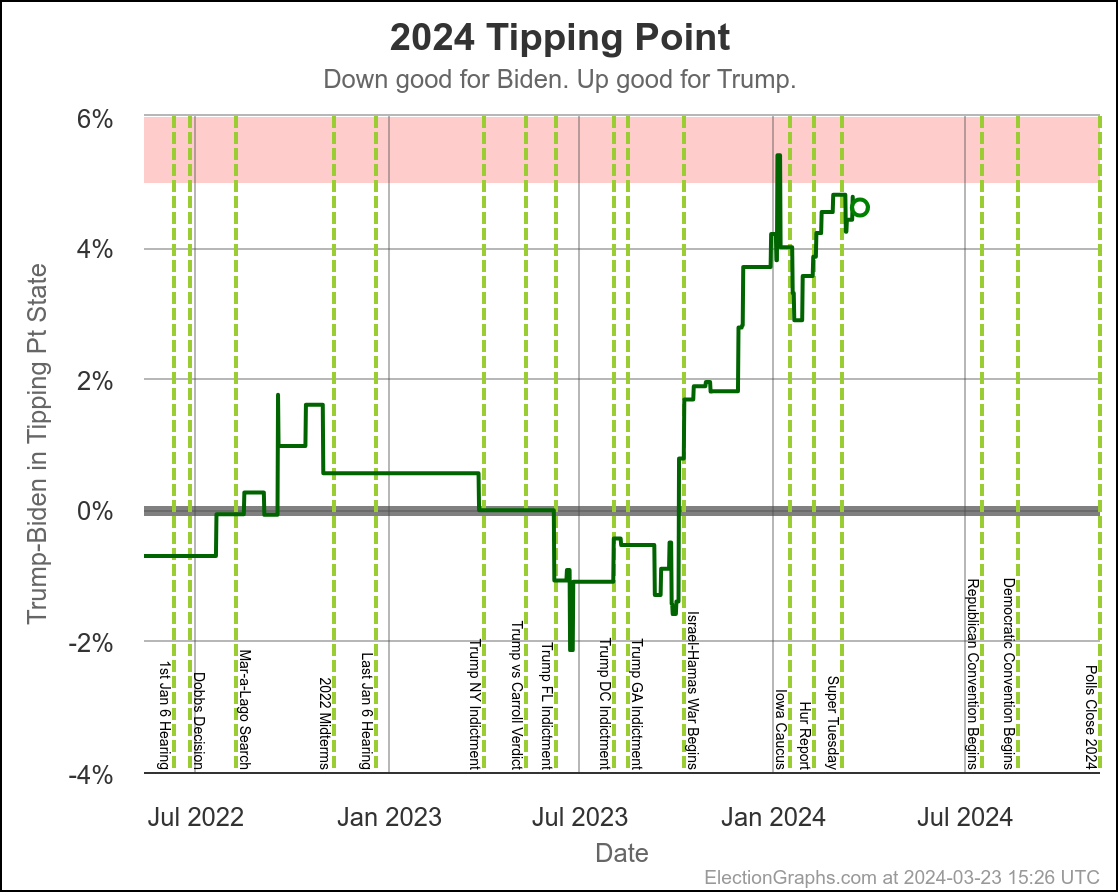
How hard is that? This is where the tipping point chart comes in. It shows the margin in the state that puts the winner over the top:
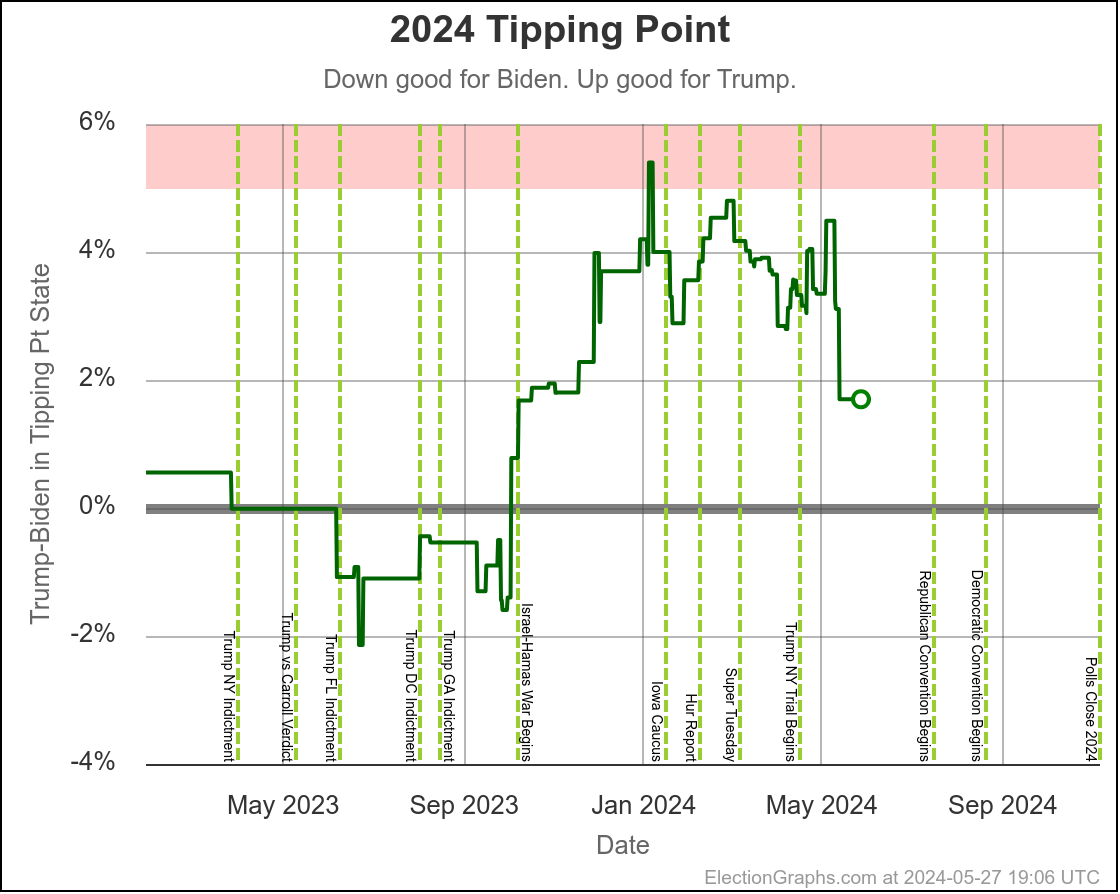
As you can see, Trump's lead is the smallest it has been since mid-October. But that is due to a recent spike toward Biden that only came in from the last week or so of new polls (covering times from a little earlier than that).
Will it last? The movements toward Biden in January and March did NOT last. After a few weeks, the trend reversed and headed back in Trump's direction. The magnitude of this change does seem to be larger. But as usual only time will tell.
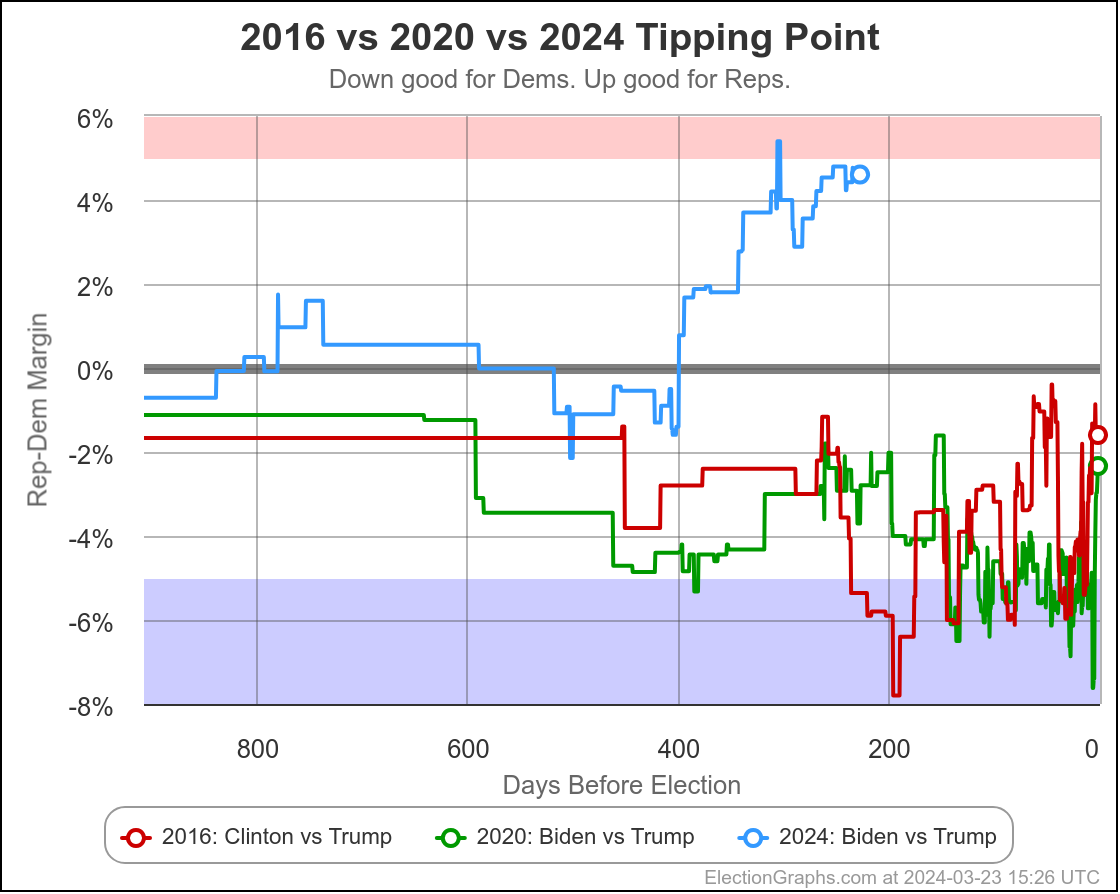
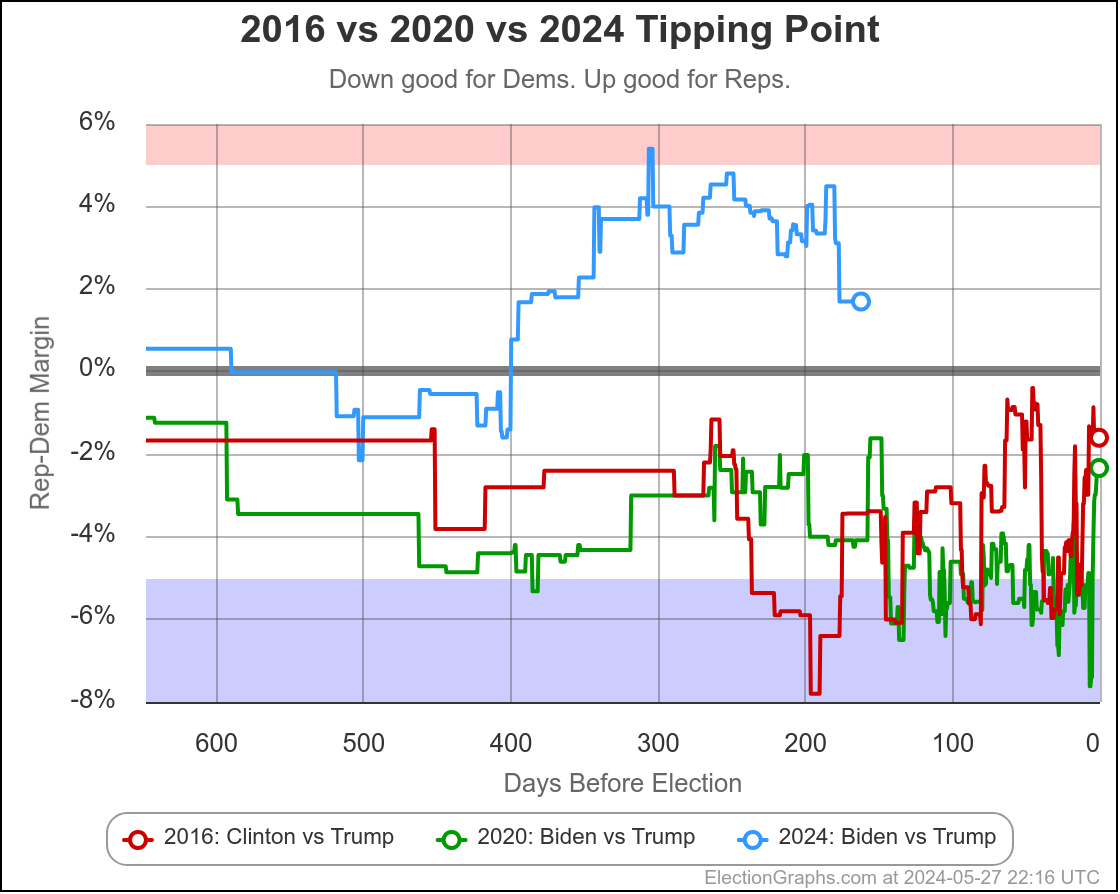
In the mean time, while Biden is doing a bit better than before, a comparison with 2016 and 2020 puts things in perspective:
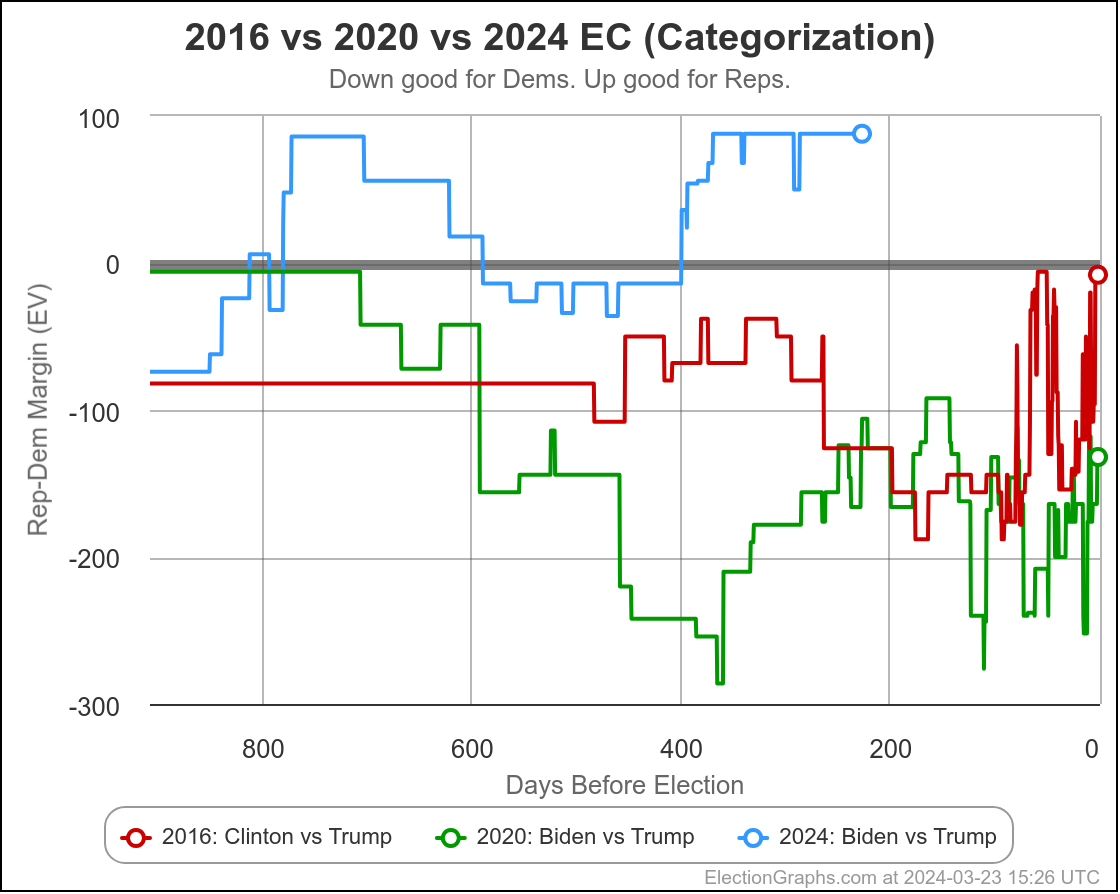
And here is that same comparison, but with the electoral college margin instead of the tipping point:
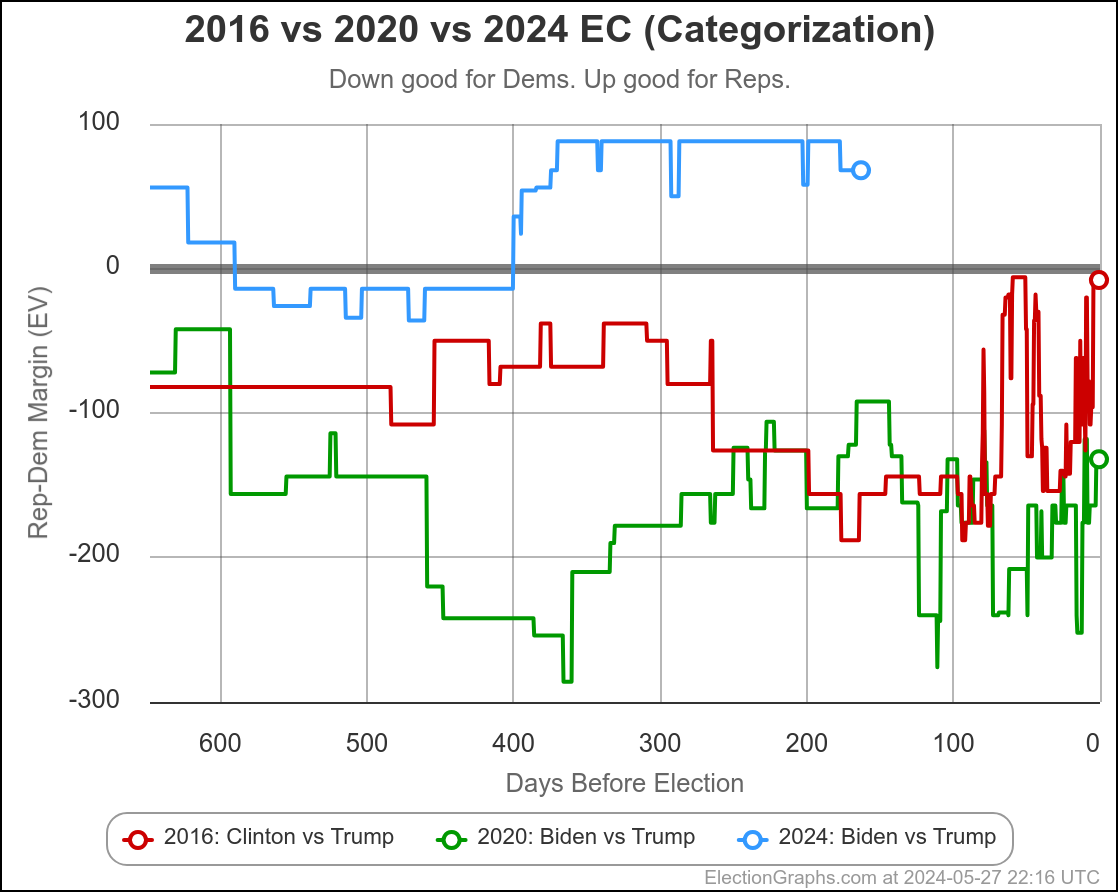
Trump is still WAY ahead of where he was in both 2016 and 2020. And of course he won in 2016, and in 2020 Biden just barely won. In both of those years polls underestimated Trump. If they are underestimating him again, he is positioned for a very substantial win. (If the election was today.) Of course this time the polls may be underestimating Biden. We won't really know until the votes are counted.
A race with a tipping point less than 5% (in either direction) is a competitive race. And we still have about 160 days. A lot can and will happen.
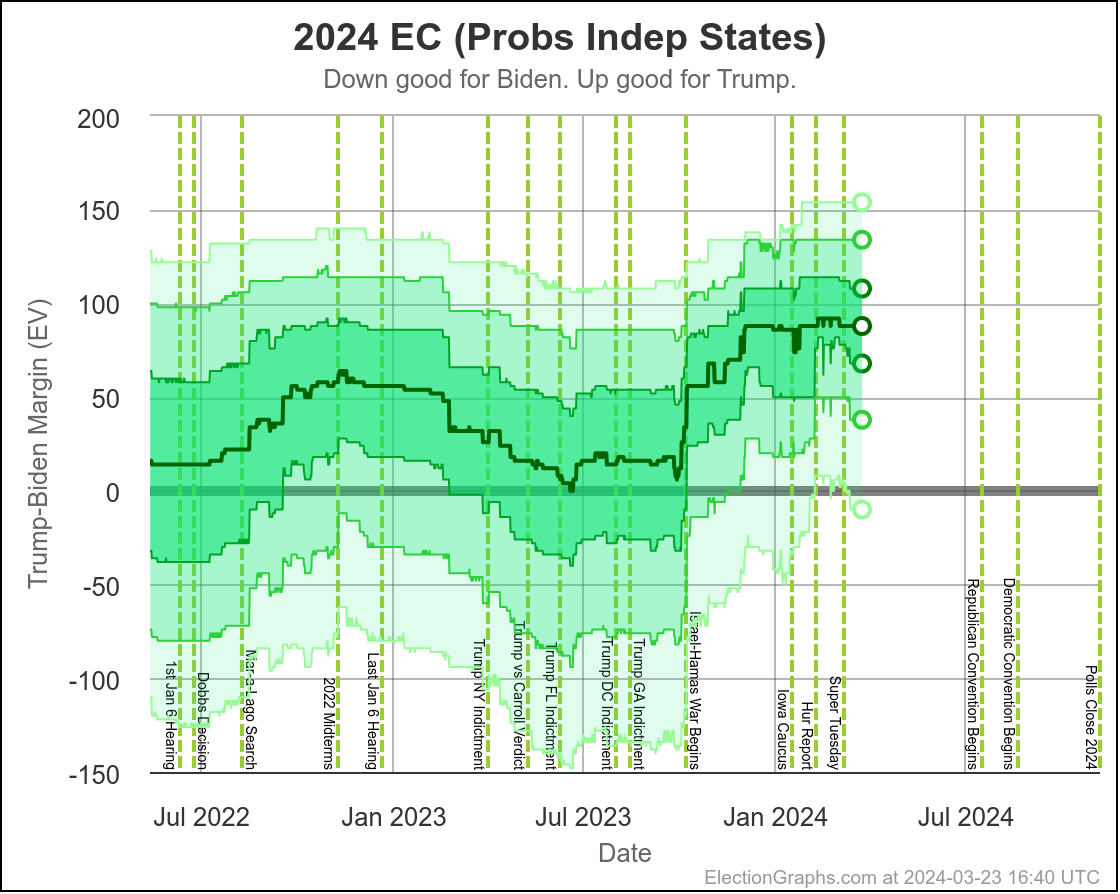
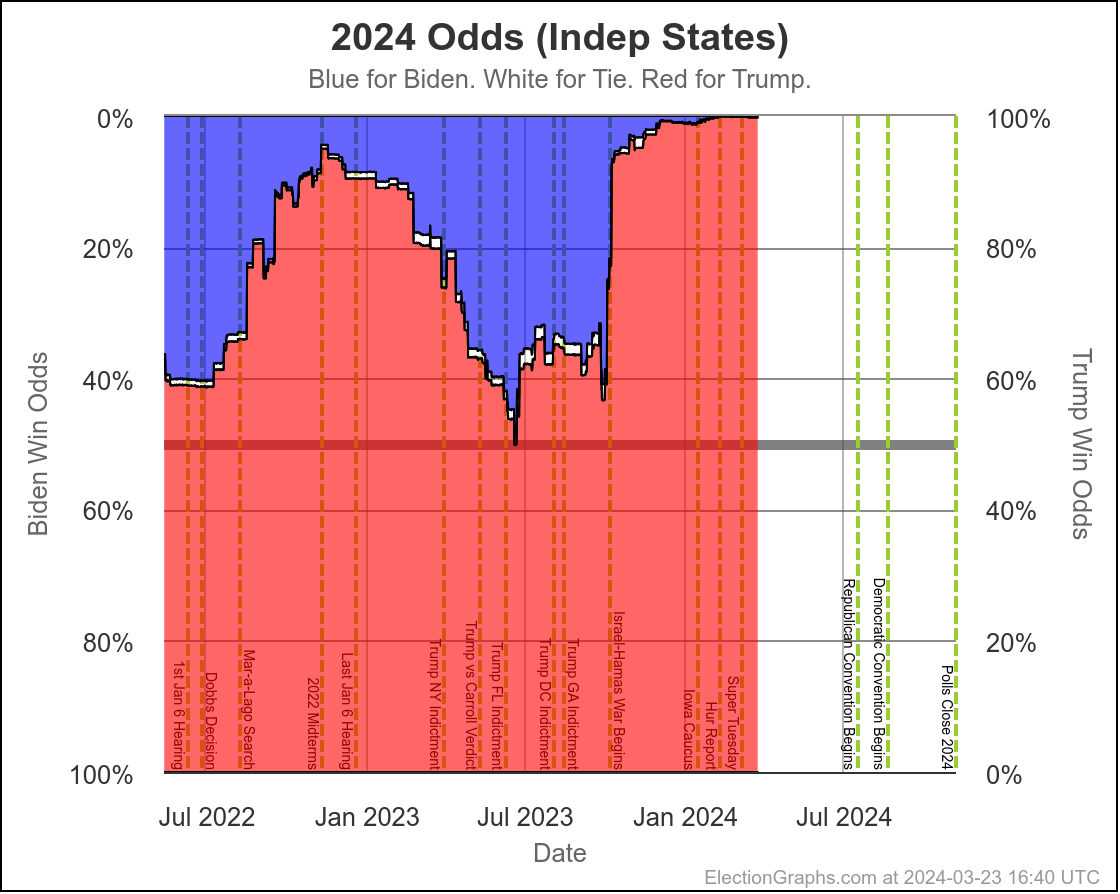
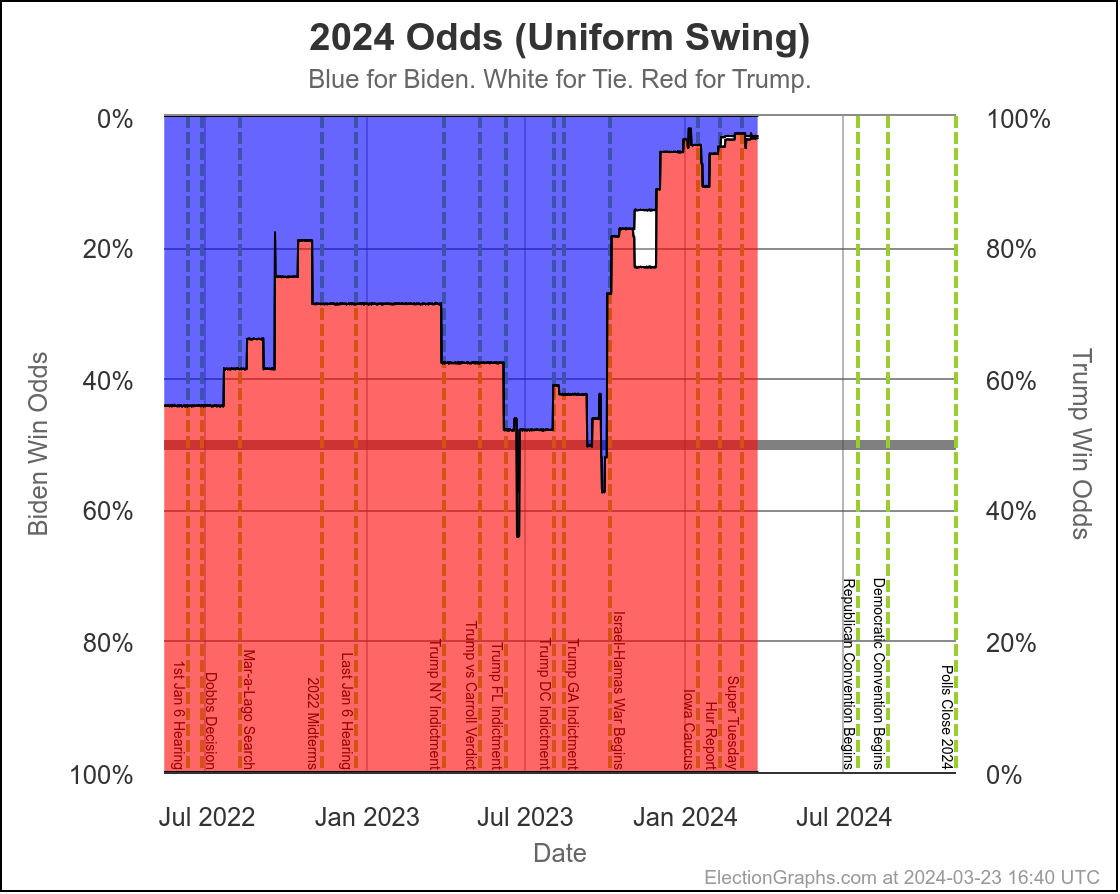
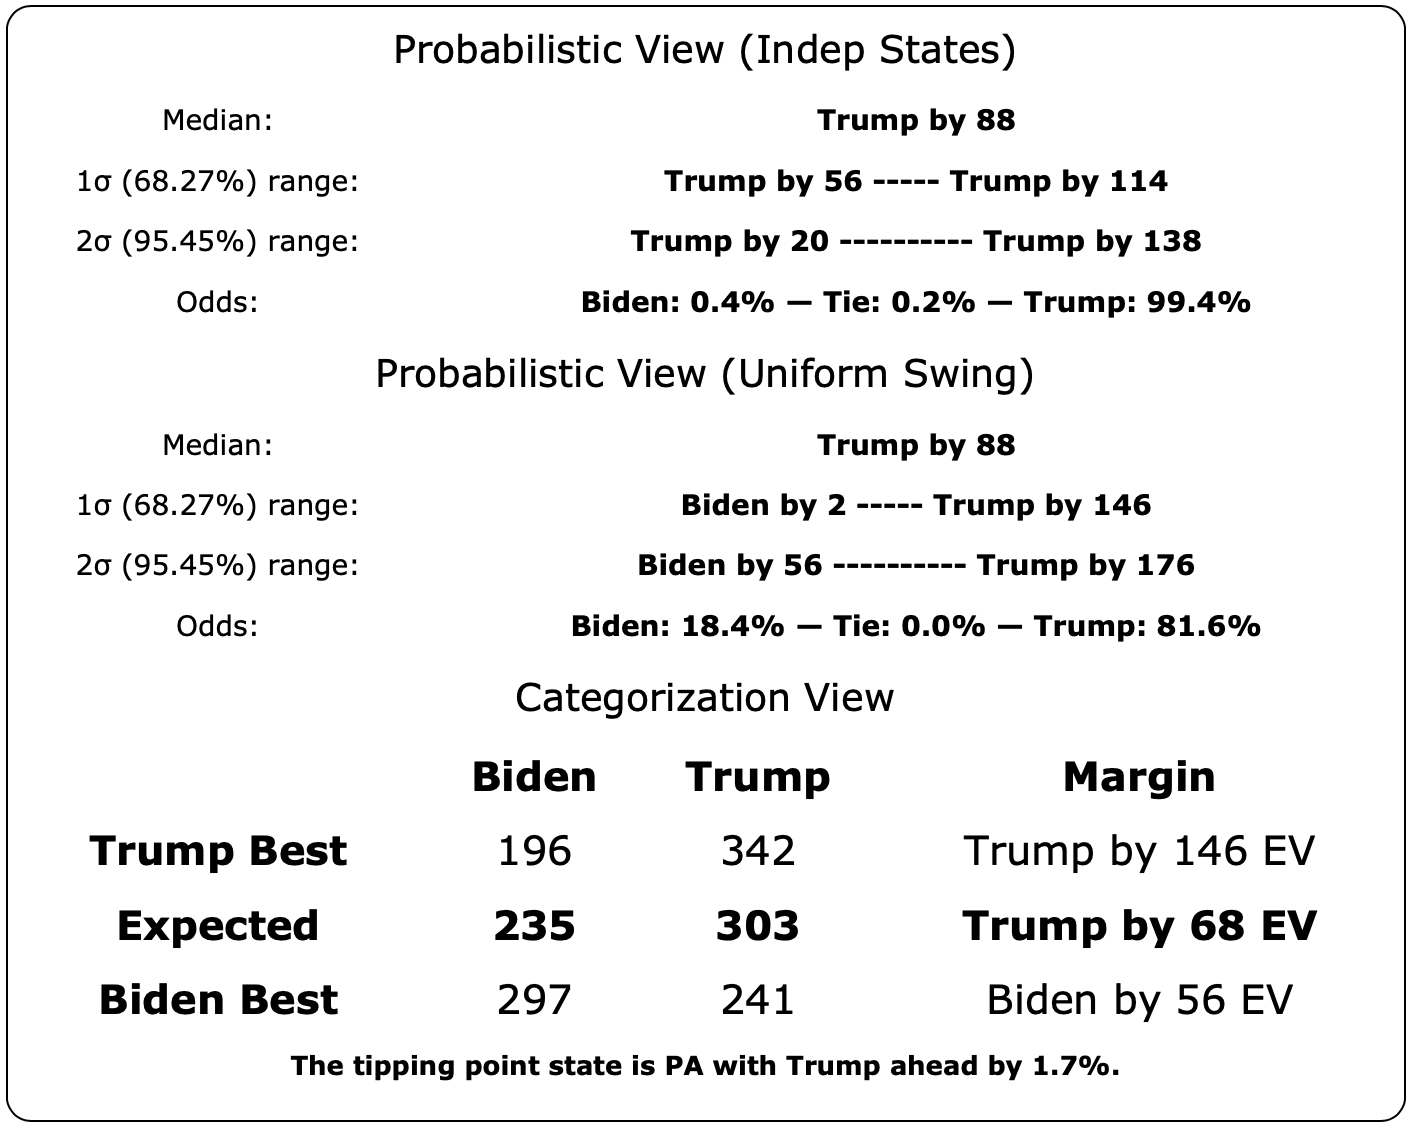
Next up, lets look at the two statistical models I do looking at how far off the EG poll average was from the final results in 2008-2020, and using that to estimate ranges for this time. One of these assumes the errors in all the states are completely independent from each other, the other assumes all the states will have the same error. The truth will of course be somewhere in between.
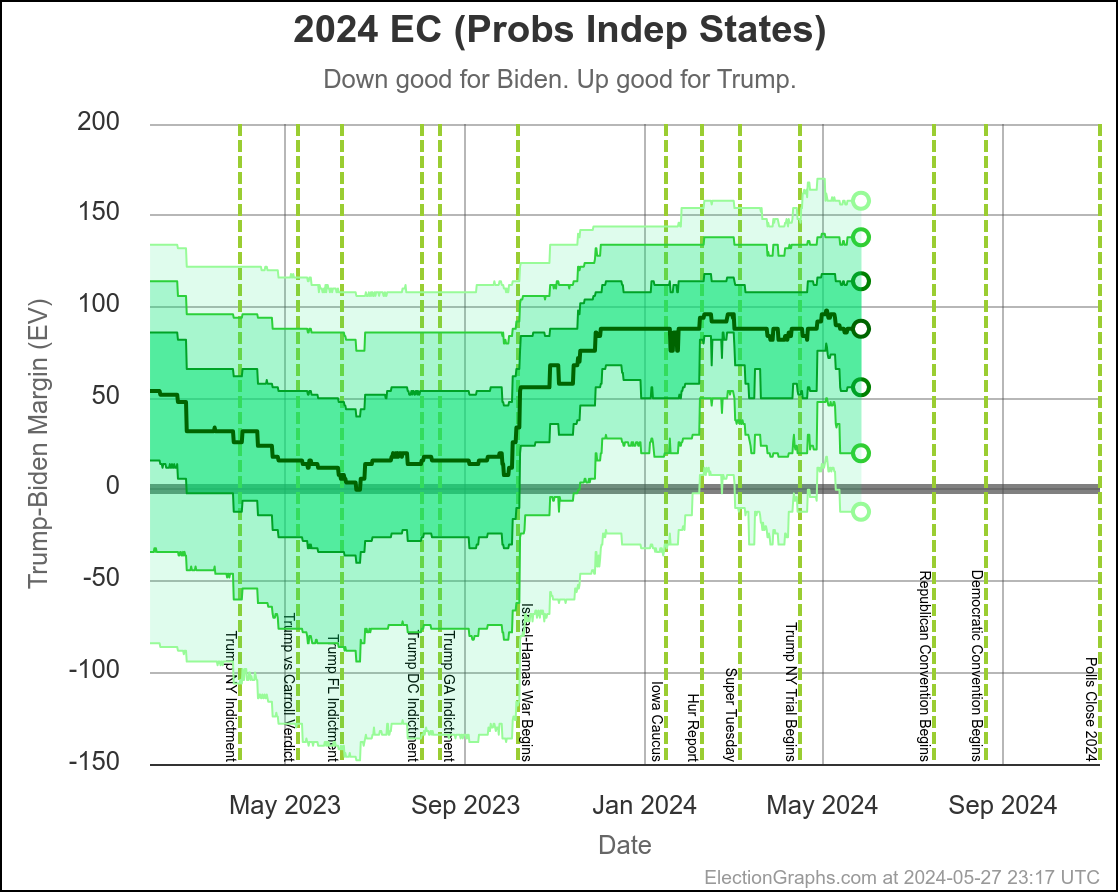
Now, repeating myself, these are both "if the election was today". Which it is not. I'm working on adding models that take the time left into account, but they are not ready yet.
In any case, with both of these views, the center line really hasn't moved much since at least December. We do see Biden's best case improving a bit recently though. So has Trump's though.
Here is what these look like in terms of chances of winning. Again, and I really just can't say this enough, these are not taking into account how much things may change in the remaining time.
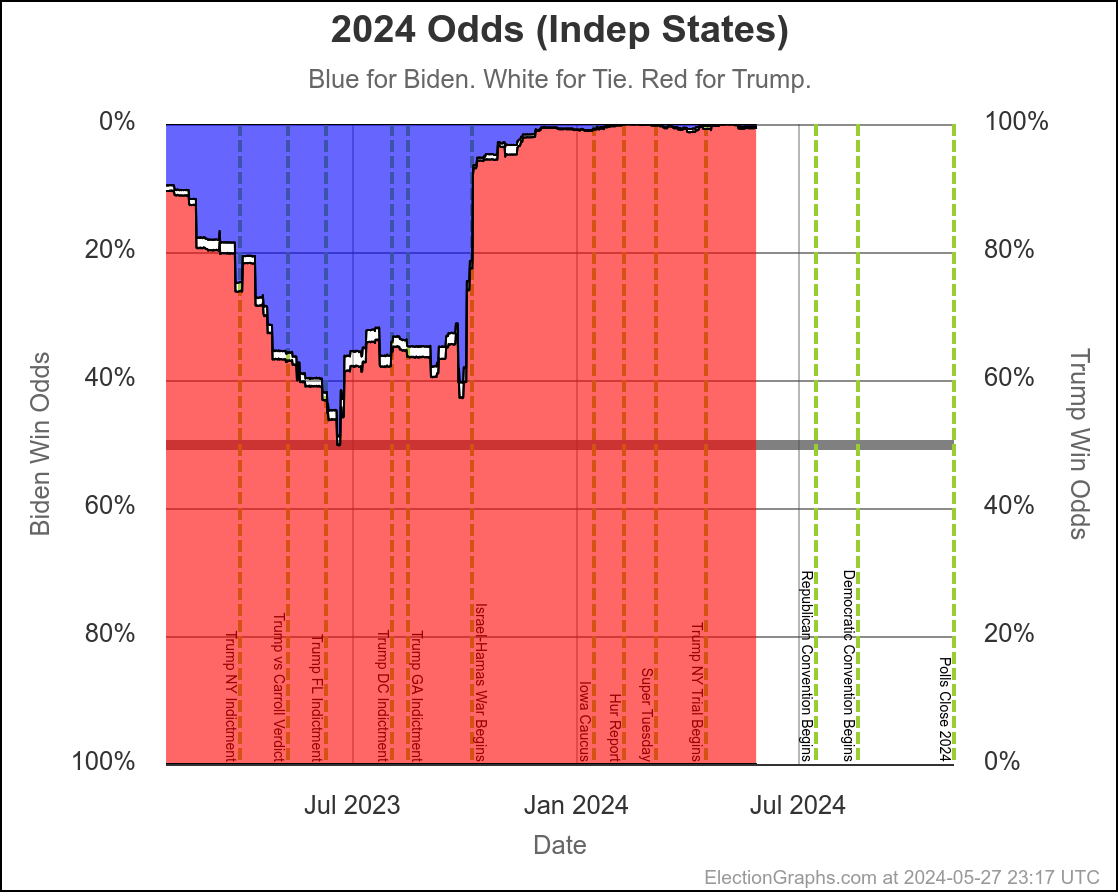
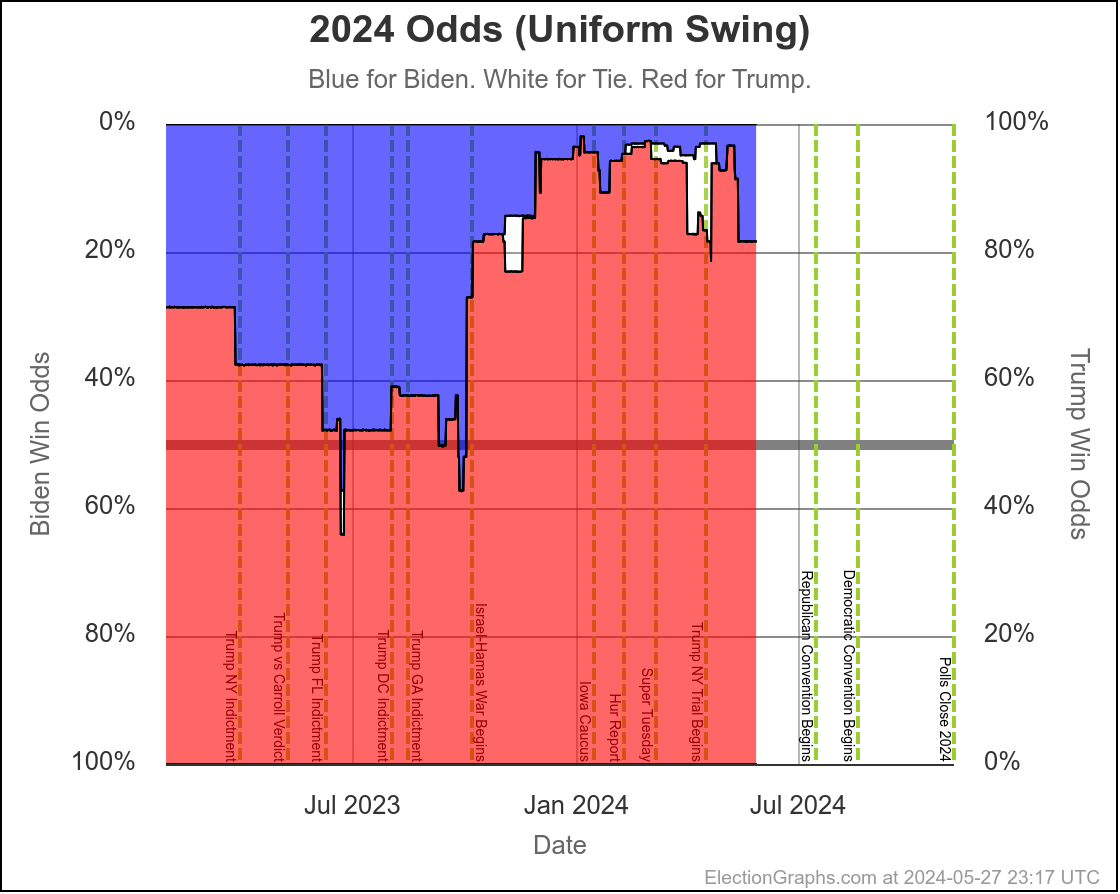
Biden's recent improvement shows up on the Uniform swing model, but still isn't making much of a difference on the Independent states model. Imagine the real scenario to be somewhere in between.
But looking at these I really want those models that take into account the amount of time left. I'm working on it! I may have to take some time off in June to just knock that out. 🙂
And that is that. I'll try not to go 60+ days before the next update, but it is what it is. Day job. Family. Other responsibilities. Sometimes this just ends up delayed. Sorry!
But the site itself is updated pretty promptly whenever new polls come out. Almost always within 24 hours, sometimes a lot less.
So please bookmark and explore the site itself regularly, and also follow ElectionGraphs on Mastodon for daily summaries and posts whenever new polls come out.
Coming up next: A verdict in Trump's NY trial, and the first Biden vs Trump debate. Will either of those change anything? I guess we will find out.
161.9 days until polls start to close.