So far, all the posts here on Election Graphs in the 2024 cycle have been about looking at state level polls for the general election in November.
That ends today, as the second part of Election Graphs opens up, as the delegate race begins on the Republican side.
The numbers may still shift a bit as all the T's are crossed and all the I's are dotted for the final counts, but the preliminary delegate counts at The Green Papers haven't shifted in a couple of hours, so that's good enough for now, lets start looking at the new charts and graphs.
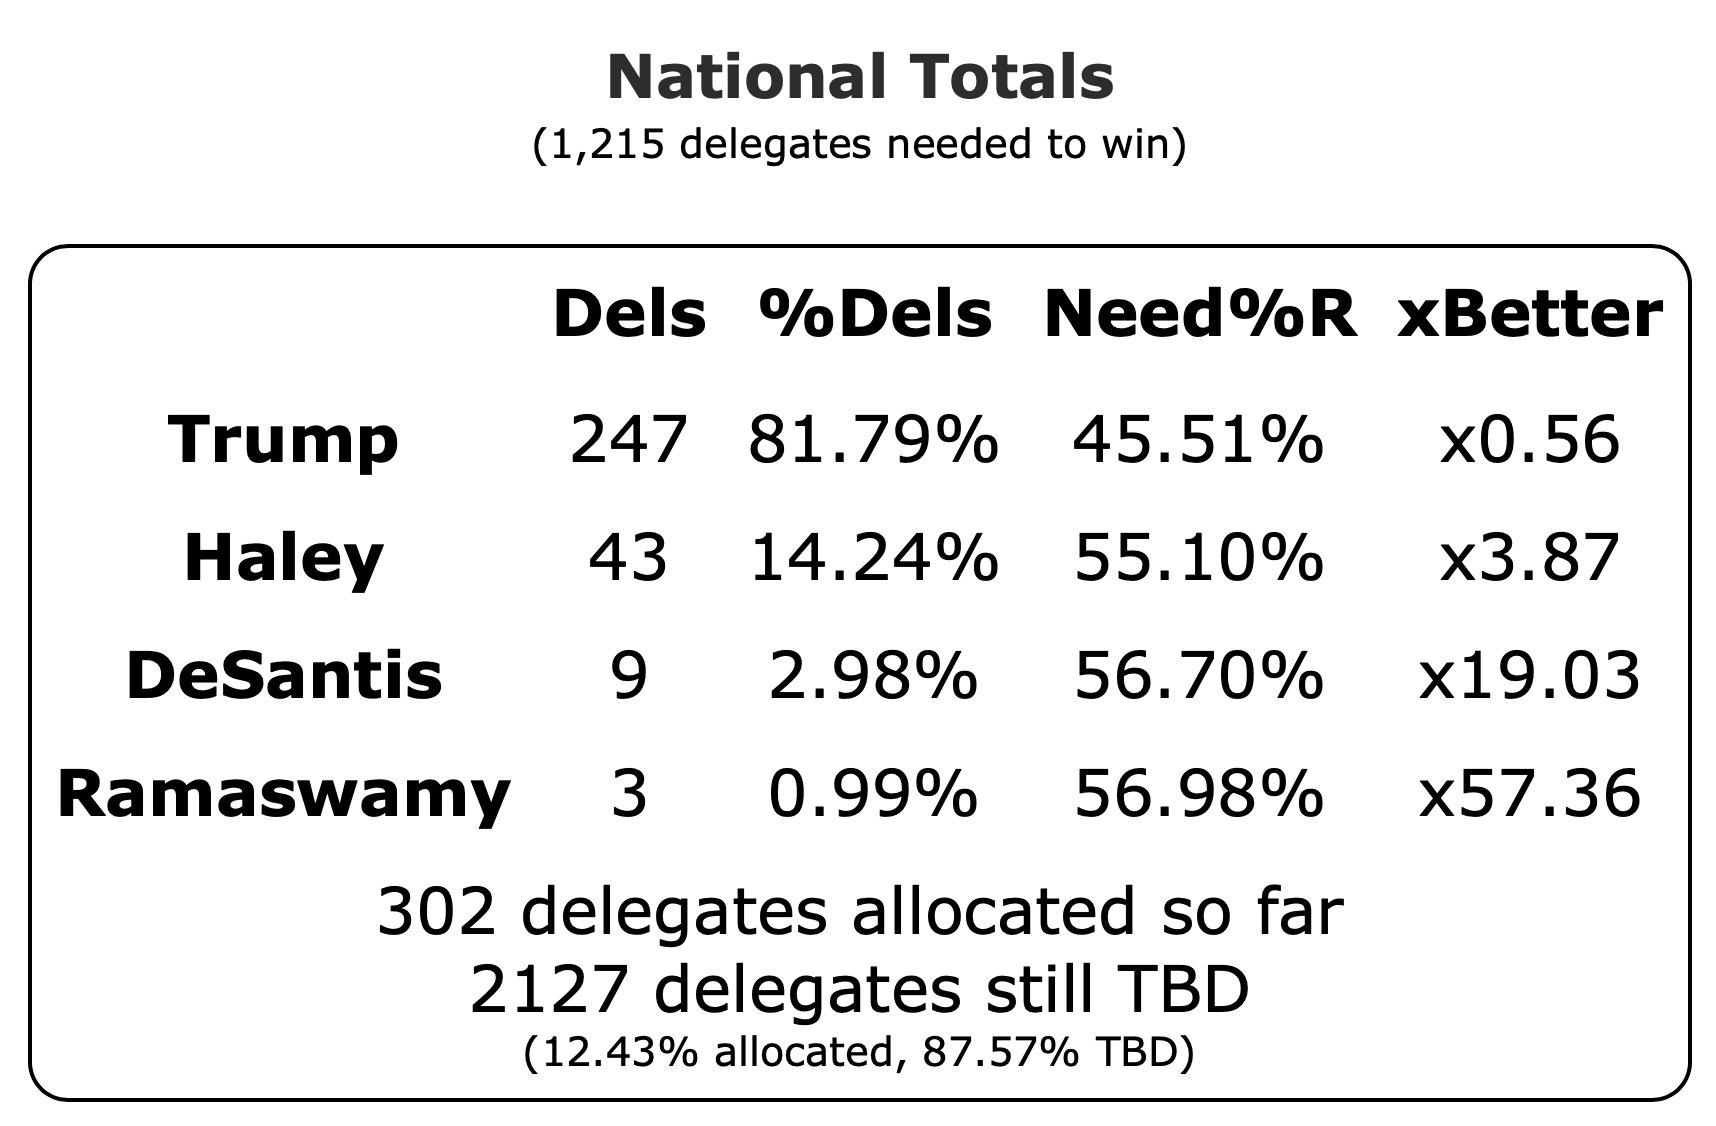
Many places will have tables showing the delegate totals. Here is ours:
The first column shows how many delegates each candidate has right now, the second shows that as a percentage of the delegates so far, the third shows the percentage of the remaining delegates each candidate needs to win, and the last column is how much better than their performance so far each candidate needs to do to win.
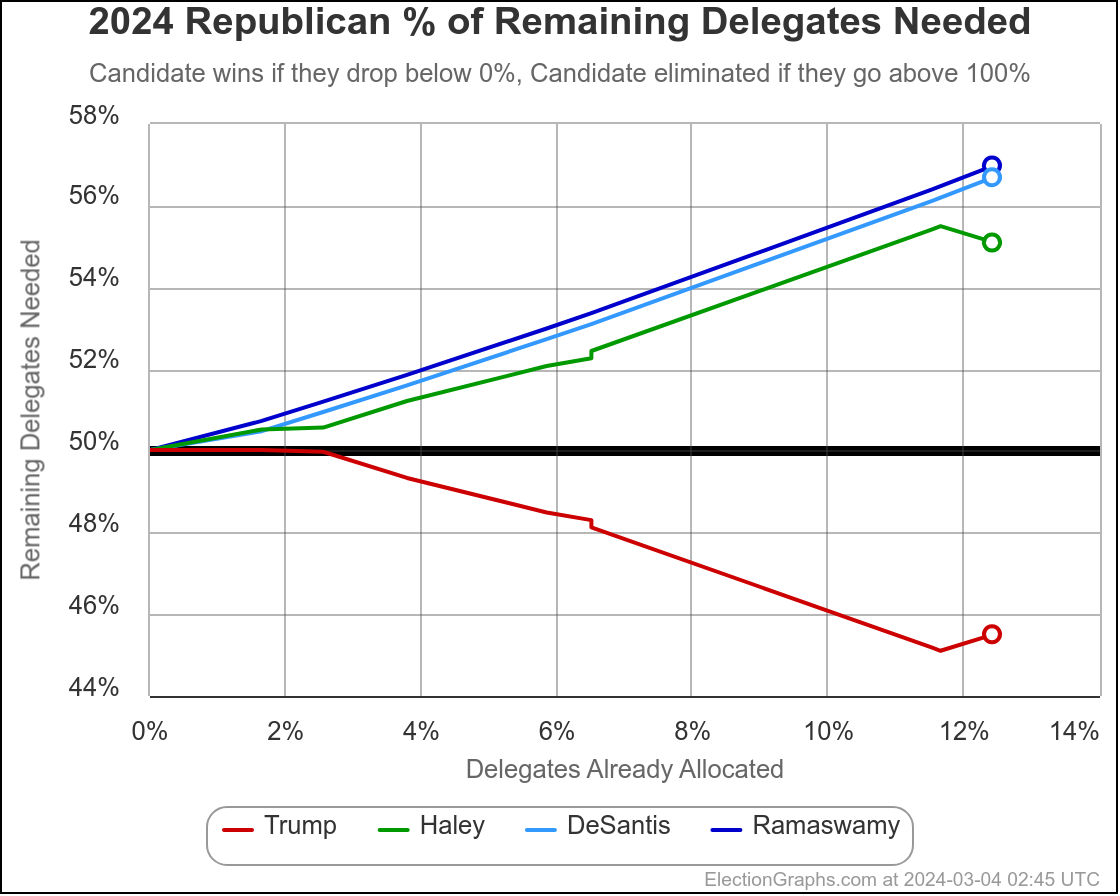
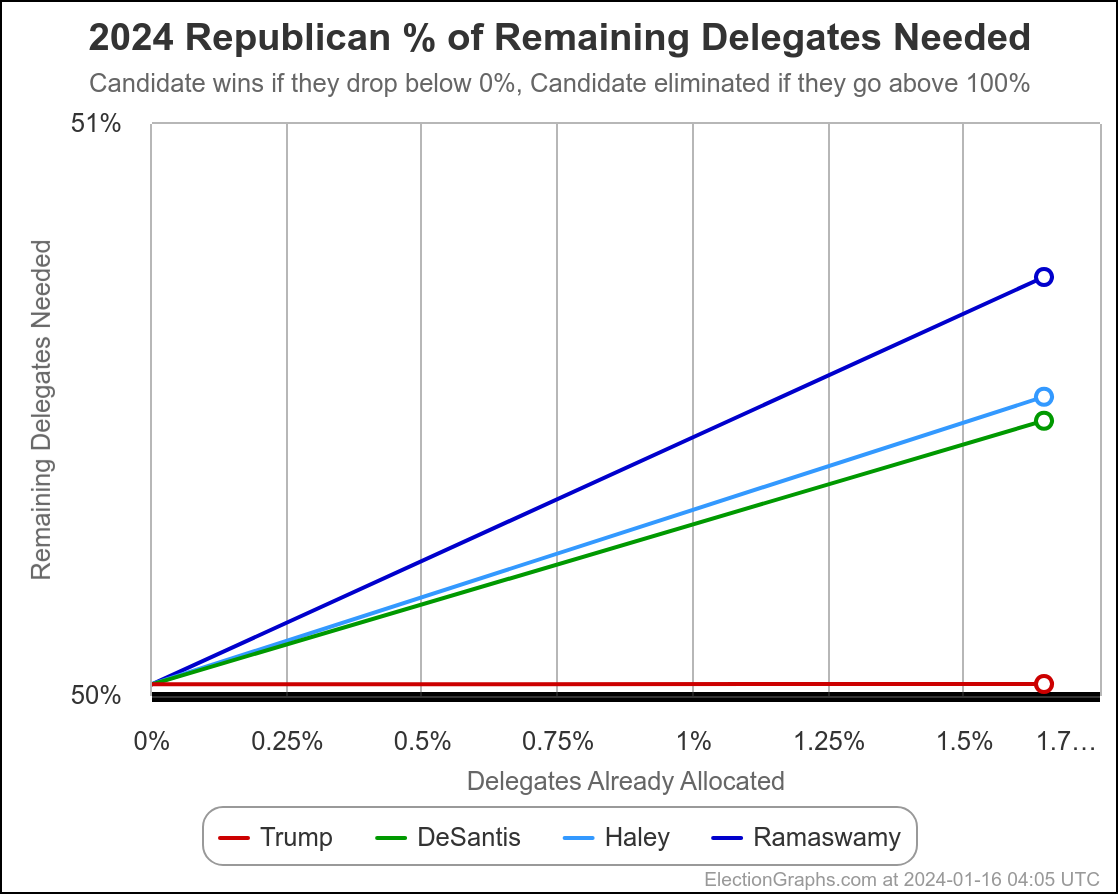
The delegate race page shows graphs for all of these, but the main one, the one that matters the most, is the "% of remaining delegates needed" graph:
OK, we've only had the one delegate estimate from Iowa so far, so this is just a bunch of straight lines right now… kinda boring. It will get more interesting as we get results from more states.
Well, how interesting will depend on if we get any surprises in the race, but it will stop just being straight lines in any case.
Let me explain what you are looking at.
First, we specifically show graphs showing how those numbers evolve over time, not just "now". The data table is nice and all, but to get a sense of how things are going, it really helps to see how things have been changing. Is someone catching up? Or falling behind?
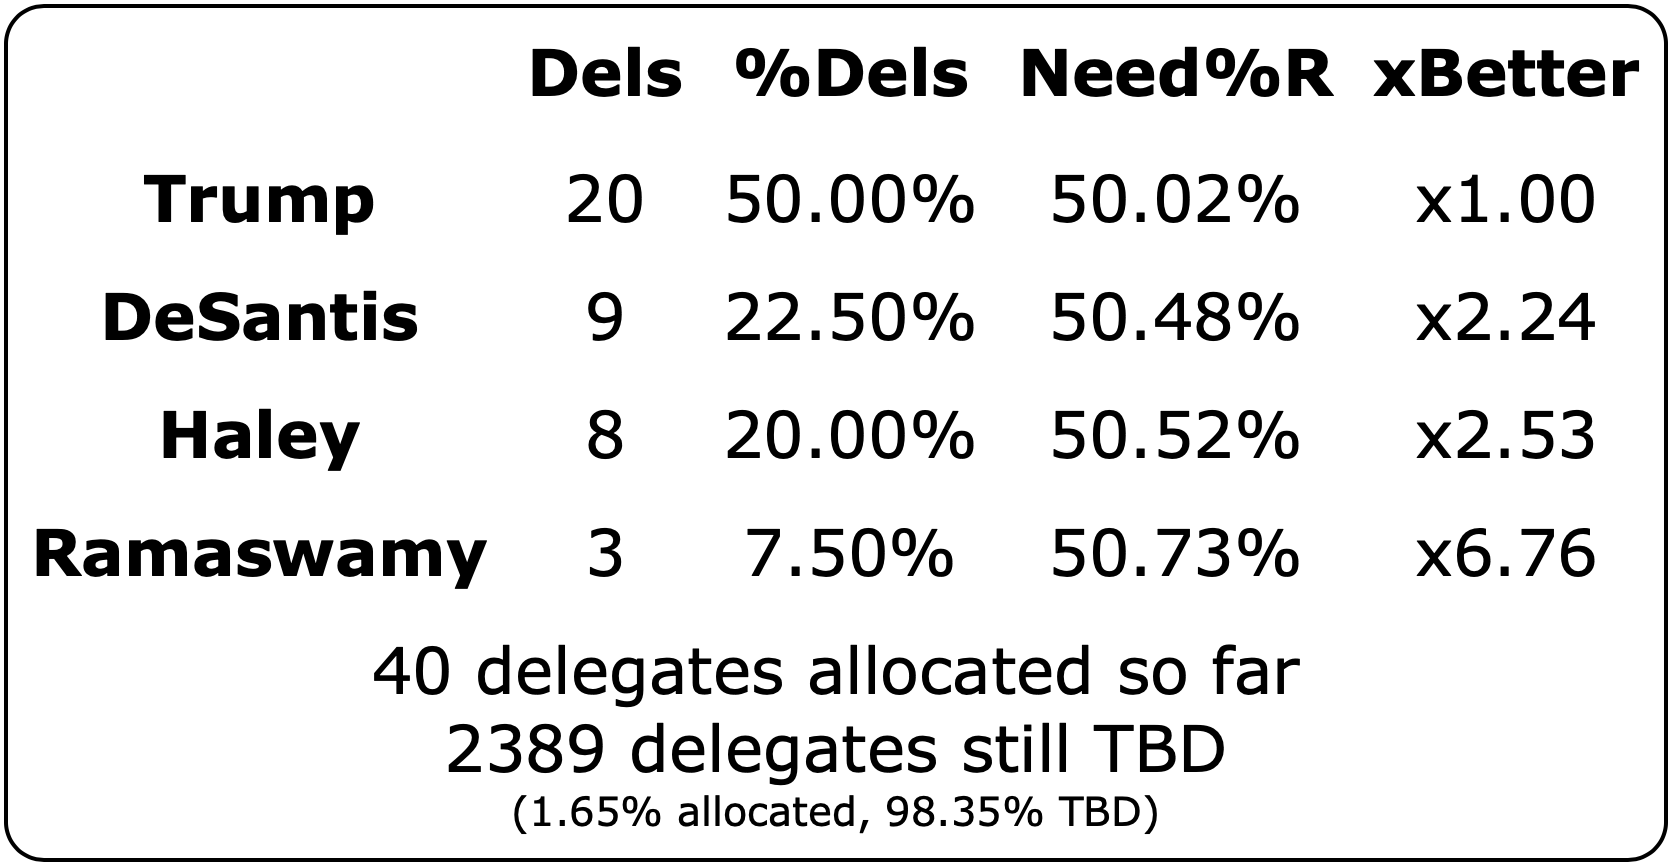
Second, while we do have a page that shows things in a date-based way, the primary view has the % of delegates that have been allocated on the x-axis rather than the date. This gives a much better sense of how far though the process we are. After Iowa, the Republicans have allocated 1.65% of their delegates. We are still a very long way from the end. On some primary days, only a small percentage of delegates will be allocated, but on the other extreme, 35.99% of the delegates will be allocated on Super Tuesday alone.
Third, the y-axis is of course the % of the remaining delegates that each candidate needs to win.
To me, the other graphs are nice, but this is the most important metric of all.
Why is this the most important thing? Because the absolute numbers can be misleading, because as more and more delegates get allocated, there is less and less opportunity for whoever is trailing the leader to catch up, and the leader has to do less and less in order to coast to the victory.
Just like any race, if you are behind, the less track you have left before the finish line, the faster you have to go to in order to catch up to the winner before they get to the finish line. It does you no good to catch up to them after they have already won.
The "% of remaining delegates needed to win" graph shows that more clearly than anything else.
Even though only a very small number of delegates have been allocated so far, you can already see that in the chart above. Everybody starts out needing just barely over 50% of the delegates to win.
But now with just a few delegates estimated, Ramaswamy, who actually already dropped out due to his 4th place finish here, would now have needed 50.73% of the remaining delegates to win. Haley needs 50.52%, DeSantis needs 50.48%.
Meanwhile Trump, after getting exactly half of the delegates from Iowa, only needs 50.02% of the remaining delegates to win.
As we continue through the primaries and caucuses, the losers will have their numbers move toward 100% faster and faster, while the winner will start dropping down toward 0%. This represents those who are behind needing to get a larger and larger percentage of the delegates to catch up, while the person in the lead needs less and less.
Later on in the race, it is very possible that a candidate could win a state, but not by enough to be on a pace to catch up, so even though they won, they still end up falling further behind.
In the epic 2008 race between Obama and Clinton, this happened to Clinton over and over in the second half of the race. She was winning states, but not by enough to be on a pace to catch up to Obama.
As each losing candidate hits 100% and then goes beyond it, they are eliminated.
When the winning candidate gets to 0%, they have clinched the nomination.
OK, that sounds complicated. It really isn't. It will become clearer as the race progresses.
But if you really like raw counts better, it is there too:
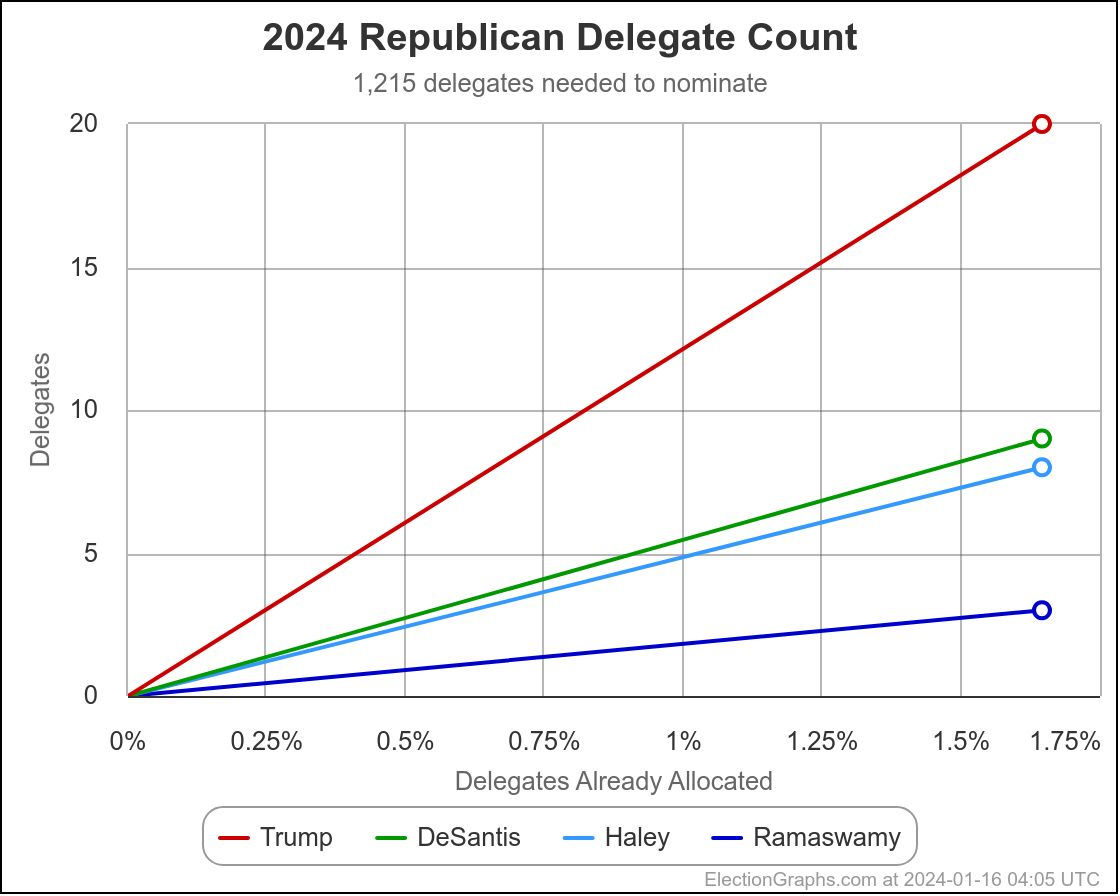
On there is it just about who gets to 1,215 first.
In any case, next up New Hampshire, including delegates for the Democrats too, despite the penalties the Democrats put on New Hampshire for not moving their primary later in the year.
It is very very possible, probably very likely actually, that there will be no real drama in either party's delegate race this year. Even if Haley puts on a good show in New Hampshire next week.
Regardless, we'll track it all here, and see how it goes.
181.6 days until the Republican National Convention
216.6 days until the Democratic National Convention
Off we go.