I am overdue for another update. The 2020 pages on Election Graphs are updated nearly every day as new polls come in. So you can always see the current status there for yourself in between these posts. But here comes another blog post…
Since the last update on July 24th, there have been new state polls in Pennsylvania (x8), Arizona (x7), Florida (x7), Michigan (x10), Ohio (x5), North Carolina (x9), South Carolina (x4), Minnesota (x5), Colorado (x3), Georgia (x5), Texas (x4), Virginia (x3), Wisconsin (x9), New Jersey, Massachusetts, Alaska, Iowa (x5), Maine All (x4), Montana (x2), Maine CD1 (x2), Maine CD2 (x2), Washington, New Hampshire (x3), California, Alabama, Kentucky (x4), Hawaii, Indiana, Oklahoma, Utah, and Kansas.
That's 31 out of the 56 entities that allocate electoral votes in only 16 days. That's more than half. Given that, I'm going to stop calling out the states with polls each update. In short, the answer from now until the election is always going to be "a lot of them", and "multiple polls for all the close states".
It has been 16 days, how much has changed?
First the summary table of changes:
| Model | Metric | 24 Jul | 9 Aug | 𝚫 |
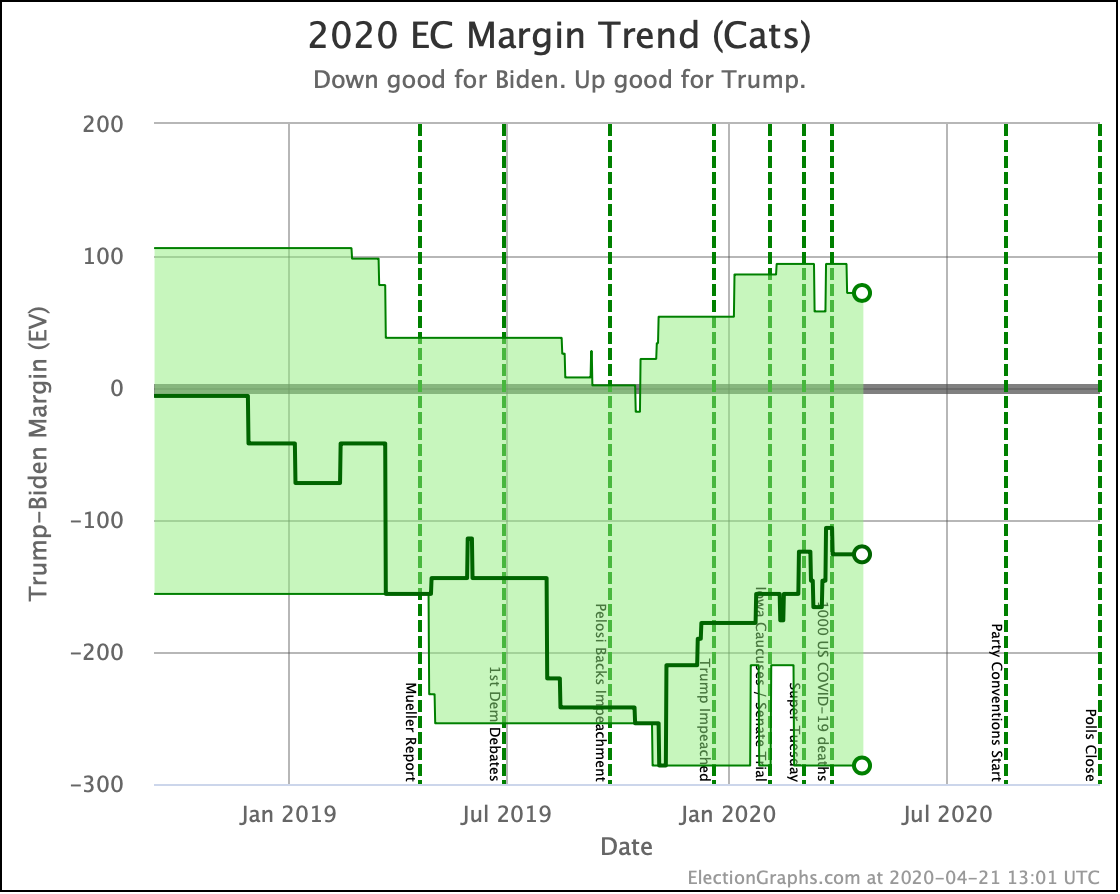
| Categories | Trump Best Expected Biden Best |
Biden +36 Biden +168 Biden +288 |
Trump +34 Biden +180 Biden +288 |
Trump +70 Biden +12 FLAT |
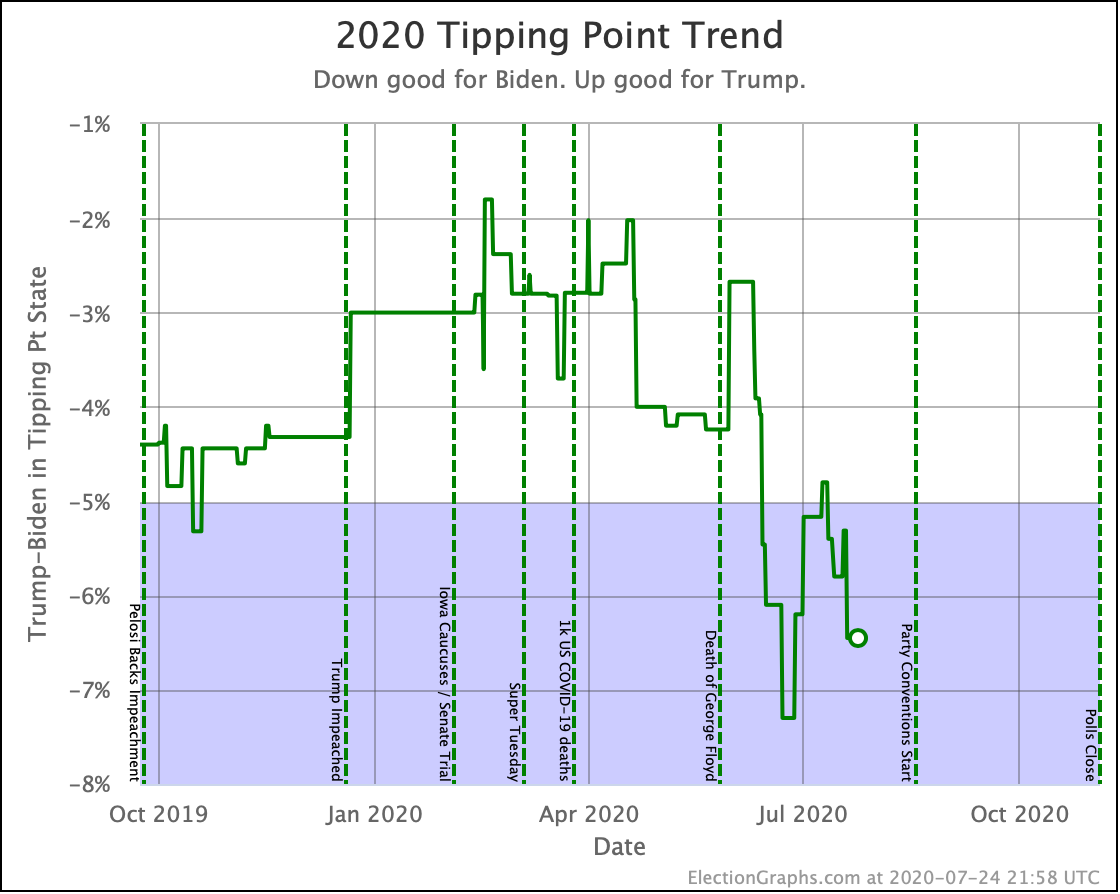
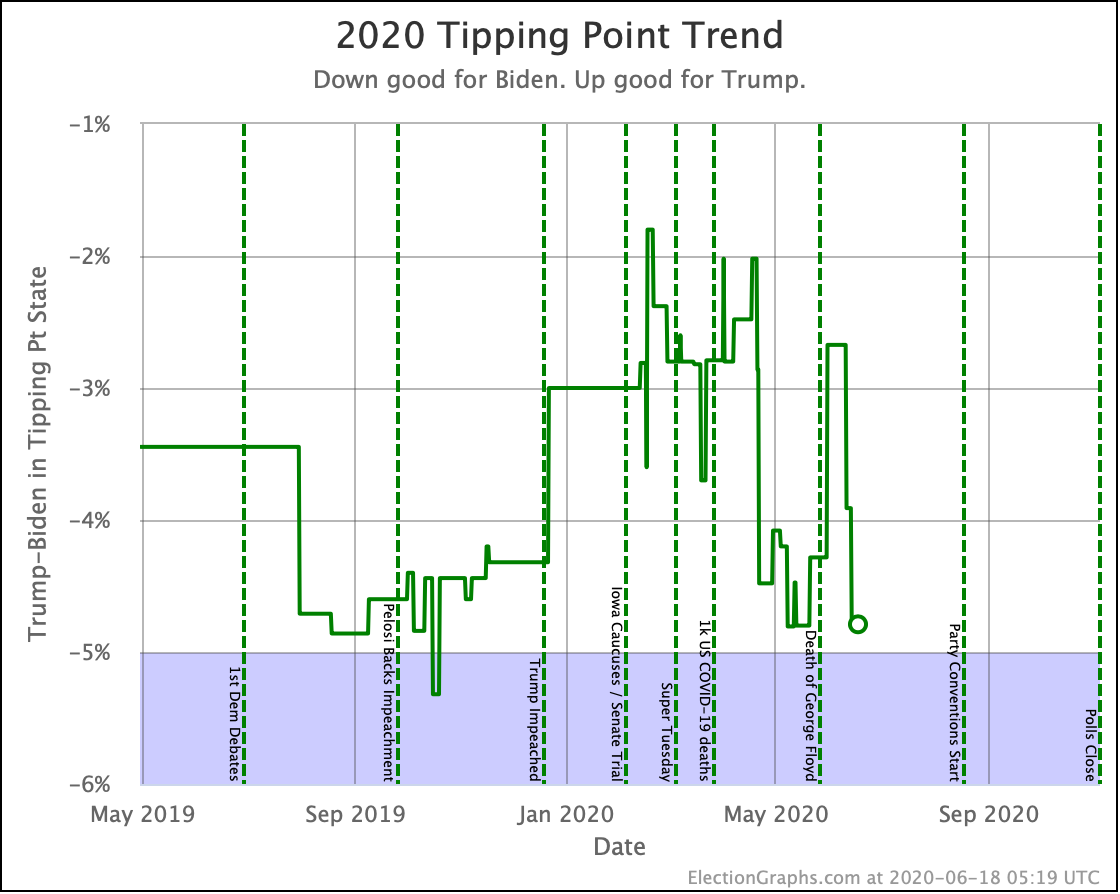
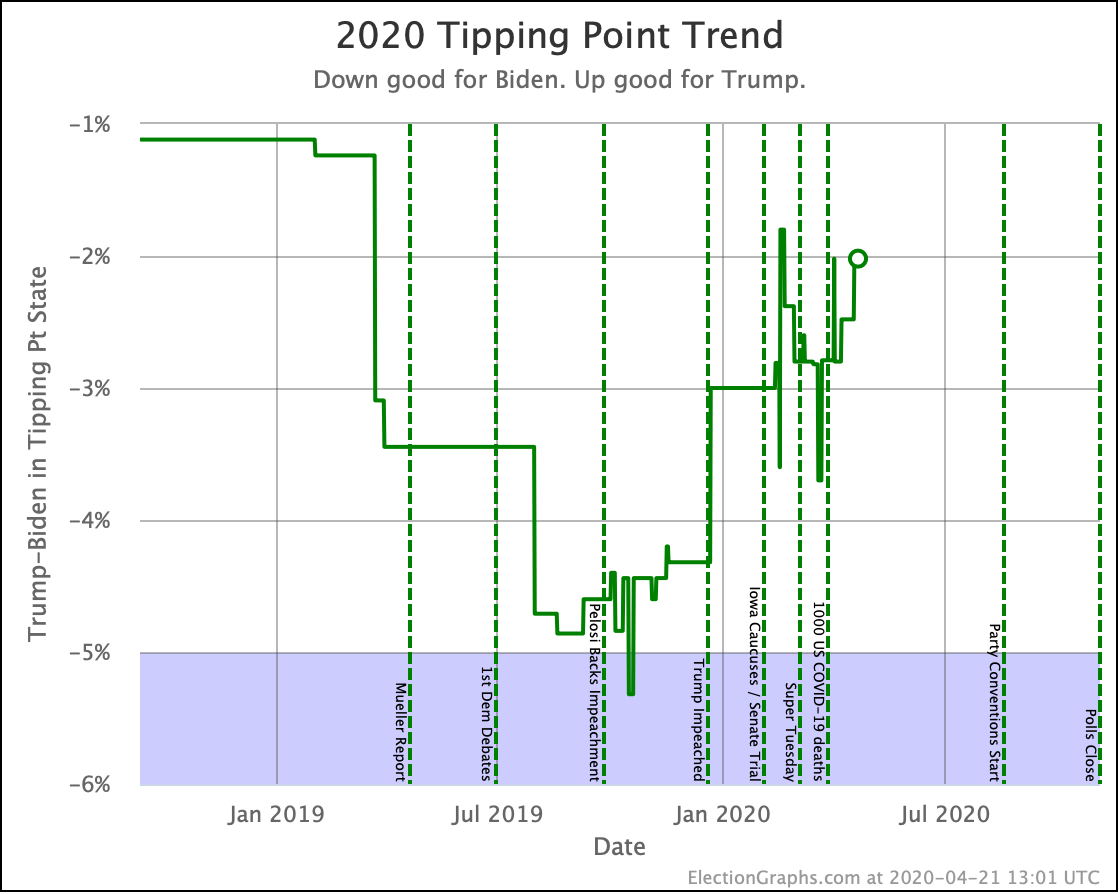
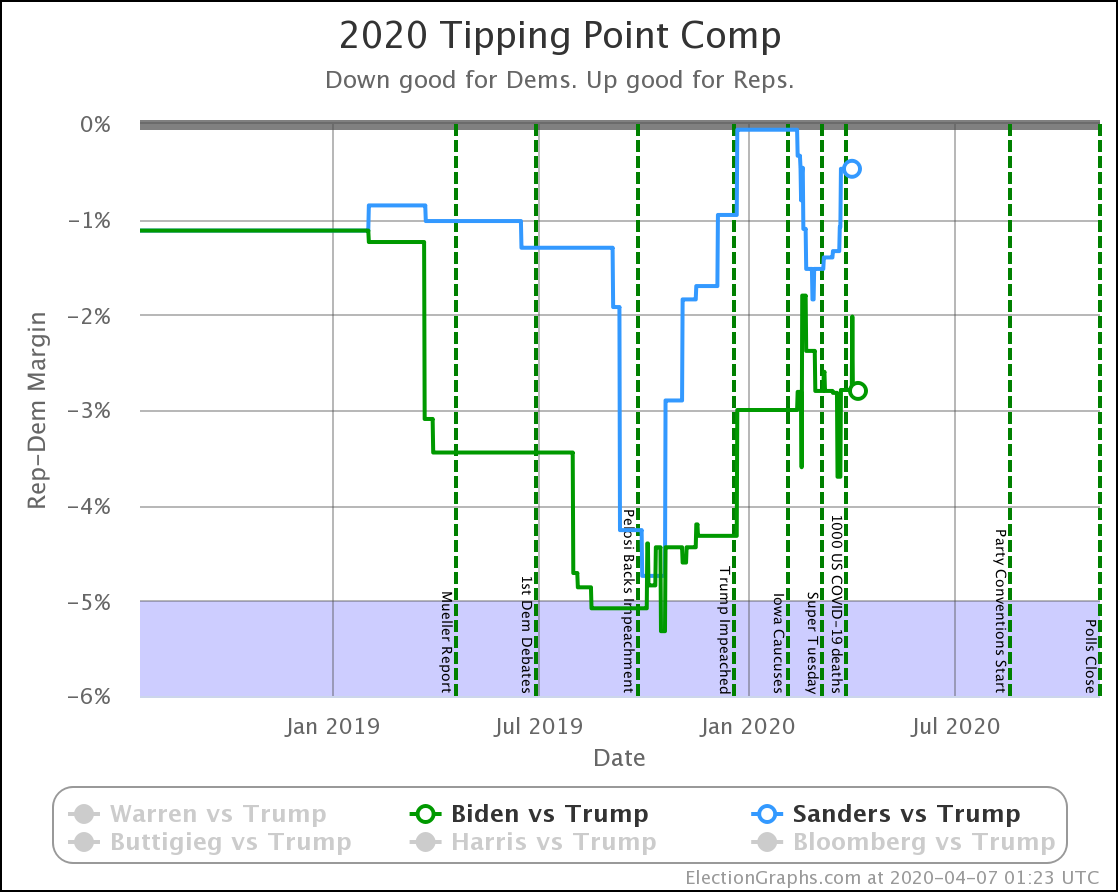
| Tipping Point | Biden +6.5 | Biden +4.2% | Trump +2.3% | |
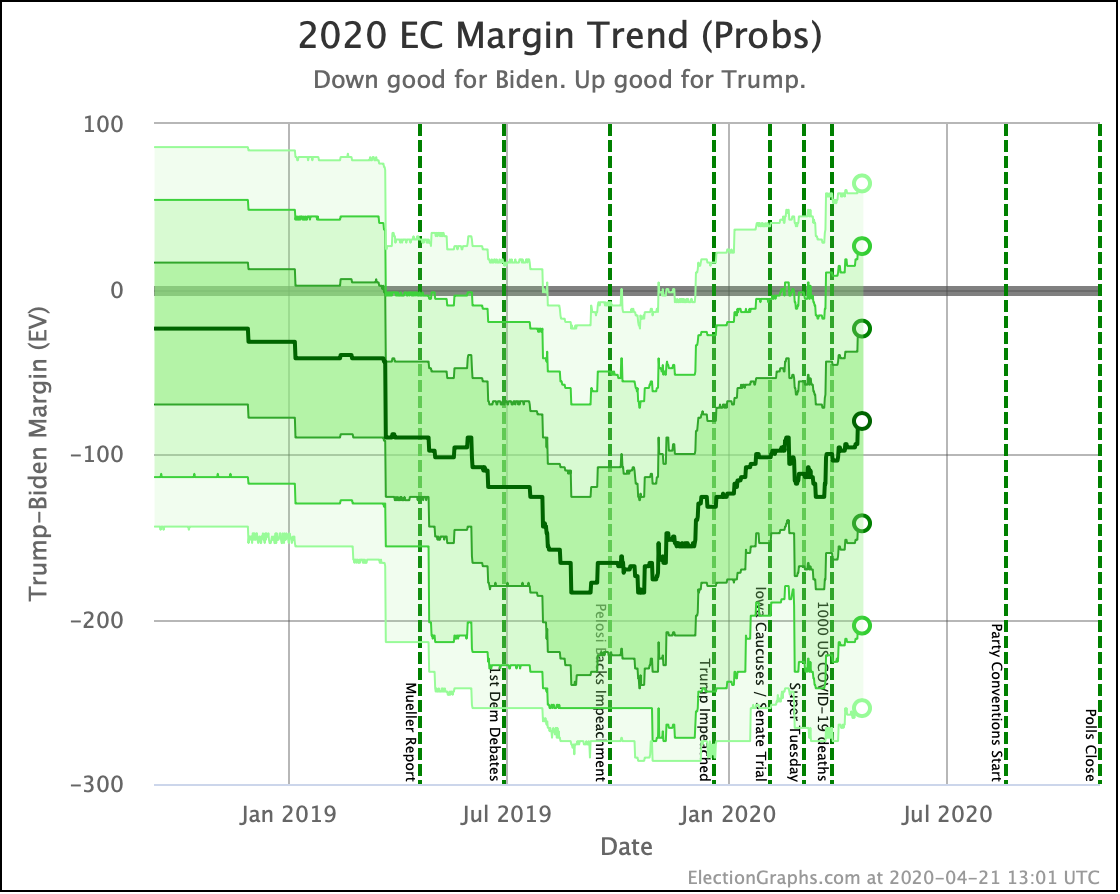
| Probabilities | Trump 2σ Median Biden 2σ |
Biden +80 Biden +168 Biden +272 |
Biden +50 Biden +154 Biden +264 |
Trump +30 Trump +14 Trump +8 |
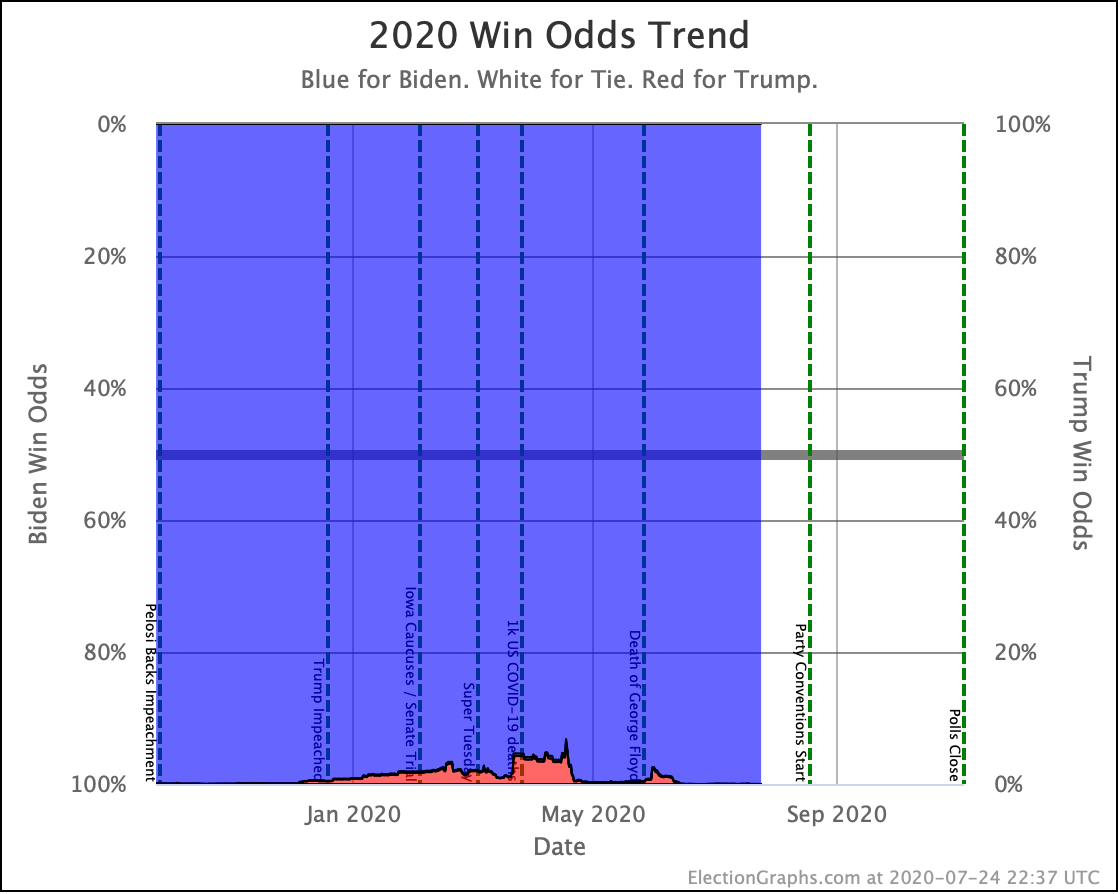
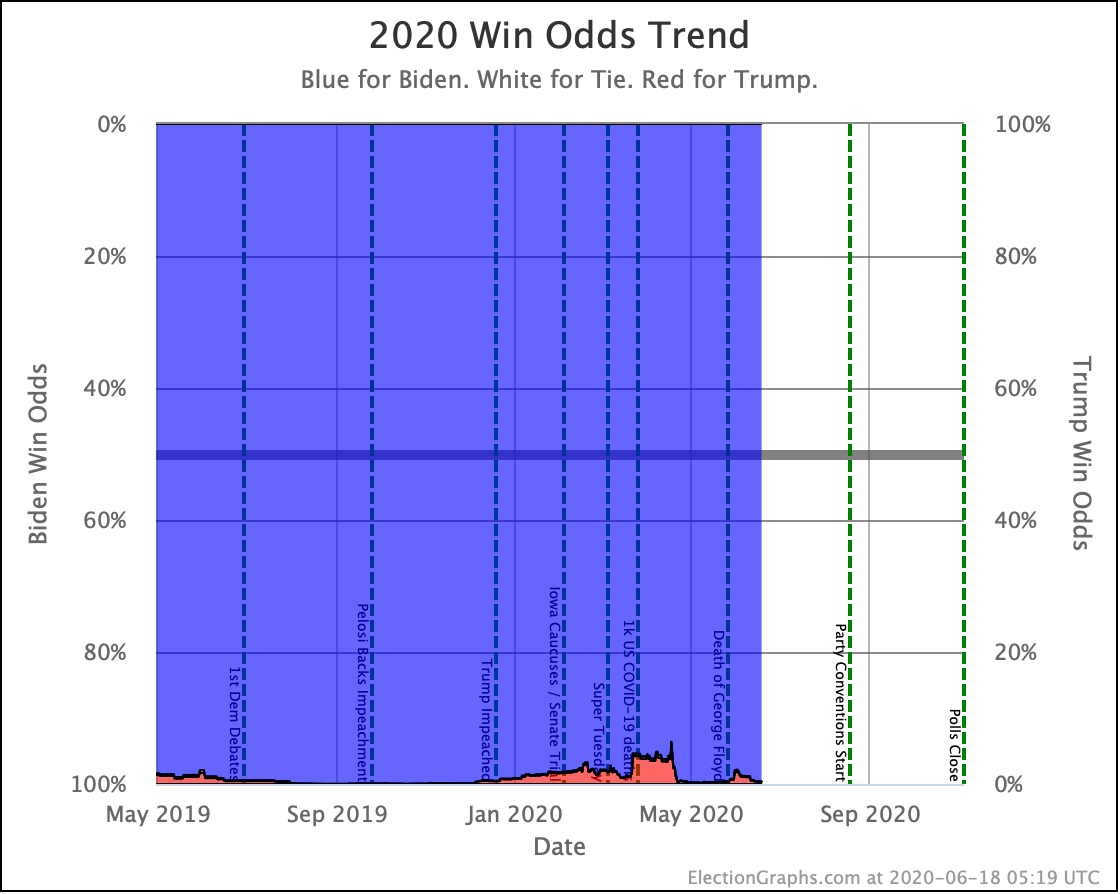
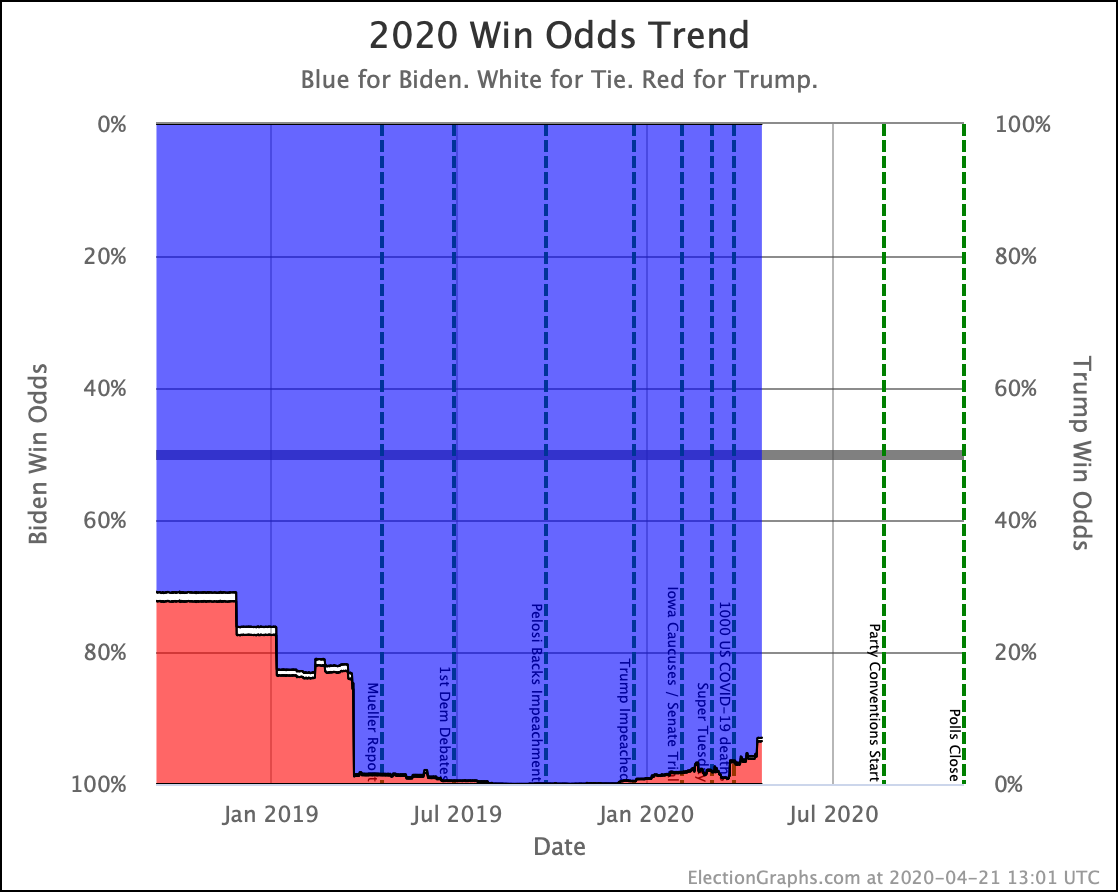
| Trump Win Tie Biden Win |
0.0% 0.0% 100.0% |
0.1% 0.0% 99.9% |
+0.1% FLAT -0.1% |
So compared to 16 days ago, what is the TL;DR summary?
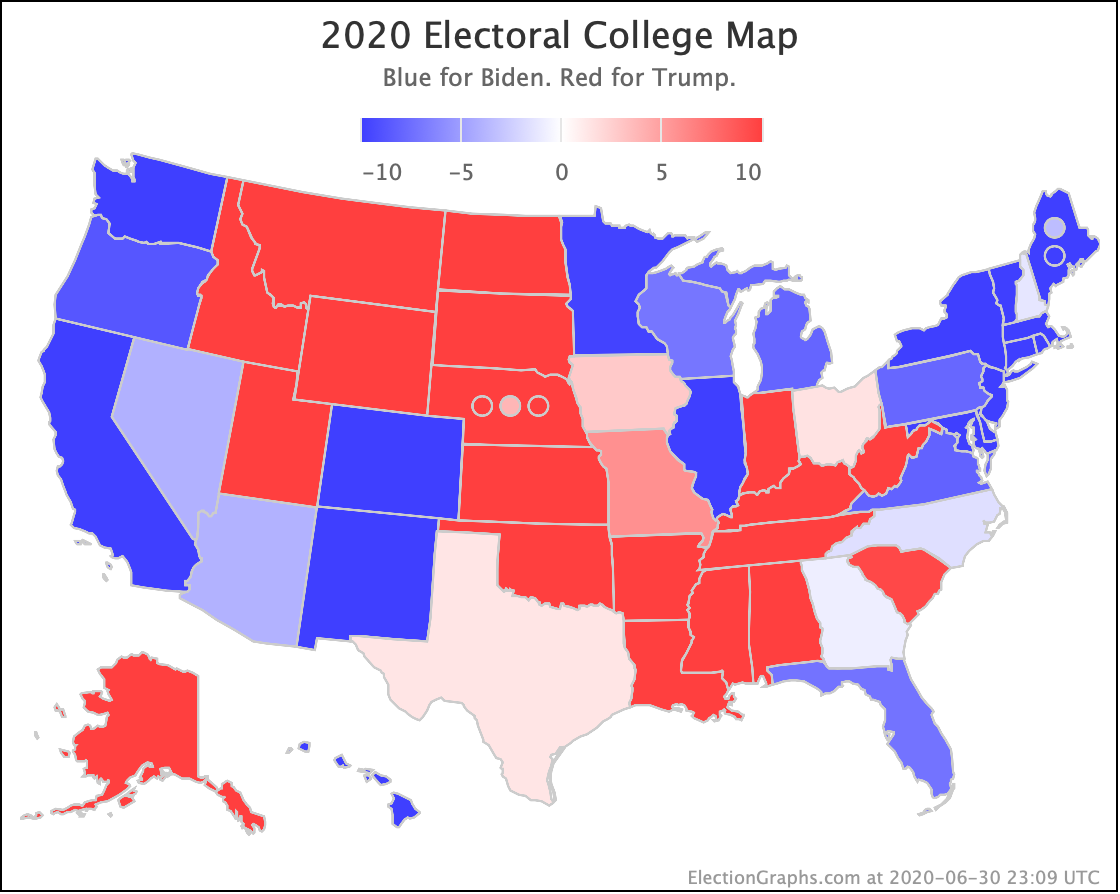
Biden still leads by a large margin and actually improves his margin in the "everybody wins every state where they lead the average" expected case metric, but overall Trump has managed to reduce Biden's margin in a number of states, thus increasing the likelihood he might steal those states back and strengthening his position. And if he managed to flip ALL the close states, he could once again pull off a narrow win.
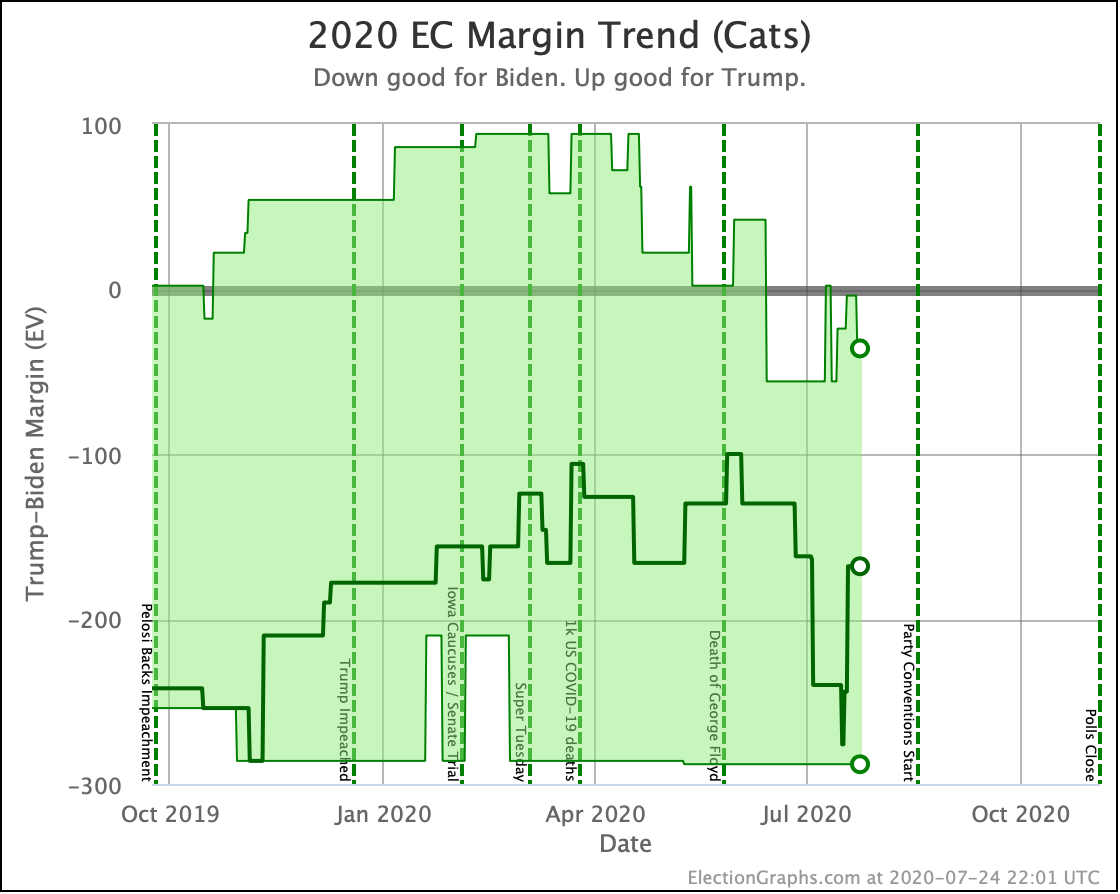
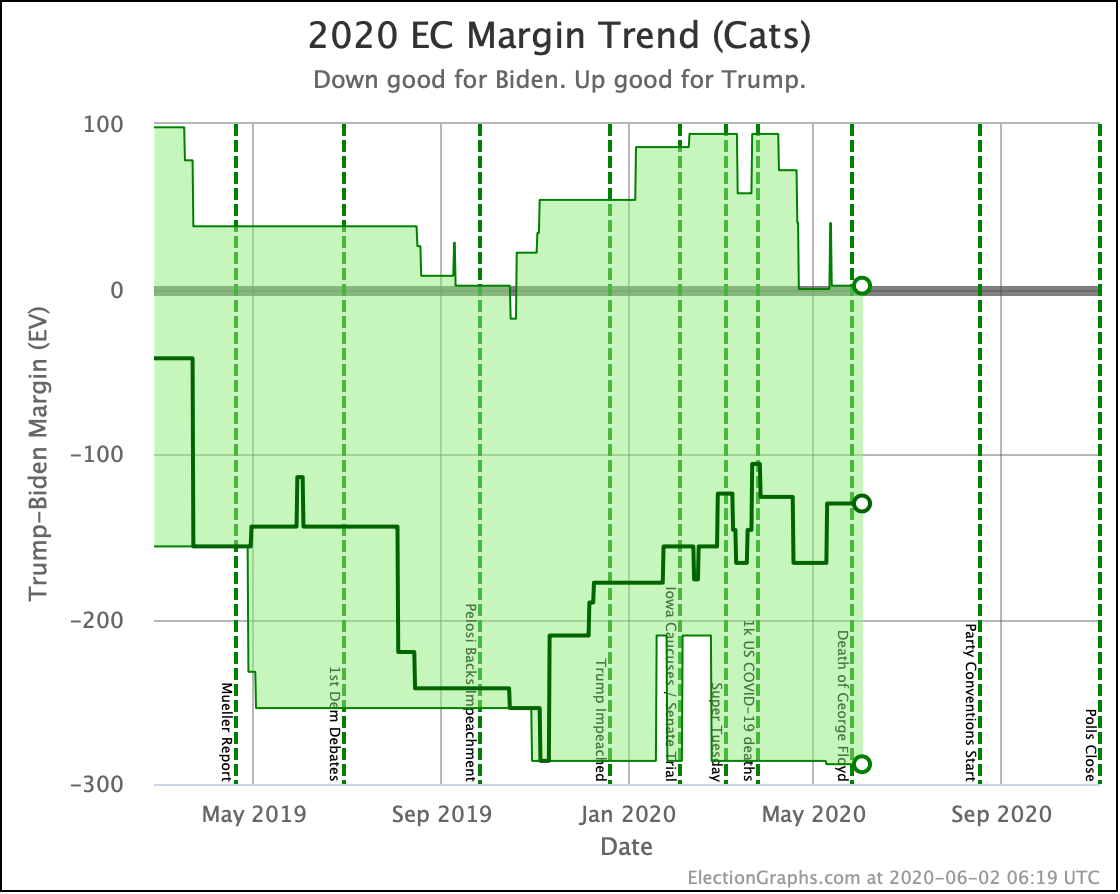
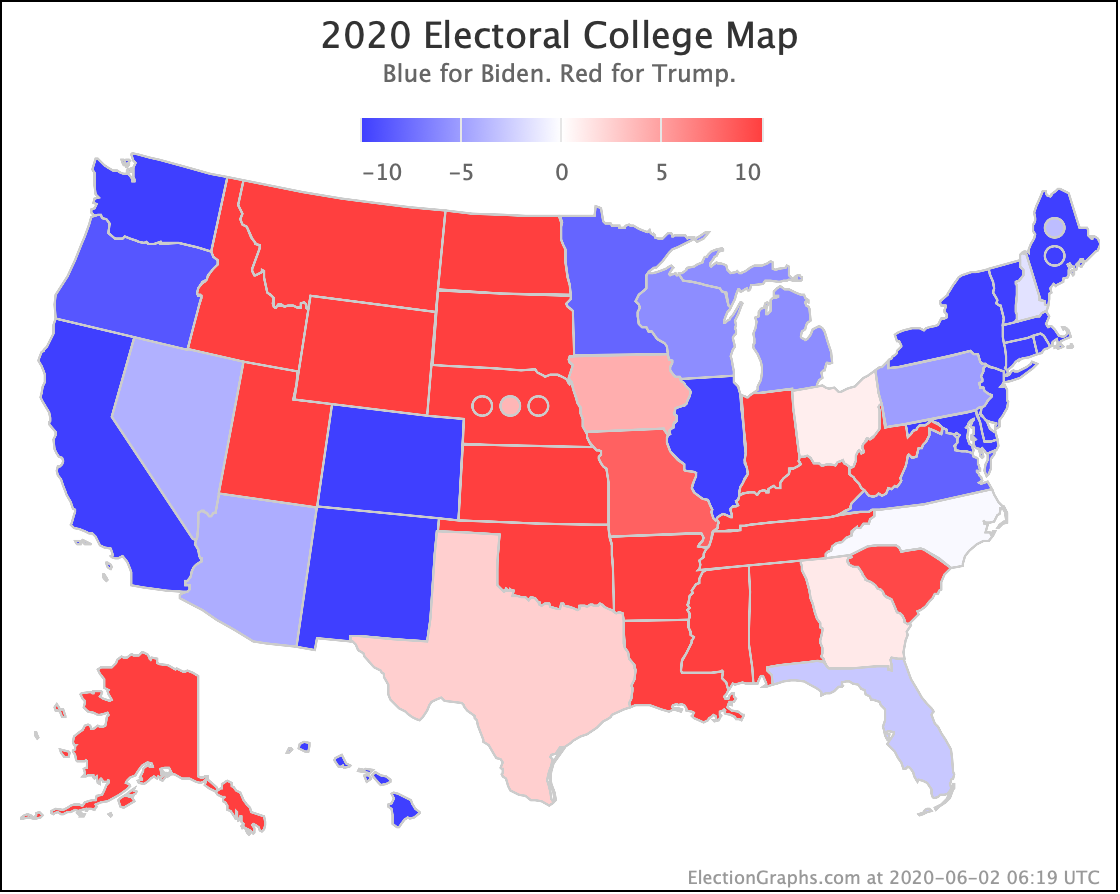
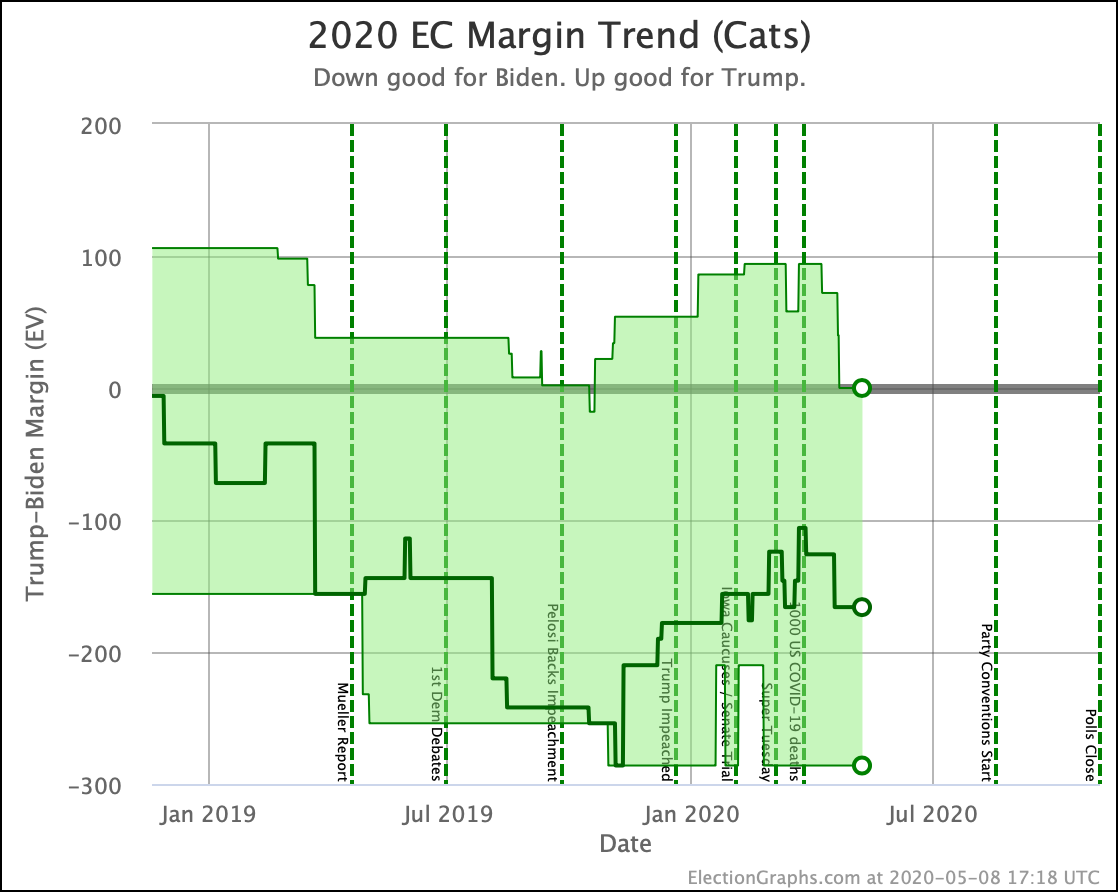
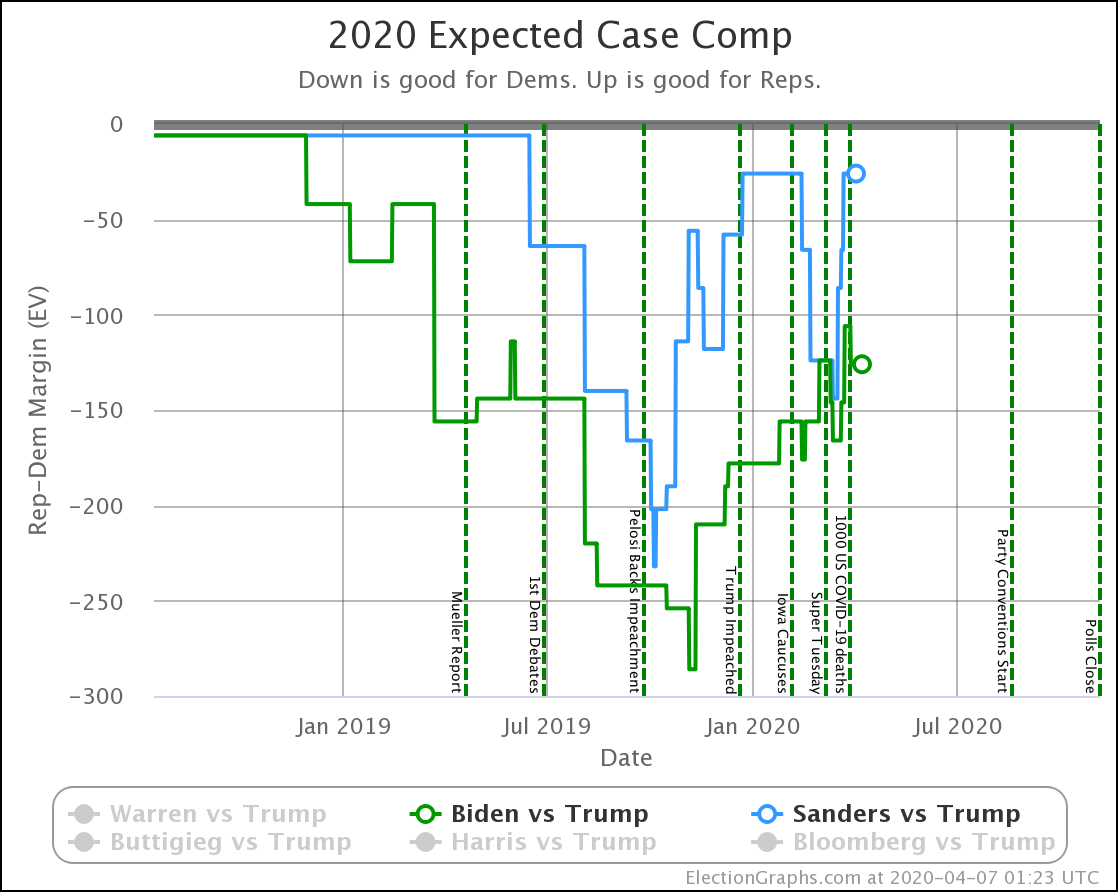
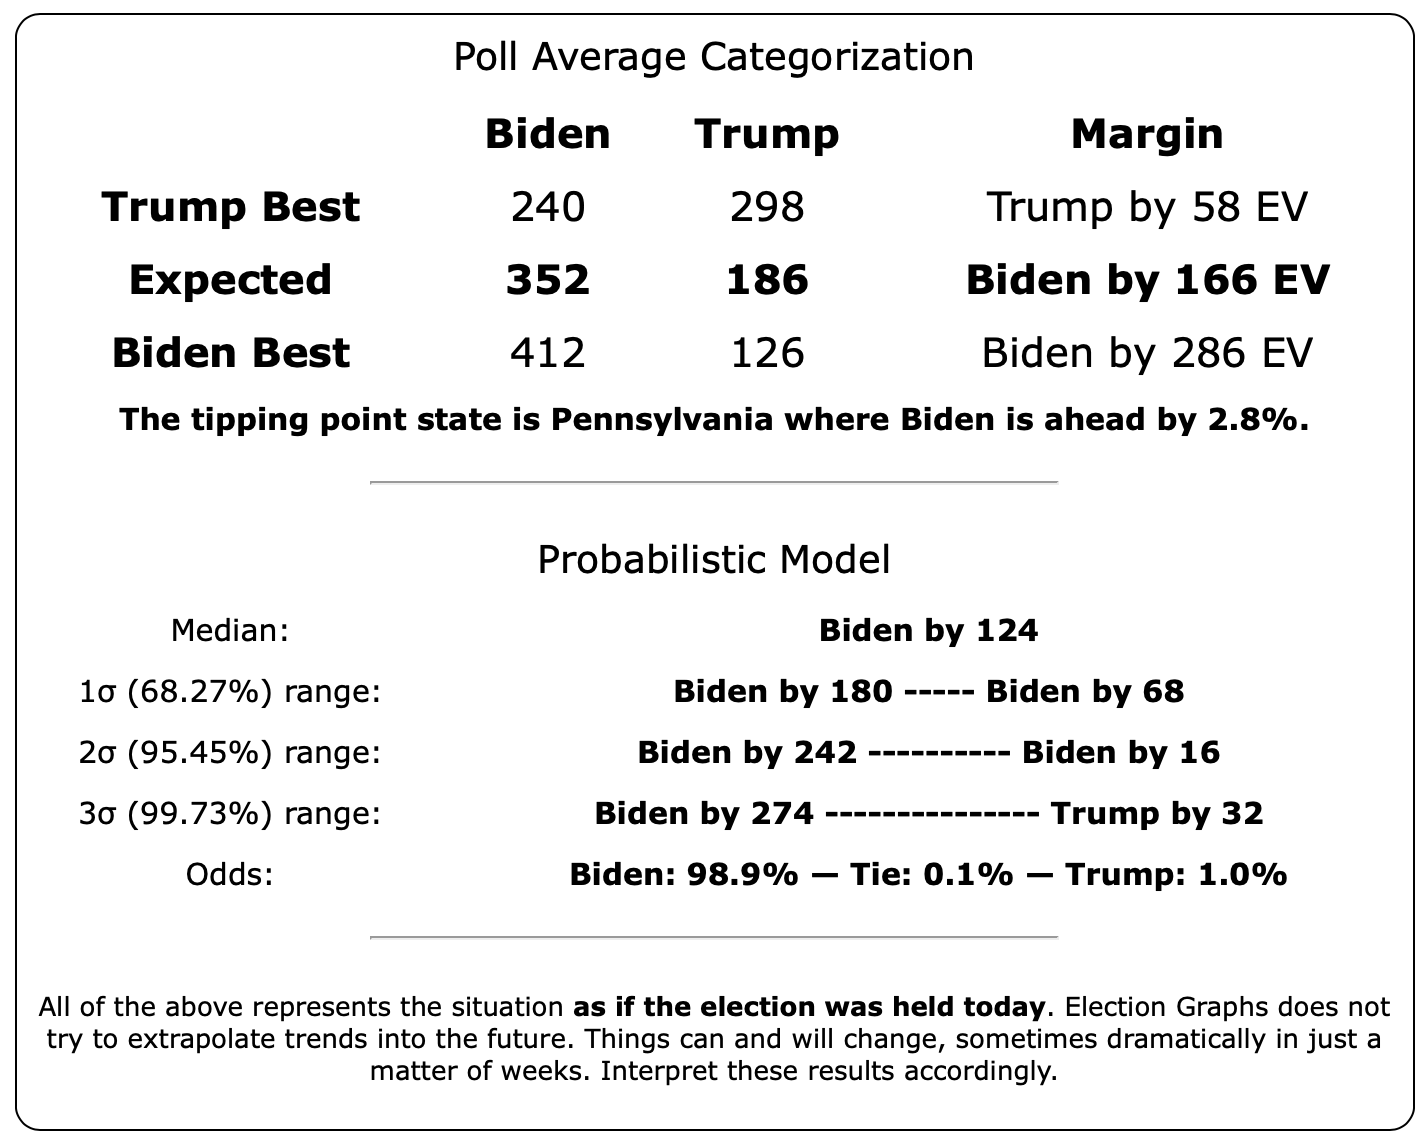
Now some of the charts, starting with the categorization view:
We can see that while Biden improved his expected case, Trump's best case has improved significantly.
So which specific states changed?
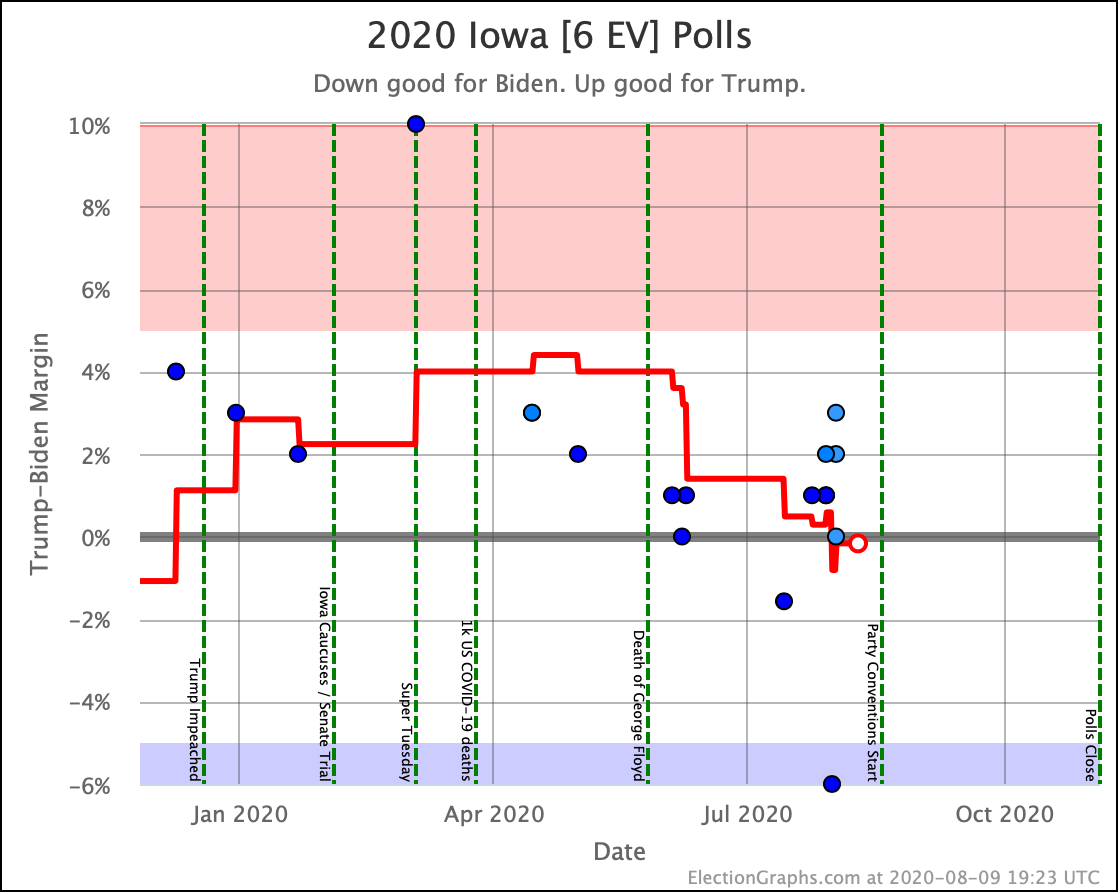
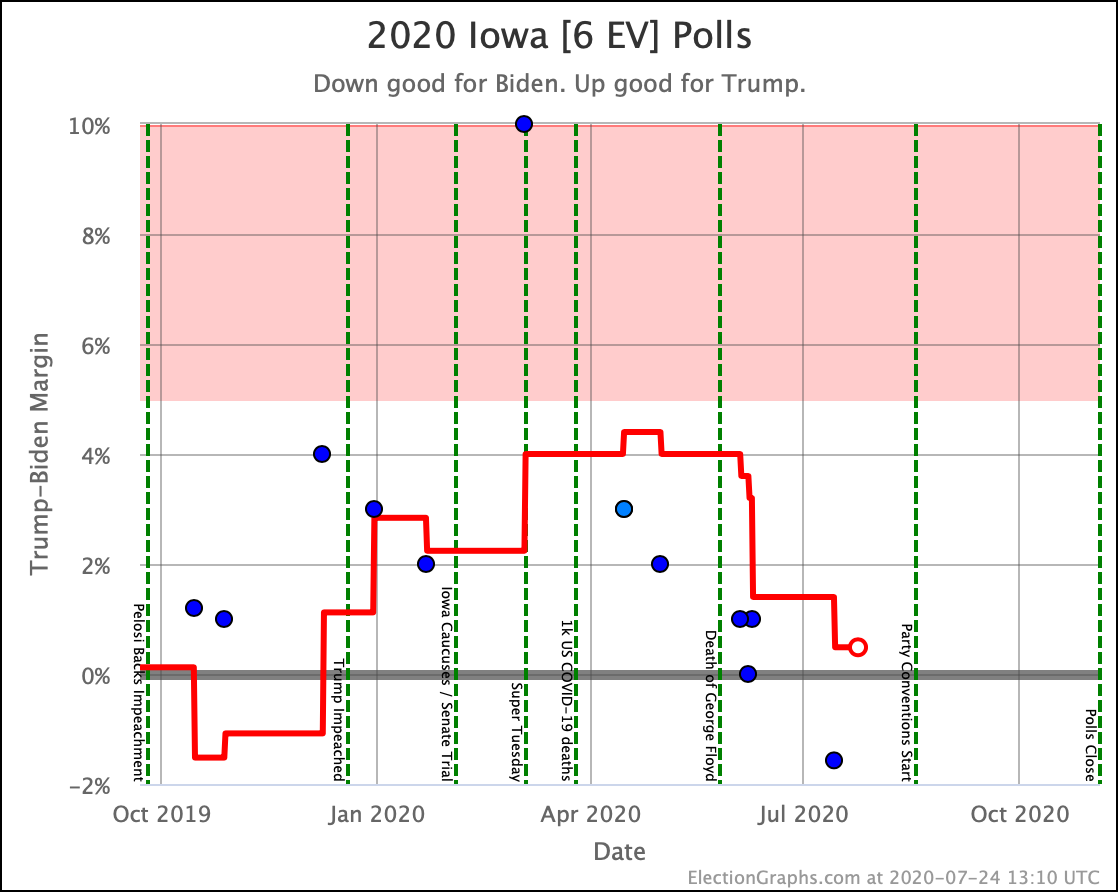
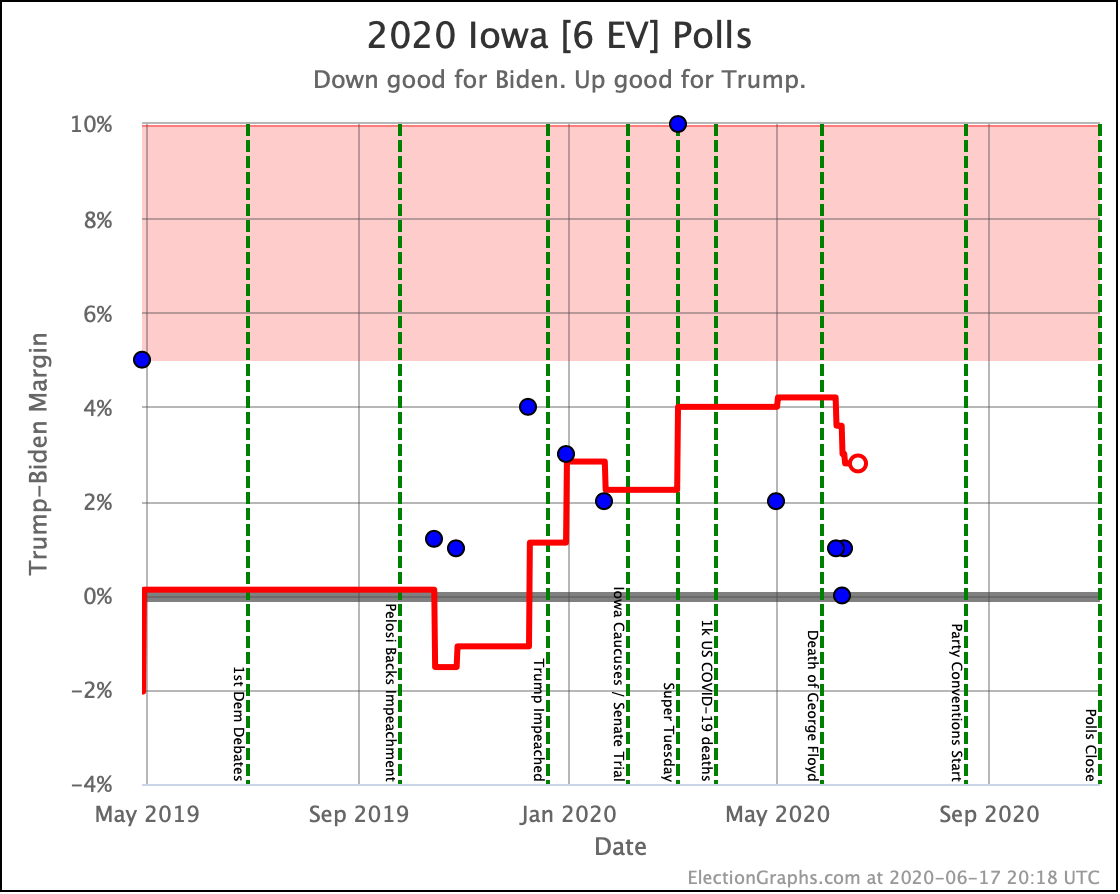
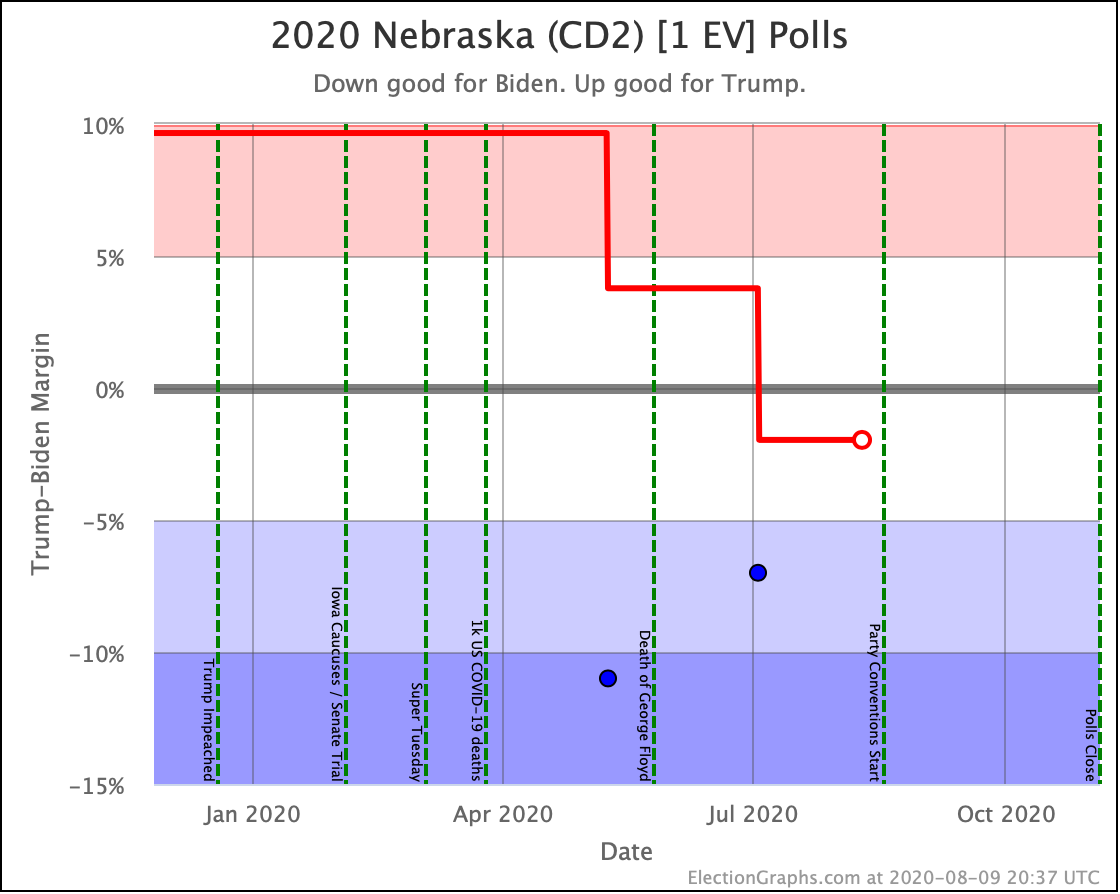
First, it was Iowa that moved from barely Trump to barely Biden, improving Biden's margin in the case where each candidate wins every state where they lead the average. But Biden leads Iowa by only 0.2%. And it looks pretty likely that the lead is due to a single outlier poll that showed a 6% Biden lead. So far no other polls indicate a Biden lead of that magnitude. So it would not be surprising at all to see Iowa slip back to the Trump side with the next poll, or at least when that outlier slips out of the average.
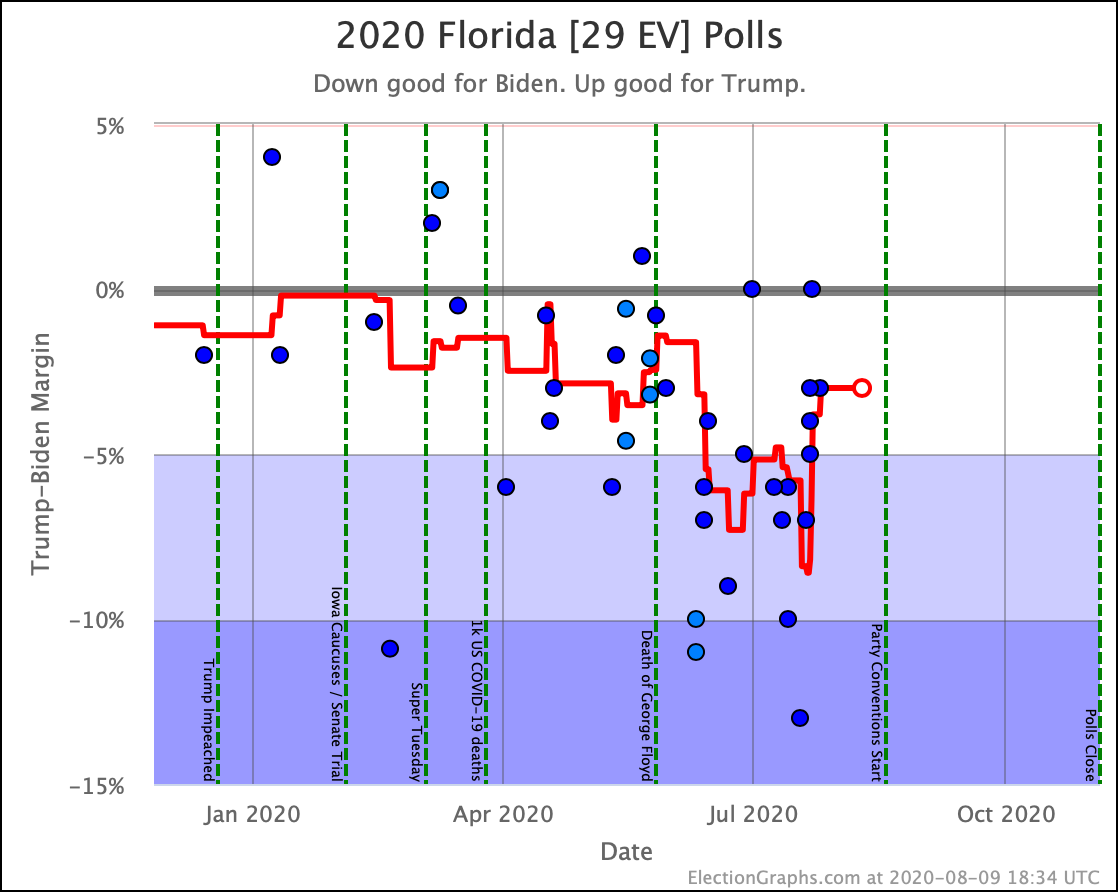
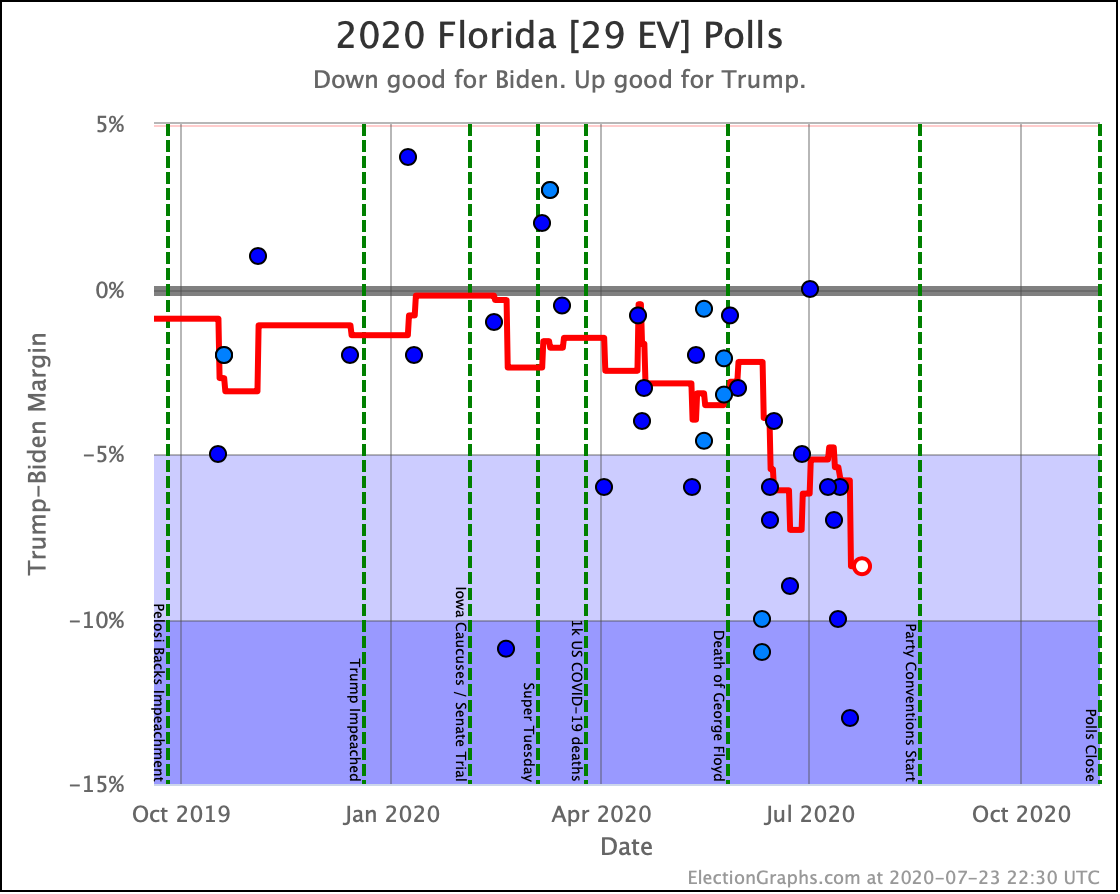
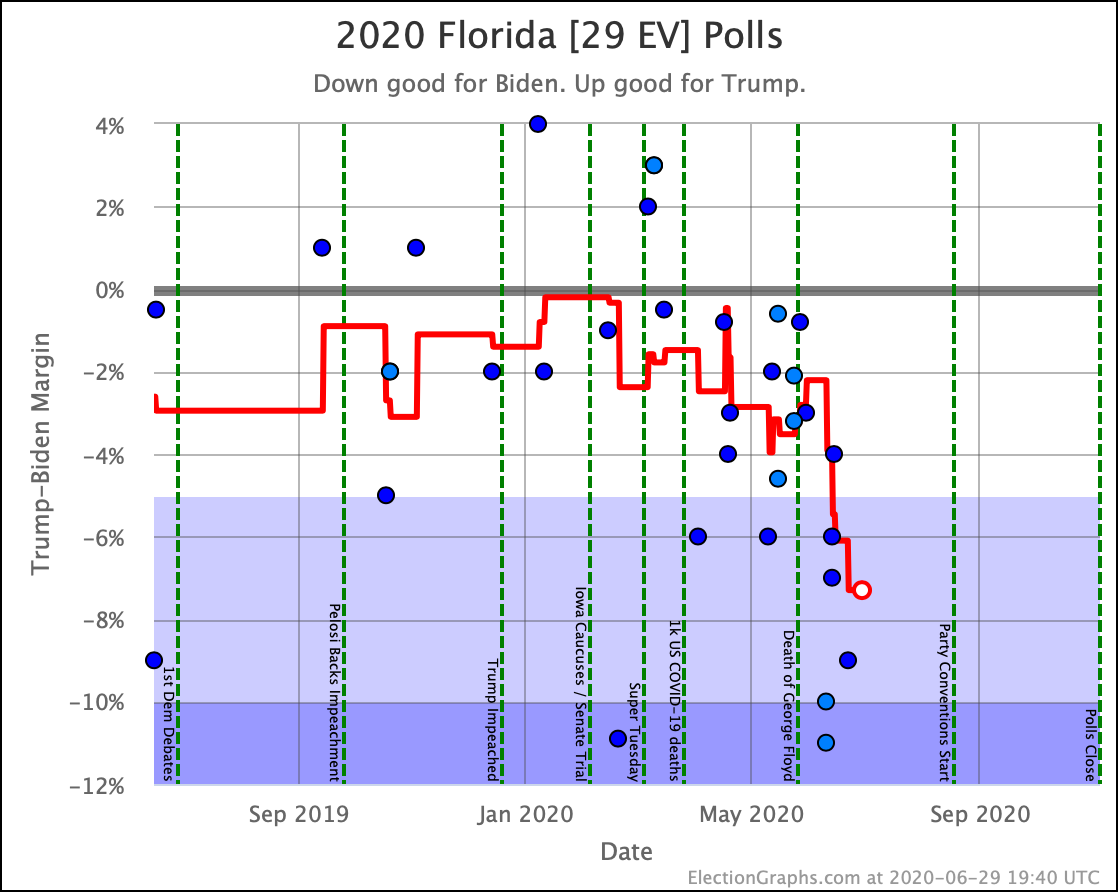
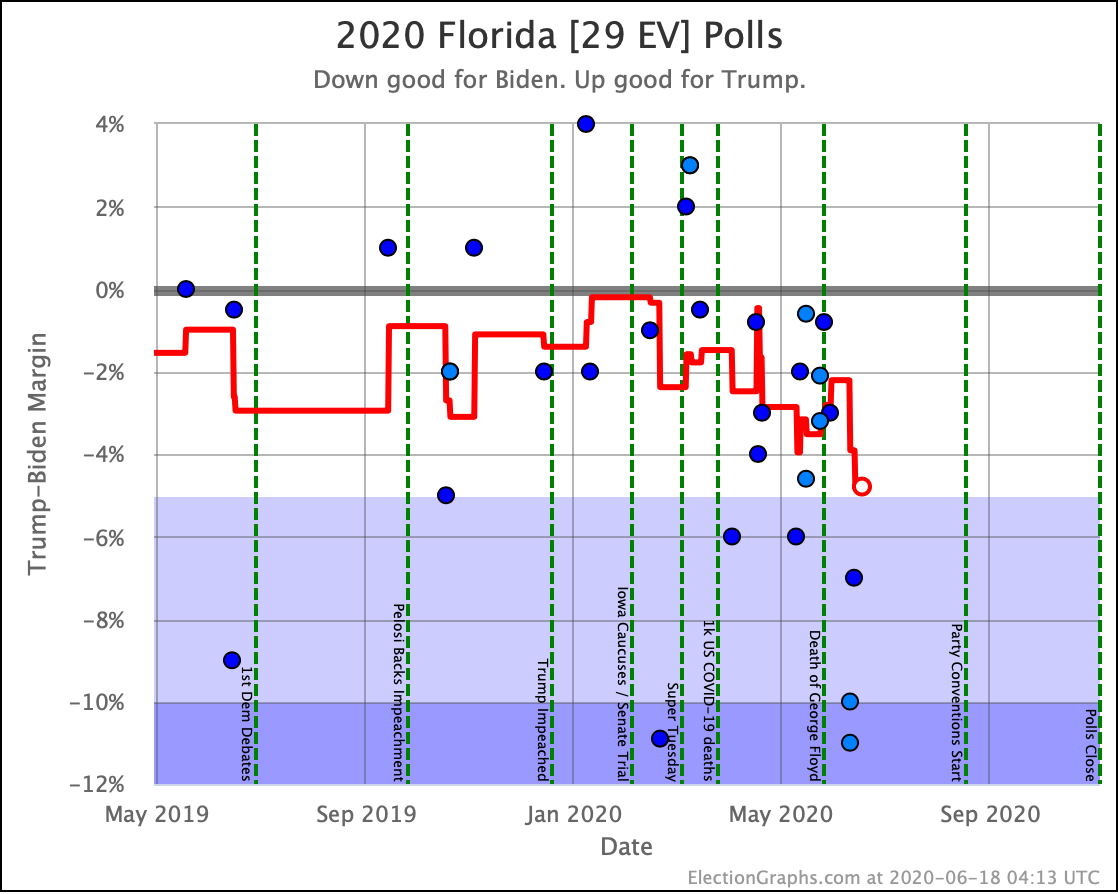
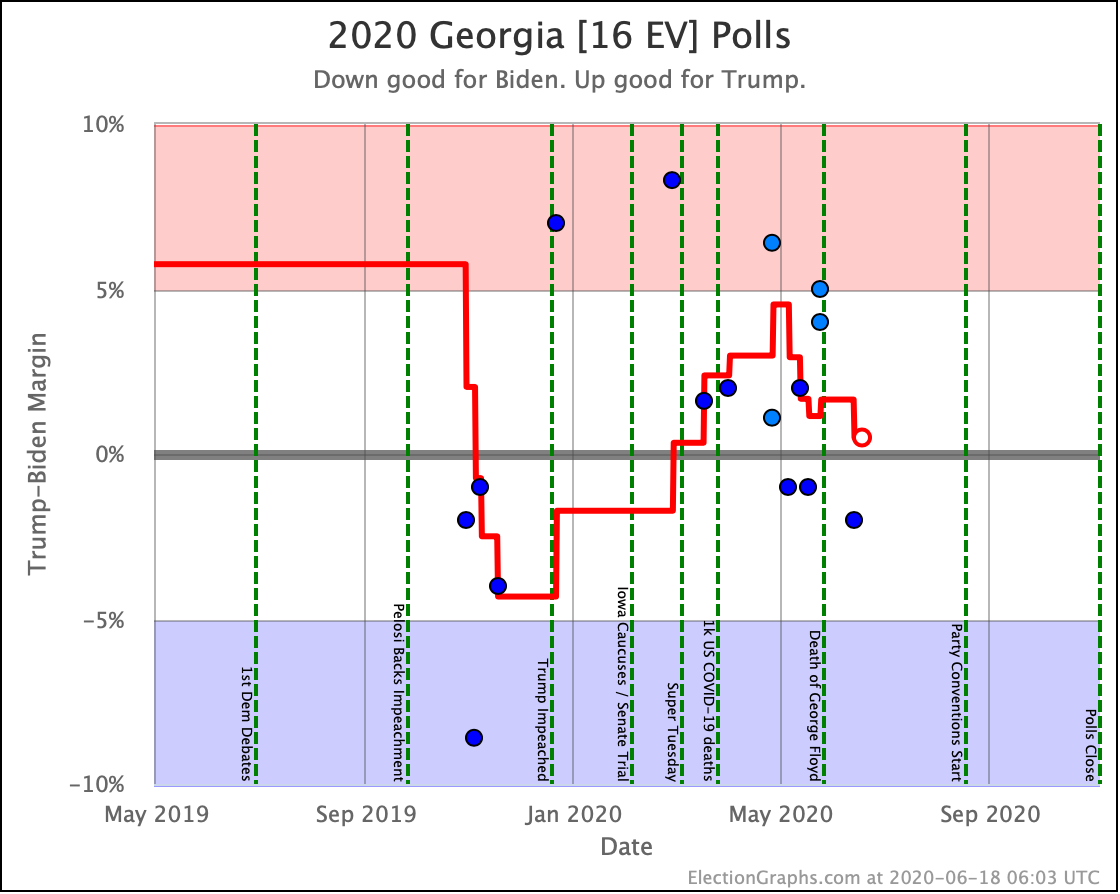
But then there is Florida. Biden's substantial lead in Florida has slipped significantly. He still leads, but no longer by huge margins. In our average Biden now only leads Florida by 3.0%. If the election was today, we estimate that translates into a 73.8% chance that Biden would win the state. But we actually have 86 days until the election, and there is plenty of room for this to move further.
The substantial swings here over June and July indicate that as polarized as things tend to be these days, there is still a non-trivial group of voters who have shown they can change their minds over time. In this case, they moved away from Trump for a while, but seem to be coming home again, once again putting Florida within Trump's reach.
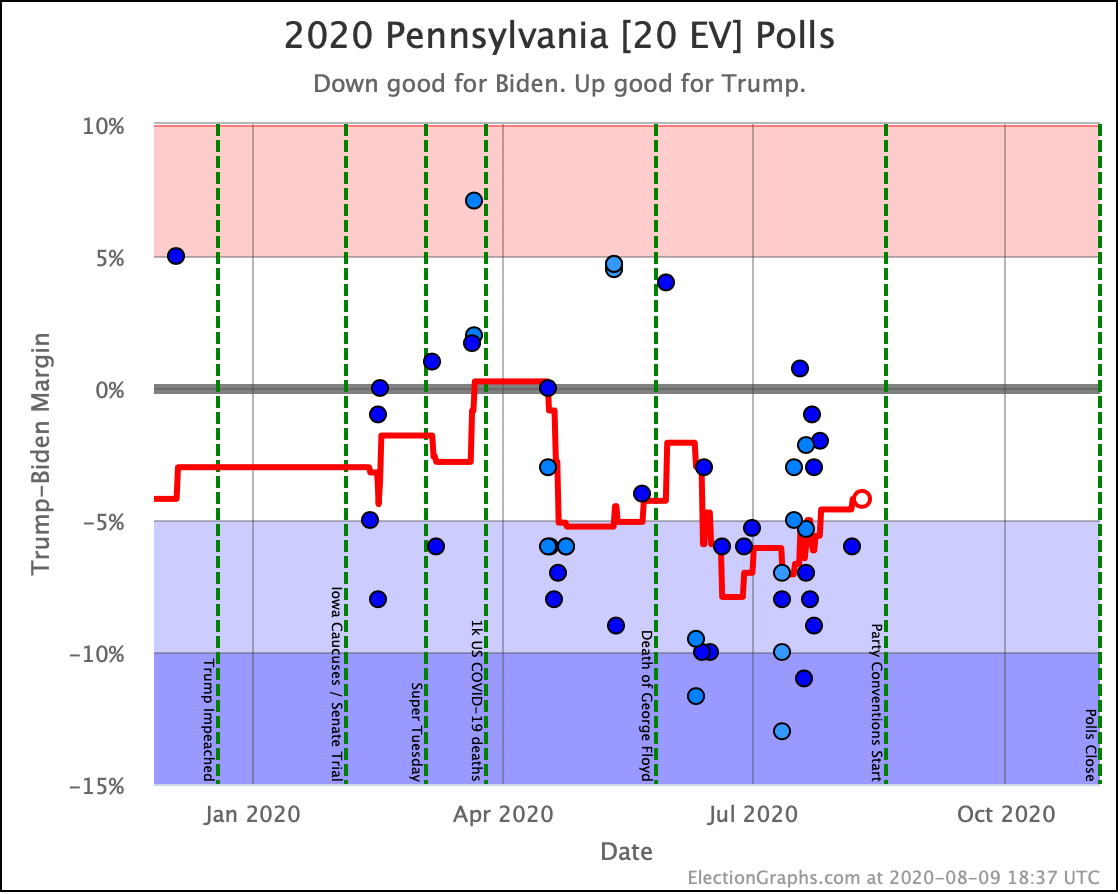
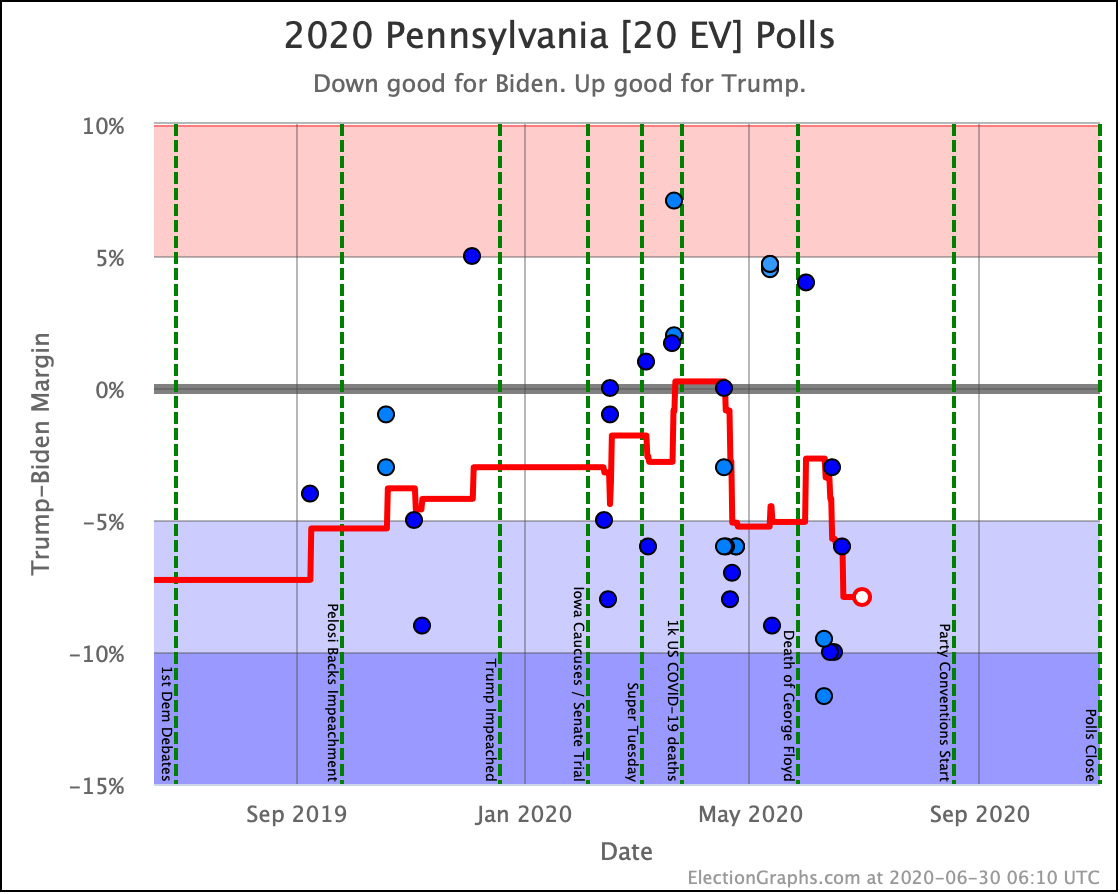
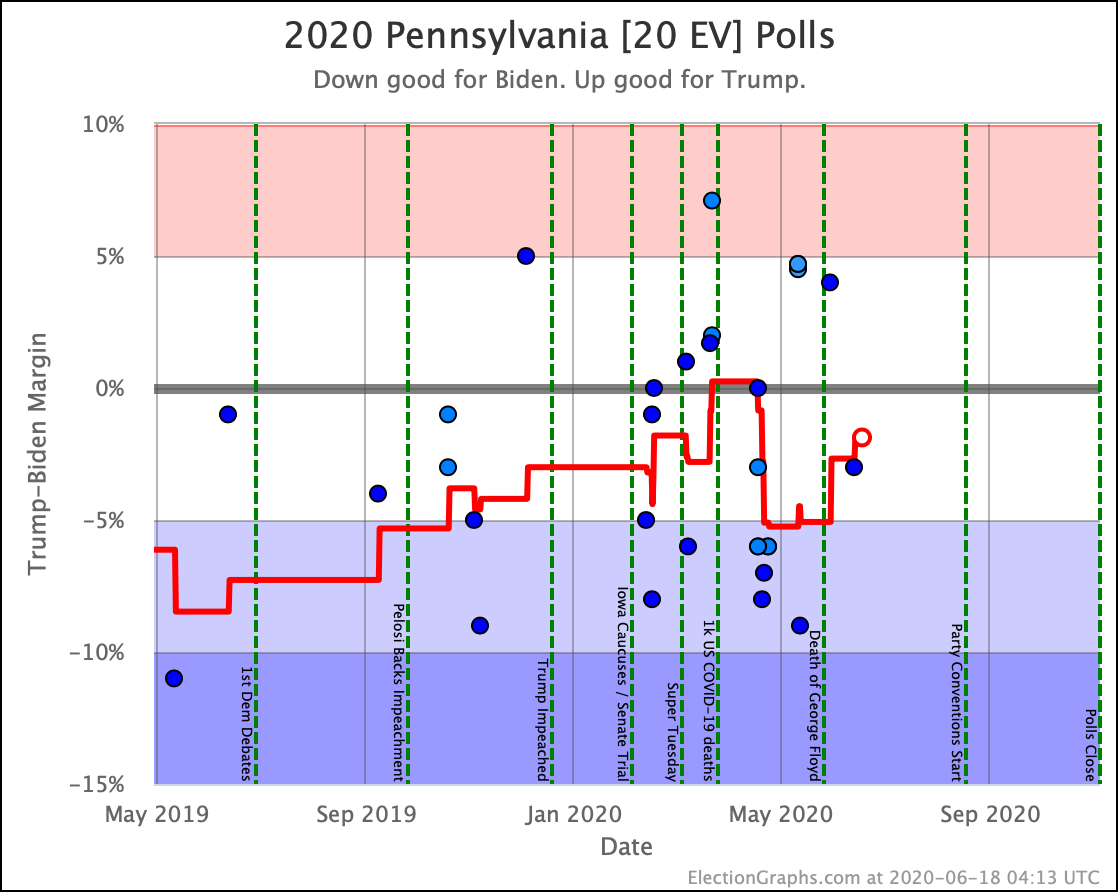
Much the same pattern has played out in Pennsylvania. Biden built a substantial lead in June, but over the course of July, it faded quite a bit. Biden still leads Trump by 4.2% in Pennsylvania, translating into an 84.9% chance of winning the state in our model if the election was today. But that is significantly less certain than the 98.8% we had at Biden's peak.
Given Florida's 29 electoral votes and Pennsylvania's 20 electoral votes, together these states can change the margin by a massive 98 electoral votes.
Having these two states close enough to be in play is critical to Trump. At the moment, he is still behind, but close enough that it is easy to imagine scenarios where Trump could come back from behind and win them.
Not all of the movement was bad for Biden.
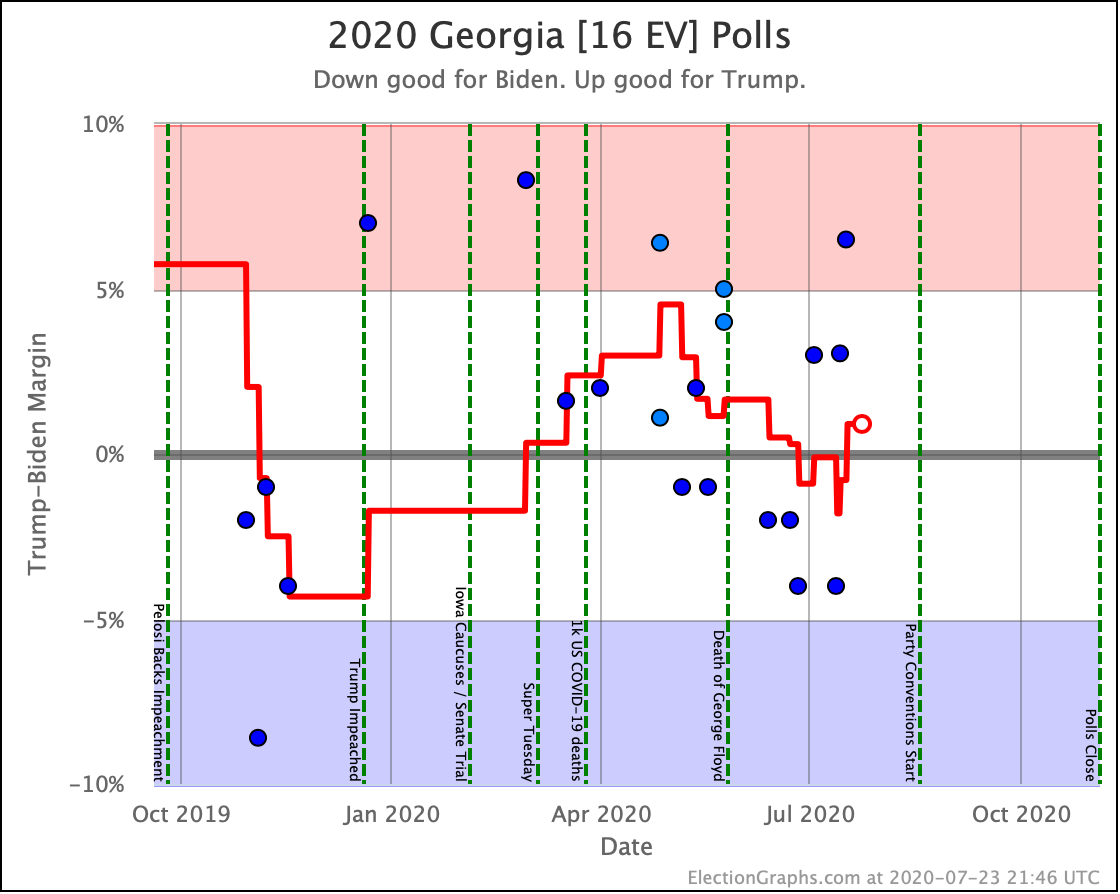
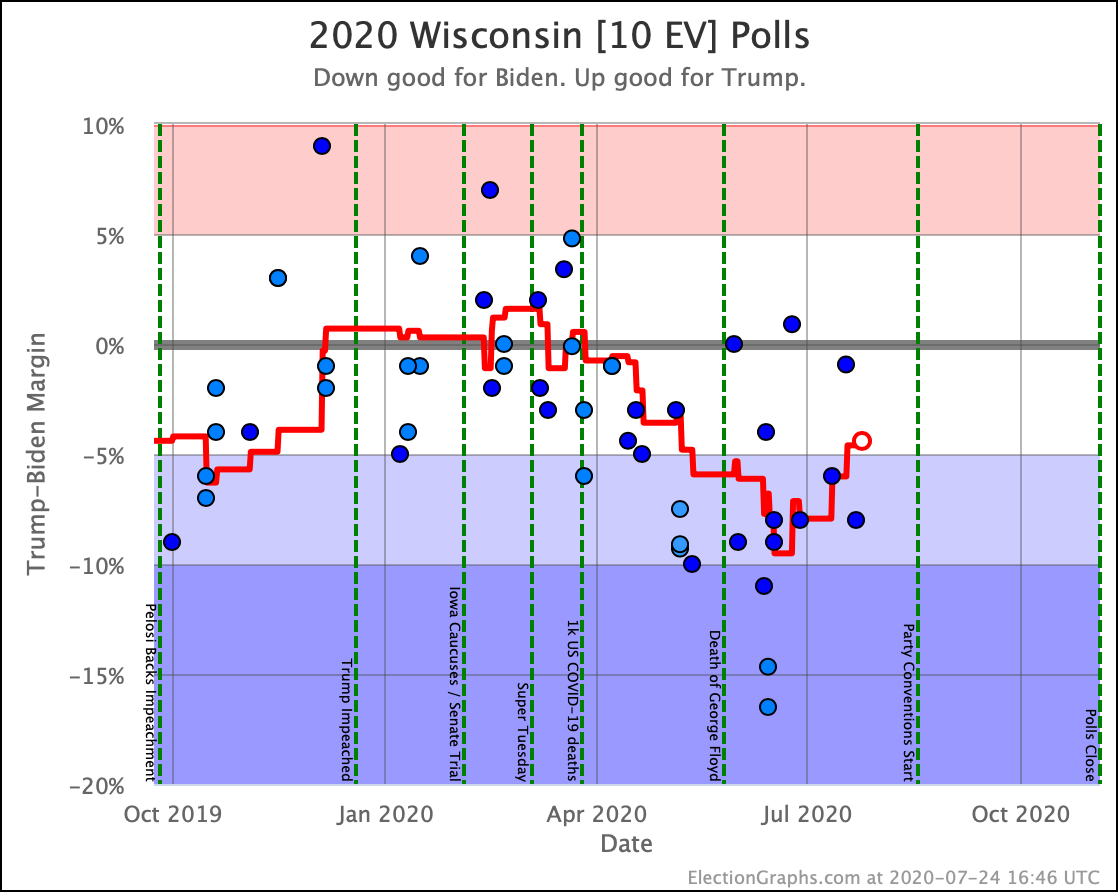
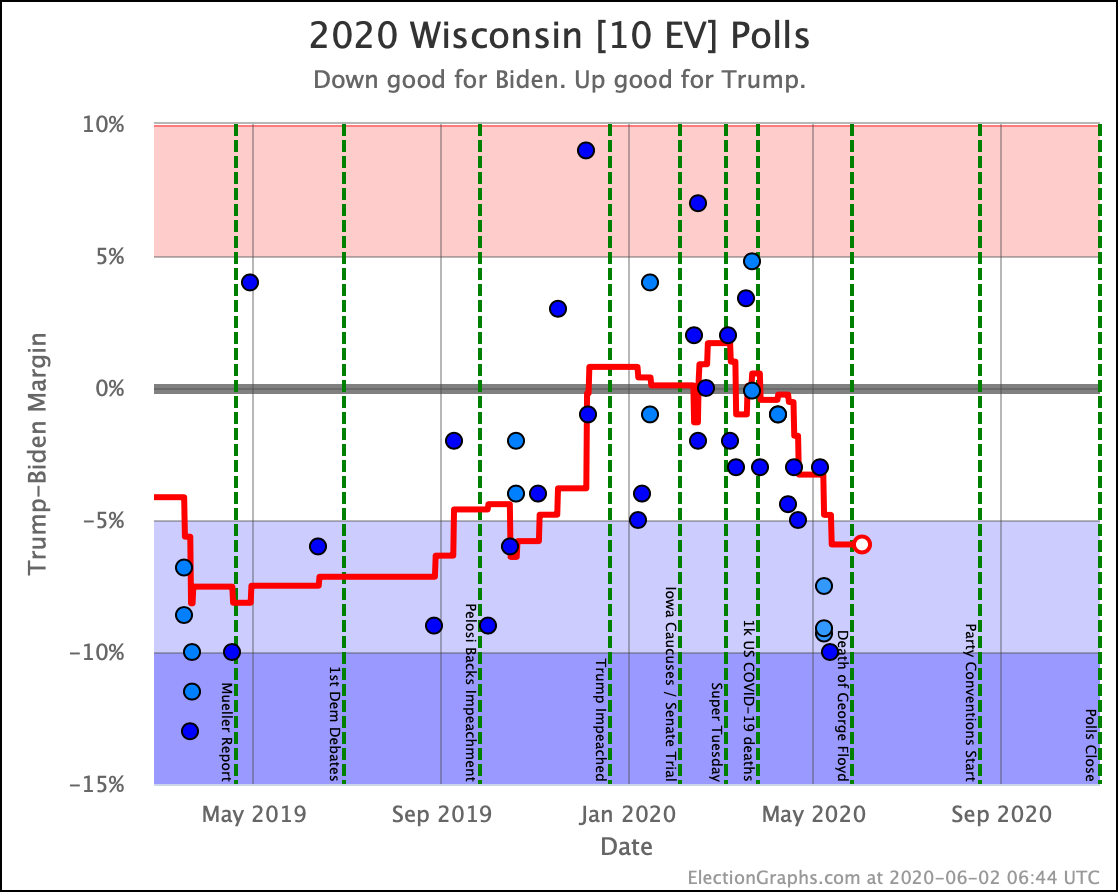
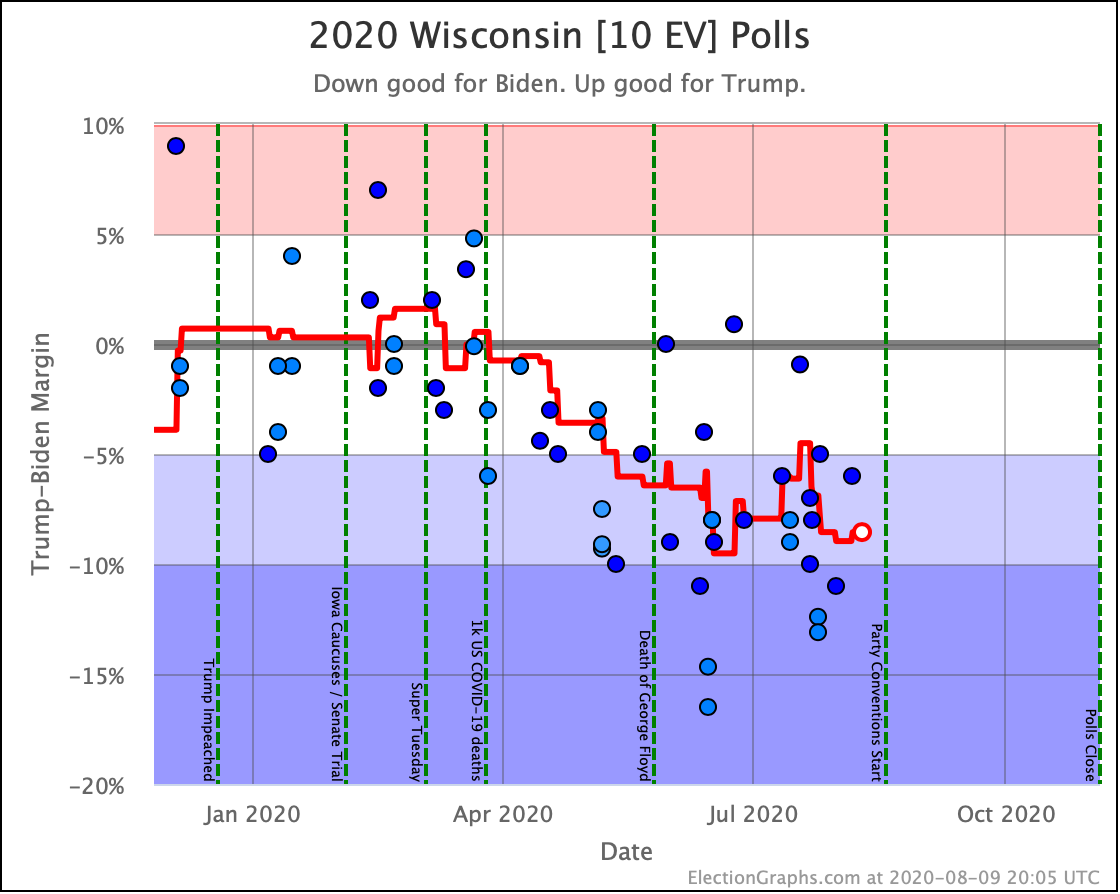
In Wisconsin, at the time of the last update, Wisconsin had flipped from "Strong Biden" down to "Weak Biden". But that didn't last long, and Wisconsin is once again a strong enough Biden state that we don't include it in Trump's best case. (At an 8.6% lead, our odds estimate is a 99.1% chance of a Biden win if the election was today.)
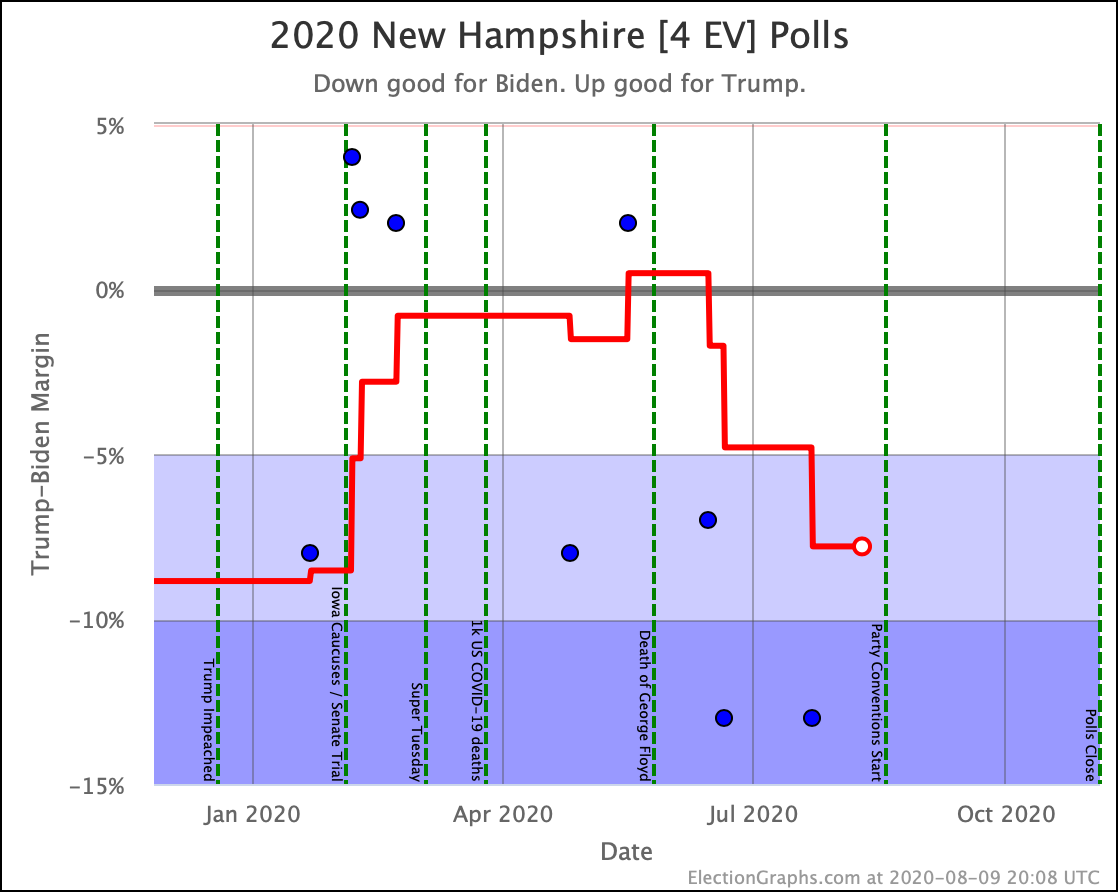
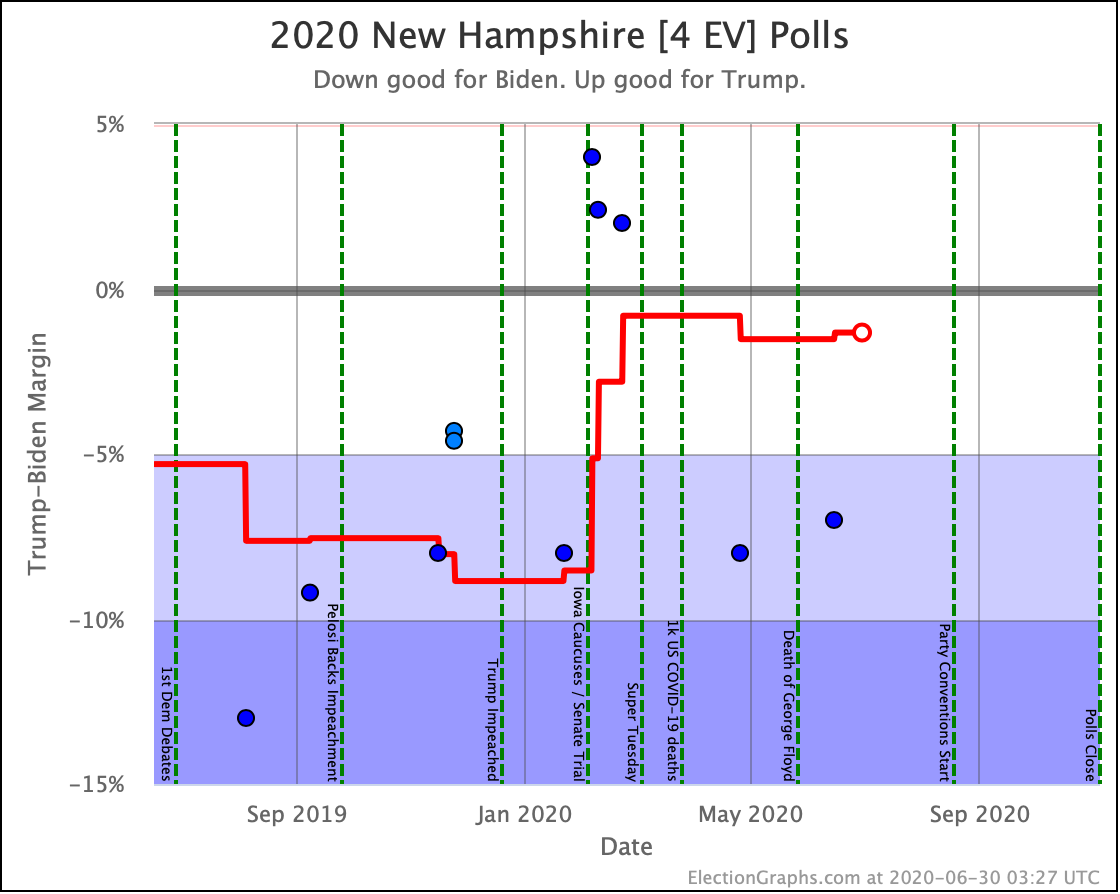
New Hampshire also moves out of Trump's reach with Biden leading the average by 7.8%, which would be a 98.6% chance of a win if the election was today.
But Wisconsin and New Hampshire are only 14 electoral votes, compared to 49 electoral votes for Florida and Pennsylvania. So the net change is 35 electoral votes in reach for Trump that were not when we did the last blog post, meaning a 70 electoral vote increase in Trump's best case.
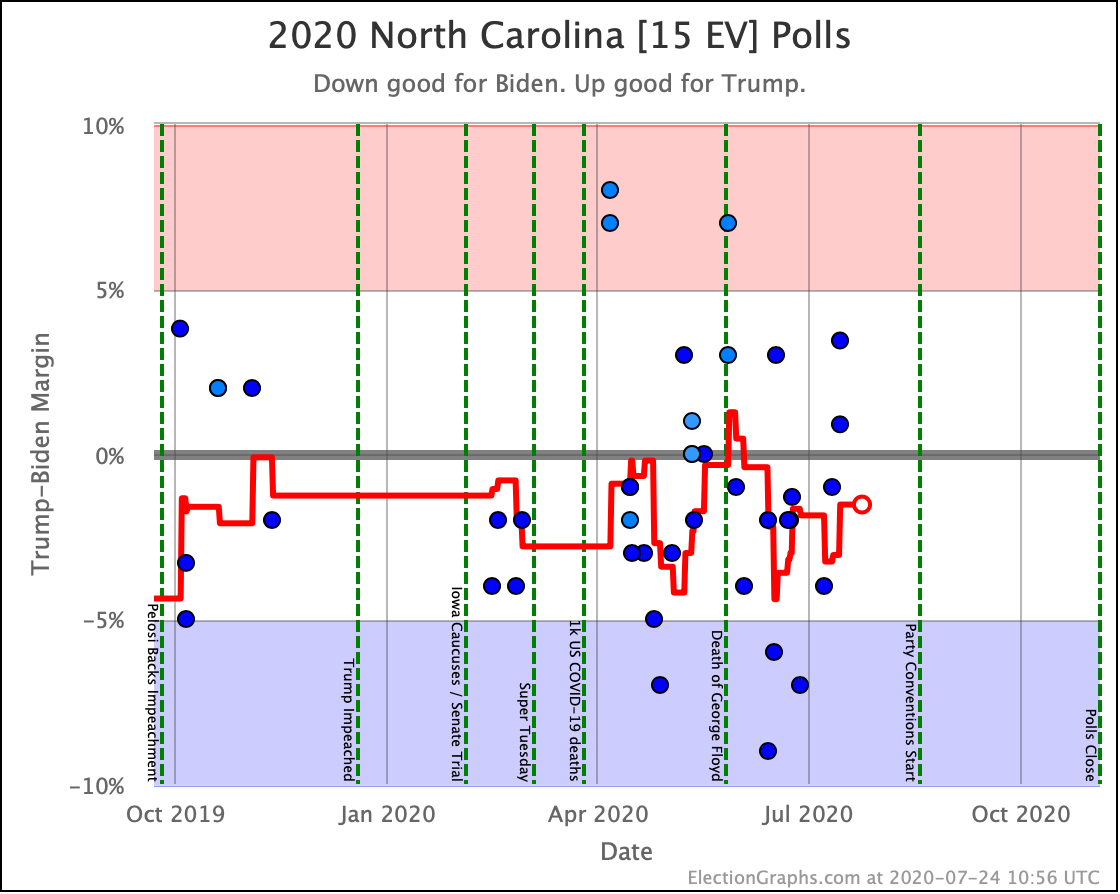
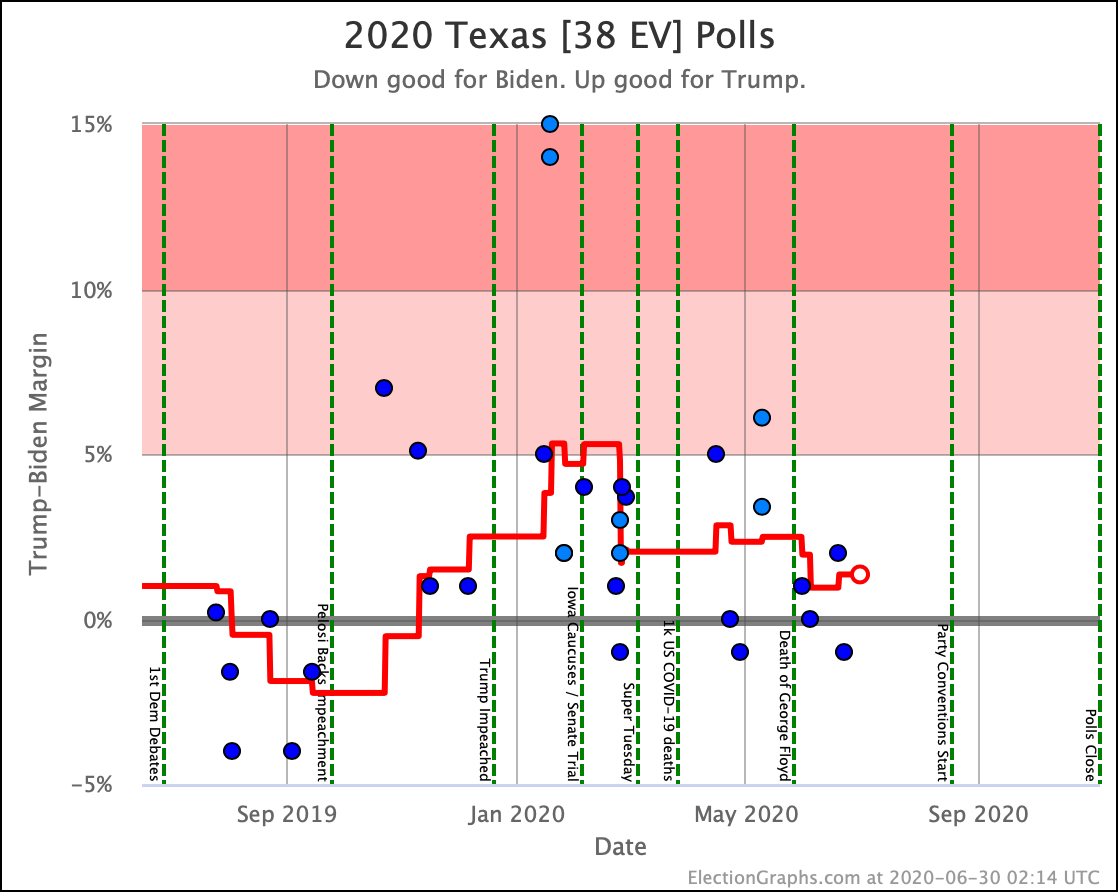
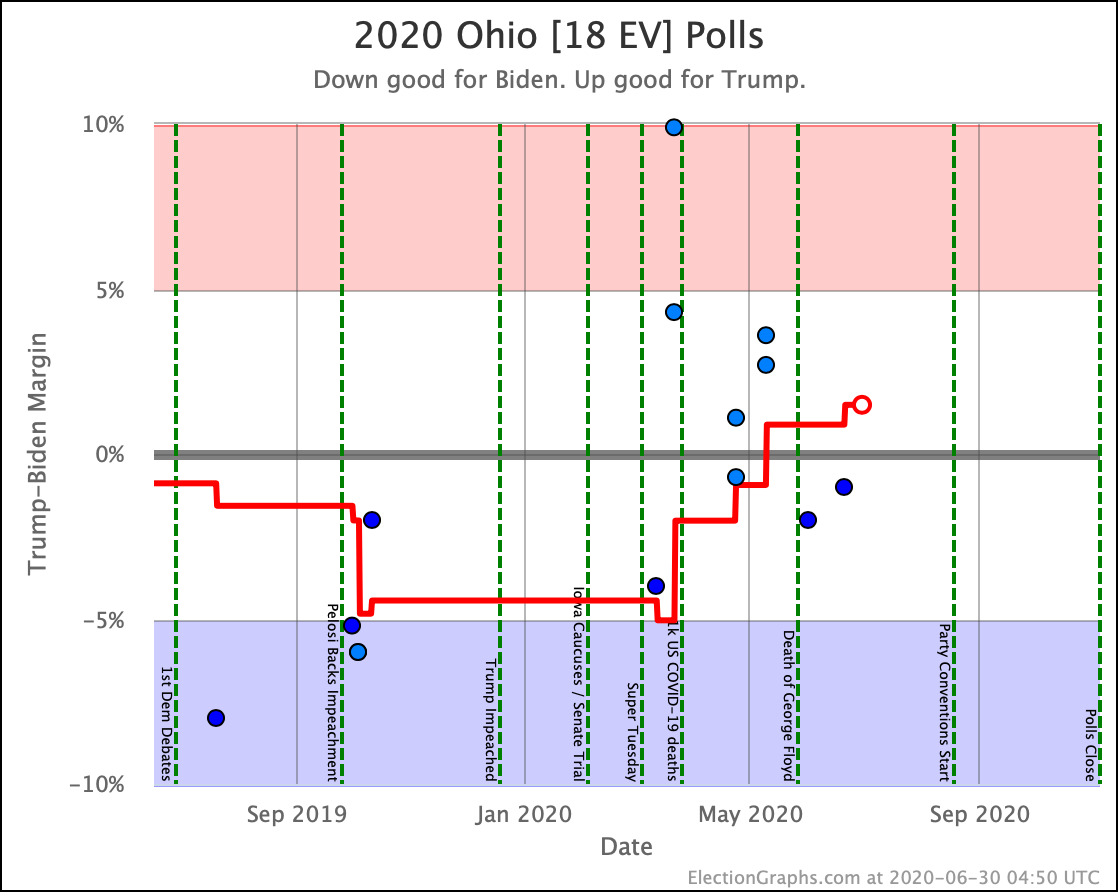
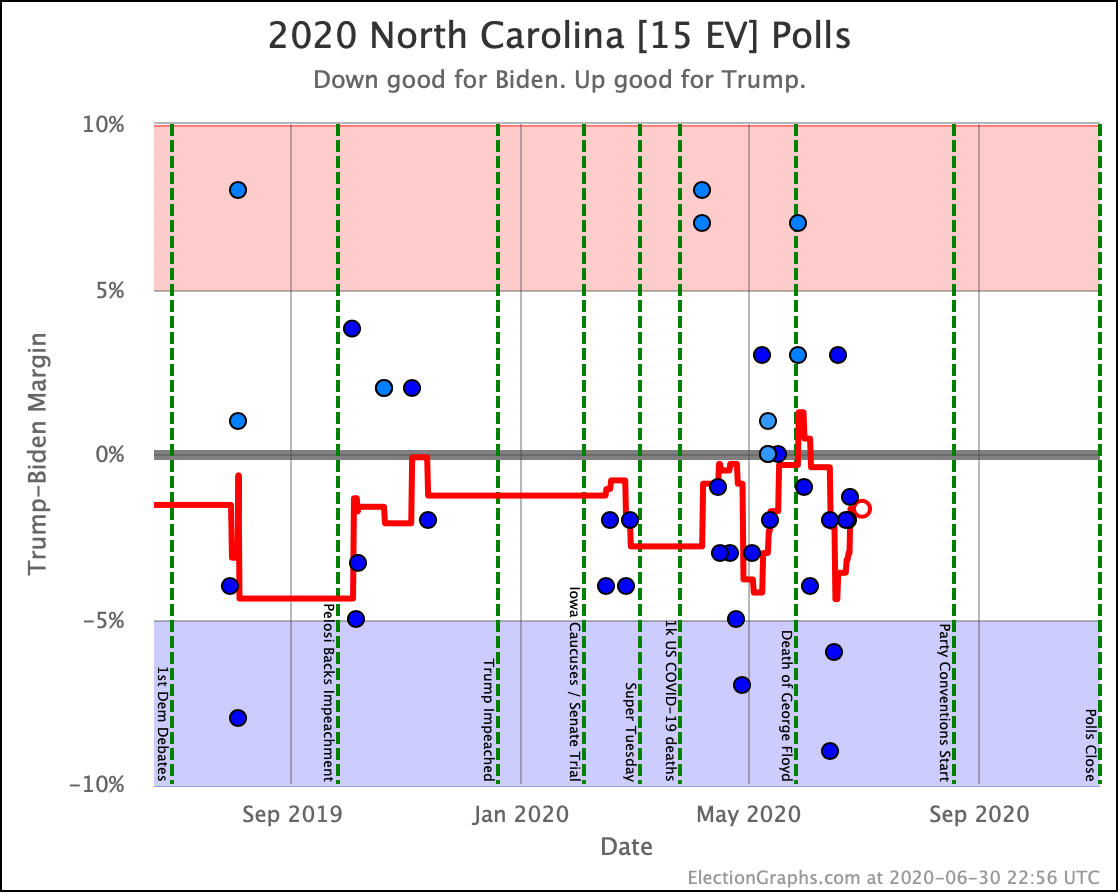
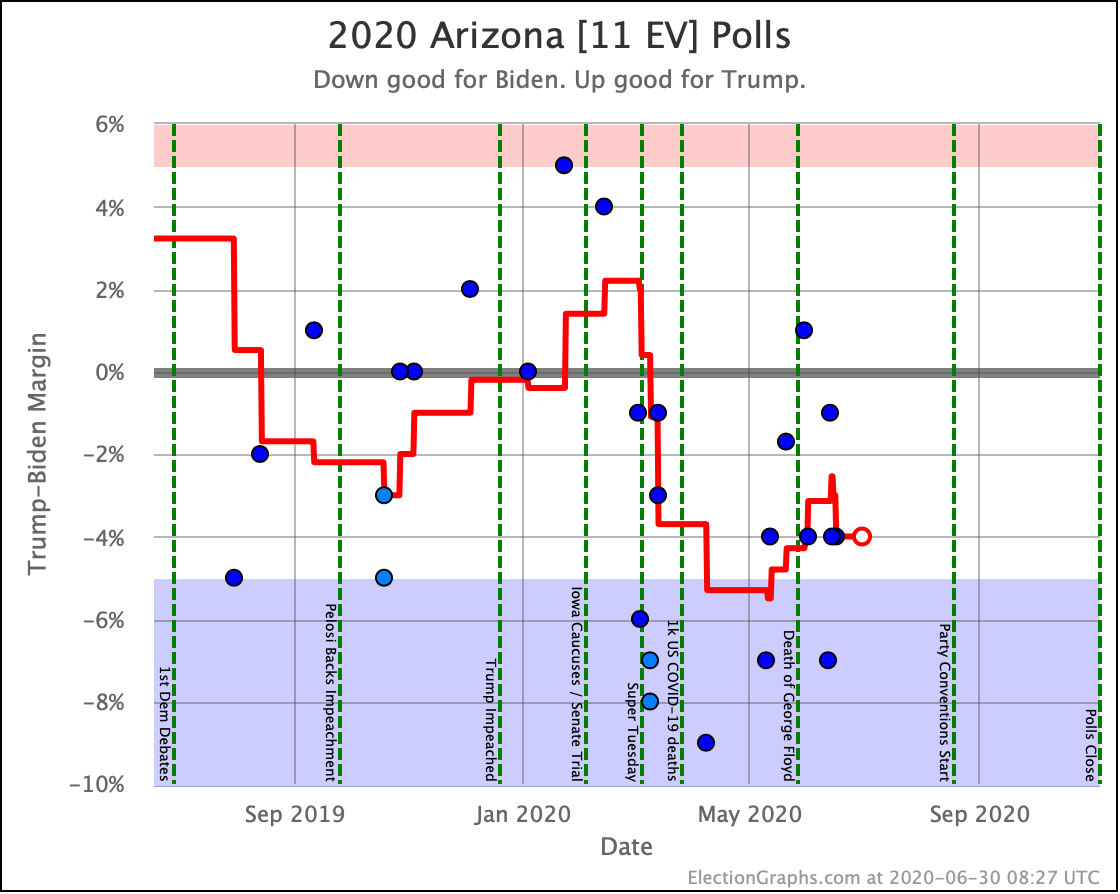
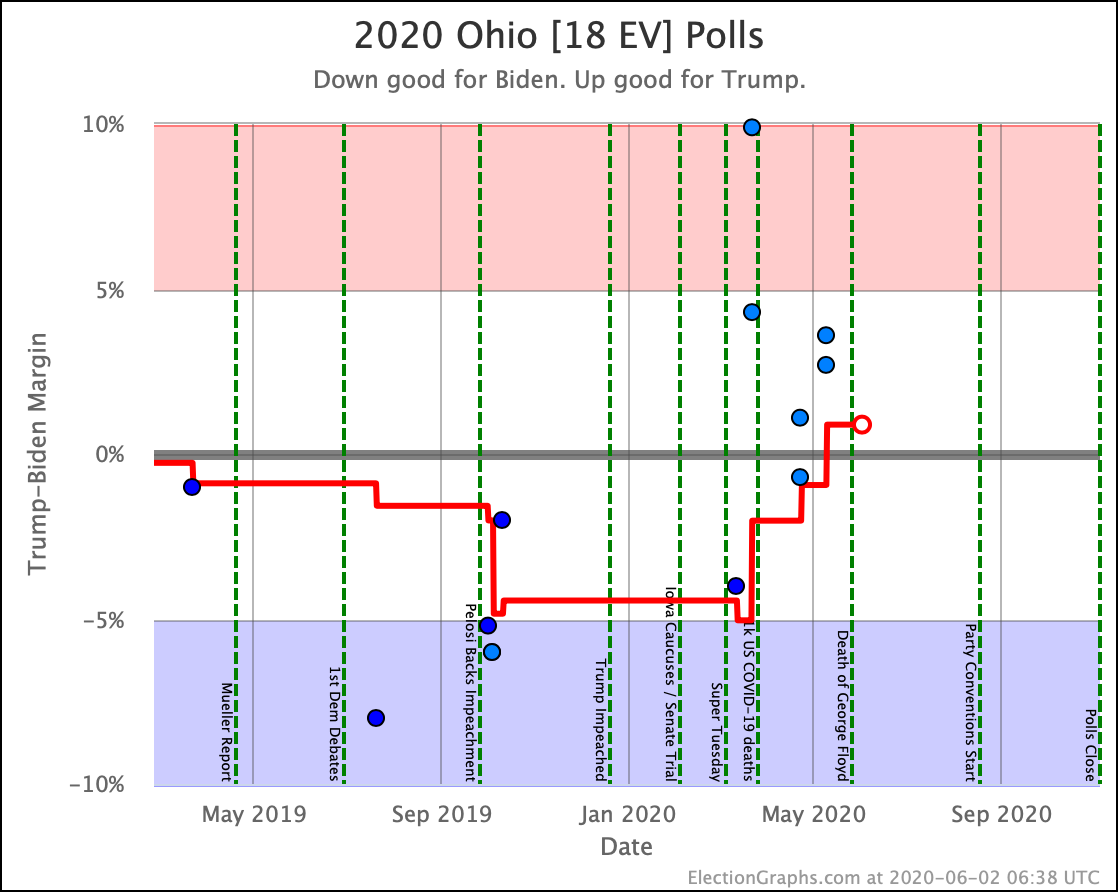
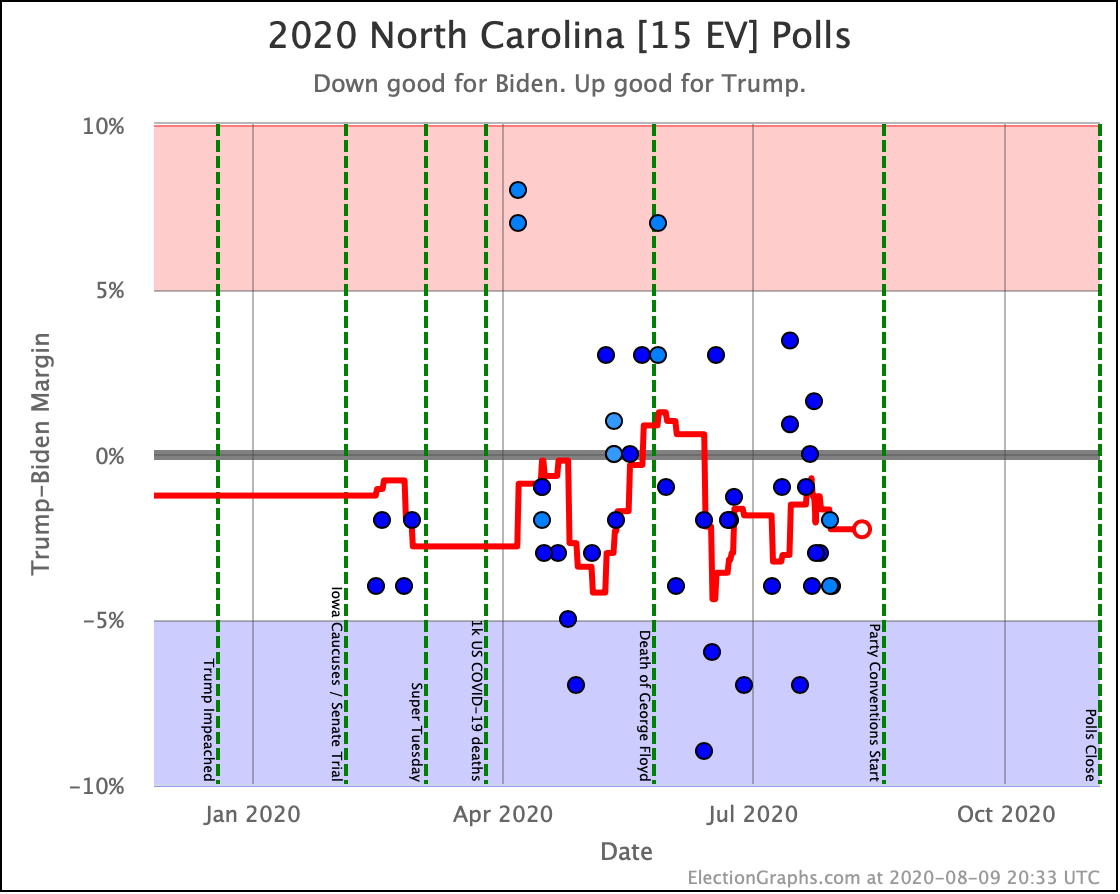
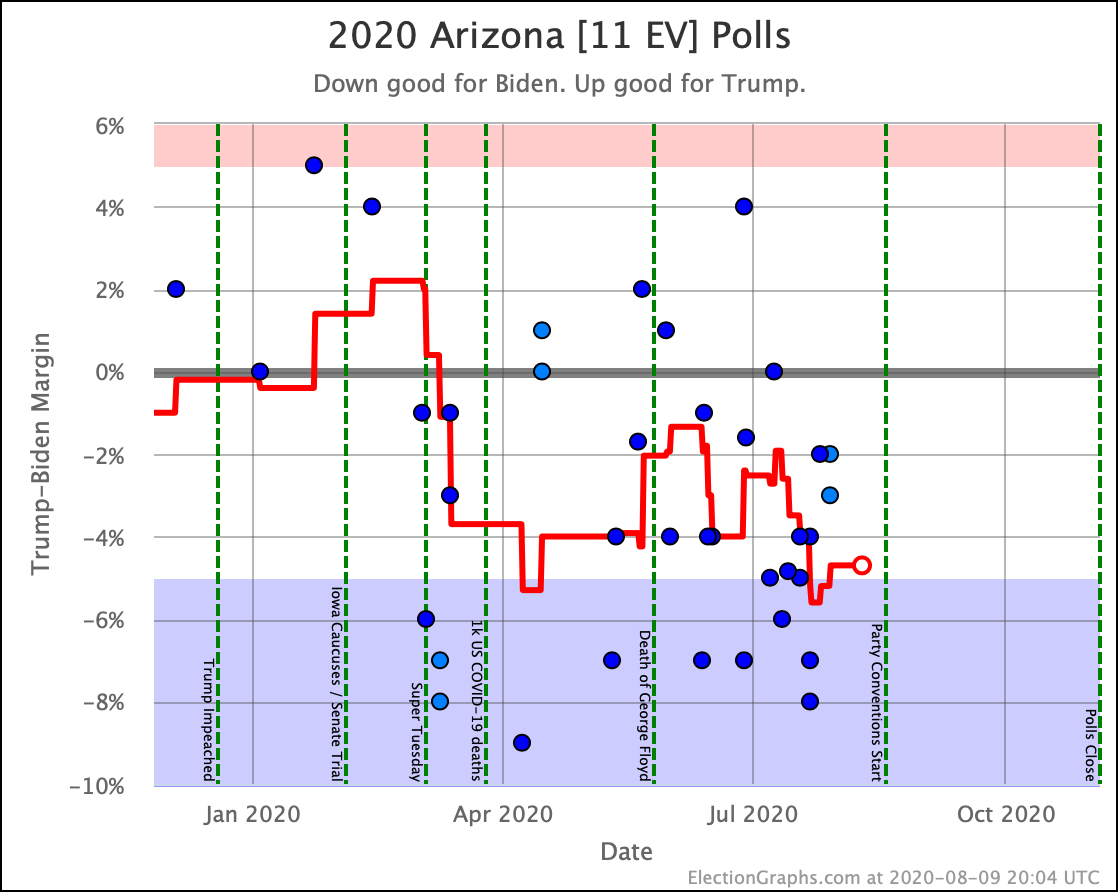
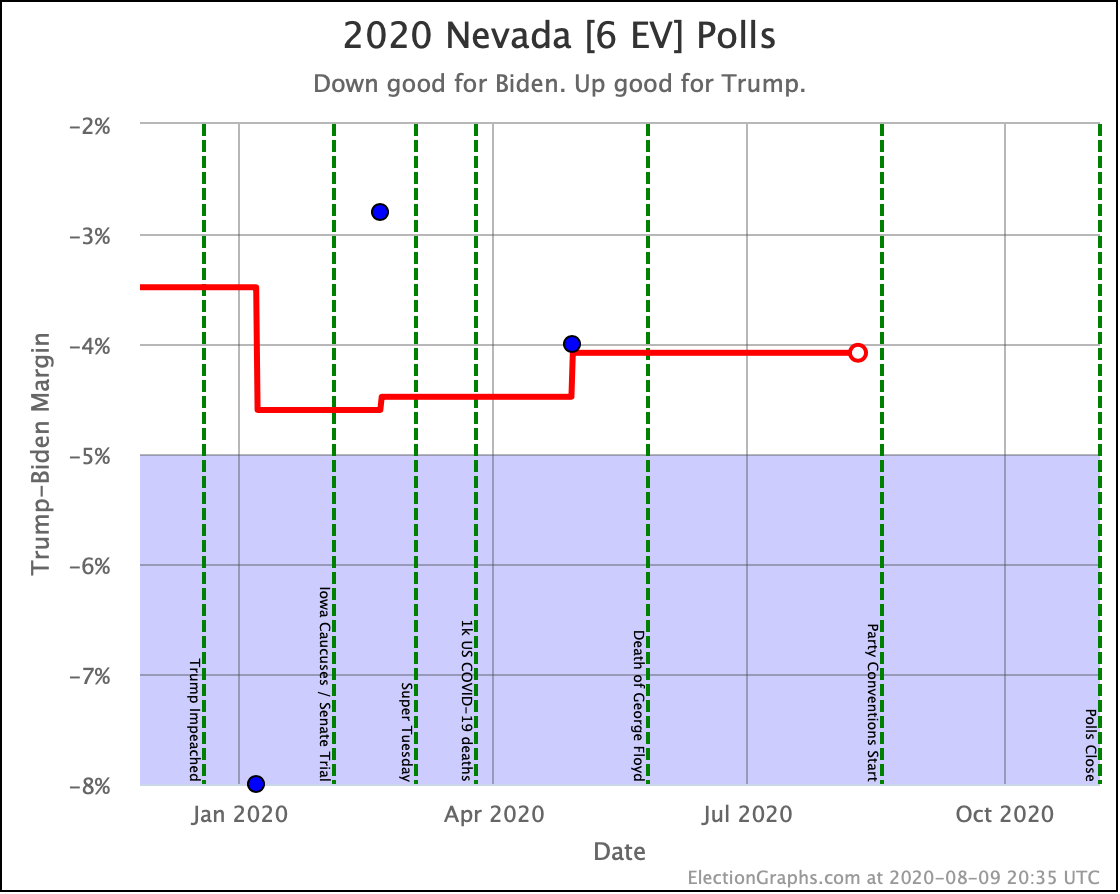
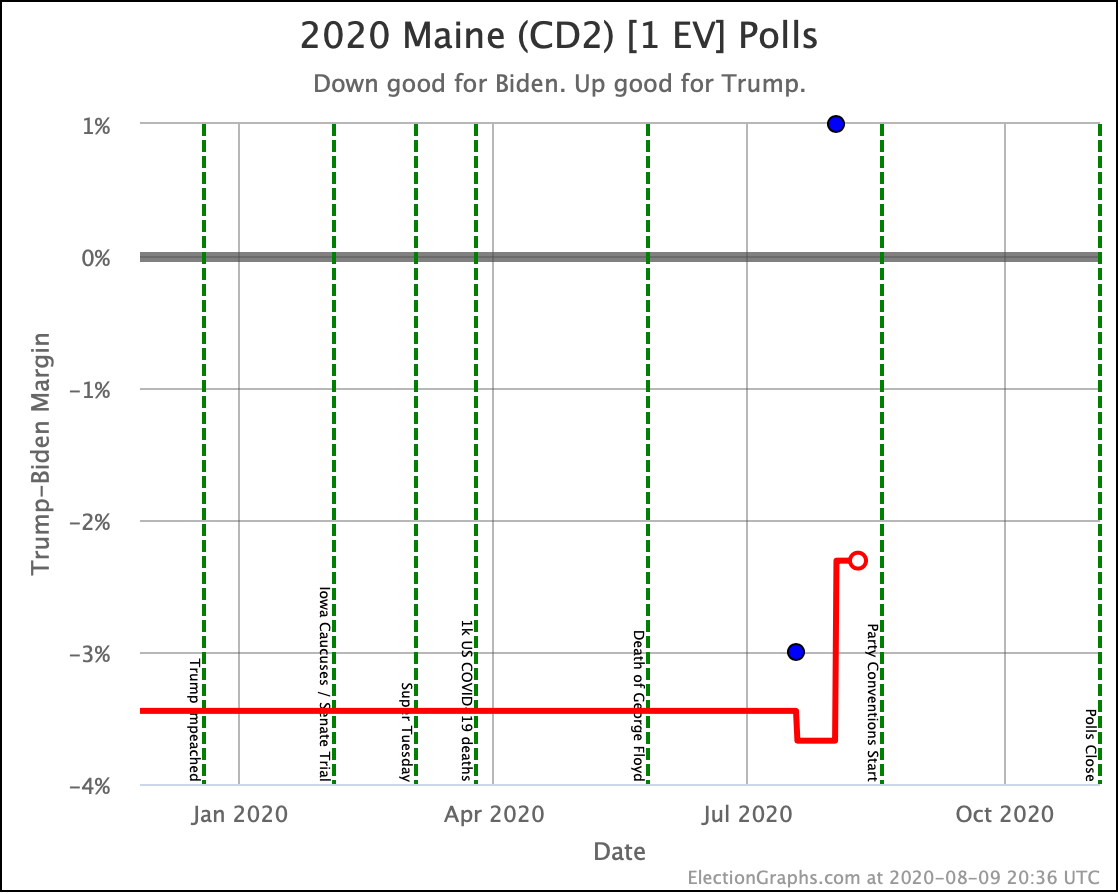
So, now to dash through the "weak" states that are in play that didn't switch broad categories this time around, in order by the number of electoral votes:
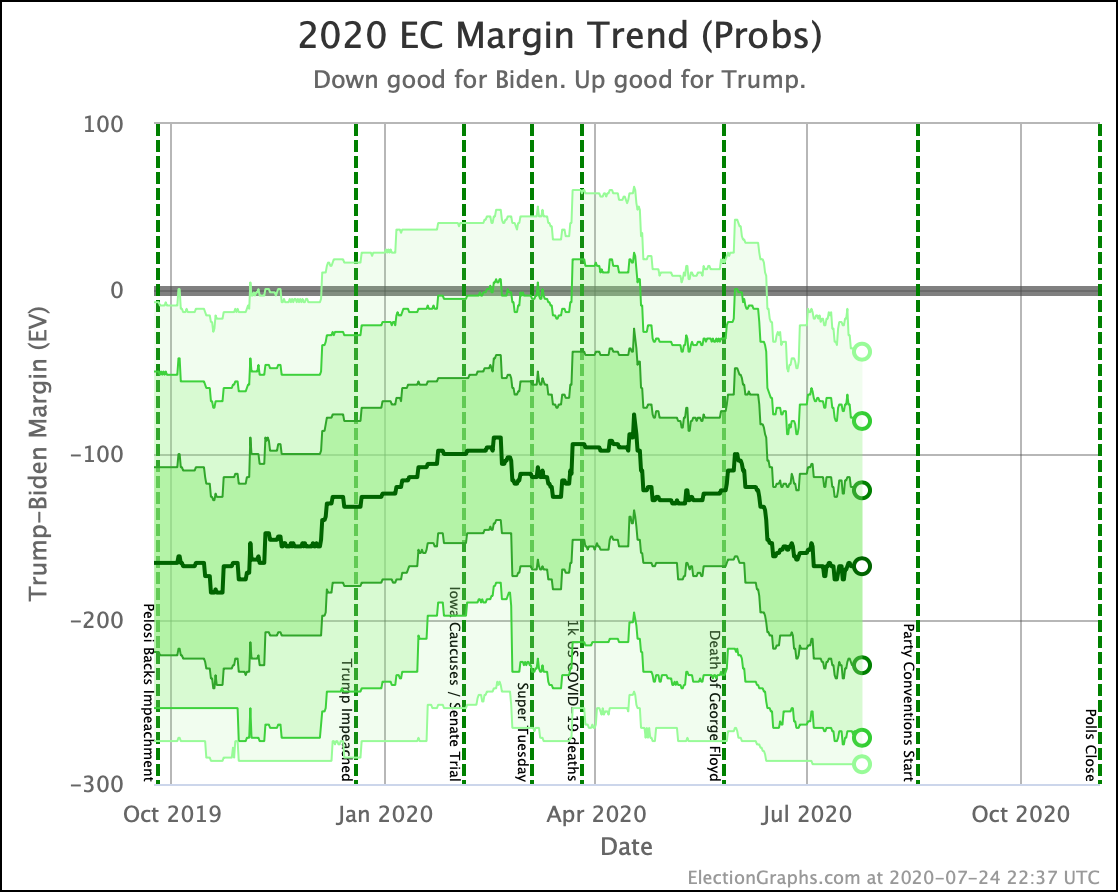
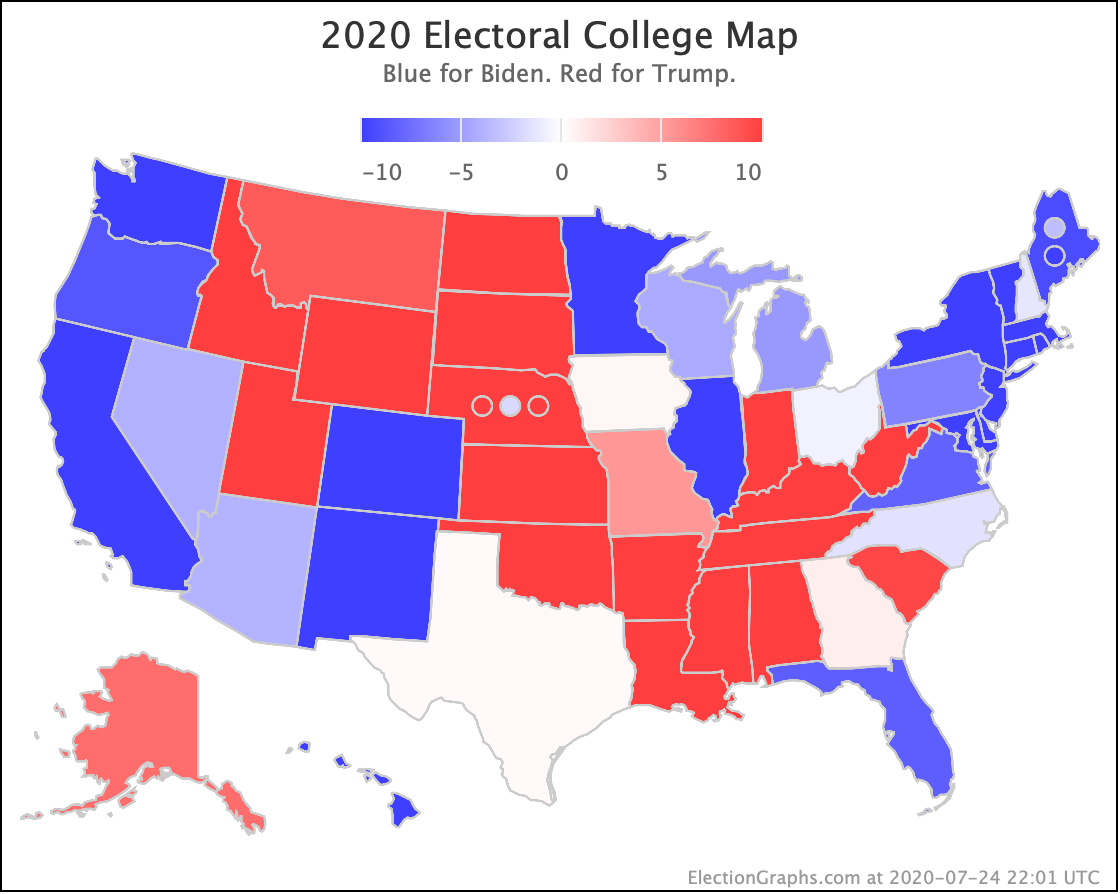
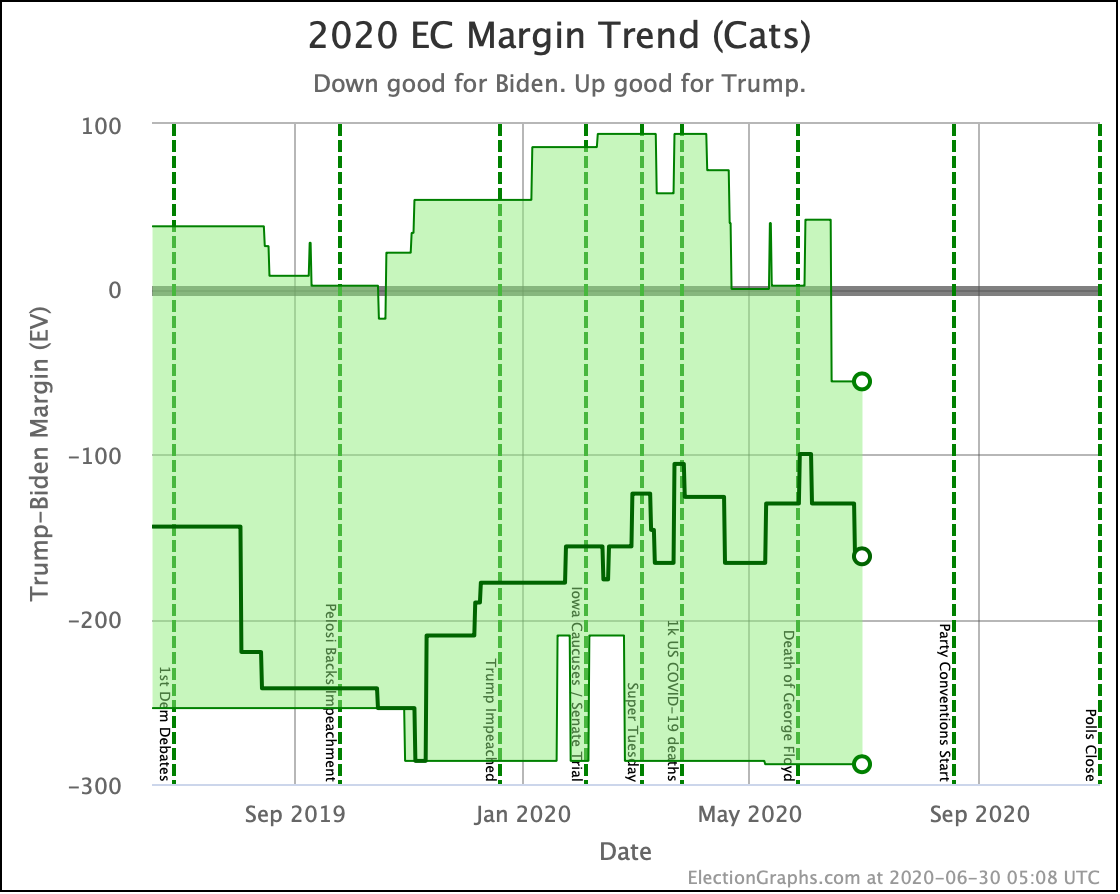
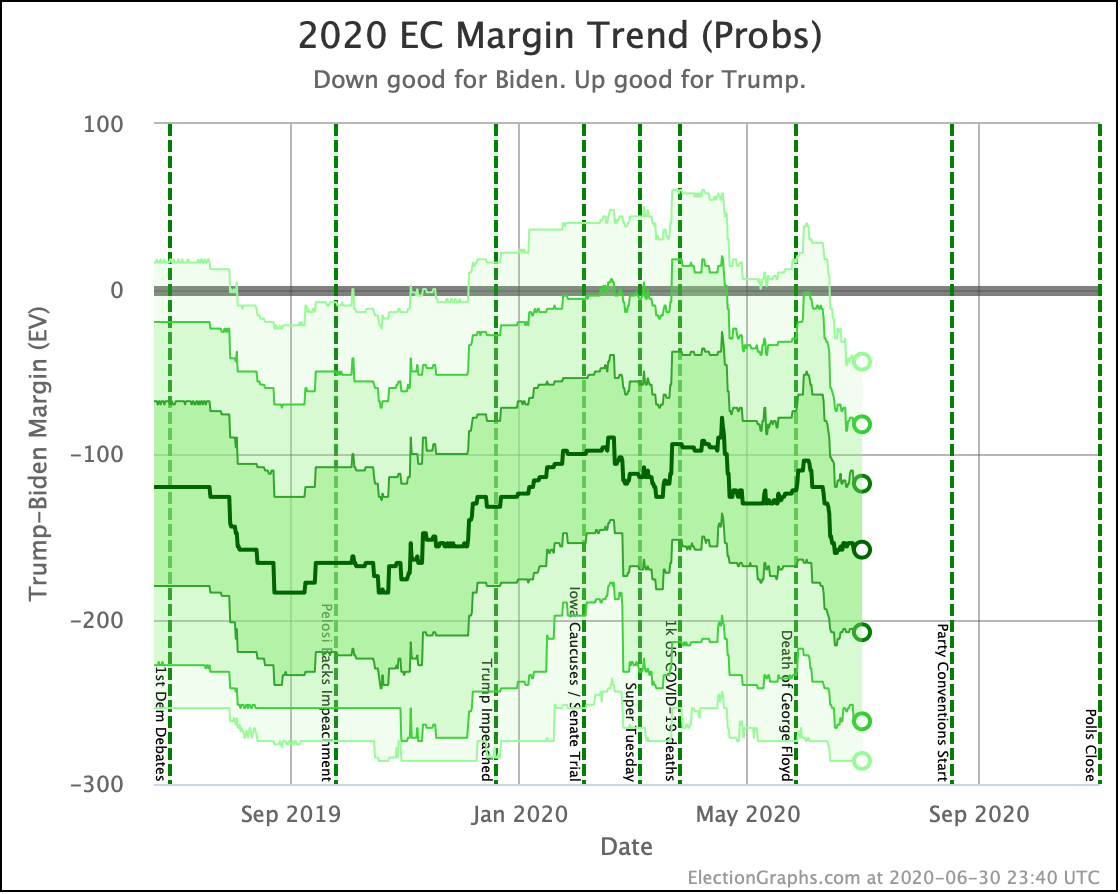
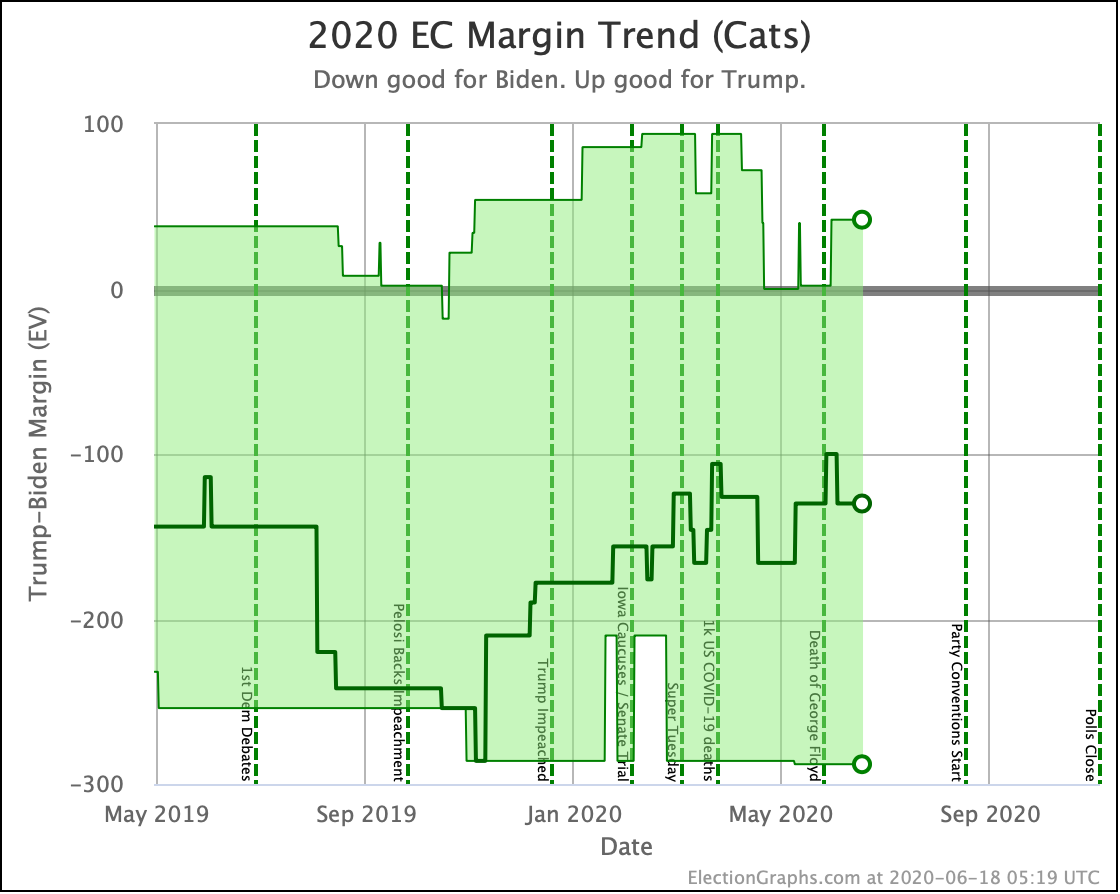
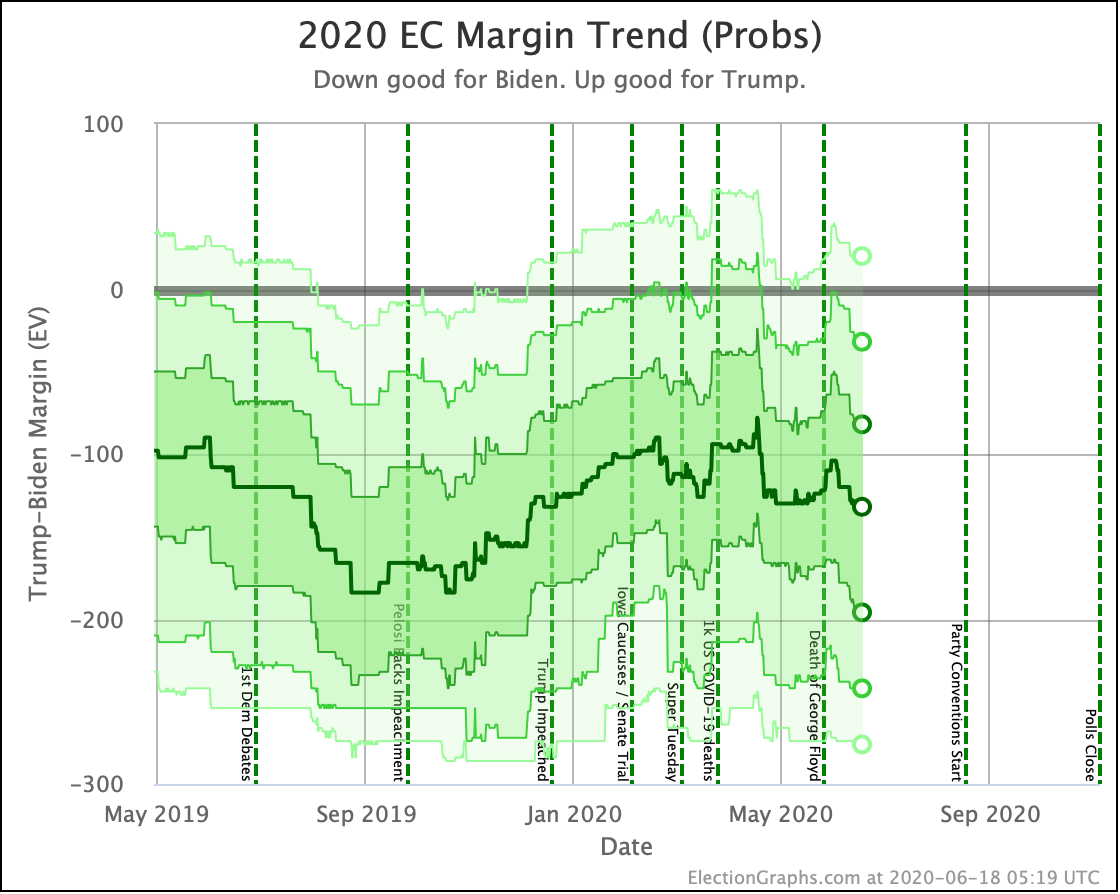
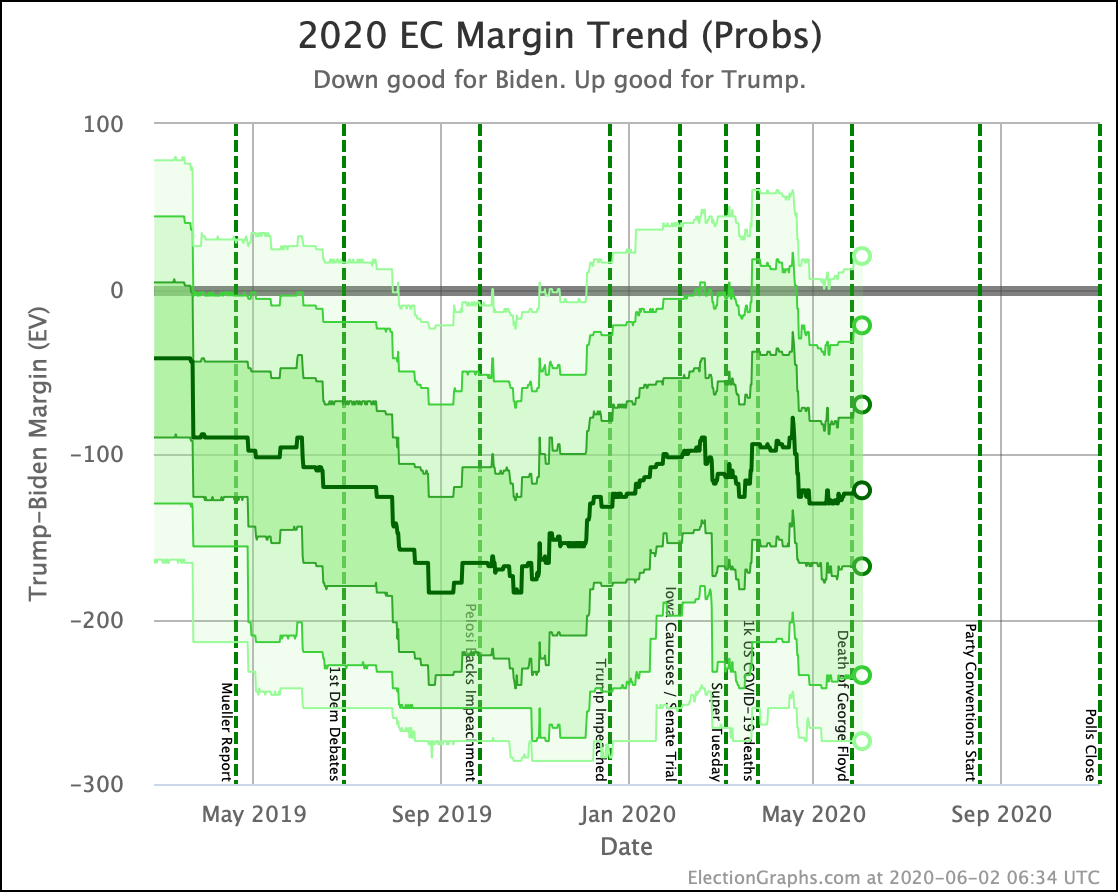
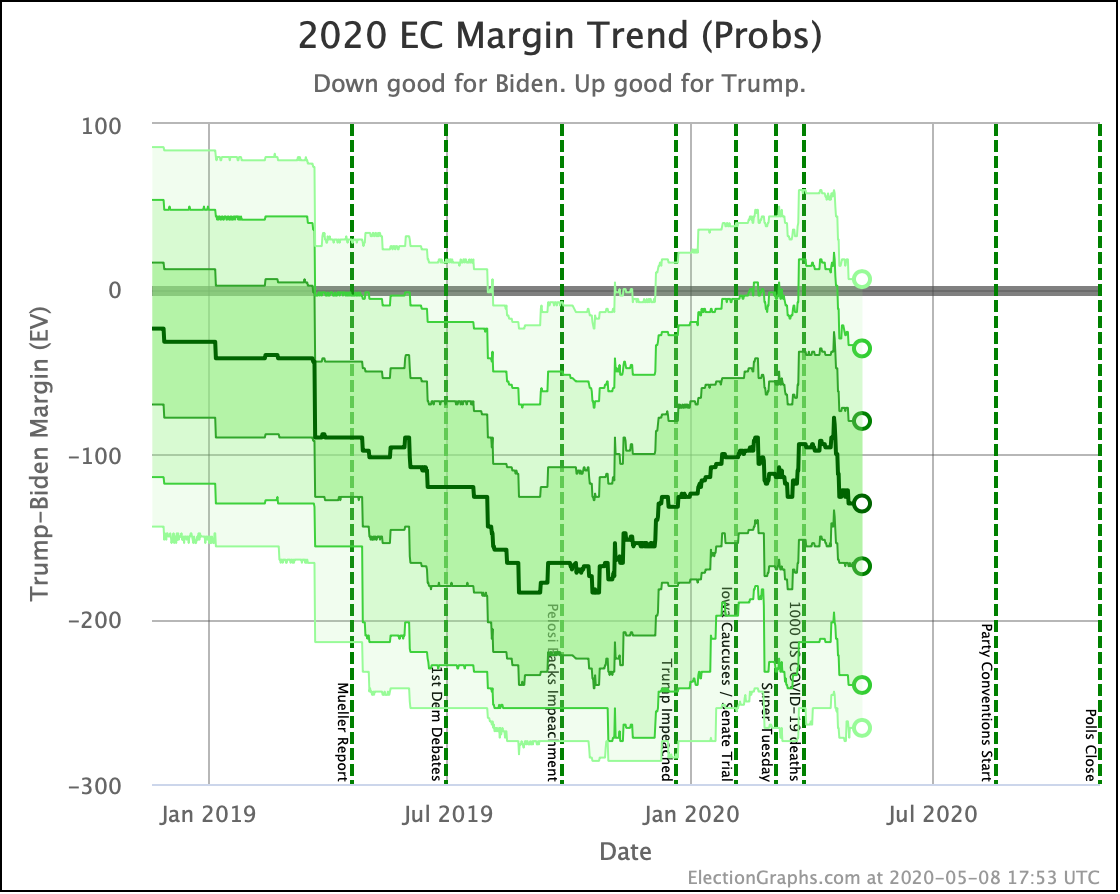
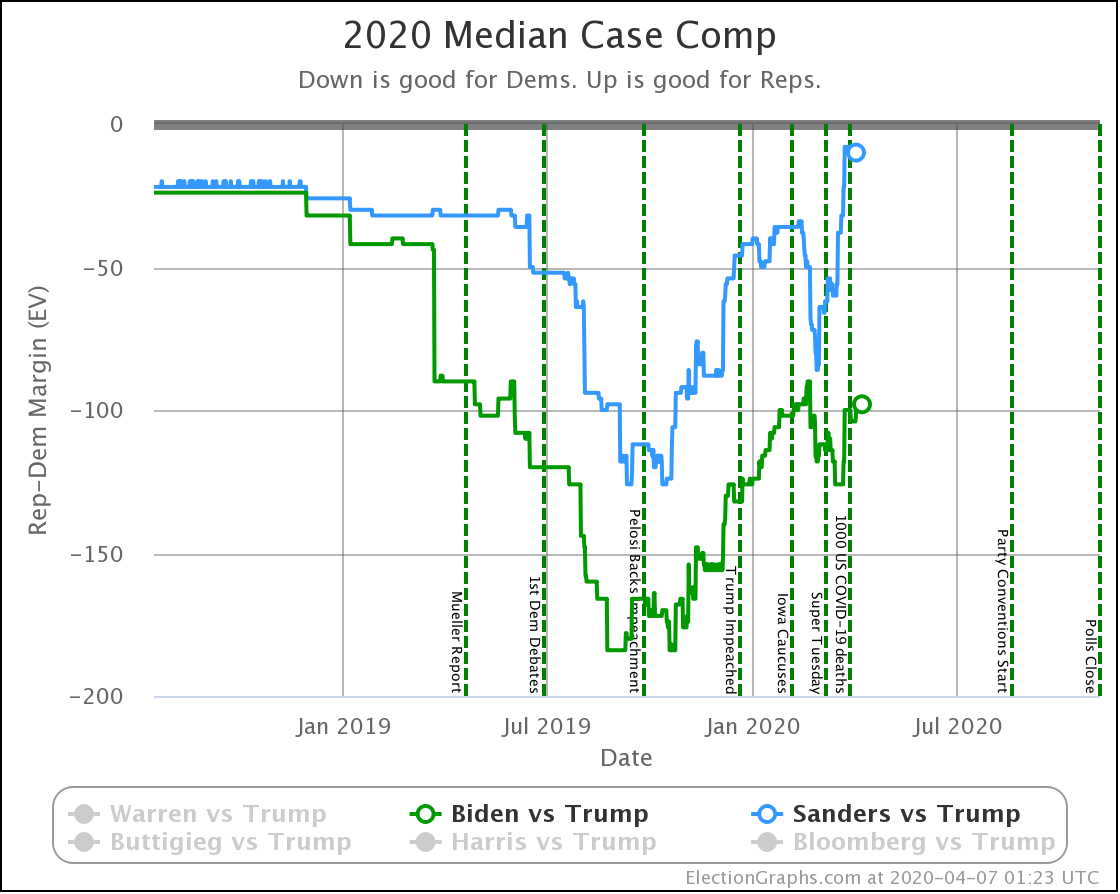
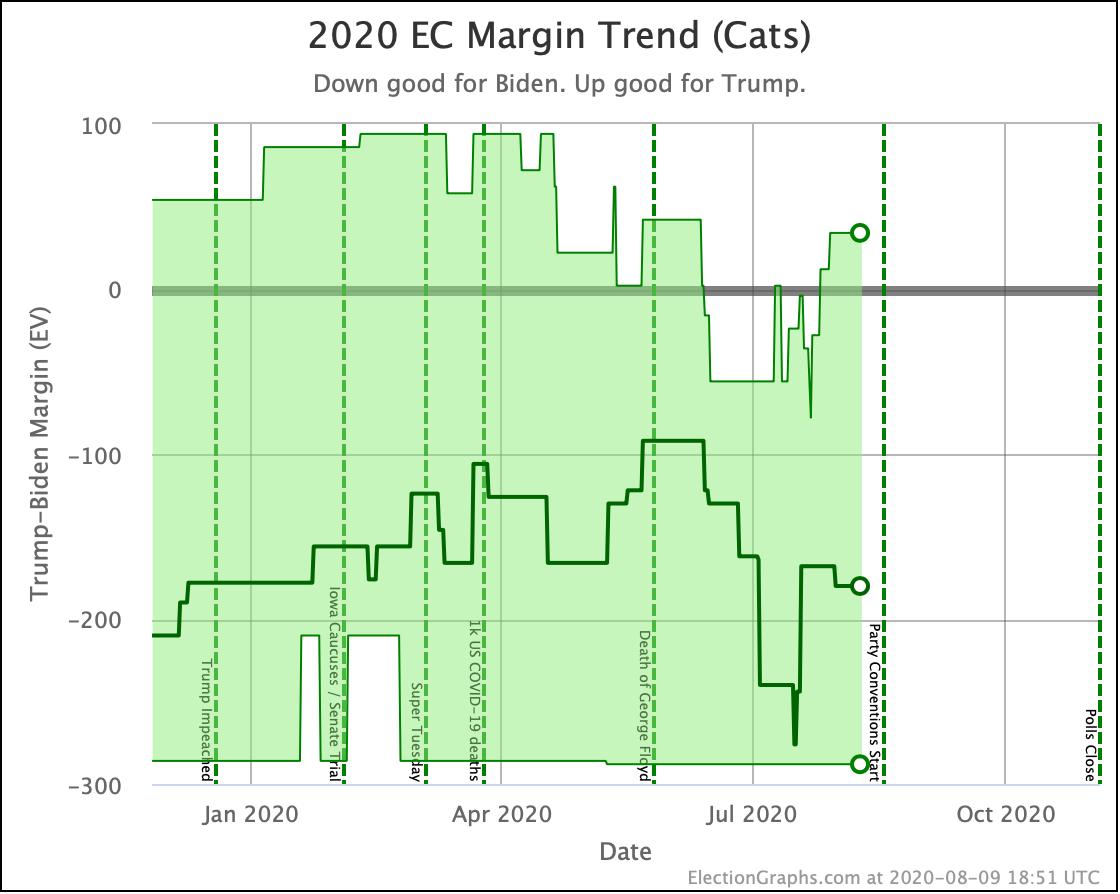
When you mash all of these movements together into our probabilistic model that doesn't just say that since one candidate is ahead in a state they are going to win it, but instead simulates many possible election results recognizing that close states can go either way, you get these trends:
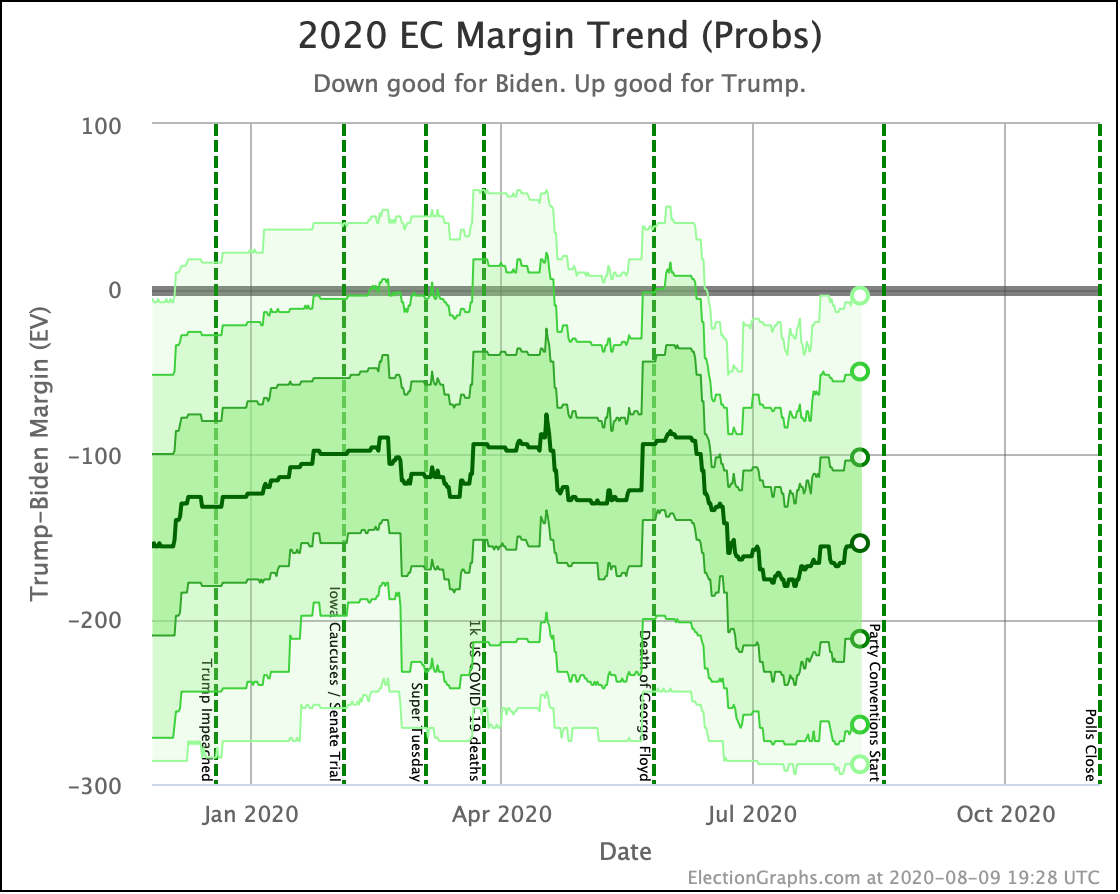
Roughly speaking, the darker the color, the more likely the final margin will be in that range.
Looking at the center median line, where half the simulated election results were better for Biden, and half were better for Trump, Biden's most recent peak was a 180 electoral vote margin on July 17th. Since then he has slipped down to a 154 electoral vote margin.
All of the other bands have moved toward Trump as well, each to a differing degree. The moves aren't as dramatic as the categorization view shows, but there has been a steady deterioration for Biden since that peak.
June and the first half of July were a constant stream of bad news for Trump, and his position in election polls reflected that. Since then things have slowly been moving back in his direction.
To be absolutely clear, Biden still has a huge advantage. But less so than he did a few weeks ago.
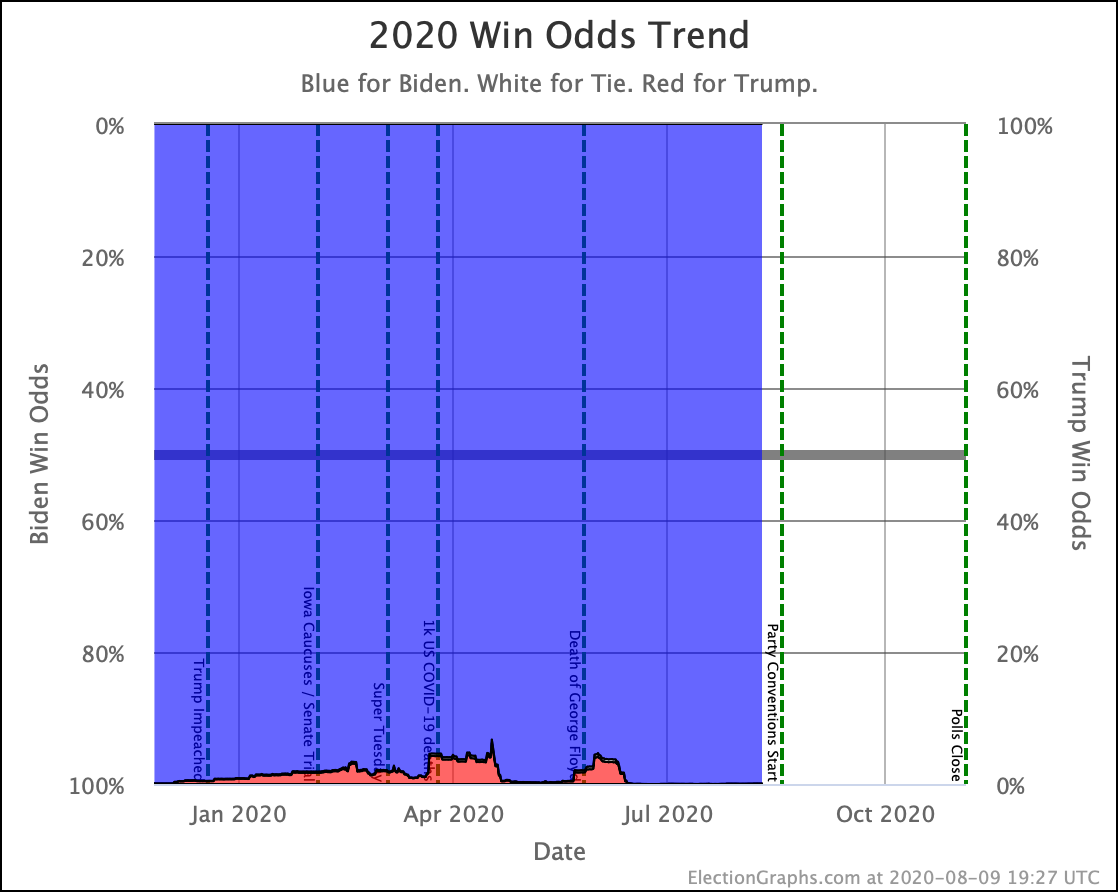
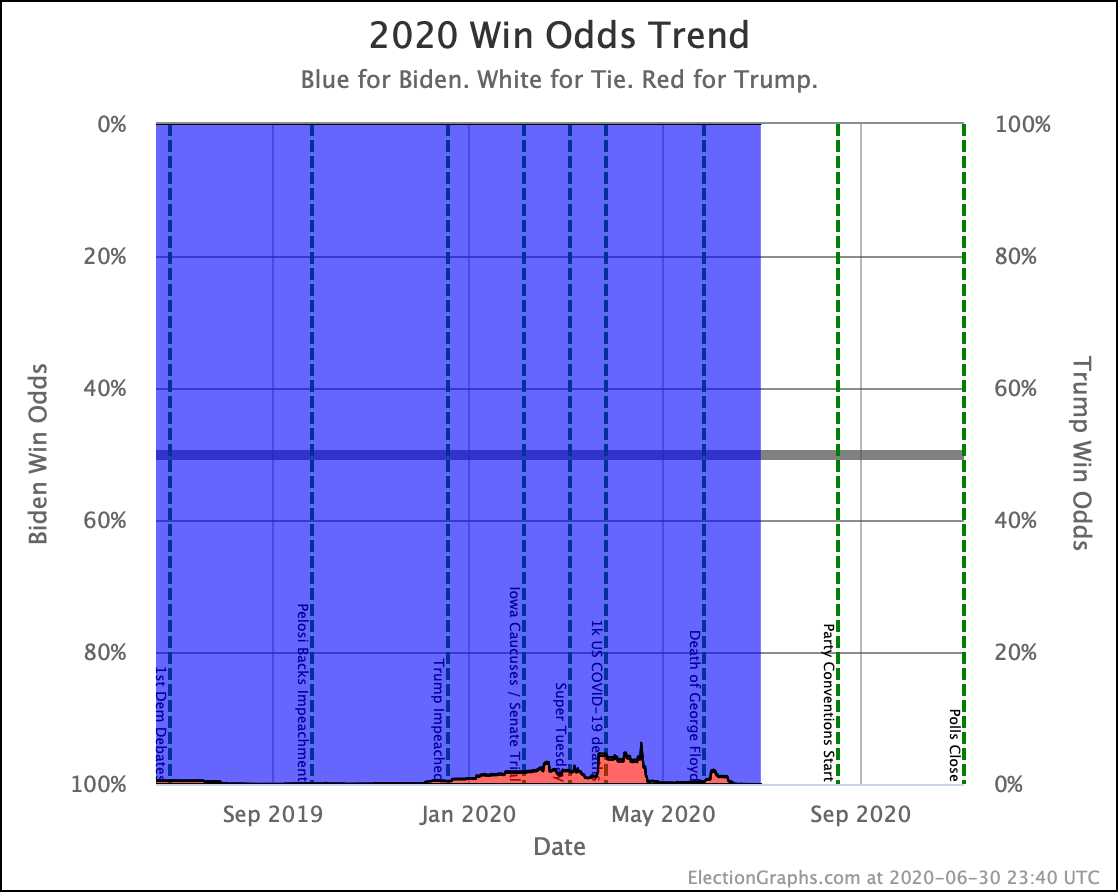
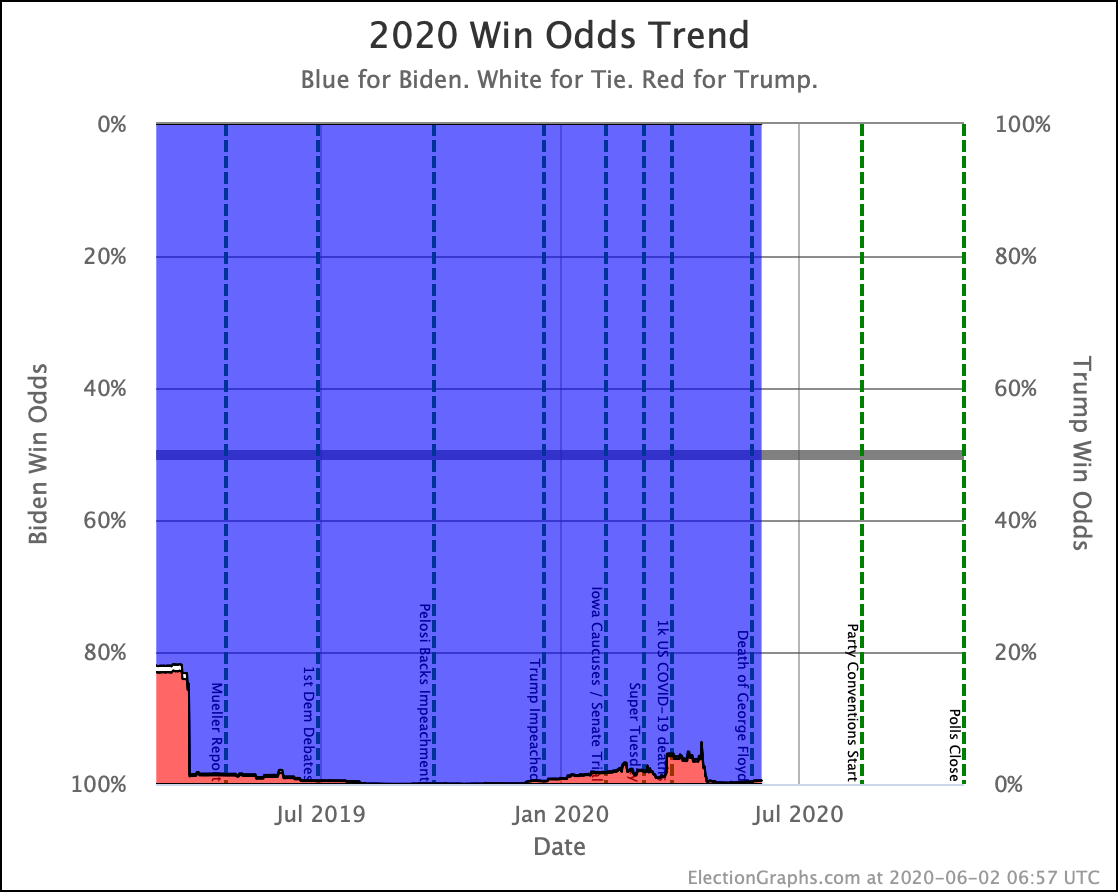
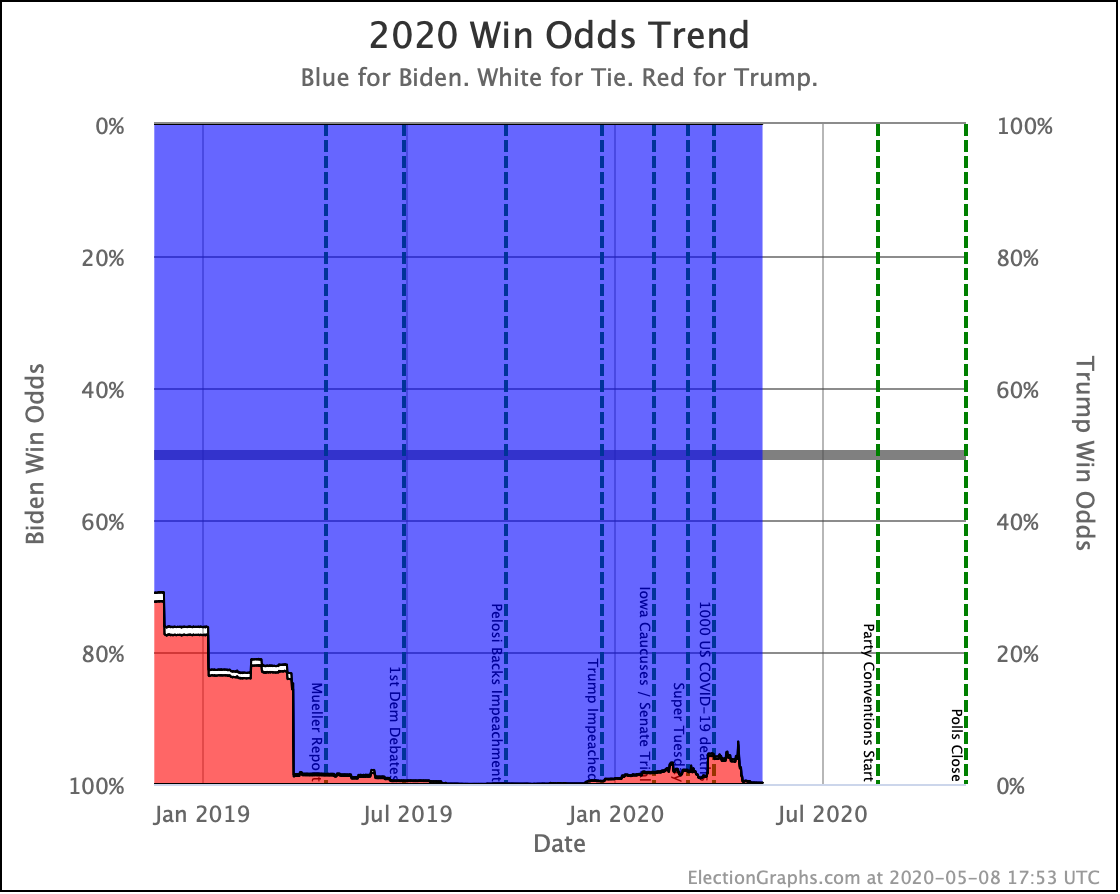
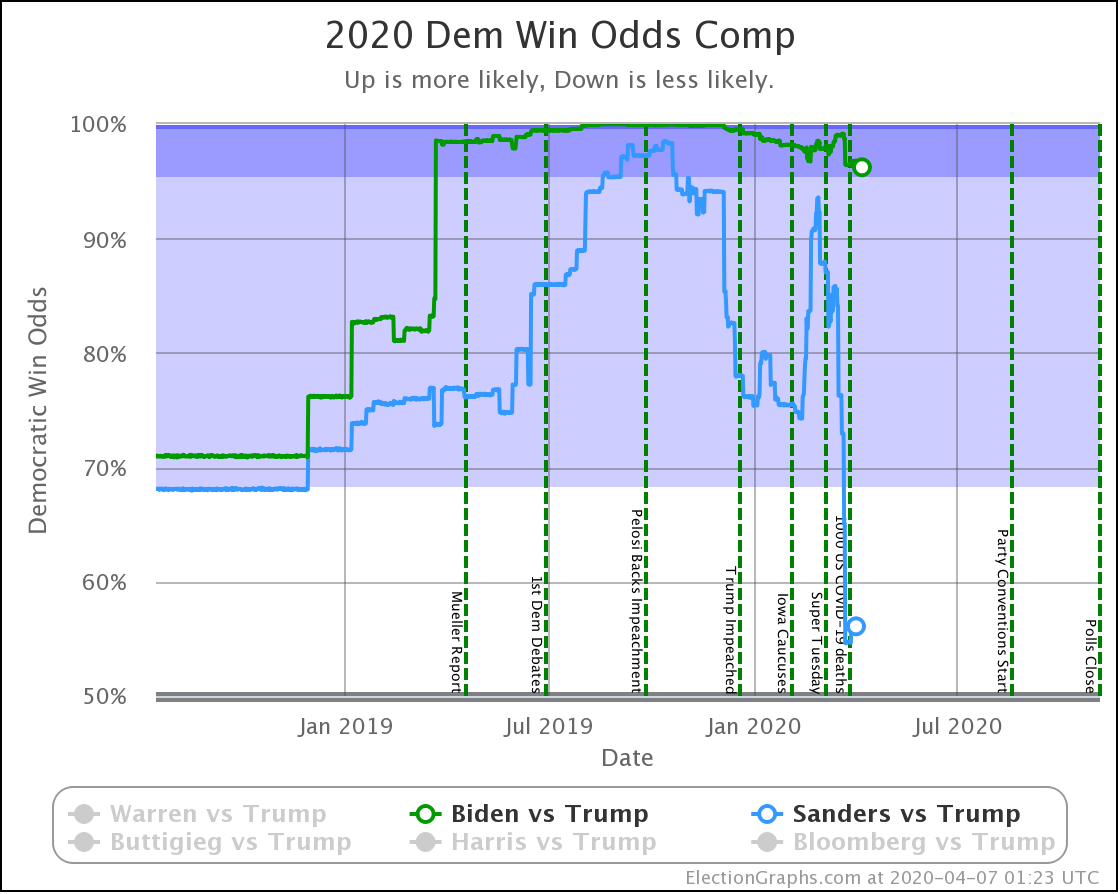
It is still too small to see directly on the chart, but Biden's chances of winning when we did our last update rounded to 100.0% (it was actually 99.9931% in our simulation), and now they round to 99.9% (it is actually 99.9265% in our current simulation).
So that is still substantial, even if it is less than it was.
But that is if the election was today.
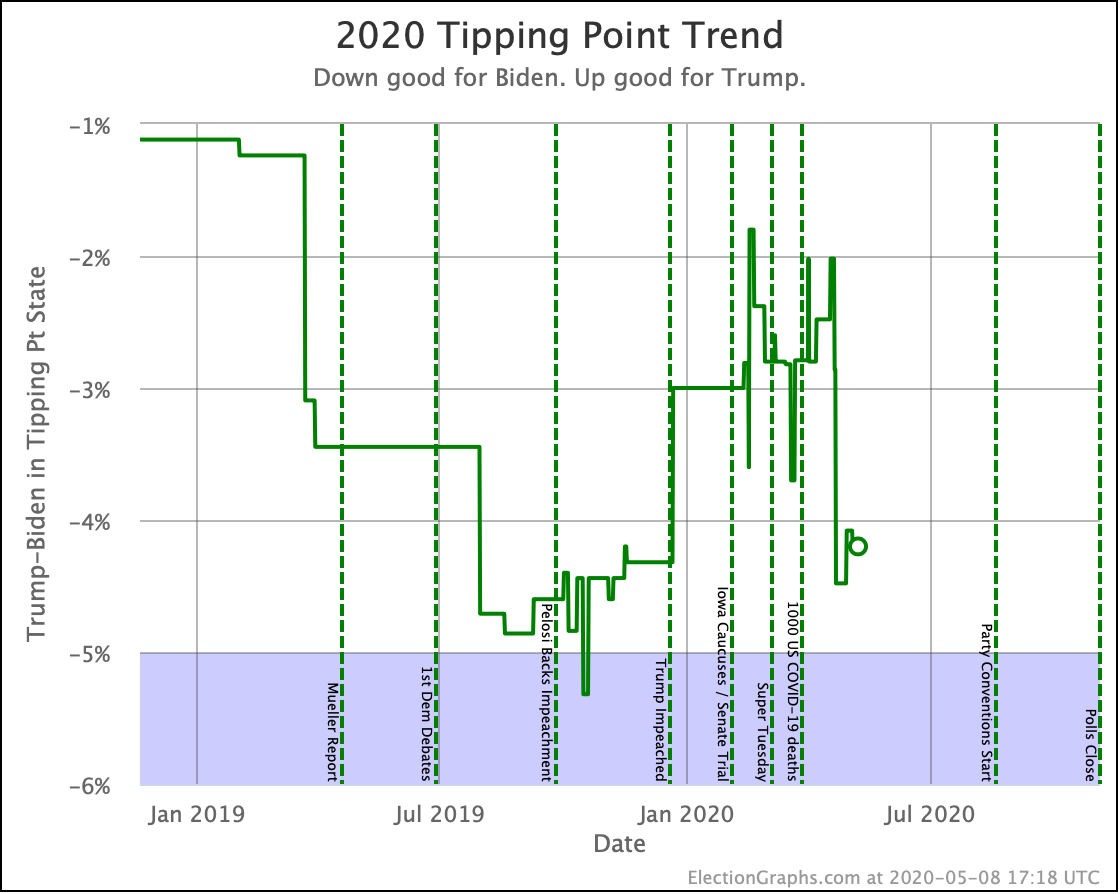
How vulnerable is that lead?
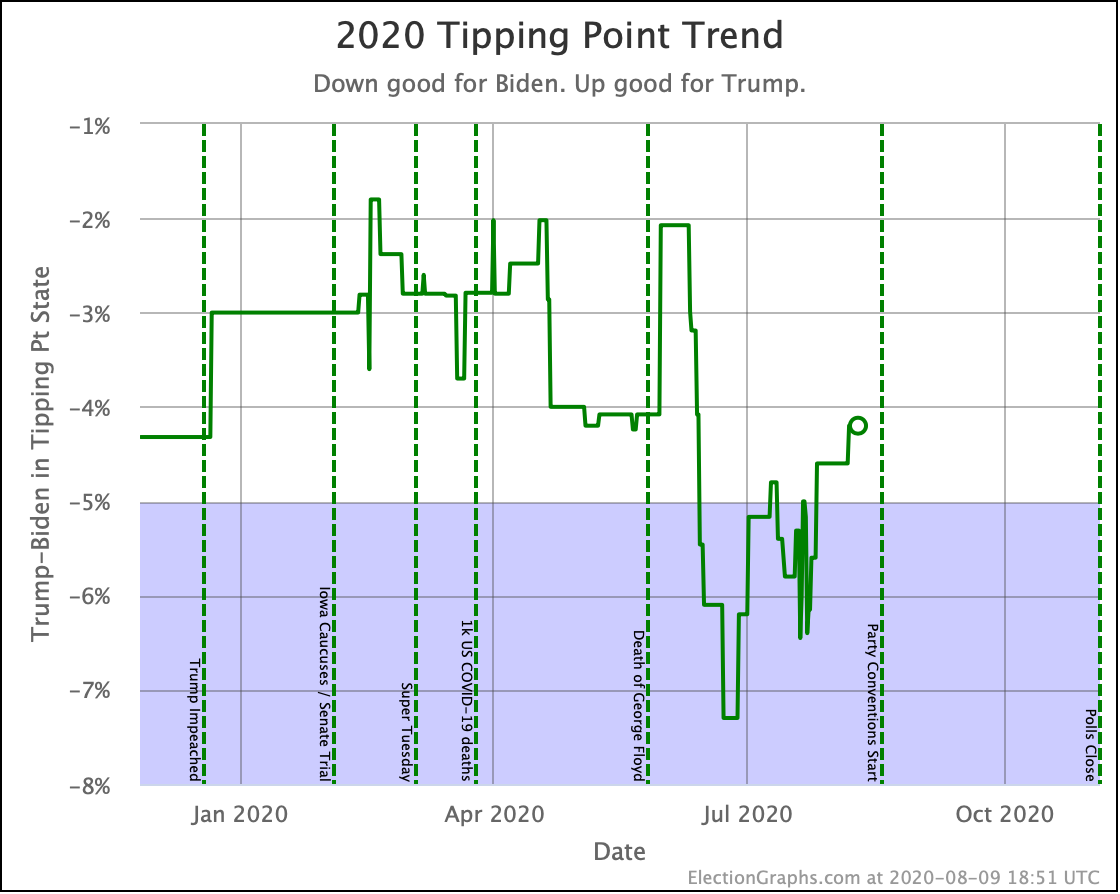
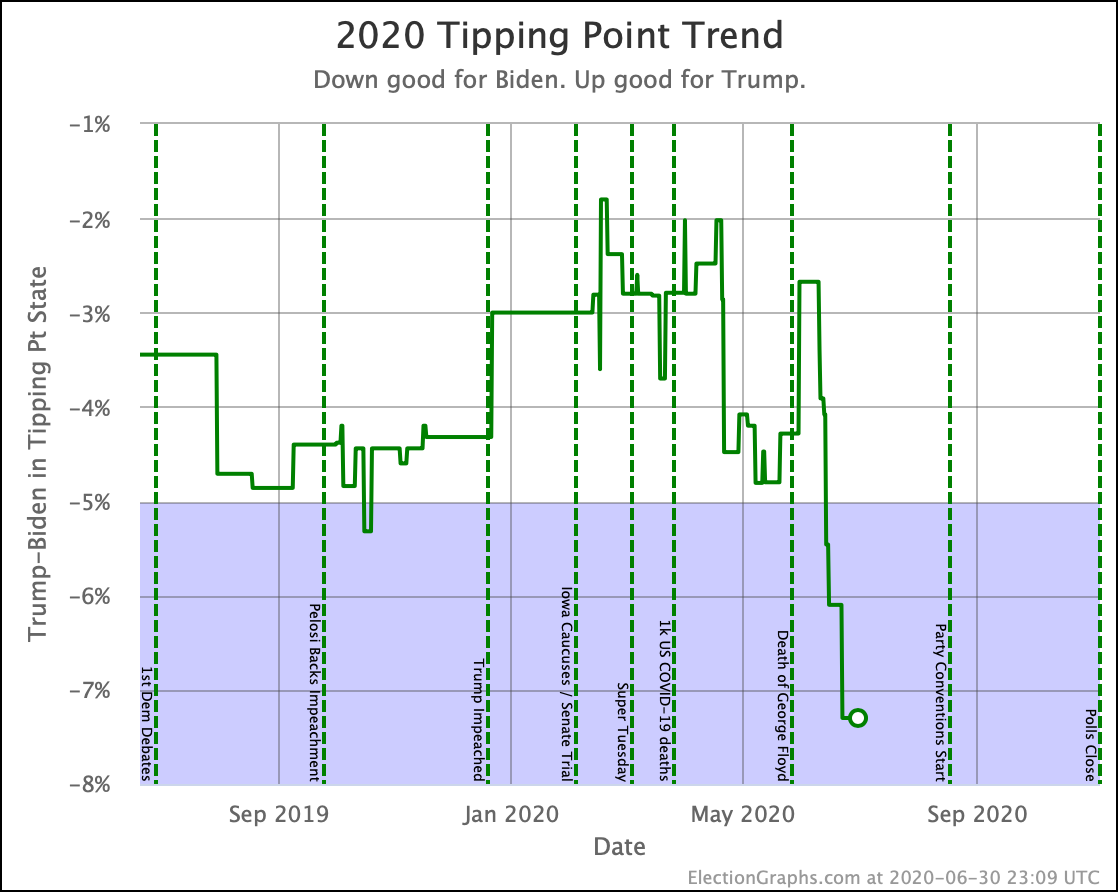
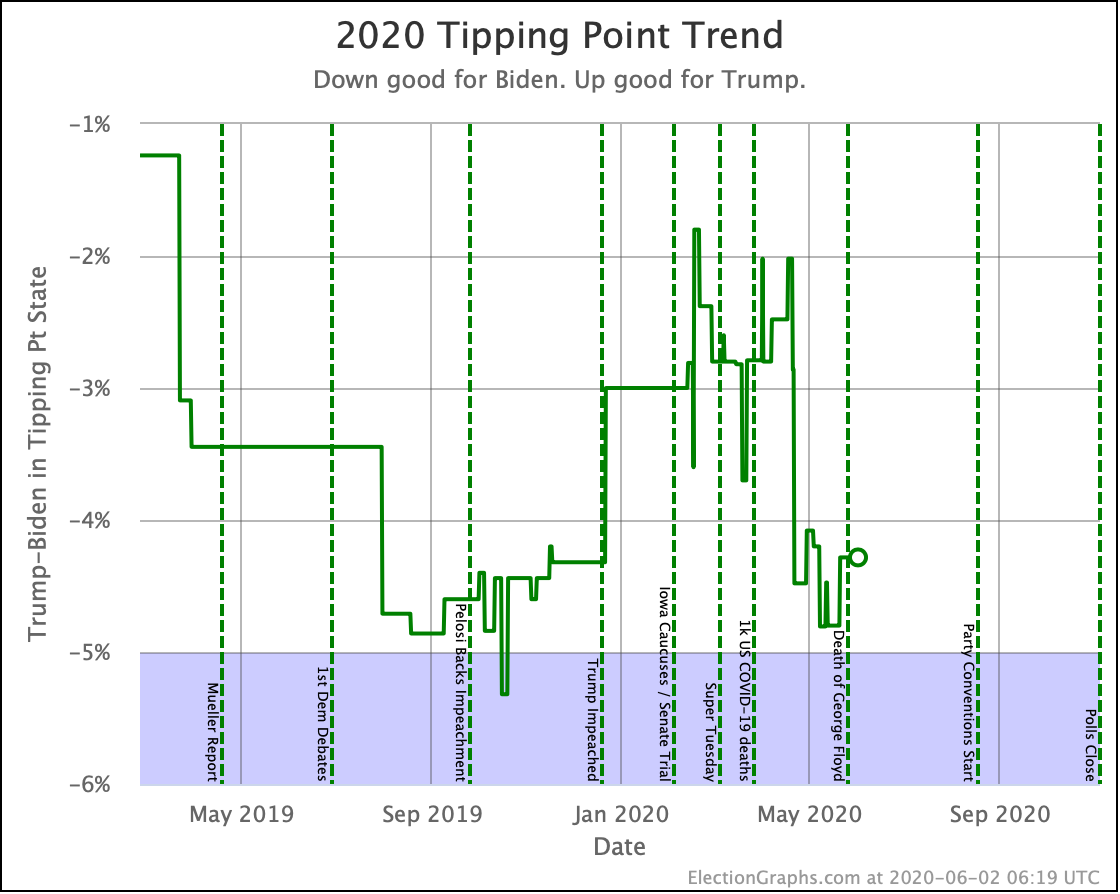
Biden's tipping point lead peaked at 7.3%. It is down to 4.2%. That's a 3.1% decline in a little over a month. If that trend continued, in another month Biden would still have a lead, but it would be quite tenuous.
That is not a prediction. It seems more likely that if Biden's spike in June was just an aberration and things are returning to the mean, that the tipping point will settle out between a 2% and 4% Biden lead.
But that is the level of lead that might just be a systematic polling error. Or that could be erased by a major event in the last few days of the campaign, too late to be measured by the polls.
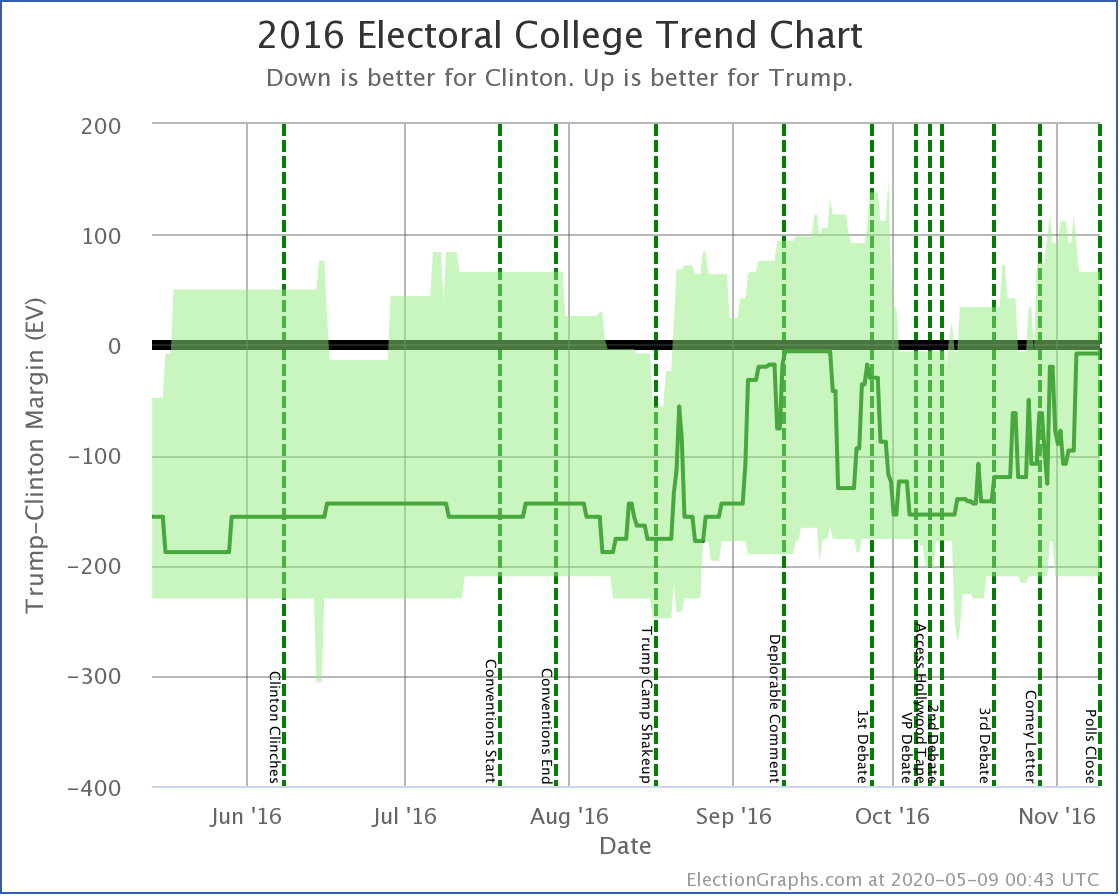
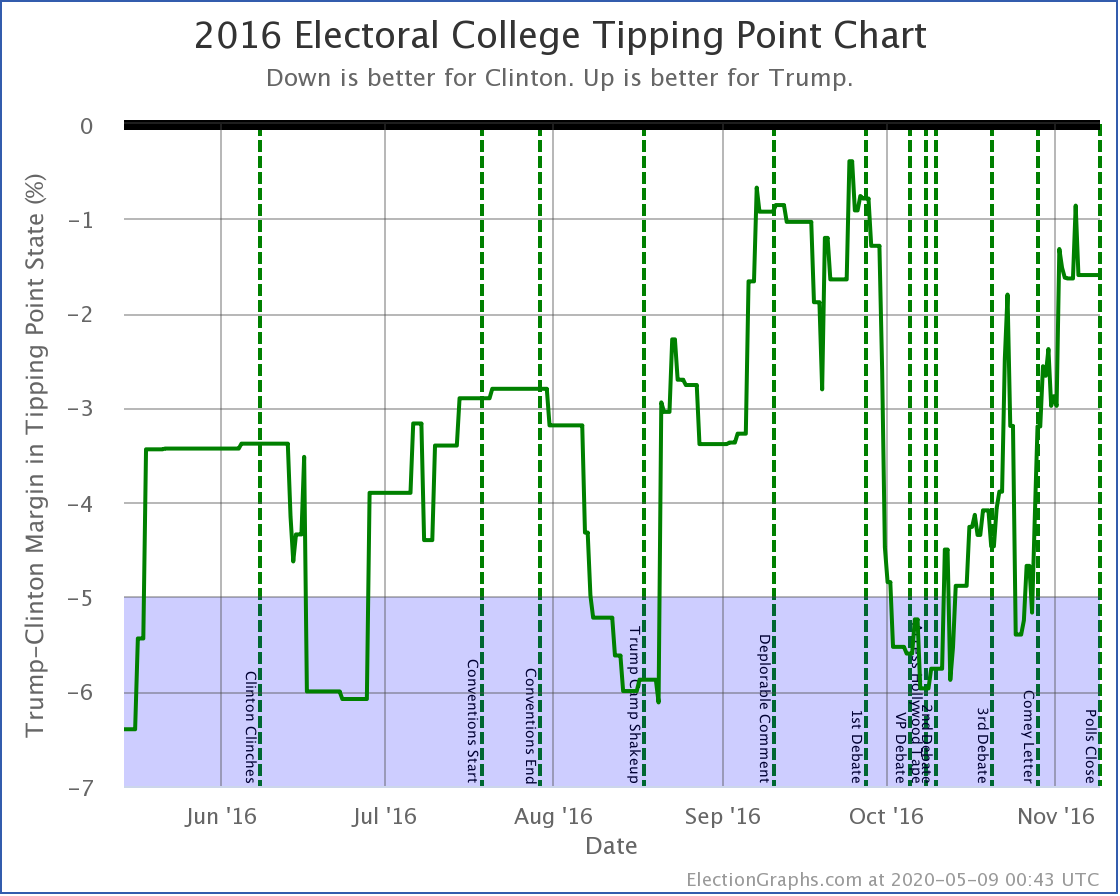
So how does this look compared to 2016?
| <86 Days Out> | 2016 | 2020 |
|---|---|---|
| Expected Case | Clinton by 164 | Biden by 180 |
| Tipping Point | Clinton by 6.0% | Biden by 4.2% |
So Biden is ahead of Clinton at this same point in time in terms of expected margins if all the states fell where their polls indicated. But Clinton's lead was actually a bit more secure than Biden's is right now, and of course, it slipped away before the end.
If the election was today, Biden would almost certainly win. But his lead is somewhat precarious. If 2% or 3% of people change their minds from Biden to Trump in a few critical states, Trump takes the lead.
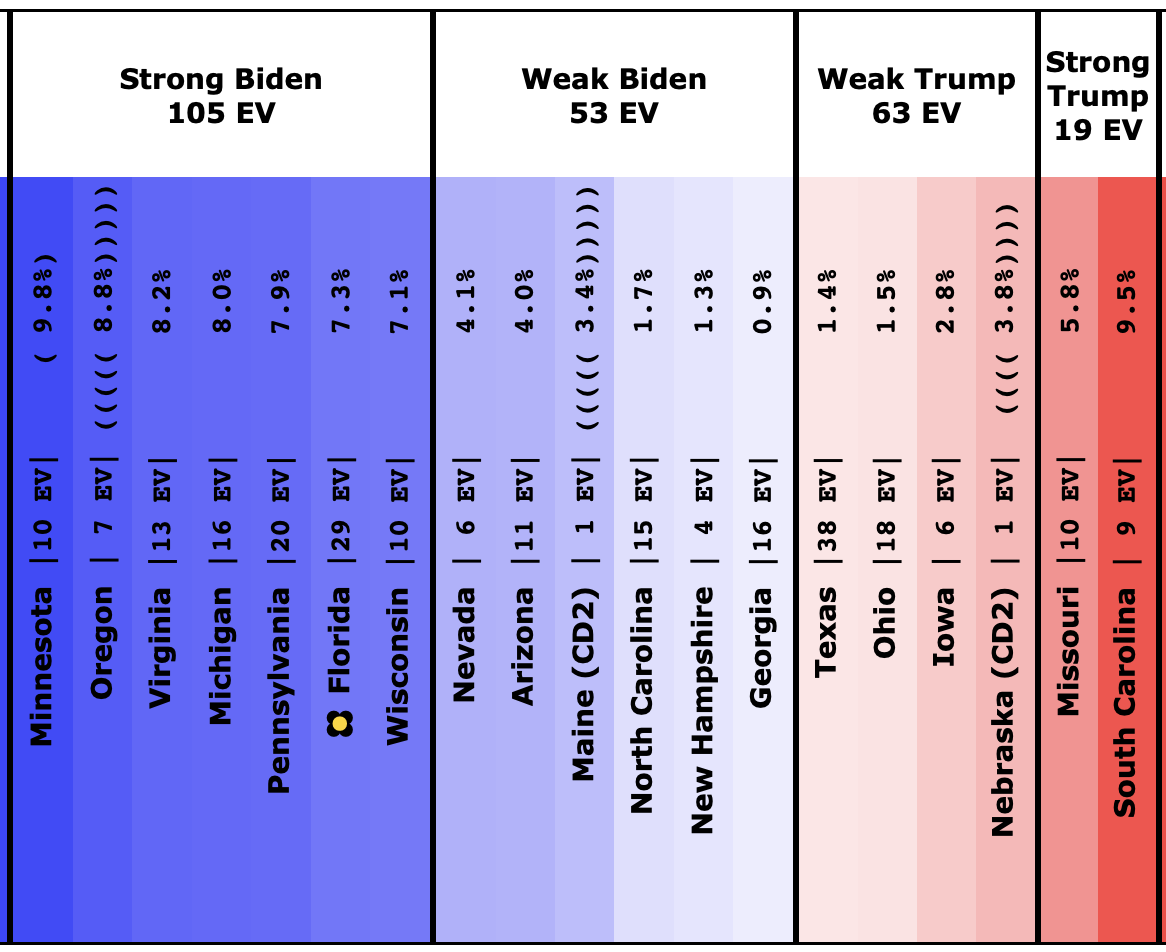
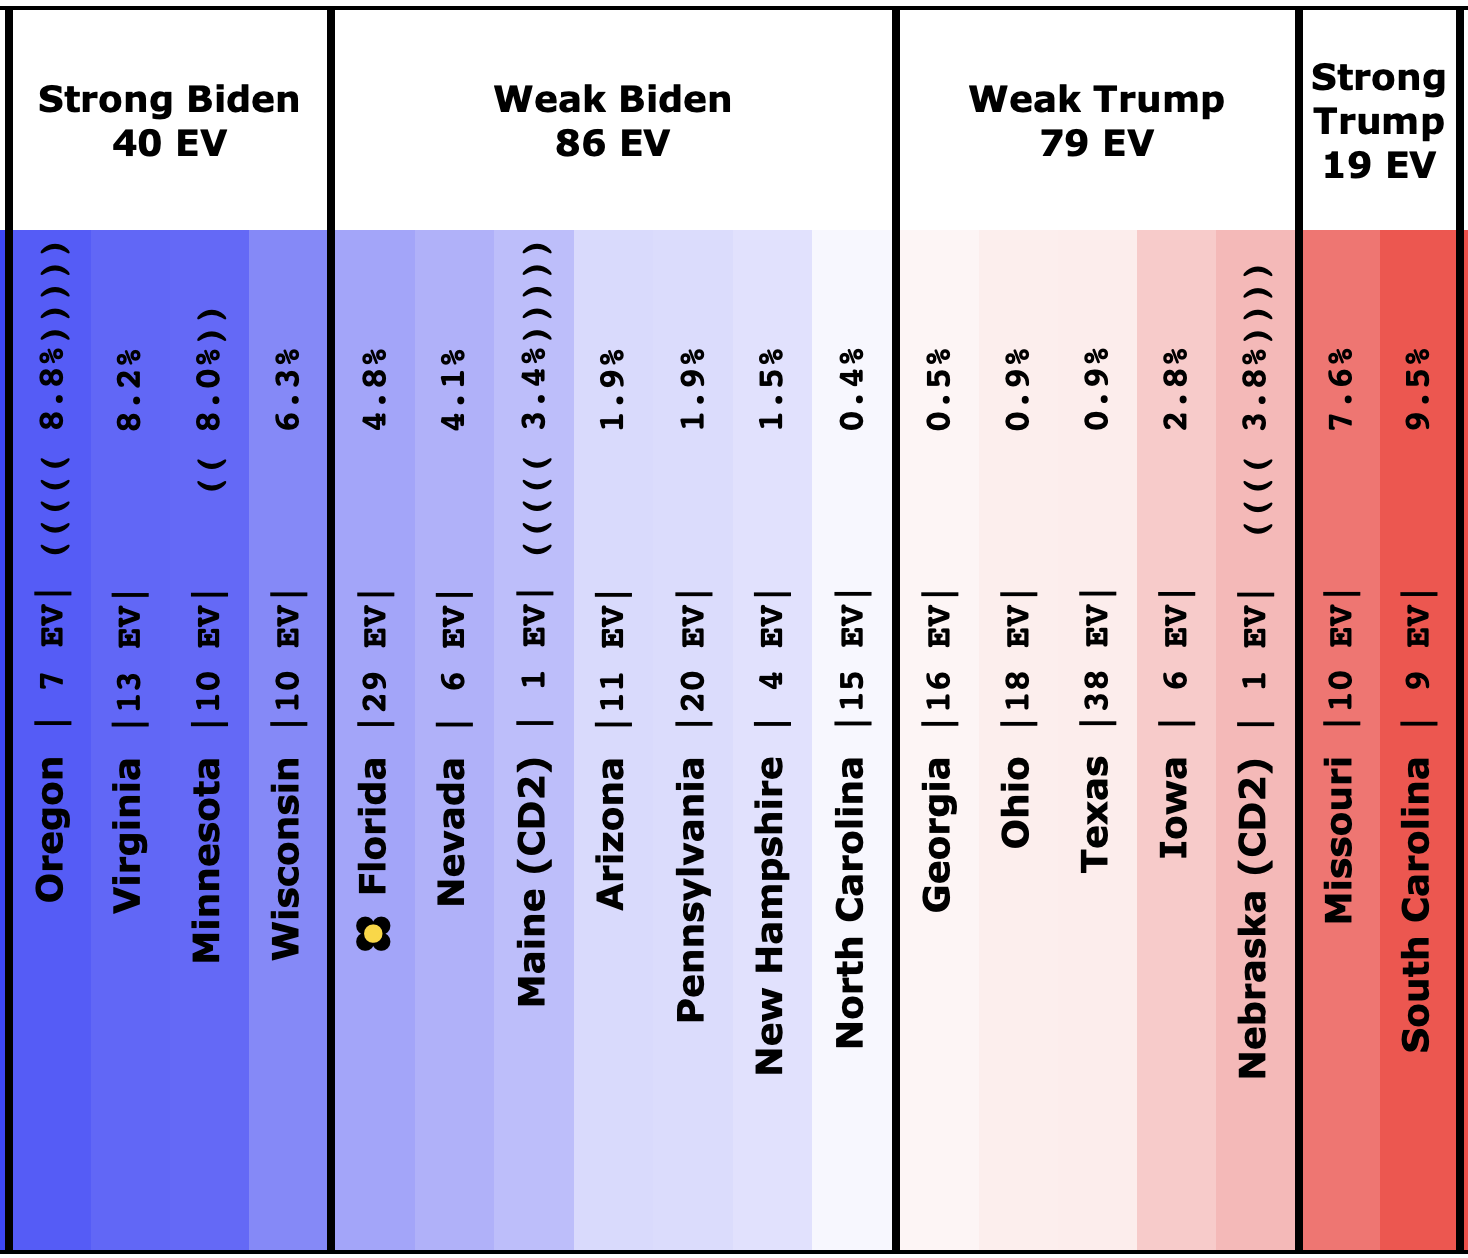
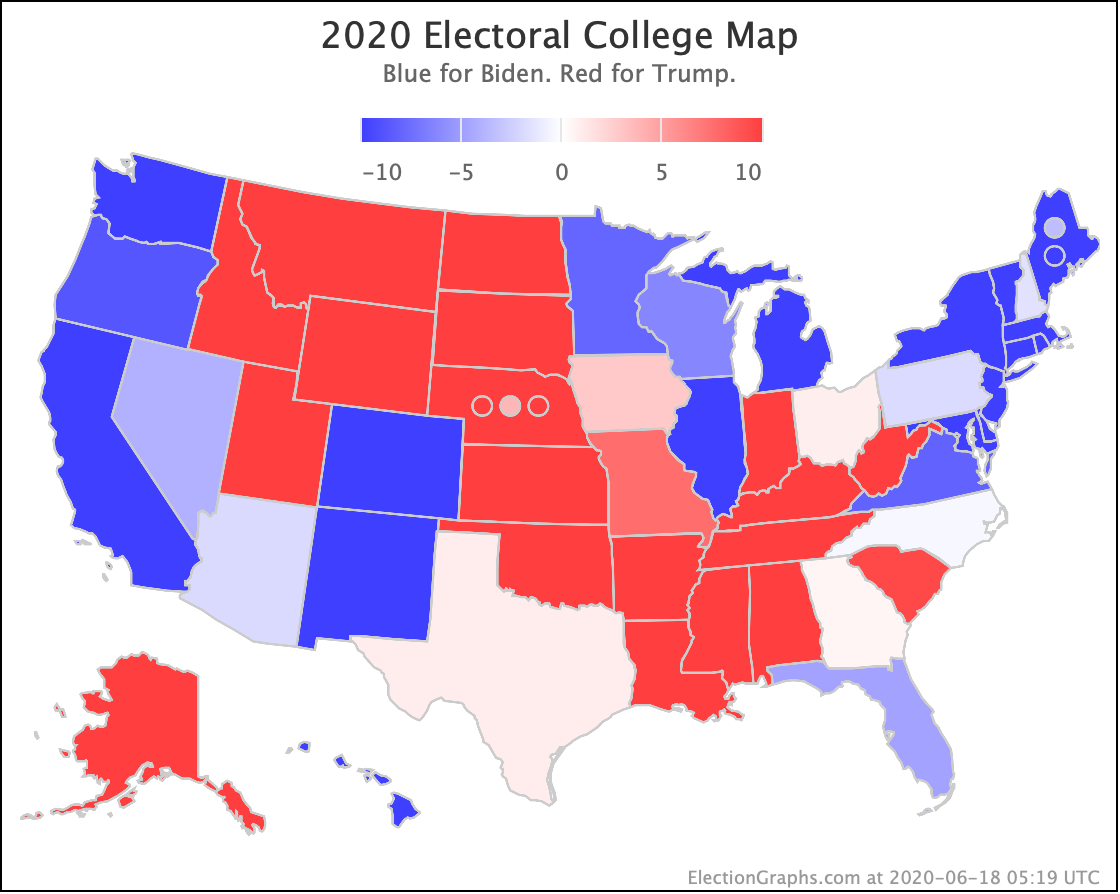
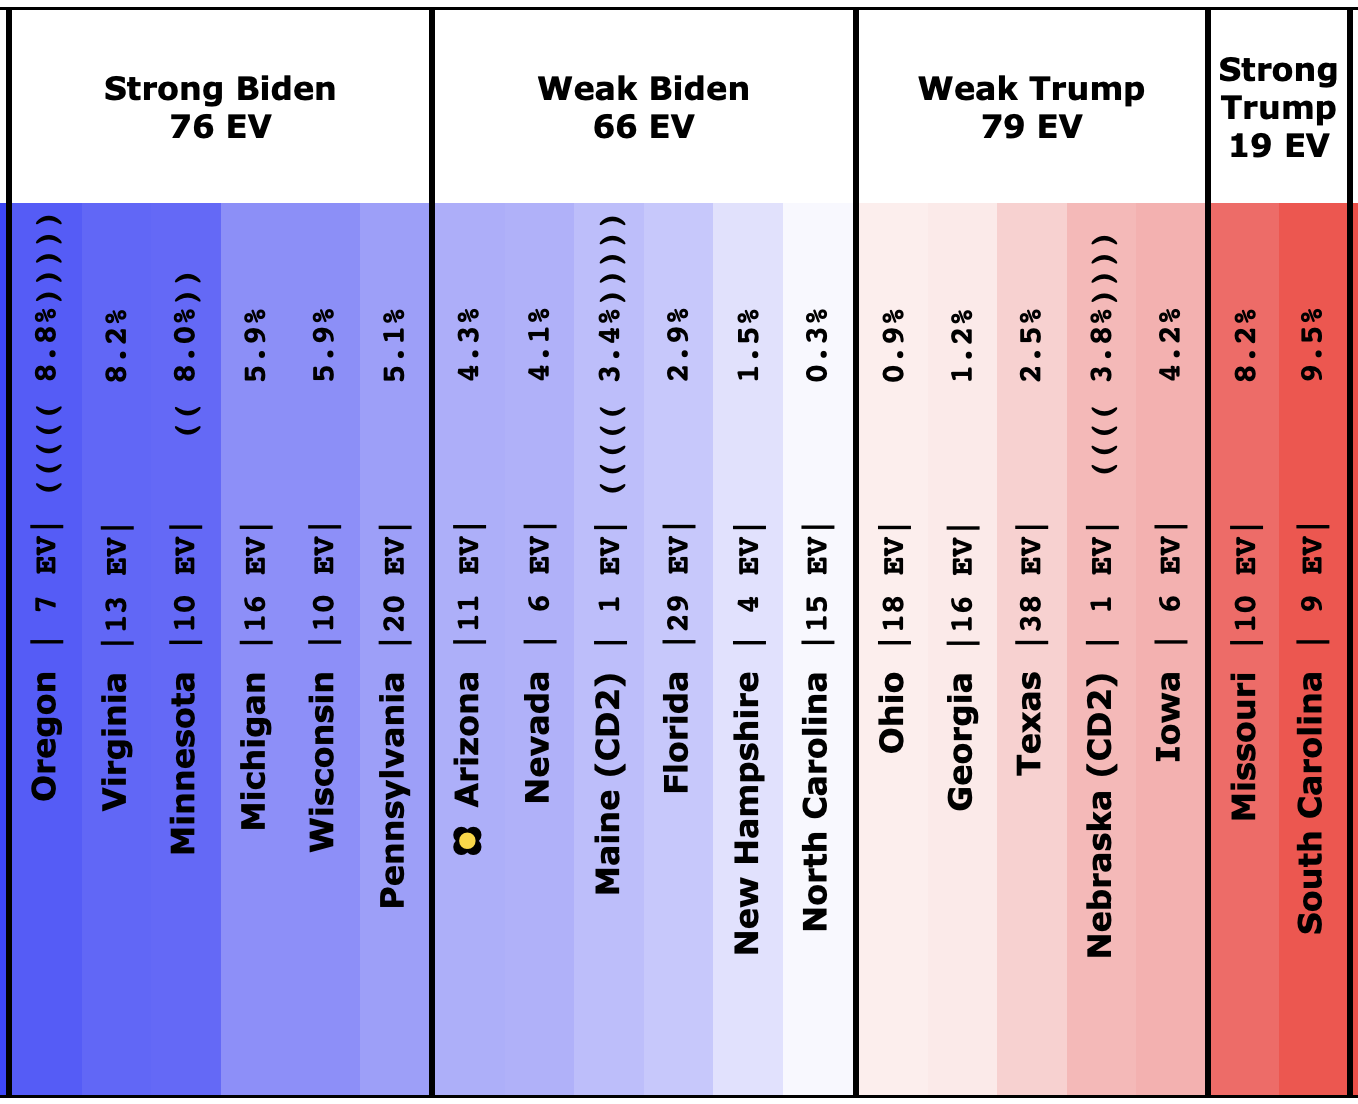
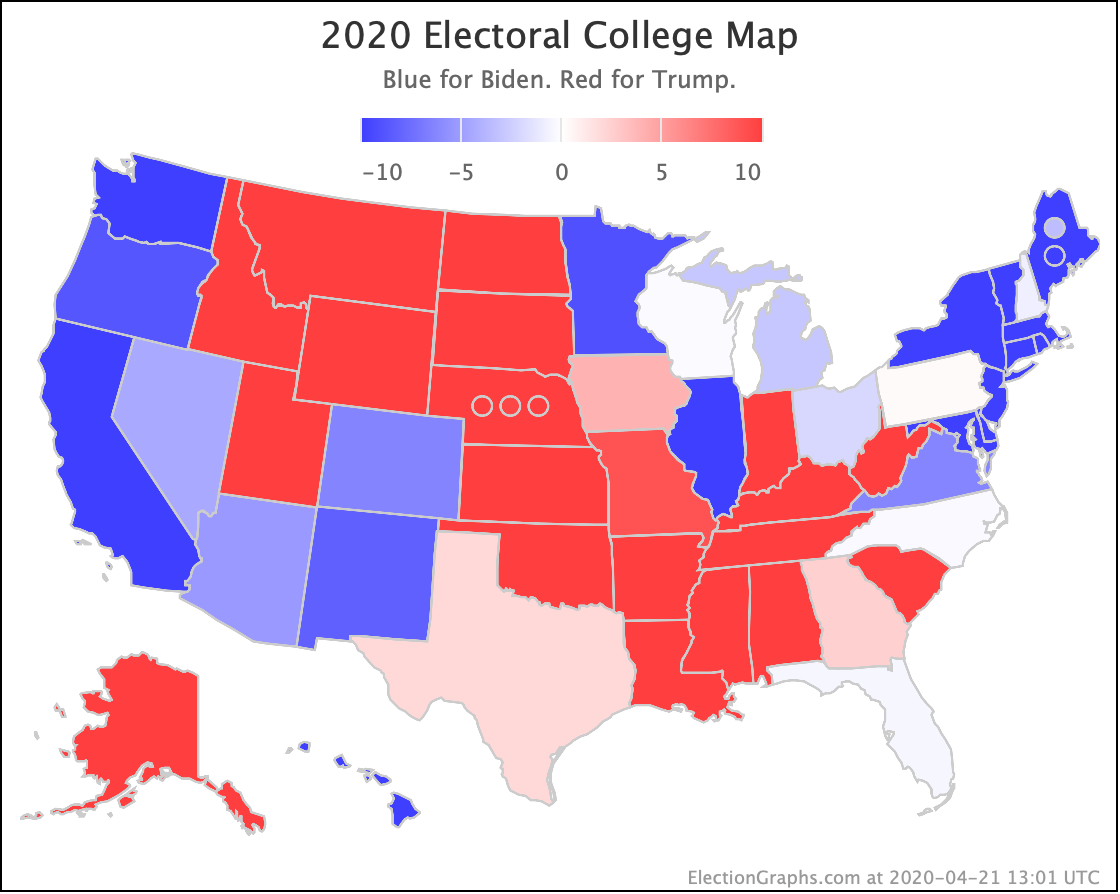
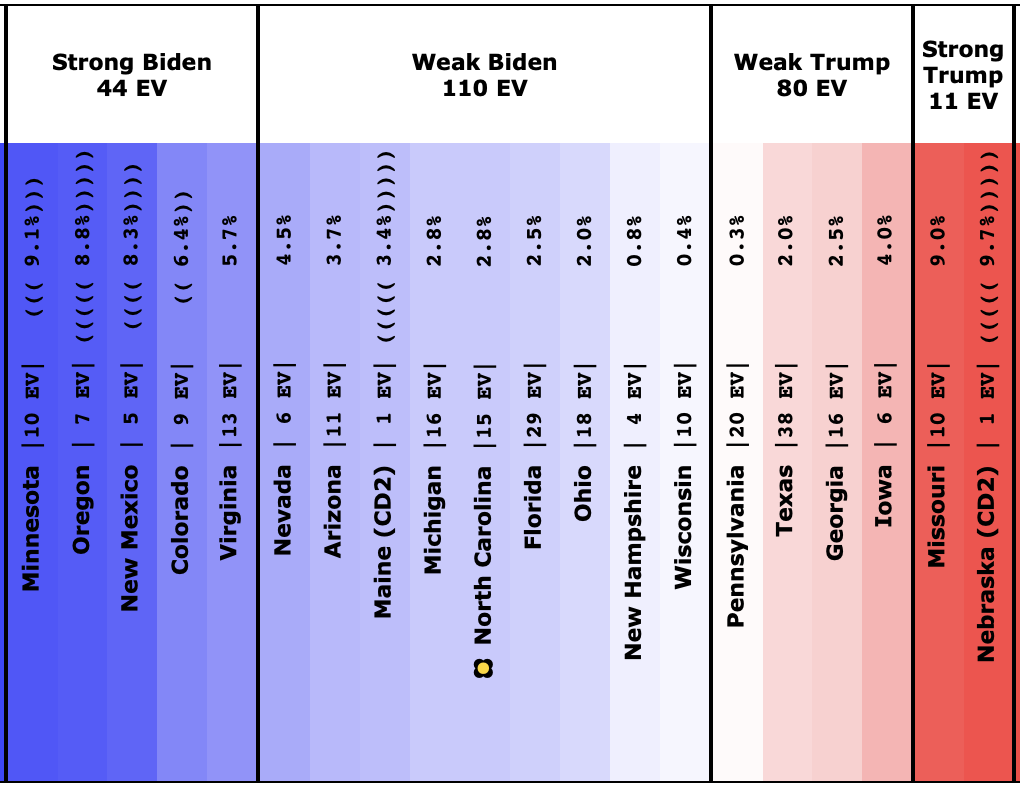
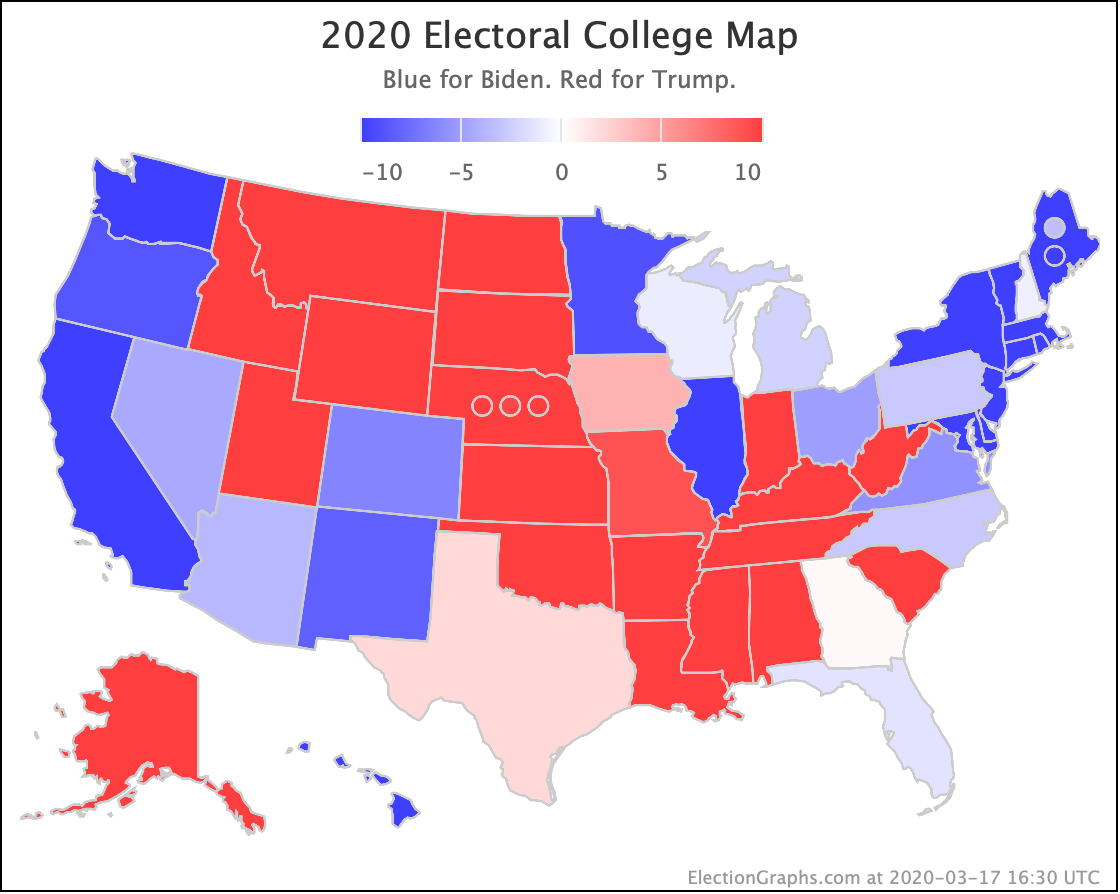
Now the spectrum of battleground states :
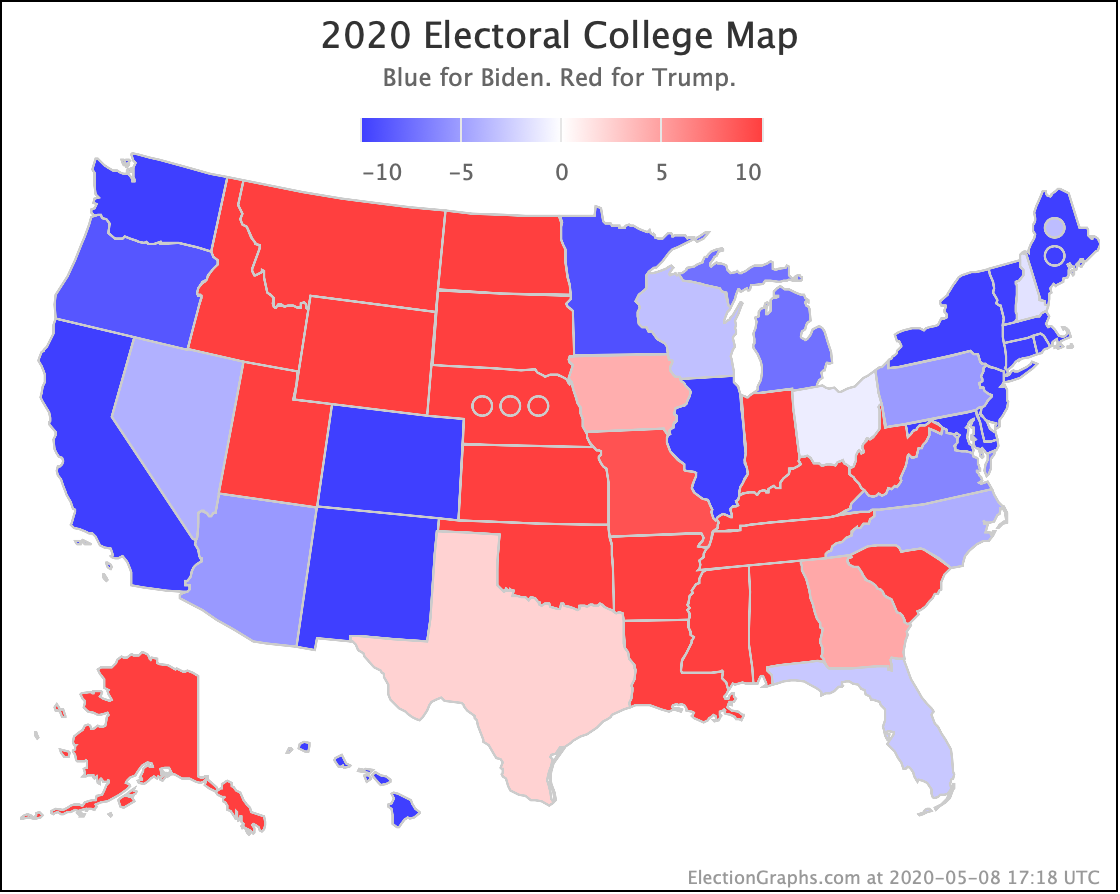
Here is what it looked like in our last update:
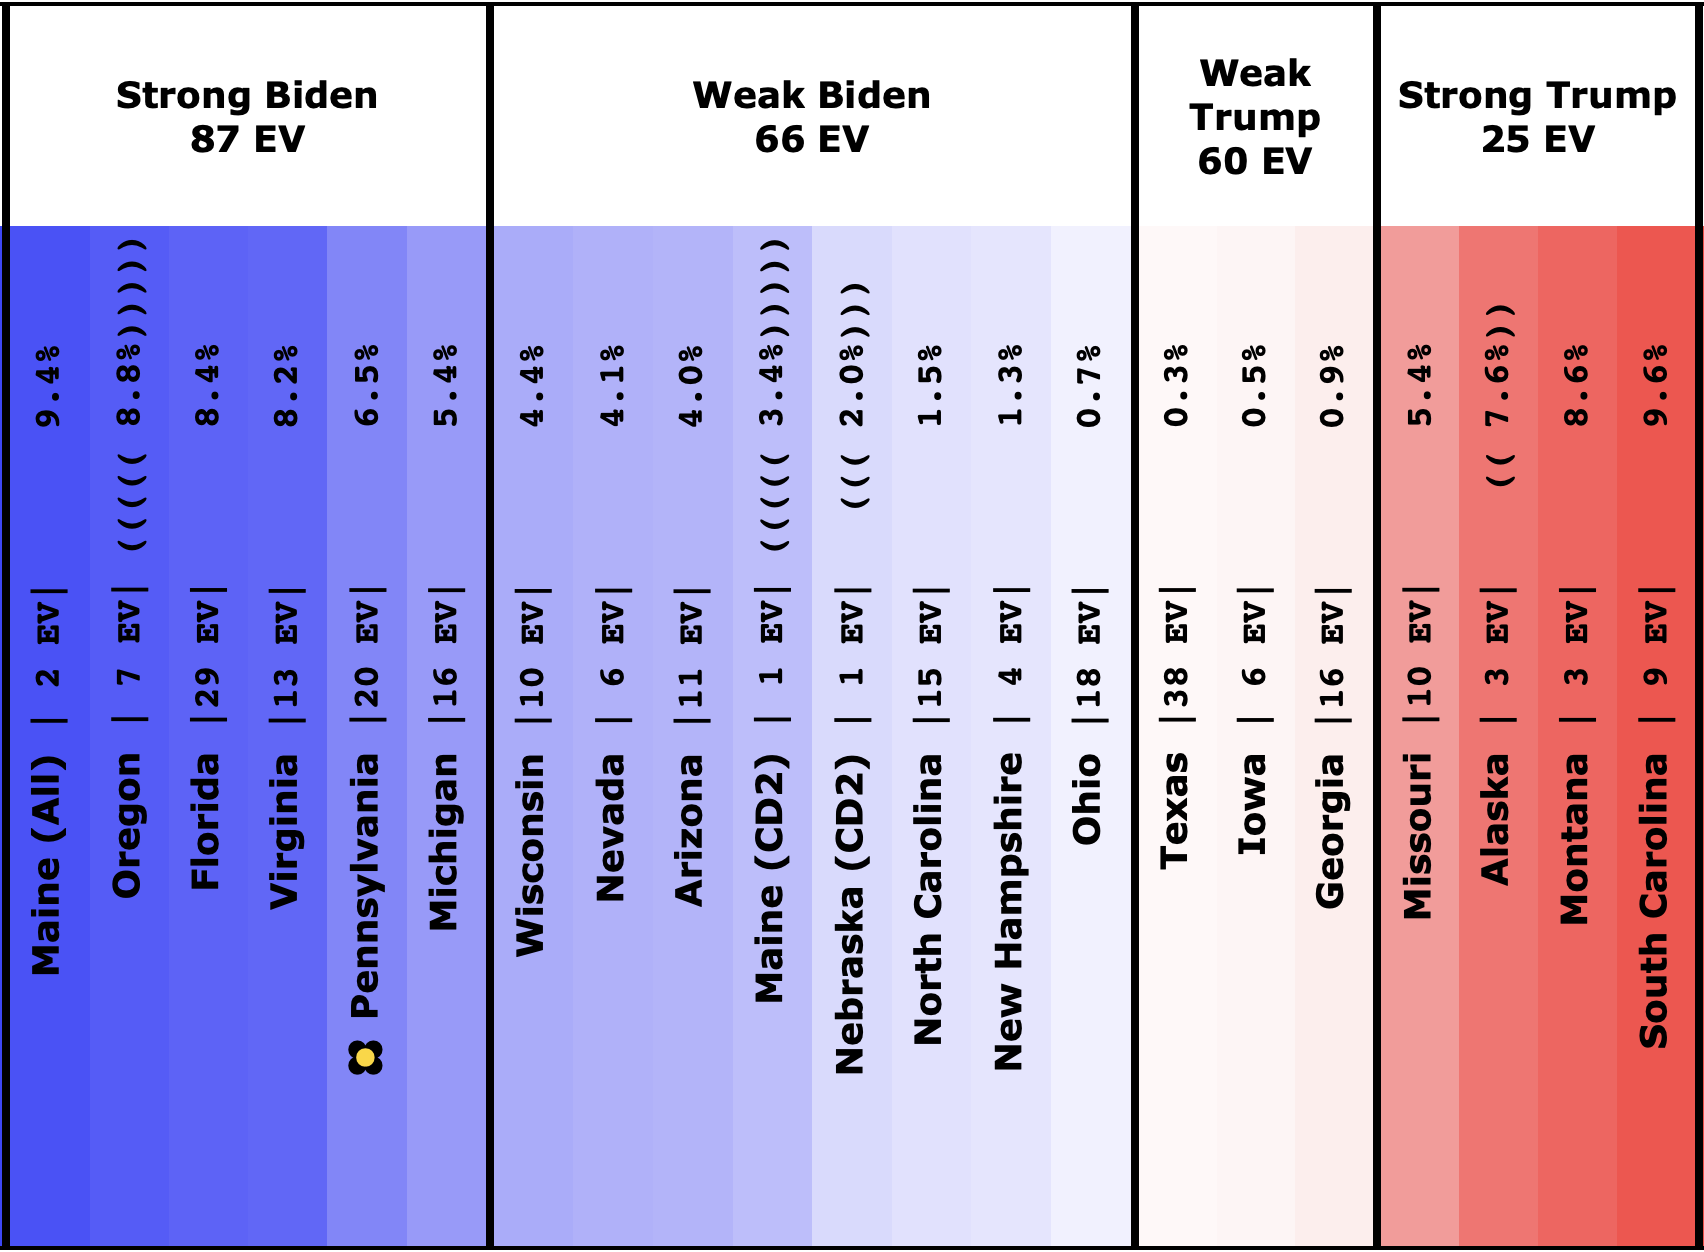
And here it is today:
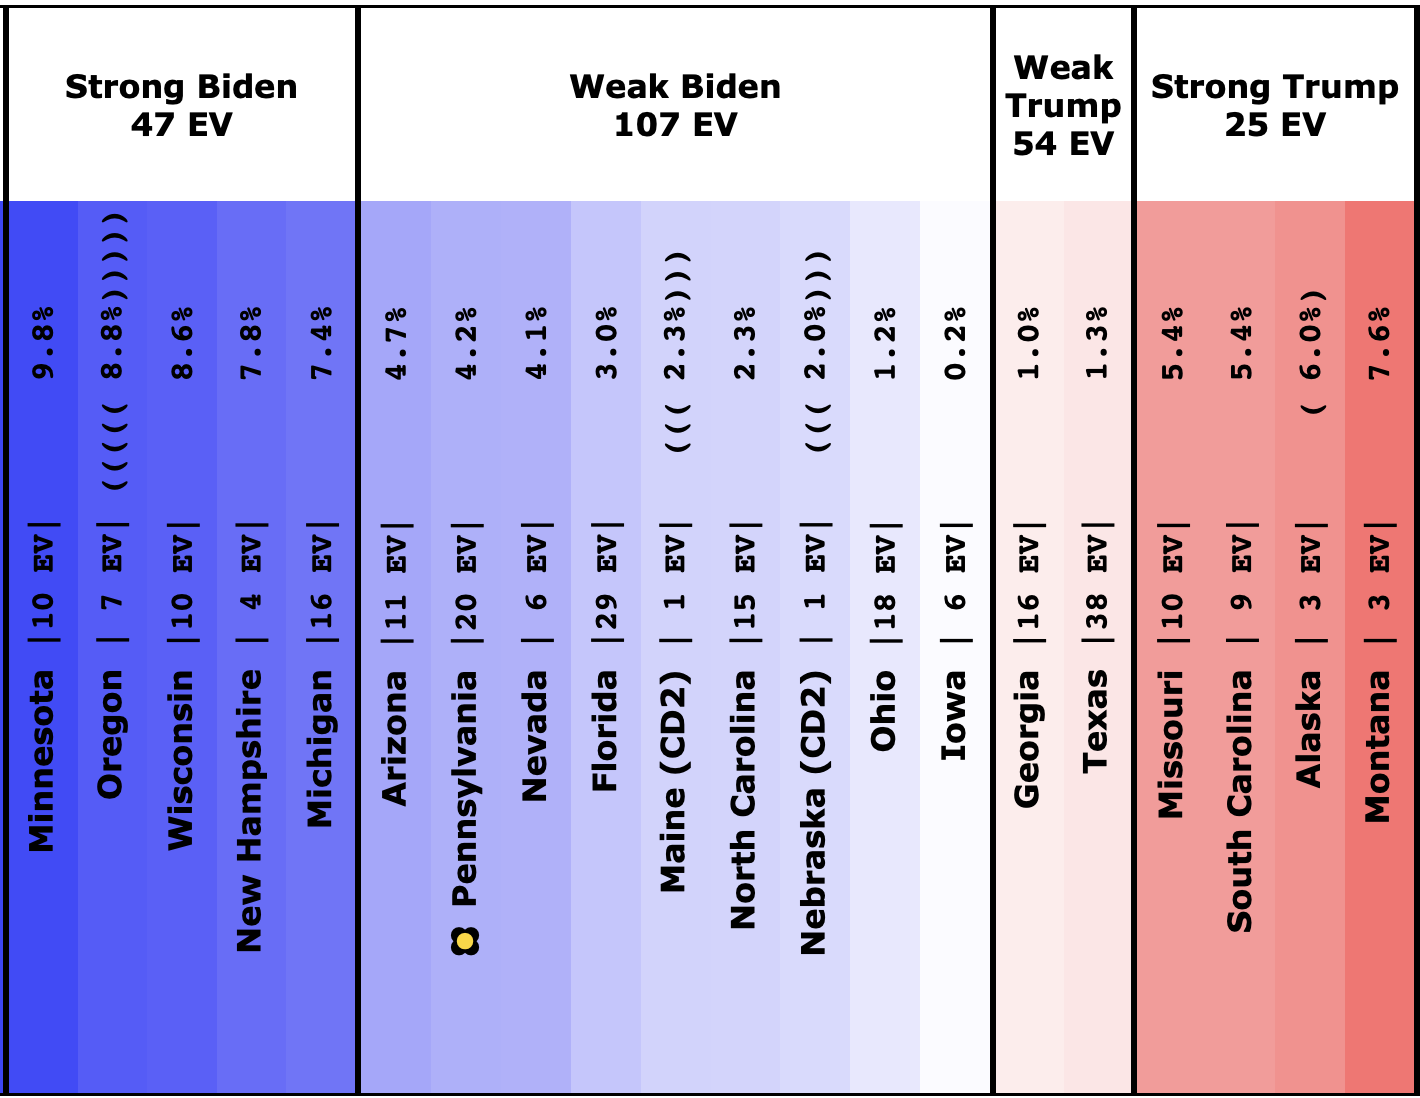
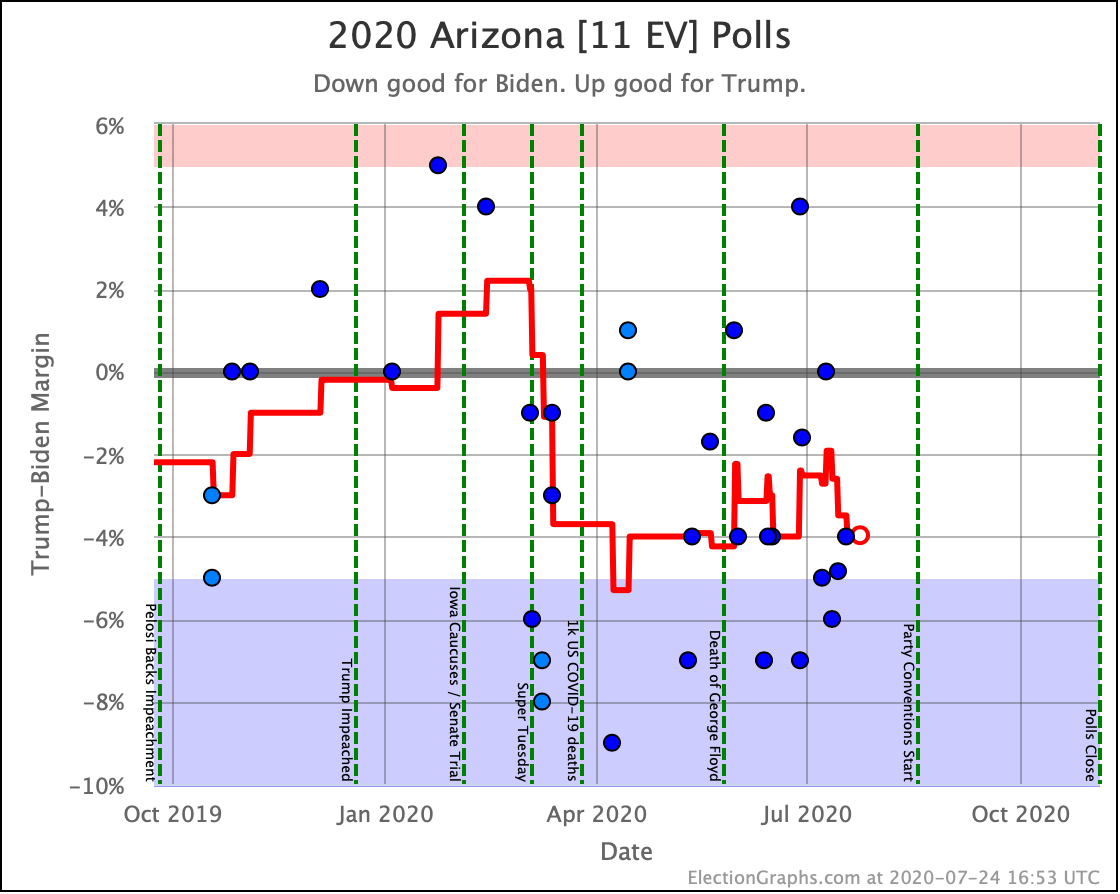
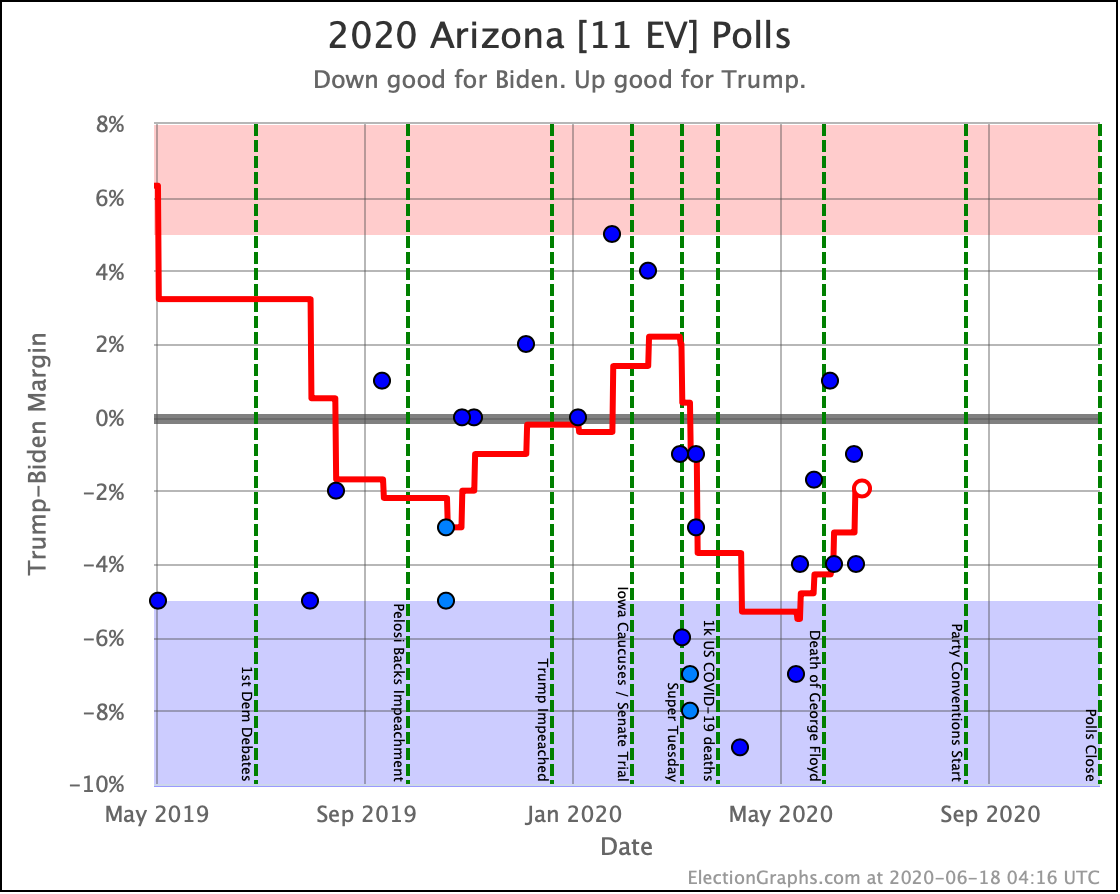
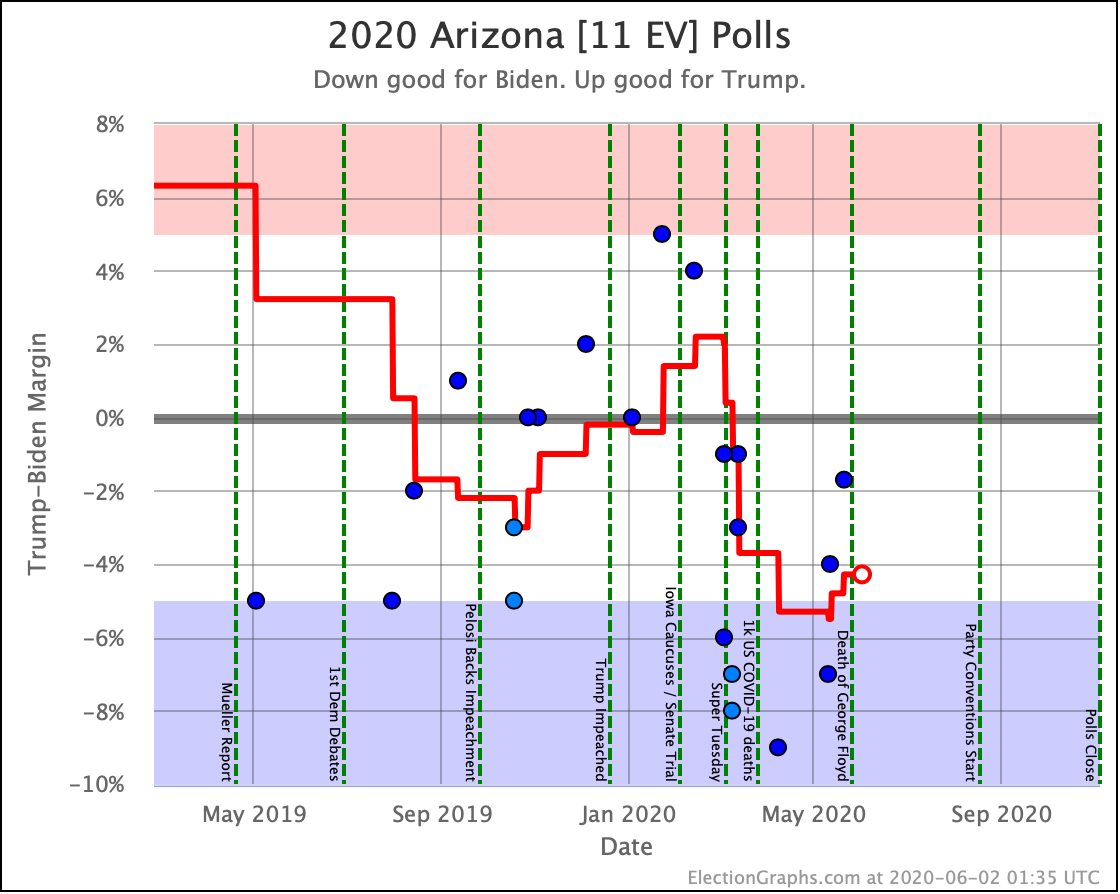
Out of the close ("weak") states, Biden only has to hold Arizona and Pennsylvania. He can afford to lose all the rest and still win.
But we're once again in a position where with a sweep of all the close states, Trump could win.
86.0 days until polls start to close on election night. Stay tuned!
For more information:
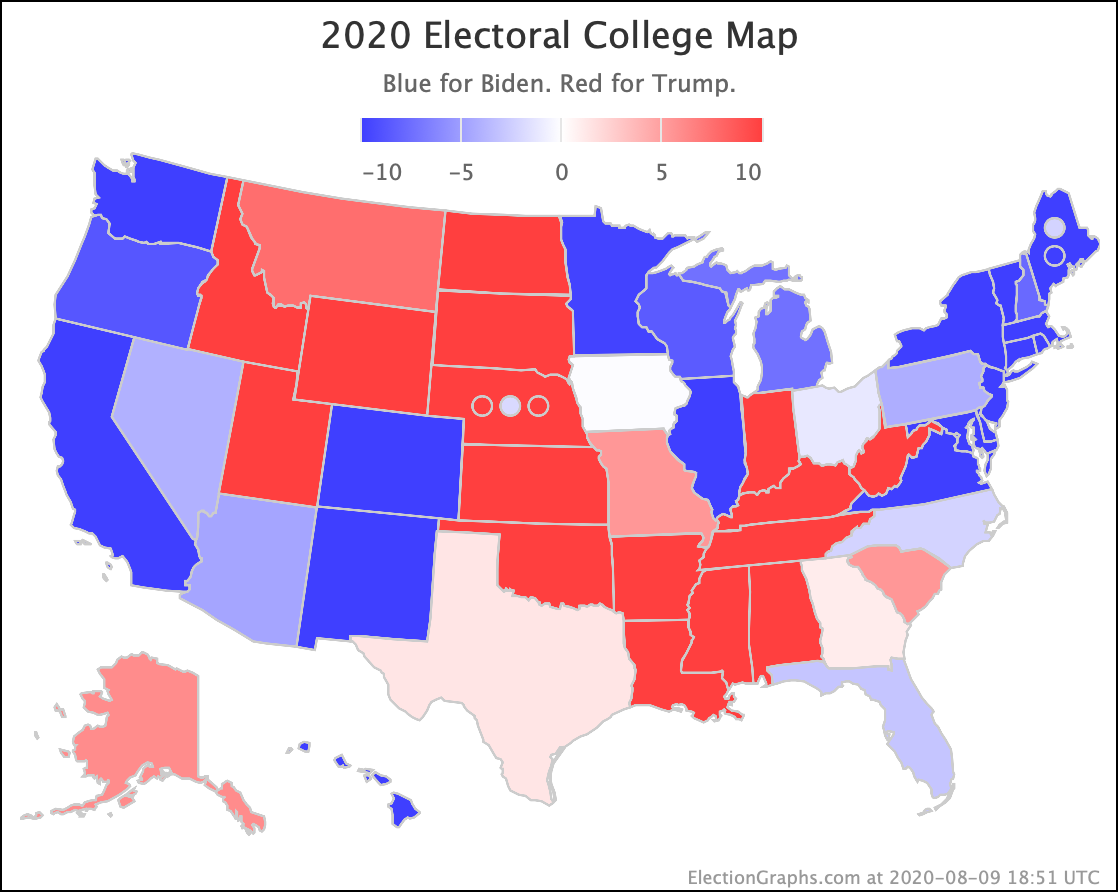
This post is an update based on the data on the Election Graphs Electoral College 2020 page. Election Graphs tracks a poll-based estimate of the Electoral College. The charts, graphs, and maps in the post above are all as of the time of this post. Click through on any image for current interactive versions of the chart, along with additional details.
Follow @ElectionGraphs on Twitter or Election Graphs on Facebook to see announcements of updates. For those interested in individual poll updates, follow @ElecCollPolls on Twitter for all the polls as I add them. If you find the information in these posts informative or useful, please consider visiting the donation page.