Correction 2020-08-26 06:03 UTC:
As it turns out, a bug I've been fighting on the site that causes data to sometimes be randomly corrupted until I notice and fix it popped up with perfect timing for me to include some bad data in the blog post below.
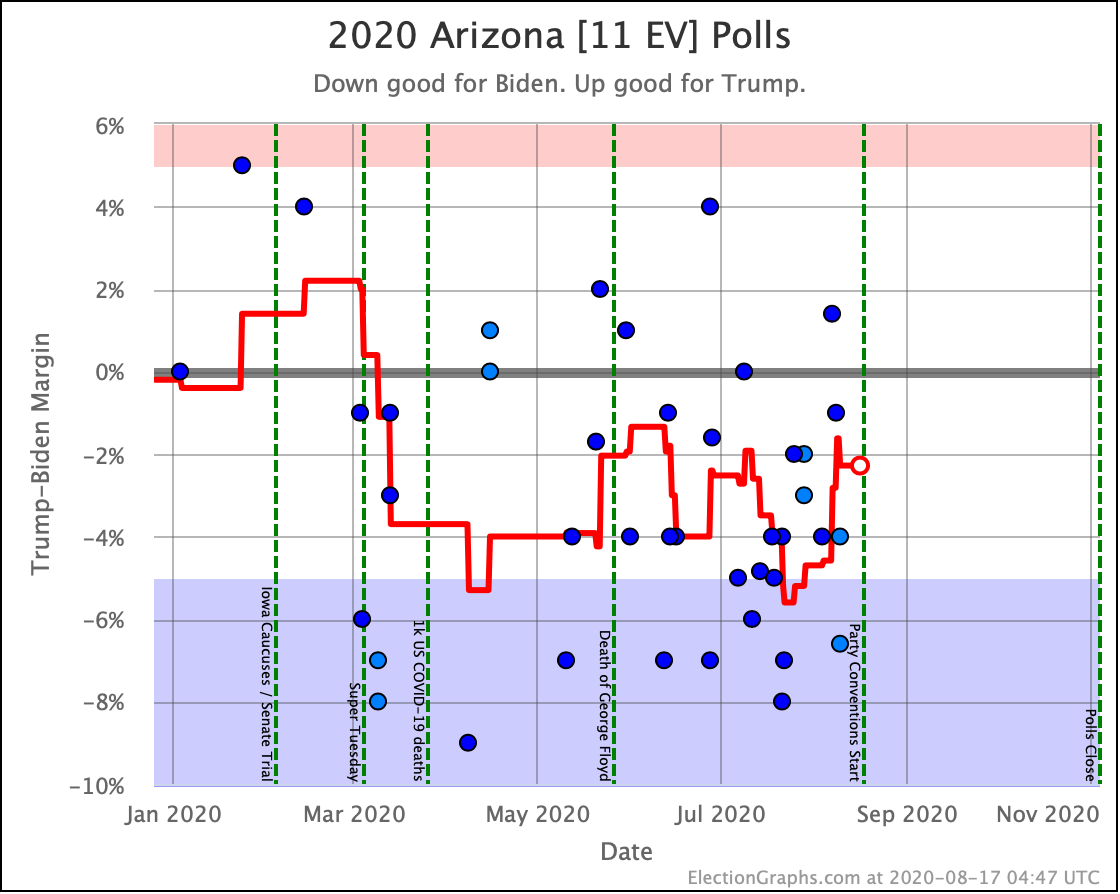
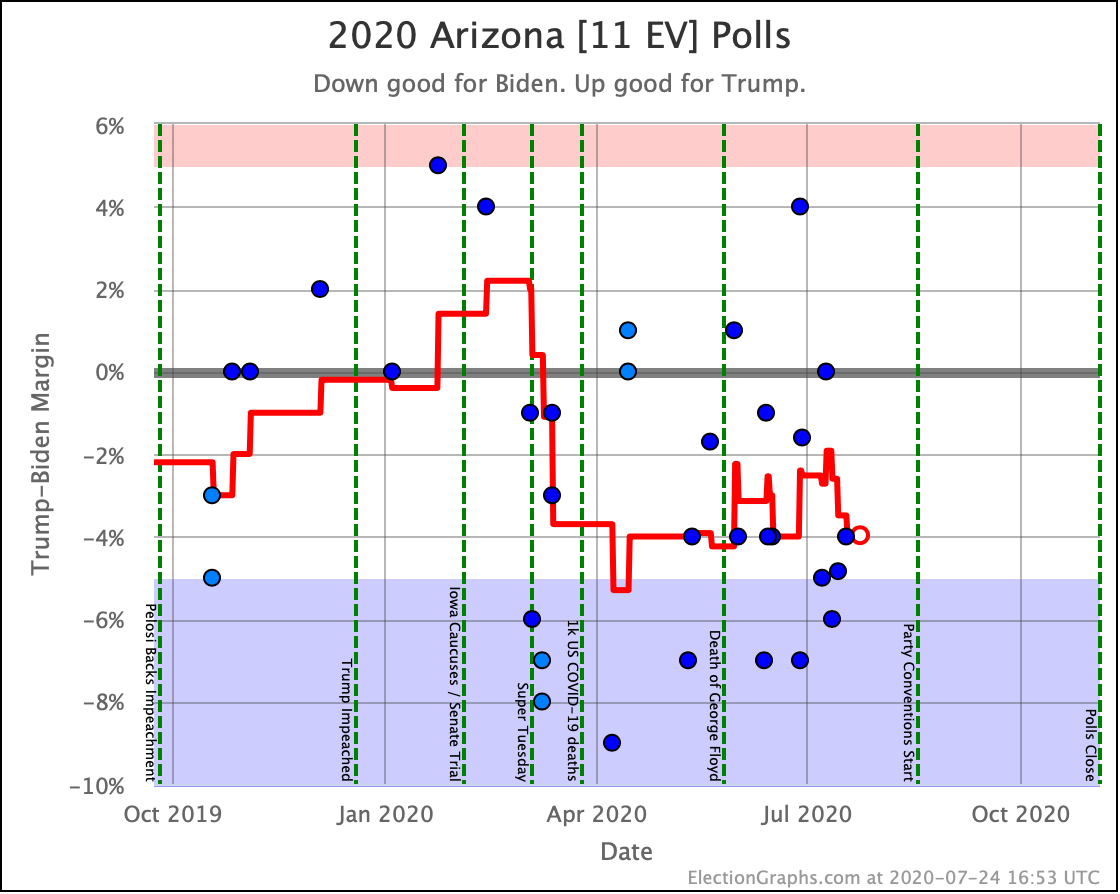
Specifically, only the probabilistic view was impacted this time… it had bogus numbers for Arizona, which threw everything else off. Despite a couple of warning signs, I didn't see the problem until well after the post below. Oops.
The right numbers as of when this post was made should have been:
- Trump 2σ: Biden +50
- Median: Biden +148
- Biden 2σ: Biden +258
This would have made the deltas: Trump +2, Trump +4, and Trump +2, respectively. Still movement toward Trump on those metrics, but significantly less than indicated below. And Biden's win odds should have remained flat at 99.9%.
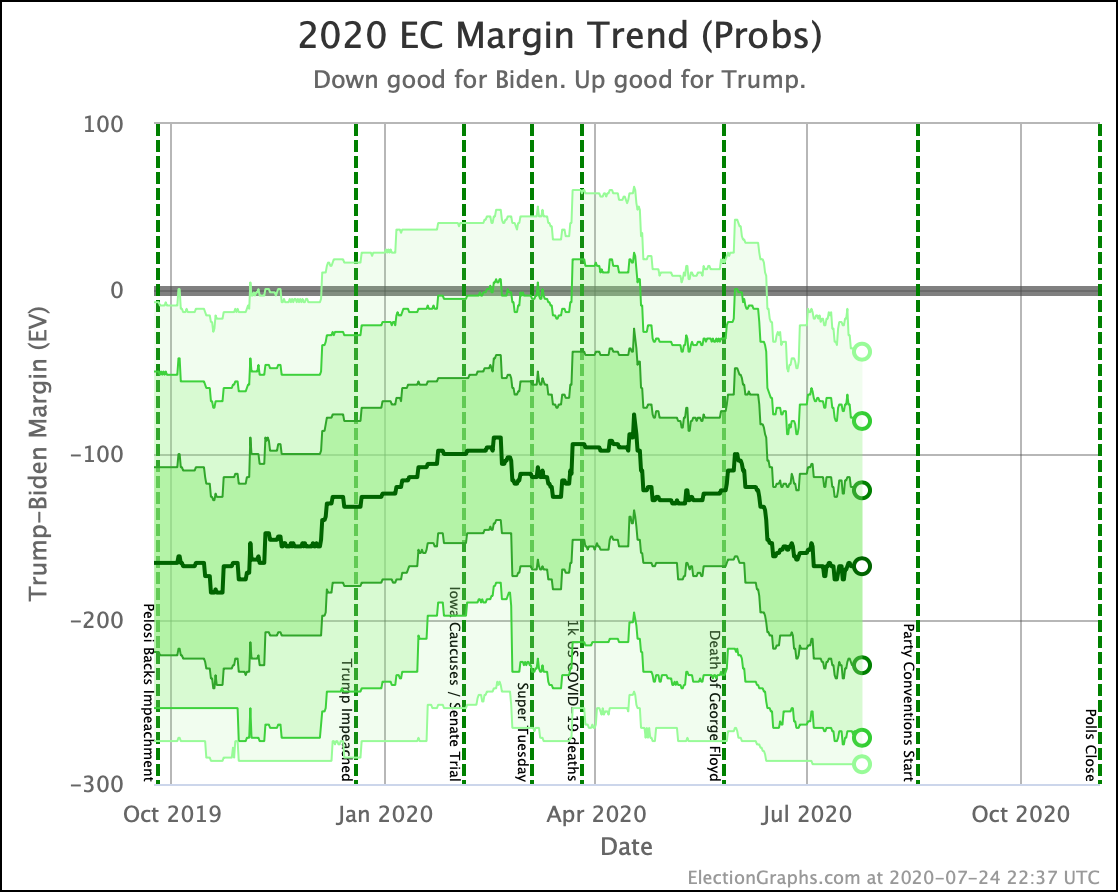
The graph for the probabilistic model trend is of course also off because of the same issue.
Apologies for the error. I'm crossing my fingers that I have finally squashed this bug, or at least that I will notice and fix specific errors before making posts that include them. Thanks for understanding:
Original post from 2020-08-25 06:51 UTC:
Time for another blog update. As always, if you are impatient for one of these updates, the 2020 pages on Election Graphs are updated nearly every day as new polls come in.
The last update here was 8 days ago on August 17th.
Here are the high-level changes since then:
| Model | Metric | 17 Aug | 25 Aug | 𝚫 |
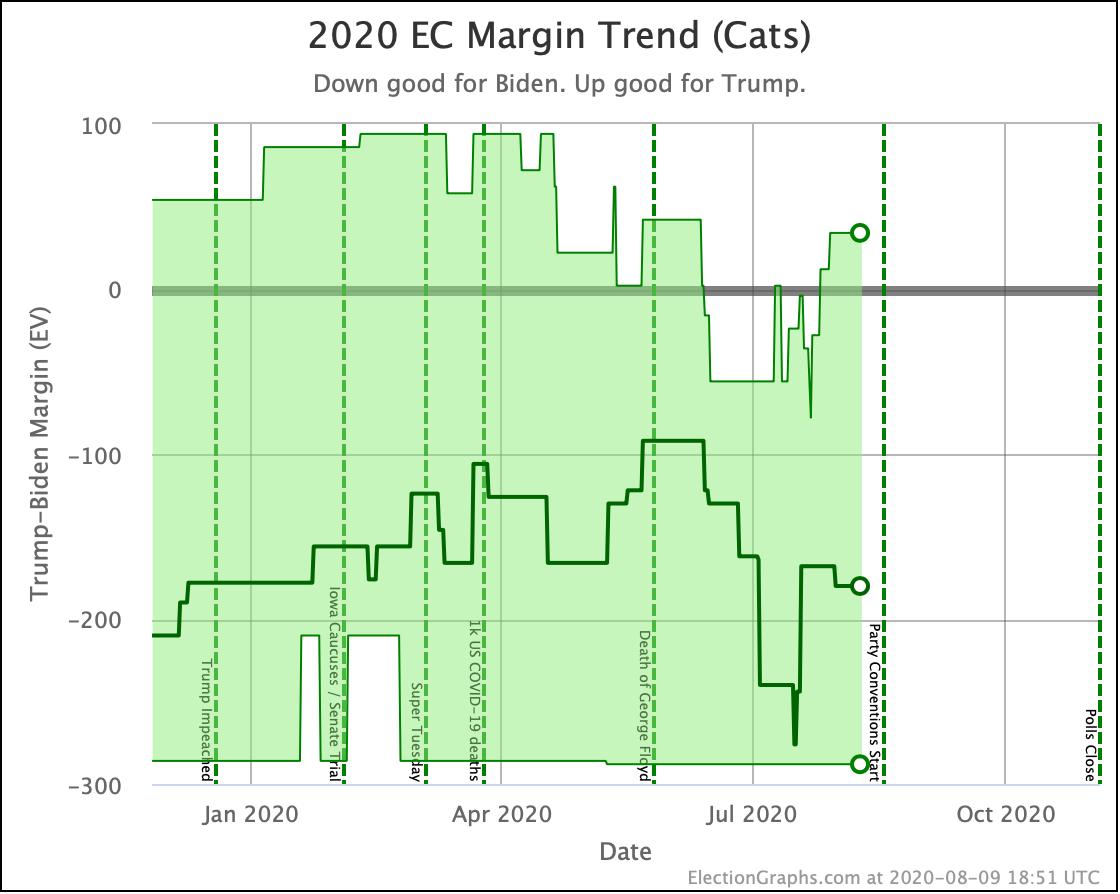
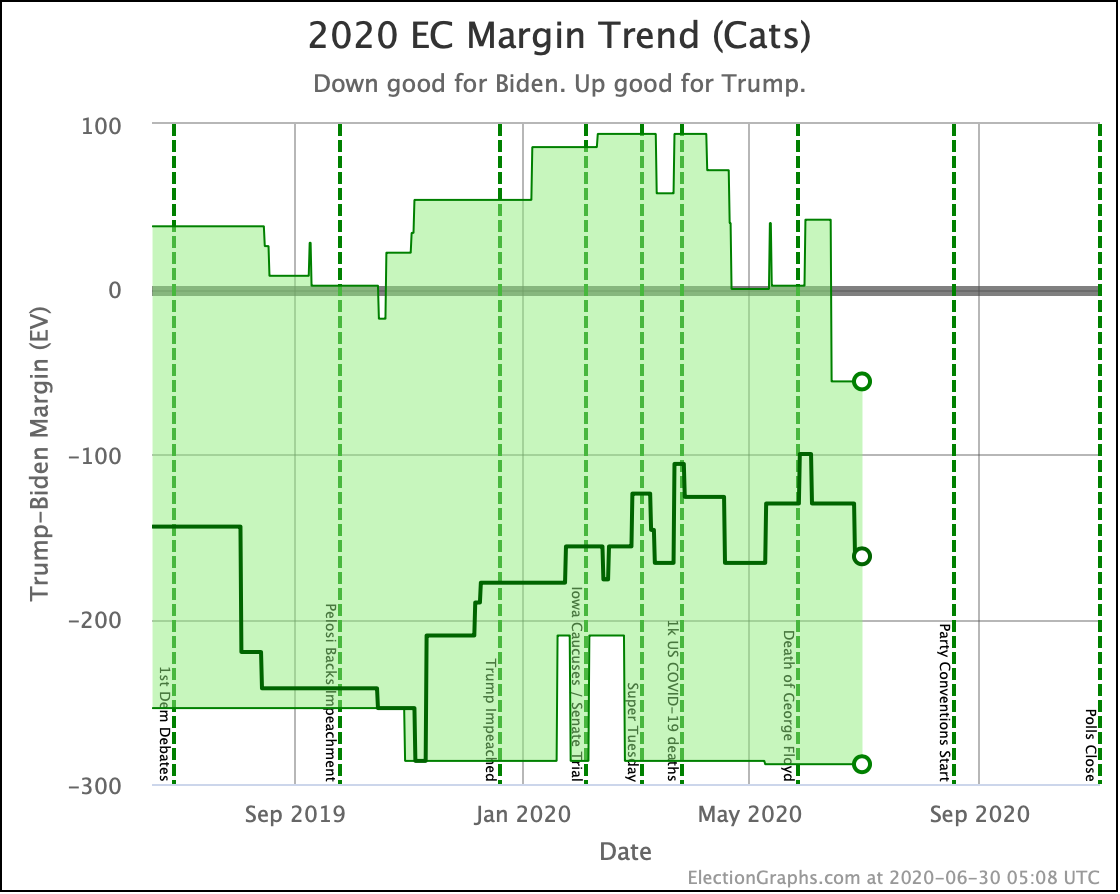
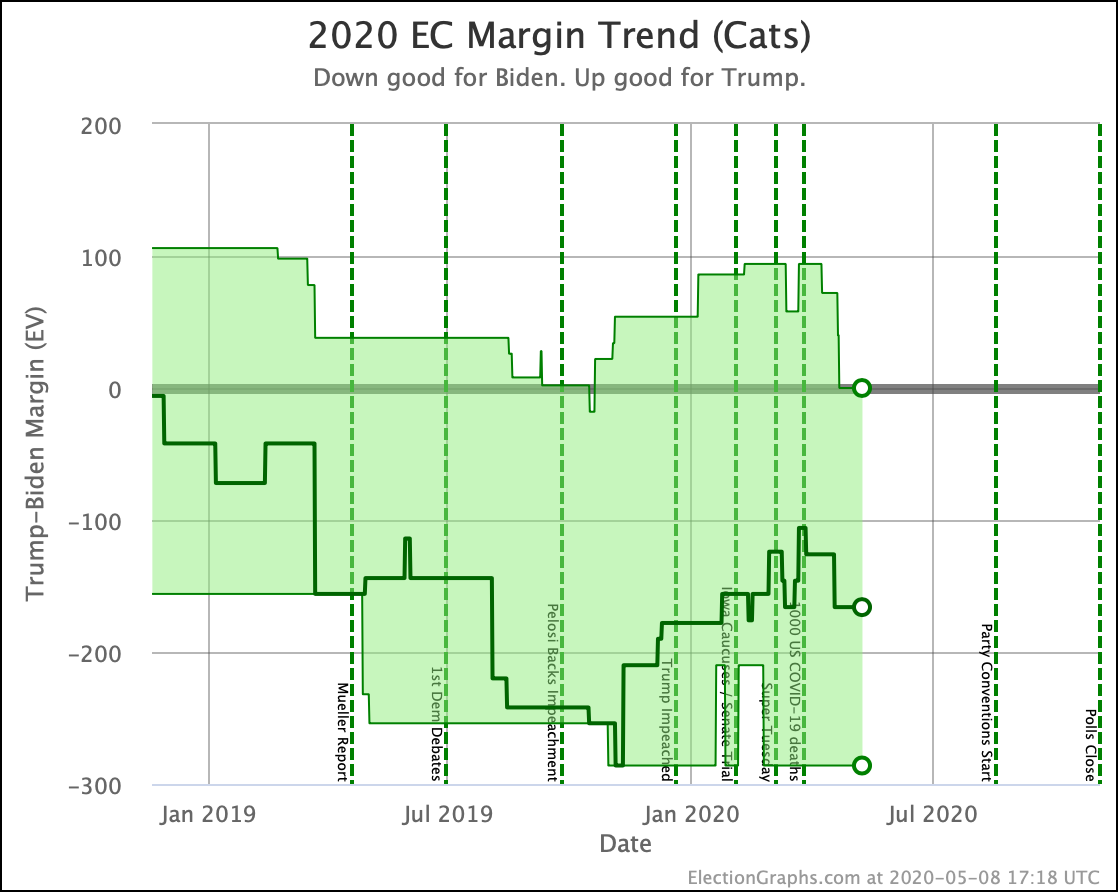
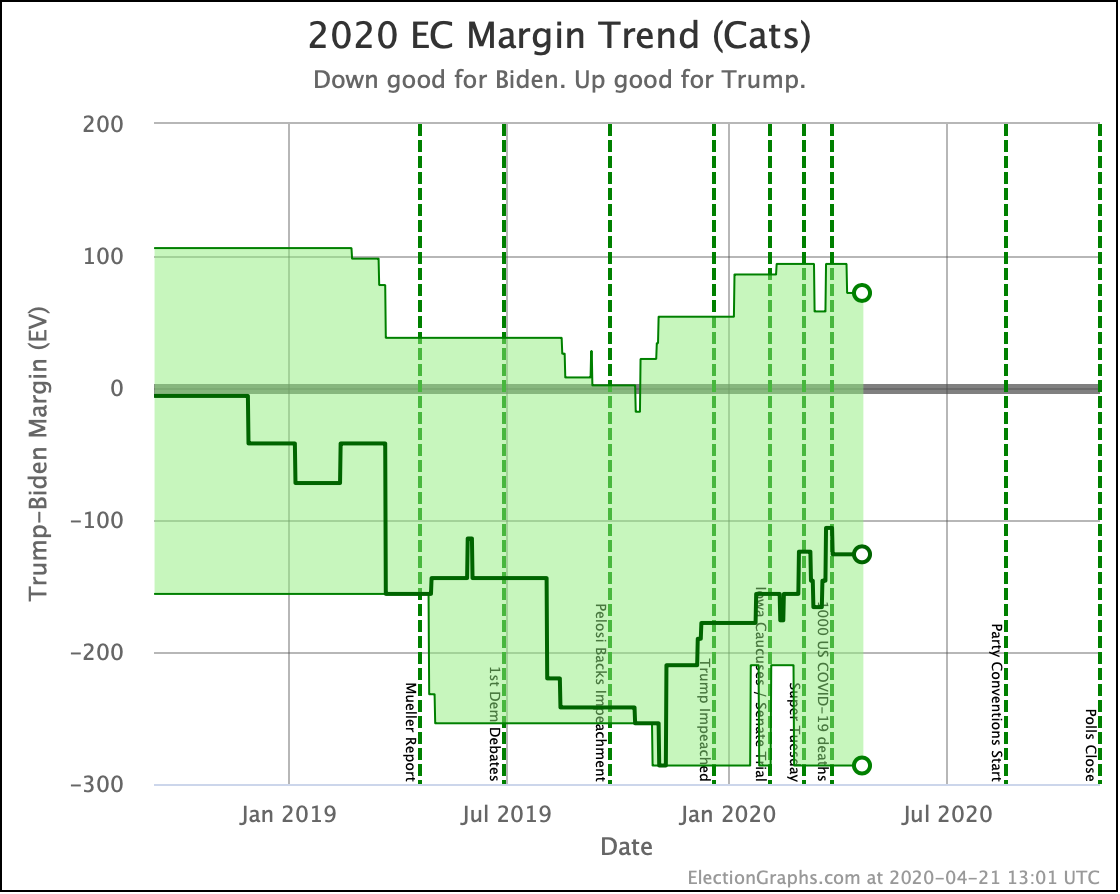
| Categories | Trump Best Expected Biden Best |
Biden +6 Biden +182 Biden +288 |
Biden +6 Biden +146 Biden +288 |
FLAT Trump +36 FLAT |
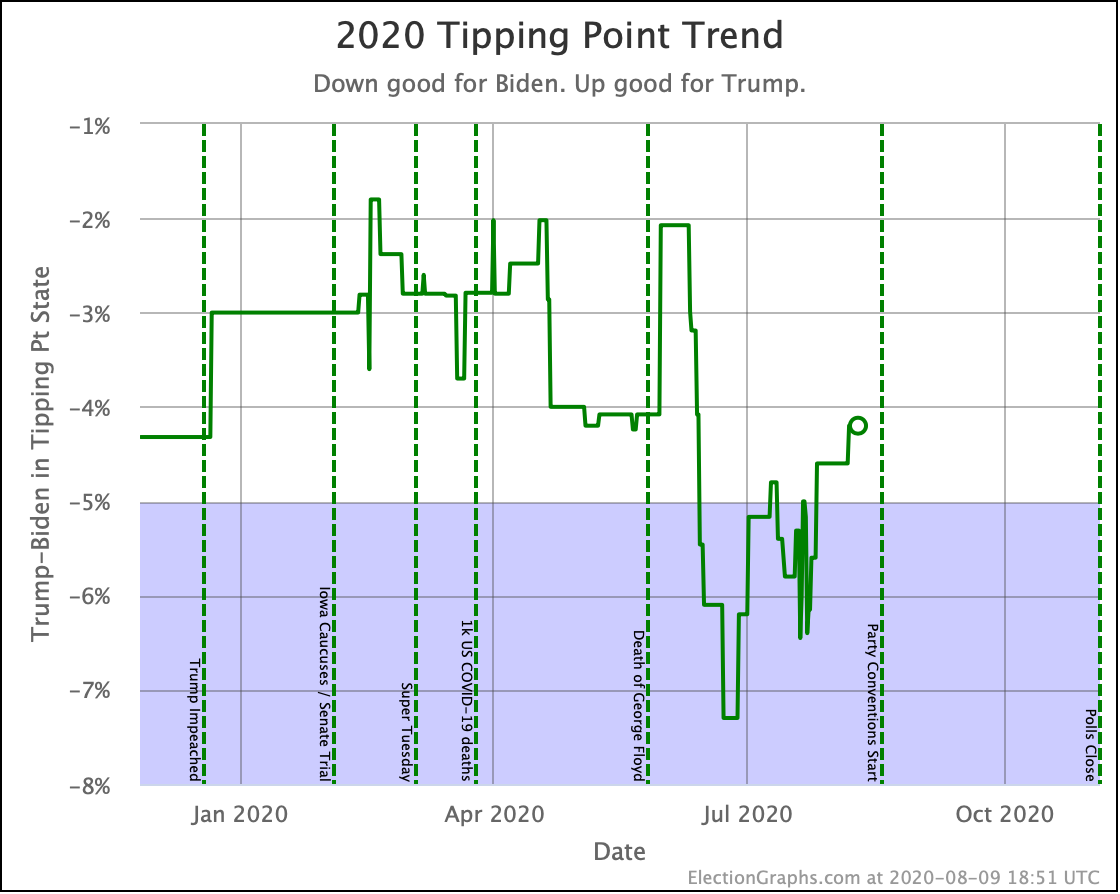
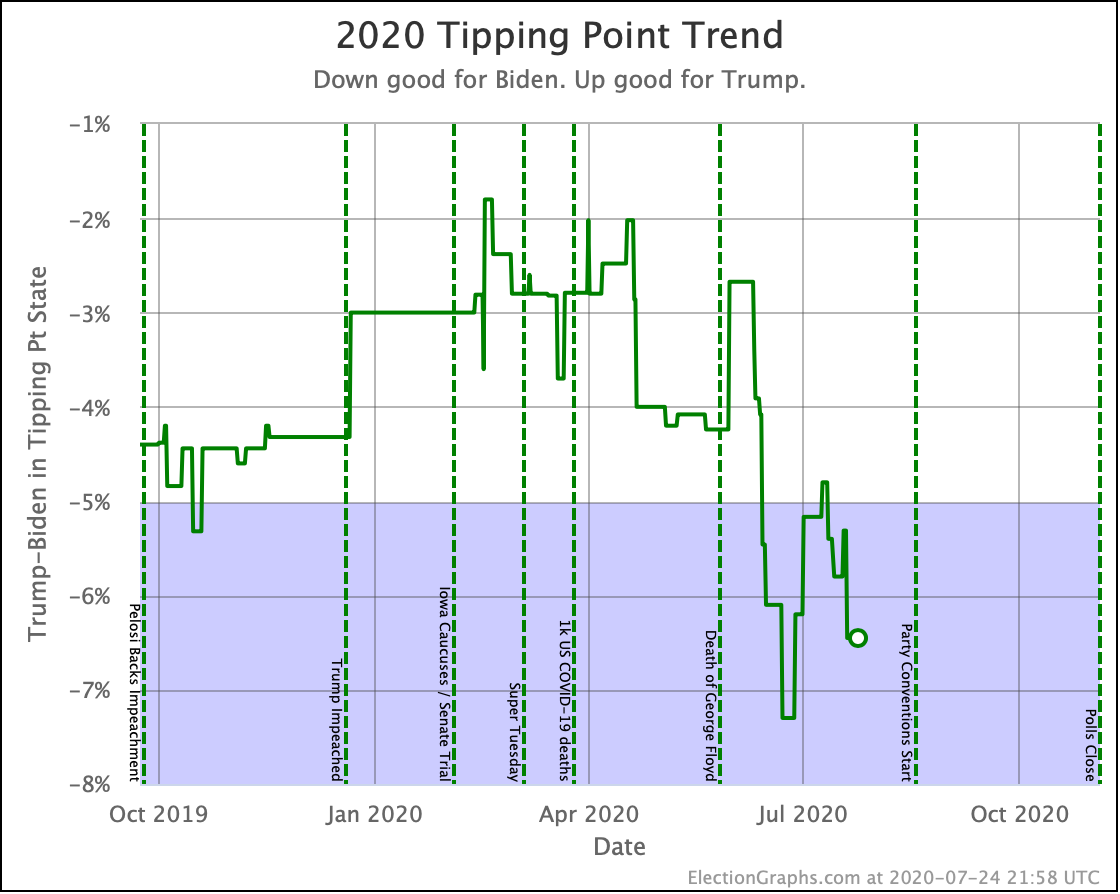
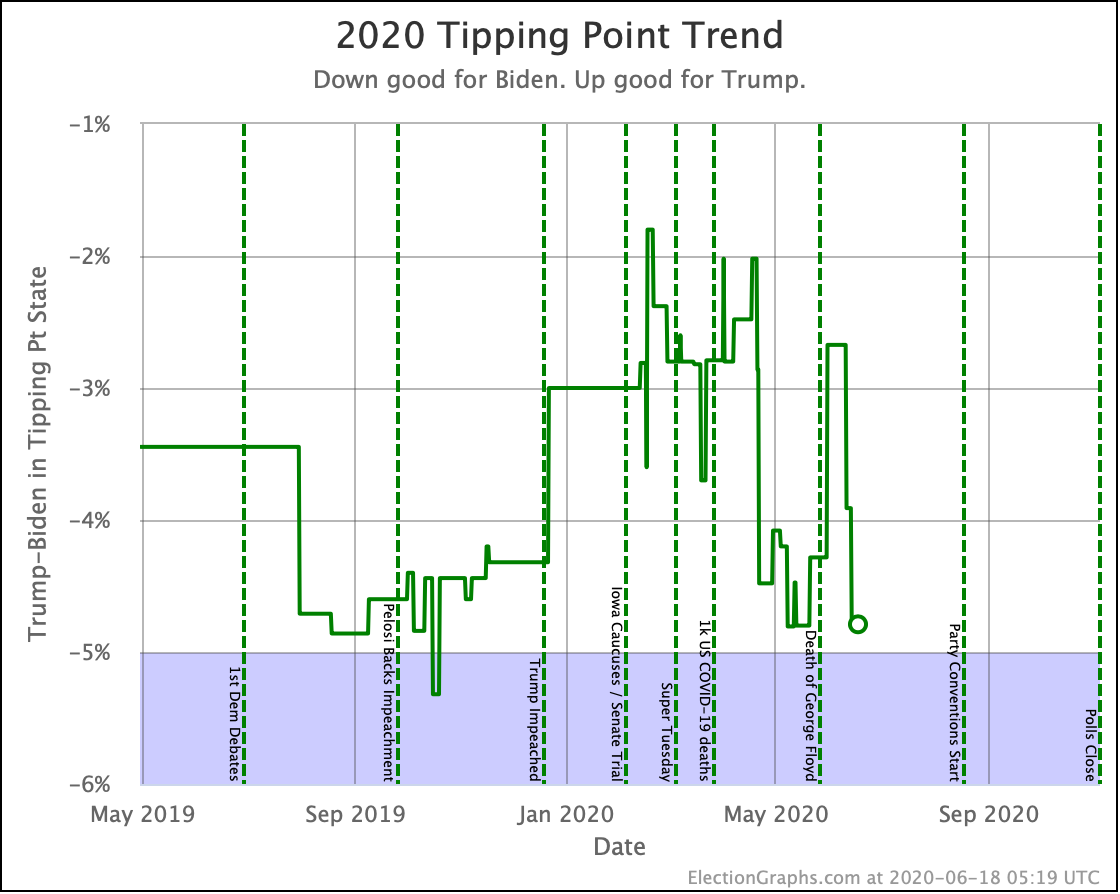
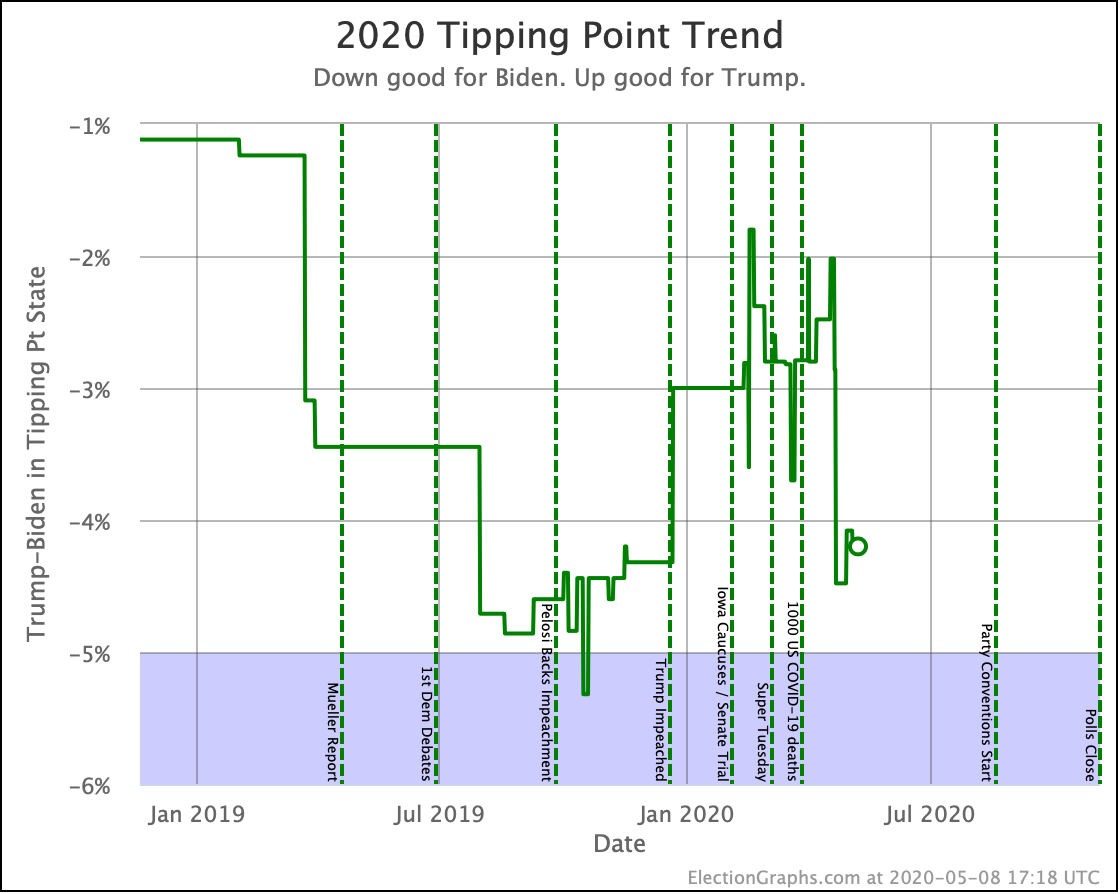
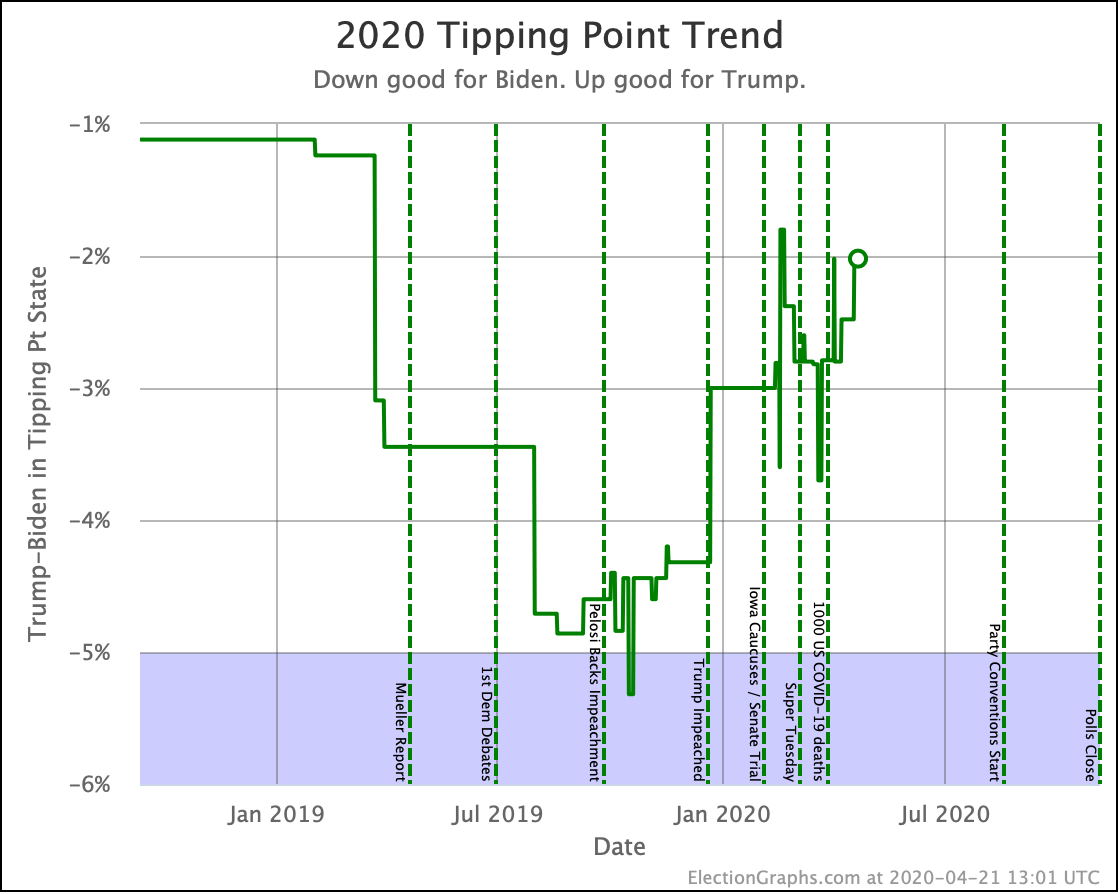
| Tipping Point | Biden +5.9 | Biden +6.0% | Biden +0.1% | |
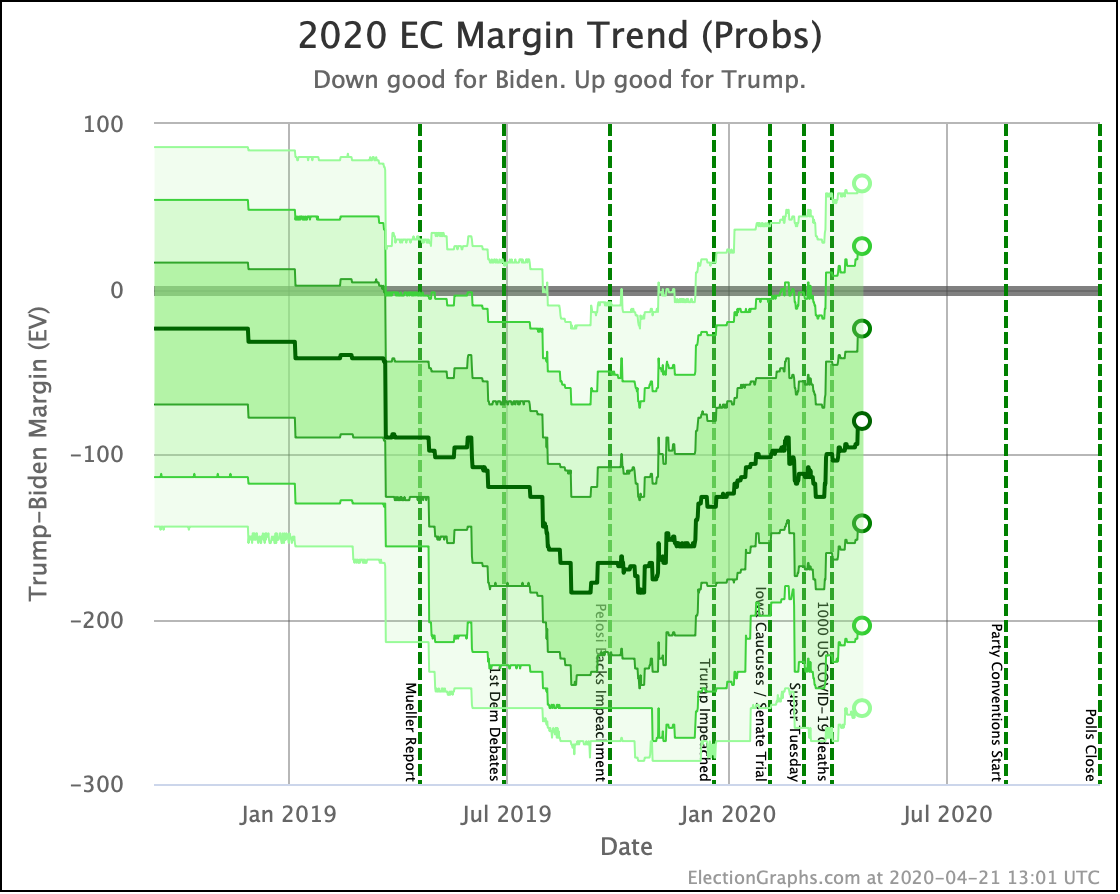
| Probabilities | Trump 2σ Median Biden 2σ |
Biden +52 Biden +152 Biden +260 |
Biden +32 Biden +128 Biden +238 |
Trump +20 Trump +24 Trump +22 |
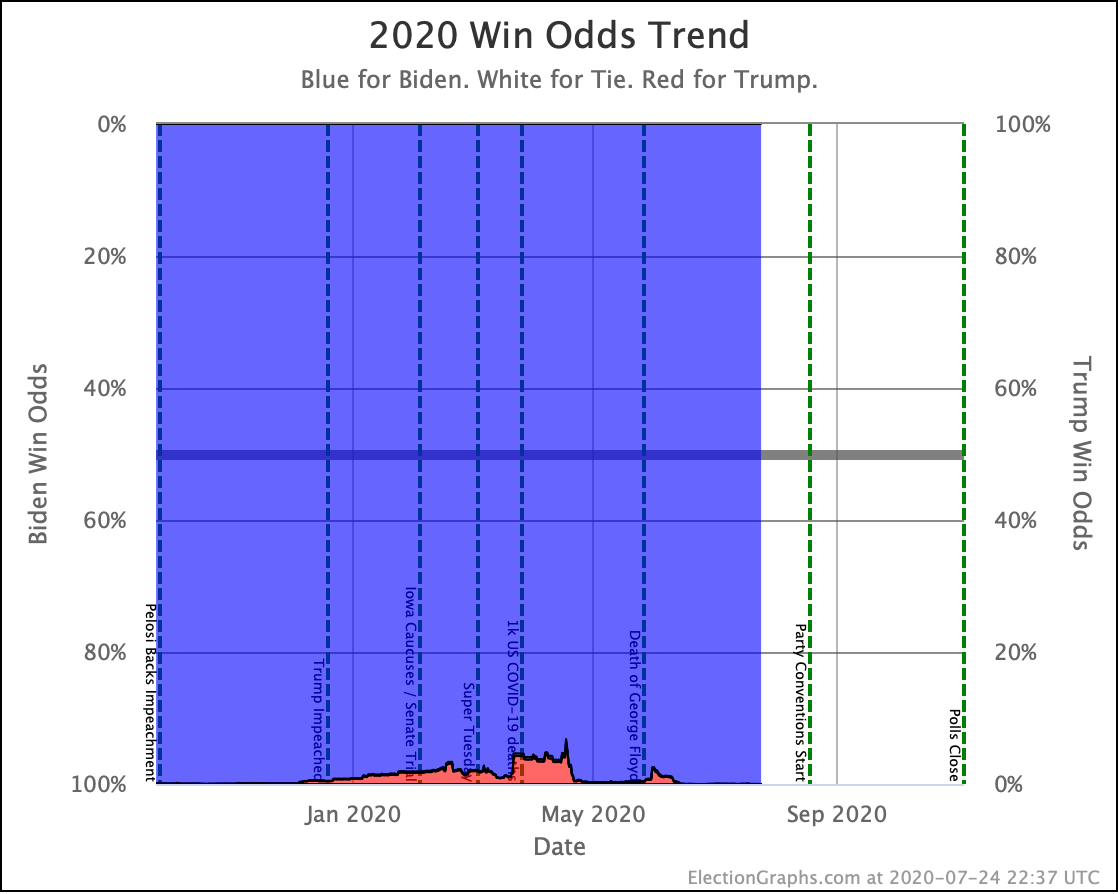
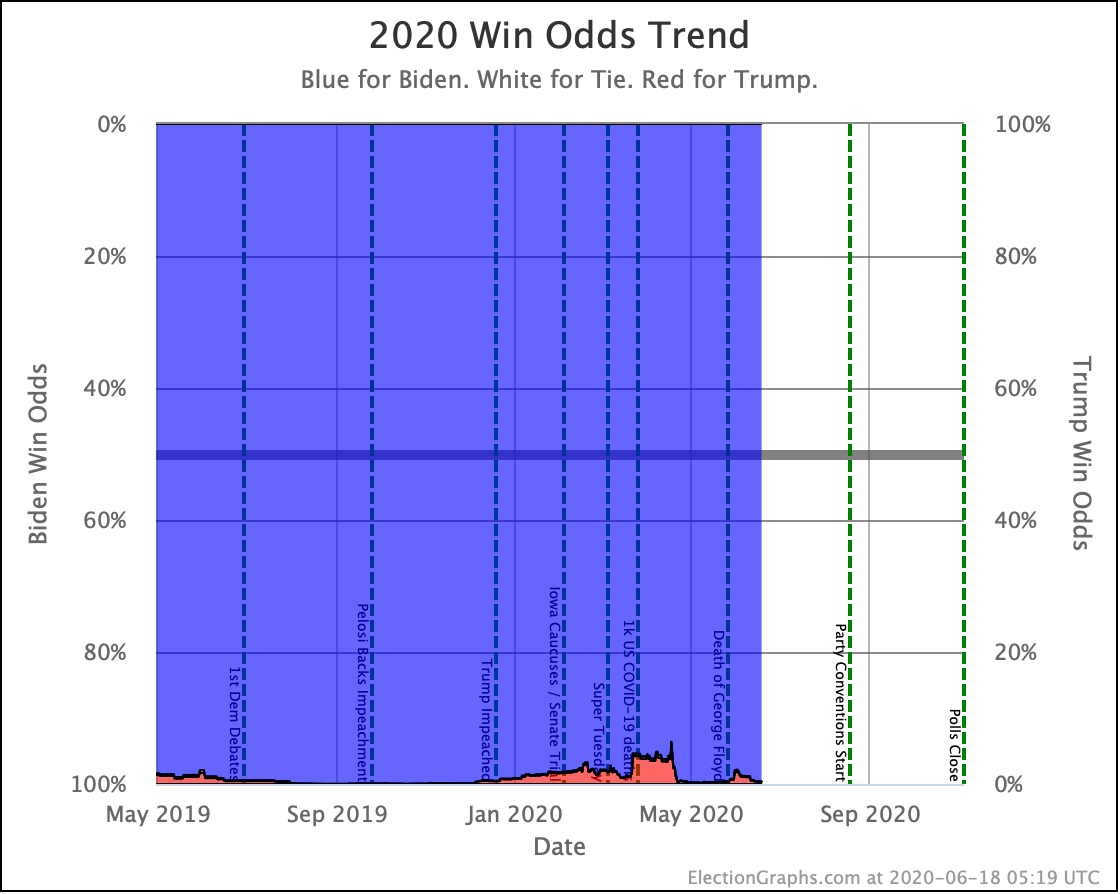
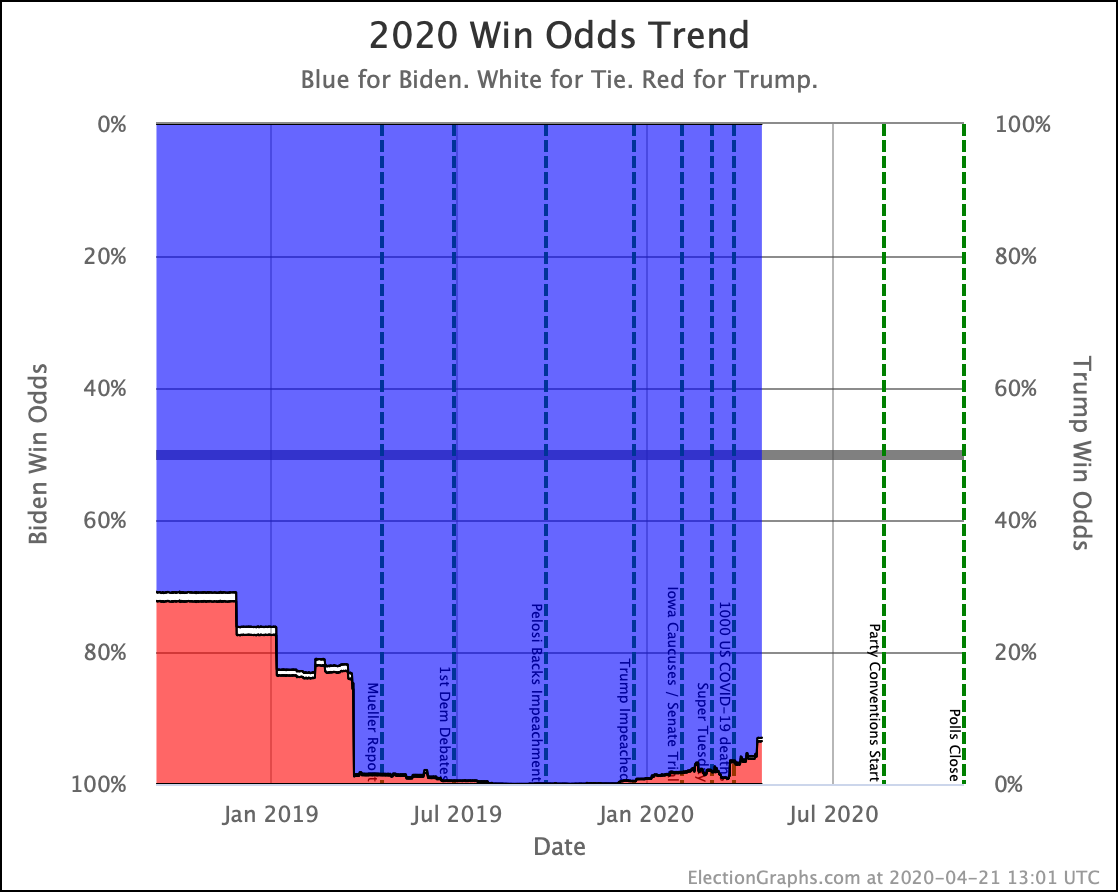
| Trump Win Tie Biden Win |
0.1% 0.0% 99.9% |
0.2% 0.1% 99.7% |
+0.1% +0.1% -0.2% |
This week's TL;DR: While Biden is still significantly ahead, and his tipping point even improves slightly, Trump is losing by a smaller margin than he was last week.
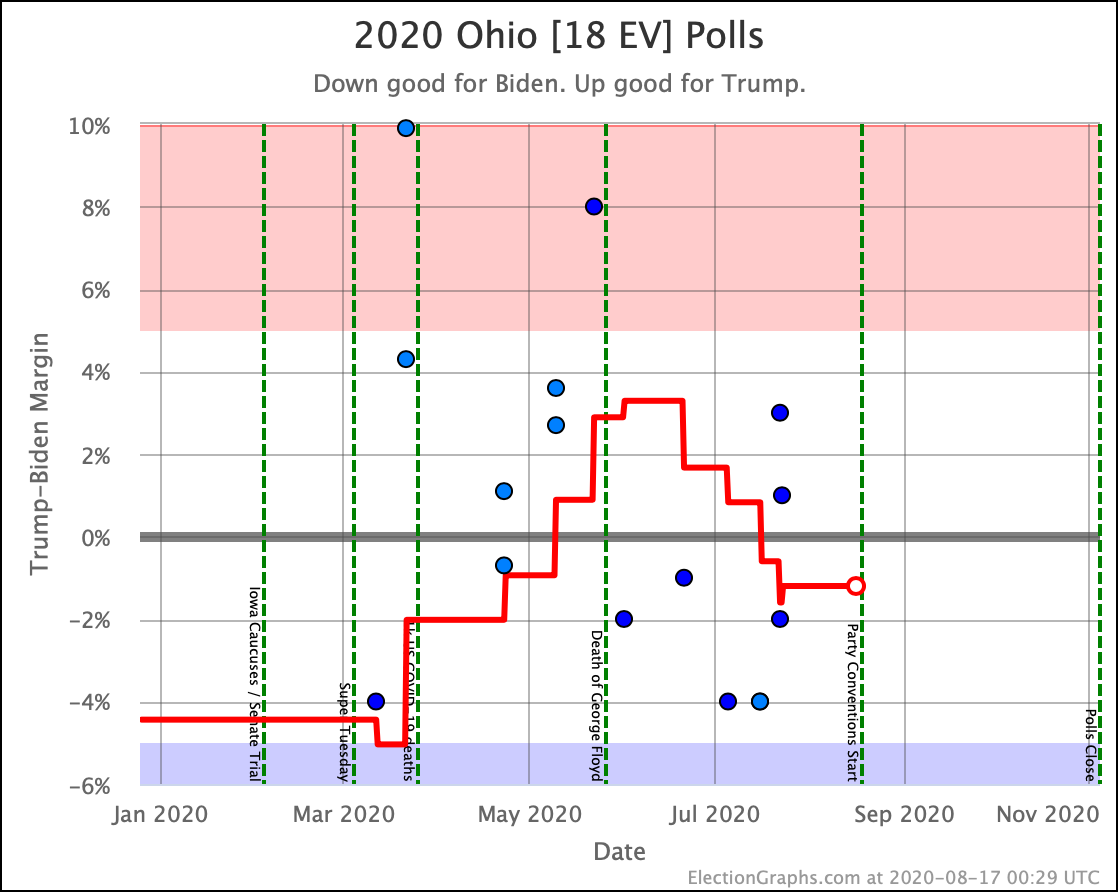
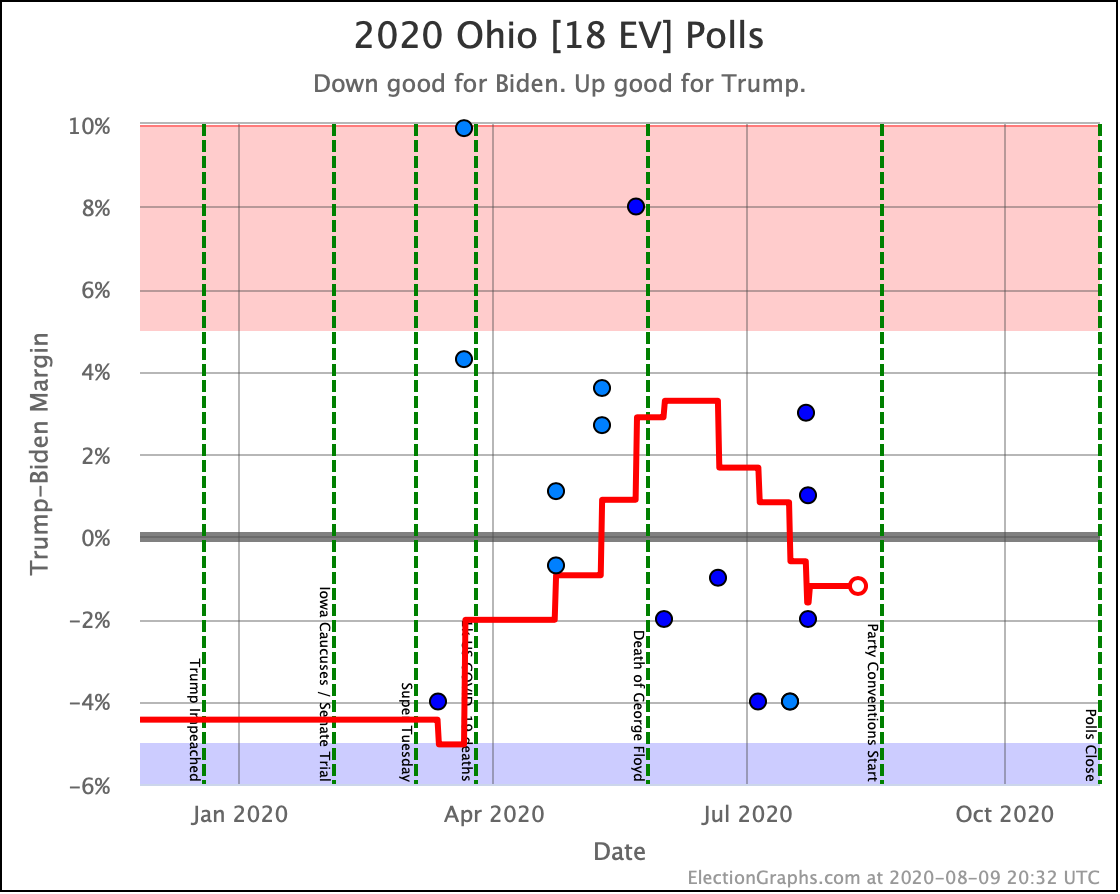
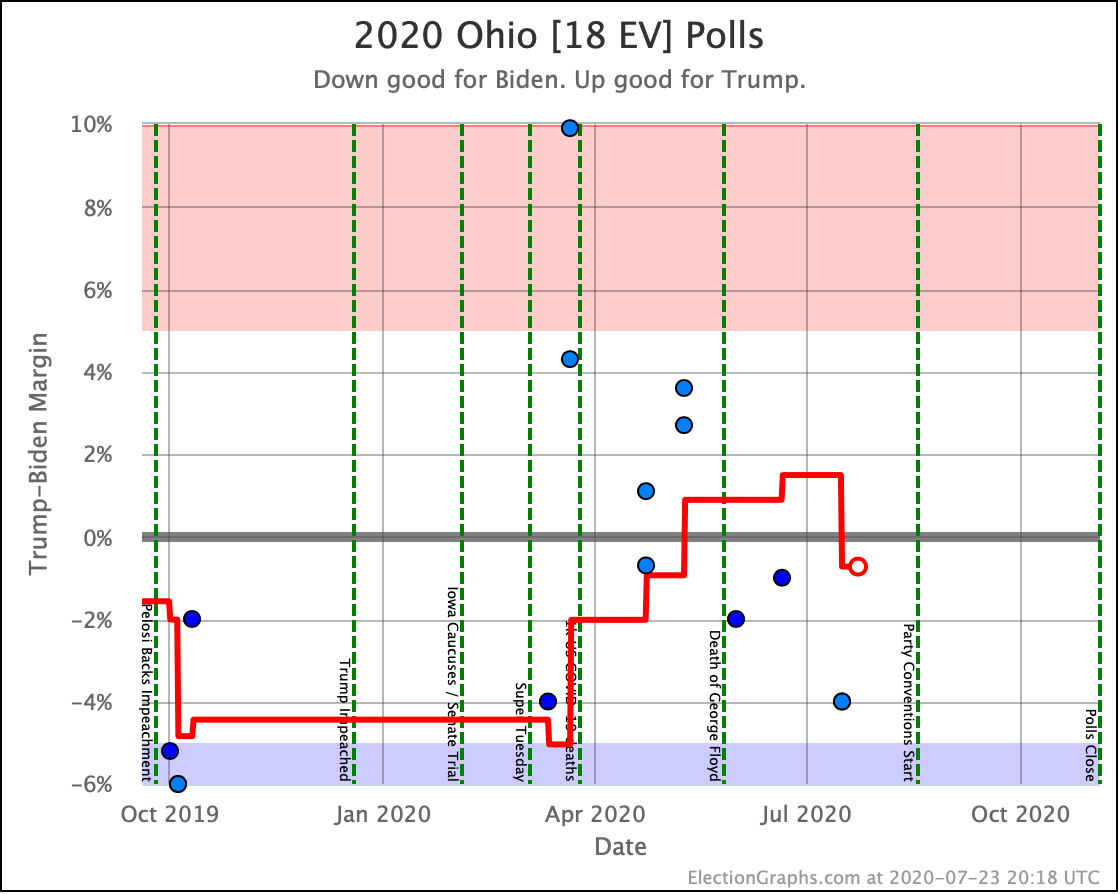
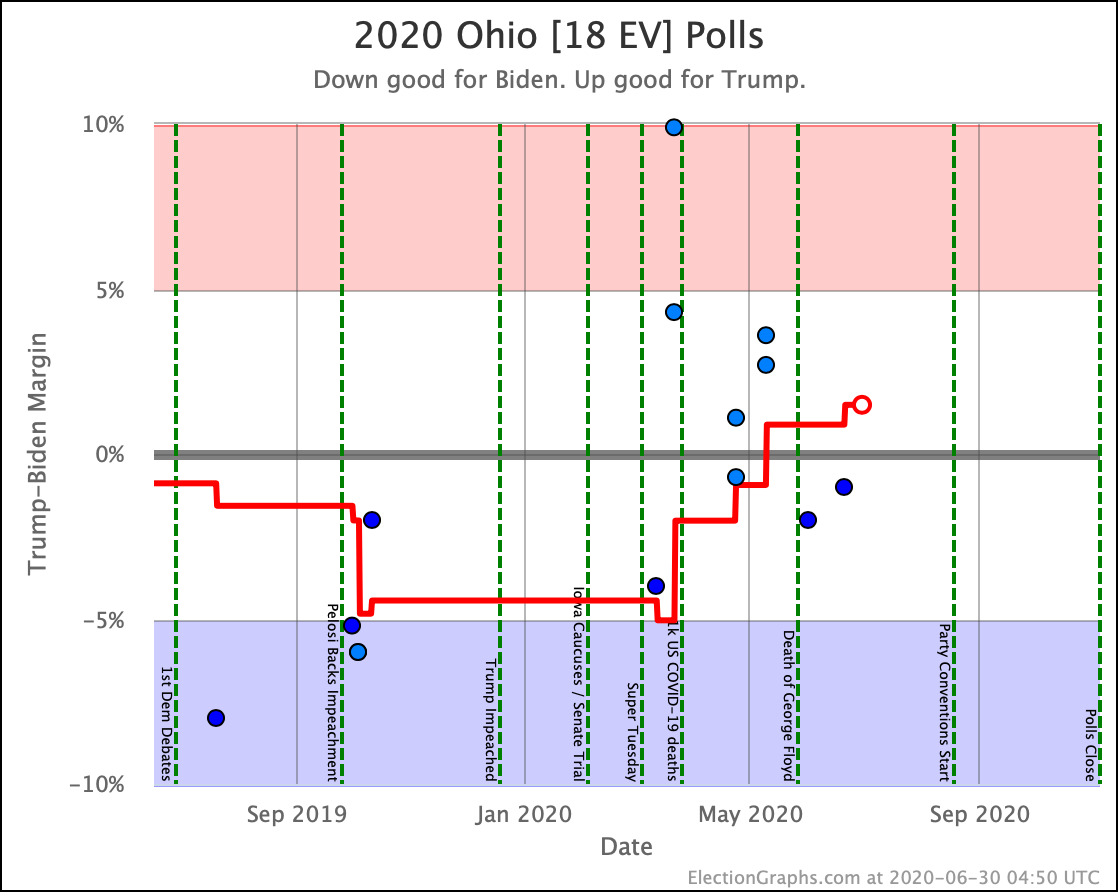
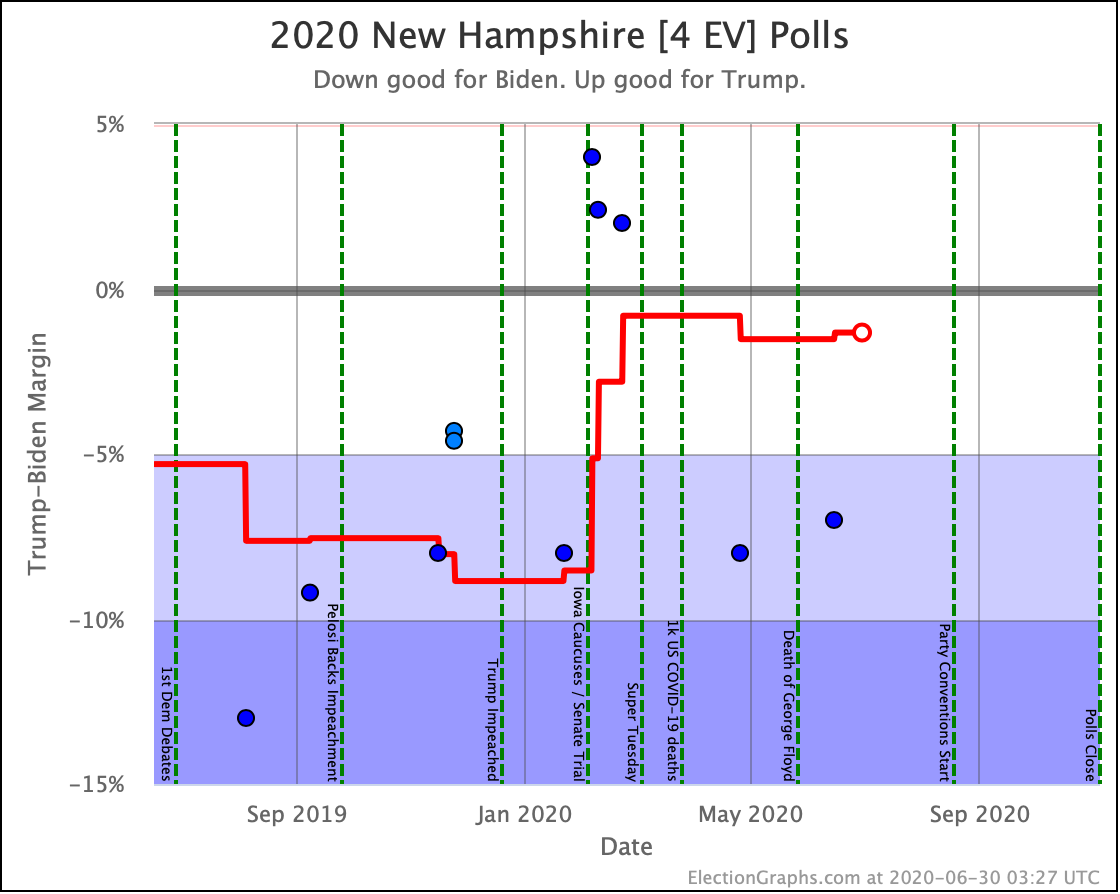
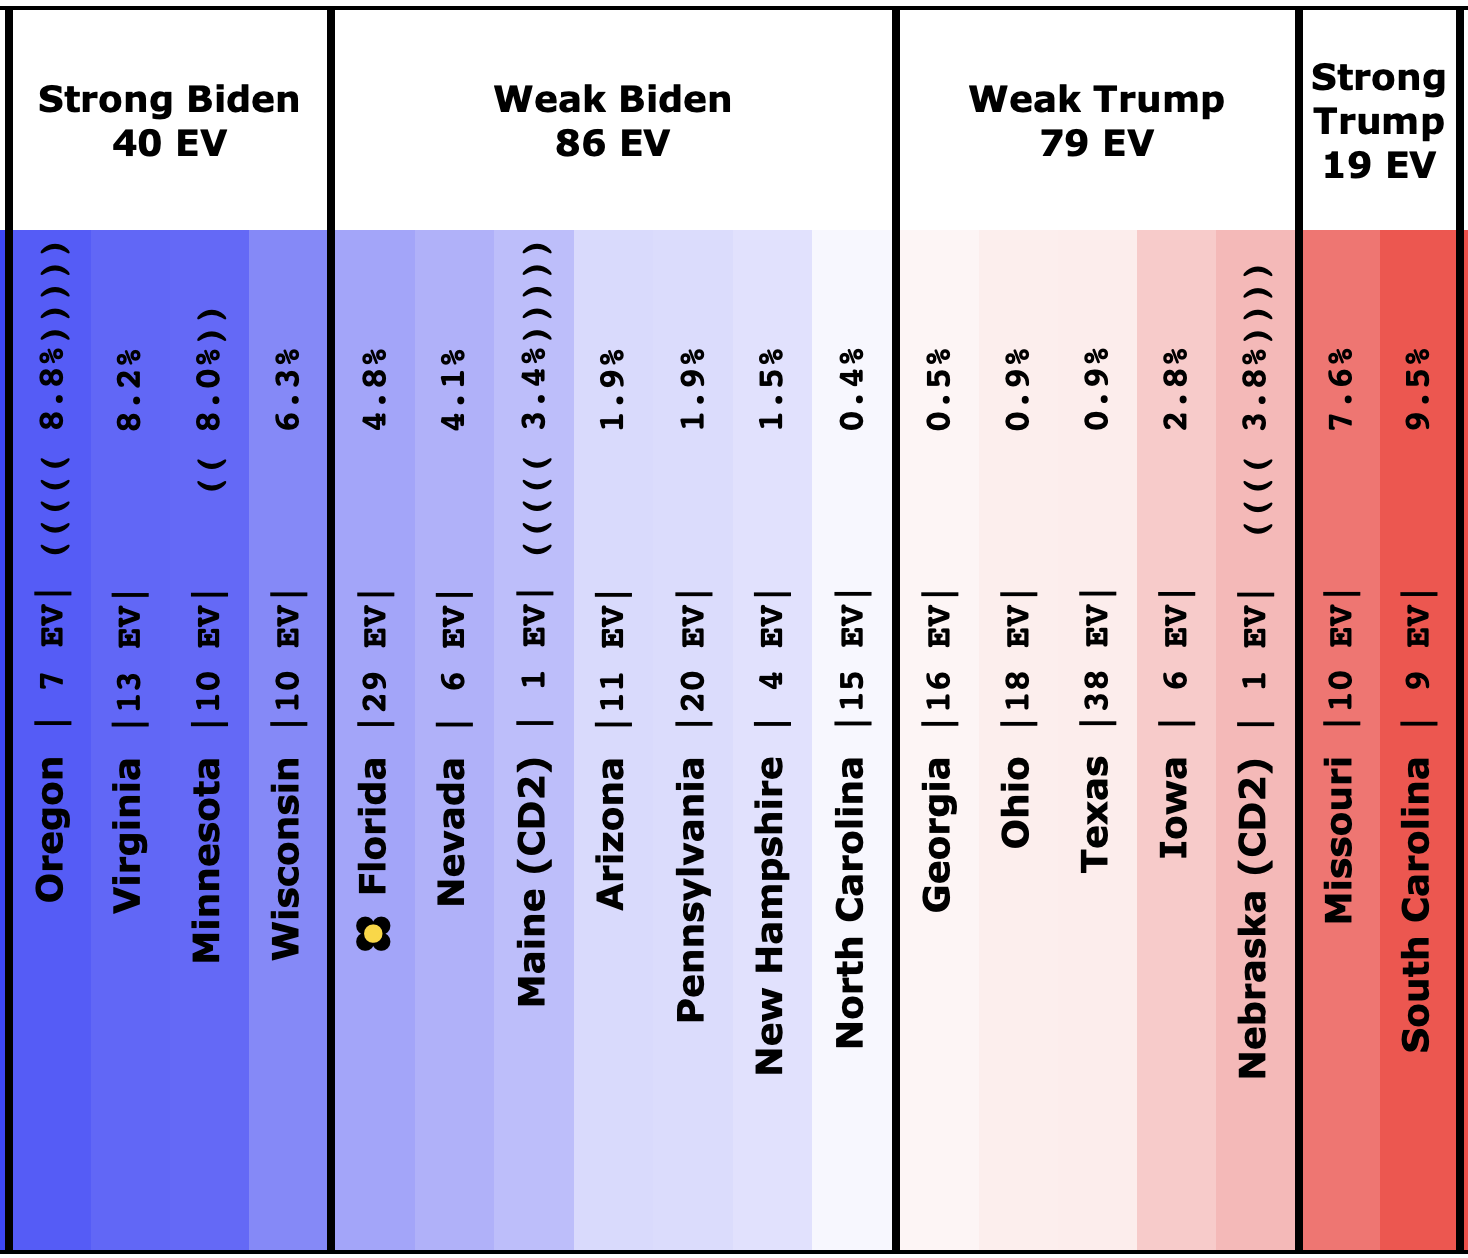
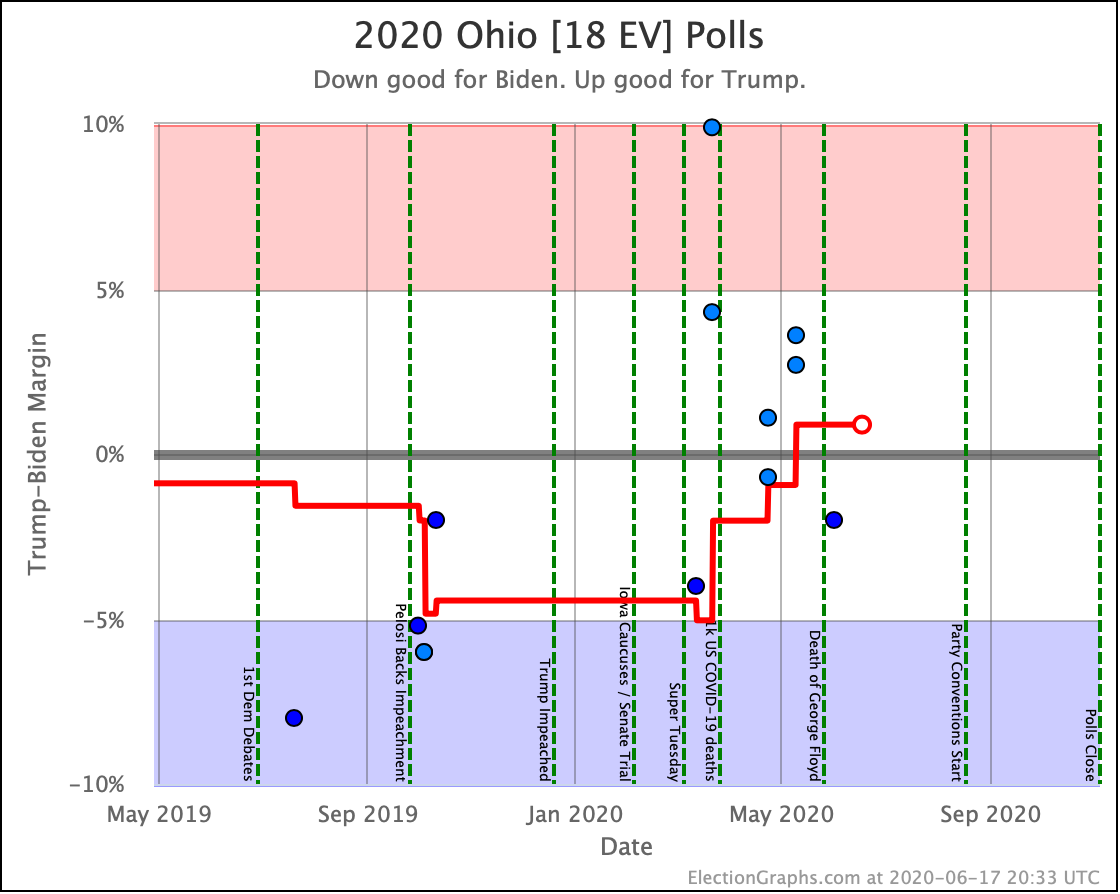
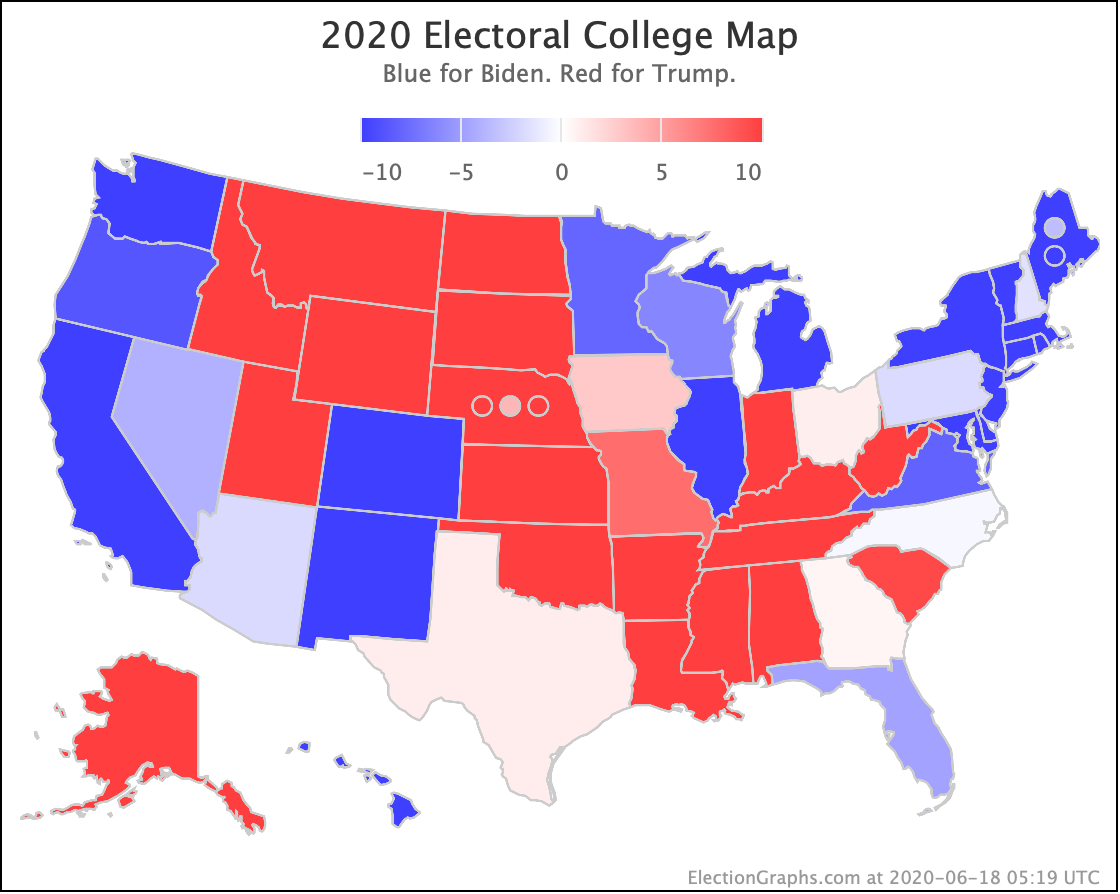
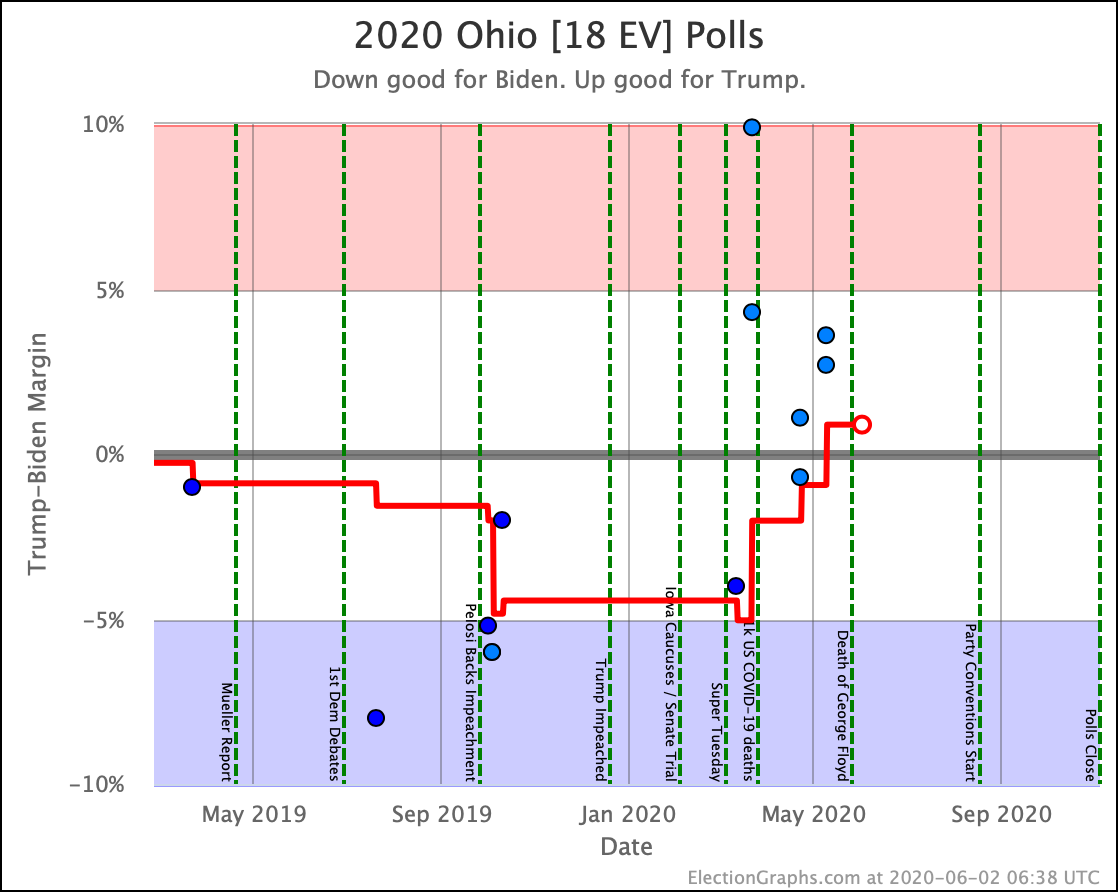
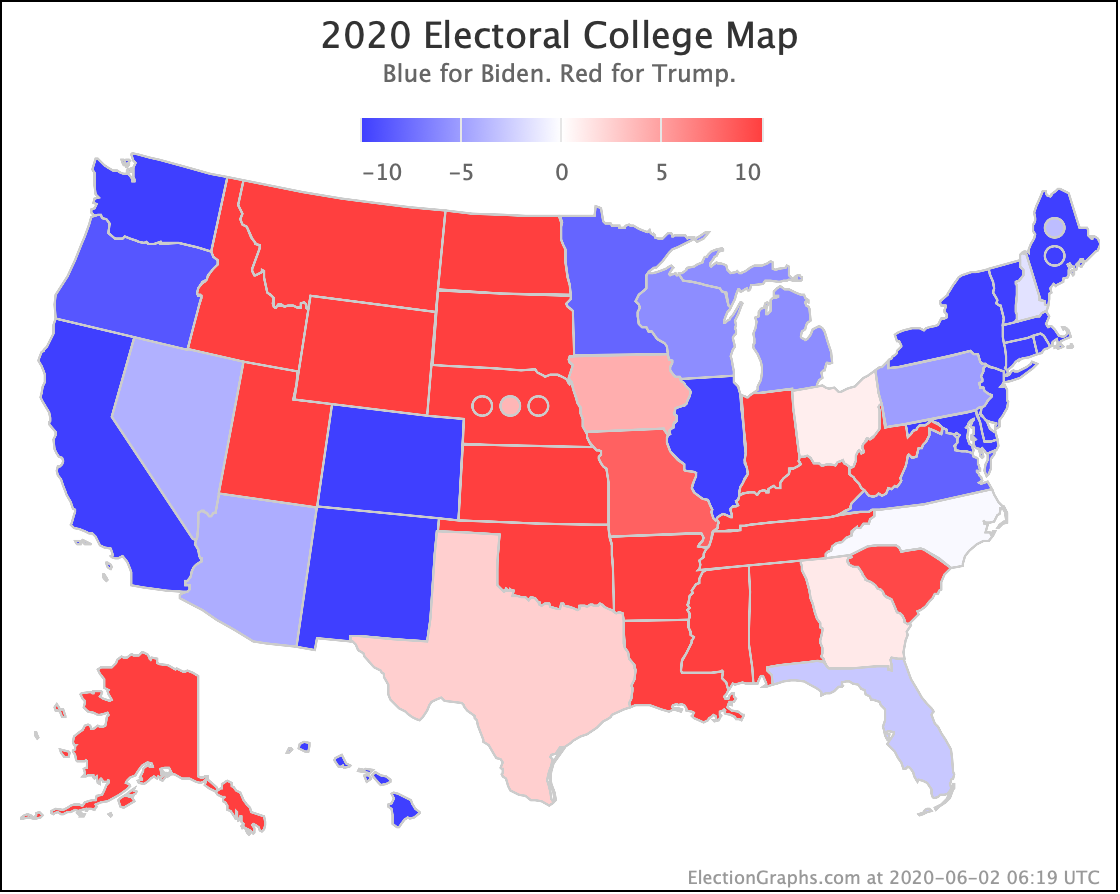
There was only one significant category change this week. It was Ohio:
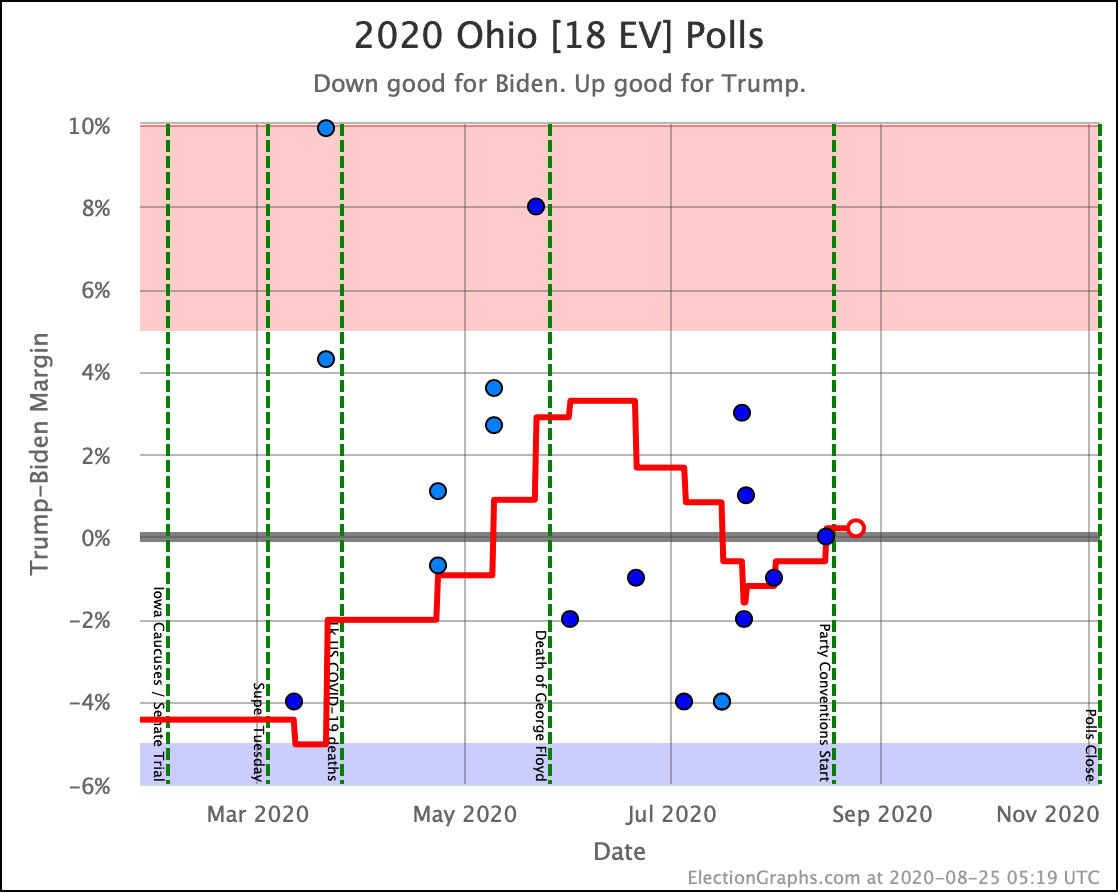
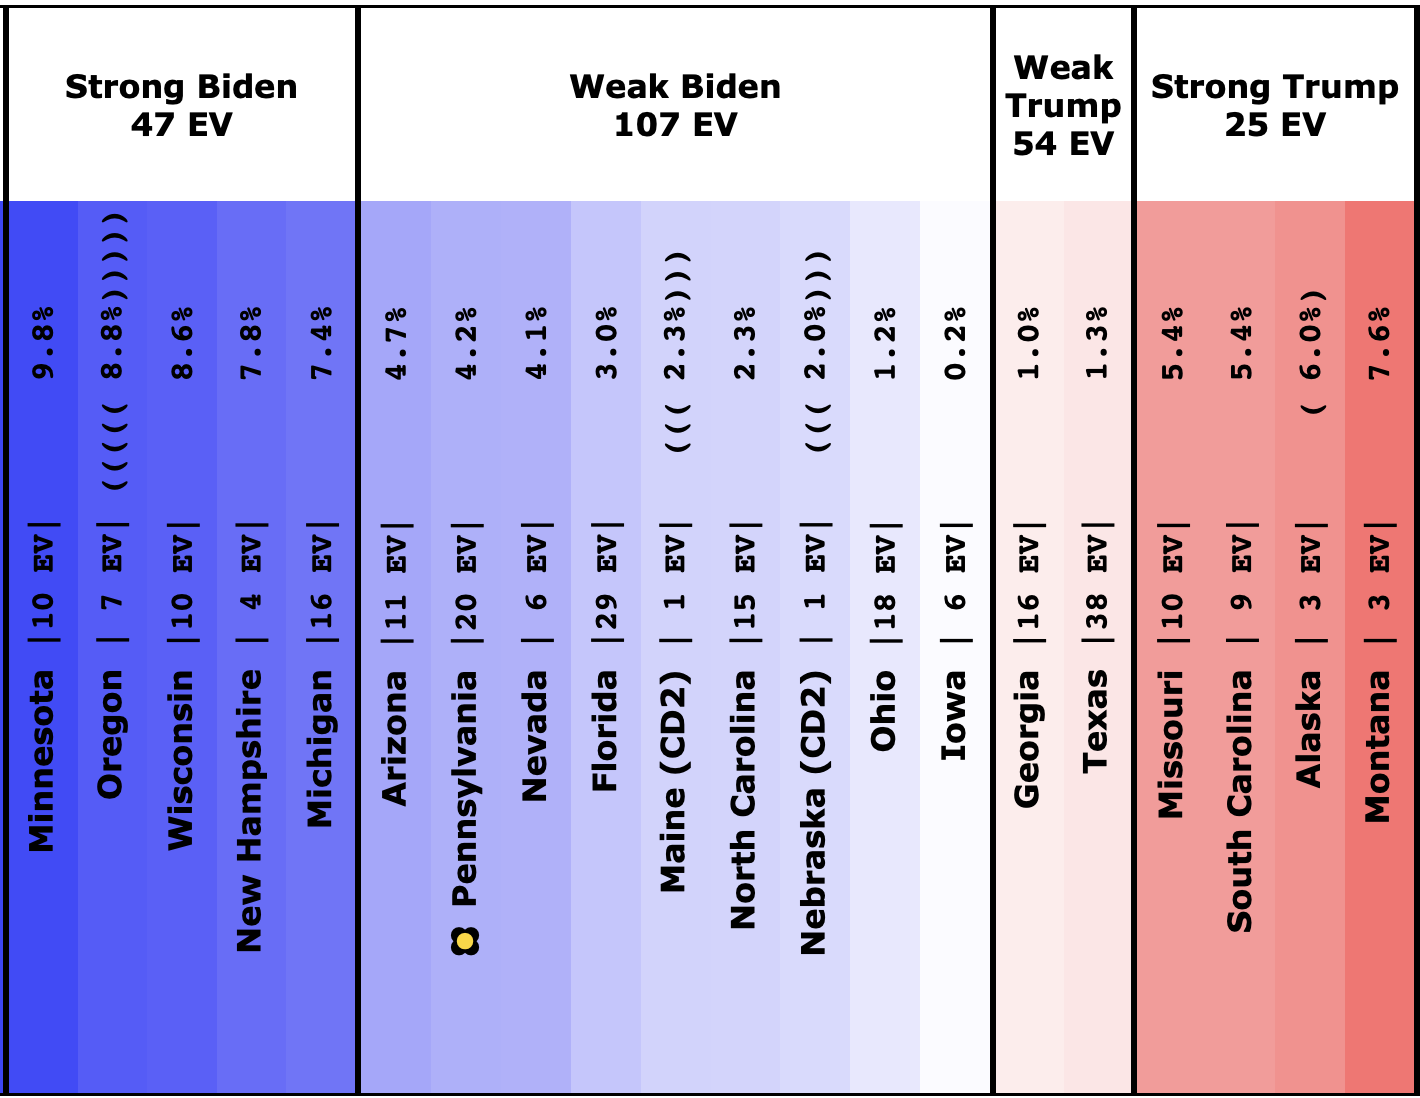
Ohio had moved into "Weak Biden" territory in mid-July. But this week it moves back to "Weak Trump".
Either way, the state is close. This move is from just barely Biden, to just barely Trump. It is really too close to call.
Trump's lead in the average is currently 0.2%. Given the historical results on Election Graphs averages from 2008 to 2016, that translates into a 56.1% chance of a Trump win and a 43.9% chance of a Biden win.
But the categorization view of things doesn't care about that. It just shows Ohio's 18 electoral votes moving from the Biden column to the Trump column, which means Biden's expected margin drops 36 EV from 182 to 146.
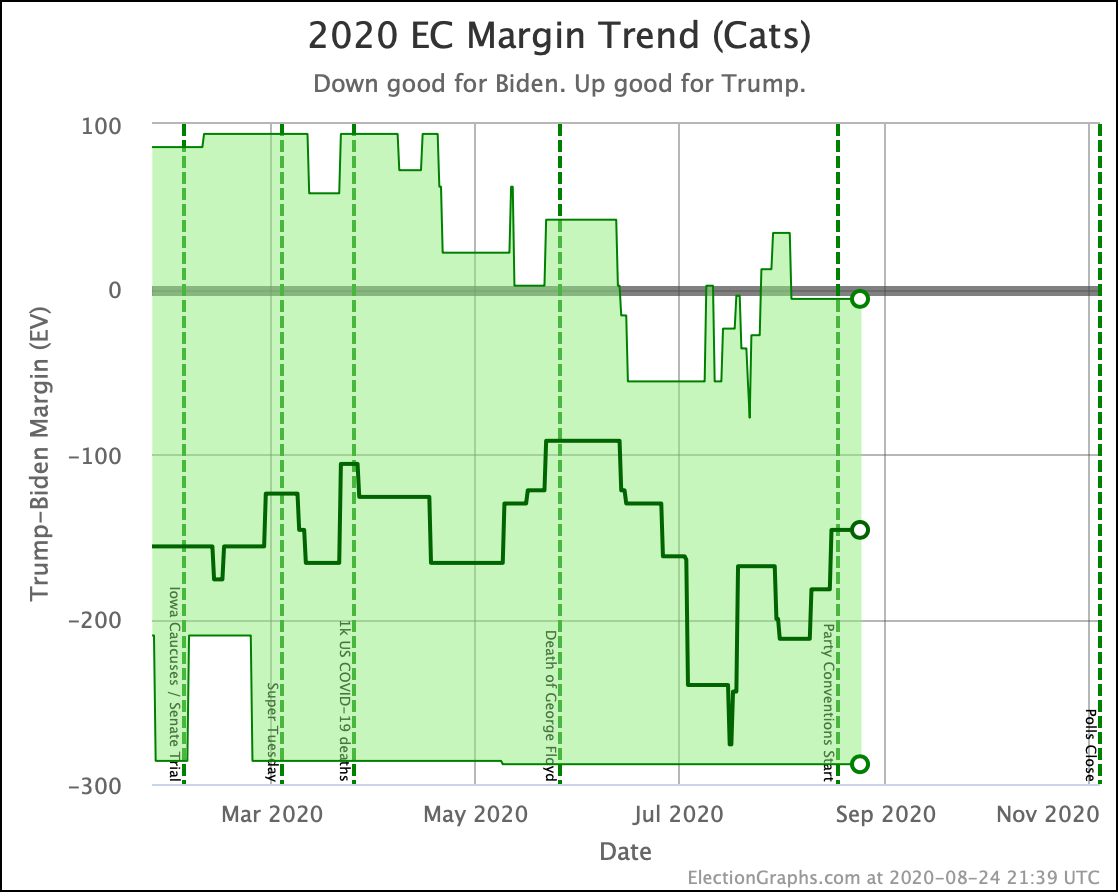
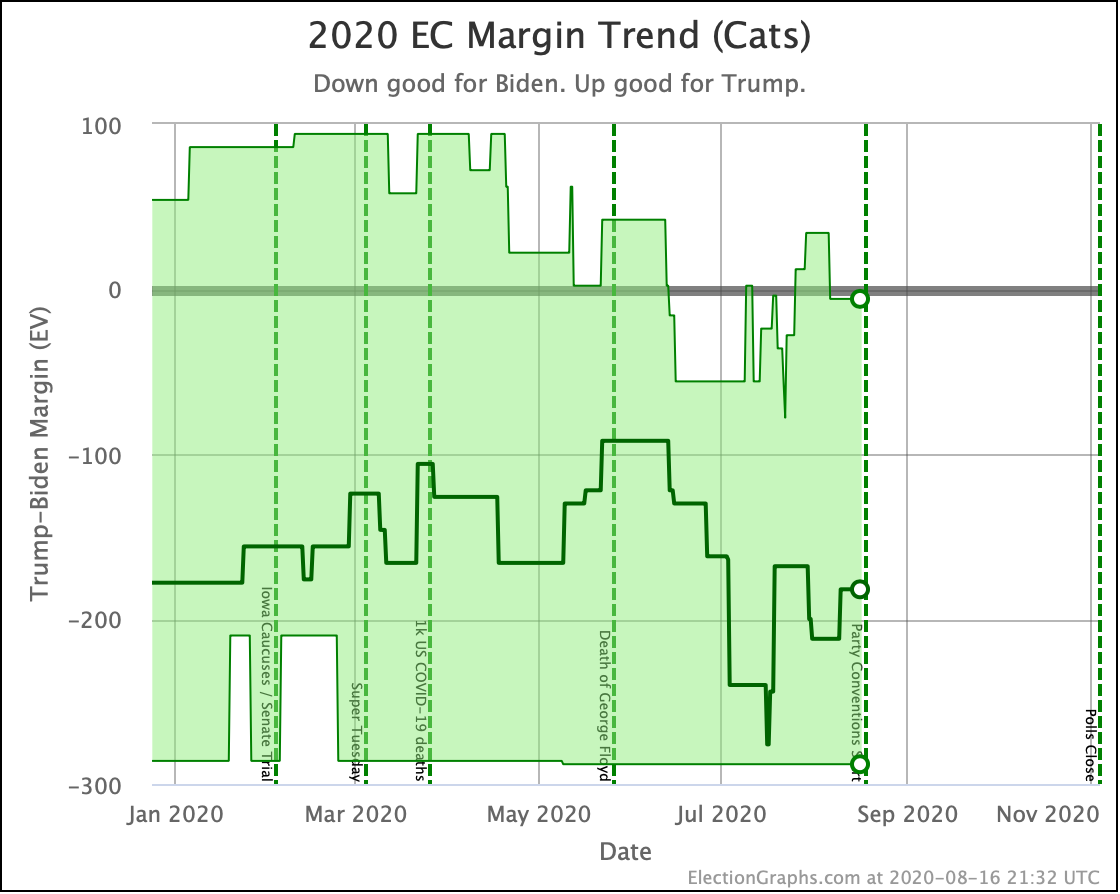
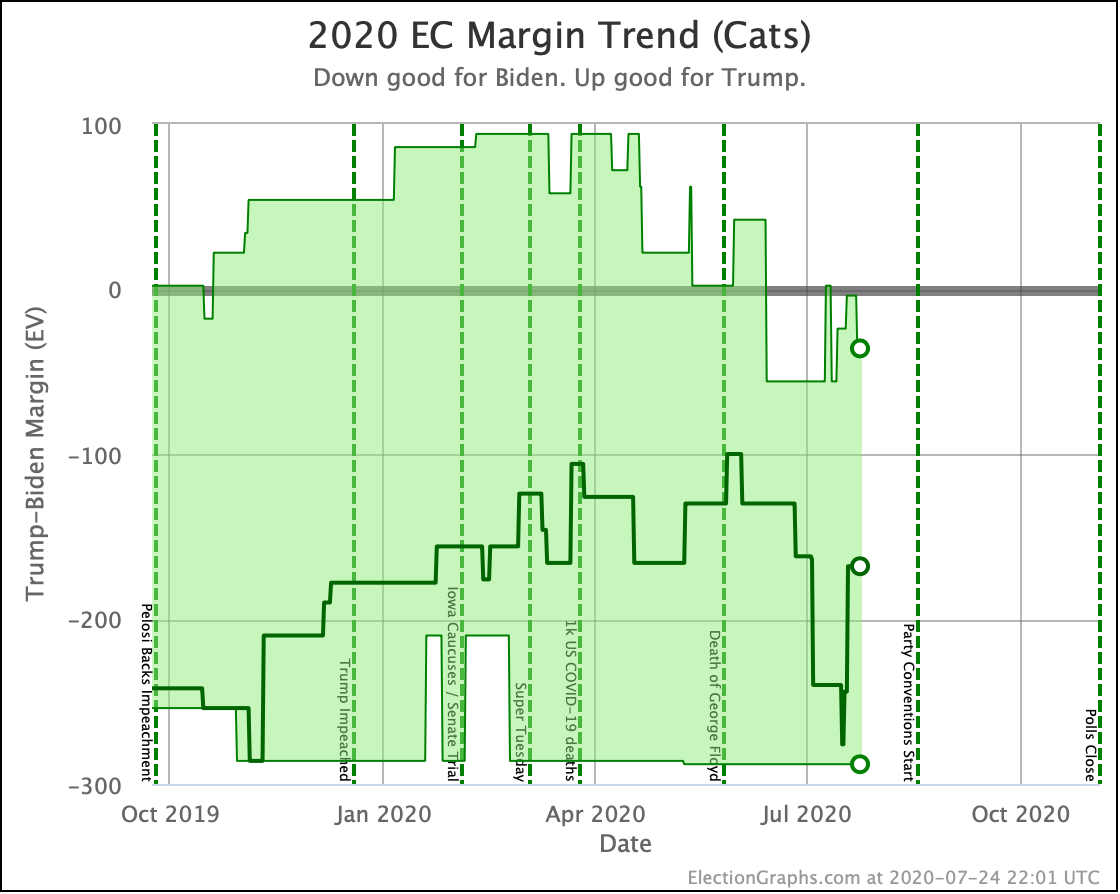
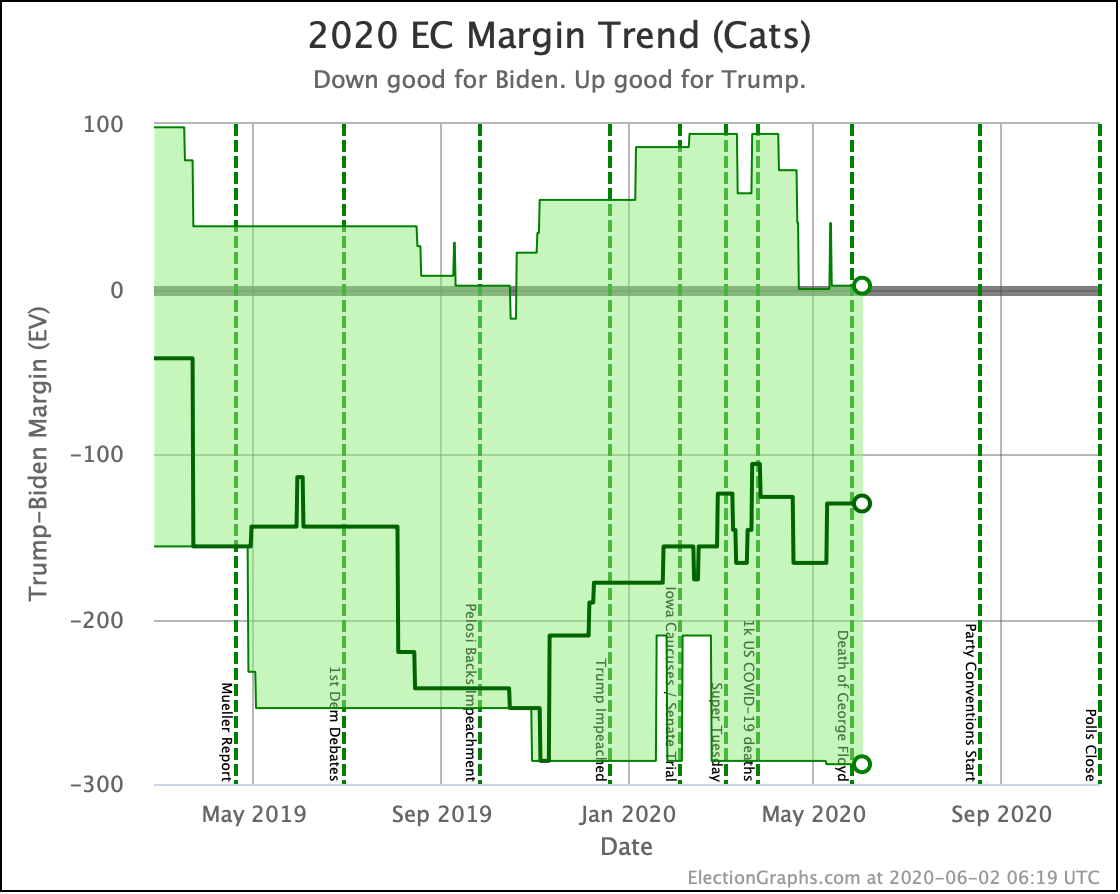
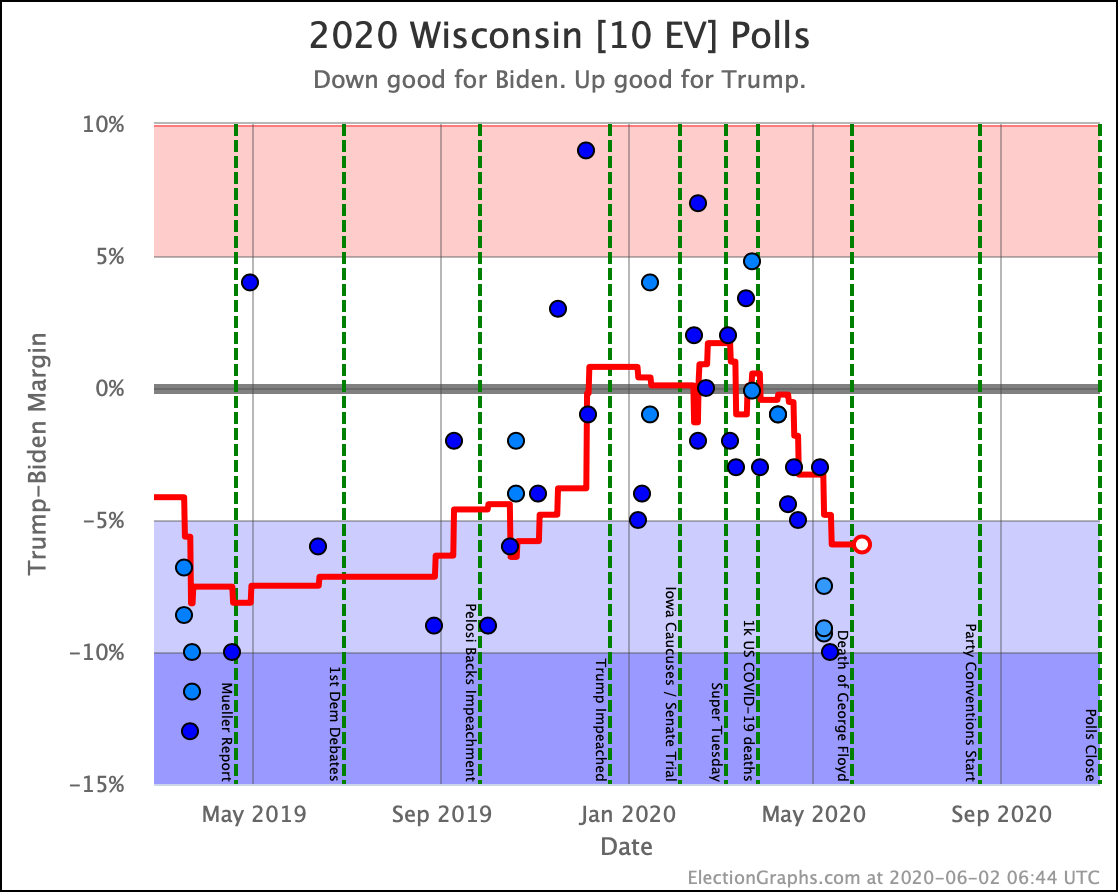
The change in the expected case can be seen above. After a peak for Biden in July, the expected case is back in the range it has usually been in over the last 6 months.
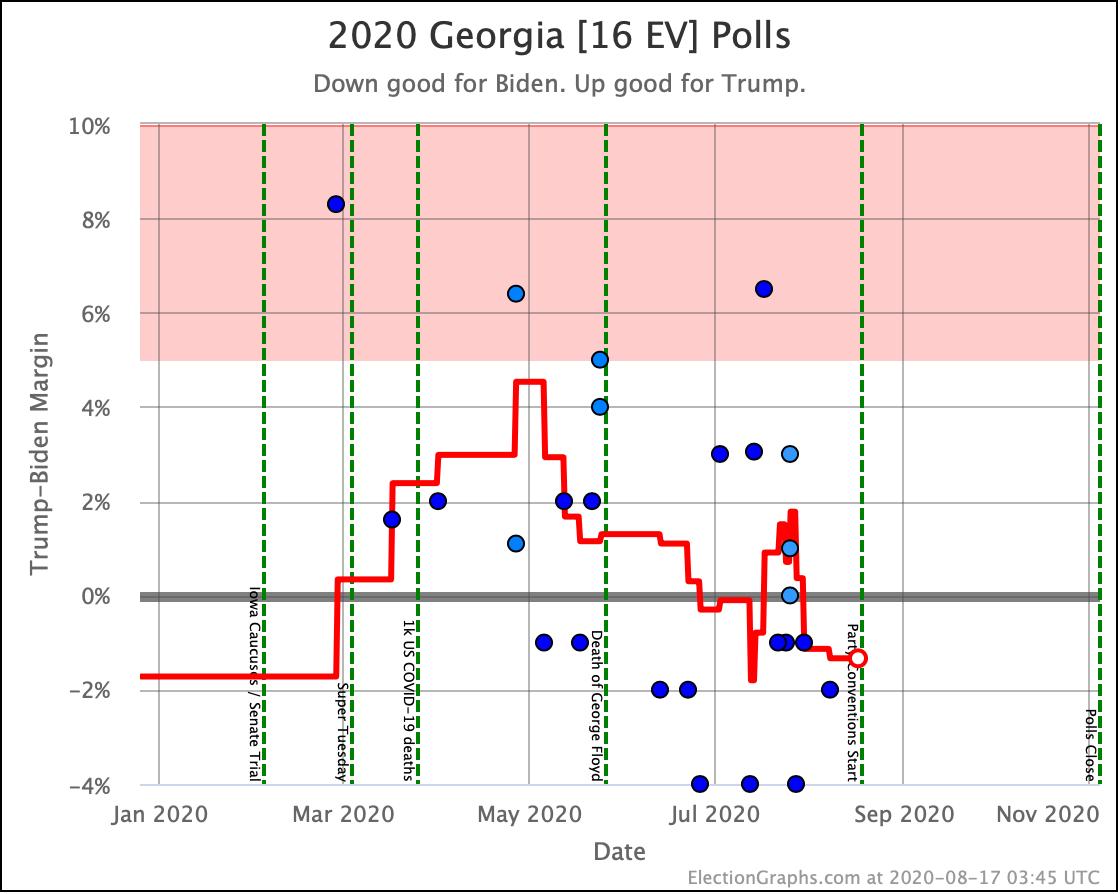
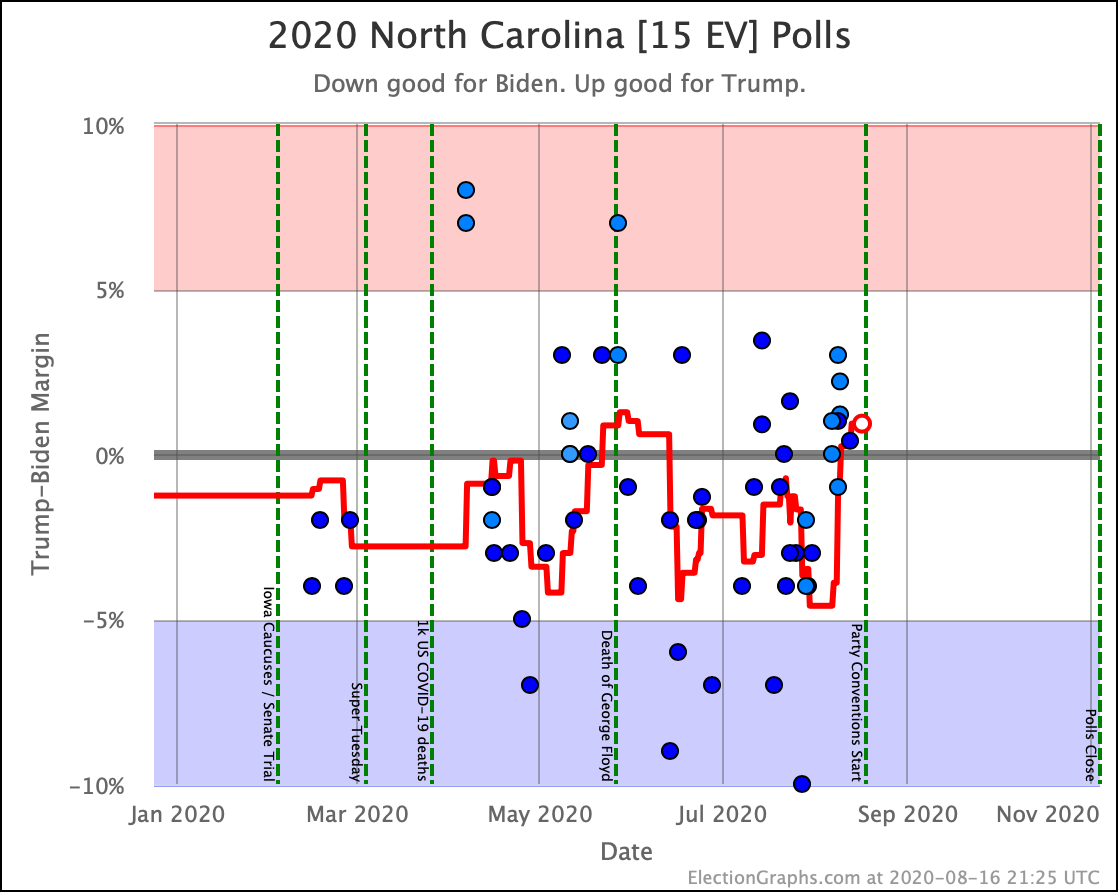
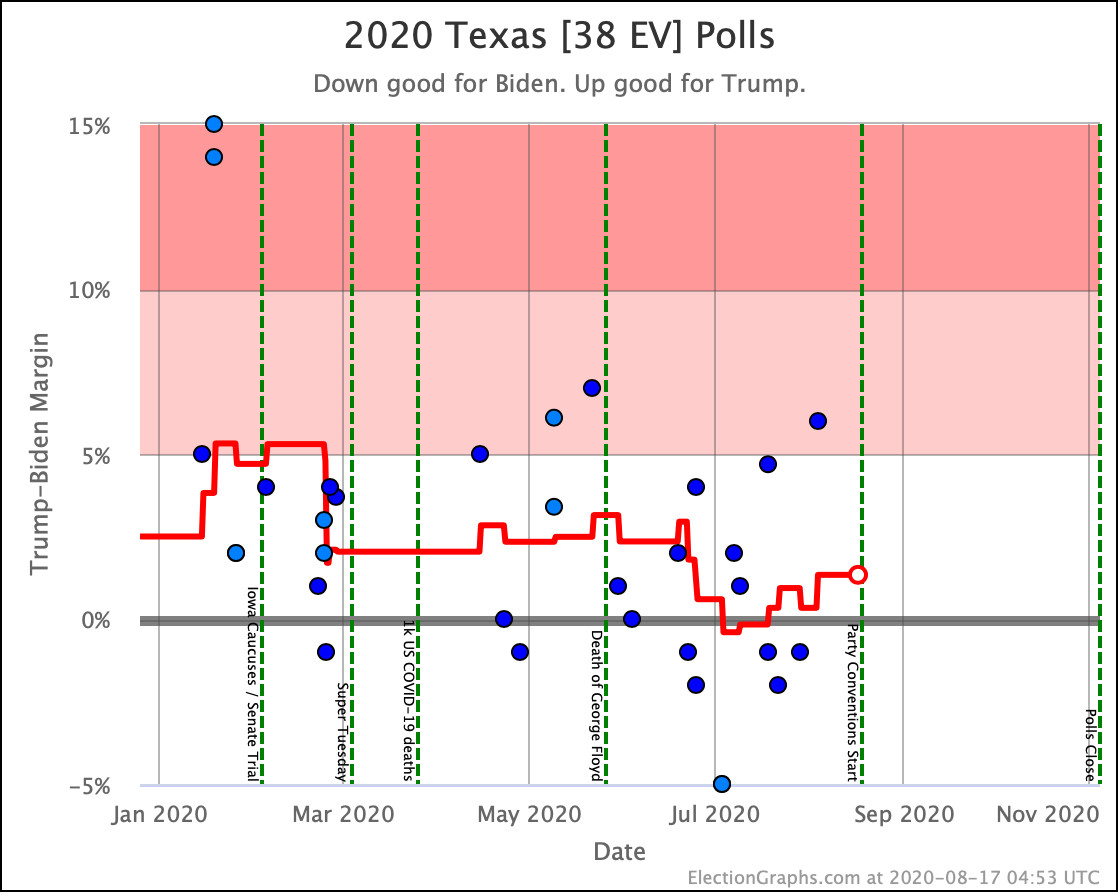
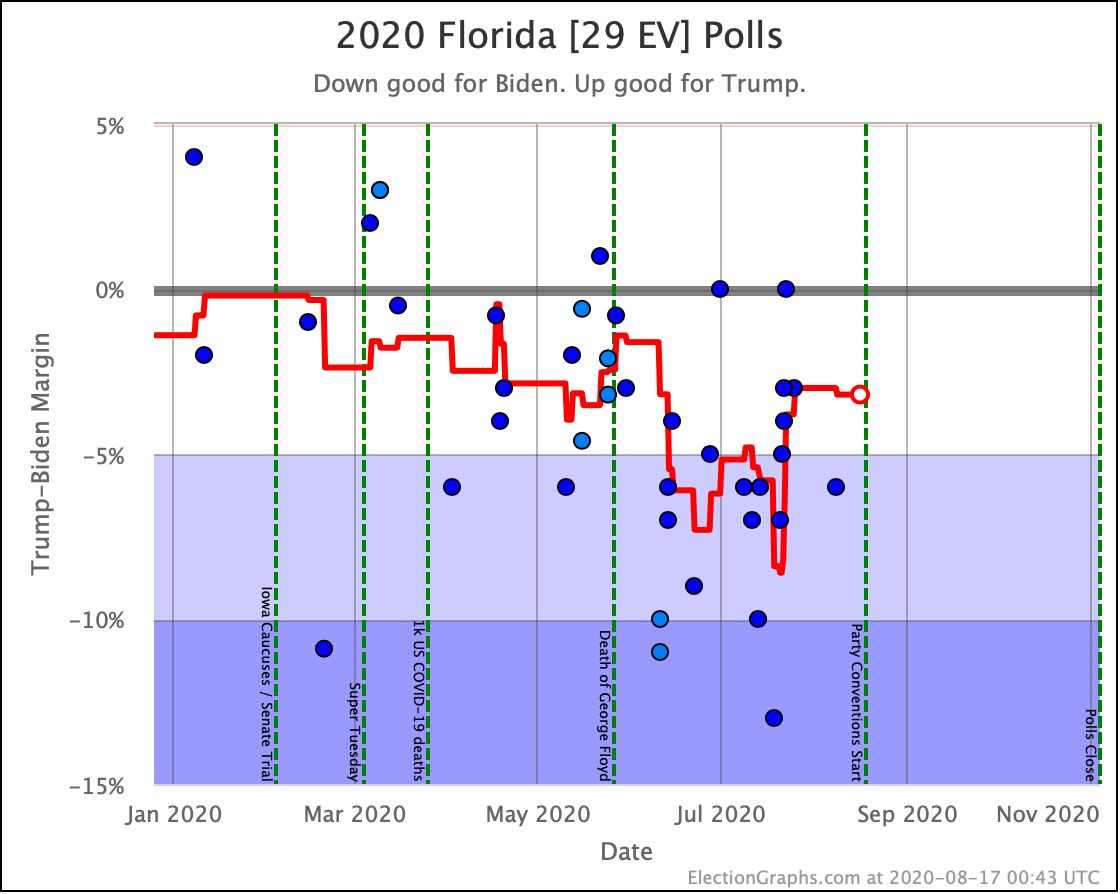
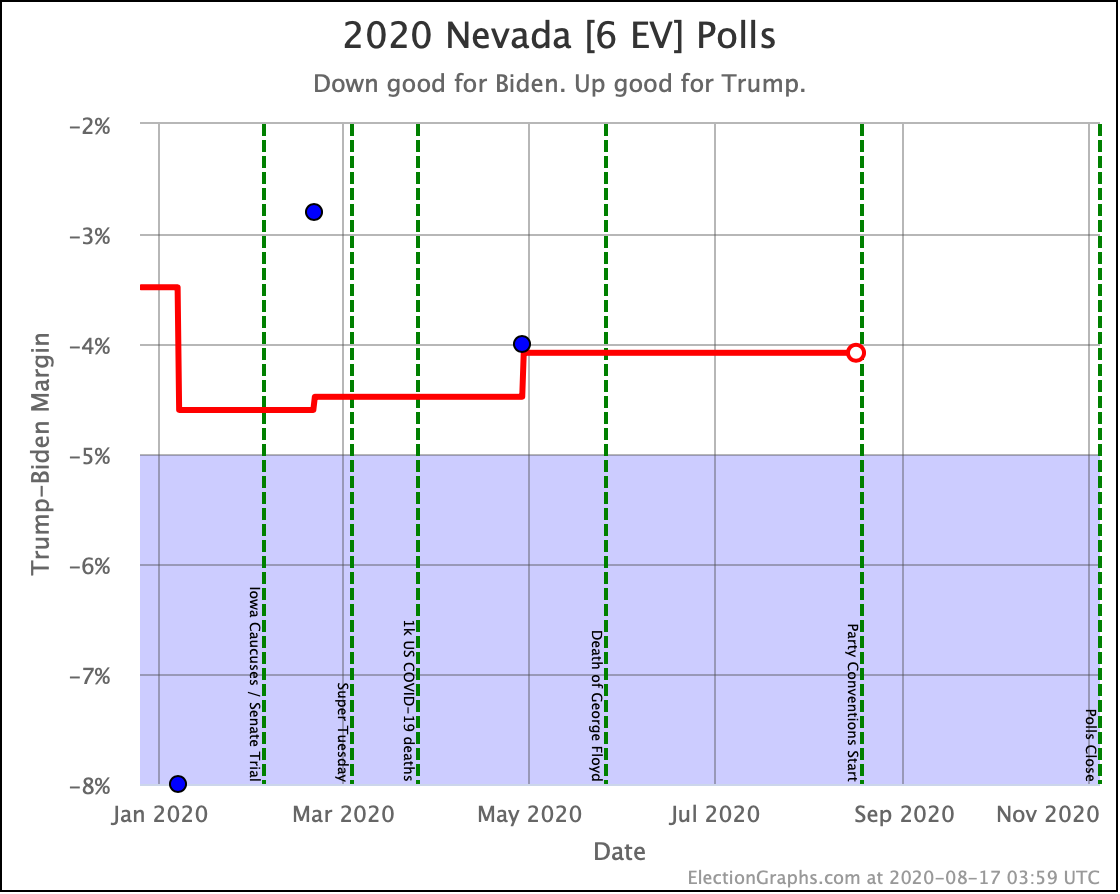
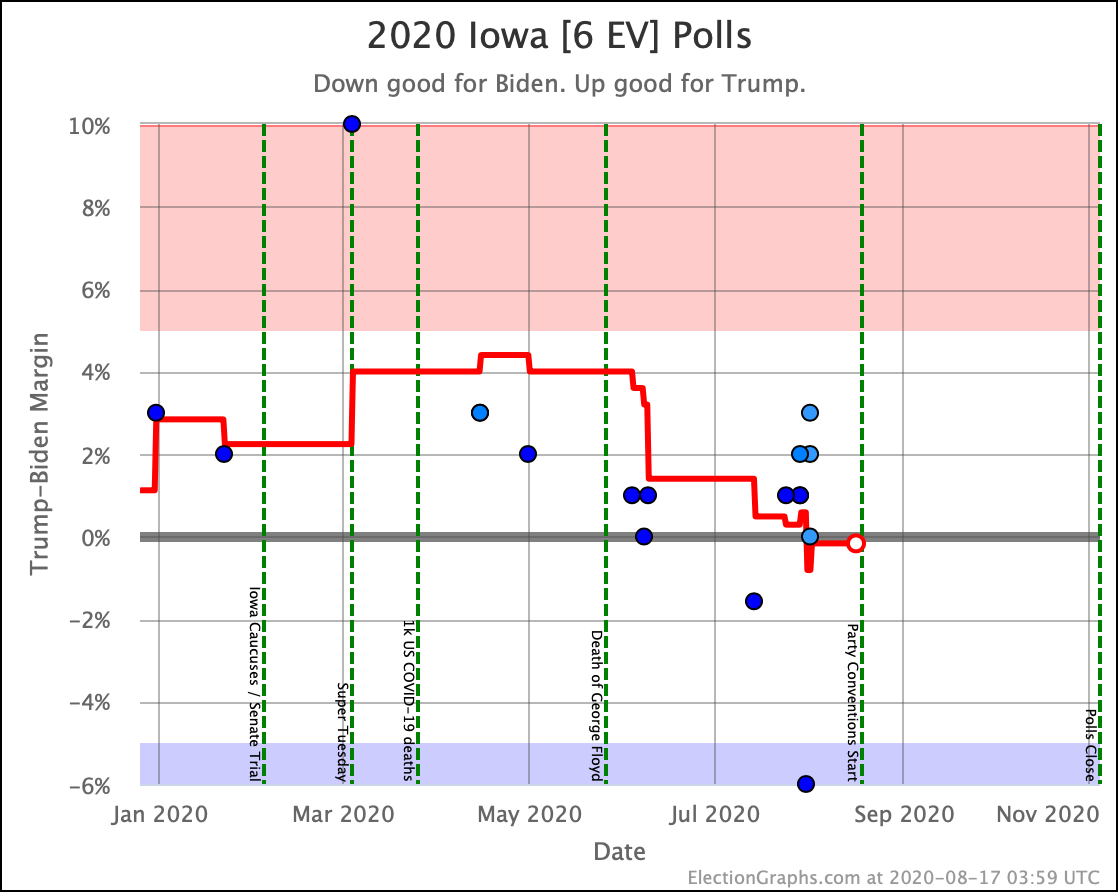
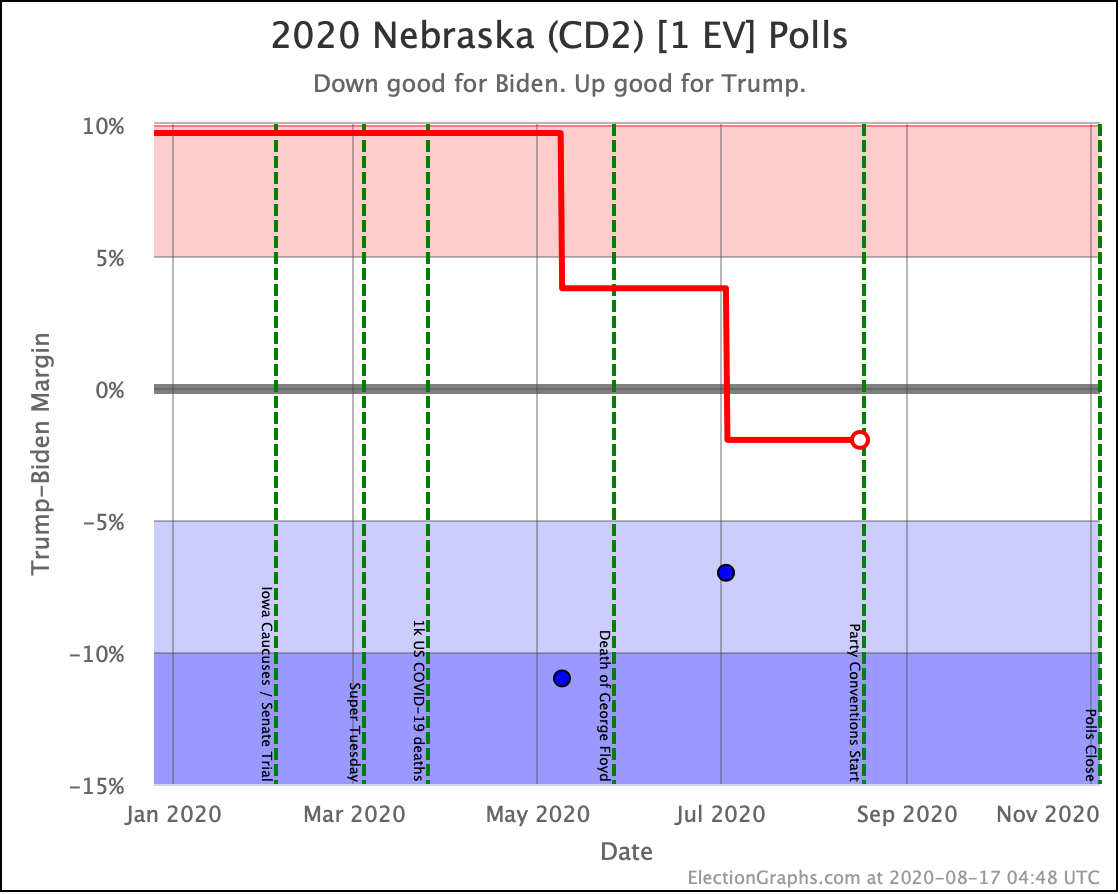
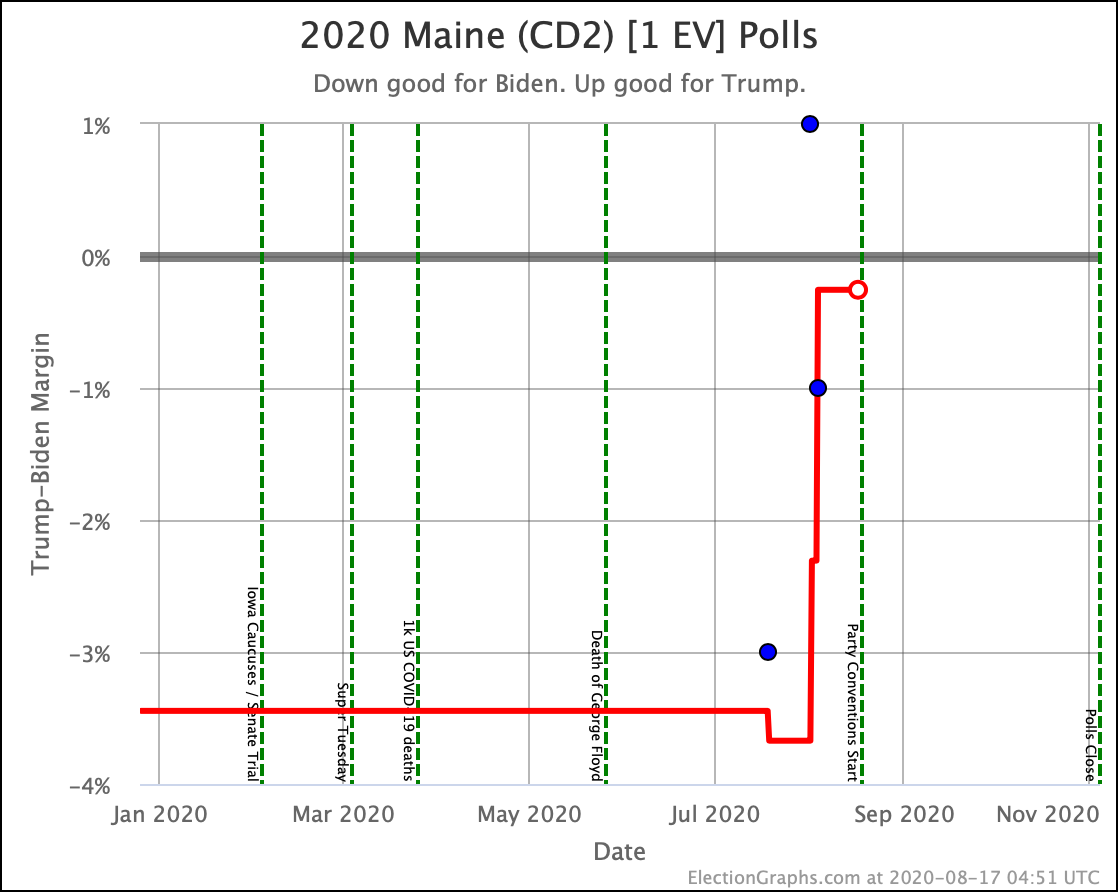
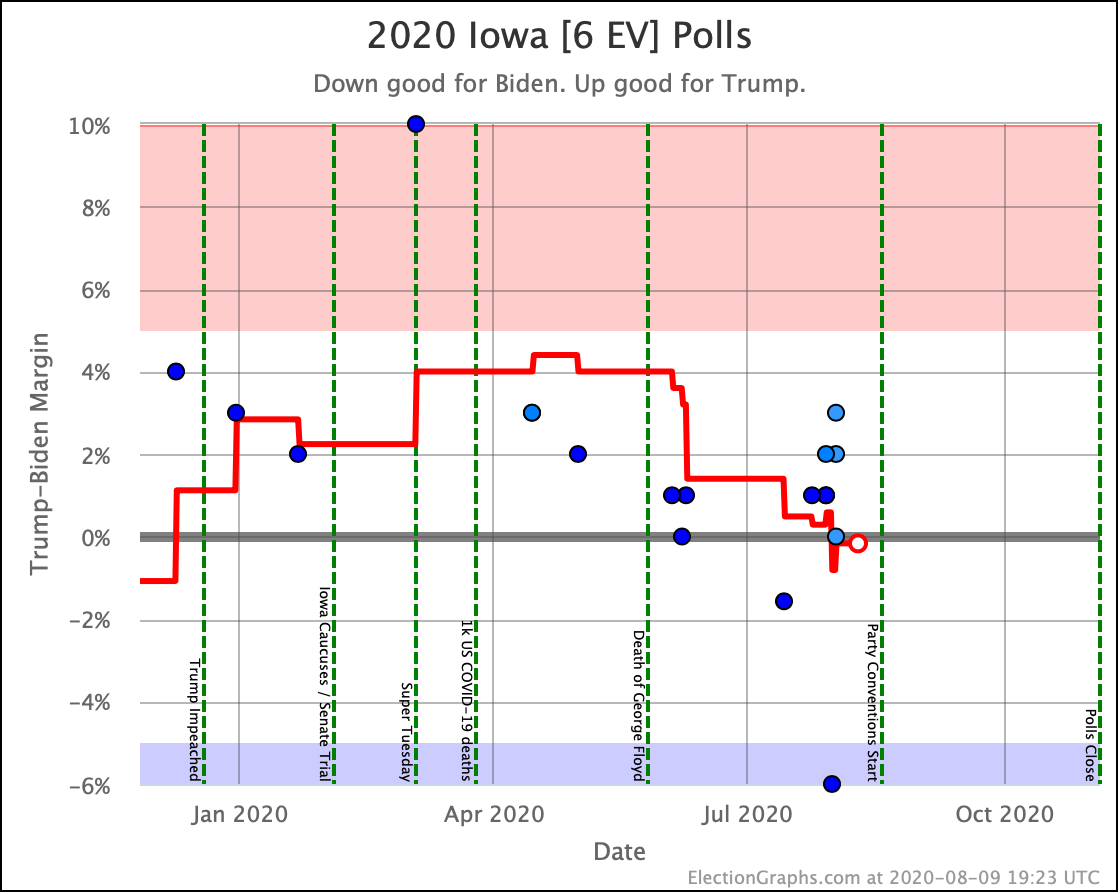
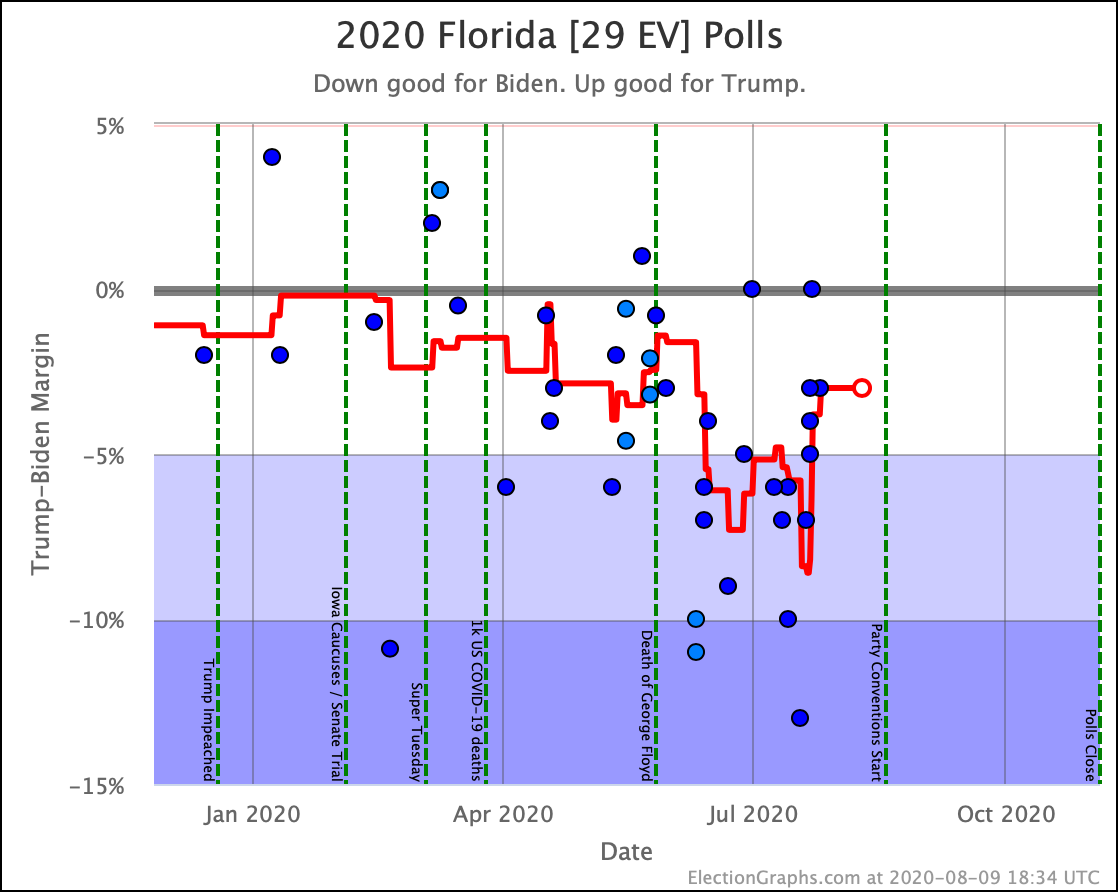
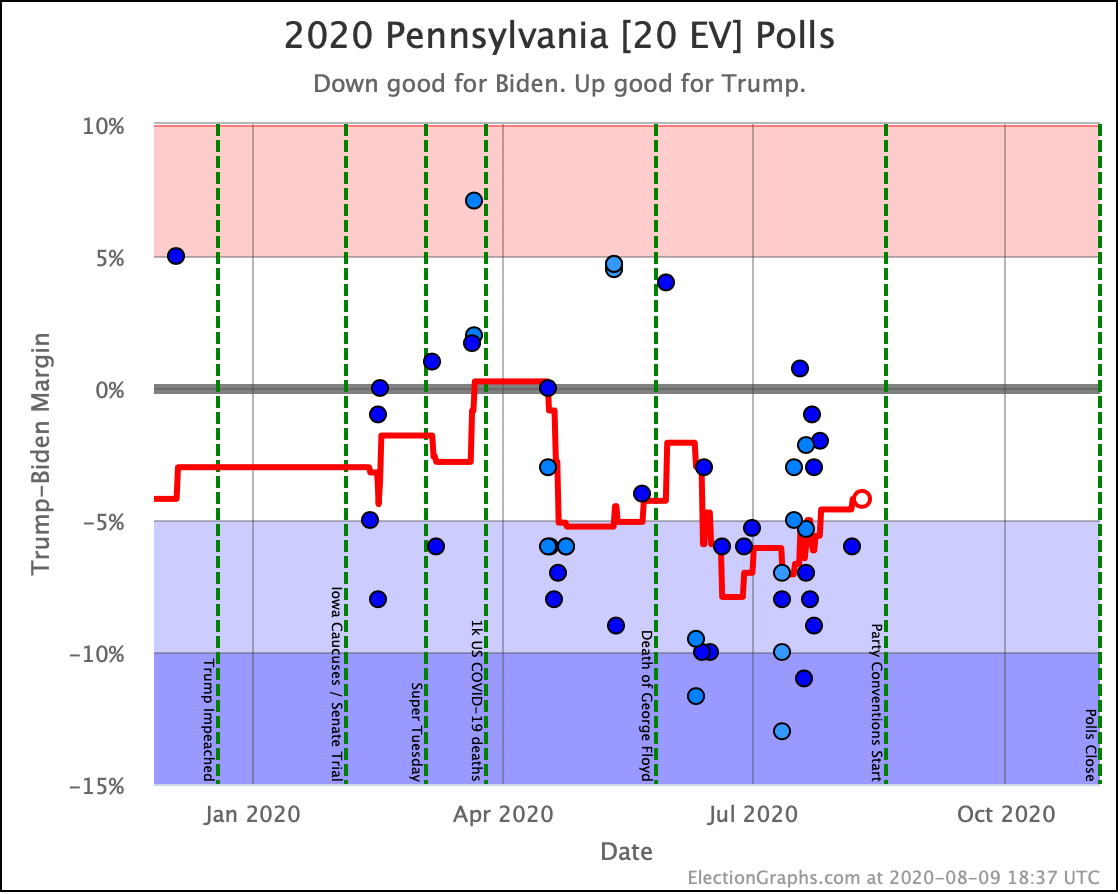
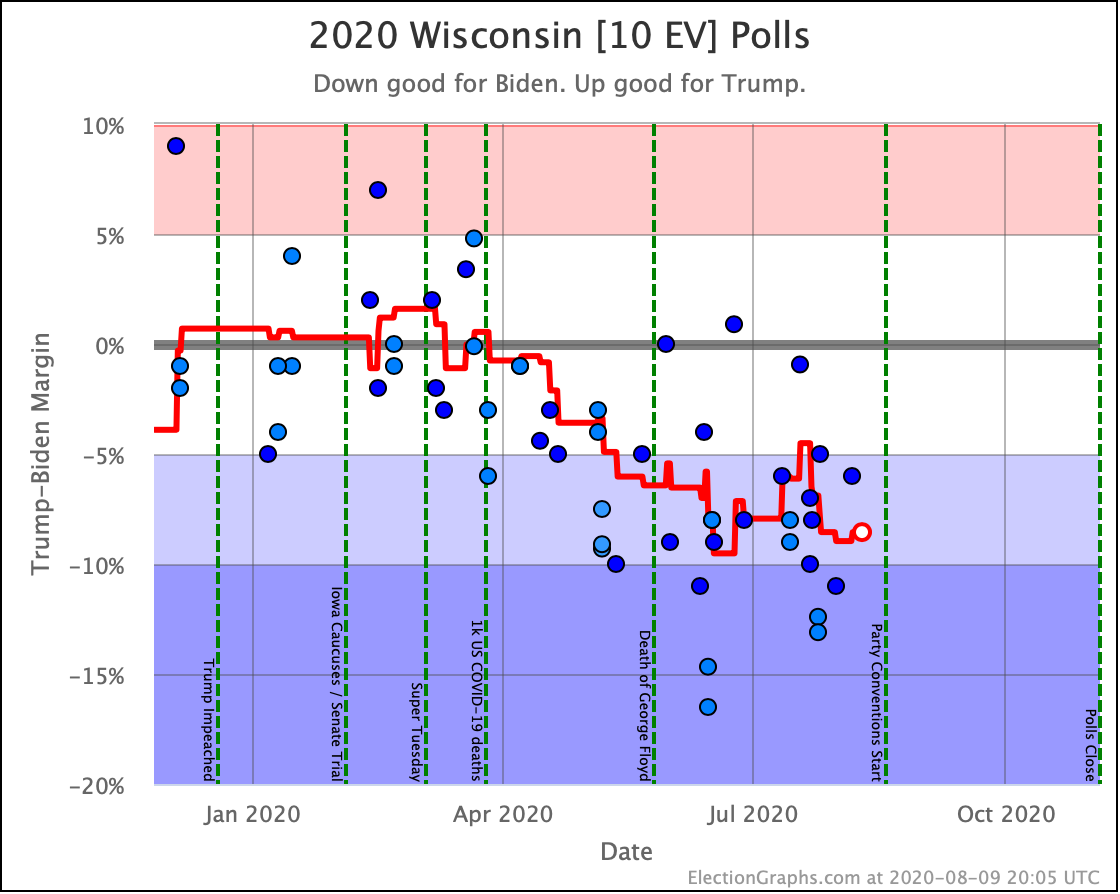
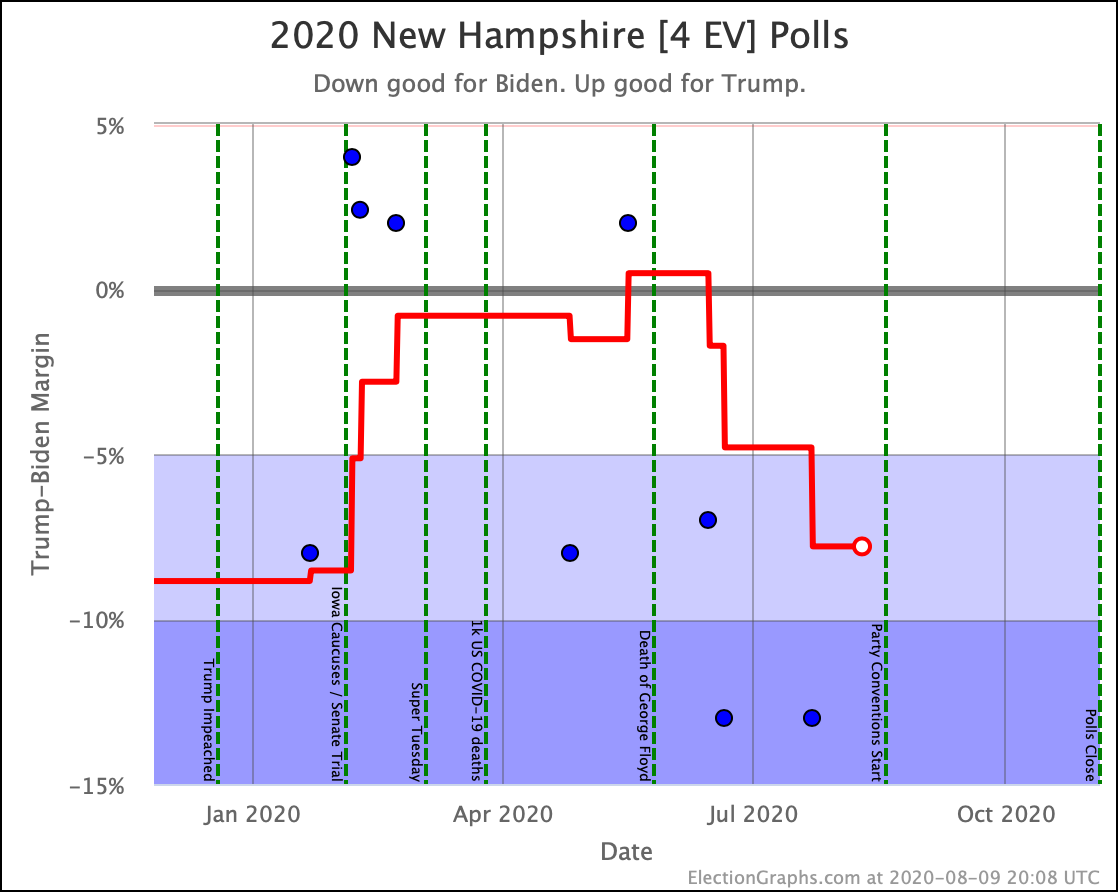
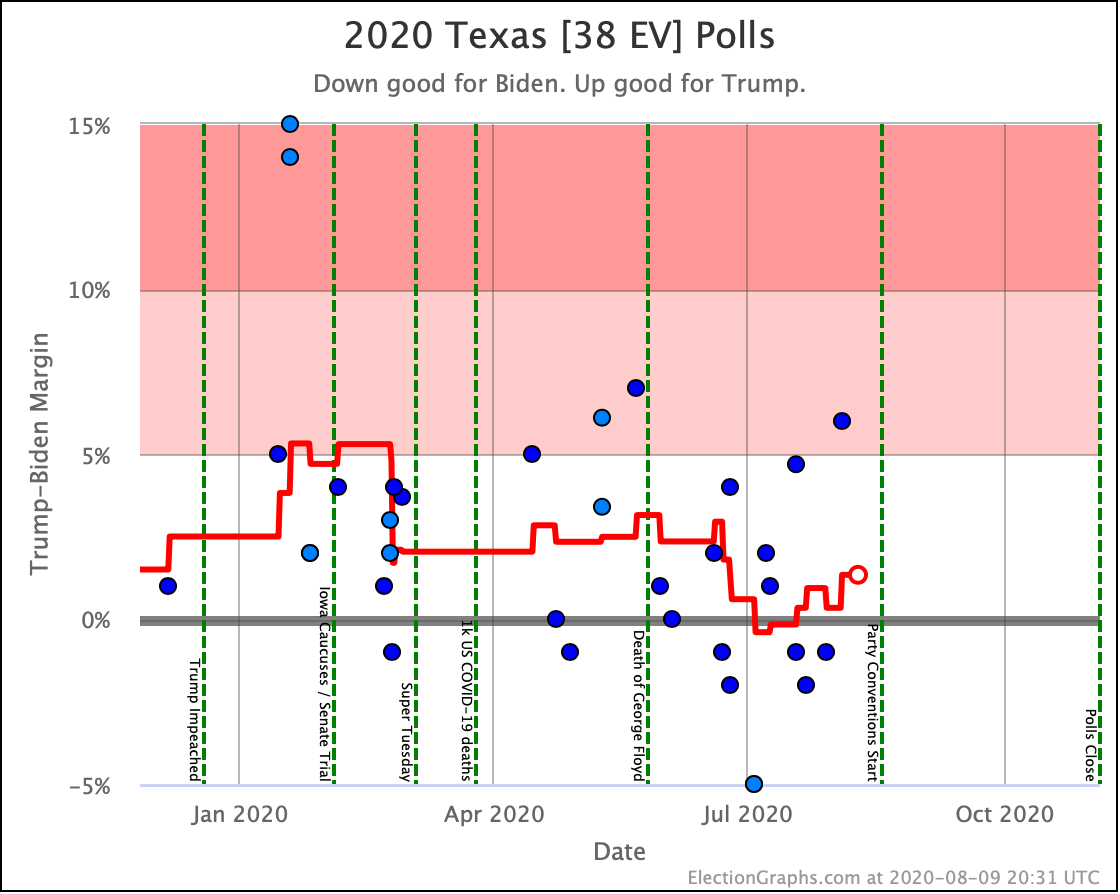
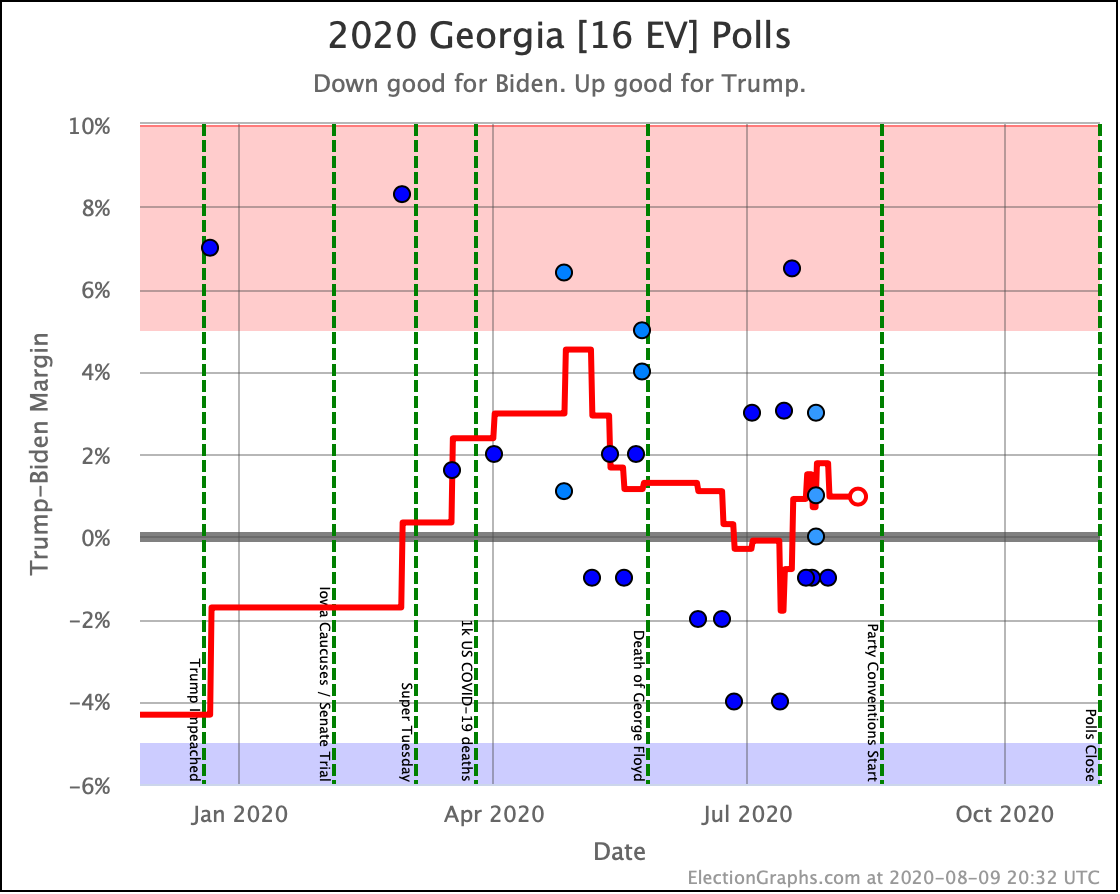
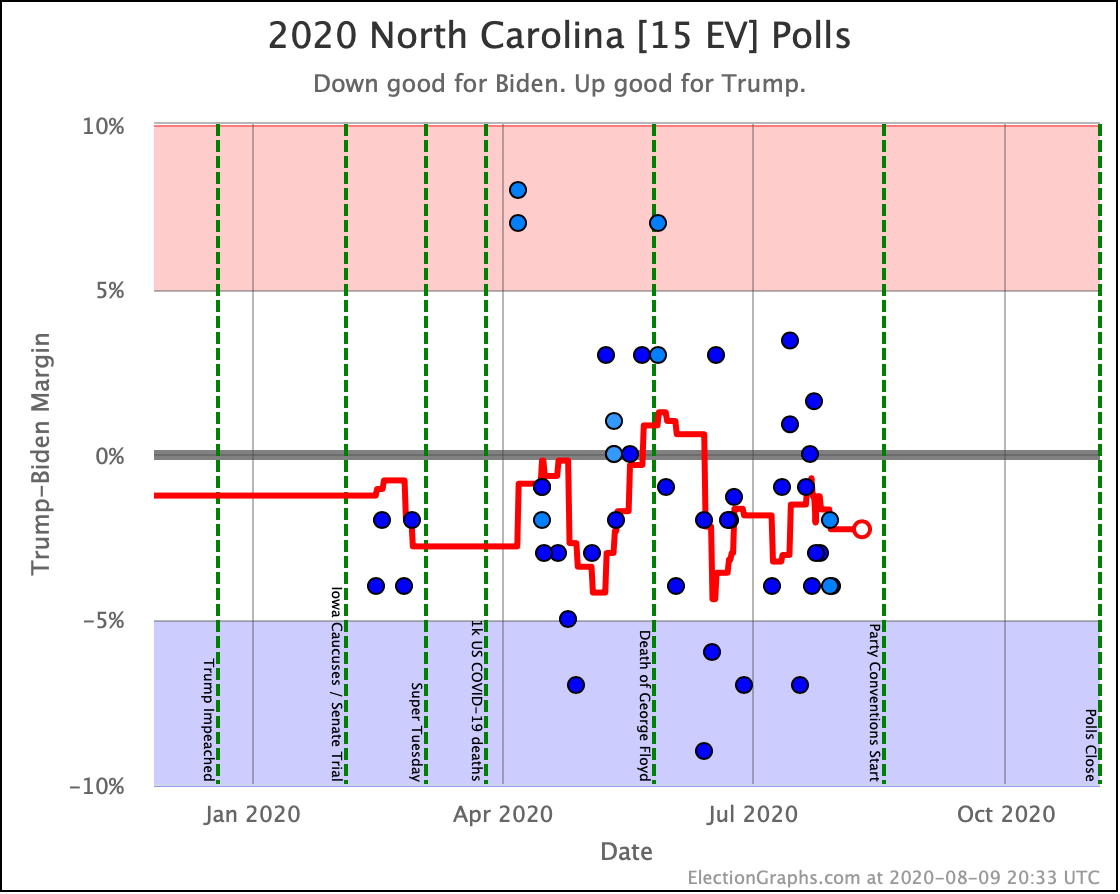
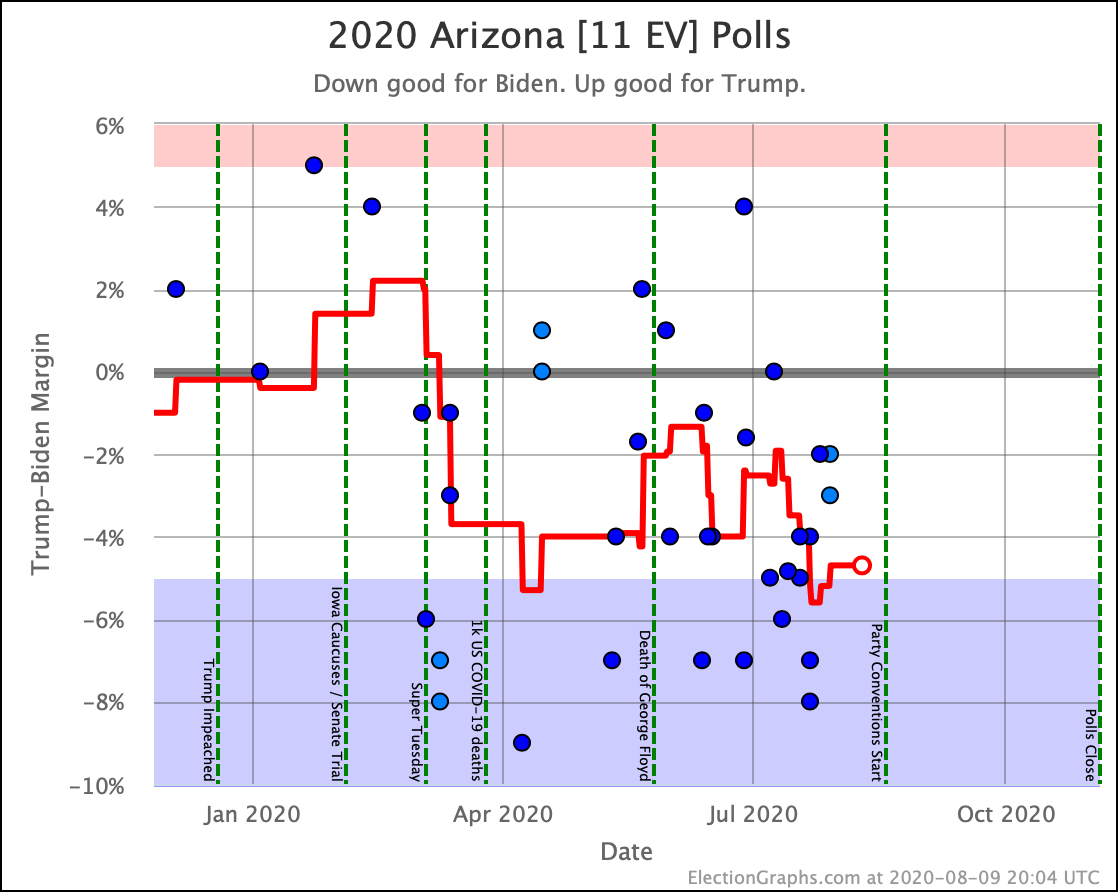
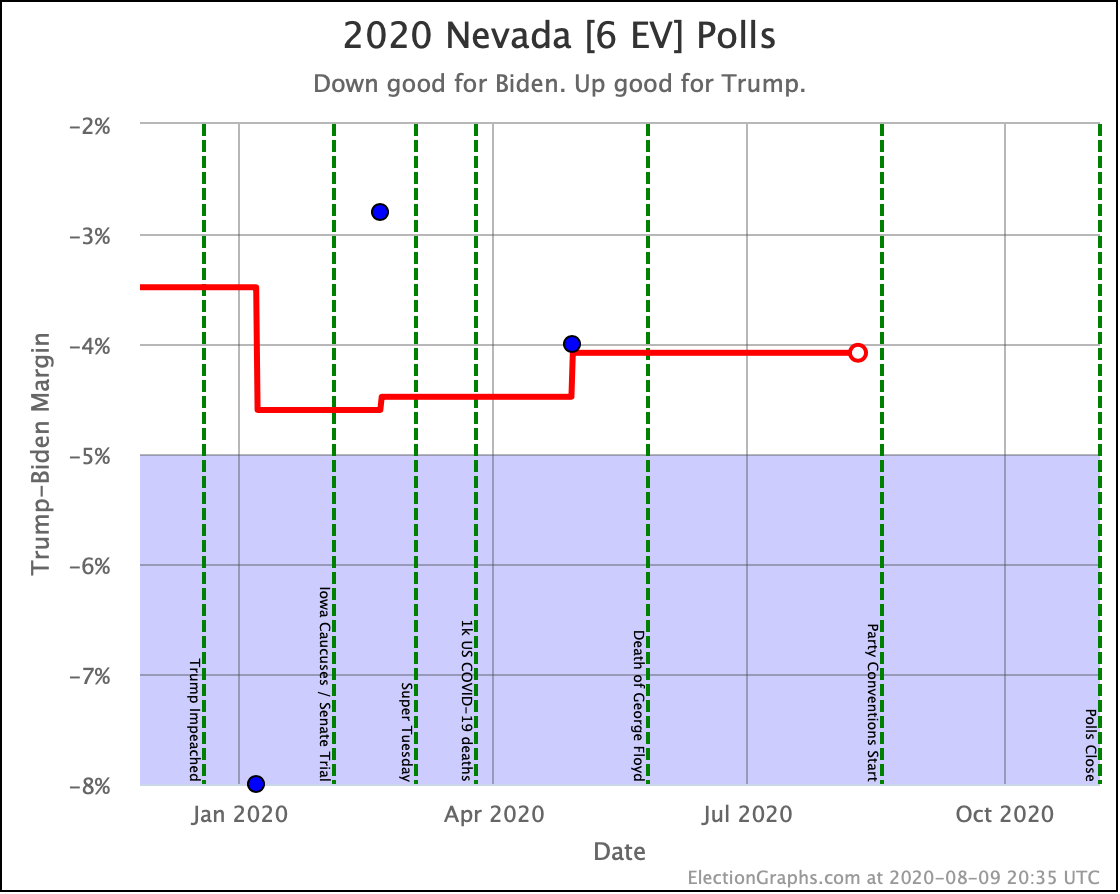
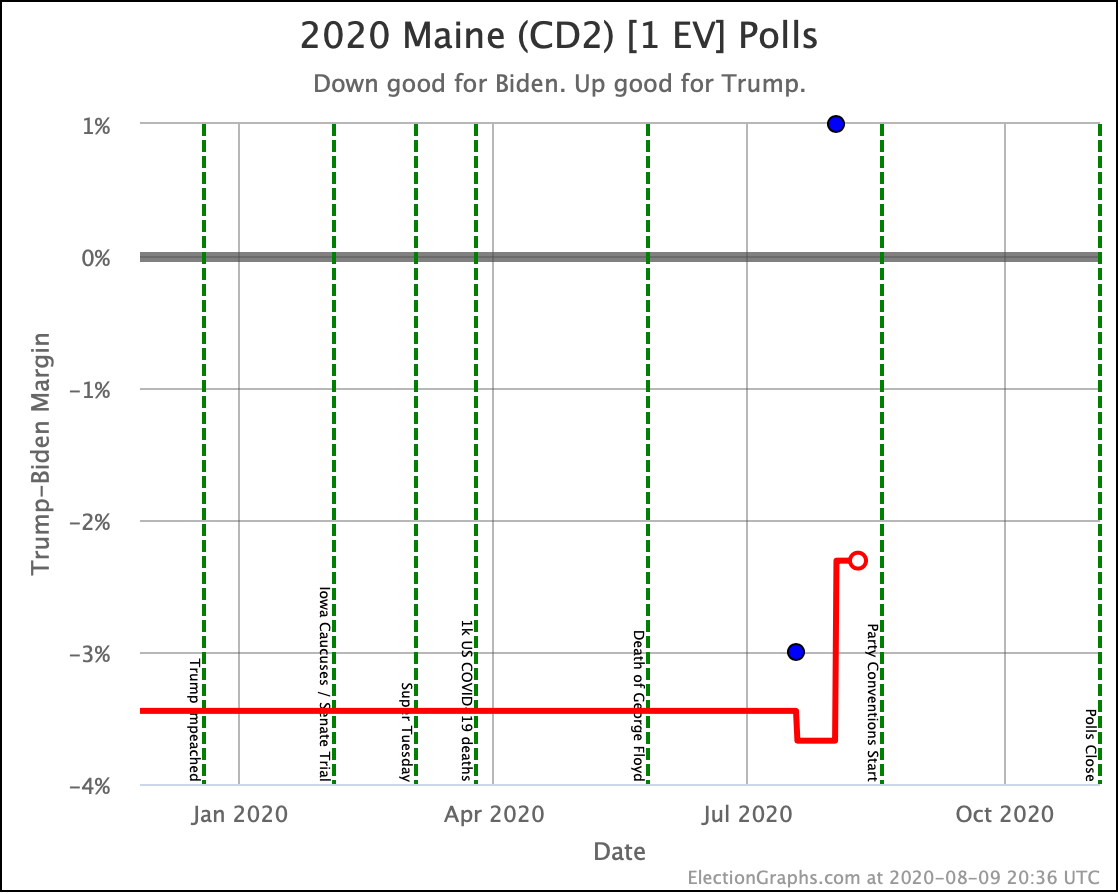
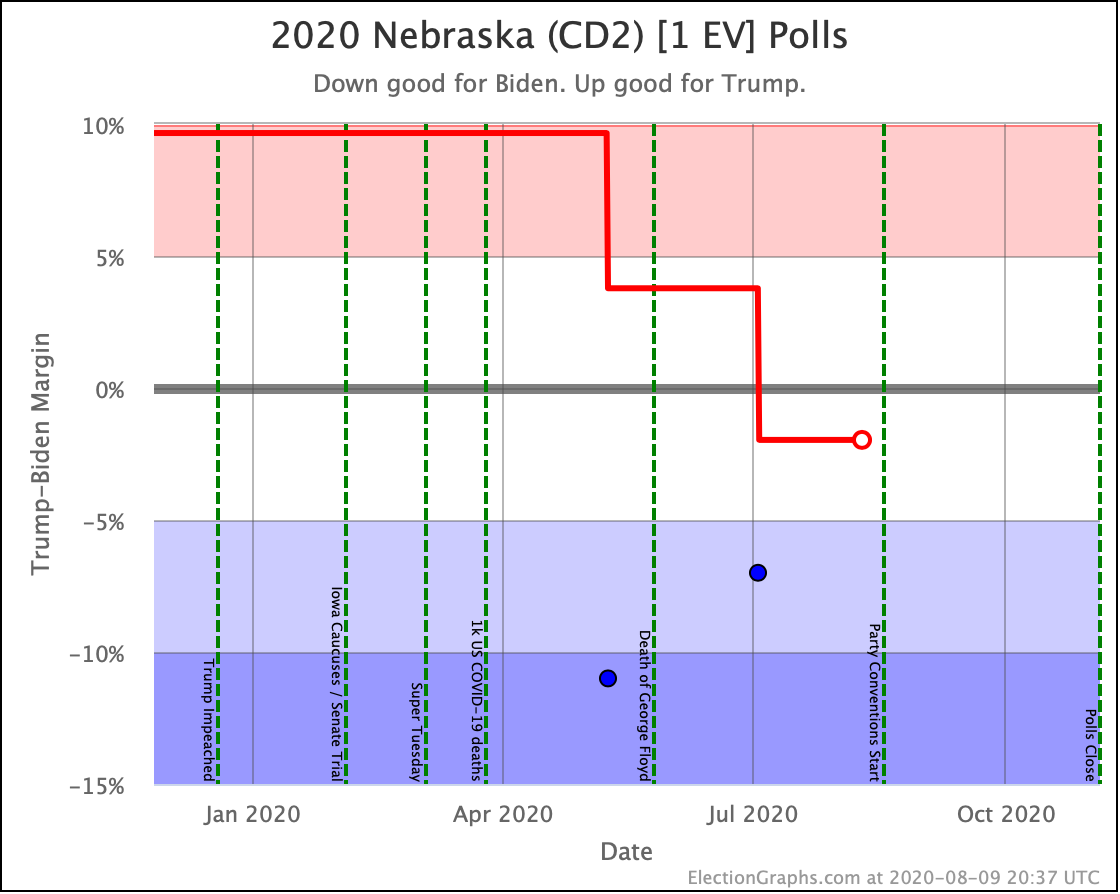
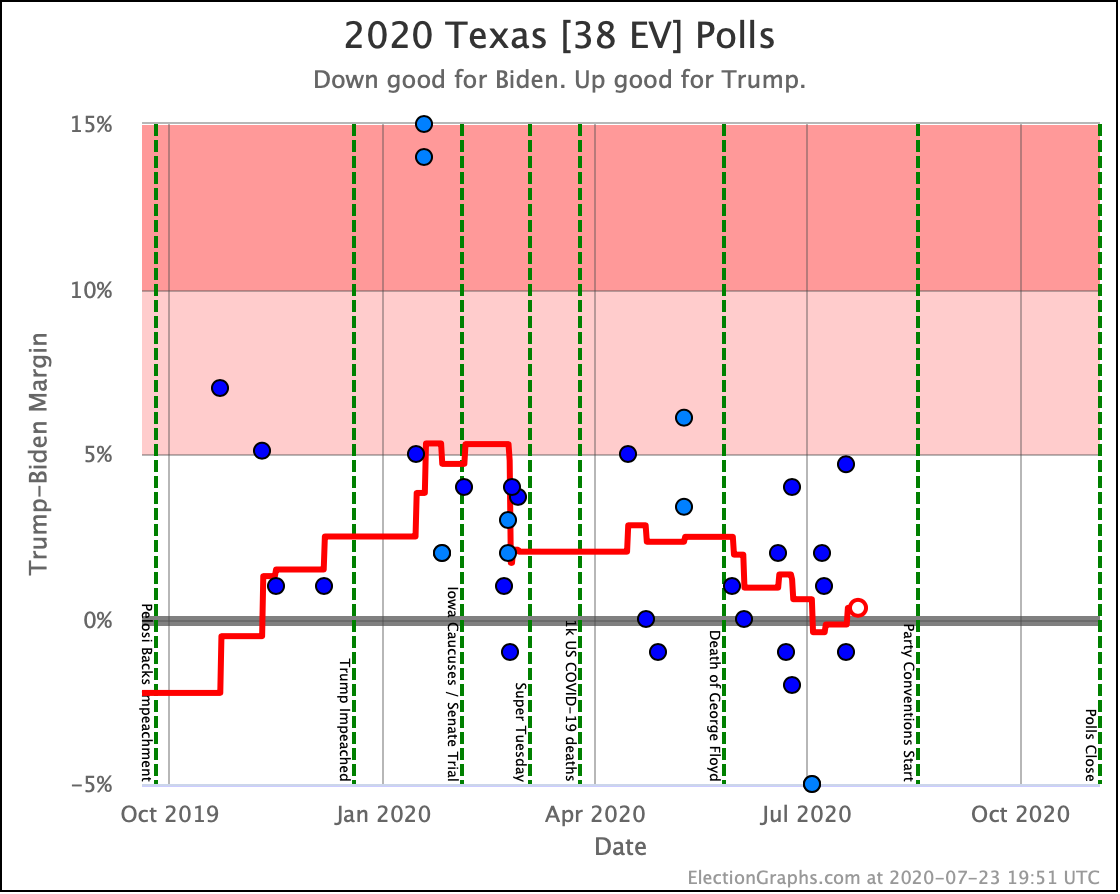
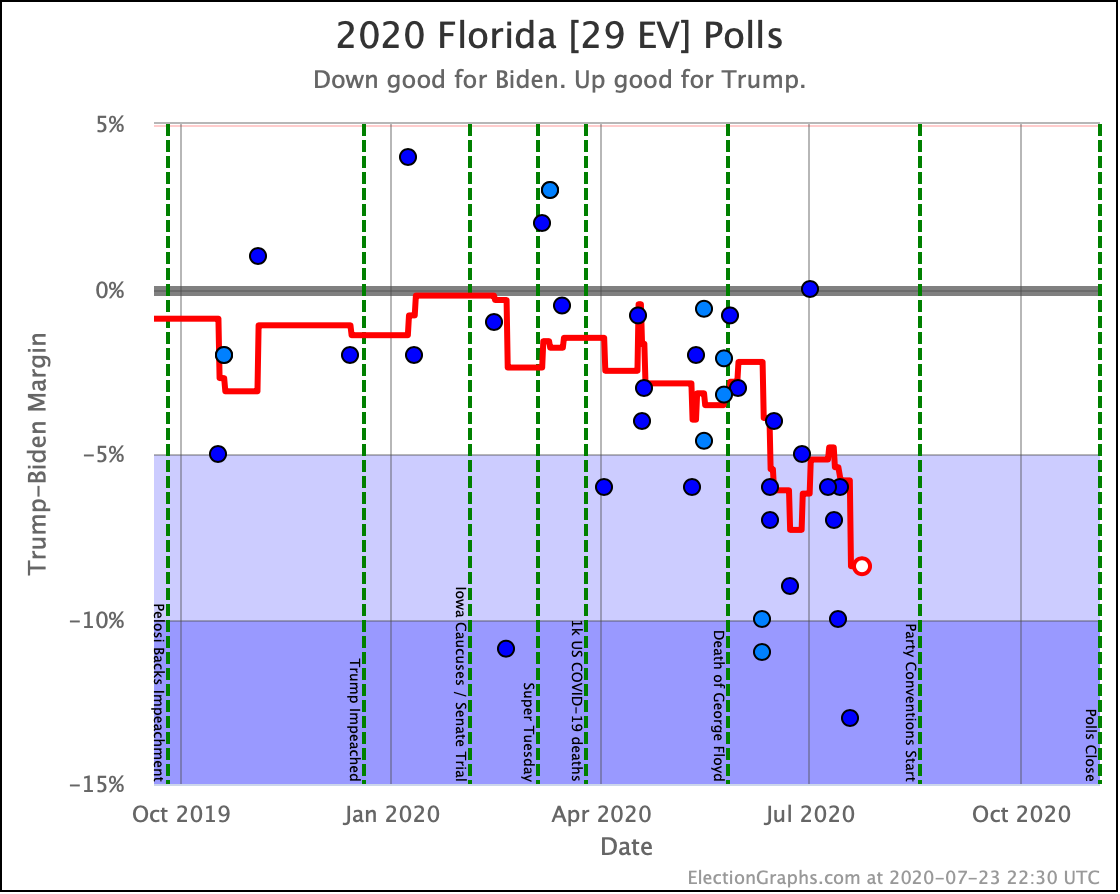
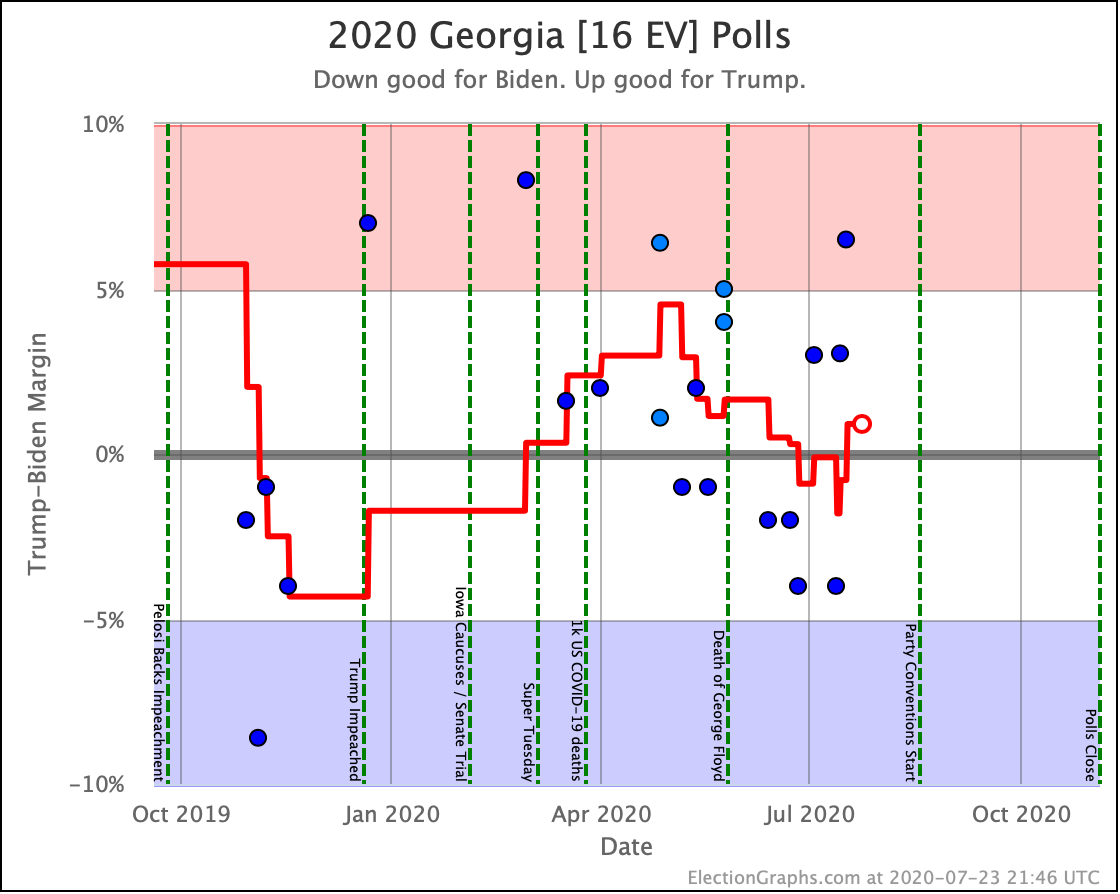
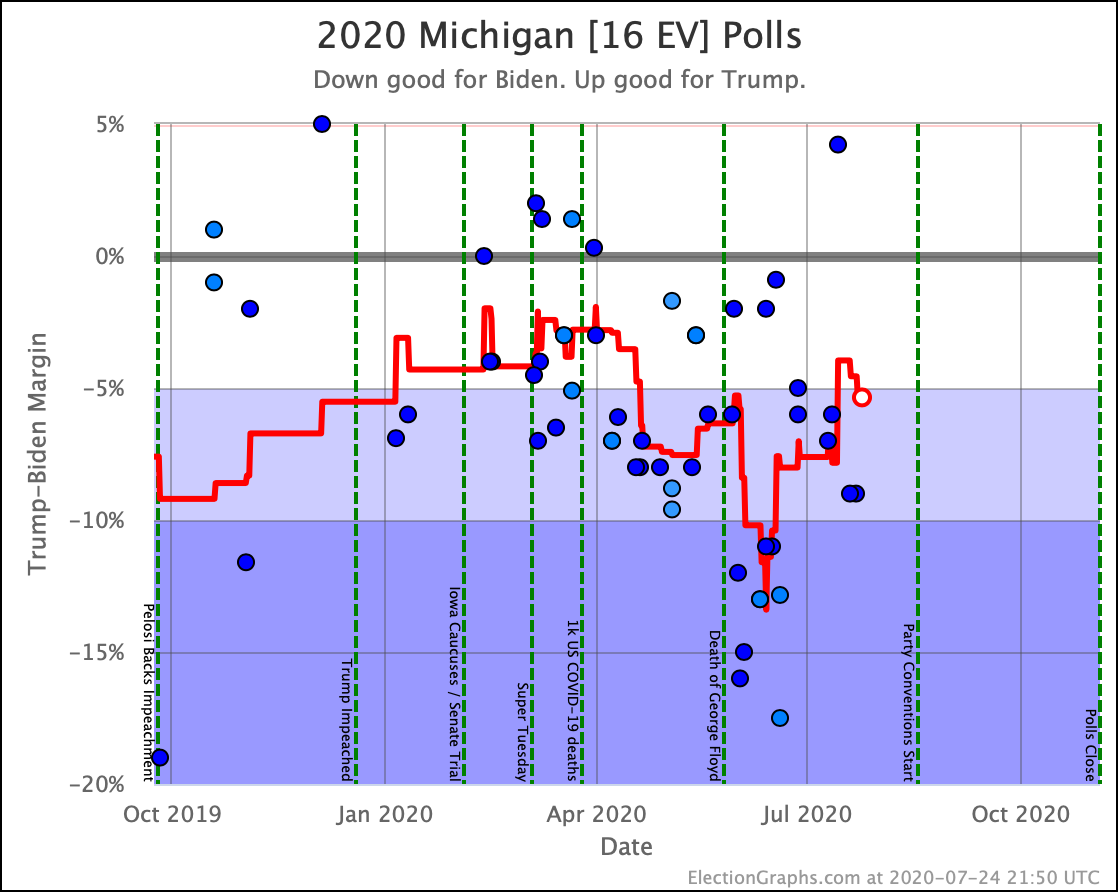
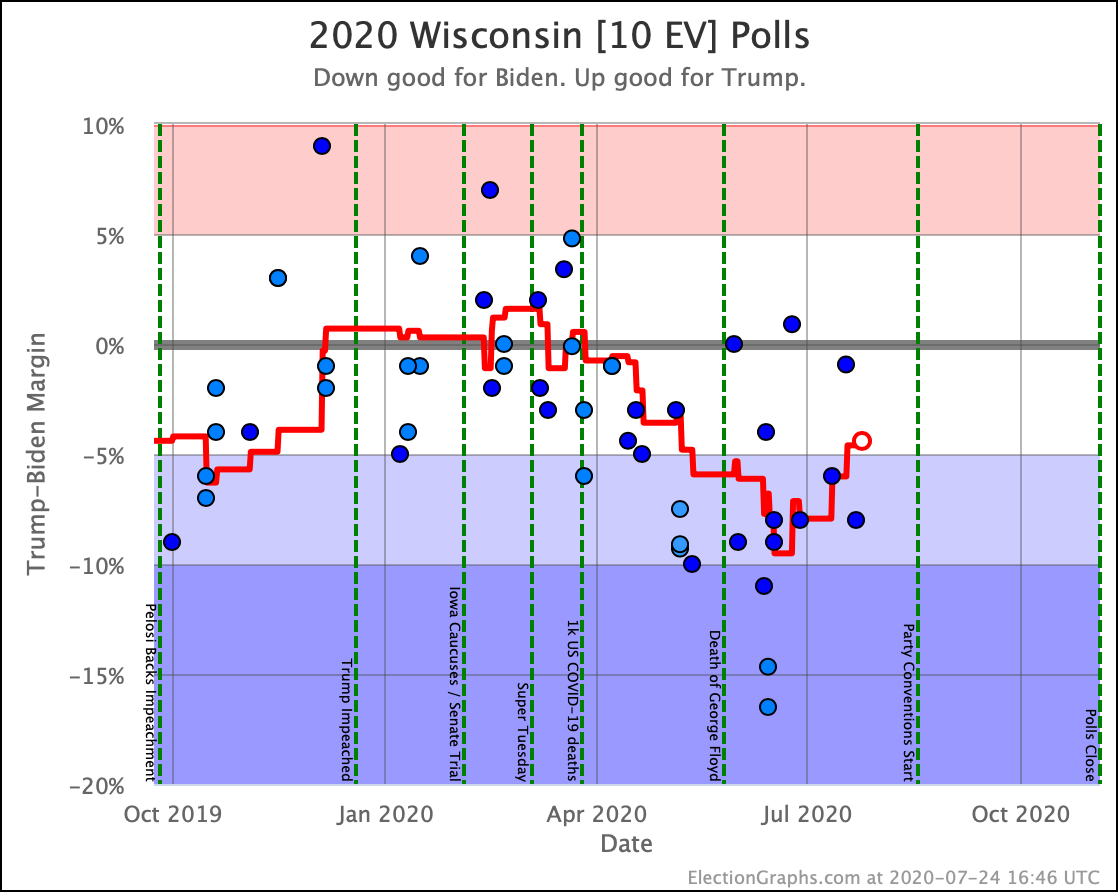
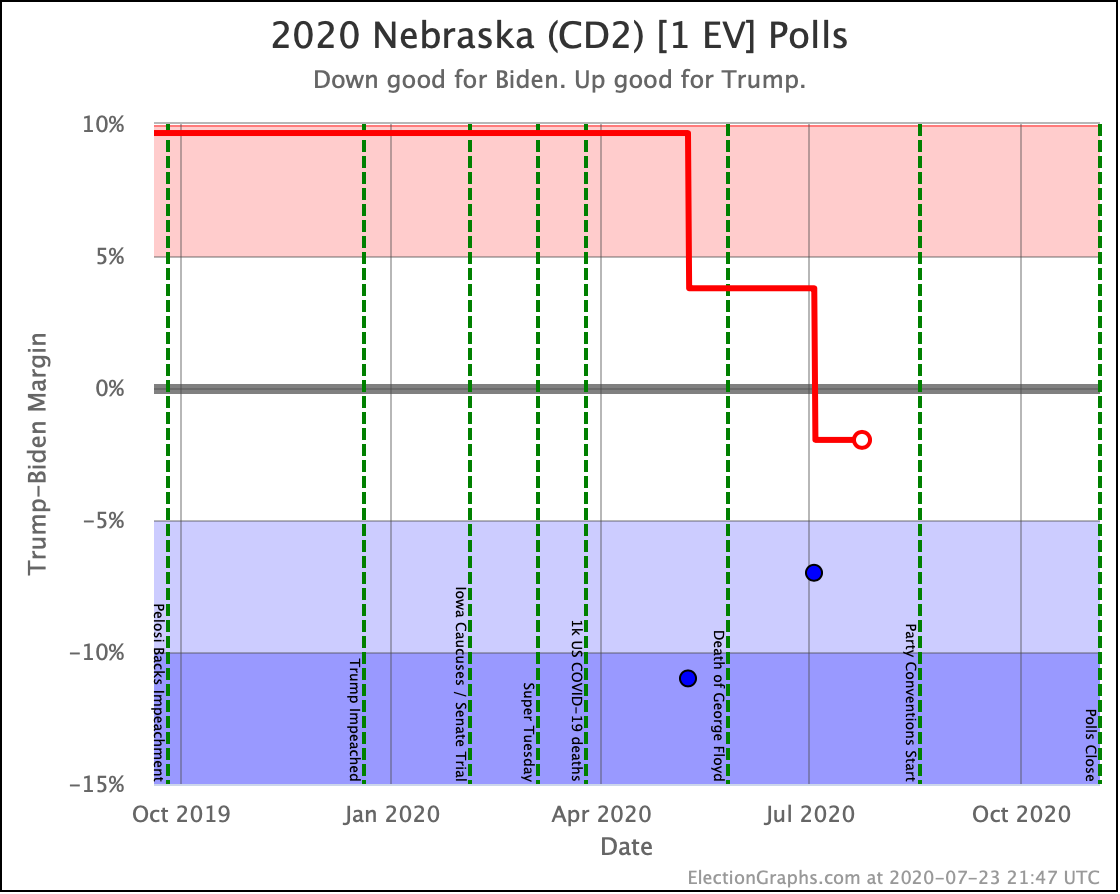
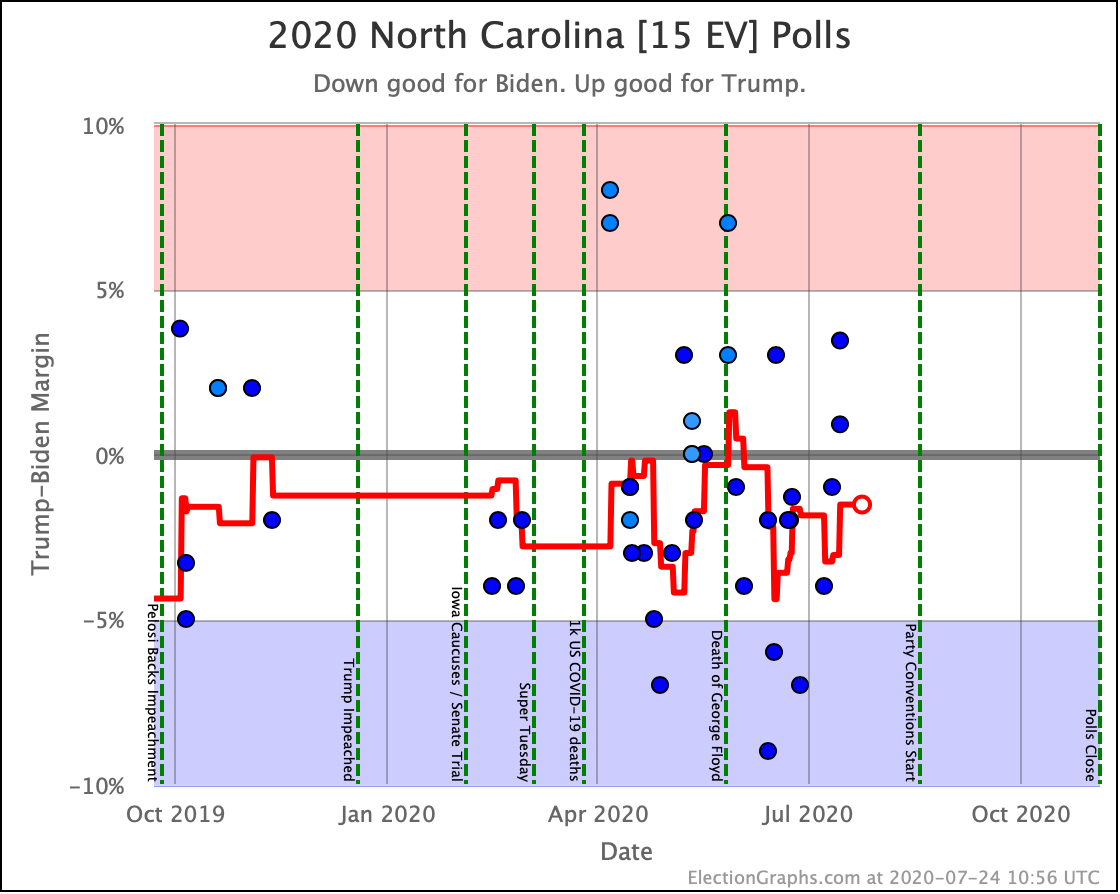
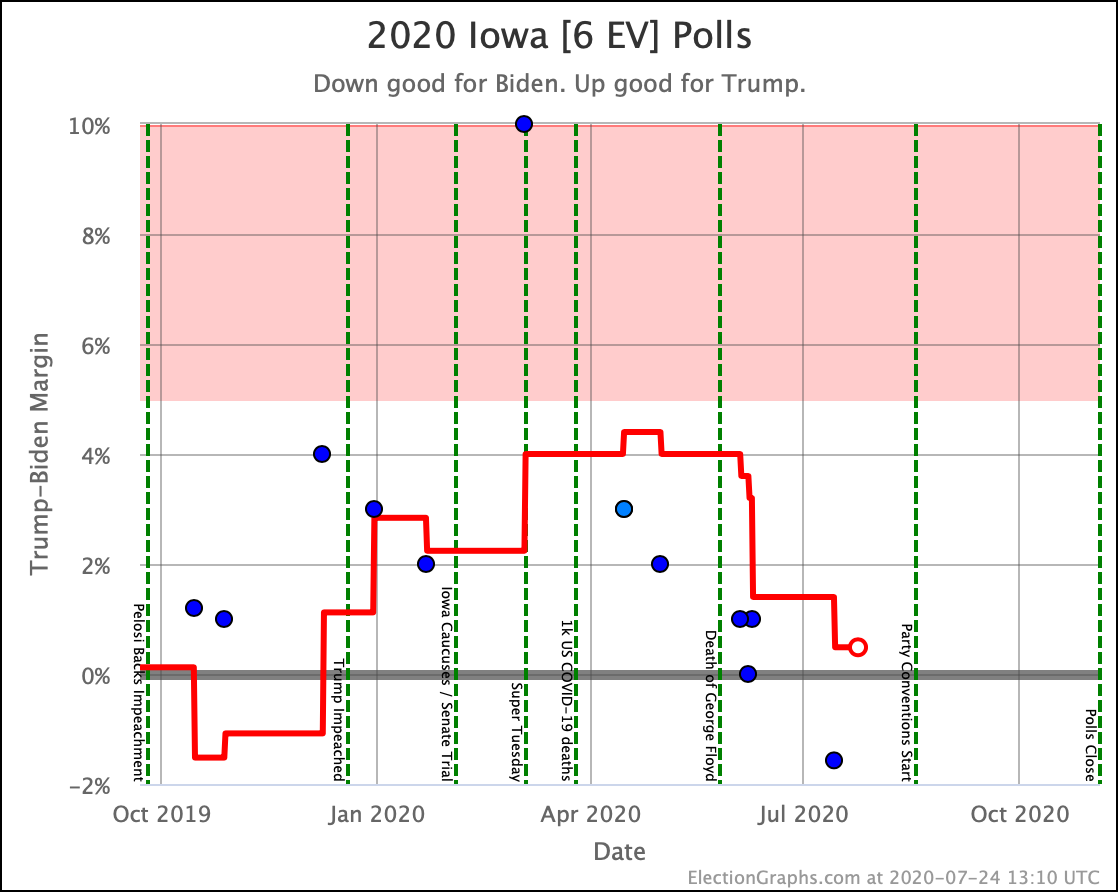
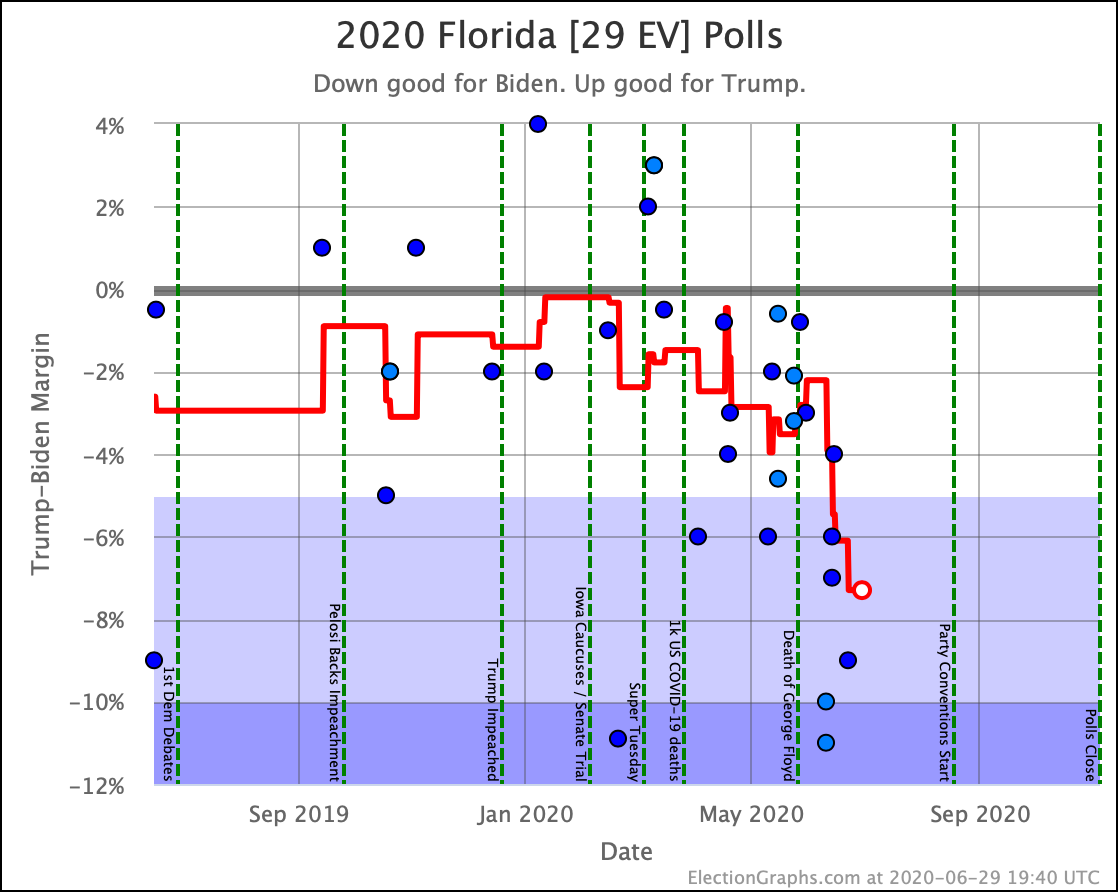
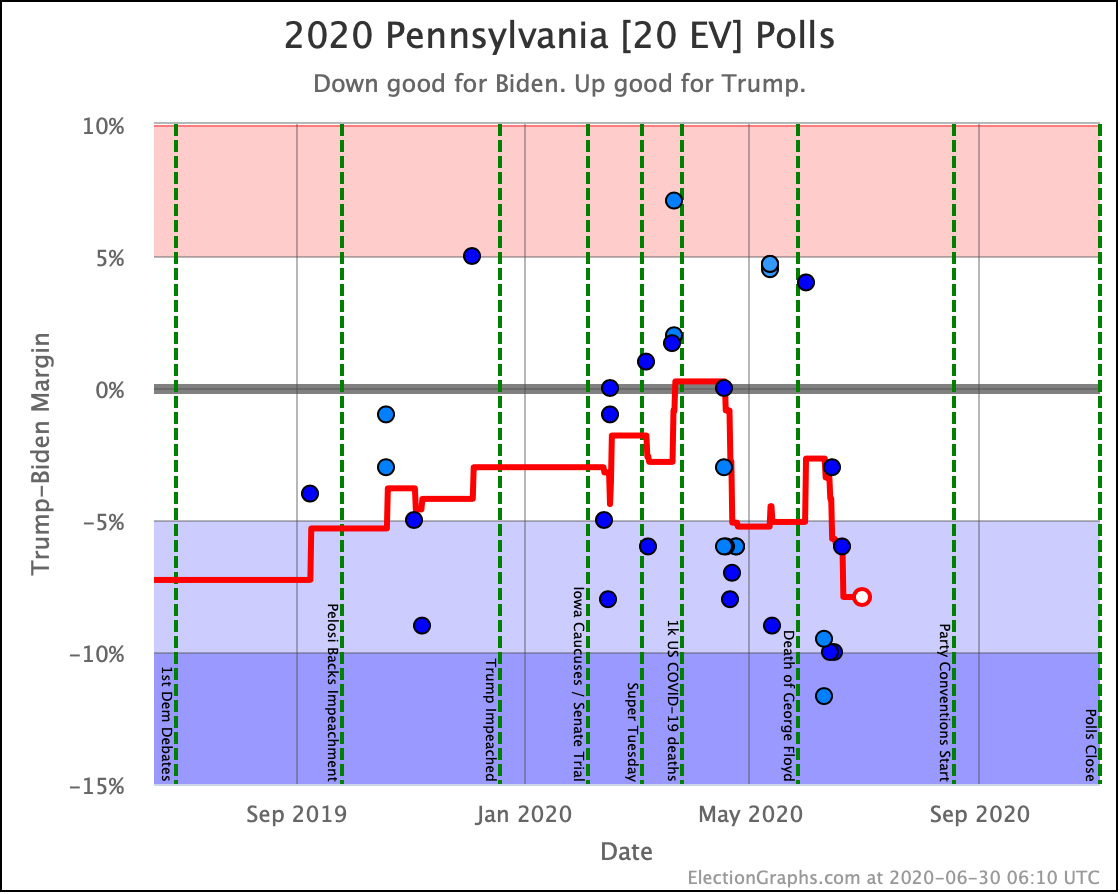
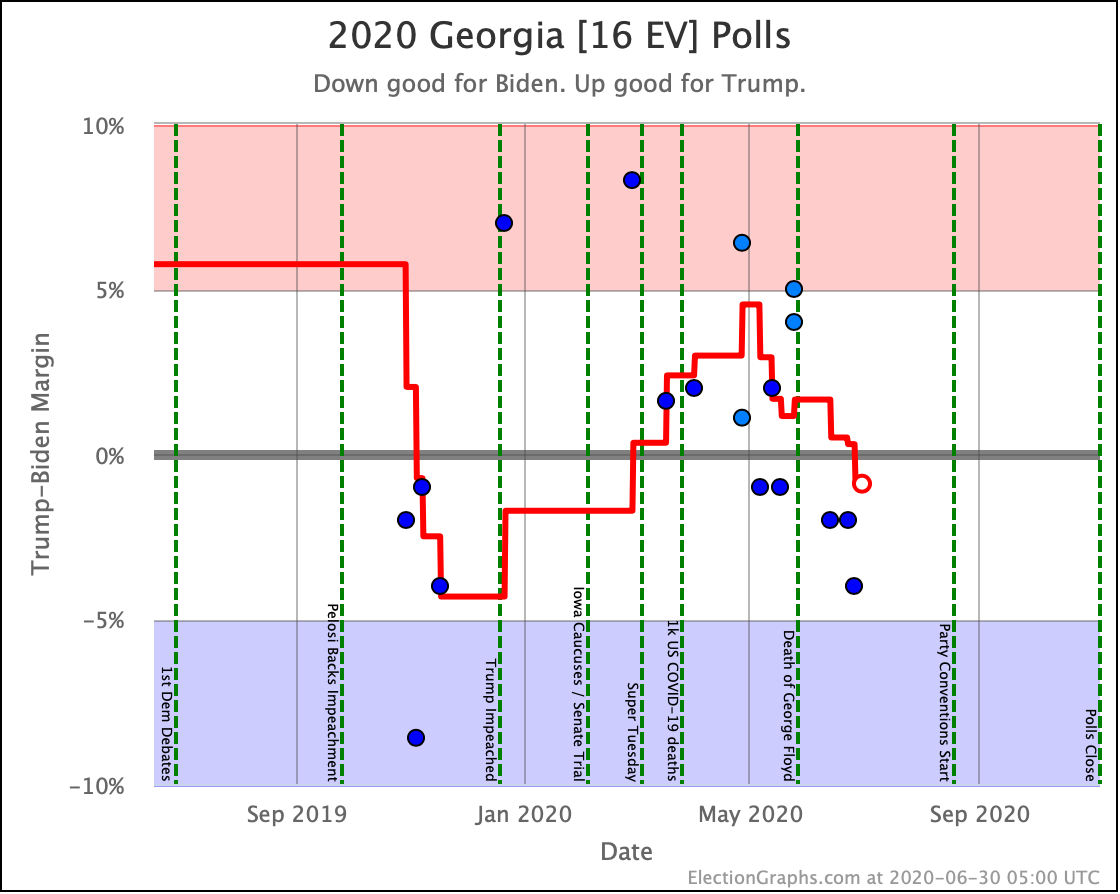
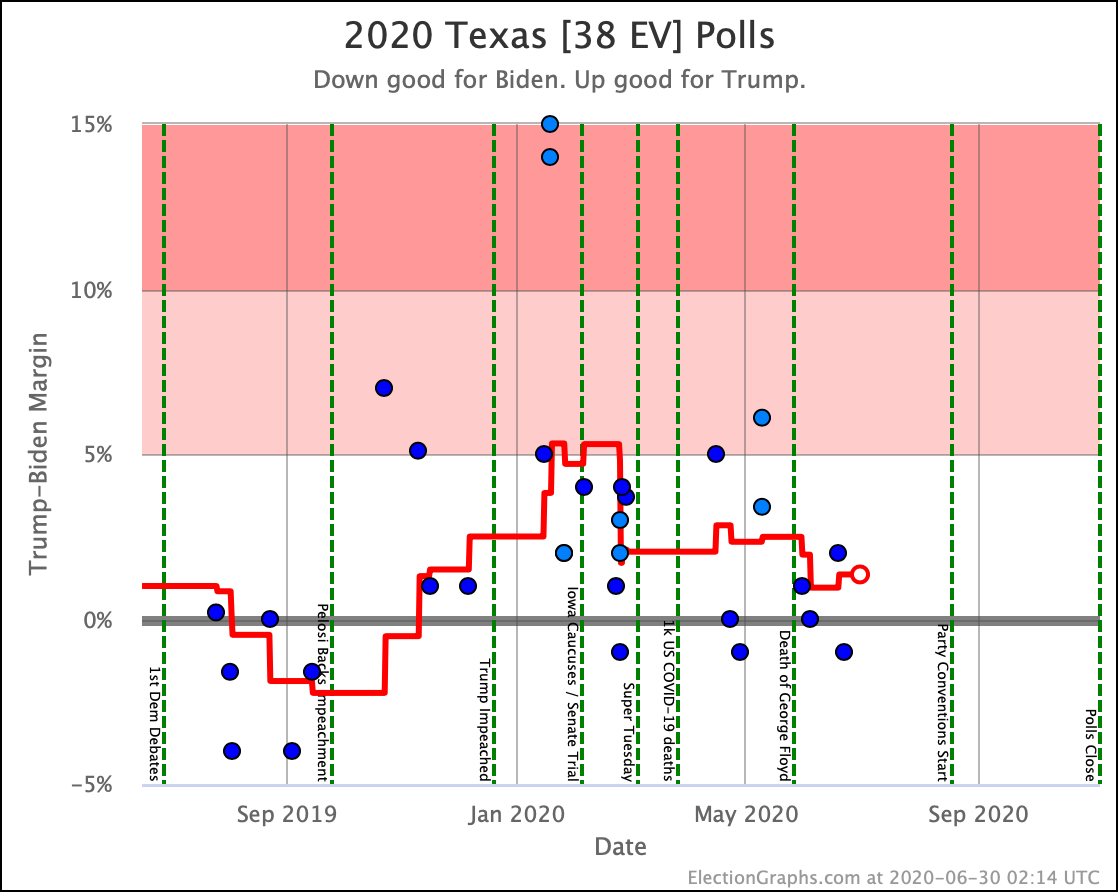
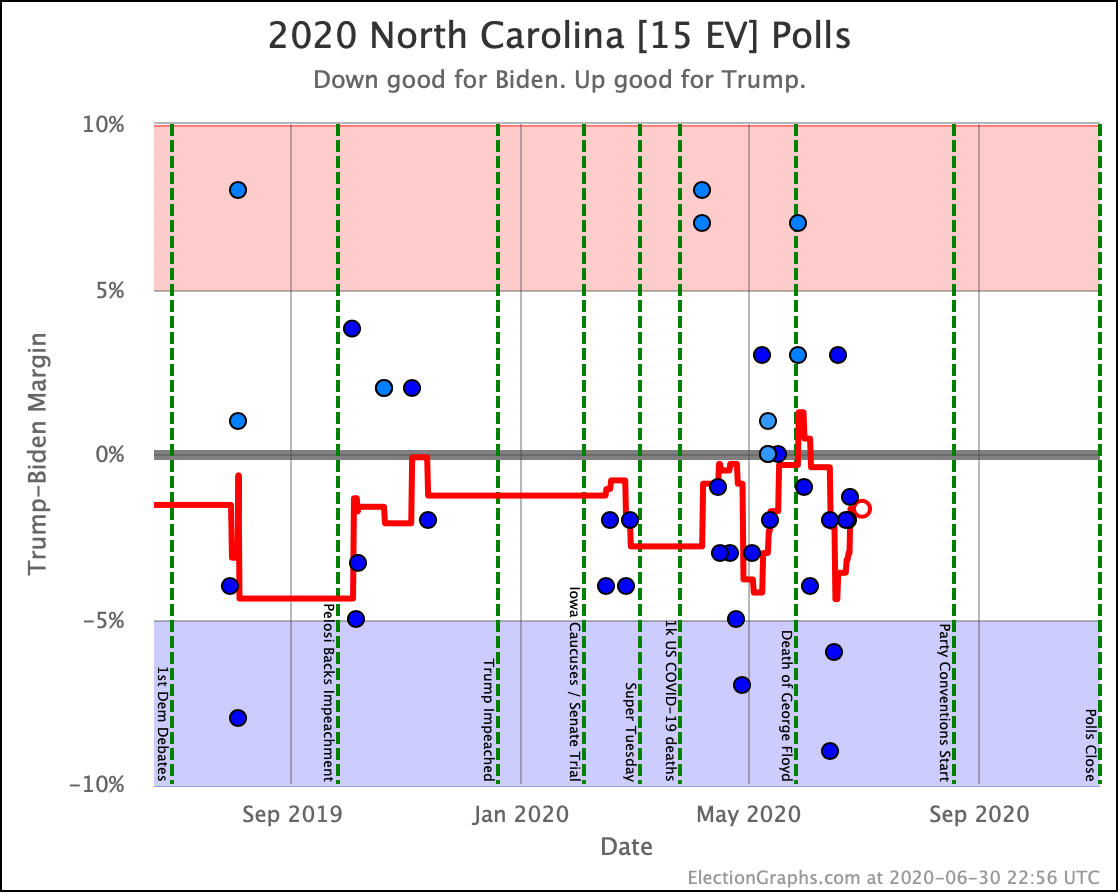
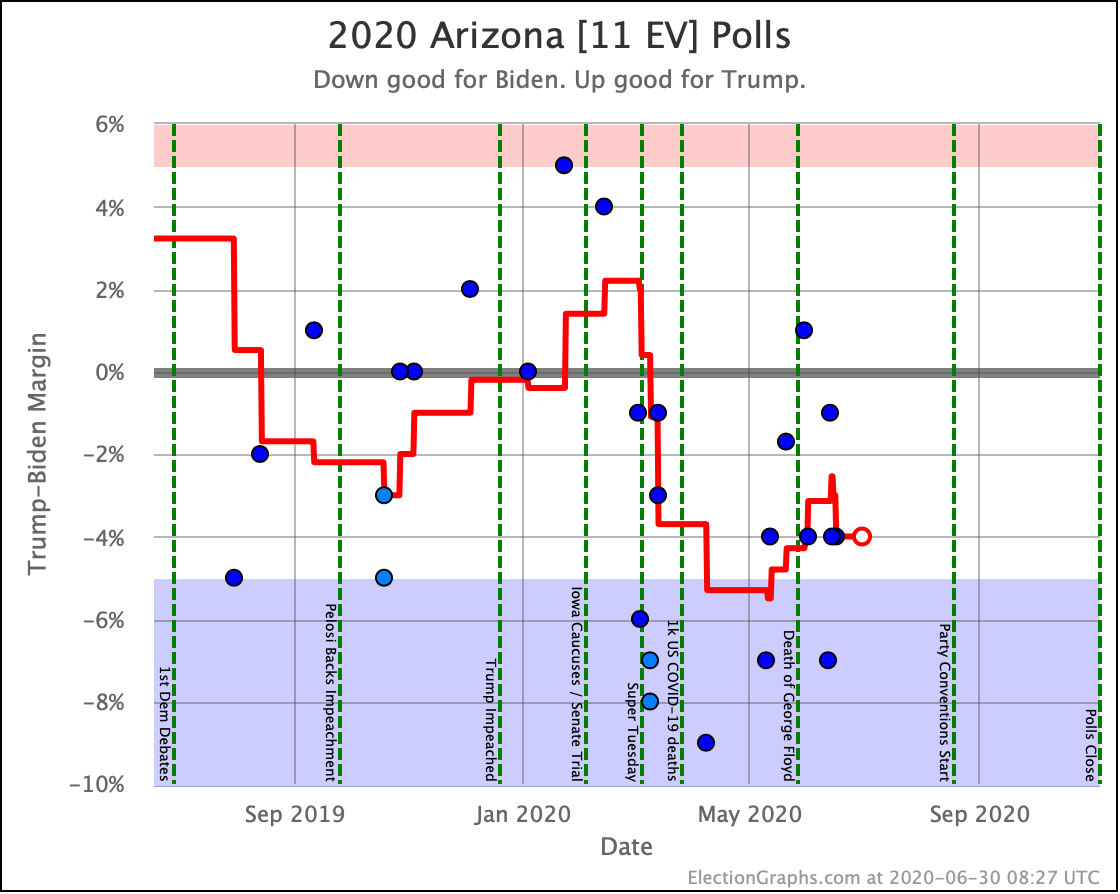
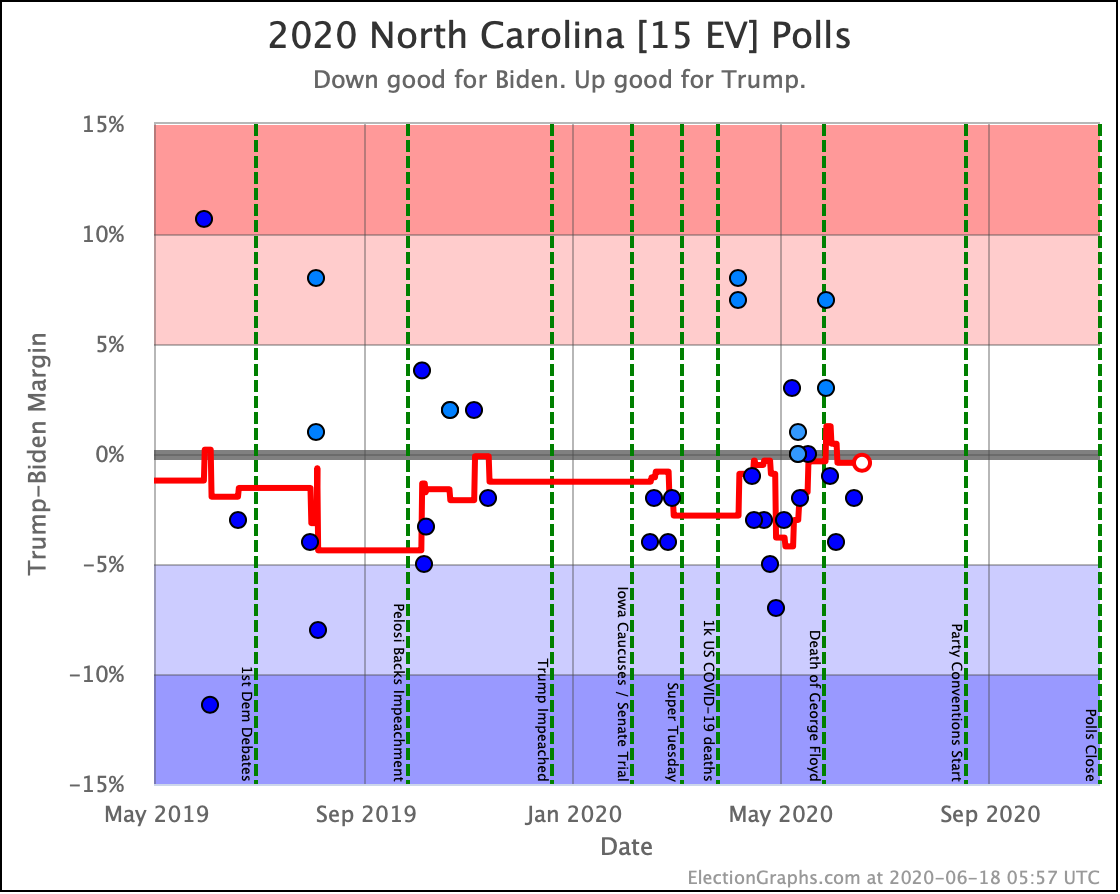
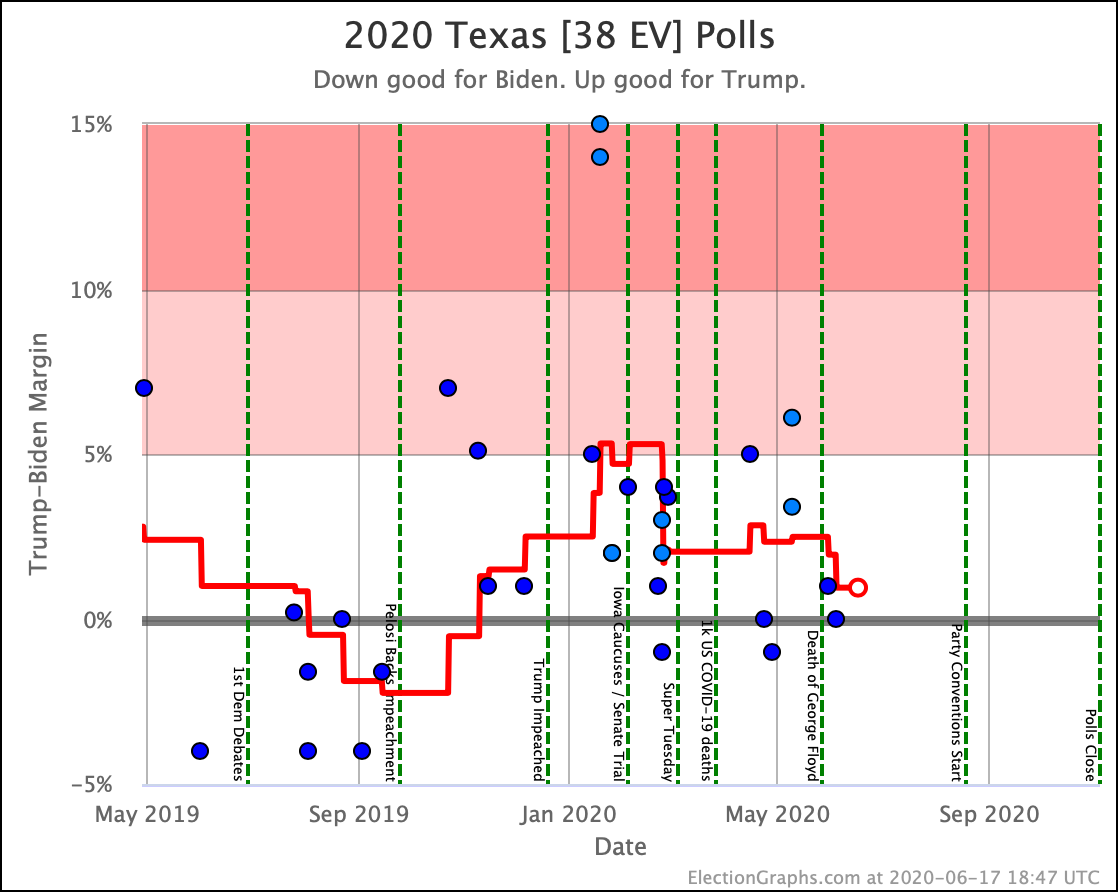
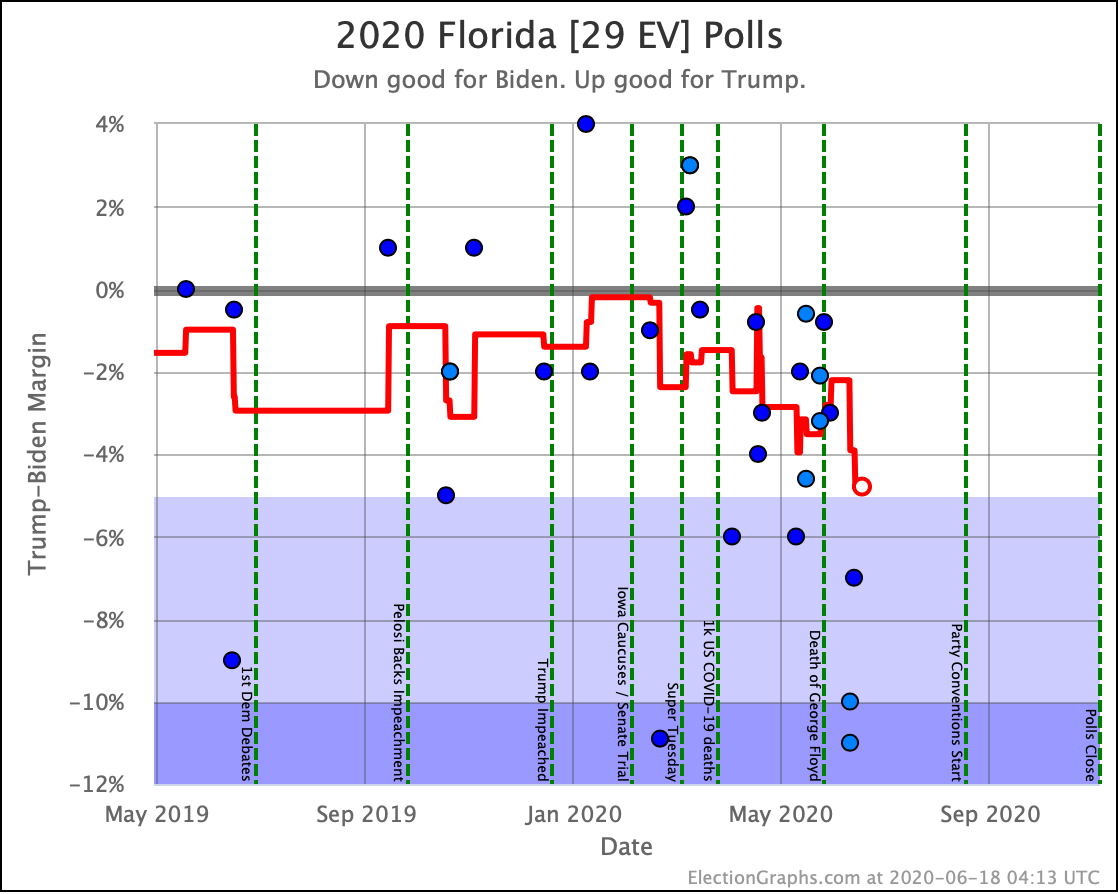
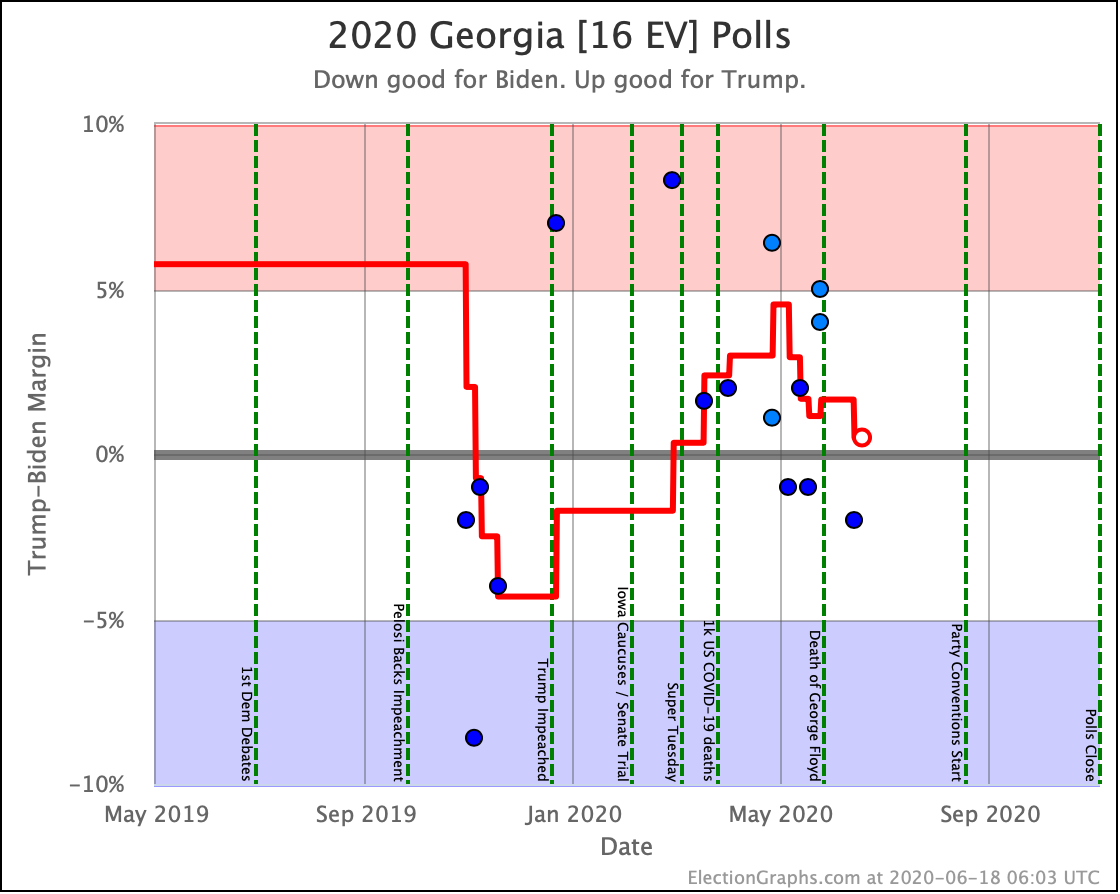
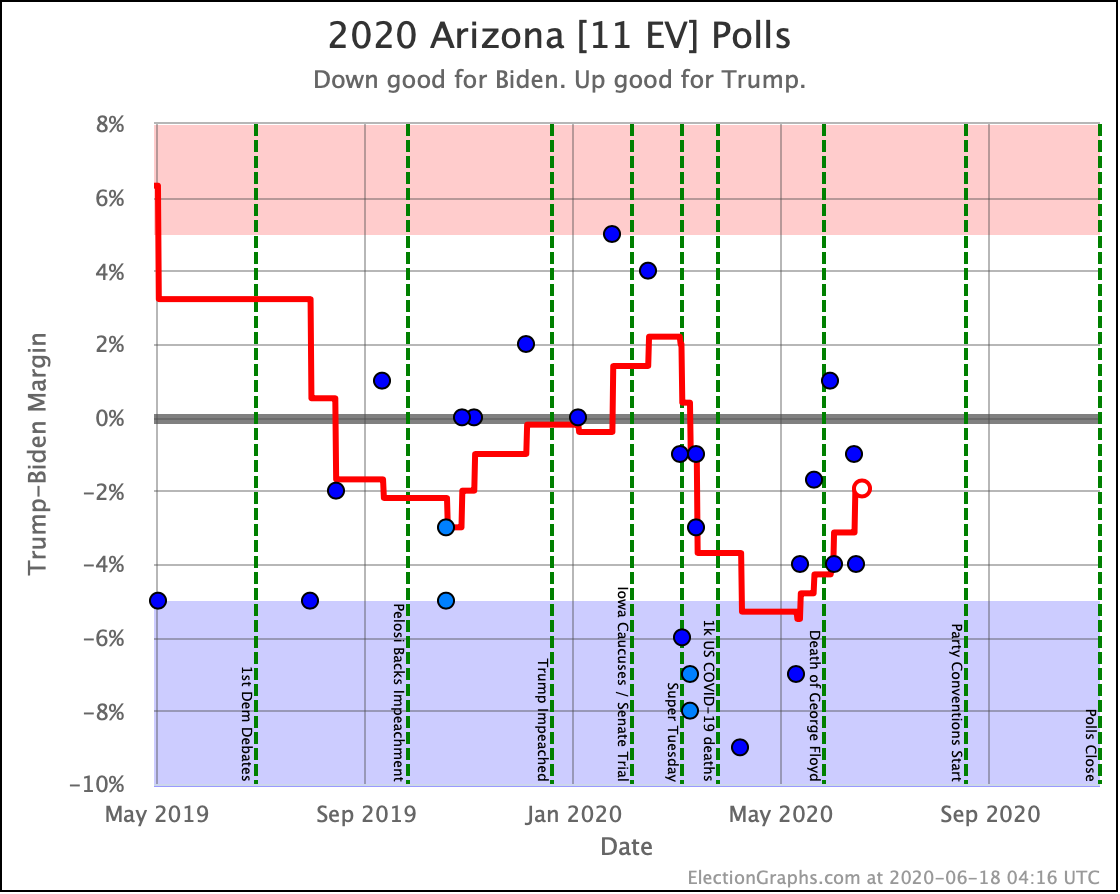
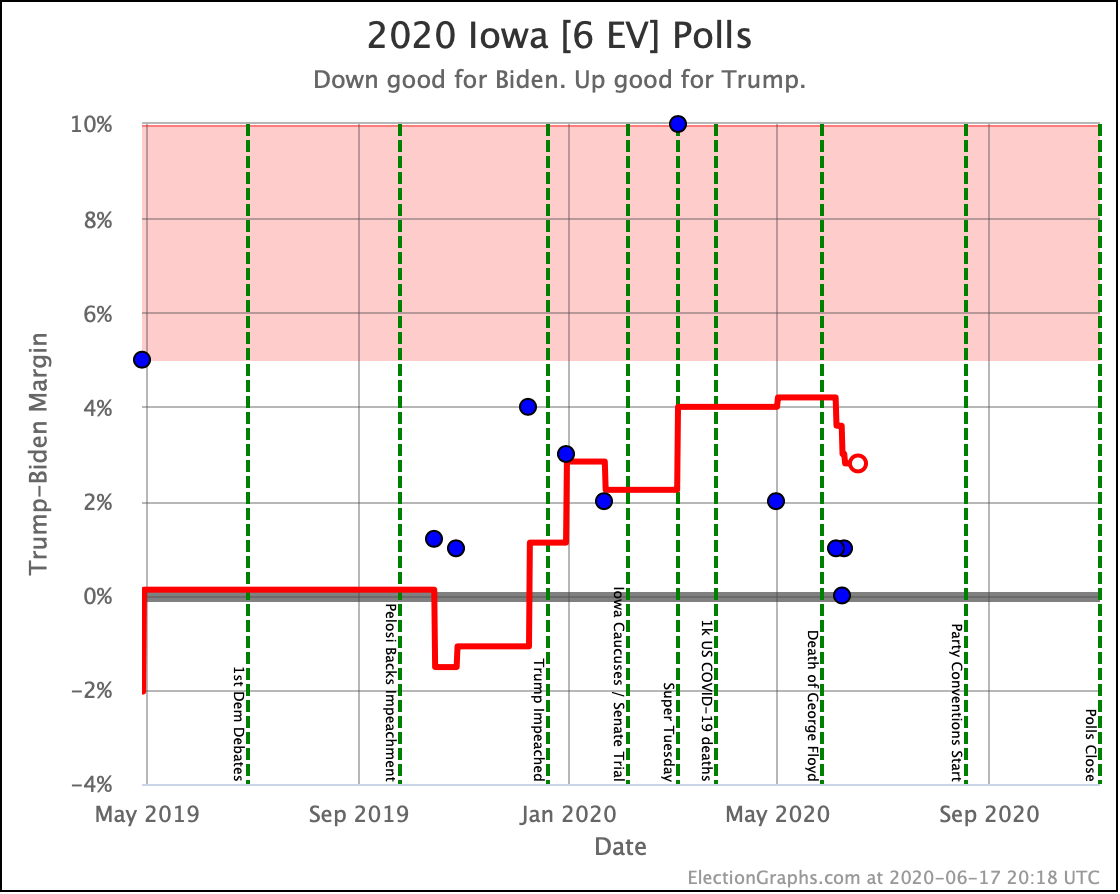
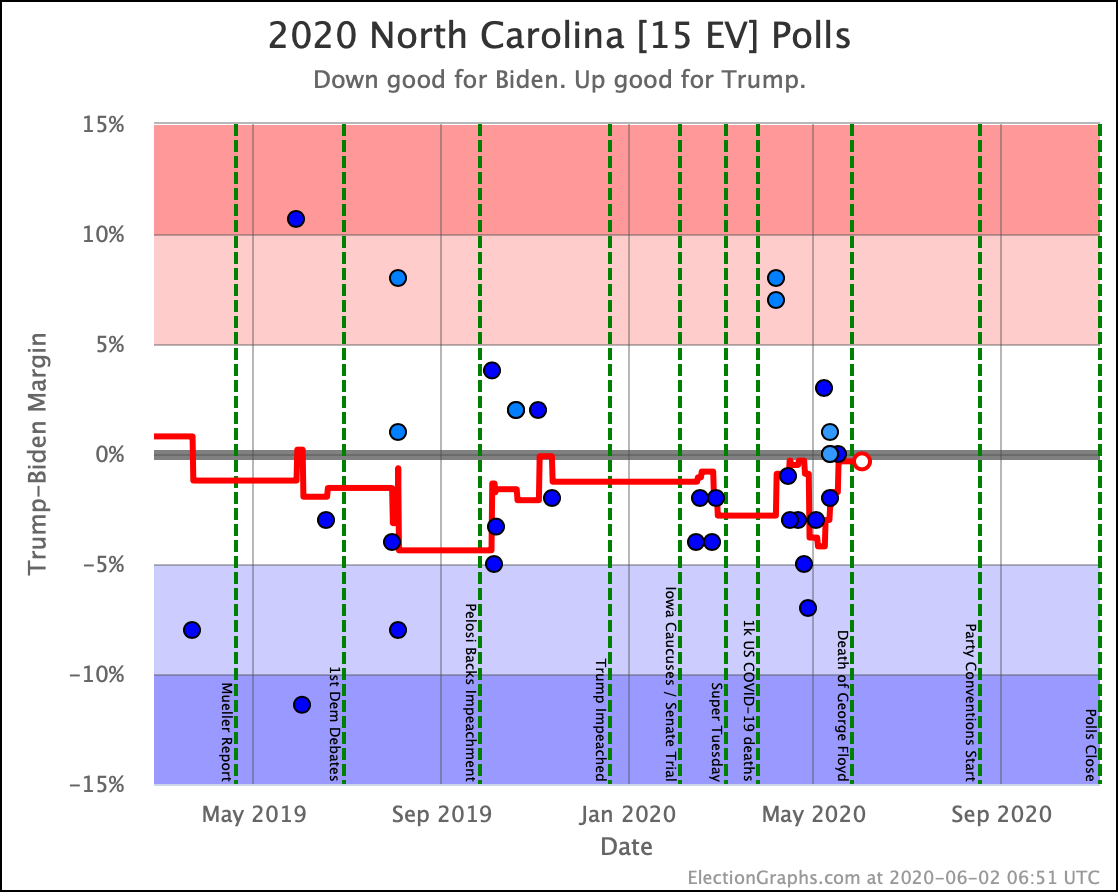
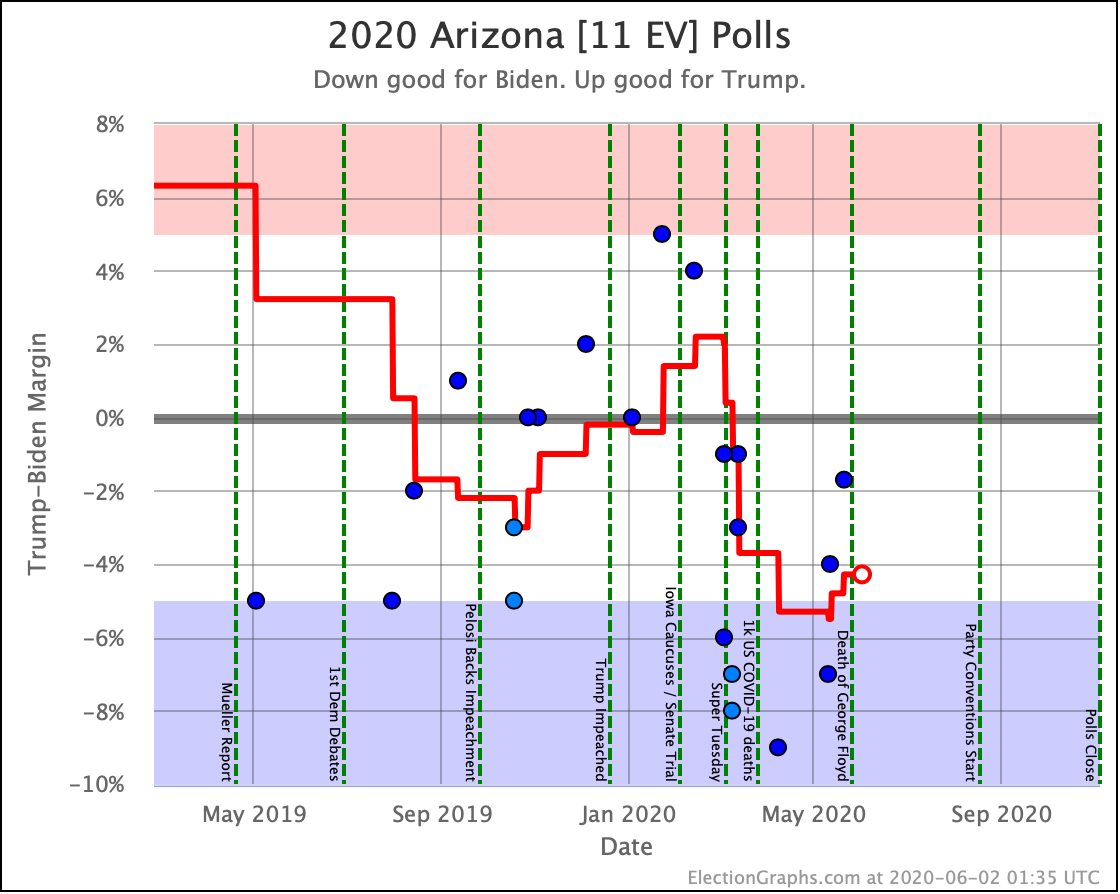
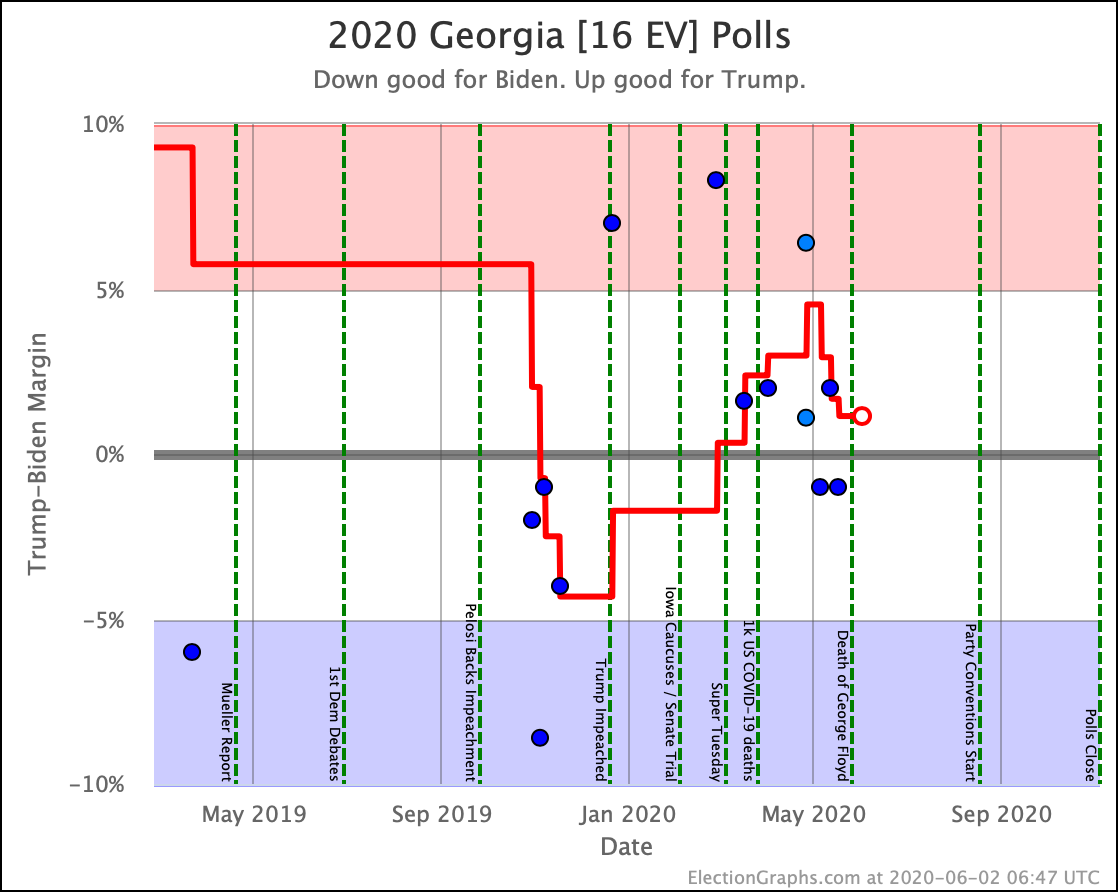
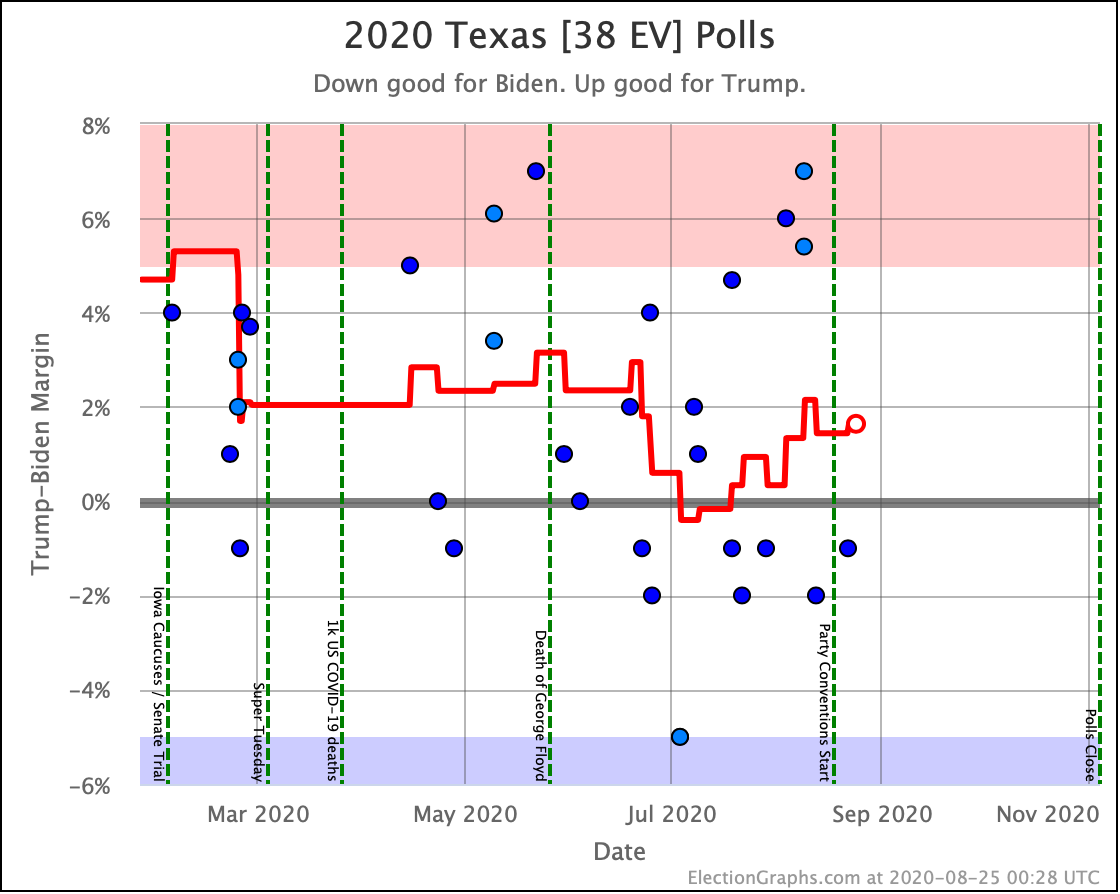
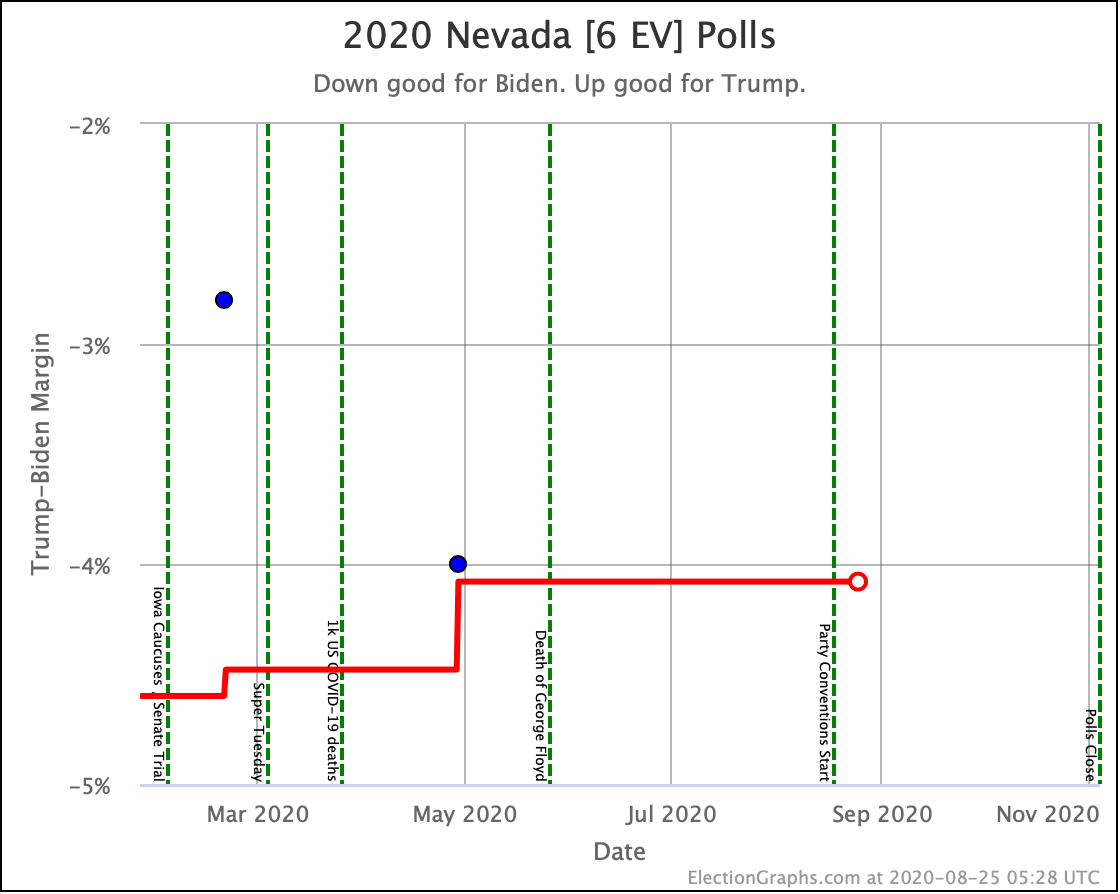
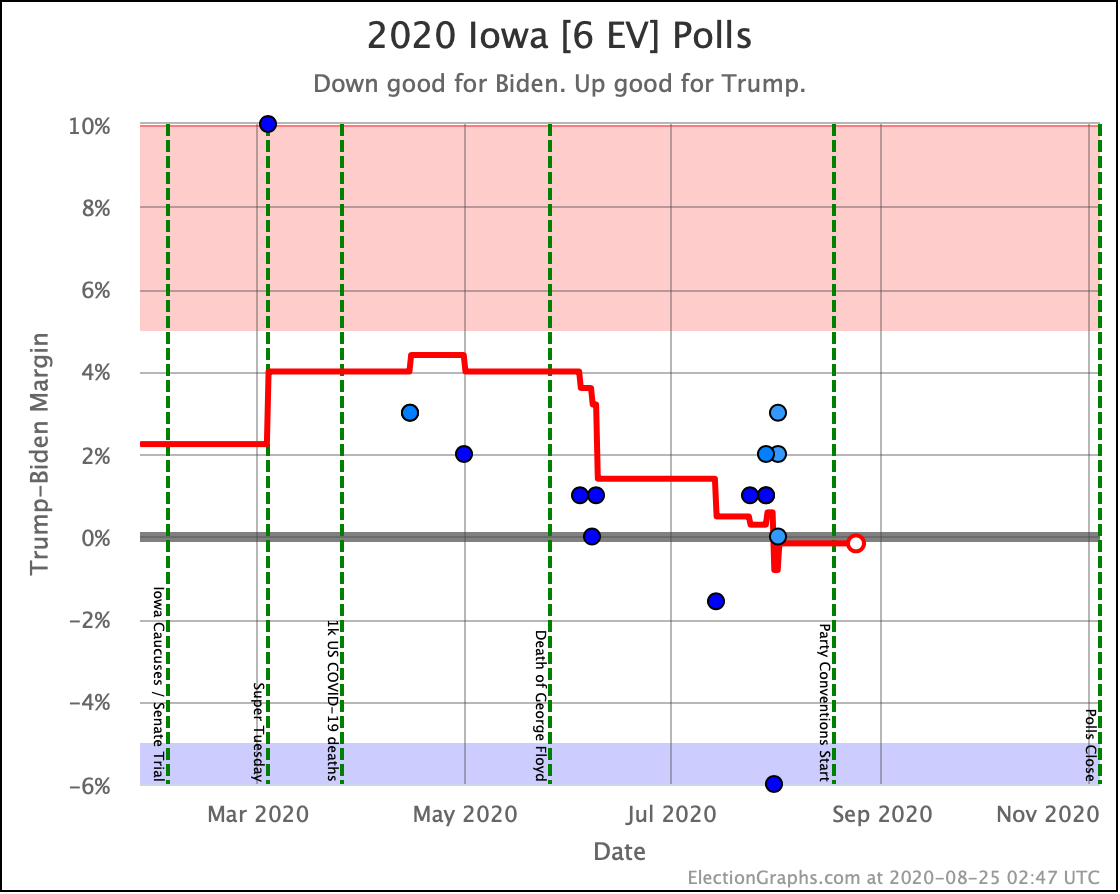
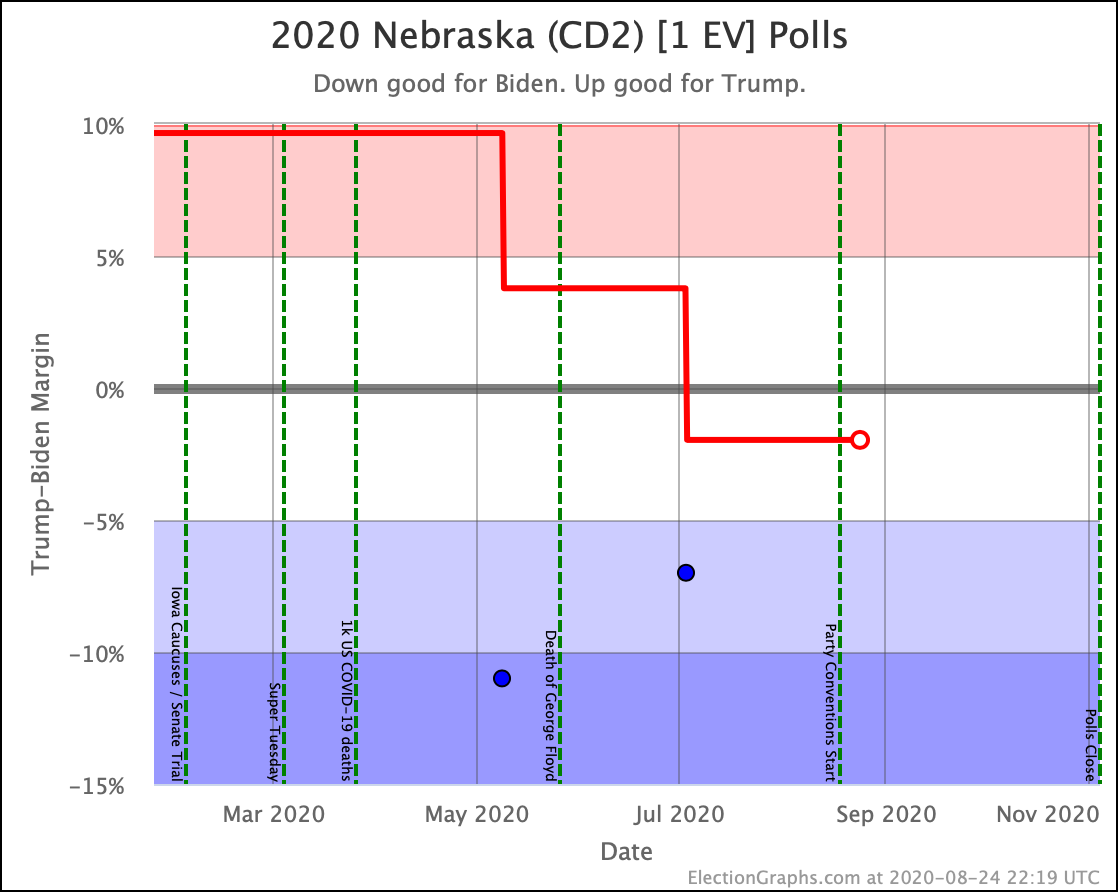
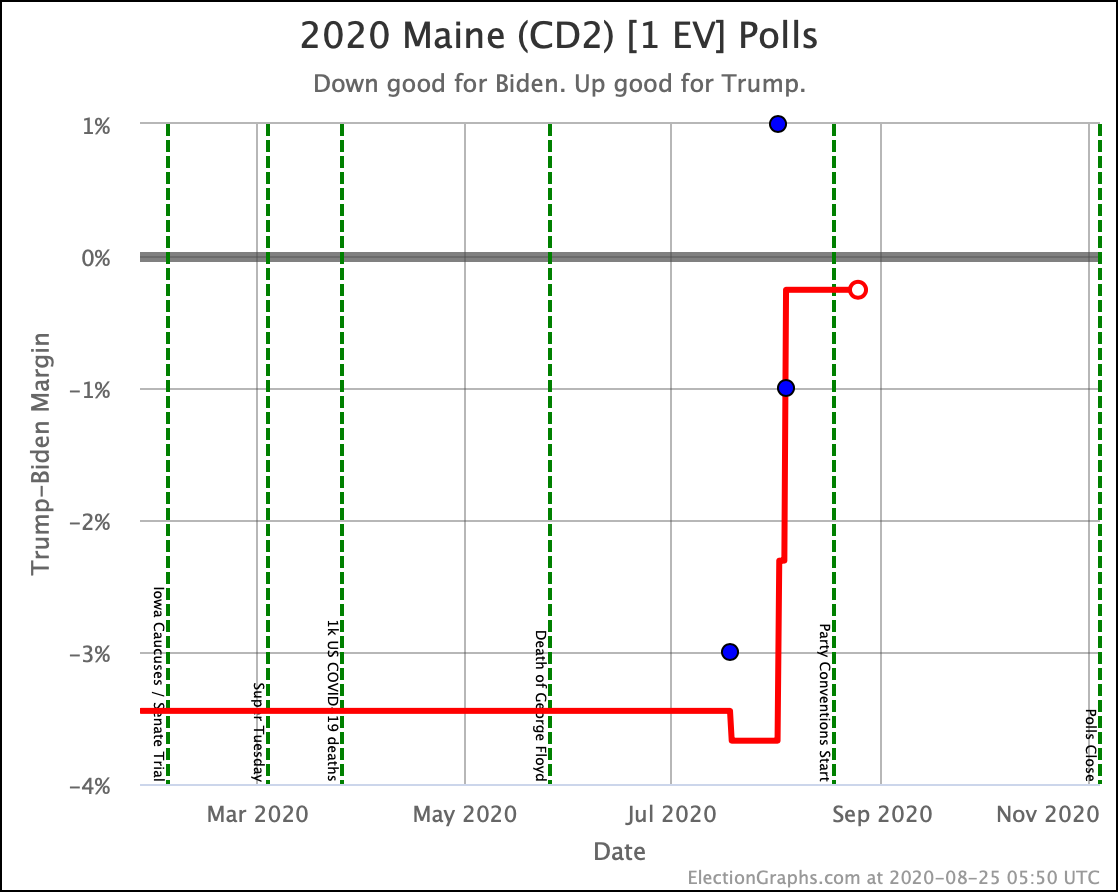
Before we look at the probabilistic views, here are the no-commentary views of all of the other close states (and congressional districts that give electoral votes):
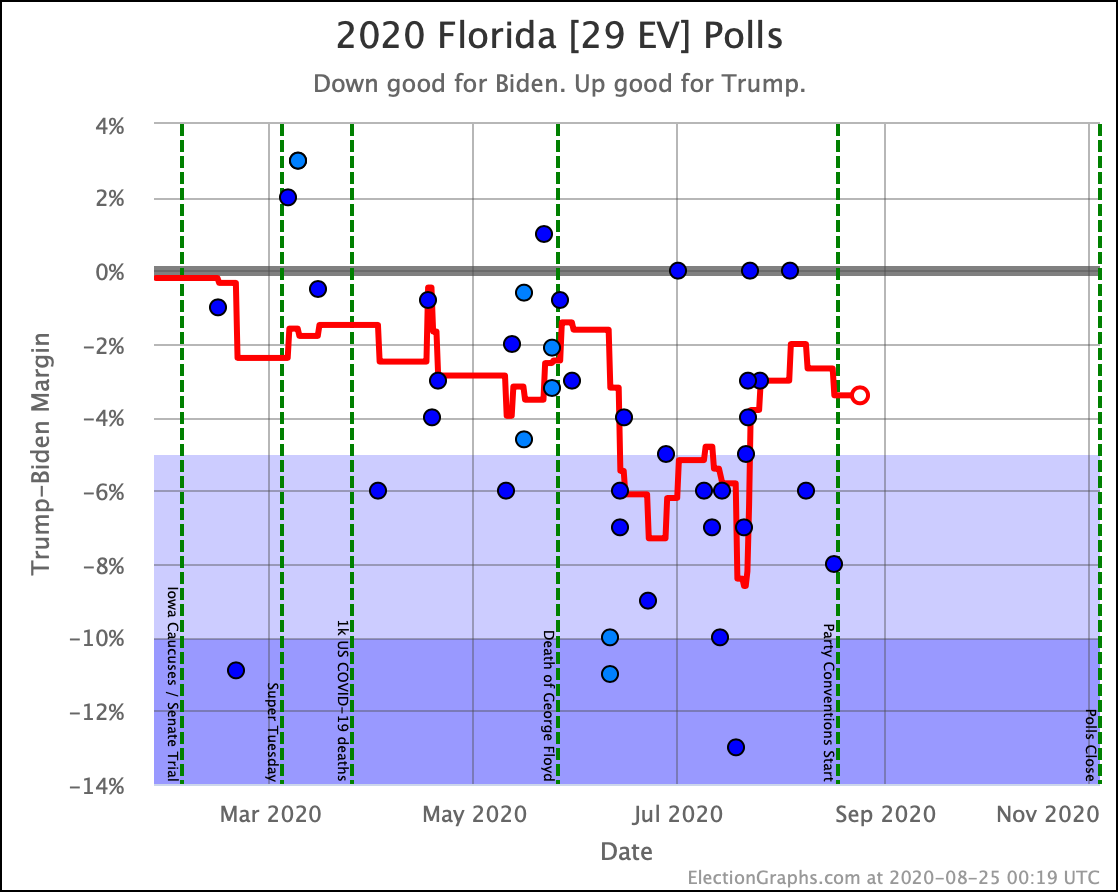
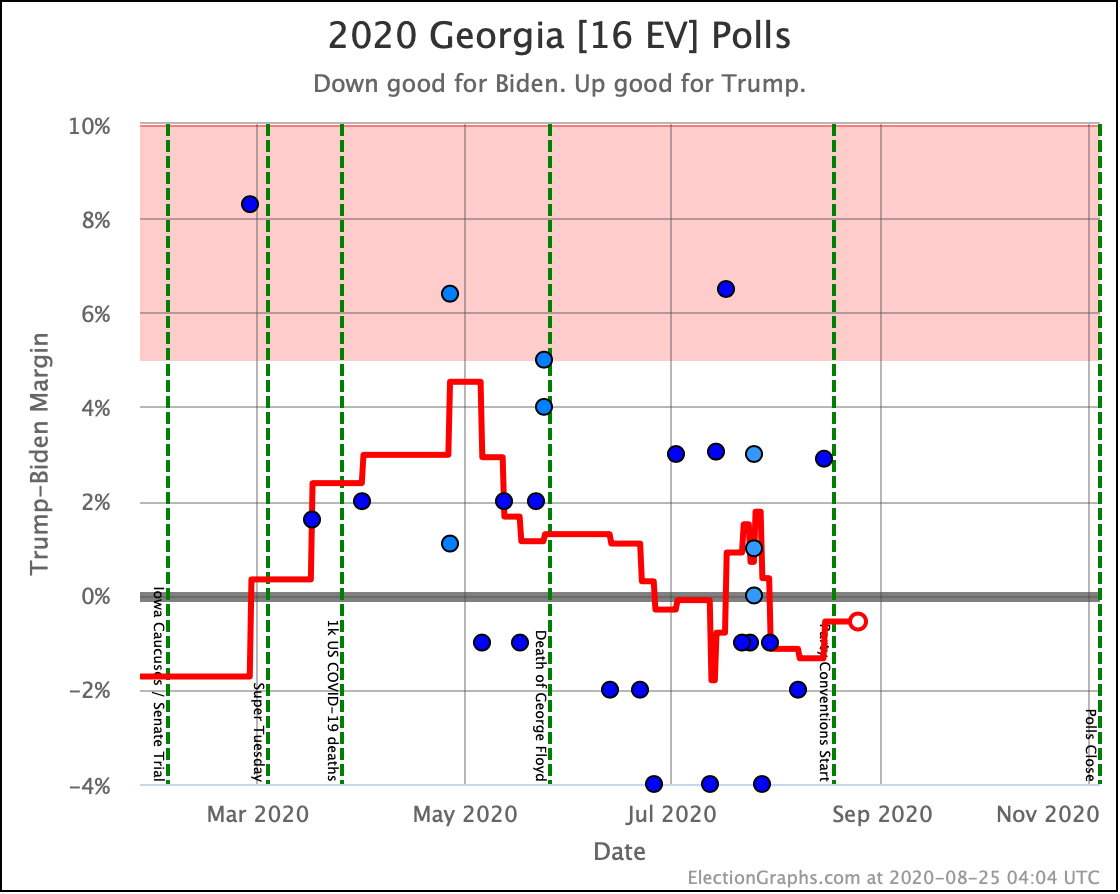
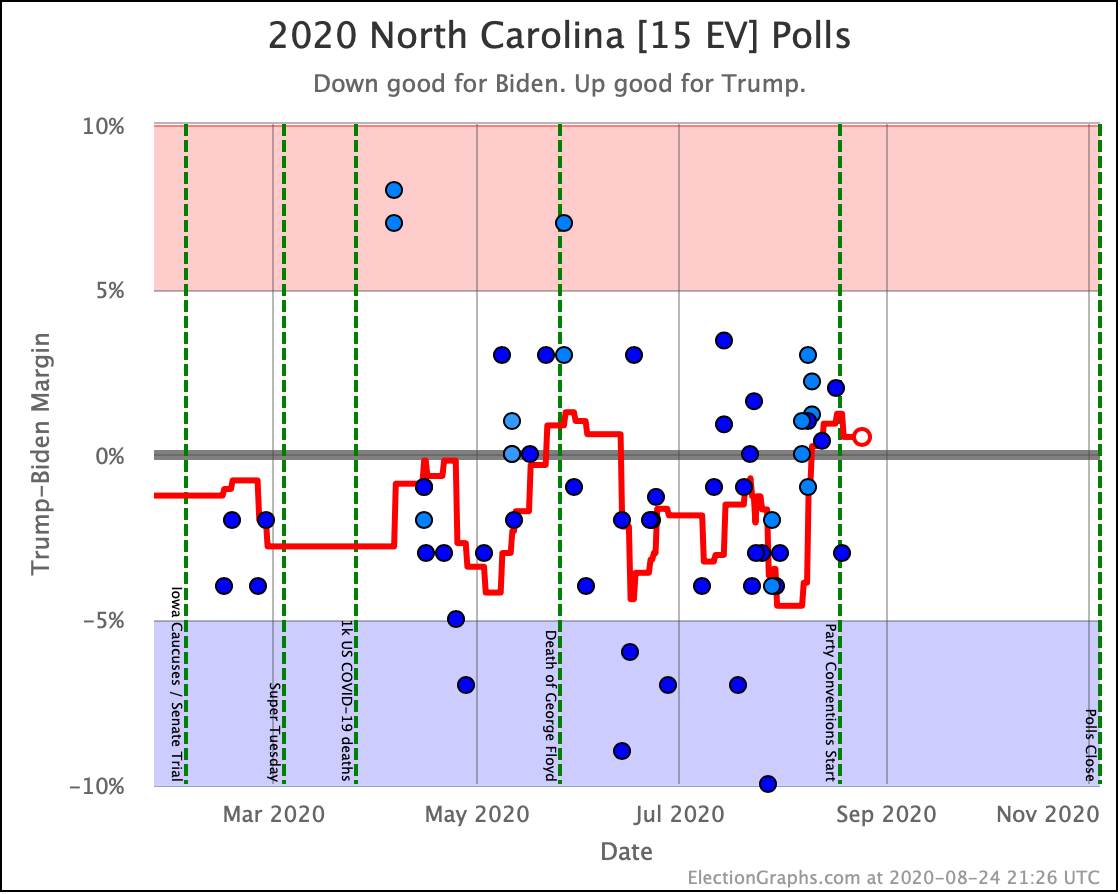
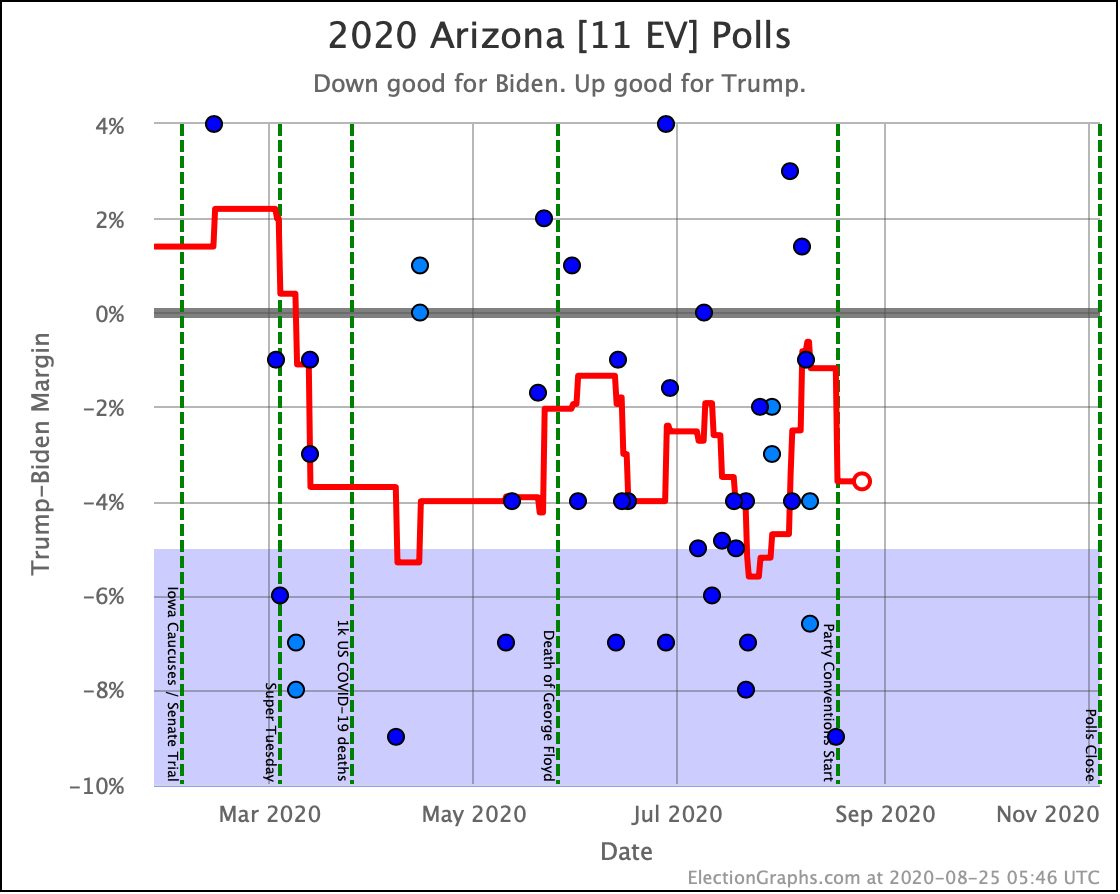
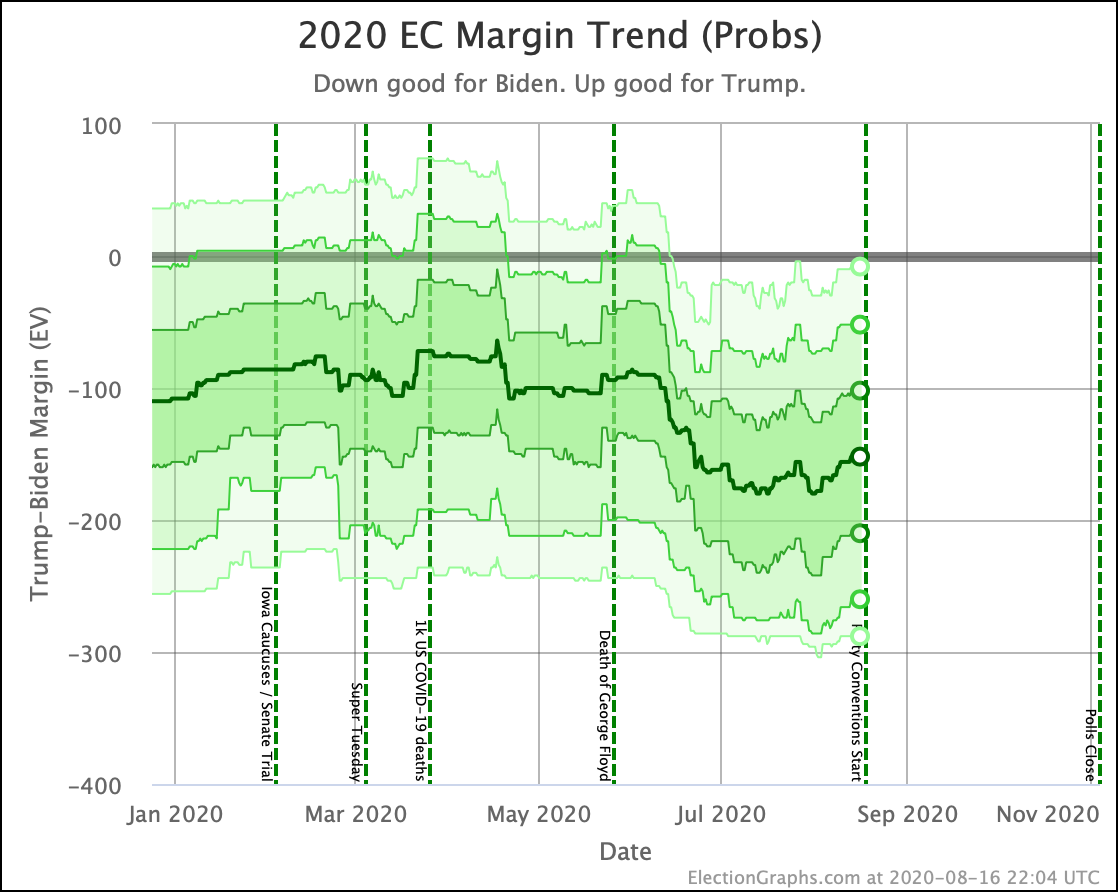
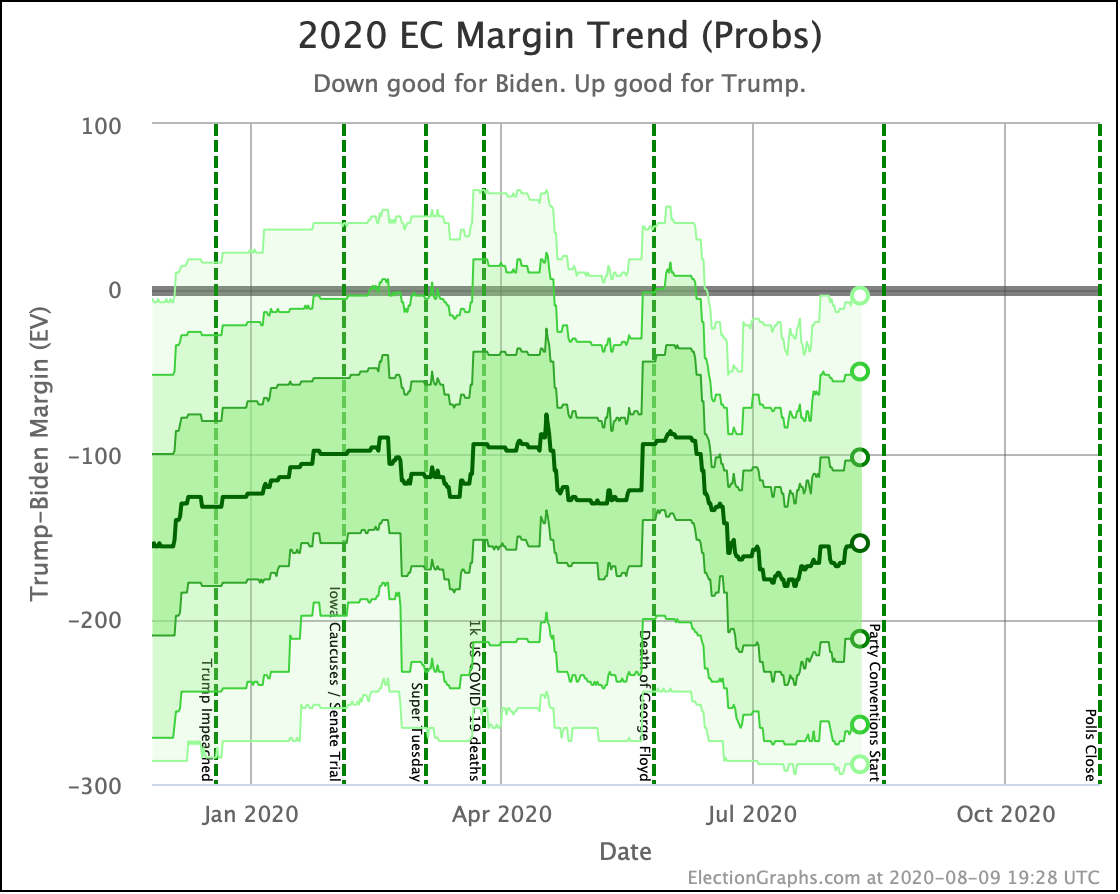
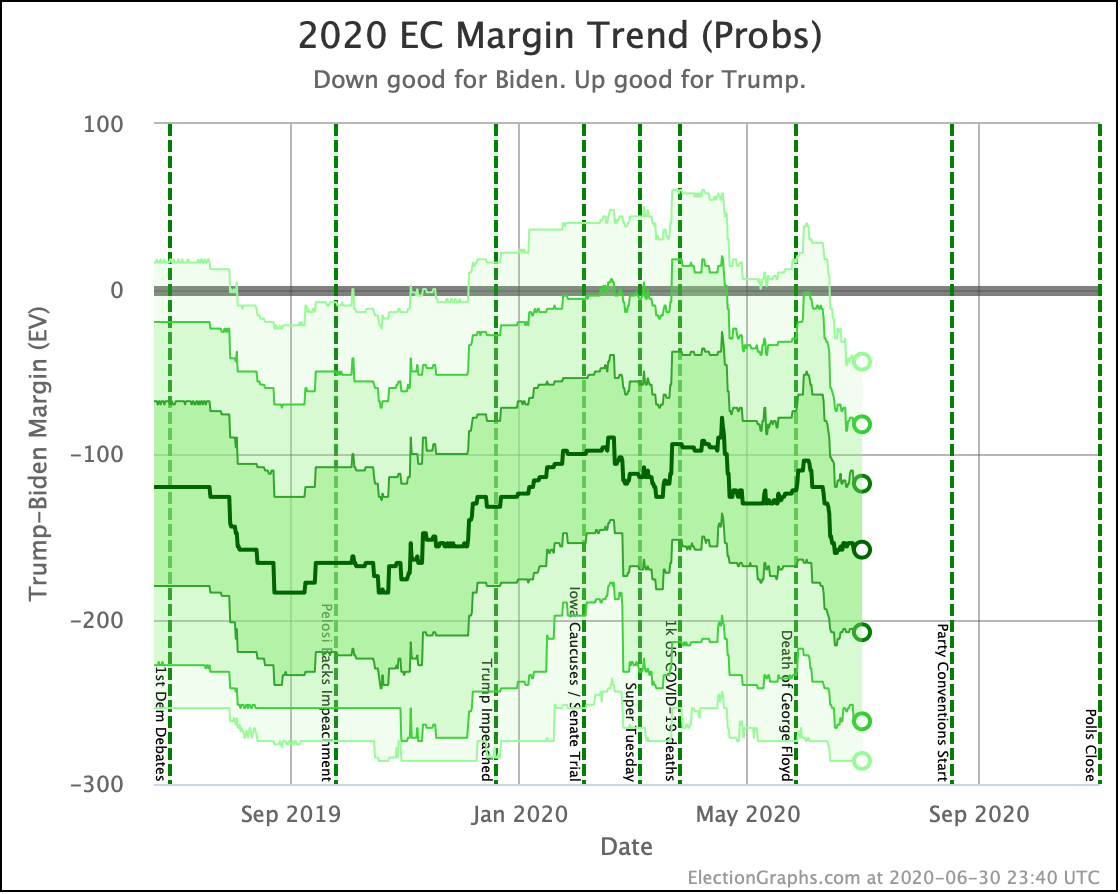
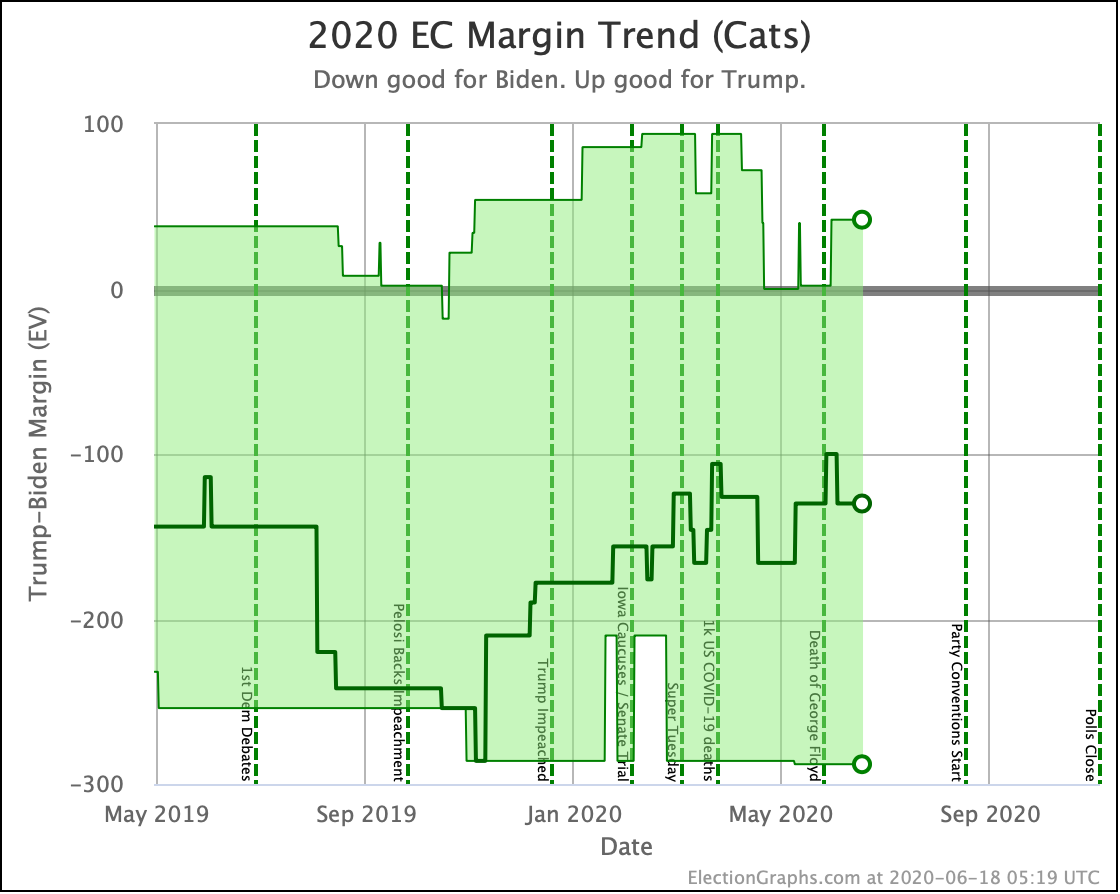
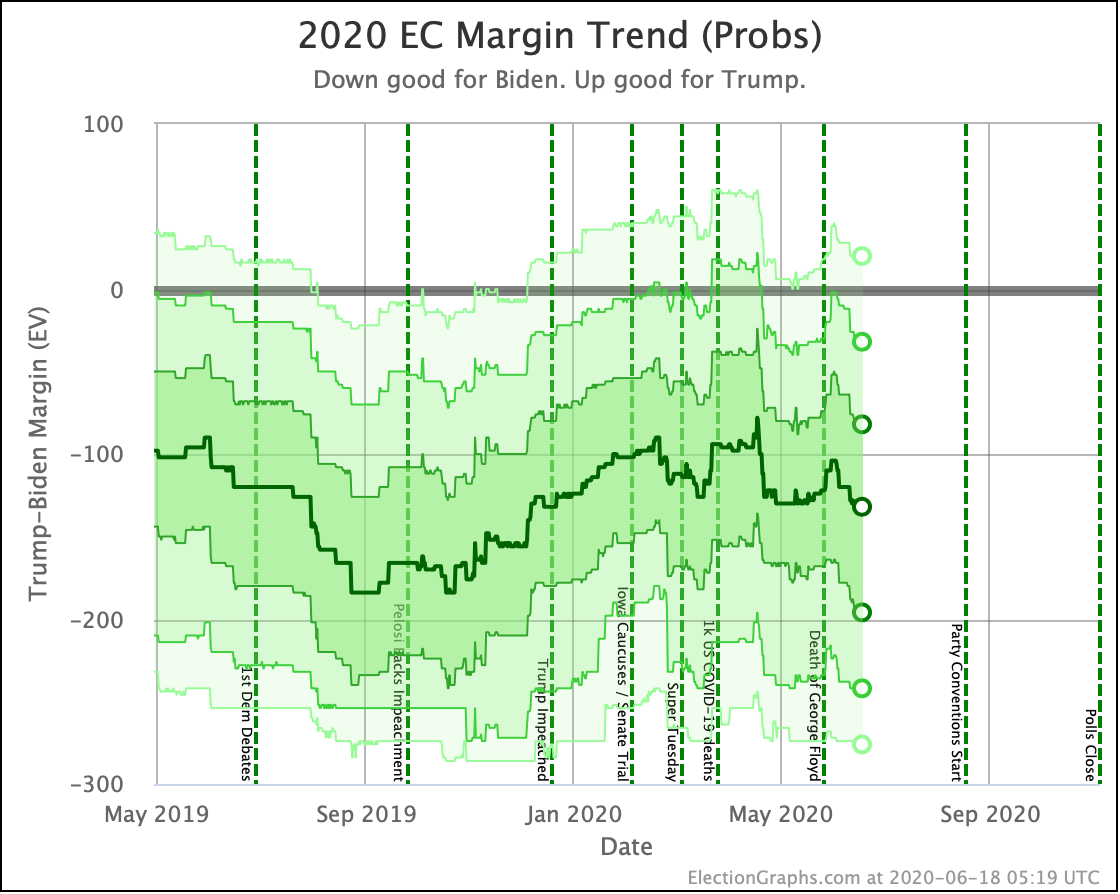
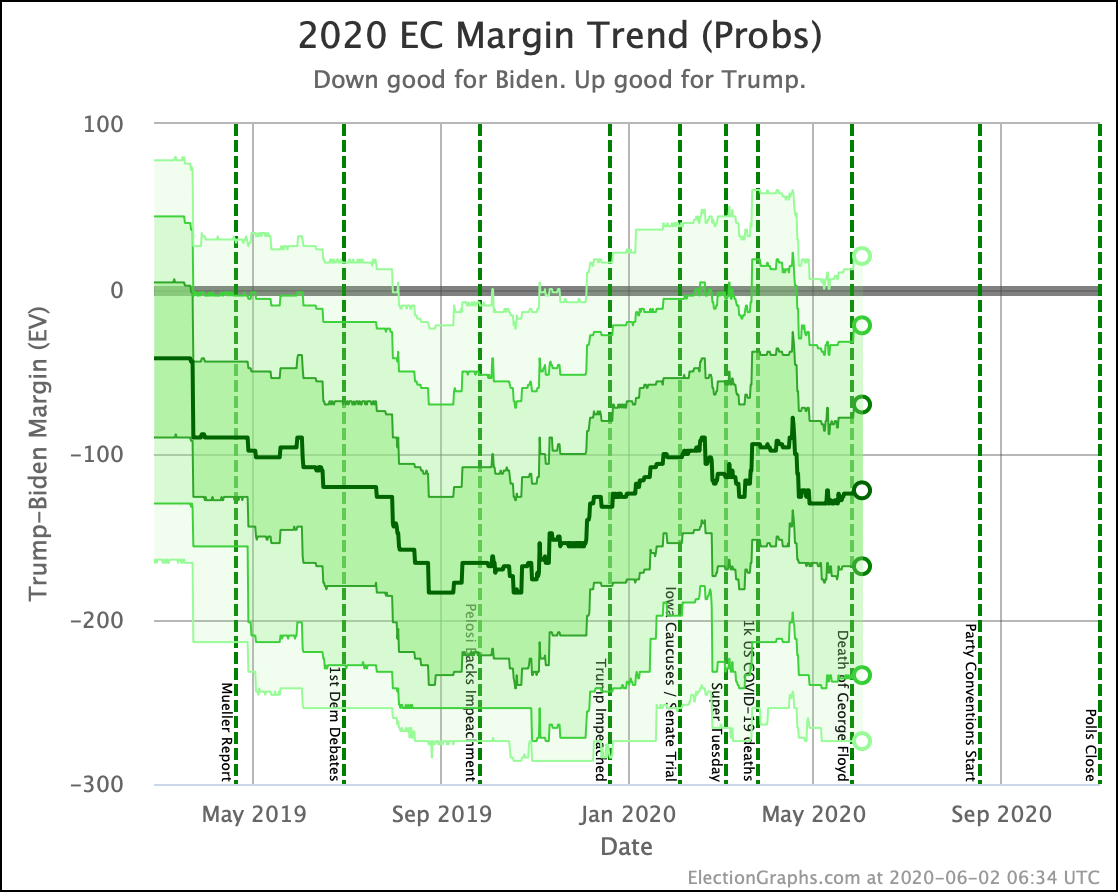
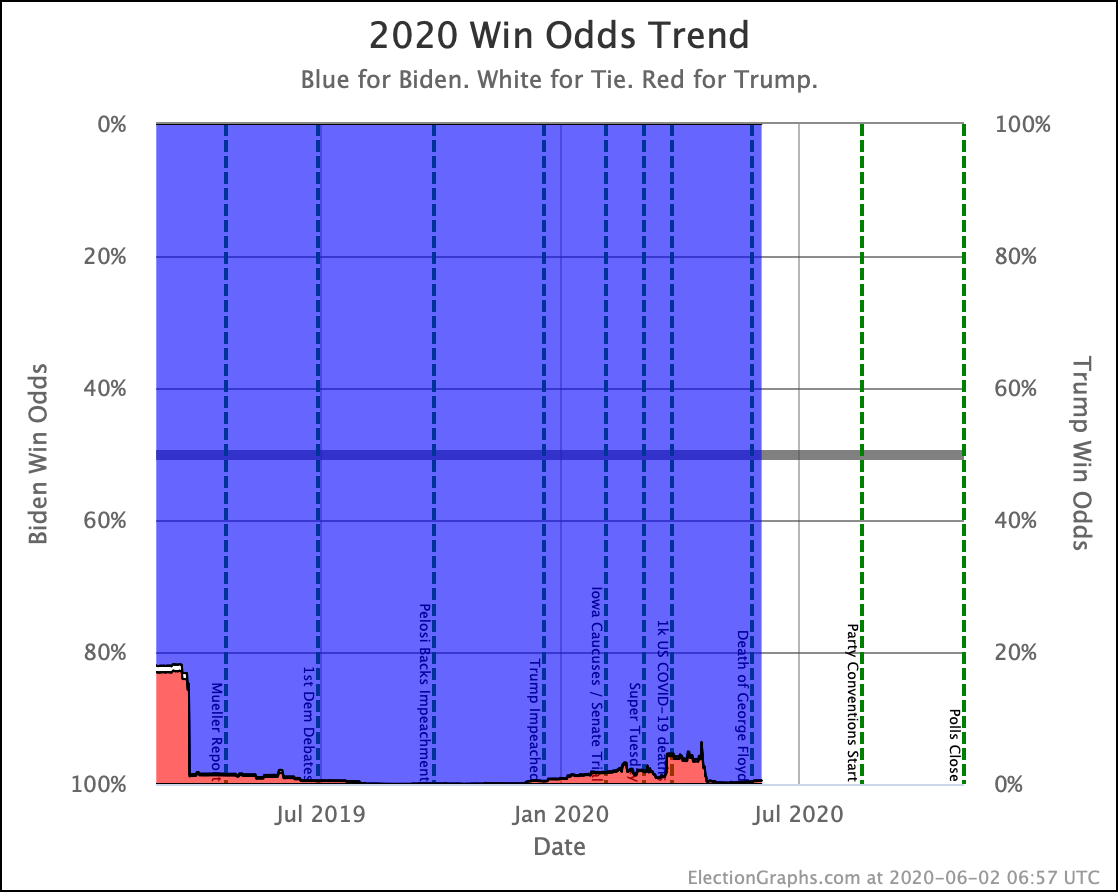
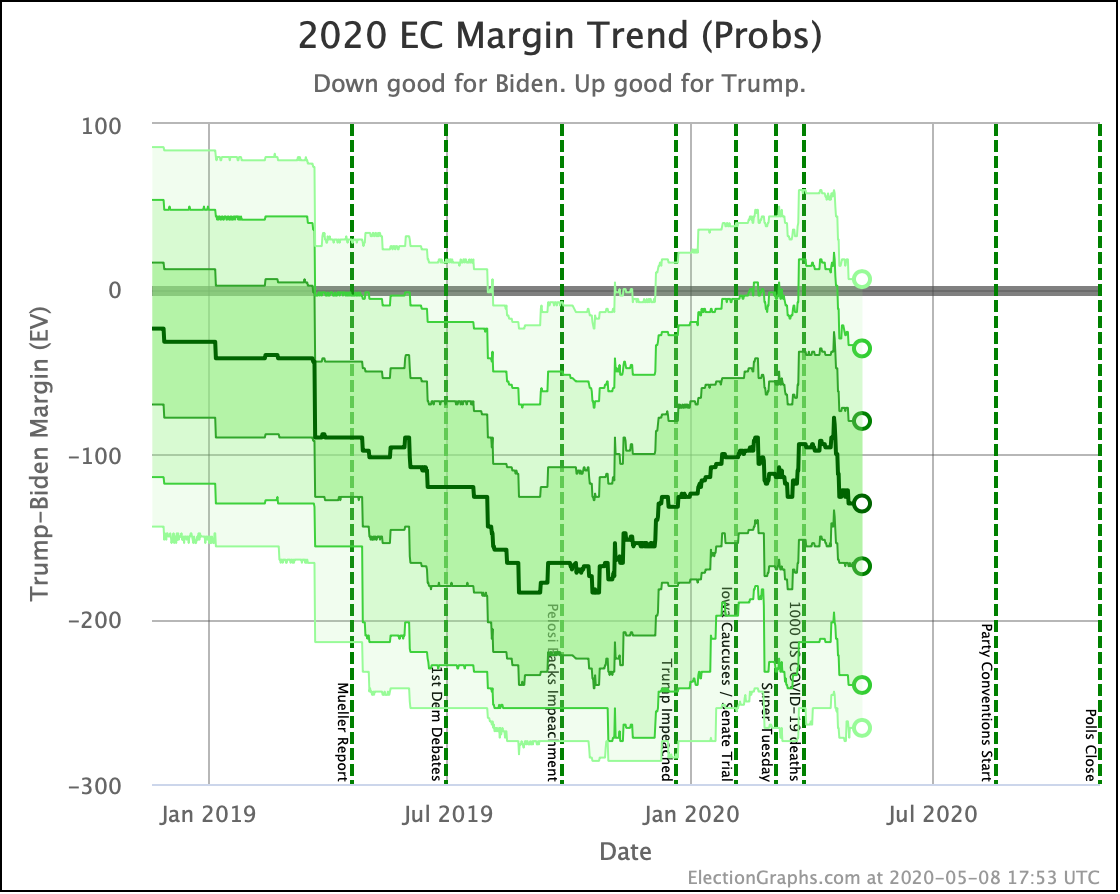
Putting all of this together into our probabilistic model, you get this trend:
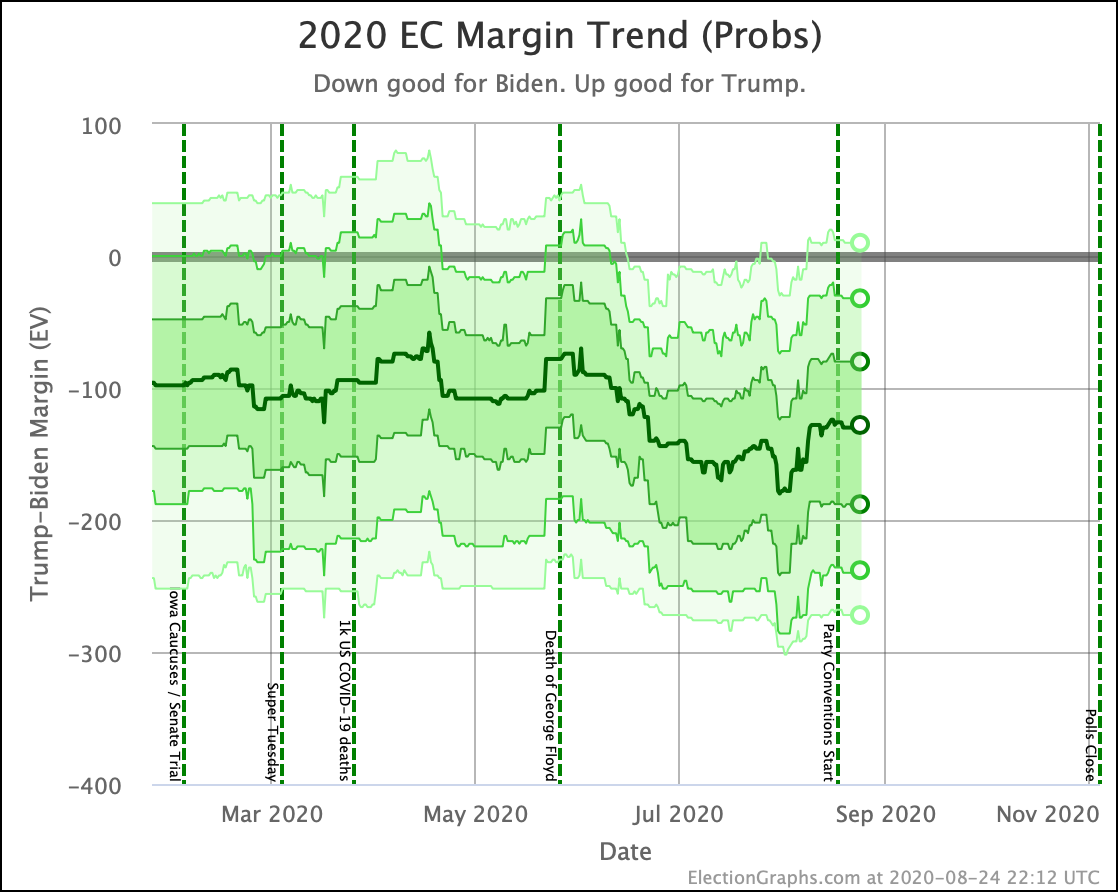
Looking at the center median line, where half the simulated election results were better for Biden, and half were better for Trump, Biden's most recent peak was a 180 electoral vote margin on July 31st. Biden's lead in that case is now down to only a 128 EV margin. This is down another 24 from last week.
Clearly the recent movement has been in Trump's favor. Biden's lead is still substantial though. And unlike the categorization view, it is still stronger than it was in the spring. But Trump has clearly bounced back from his July lows.
Other averages, such as Trump's approval ratings, or Trump vs Biden national polling have followed similar patterns. Namely, after a low point for Trump in June or July, the averages have reverted to more typical numbers.
As the campaigns go into high gear, the question is if the race will stay within the basic range we have seen so far this year, or if one or the other of the candidates will be able to break out.
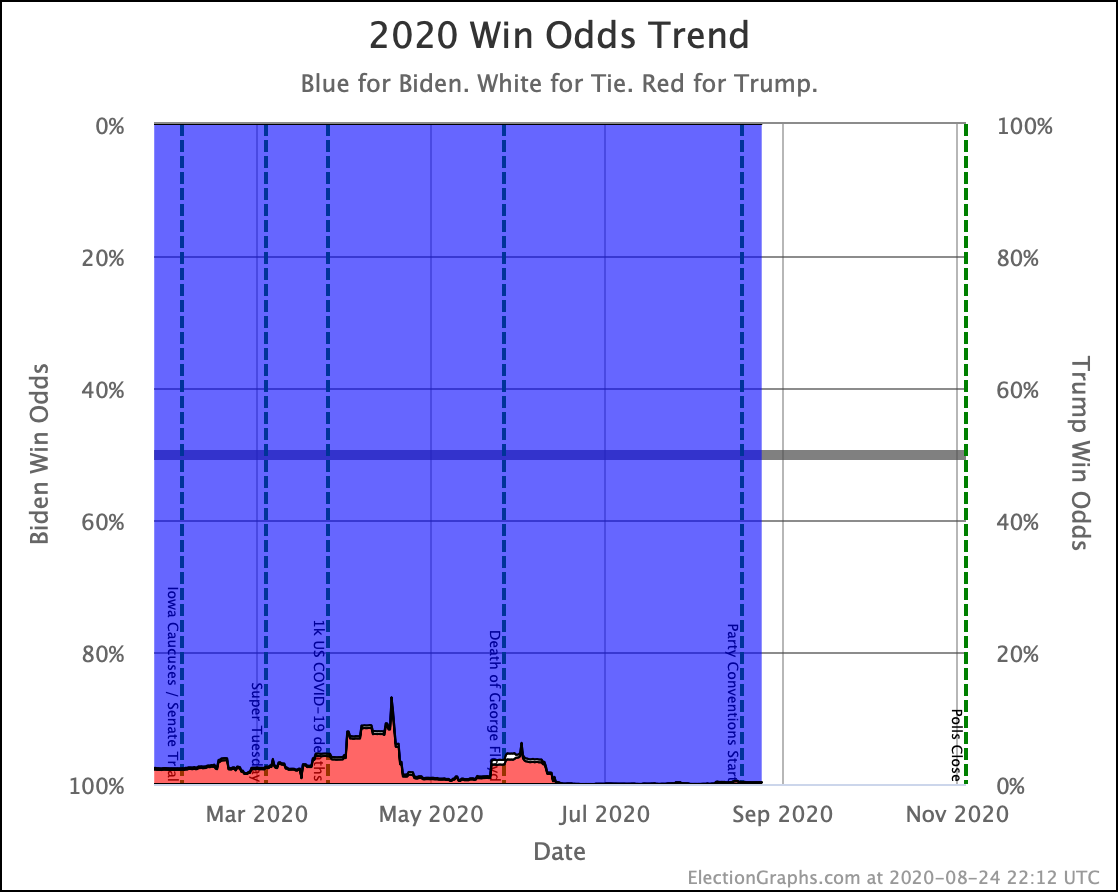
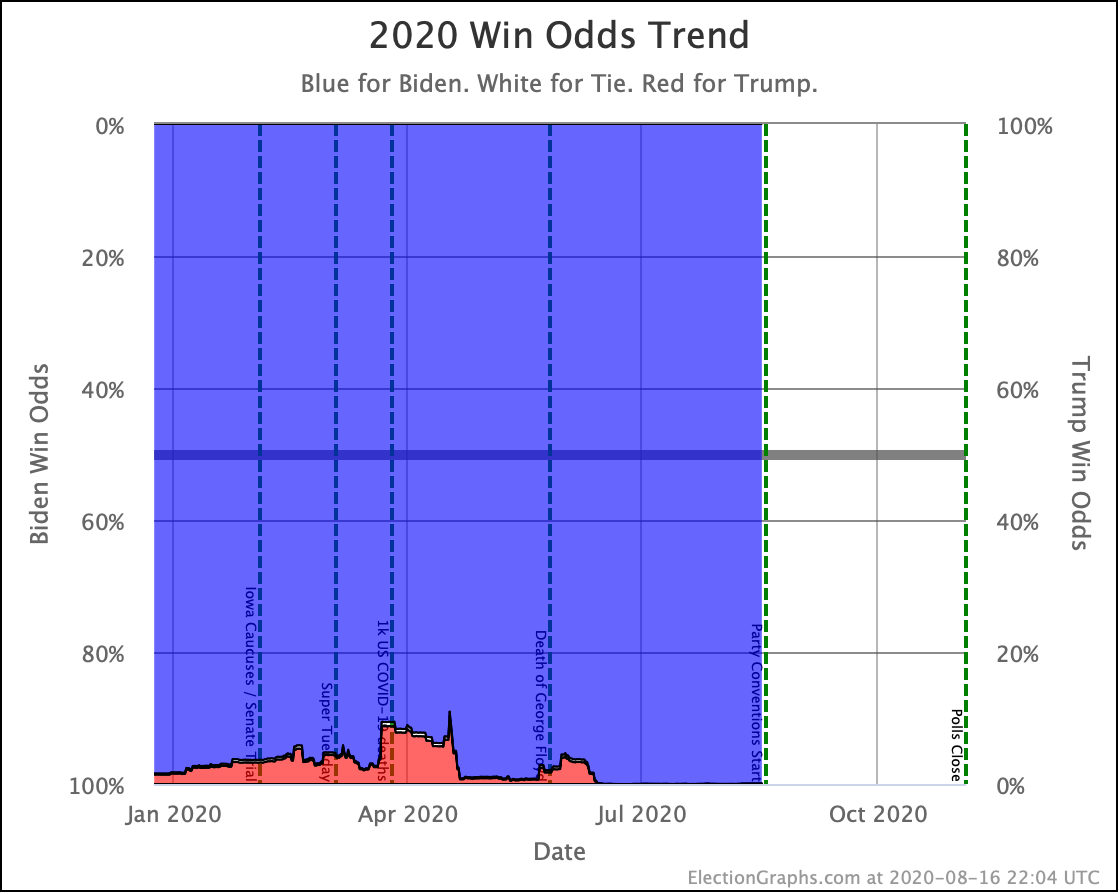
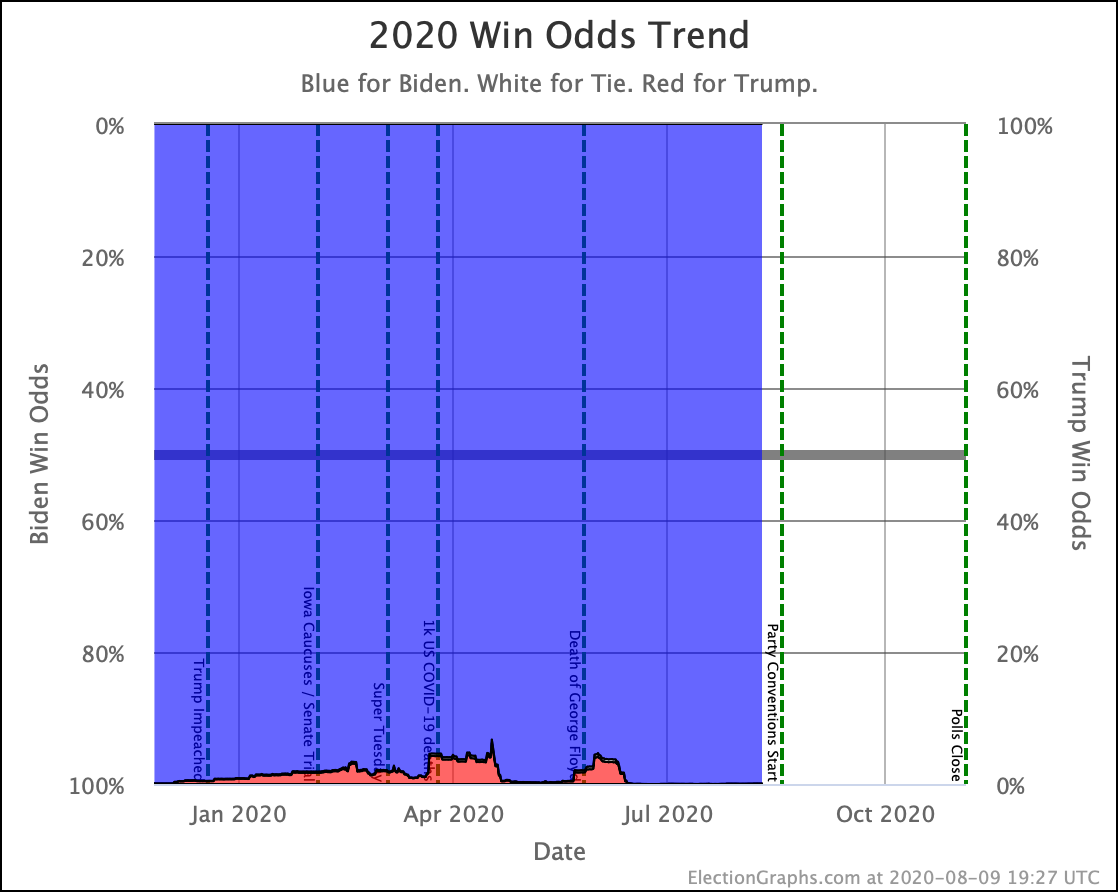
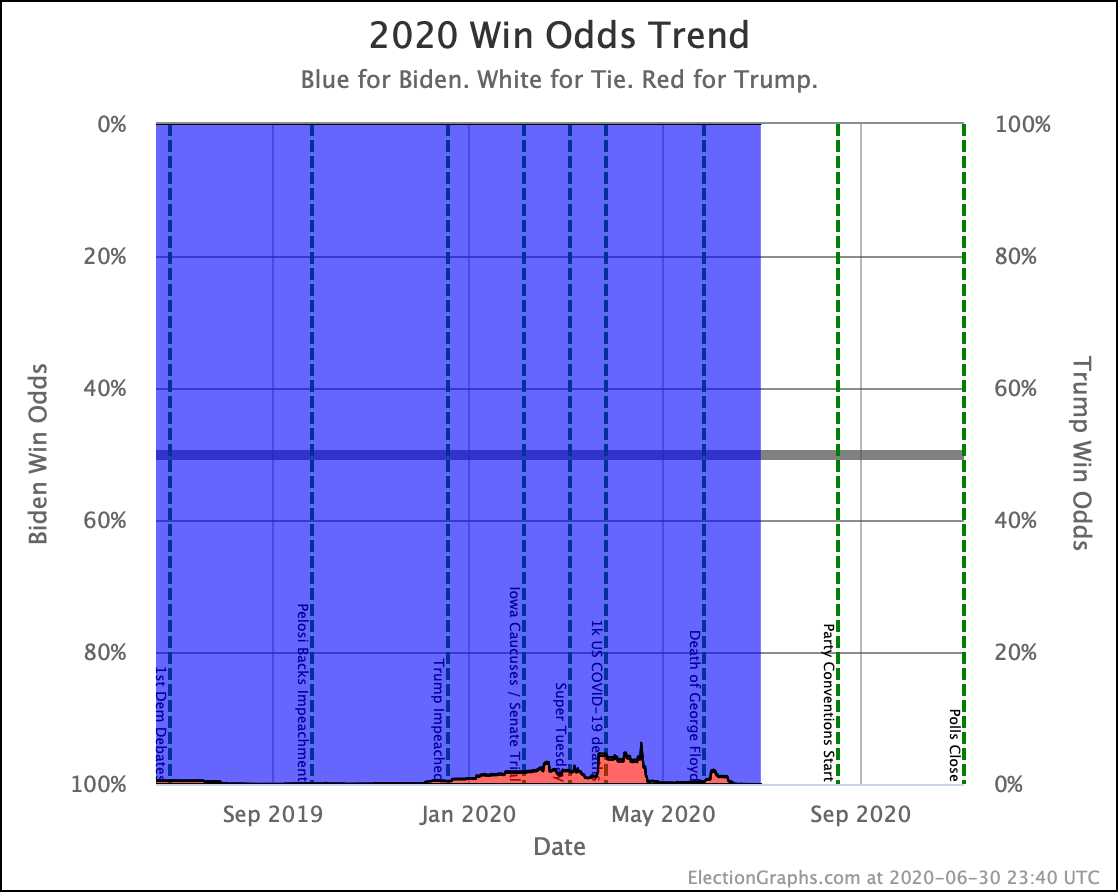
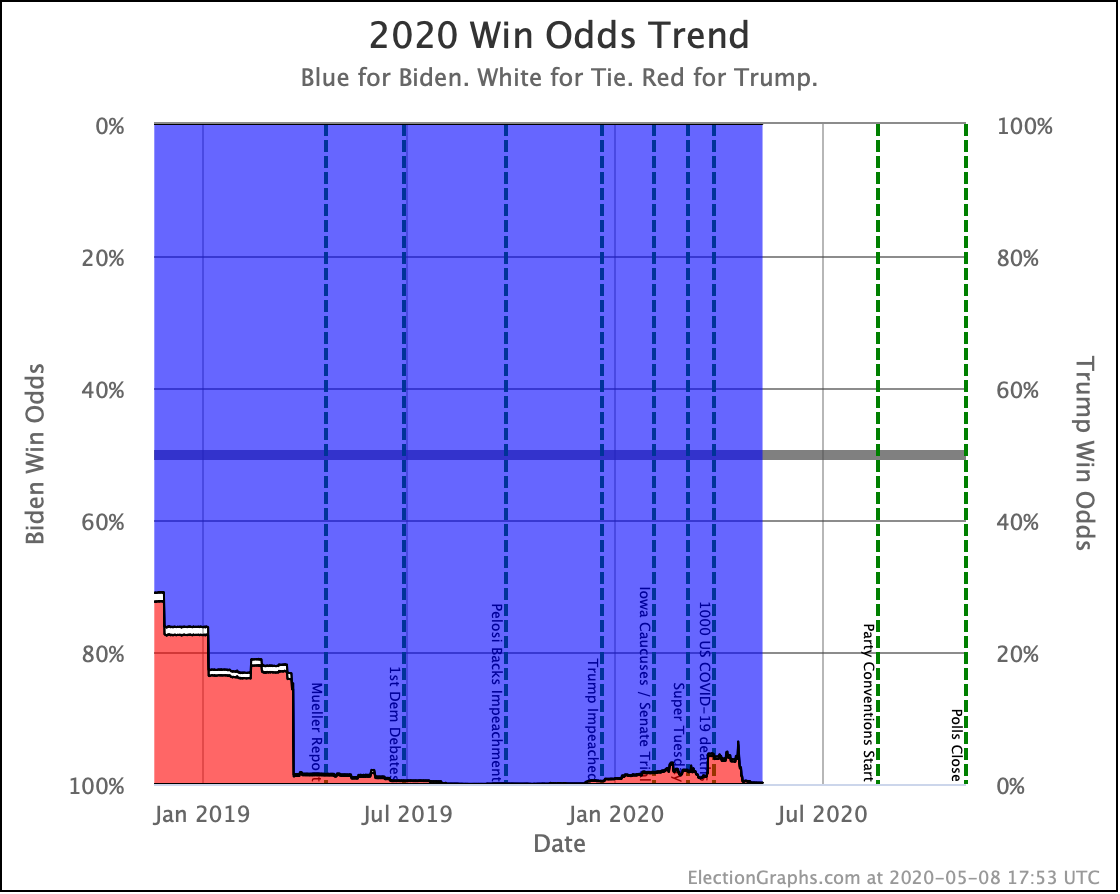
My simulations still have Biden at a 99.7% chance to win if the election was today. (The election is not today.)
This is a very asymmetric situation. Trump needs to move things significantly in his direction to win. Biden just needs to hold his current lead. If Biden actually improves his situation, it doesn't change the outcome, it just increases Biden's margin.
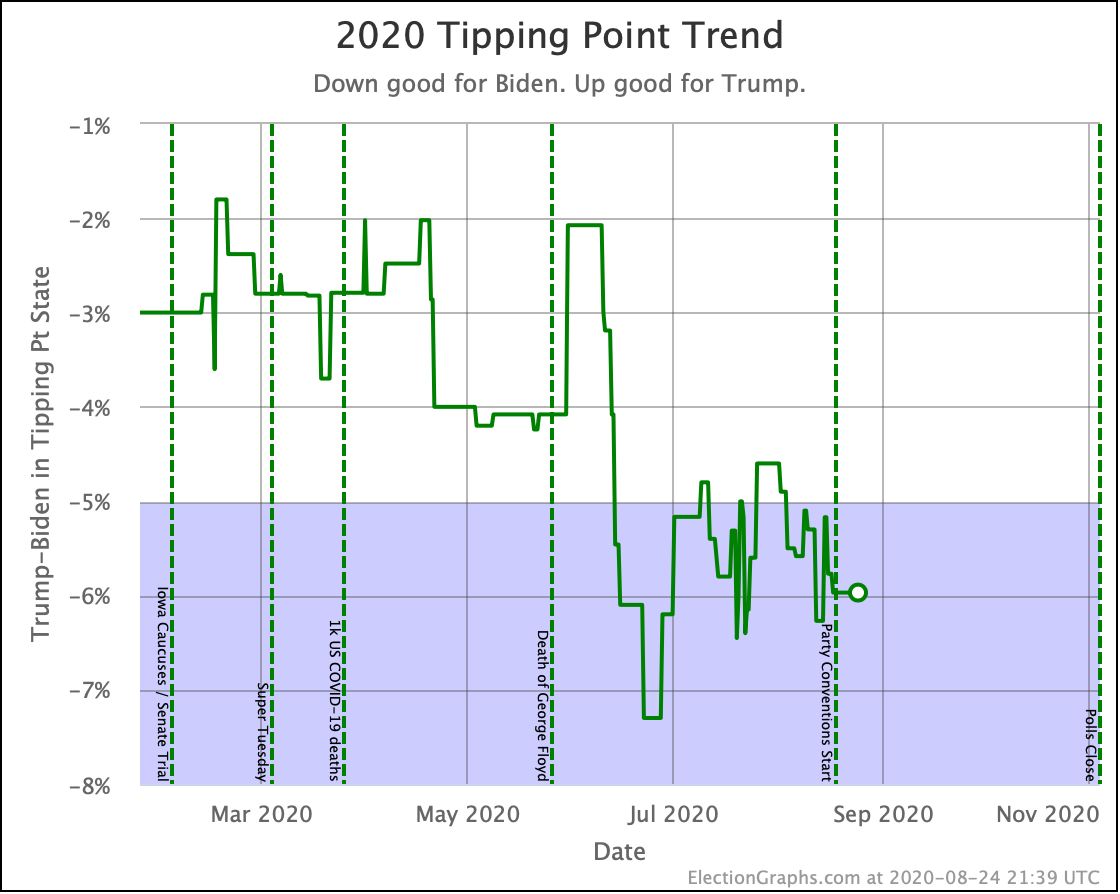
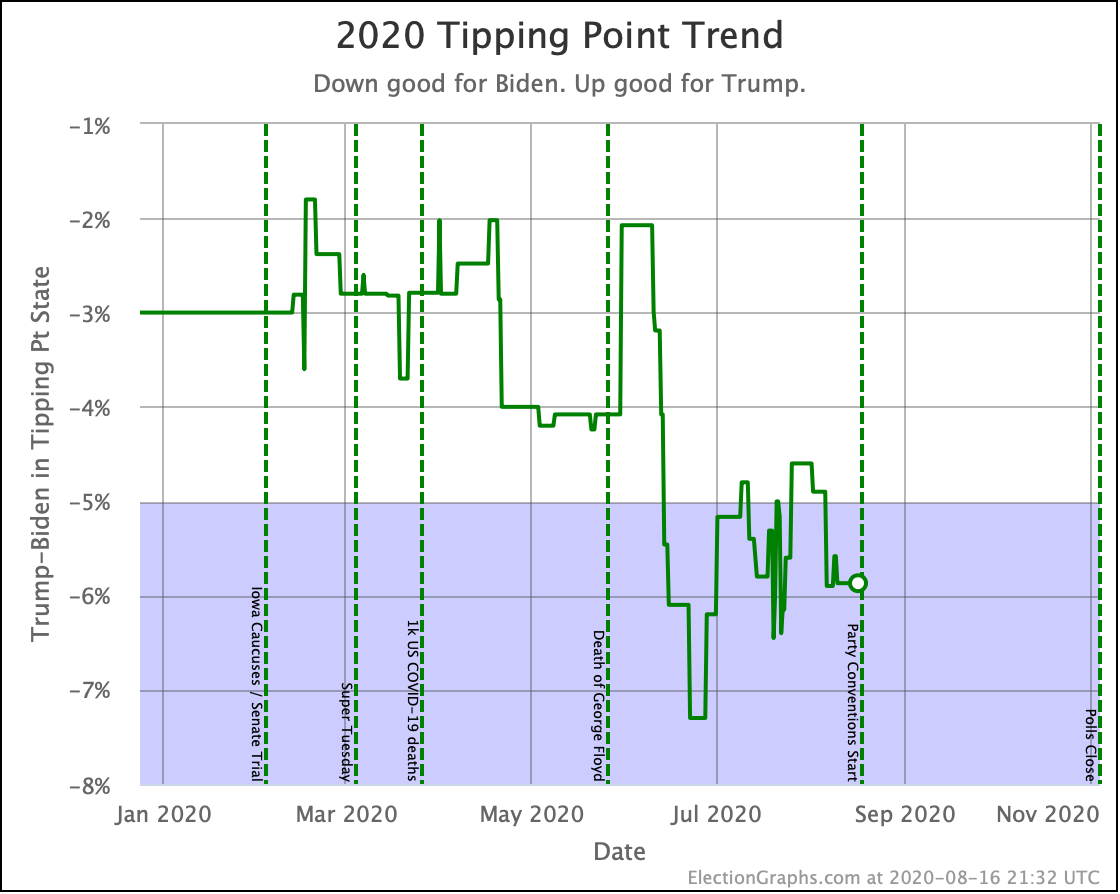
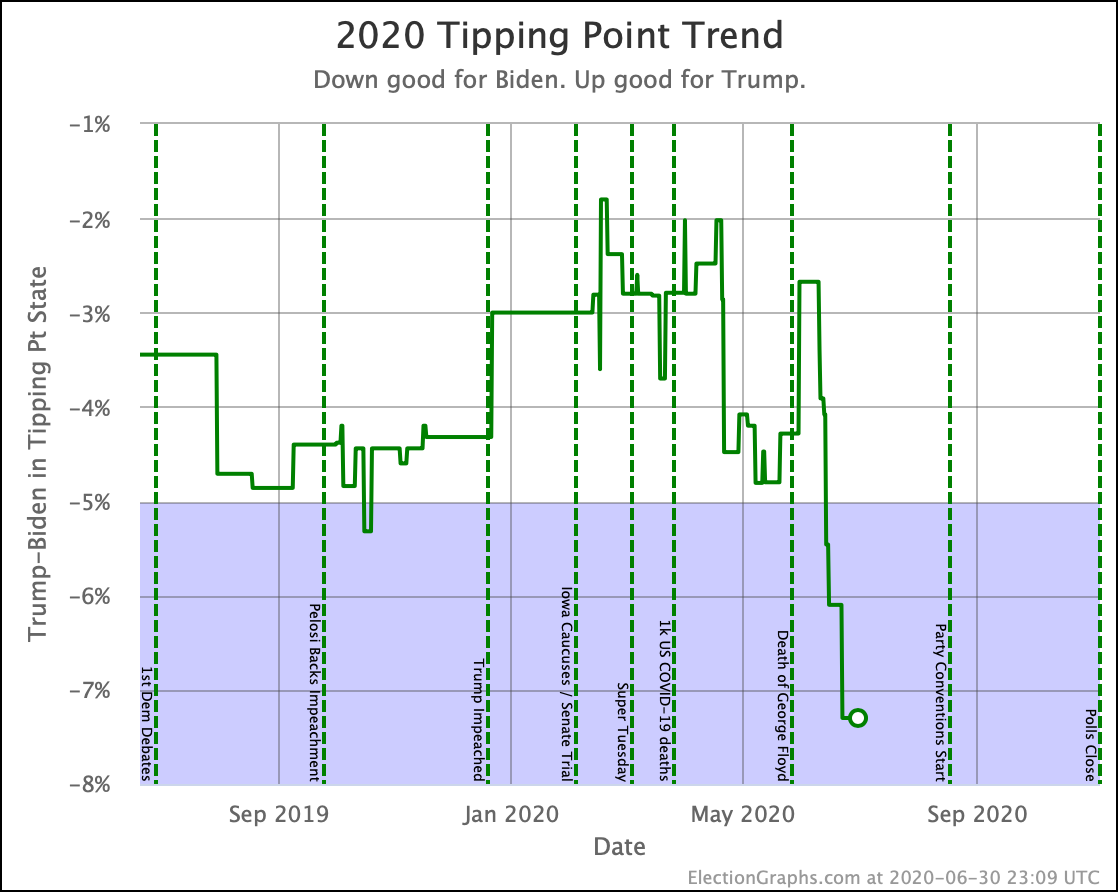
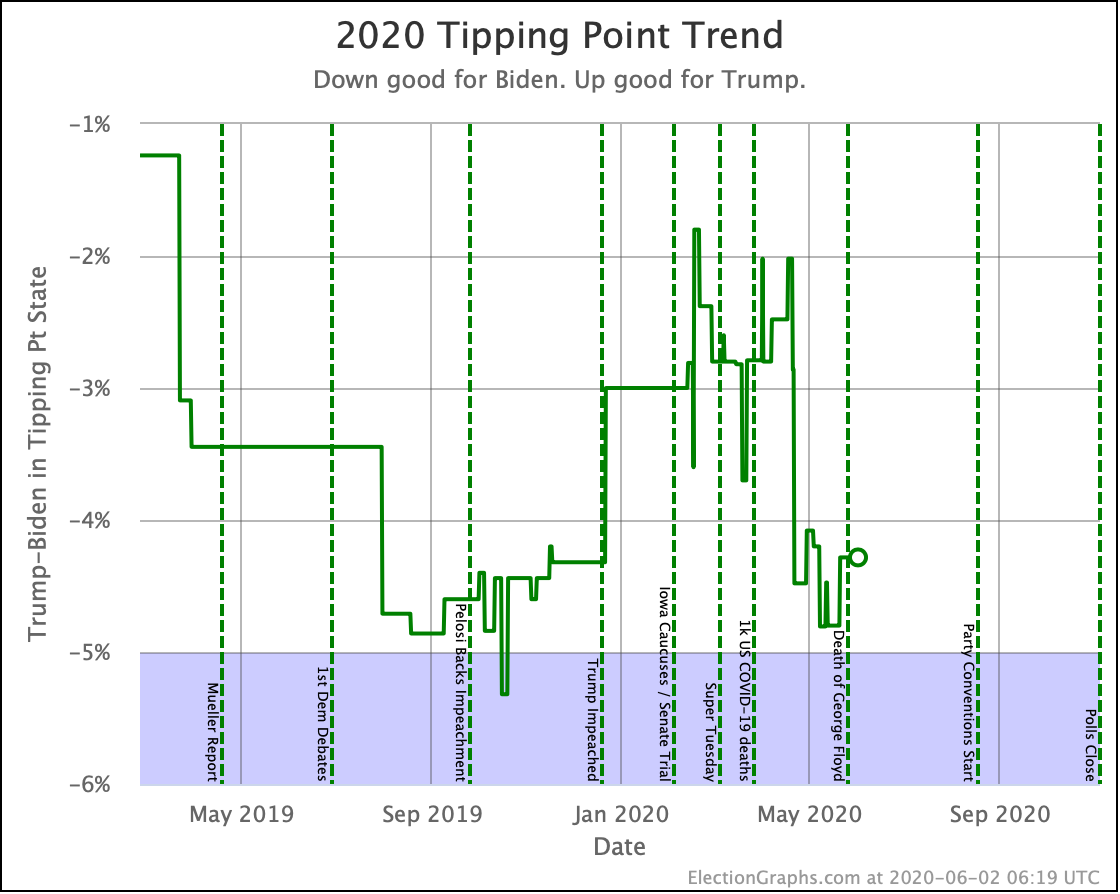
Biden's tipping point lead is now 6.0%. This number represents how much polls would have to change nationally to flip the winner if the change was uniform across all states.
The RCP average of national polls is currently at a 7.6% Biden lead. This implies that the structure of the electoral college is currently giving Trump a 1.6% head start, which is unchanged from last week.
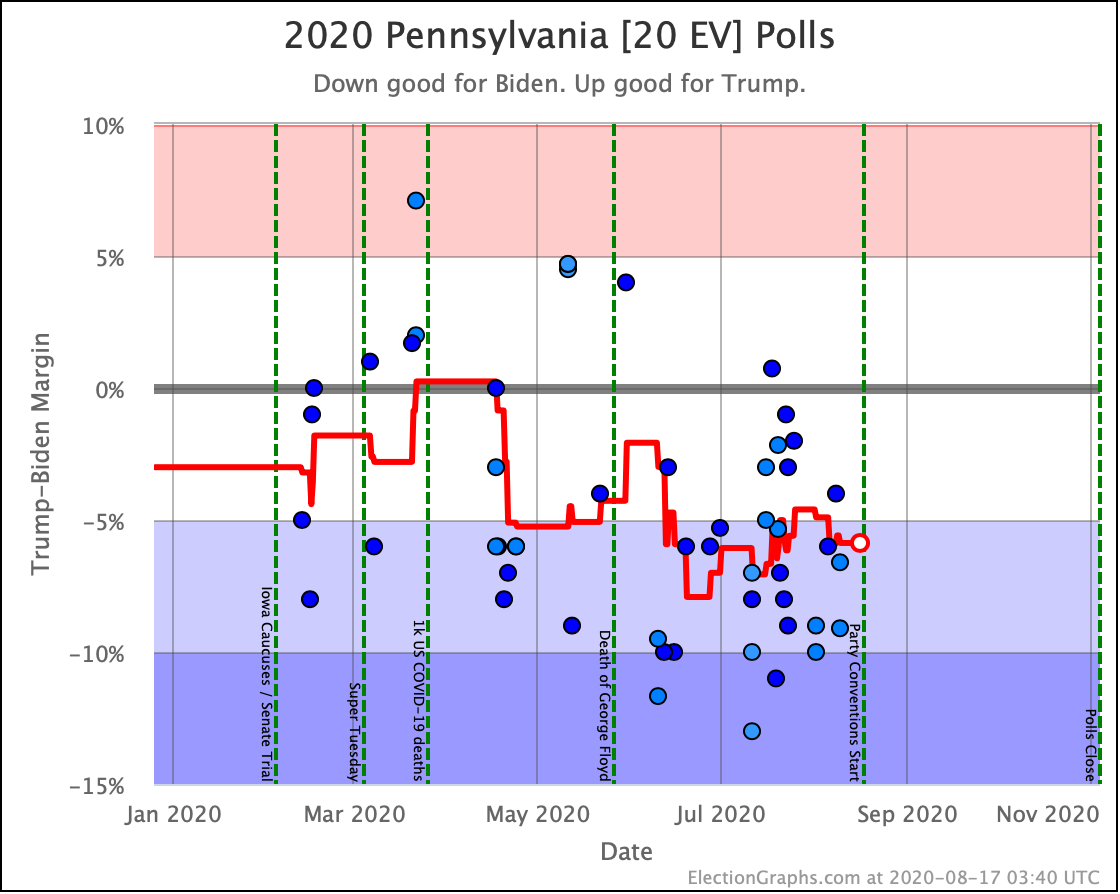
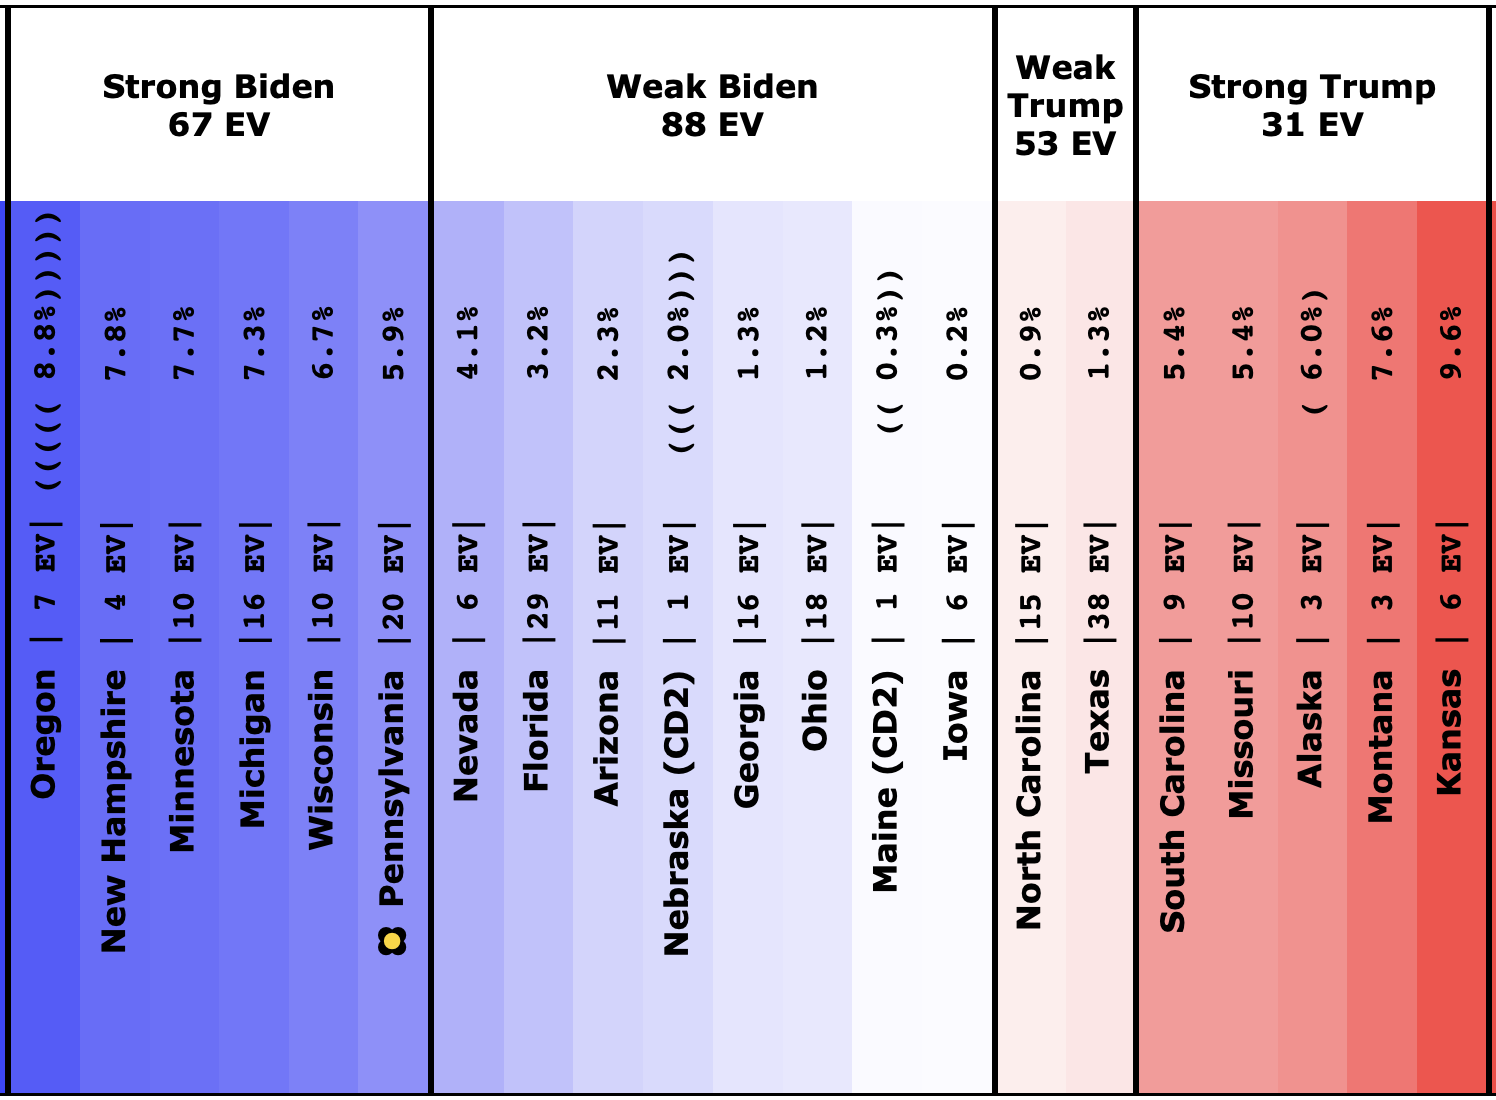
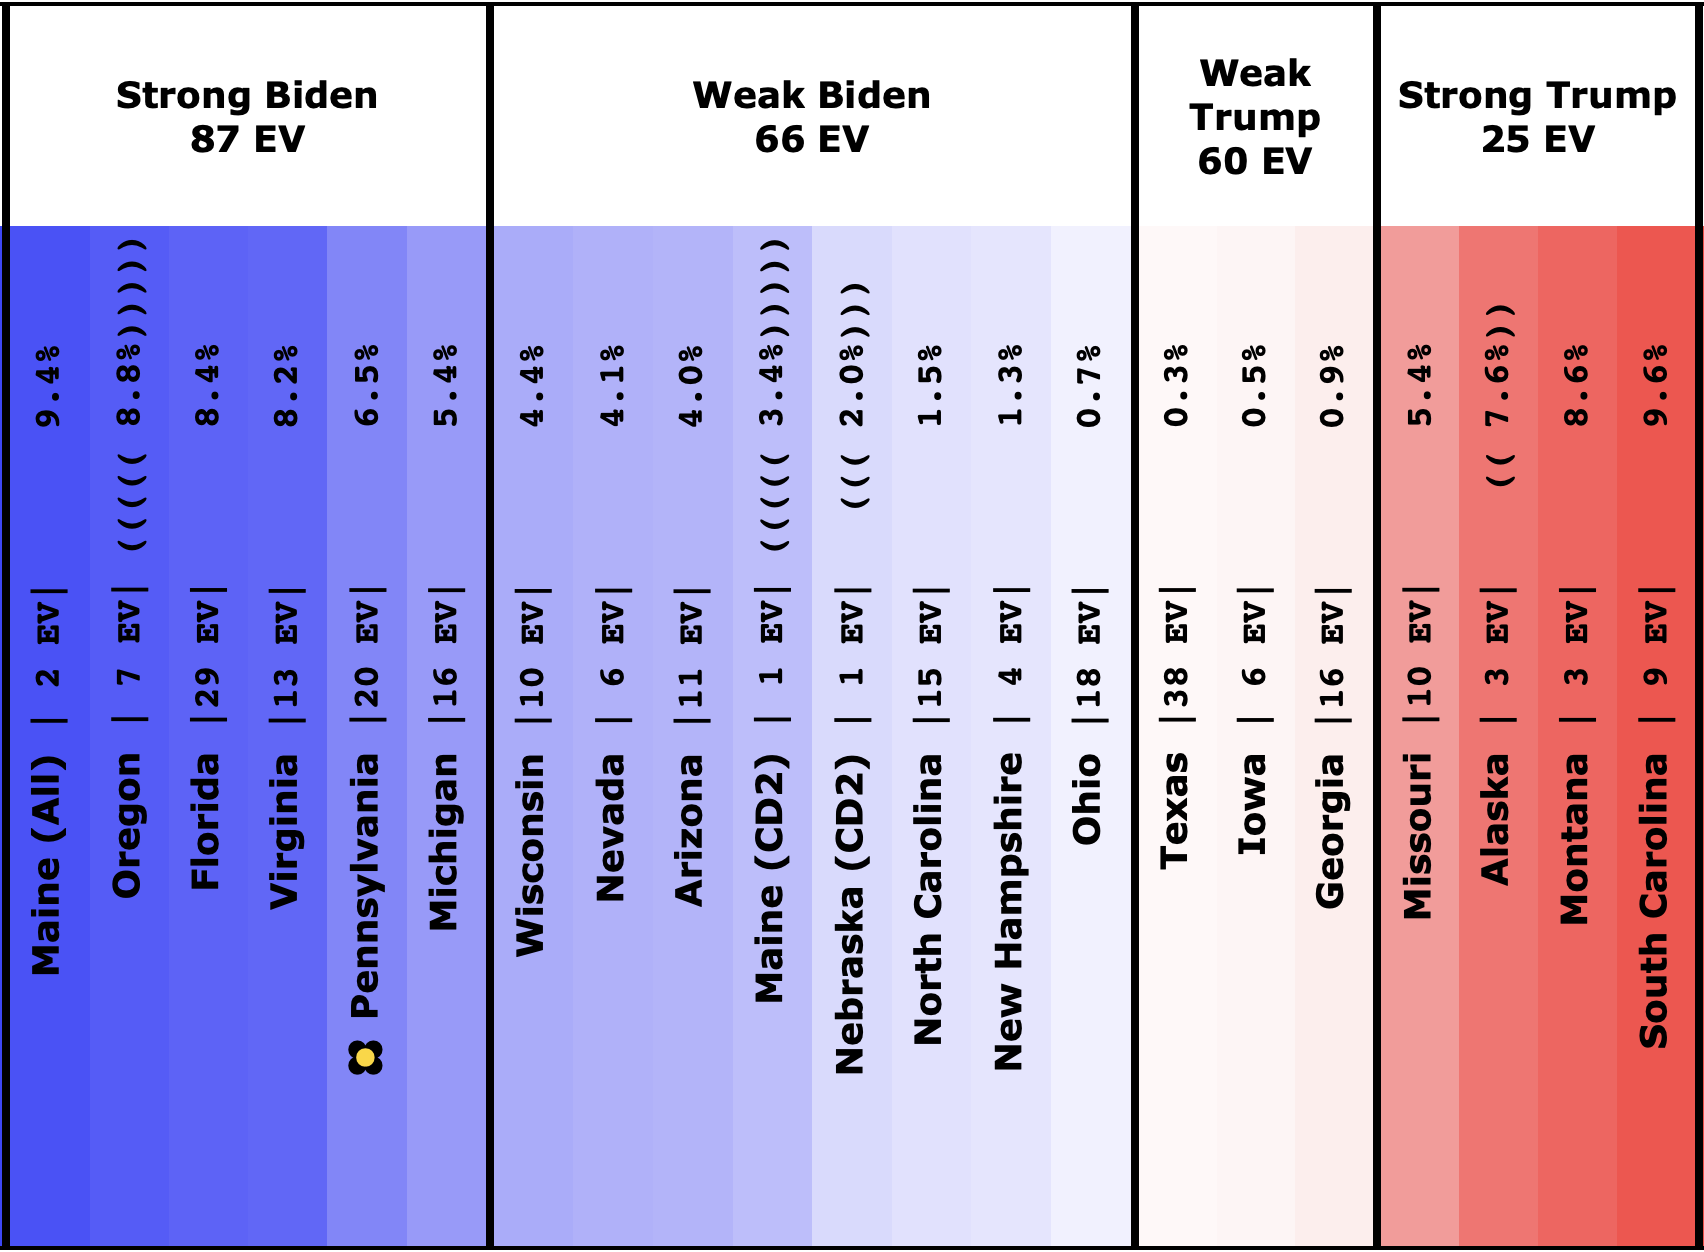
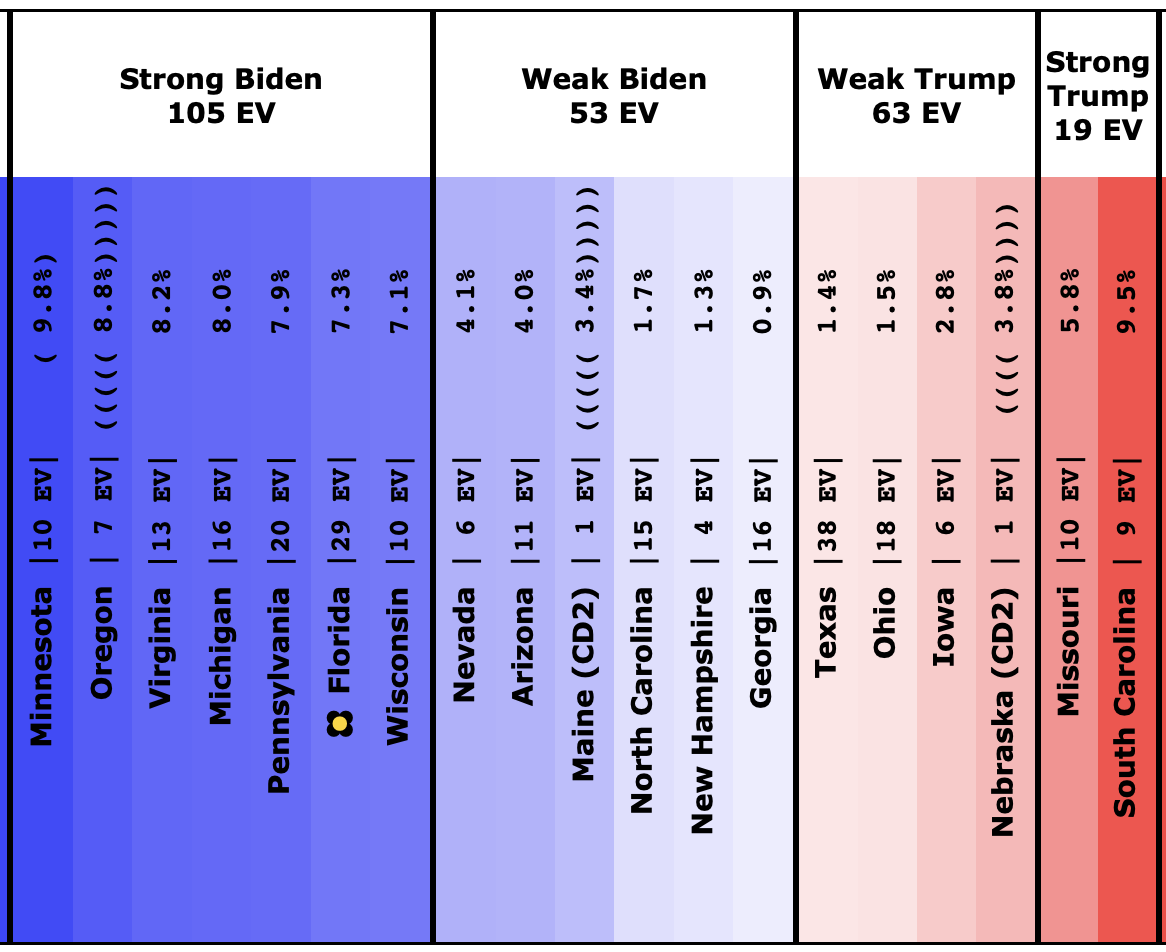
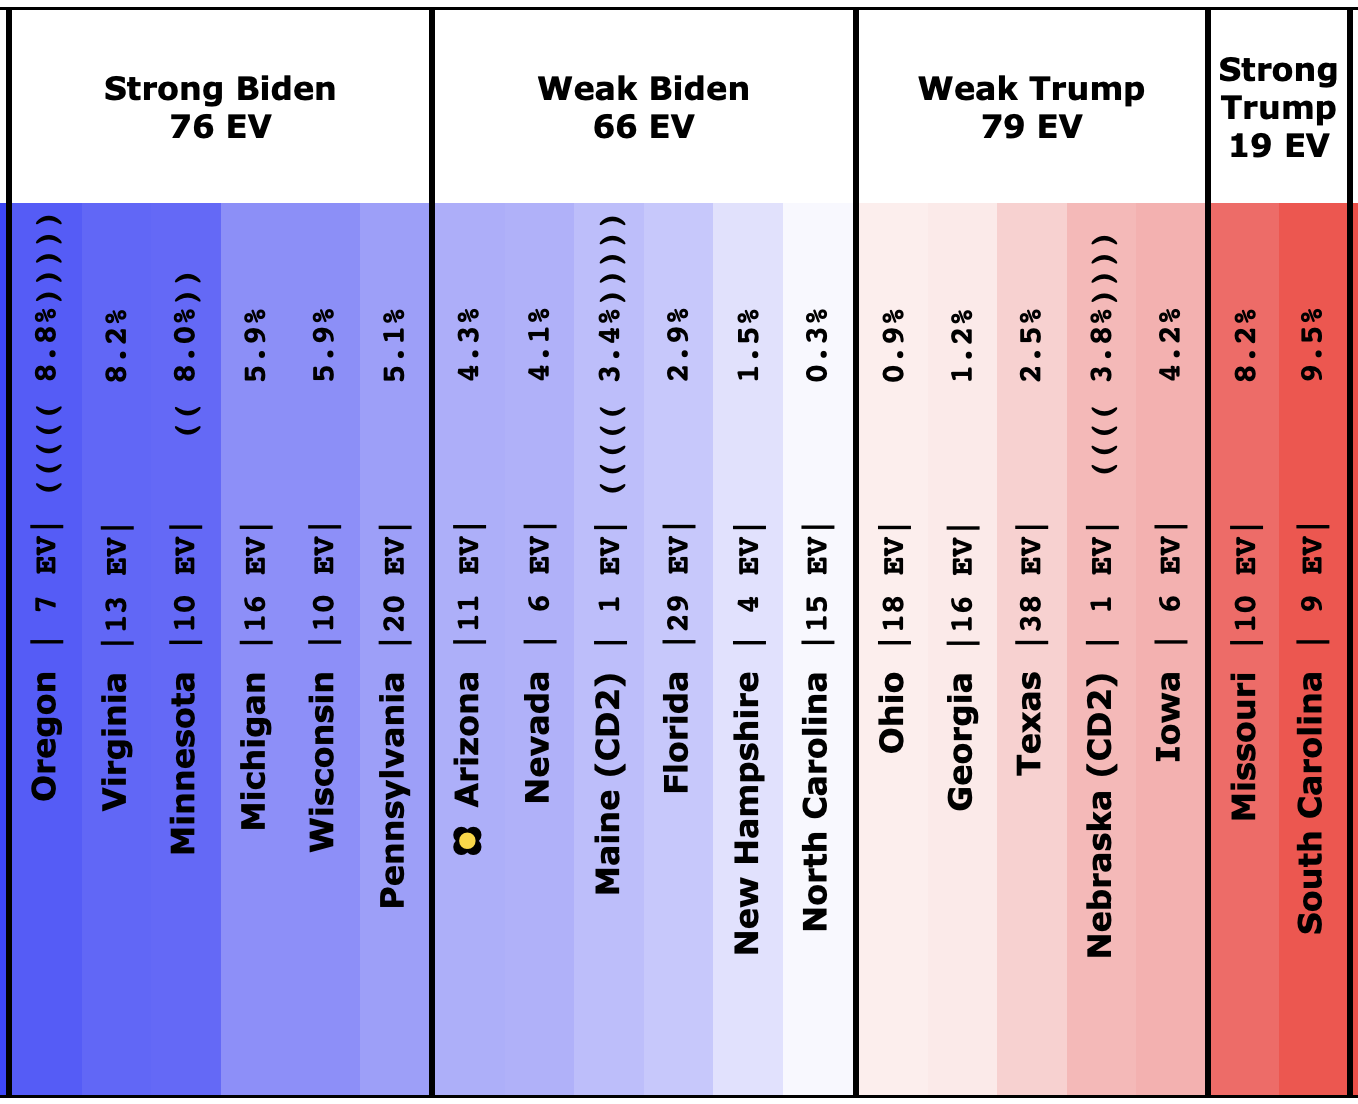
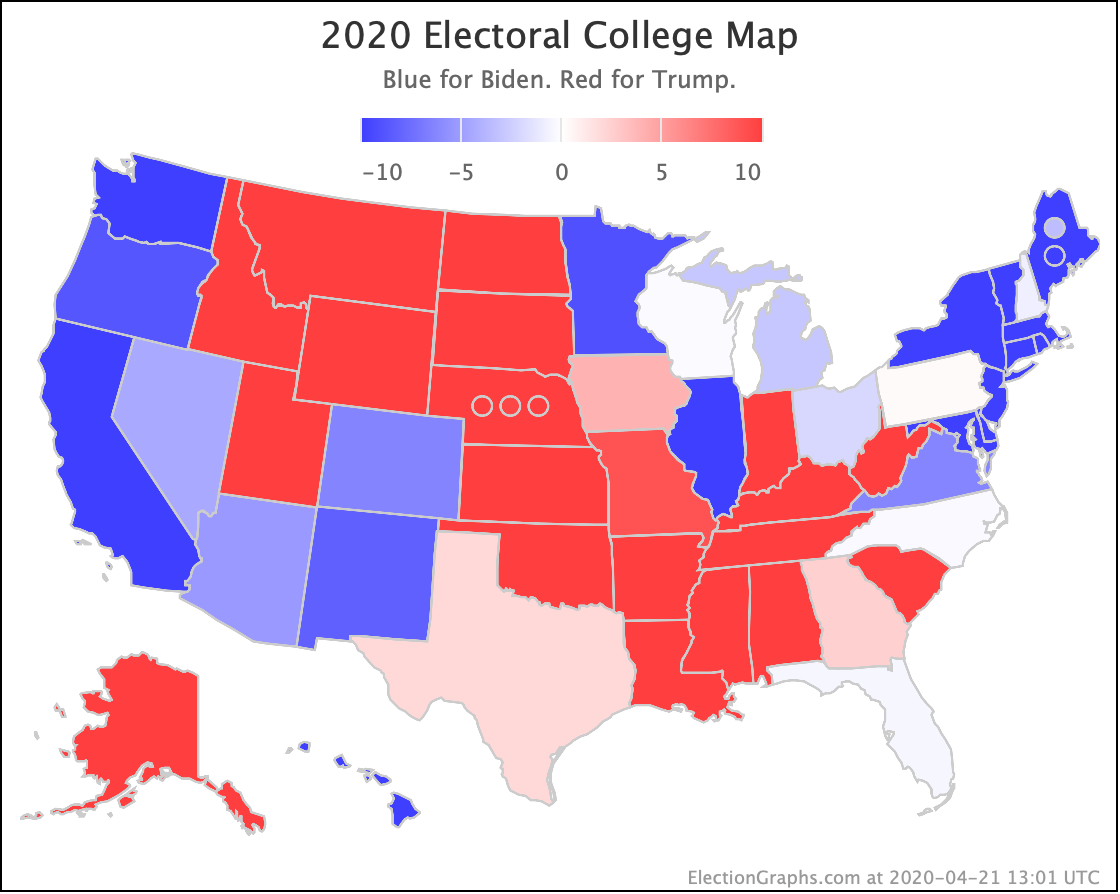
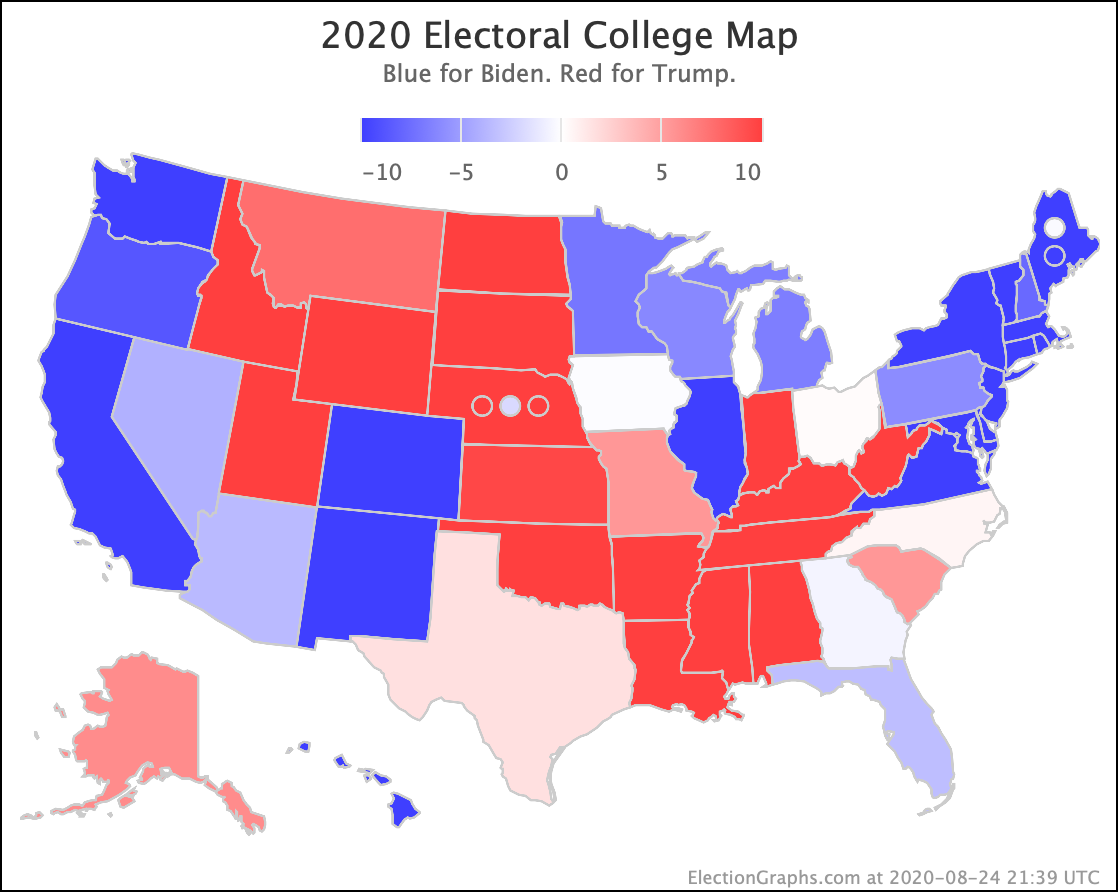
The spectrum of states where the margin is less than 10% now looks like this:
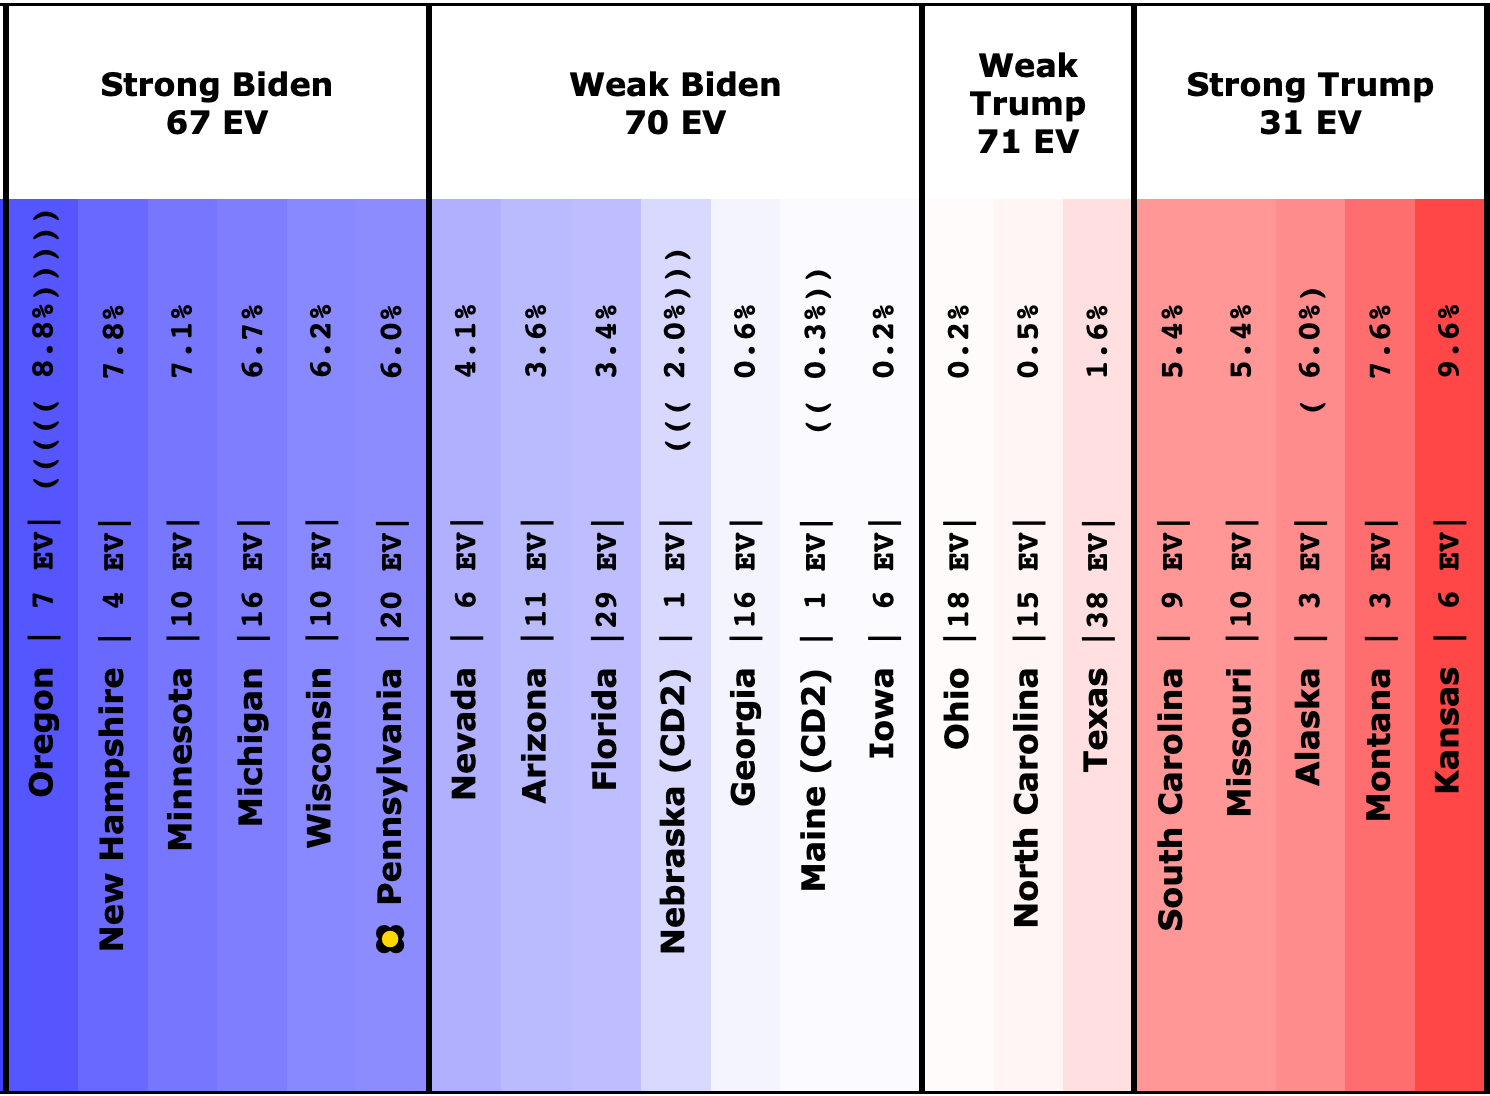
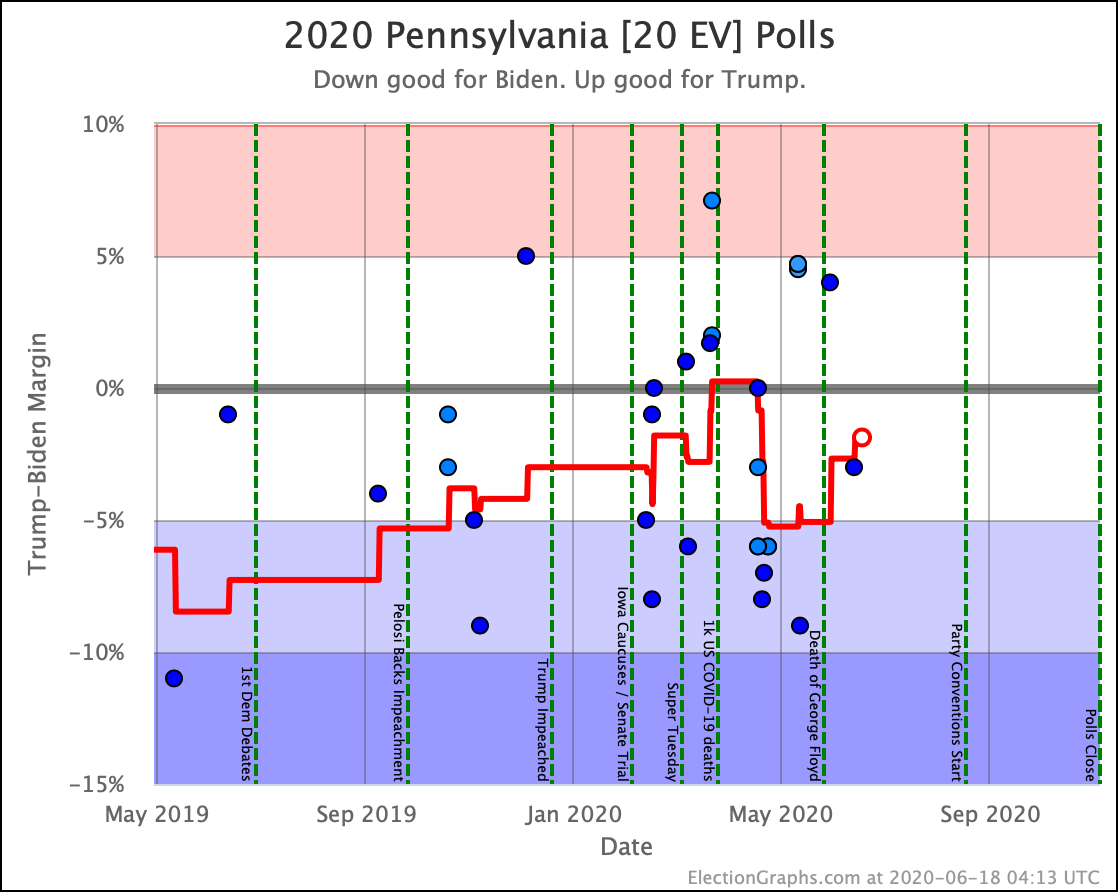
As was the case last week, in order to win Trump needs to win ALL of the close states… plus Pennsylvania.
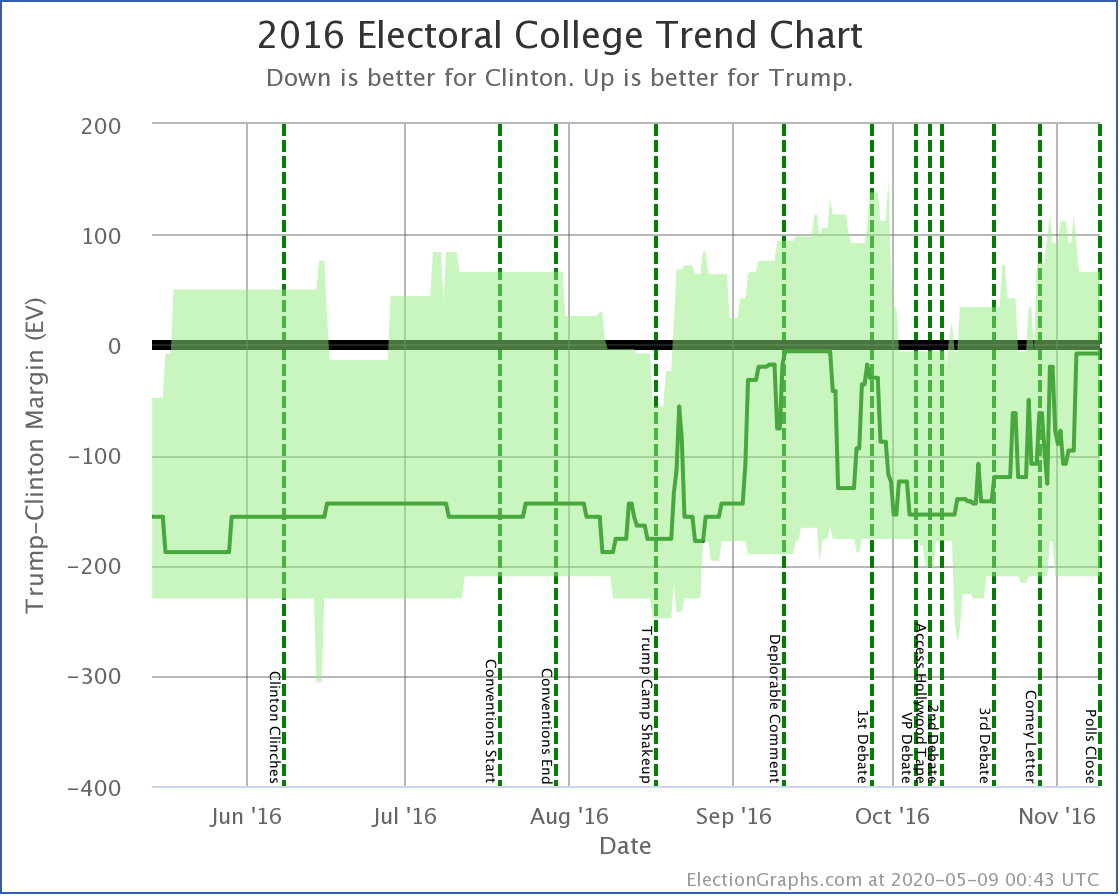
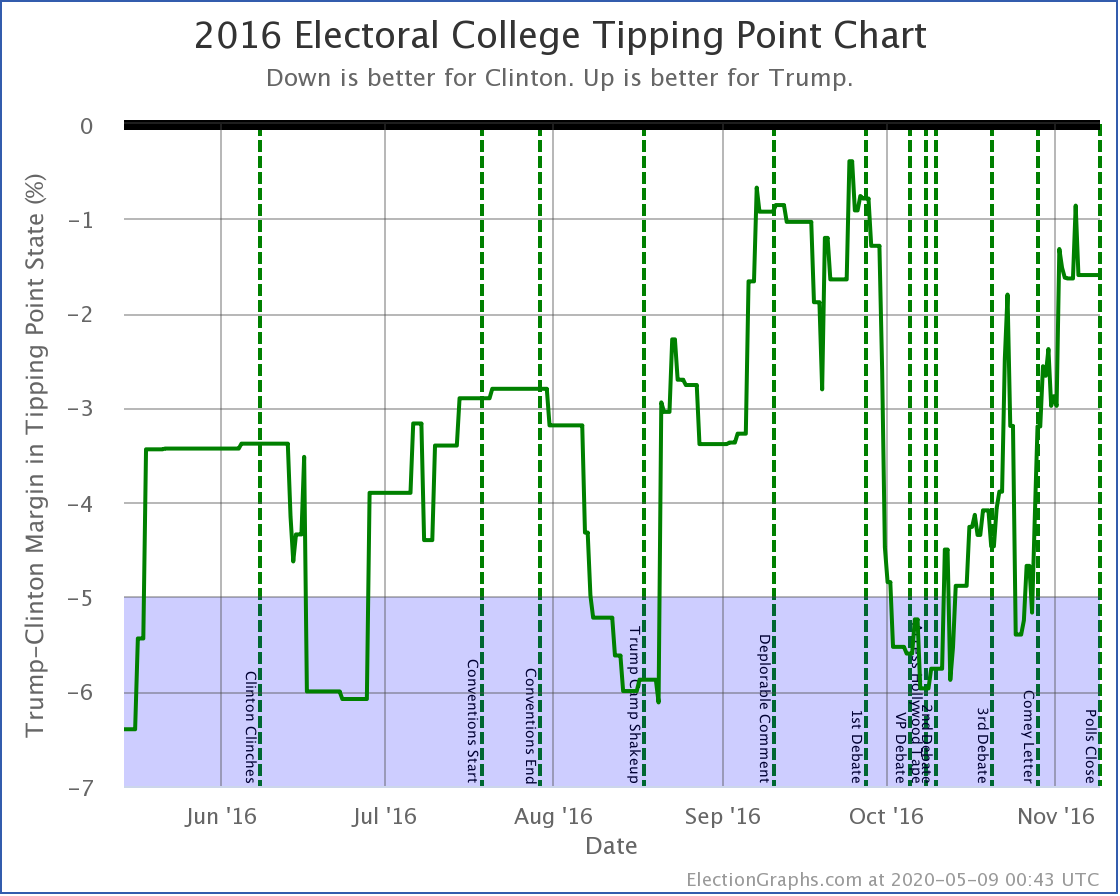
Now comparing to this time in 2016:
| <71 Days Out> | 2016 | 2020 |
|---|---|---|
| Expected Case | Clinton by 144 | Biden by 146 |
| Tipping Point | Clinton by 3.4% | Biden by 6.0% |
Biden is doing very slightly better than Clinton was in the "Expected Case" 71 days before the election but is doing considerably better with the tipping point.
The best Clinton saw in the Expected Case in the last 71 days was a 154 electoral vote margin in October. Biden is currently weaker than that.
Clinton's best Tipping Point in the last 71 days was 6.0% though. Biden currently matches that. But it is key to remember that Clinton's 6.0% tipping point maximum was in October, and it completely evaporated in the last month before the election.
Things can and do change based on breaking news. Biden is way ahead at the moment. If the election was today, Biden would almost certainly win.
But there are 70.7 days left to go.
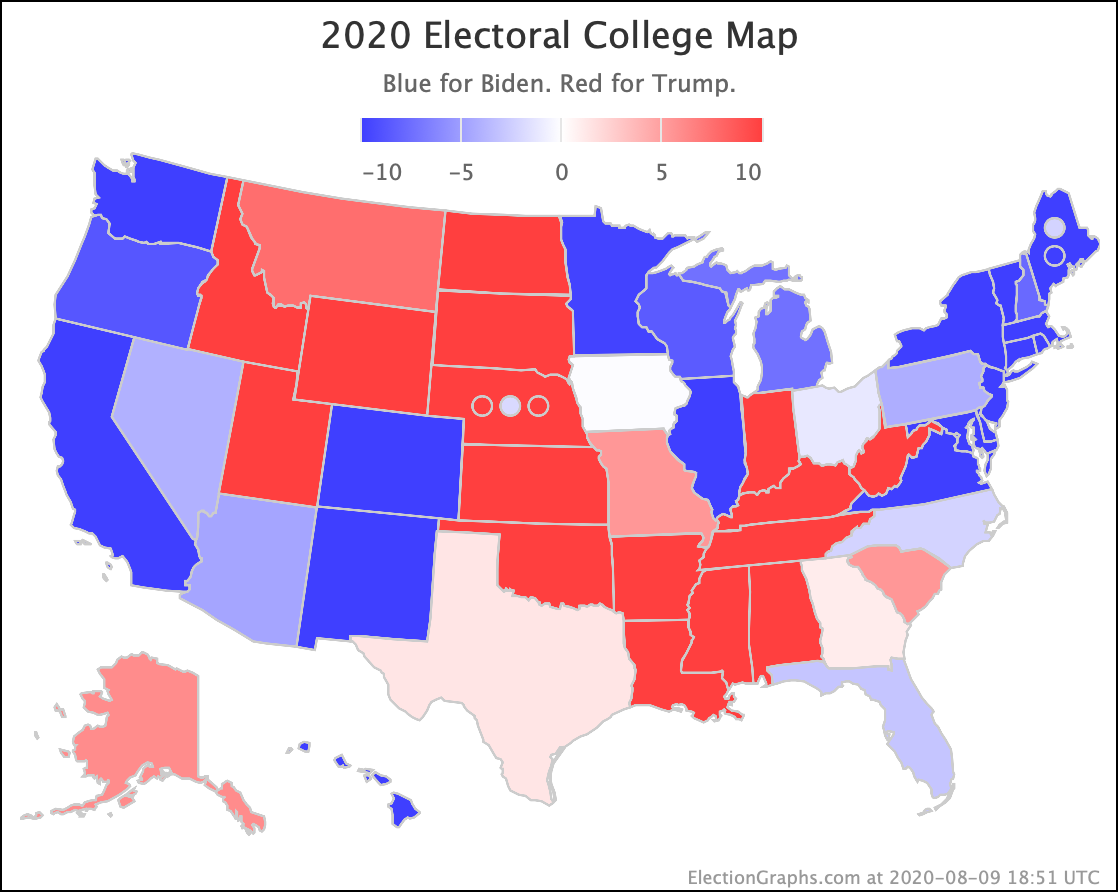
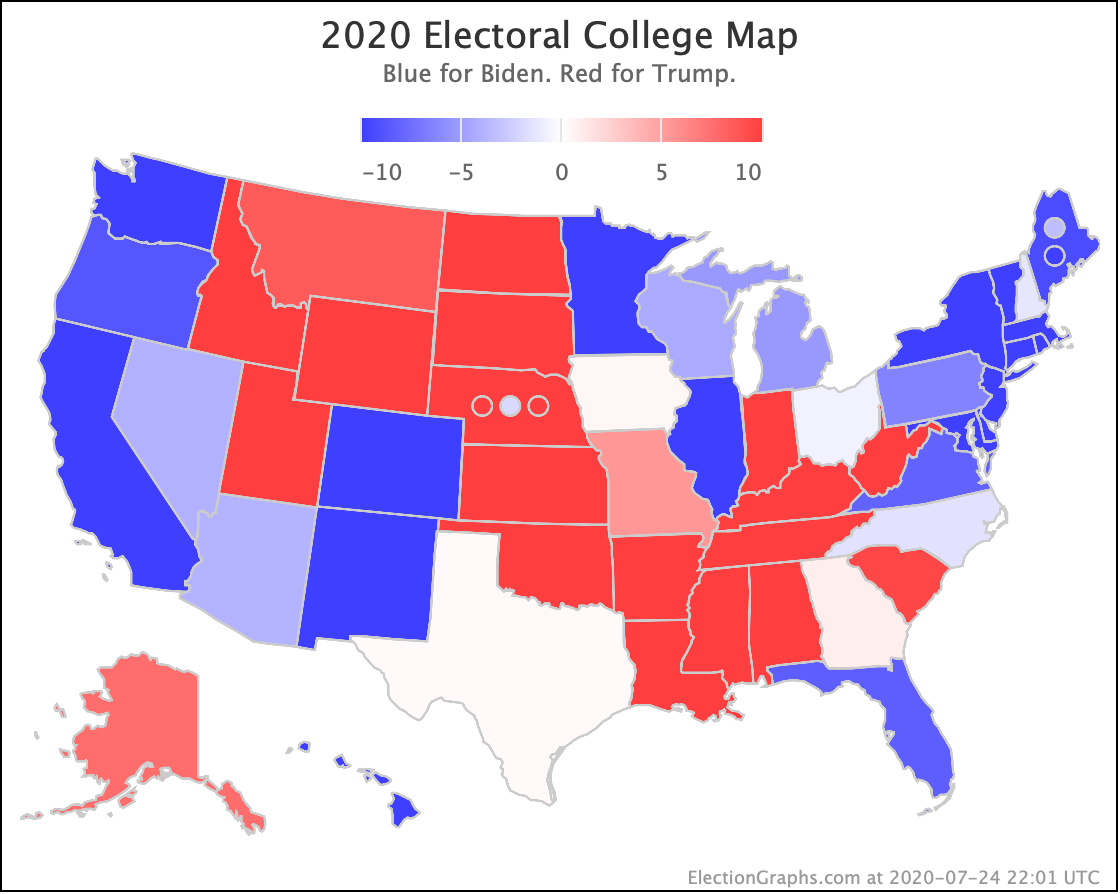
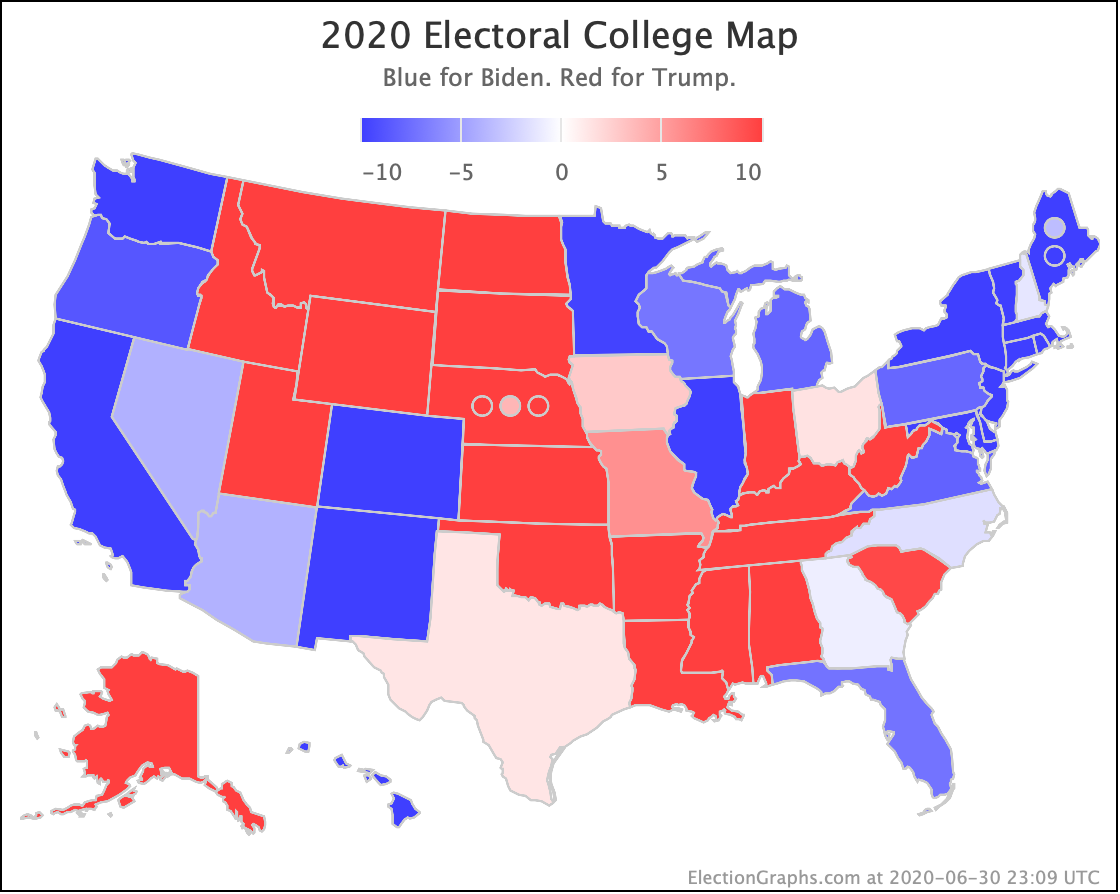
The map below is where things stand today, but there WILL be more ups and downs before the end. Keep watching!
For more information:
This post is an update based on the data on the Election Graphs Electoral College 2020 page. Election Graphs tracks a poll-based estimate of the Electoral College. The charts, graphs, and maps in the post above are all as of the time of this post. Click through on any image for current interactive versions of the chart, along with additional details.
Follow @ElectionGraphs on Twitter or Election Graphs on Facebook to see announcements of updates. For those interested in individual poll updates, follow @ElecCollPolls on Twitter for all the polls as I add them. If you find the information in these posts informative or useful, please consider visiting the donation page.