Goodbye Blue Texas

It has once again been longer than I like, but it is time for another post.

Since the last update, there have been new polls in Michigan (x3), Nevada (x2), Texas (x2), Arizona (x2), Pennsylvania (x3), Florida (x2), North Carolina (x3), Wisconsin (x2), Iowa, Georgia (x4), and New Hampshire.

That is a lot. Sorry about that. Oops.

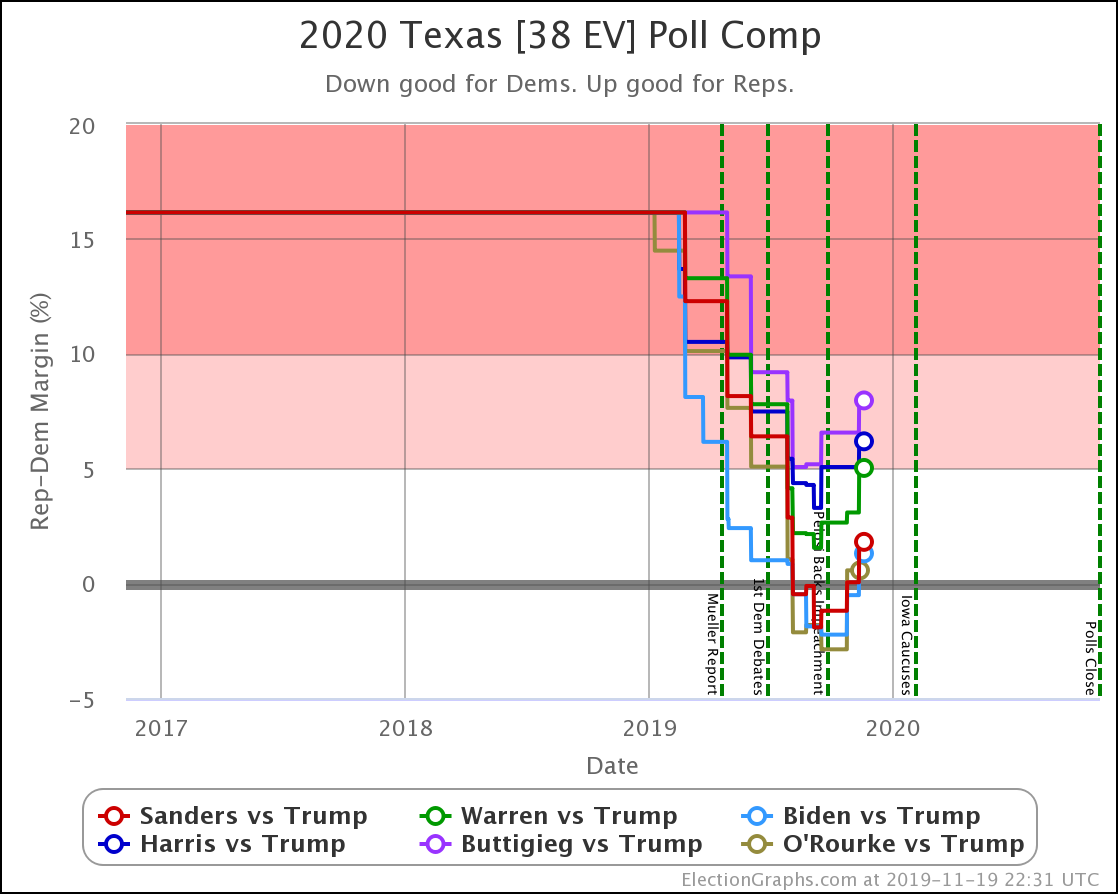
The most striking individual state result is that after peaking in September with three of the top six Democrats leading Trump in the Texas averages, and two more getting close, Texas has been moving back toward Trump.

As of now, none of the six most polled Democrats lead in Texas, and only three of those keep Trump's lead to less than 5%. And one of those (O'Rourke) has already dropped out of the race, leaving only Sanders and Biden still making it close.

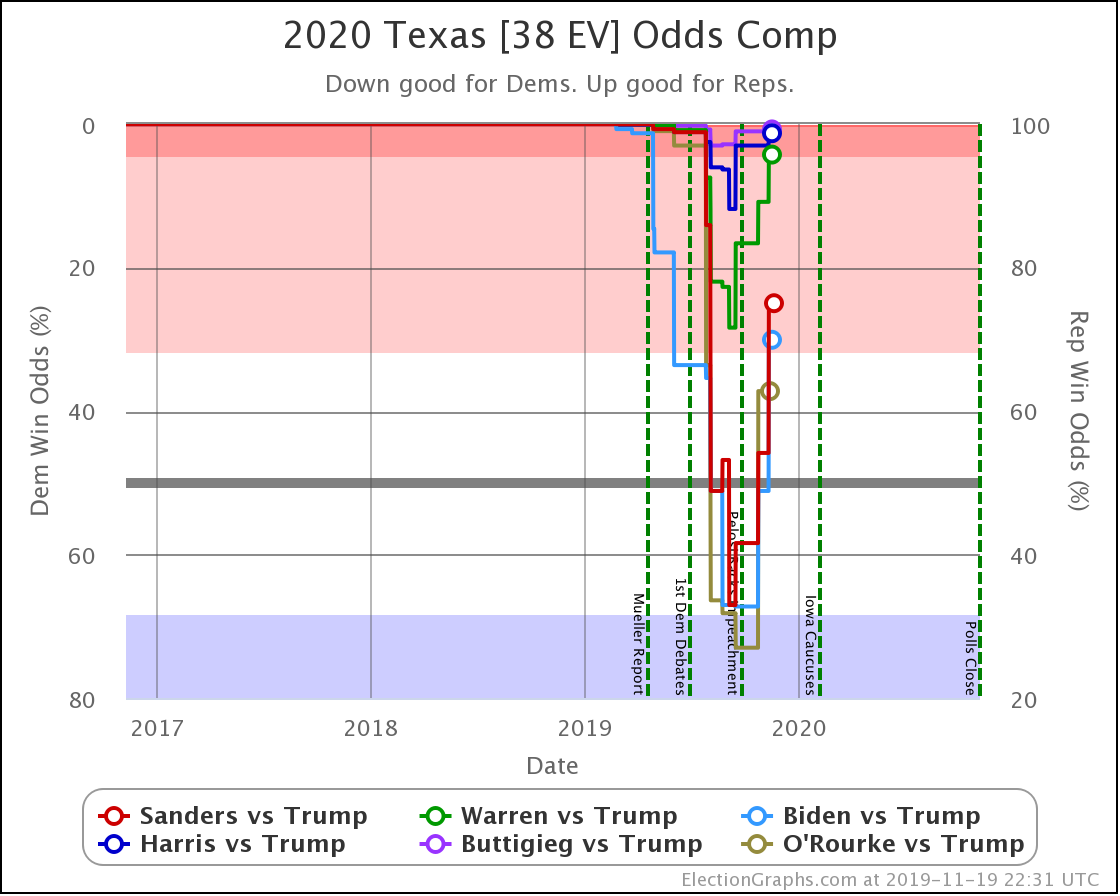
Converting this to win odds, Biden has a 30.1% chance of winning the state (if the election was today), and Sanders has a 25.0% chance of winning.

None of the rest (except O'Rourke, who is out) is above 5%.

So Texas is reverting to form. It may be closer than it has been in previous years, but at least for the moment, the Democratic hopes for a blue Texas seem to be fading.

I'll go over other states with new polling at the end of the post, but first, a look at four ways of looking at the changes in the national summary since the last post.

O'Rourke vs. Trump is now in the top six best-polled candidate combinations (replacing Sanders vs. Pence). But since O'Rourke dropped out, we will leave him out and only look at the top five for now.

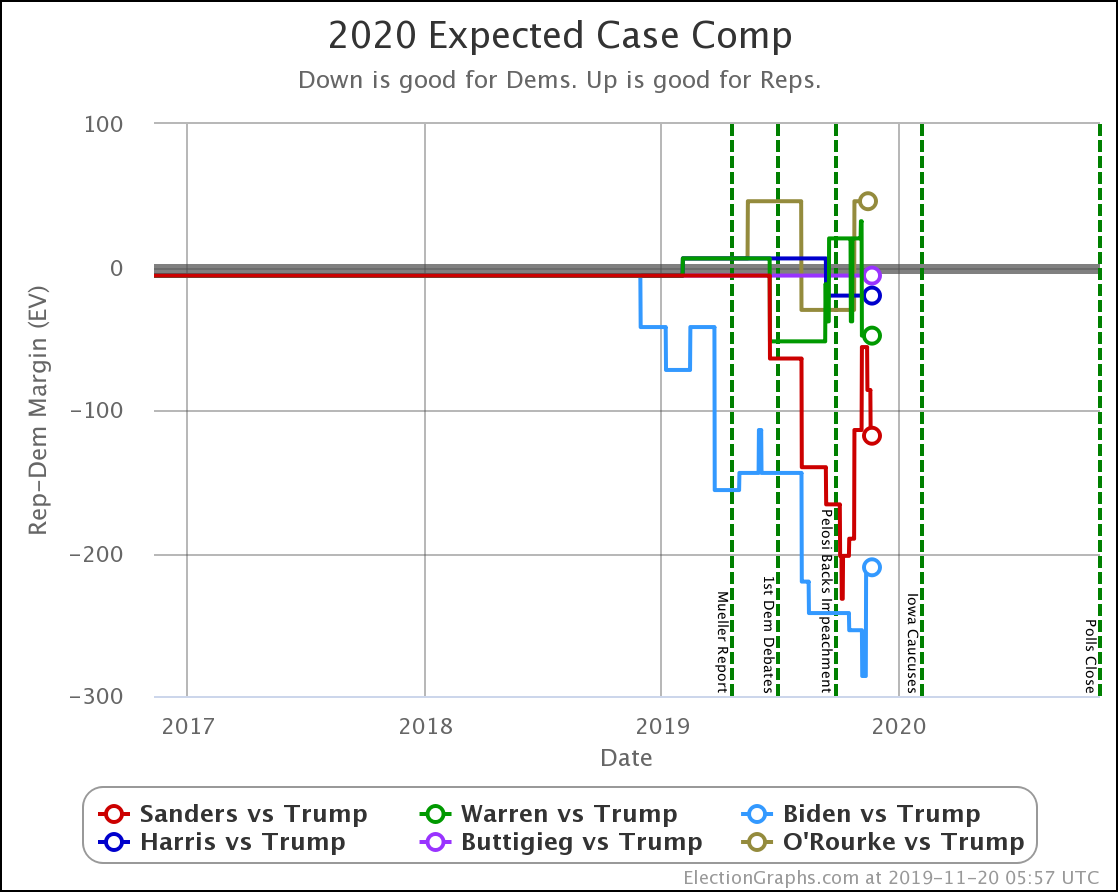
I haven't done posts showing the update-to-update comparisons for the older "categorization method" before, but since that used to be the bread and butter of Election Graphs, let's start there.

Dem 1 Nov 20 Nov šš«
Biden +254 +210 -44
Sanders +190 +118 -72
Warren +38 +48 +10
Harris +20 +20 Flat
Buttigieg +6 +6 Flat

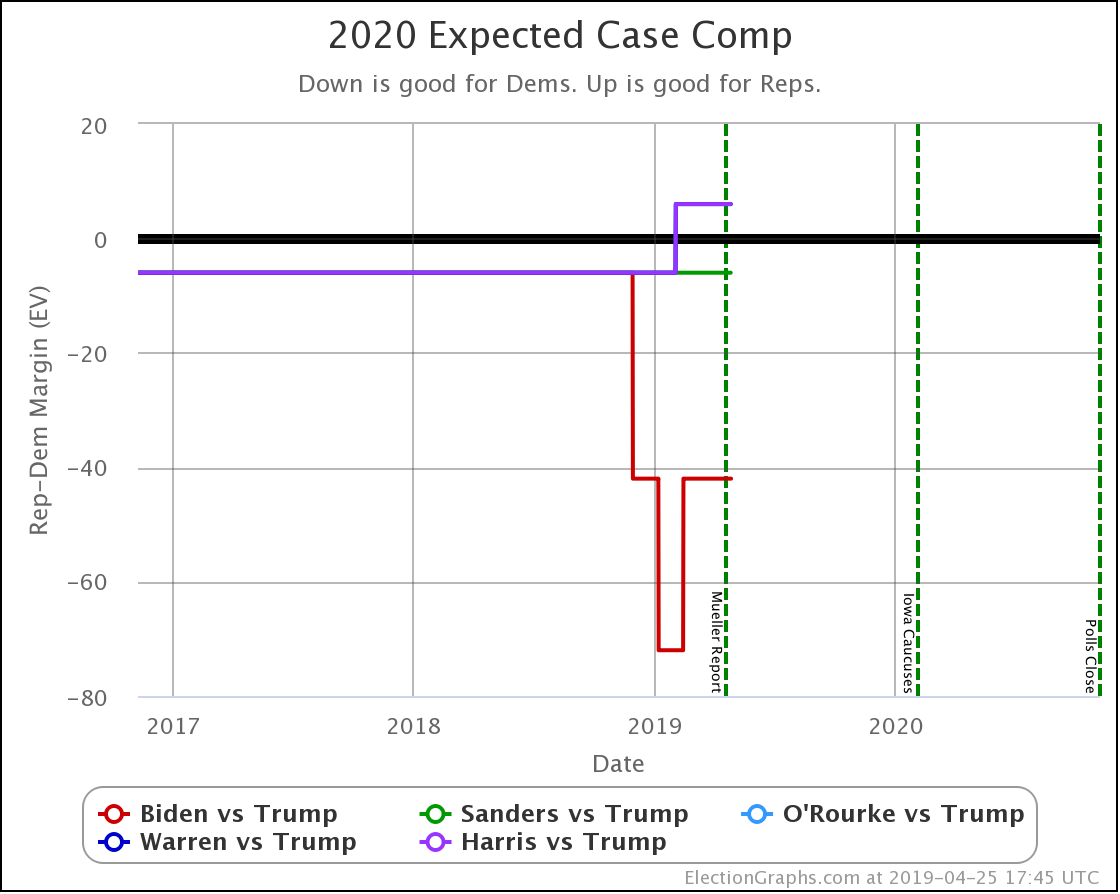
In thisĀ "expected case" view, where every candidate wins every state where they lead in the poll average, both Sanders and BidenĀ have lost ground.

Warren improves her position a little.

Harris and Buttigieg are flat.

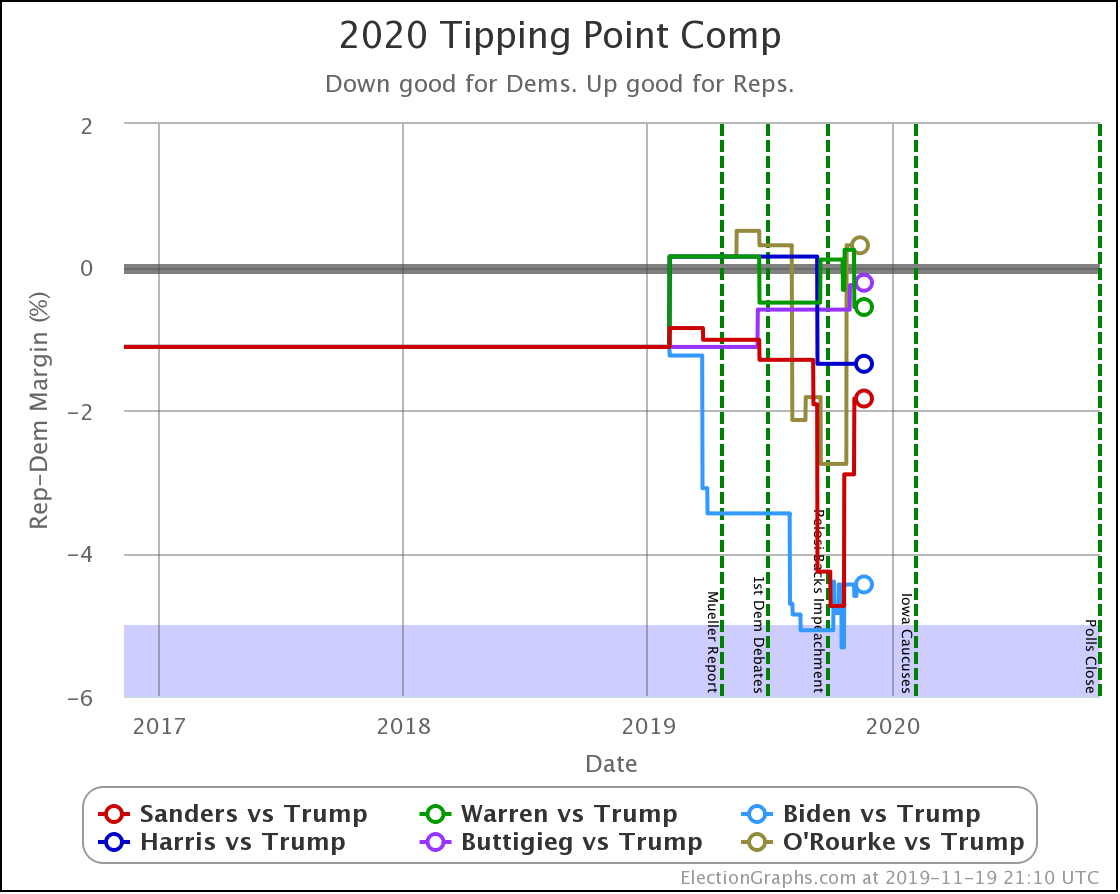
Dem 1 Nov 20 Nov šš«
Biden +5.3% +4.4% -0.9%
Sanders +4.7% +1.8% -2.9%
Harris +1.4% +1.4% Flat
Warren +0.3% +0.6% +0.3%
Buttigieg +0.6% +0.2% -0.4%

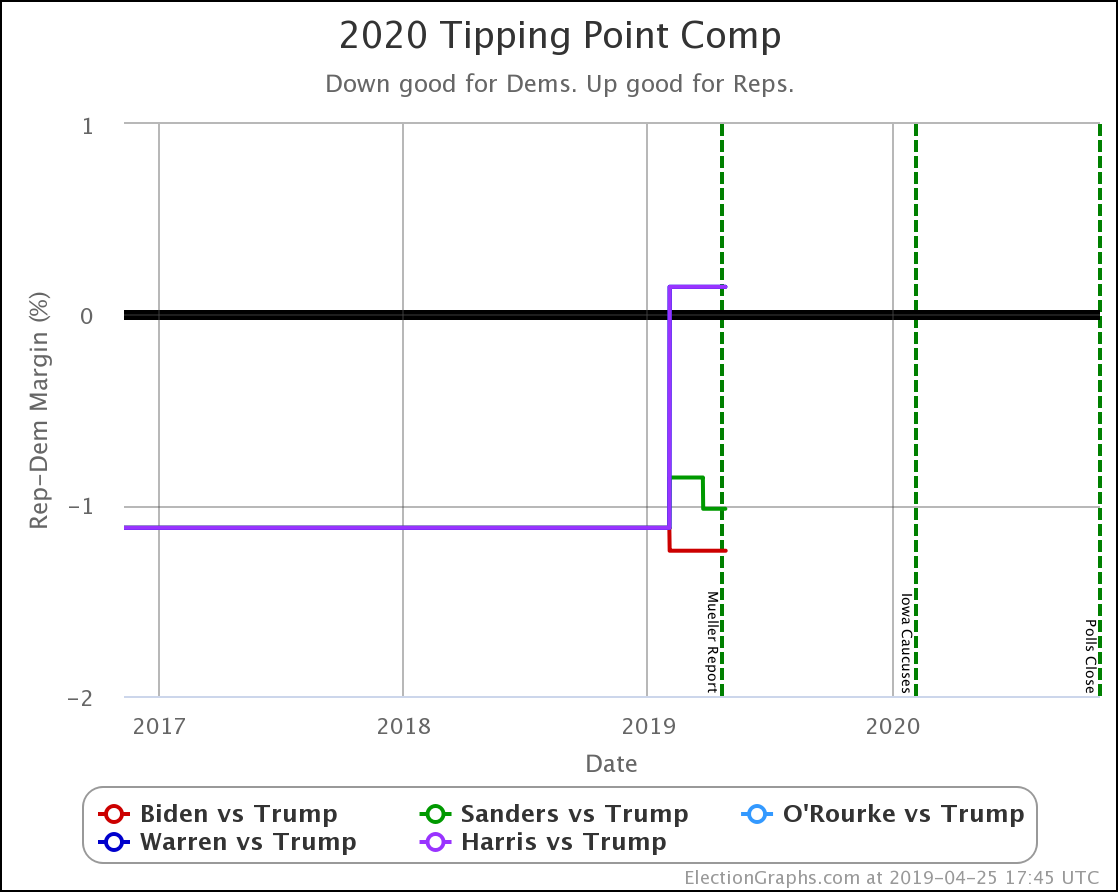
Looking at the tipping points, which is analogous to the popular vote, but adjusted for the structure of the electoral college, once again, Warren is the only Democrat who is improving.

Harris is flat.

Biden, Sanders, and Buttigieg all lose ground to different degrees.

Note that while for a short time, Biden had a tipping point greater than 5%, meaning he could win using only states where he led by more than 5% and didn't even need any swing states. That is no longer true.

Now all five of these Democrats have tipping points indicating that they need to win at least some tight states to win.

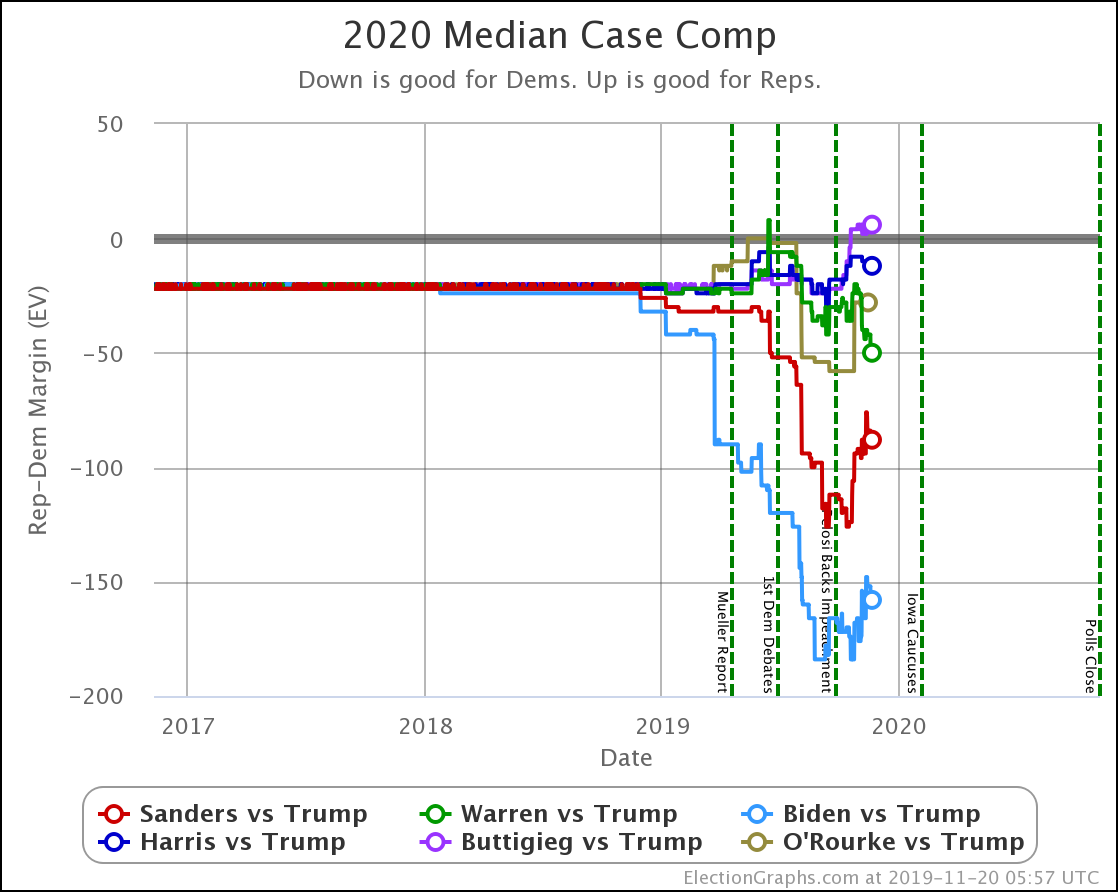
Now, moving on to the more elaborate probabilistic model I look at a bit more these days…

Dem 1 Nov 20 Nov šš«
Biden +184 +158 -26
Sanders +124 +88 -36
Warren +36 +50 +14
Harris +8 +12 +4
Buttigieg -4 -6 -2

This view shows the "Median Case." The median case is the electoral vote margin in the exact middle of the 1,000,001 simulation runs done for each candidate combination when sorted by the margin. About half the time, the Democrat does better than this. About half the time, they do worse.

Warren and Harris both improve a bit. Biden, Sanders, and Buttigieg all lose ground.

Note that while in the classification view, all five Democrats lead Trump, in the probabilistic view, Buttigieg's median case is actually to lose.

But we need to look at probabilities, not the single "median case" estimate. You should not think that since a candidate is ahead or behind on the median case, that maps to winning and losing.

For instance, Buttigieg's median case is a six electoral vote loss to Trump. But if you look at the 2Ļƒ range,Ā that is the range of outcomes that you would expect to occur 95.45% of the time; you get a range from Buttigieg winning by 92 electoral votes to Trump winning by 90 electoral votes.

There is a huge range of possibilities. It isn't just "Trump is ahead in the median case, so he wins."

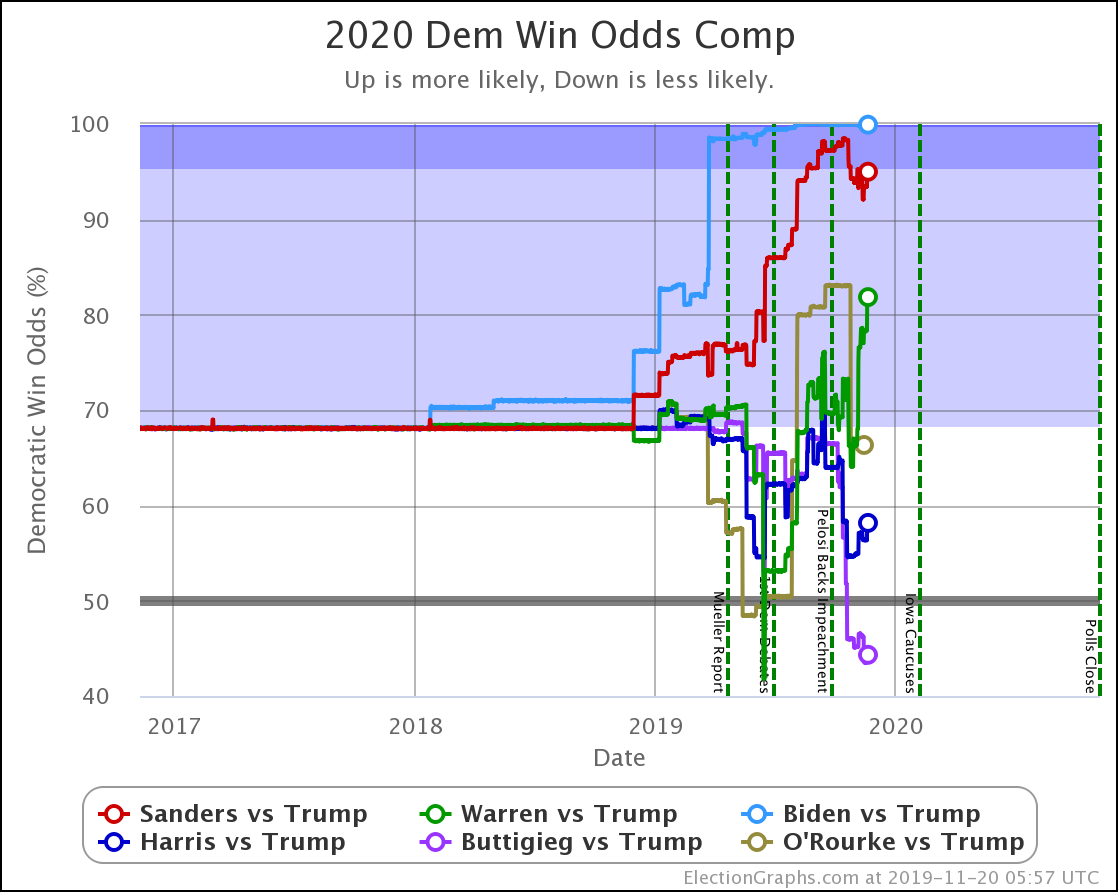
So time to look at the win odds…

Dem 1 Nov 20 Nov šš«
Biden 100.0% 99.9% -0.1%
Sanders 98.3% 95.0% -3.3%
Warren 73.1% 81.8% +8.7%
Harris 54.6% 58.2% +3.6%
Buttigieg 46.0% 44.3% -1.7%

The trends above, which cover just under three weeks, show Warren and Harris improving, while Biden, Sanders, and Buttigieg slip back.

But looking back a bit farther, we can see some overall trends going back to September.

Biden continues to be pegged at a 99%+ chance of winning. His lead in some states has slipped, but his overall margins are high enough that this hasn't yet started to impact his chances of winning.

Sanders never had as big a margin lead as Biden, so as some of those states slipped back toward Trump, you see a more significant impact on his odds of winning.

Harris and Buttigieg have never done all that much better than a coin flip against Trump, peaking at around a 70% chance of winning. But since September, they have both dropped significantly, with Buttigieg now only at a 44.3% chance of winning, and Harris only at 58.2%.

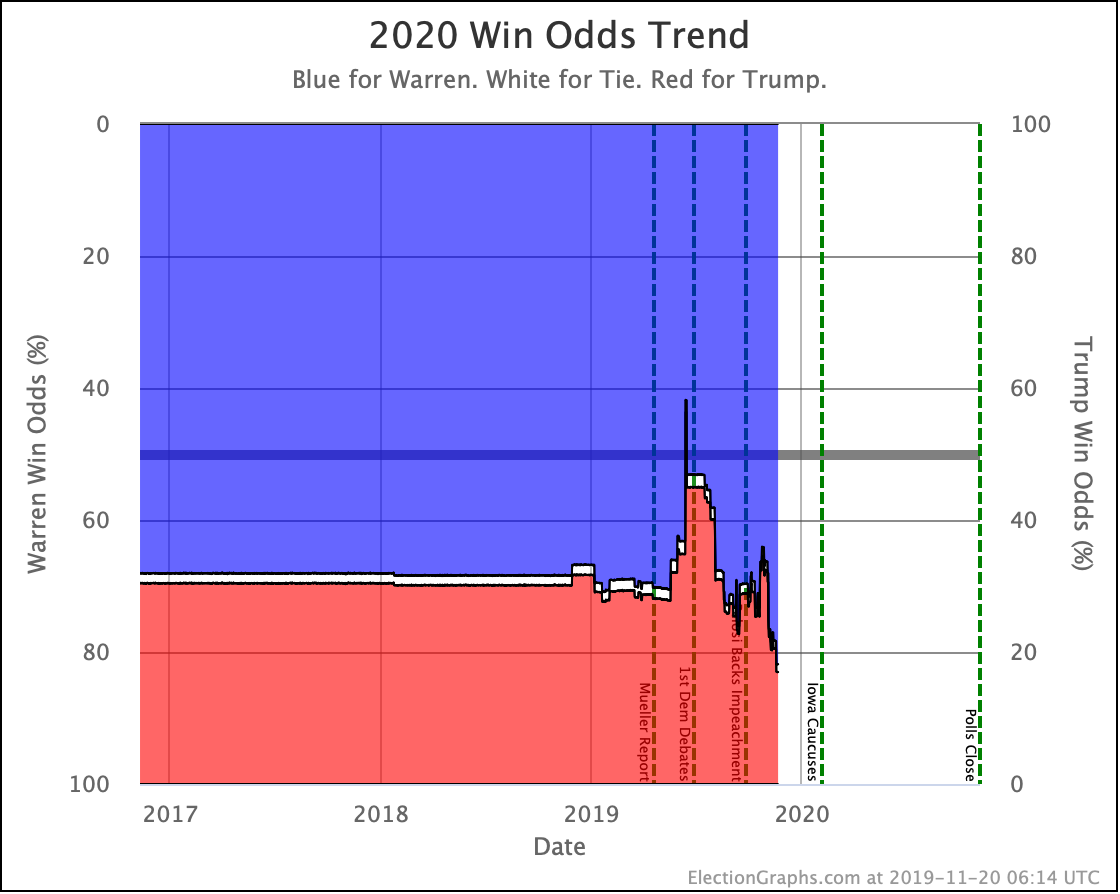
The only candidate consistently improving over the last few months has been Warren. She bottomed out at only a 41.7% shot of winning in June, and while there have been ups and downs, the trend is clearly in Warren's direction.

We will, of course, see if that lasts. As can be seen by the spike toward Trump in June, trends can reverse quite quickly.

Now, besides Texas, here are a few additional states where there are trends worth noting. (Since so many places had new polls, I'll skip a few where there is less to comment on.)

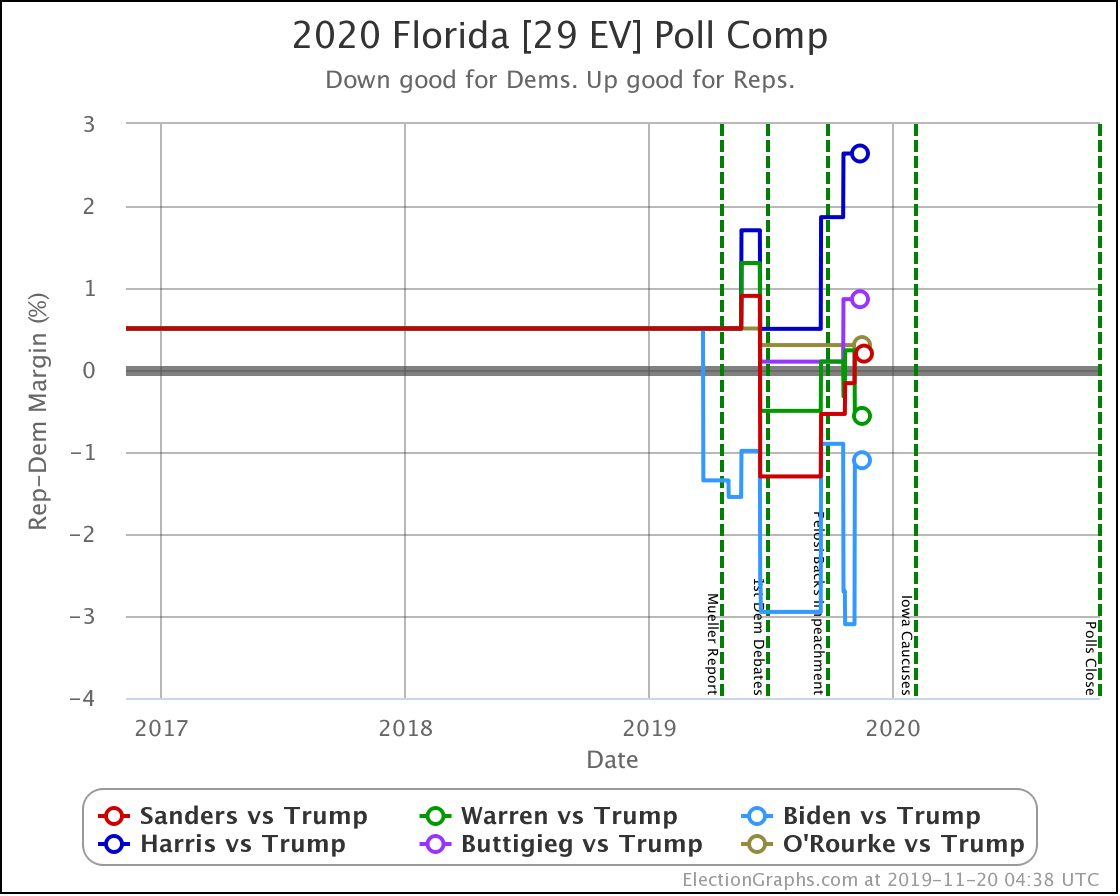
No clear trends in Florida except to note that it is an exceptionally close race no matter which Democrat you match up against Trump. As has been usual for the last few presidential races, Florida is right on the line. And it is big. So it makes a huge difference.

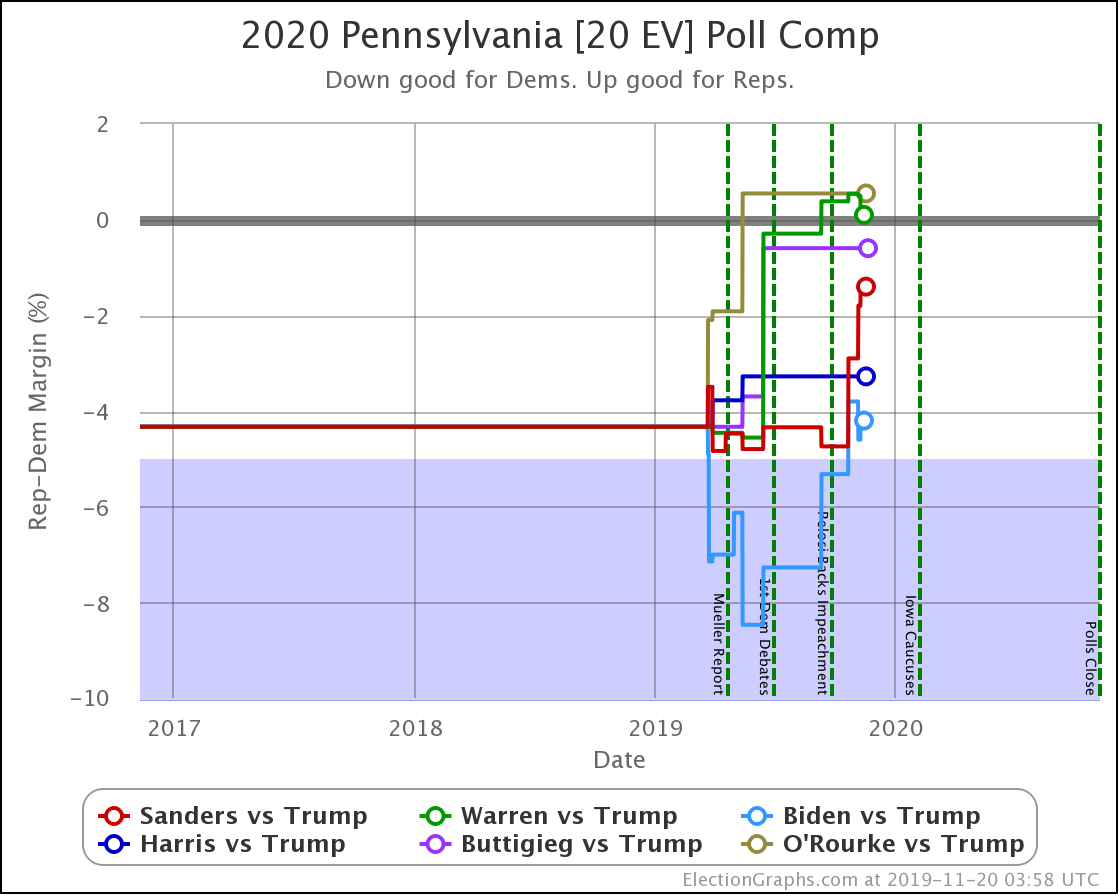
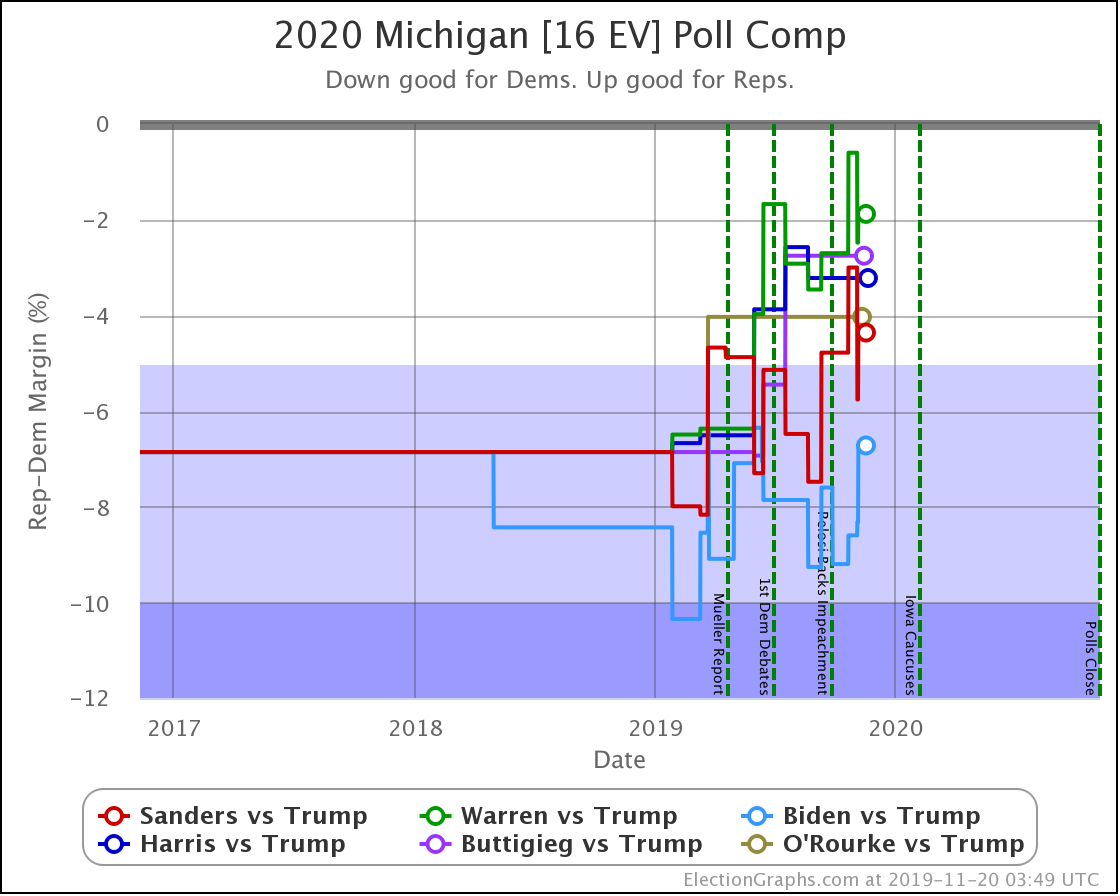
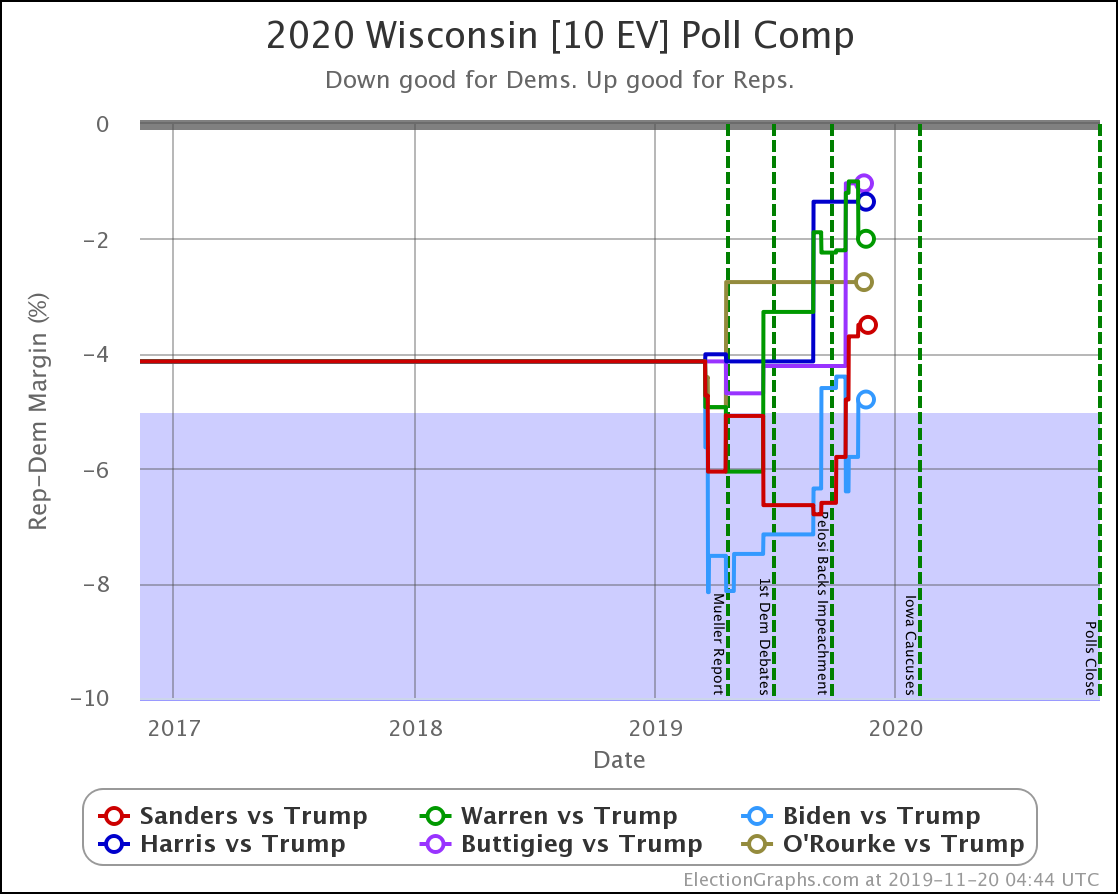
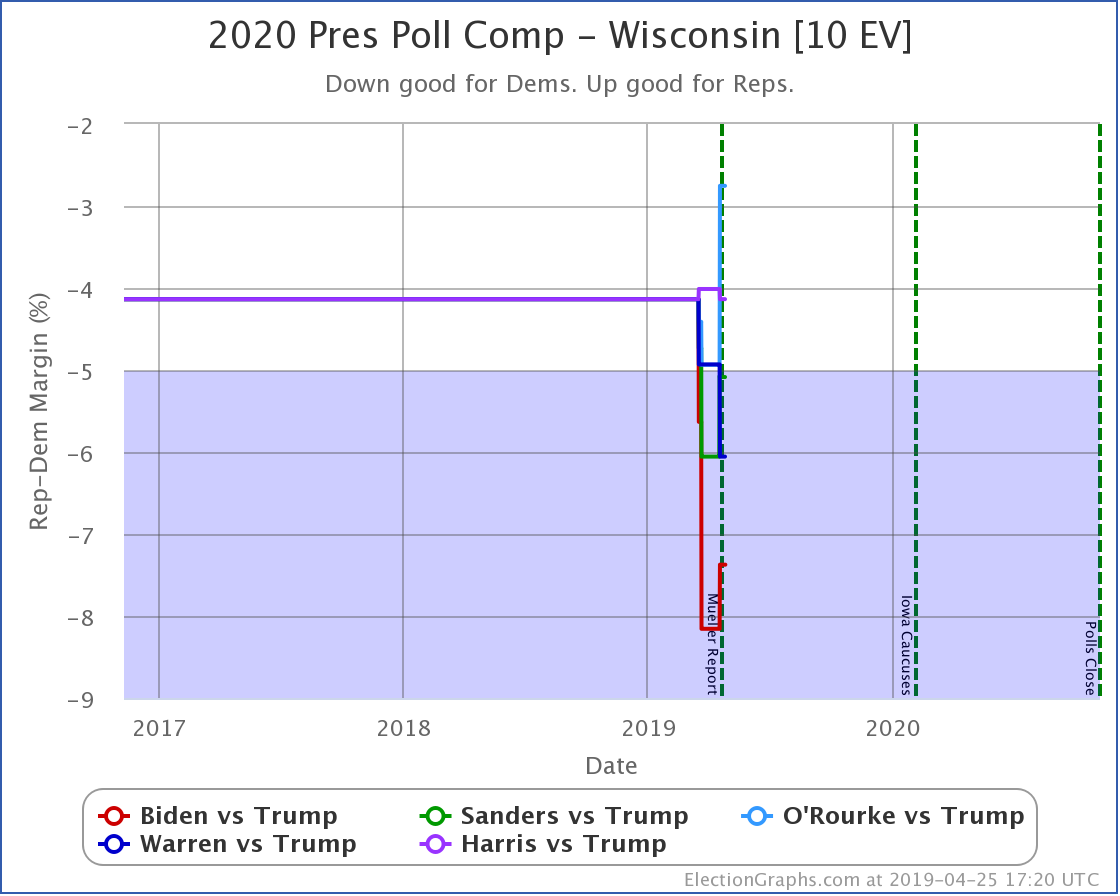
The general trend in Pennsylvania, Michigan, and Wisconsin over the past few months has been for Democratic leads to decrease.

In Pennsylvania, there is no Democrat with more than a 5% lead, and Warren (and O'Rourke) are both slightly behind.

At this point, only Biden has a lead higher than 5% in Michigan.

In Wisconsin, all the Democrats still lead, but none by more than 5%.

These are, of course, the three states that gave Trump his victory in 2016. At the moment, they are all looking to be close battlegrounds once again.

The people who say that the Democratic nominee needs to pay close attention to these states are certainly not wrong.

And at the moment, the Democrats seem to be slipping in all three.

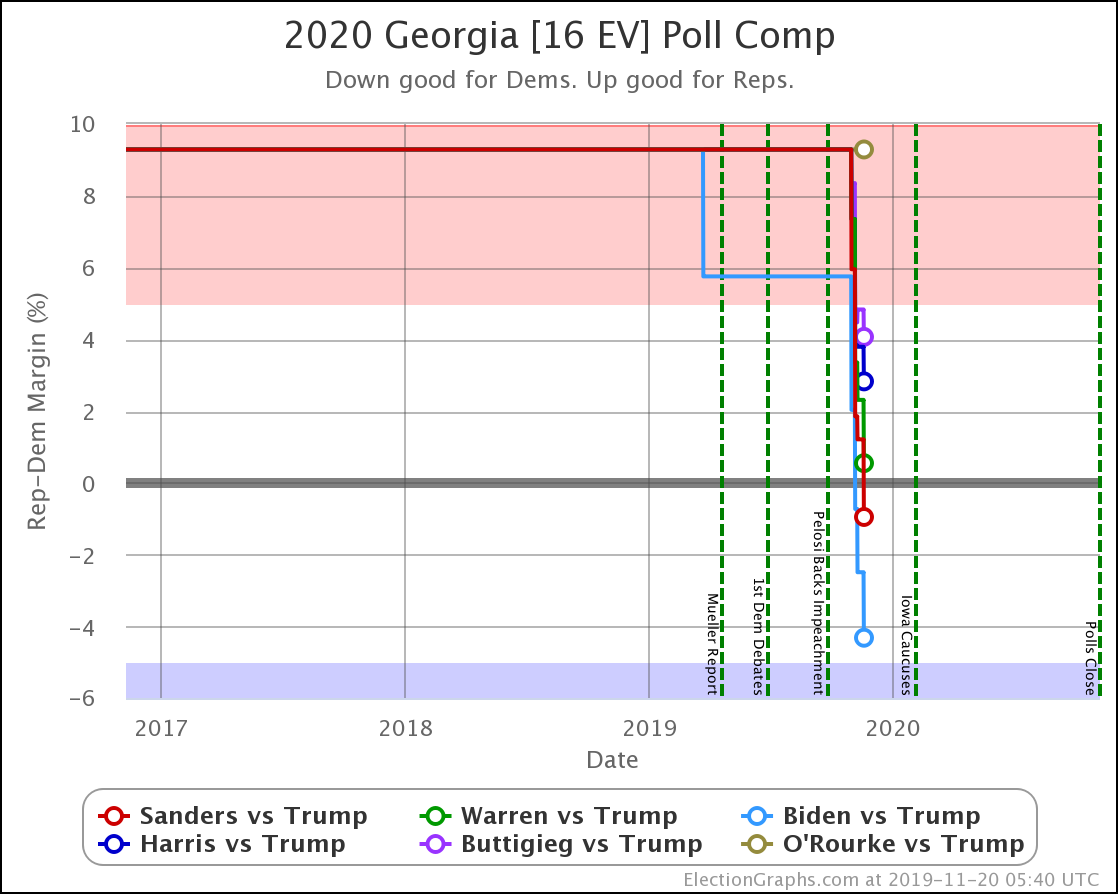
Pollsters have not paid as much attention to Georgia as I would like. But there have been a bunch of polls in the last few weeks and they show aĀ competitive state, which is a significant change from the historical average.

The poll average now shows Biden and Sanders ahead, with Warren, Harris, and Buttigieg all bringing Trump's lead under 5%.

(O'Rourke has never been polled in Georgia, and now that he has dropped out, probably will never be. Sniff.)

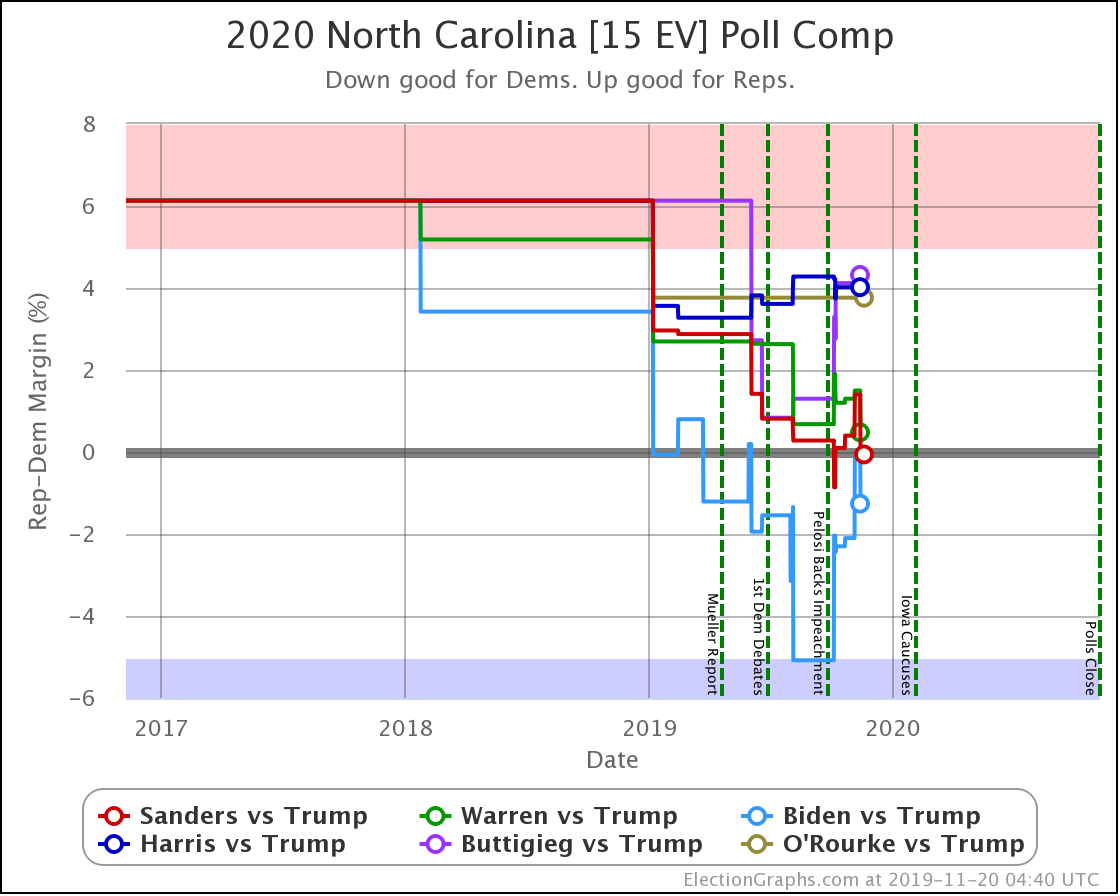
Although Biden has reversed a bit recently, overall Sanders, Warren, and Biden are making North Carolina a narrowly fought battleground.

Harris and Buttigieg, while they are still keeping Trump's lead under 5%, do not seem to be gaining any additional ground lately.

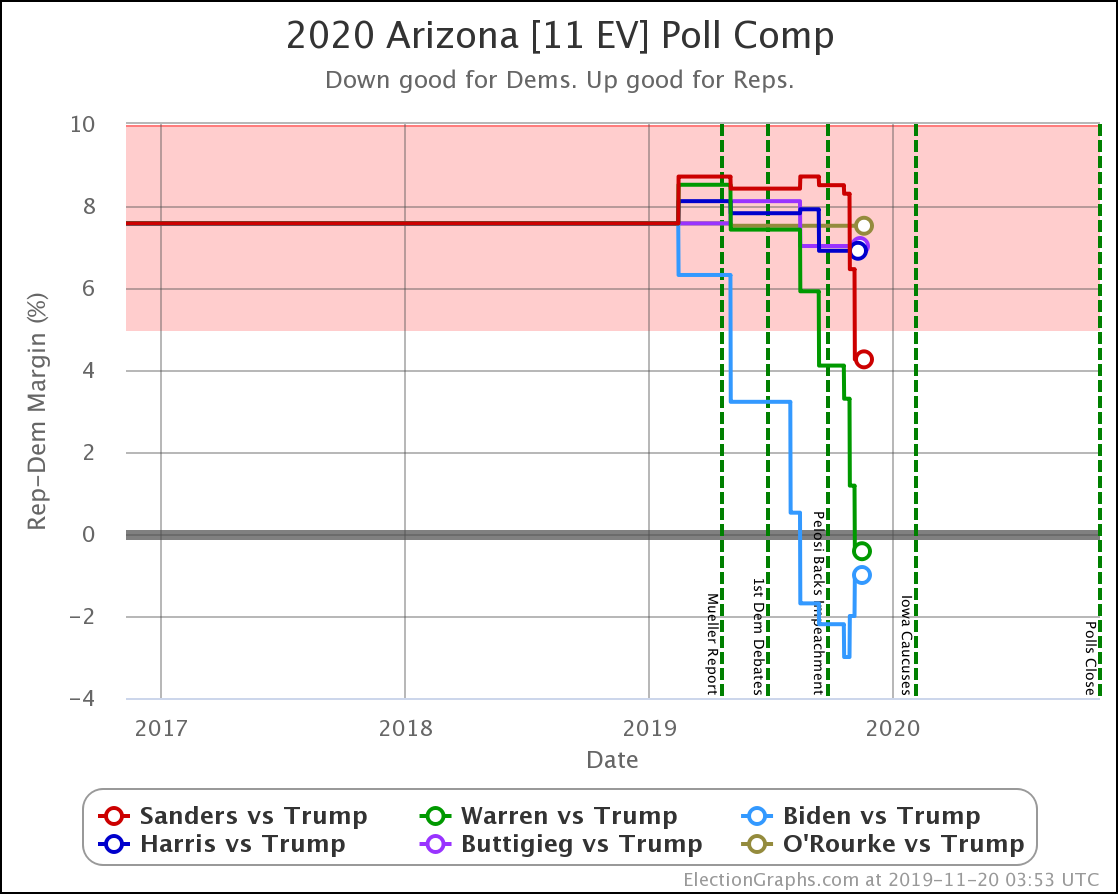
Arizona has also been moving toward the Democrats. At least for Sanders, Warren, and Biden. Warren and Biden actually are slightly leading. Sanders brings Trump's lead under 5%.

Harris and Buttigieg, on the other hand, are not making things much closer than the historical 7.6% average Republican margin in the state. Just as in North Carolina, they lag behind the stronger Democrats.

So Trump is gaining in Texas, Pennsylvania, Michigan, and Wisconsin.

But the Democrats are gaining in Georgia, North Carolina, and Arizona.

As we get closer, things will heat up; there will be lots more polls and more movement.

Are we having fun yet?

349.7 days until polls start to close on election night.

For more information:

This post is an update based on the data on the Election Graphs Electoral College 2020 page. Election Graphs tracks a poll-based estimate of the Electoral College. The charts, graphs, and maps in the post above are all as of the time of this post. Click through on any image to go to a page with the current interactive versions of that chart, along with additional details.

Follow @ElectionGraphs on Twitter or Election Graphs on Facebook to see announcements of updates. For those interested in individual poll updates, follow @ElecCollPolls on Twitter for all the polls as I add them. If you find the information in these posts informative or useful, please consider visiting the donation page.

Good Polling Week For Democrats

Since last week's update, there have been new polls in Nevada, Colorado, and Arizona.

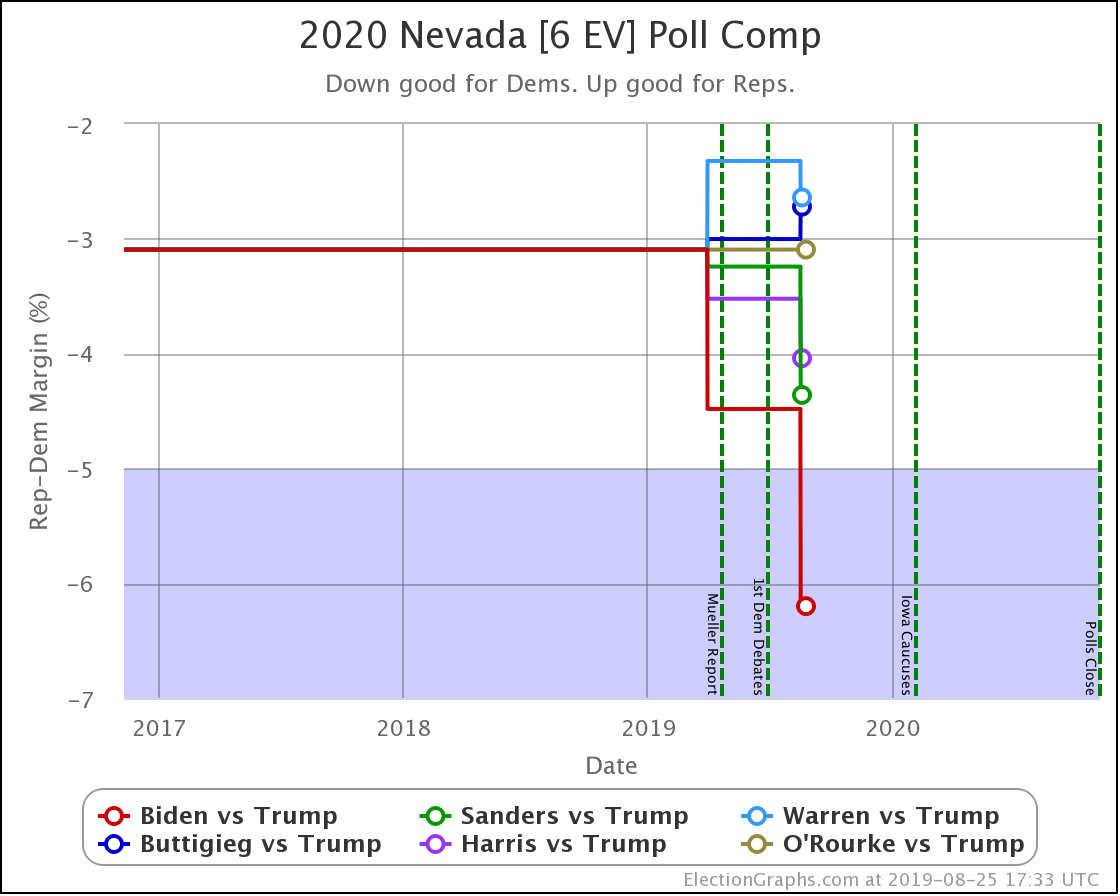
There was only one category change. Biden's poll average in Nevada moved from a 4.5% lead to a 6.2% lead which changed the state from Weak Biden to Strong Biden in the Election Graphs categorizations.

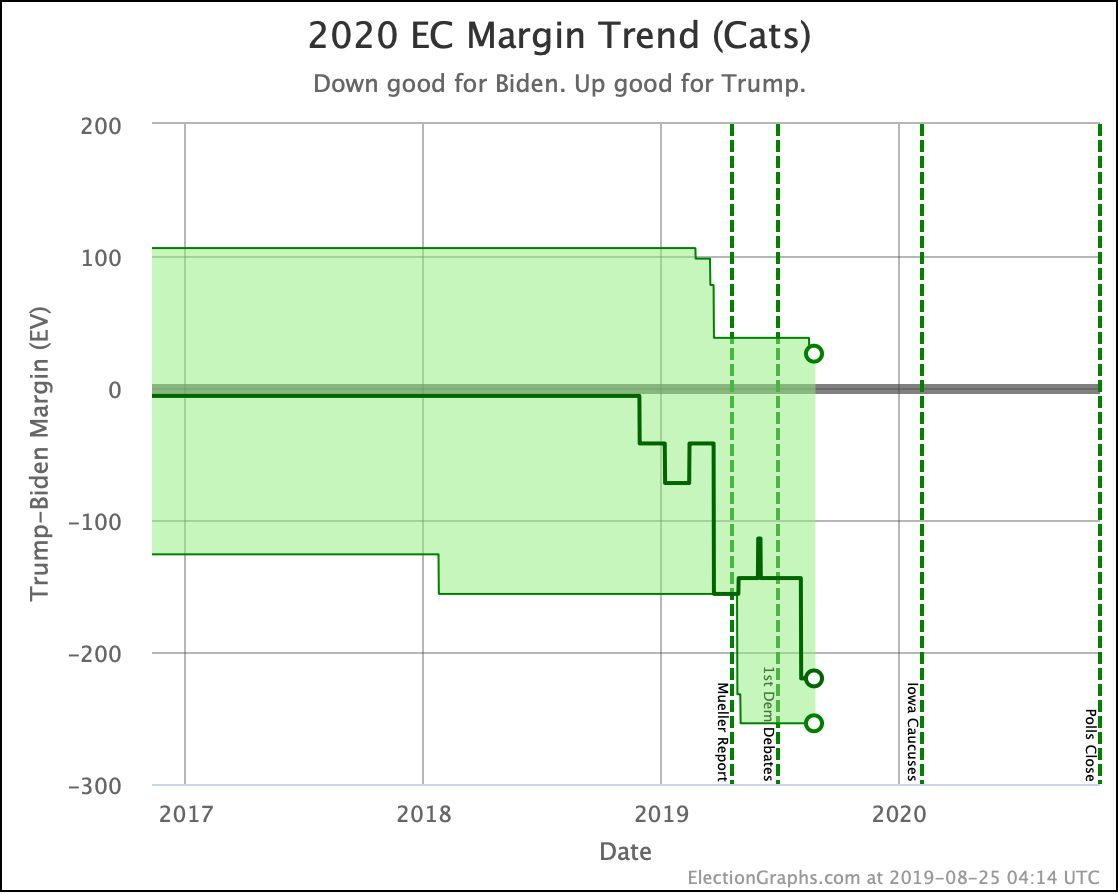
ThisĀ change drops Trump's best case in the categorization view to a 26 electoral vote win over Biden as Nevada is moved out of the list of potential Trump wins:

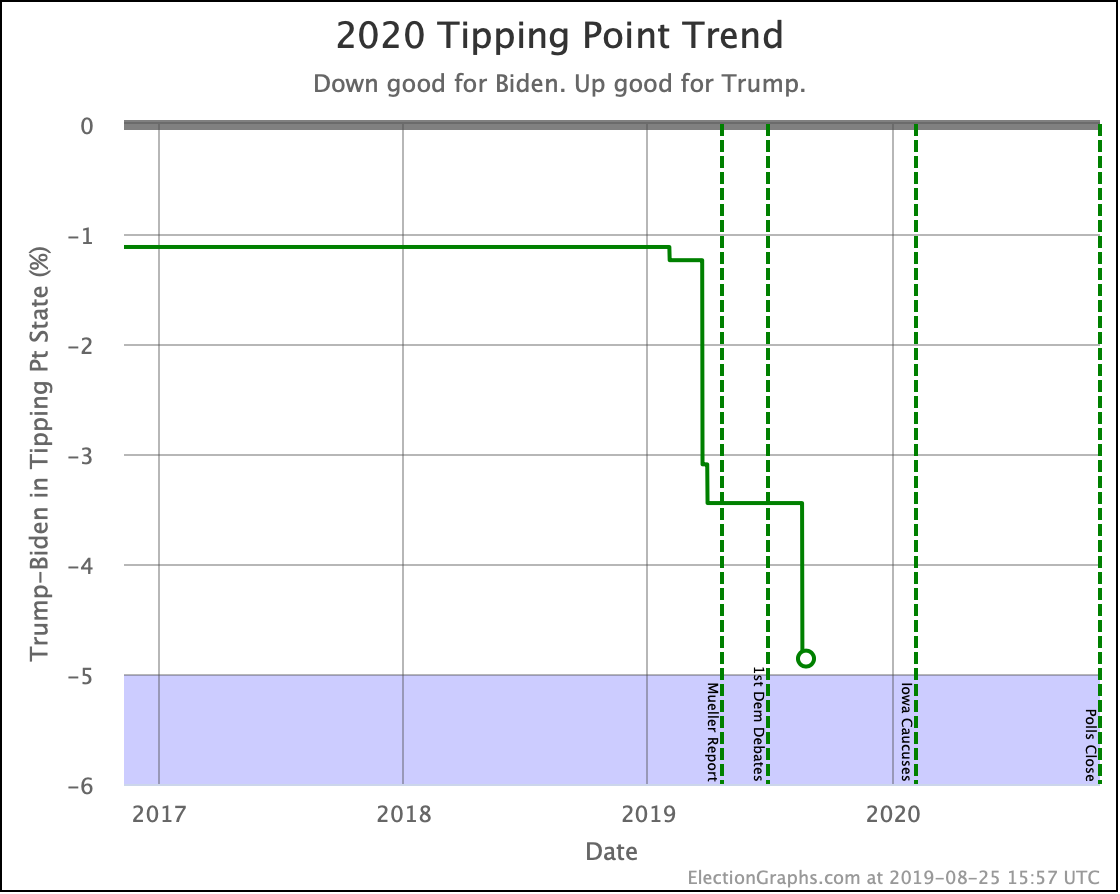
The Biden vs. Trump tipping point also shifted from a 3.4% Biden lead in Maine's 2nd congressional district to a 4.9% Biden lead in Virginia.

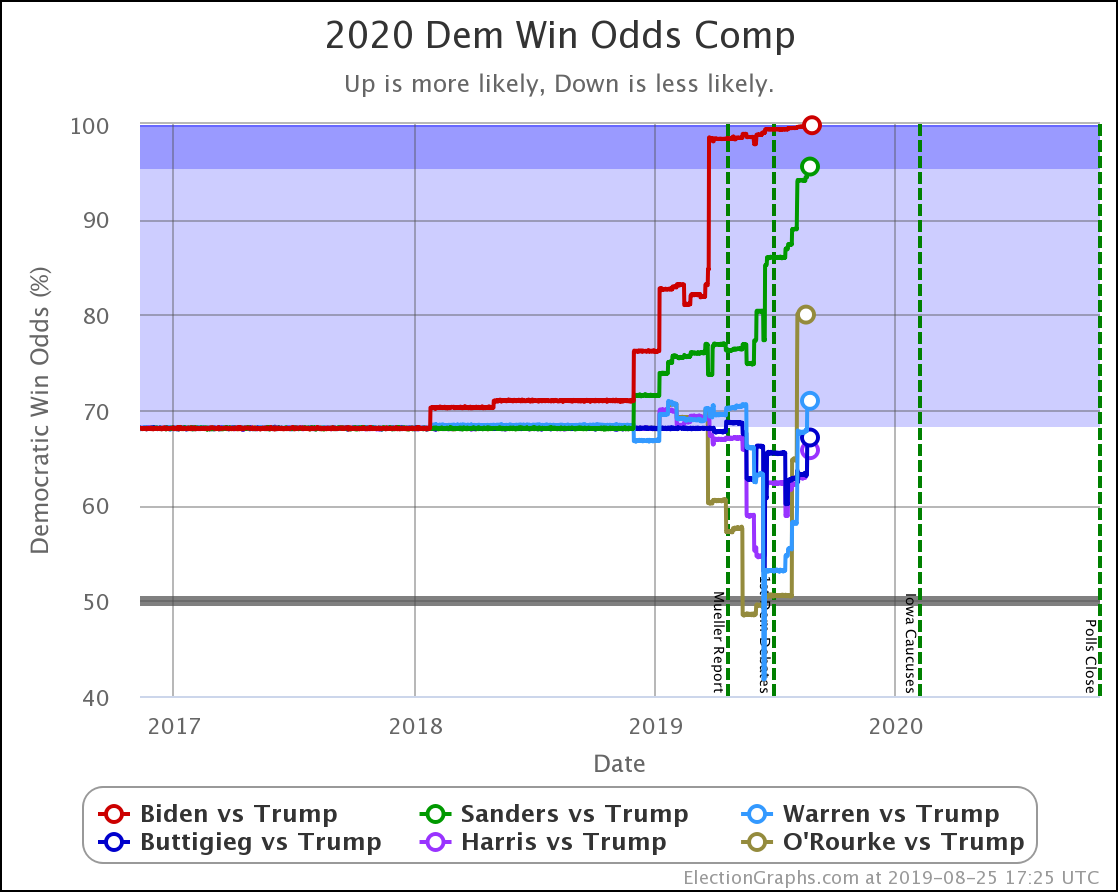
But taking into account the polling changes in all three states, and looking at the probabilistic model, of the six most polled Democrats against Trump, five improved their odds of winning the electoral college.

The only exception was O'Rourke. None of the new polls included him. Again.

Dem 18 Aug 25 Aug šš«
Biden 99.7% 99.9% +0.2%
Sanders 94.1% 95.5% +1.4%
O'Rourke 80.0% 80.0% Flat
Warren 67.6% 71.0% +3.4%
Buttigieg 63.2% 67.1% +3.9%
Harris 62.9% 65.8% +2.9%

The odds favor all of the Democrats over Trump at this point. Ā There is a massive spread between the extremes, however. At the low-end, Harris loses about a third of the simulated elections to Trump. Meanwhile at the high-end Biden looks very solid indeed with that 99.9%.

As usual, disclaimers are essential. What we see NOW may not resemble what things look like by the time we get to the Iowa caucuses, let alone by the time we get to Election Day 2020.

Although as every day passes, this is less true, many people still are not paying close attention to this contest, and many people don't know much about Harris and Buttigieg and some of the others. Name recognition and the intensity of the coverage does matter, and that will all ramp upĀ as voting approaches.

Perhaps even more importantly, the general election campaign itself won't go into full swing until it looks like the winning candidates on both sides are inevitable, and that will make a huge difference. For instance, I would be surprised to see that 99.9% for Biden survive contact with an all-out assault from the Republican side.

With that said, let's look at the three states individually:

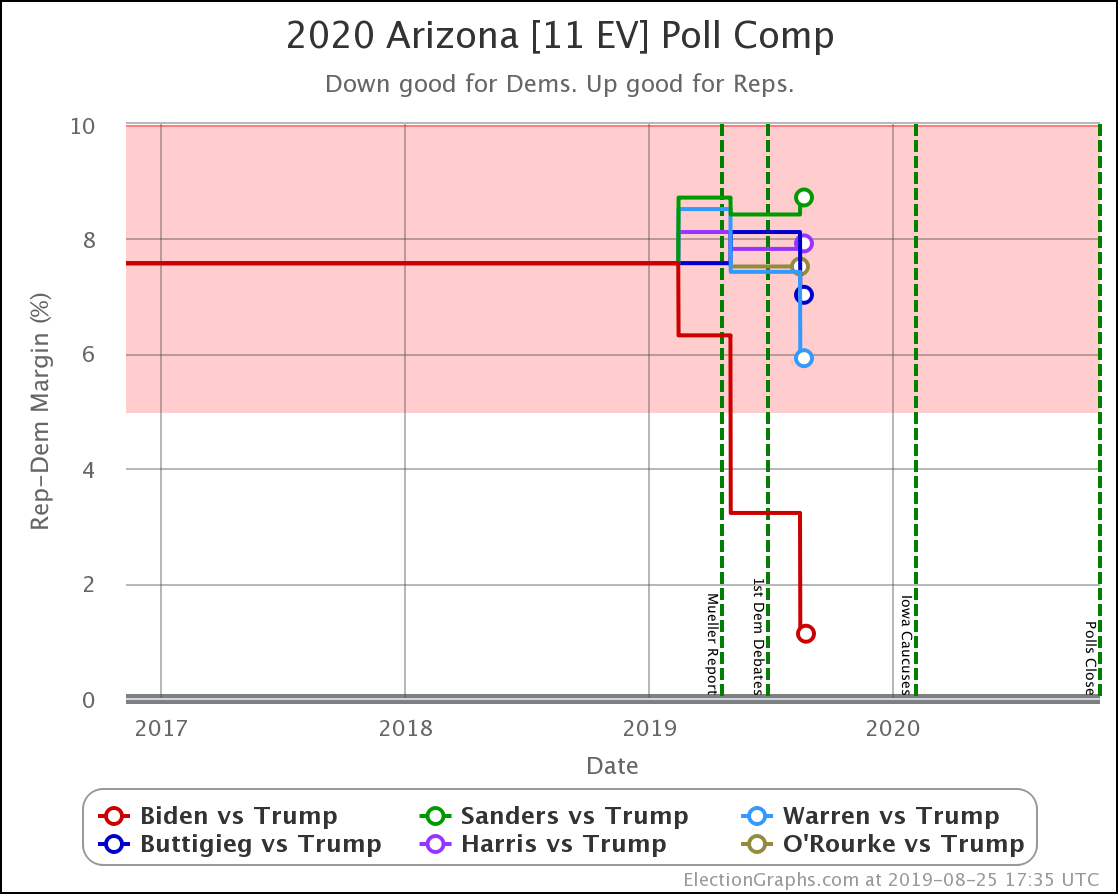
Biden is the only candidate breaking out in Arizona. The polling average still shows a Trump lead, but the three actual 2020 polls so far show one tie and two Biden leads. The state is held on the red side by the Republican wins in 2012 and 2016. At the very least though, it is clear that Biden puts Arizona into contention.

Warren's poll average has also improved a little bit on the 2000-2016 average Republican win margin of 7.6%, but she has yet to show a single poll with her leading Trump.

The other four have barely moved the needle. And Sanders and Harris are doing worse in Arizona than the historical average.

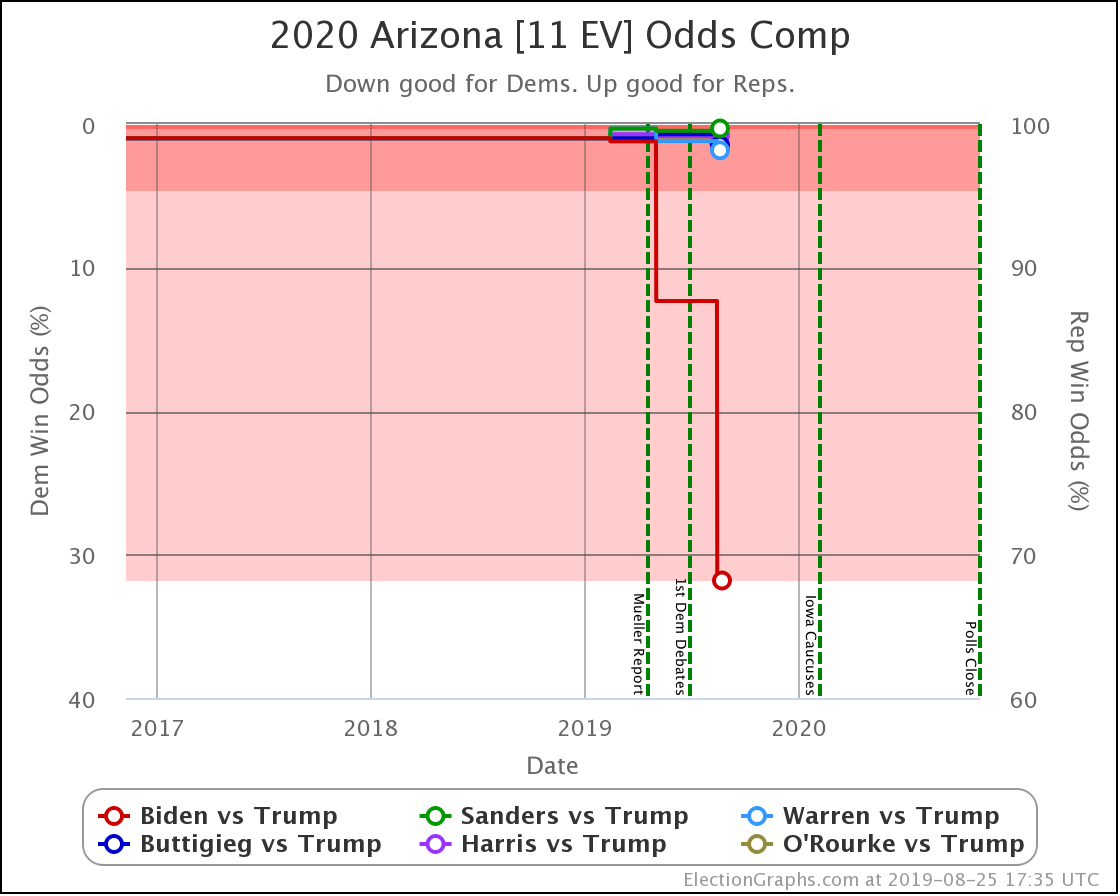
The difference between Biden and the others is even starker when you look at the chart showing the odds of winning Arizona:

Biden is now up to a 31.8% chance of winning Arizona. The other five candidates range from an 0.3% chance (Sanders) to a 1.8% chance (Warren).

Unlike Texas, where it looks like all the Democrats are making the state look bluer, Arizona is much more selective.

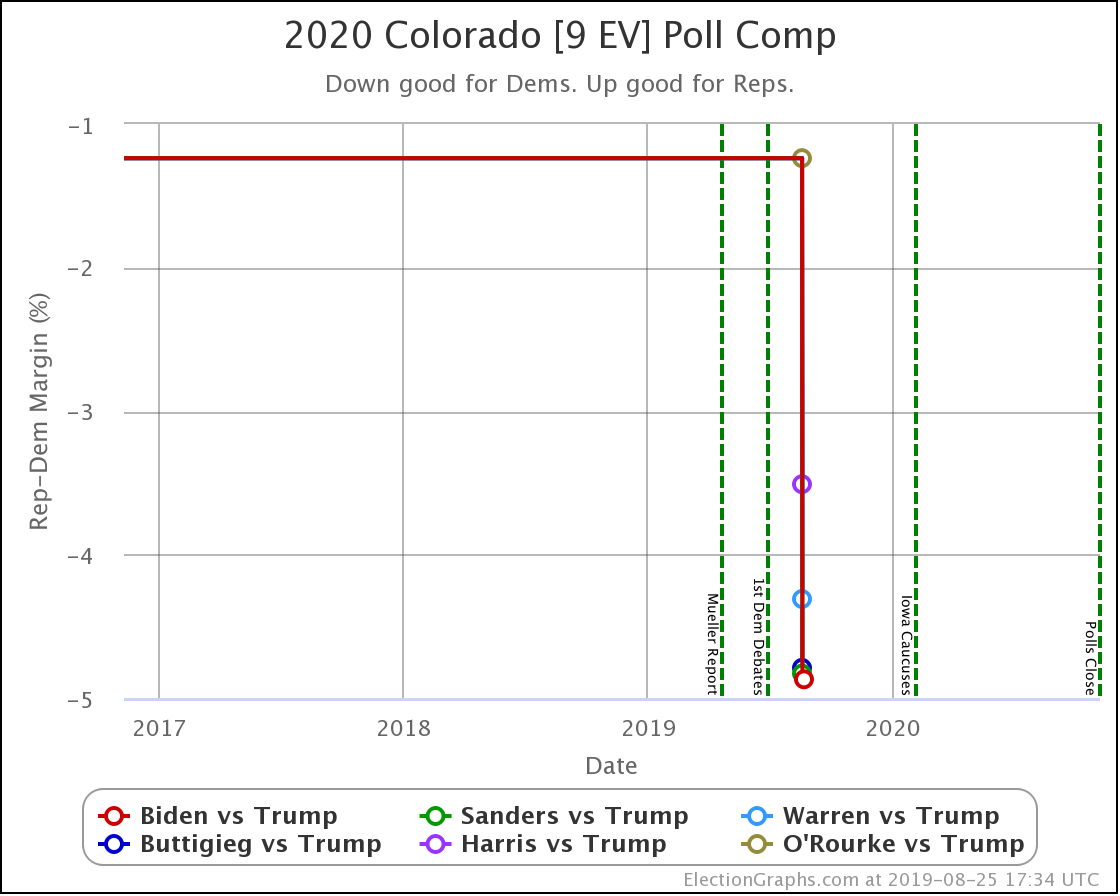
The Emerson poll this week is the very first Colorado polling for 2020. Biden, Sanders, Warren, and Buttigieg all lead Trump by more than 5% in the new poll. Harris leads by a narrower 3%.

In all of these cases, the average drops significantly in the blue direction, because it is the 2000 election results that are falling off the average, where the Republican won by an 8.4% margin.

One poll is not enough to move the state out of the "Weak Democrat" category though. But if the next Colorado results are similar to these, the next election to drop off the average will be the 4.7% Republican win in 2004 and the state will probably move to "Strong Democrat" at that point.

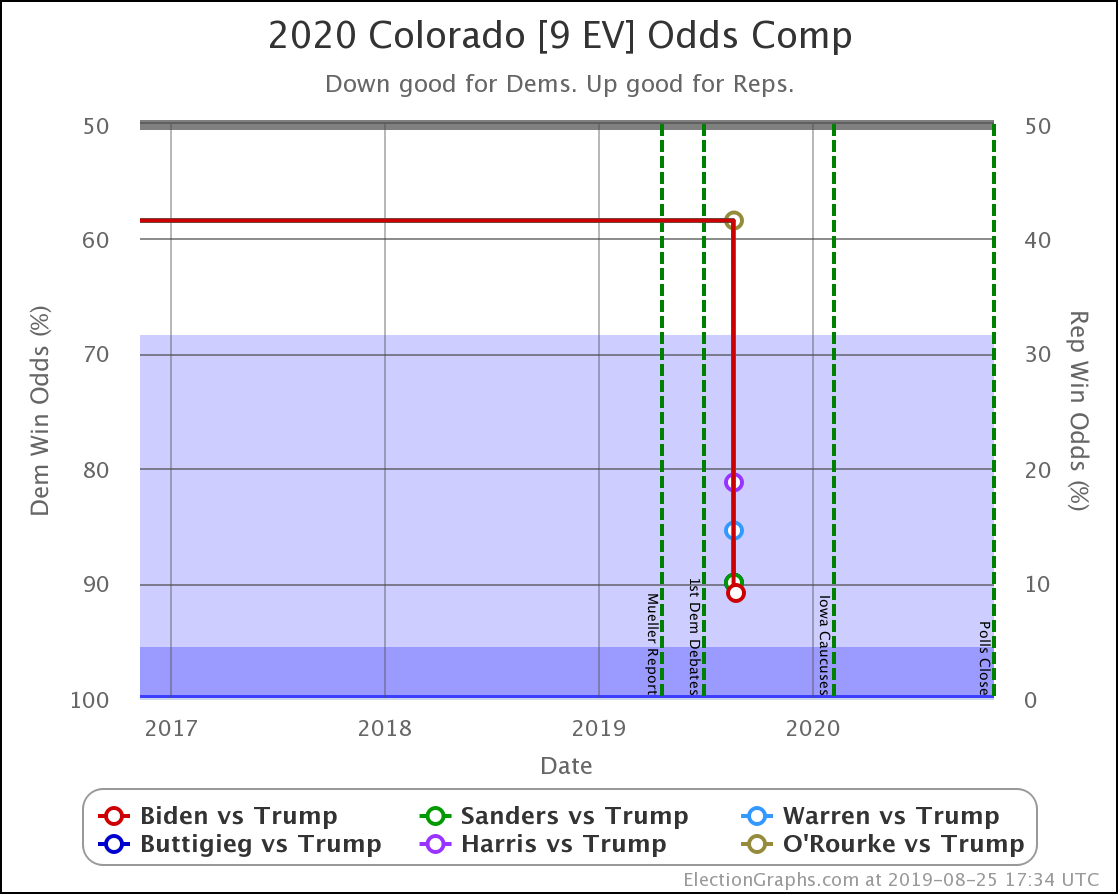
Looking at the odds view though, you can see that even the move from this one new poll makes a big difference. With just the average of the last five elections as the poll average, we put the Democratic chance of winning Colorado at 58.4%. An advantage, but just barely.

With this first 2020 poll, excluding O'Rourke since no pollster included him, the Democrats range from an 81.2% chance of winning the state (Harris) to a 90.9% chance (Biden).

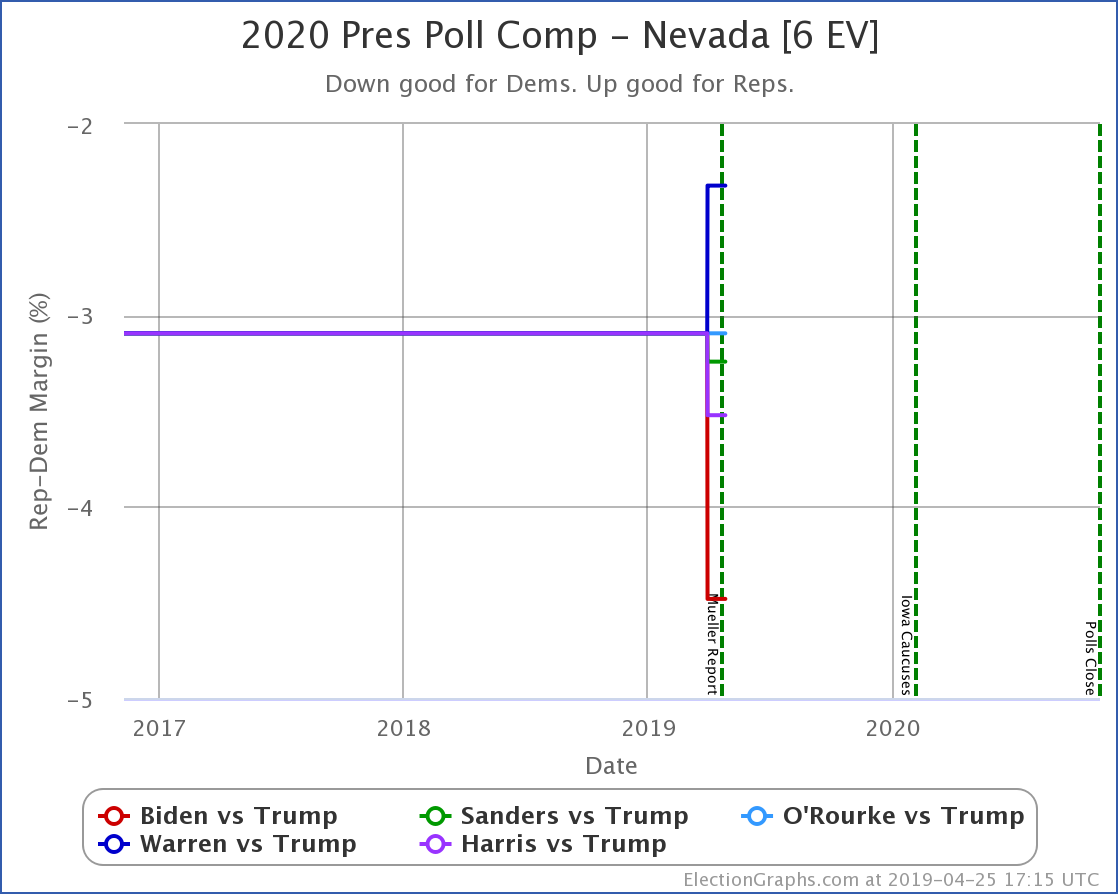
All the Democrats improved their averages in Nevada except for Buttigieg.

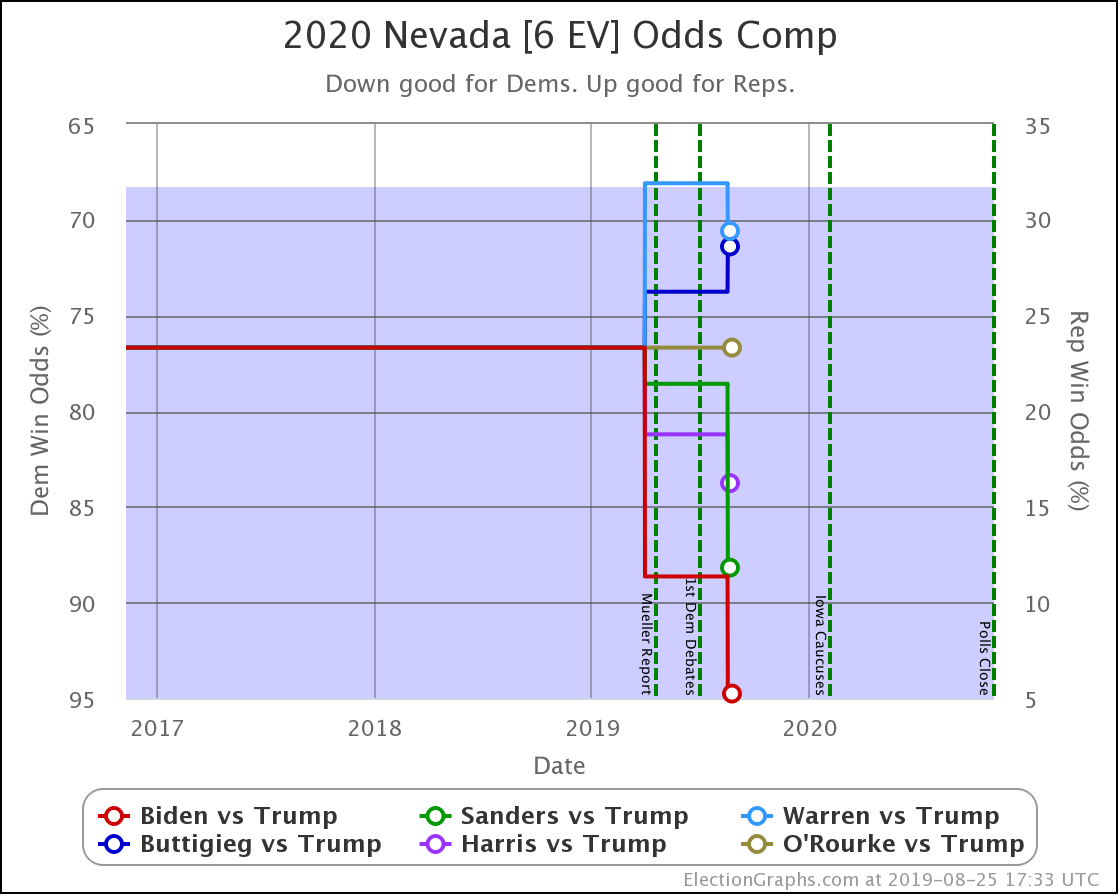
Biden is the standout, moving into "Strong Biden" territory, with his 6.2% margin translating into a 94.8% win chance. The other Democrats range from a 70.6% chance to win (Warren) to an 88.2% chance to win (Sanders).

And that is where we are this week.

436.1 days until polls start to close.

For more information:

This post is an update based on the data on the Election Graphs Electoral College 2020 page. Election Graphs tracks a poll-based estimate of the Electoral College. The charts, graphs, and maps in the post above are all as of the time of this post. Click through on any image to go to a page with the current interactive versions of that chart, along with additional details.

Follow @ElectionGraphs on Twitter or Election Graphs on Facebook to see announcements of updates. For those interested in individual poll updates, follow @ElecCollPolls on Twitter for all the polls as I add them. If you find the information in these posts informative or useful, please consider visiting the donation page.
Warren improves in Wisconsin

Since the last update,Ā there have been new general election polls in Nevada, Massachusetts, Michigan, Wisconsin, Pennsylvania, and Wisconsin again.

With this new batch of polling, Harris vs. Trump supplants Booker vs. Trump in our "five best-polled matchups" that we spend time talking about here. Those five at the moment are Biden, Sanders, O'Rourke, Warren, and Harris. All vs. Trump of course.

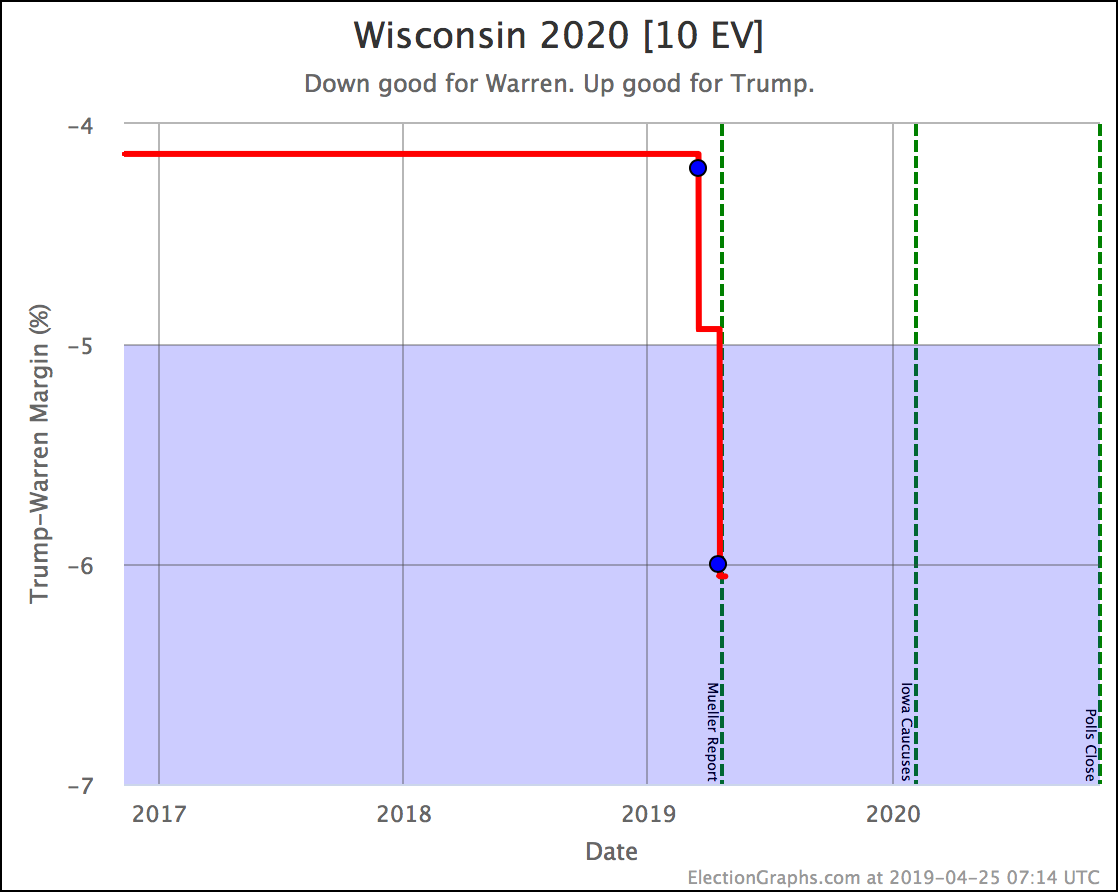
But of all of those polls, only the last Wisconsin poll resulted in any category changes for any of the candidate pairs. That would be Warren vs. Trump, which moves from Weak Warren (a Warren lead less than 5%) to Strong Warren (a Warren lead more than 5% but less than 10%).

Keep in mind that the average here still includes election results from 2008 to 2016 to "baseline" the state while we don't have enough polls for a meaningfulĀ average based solely on the candidate pair. There are still only two actual Warren vs Trump poll results in Wisconsin. So as with everything at this stage, things are still very very preliminary.

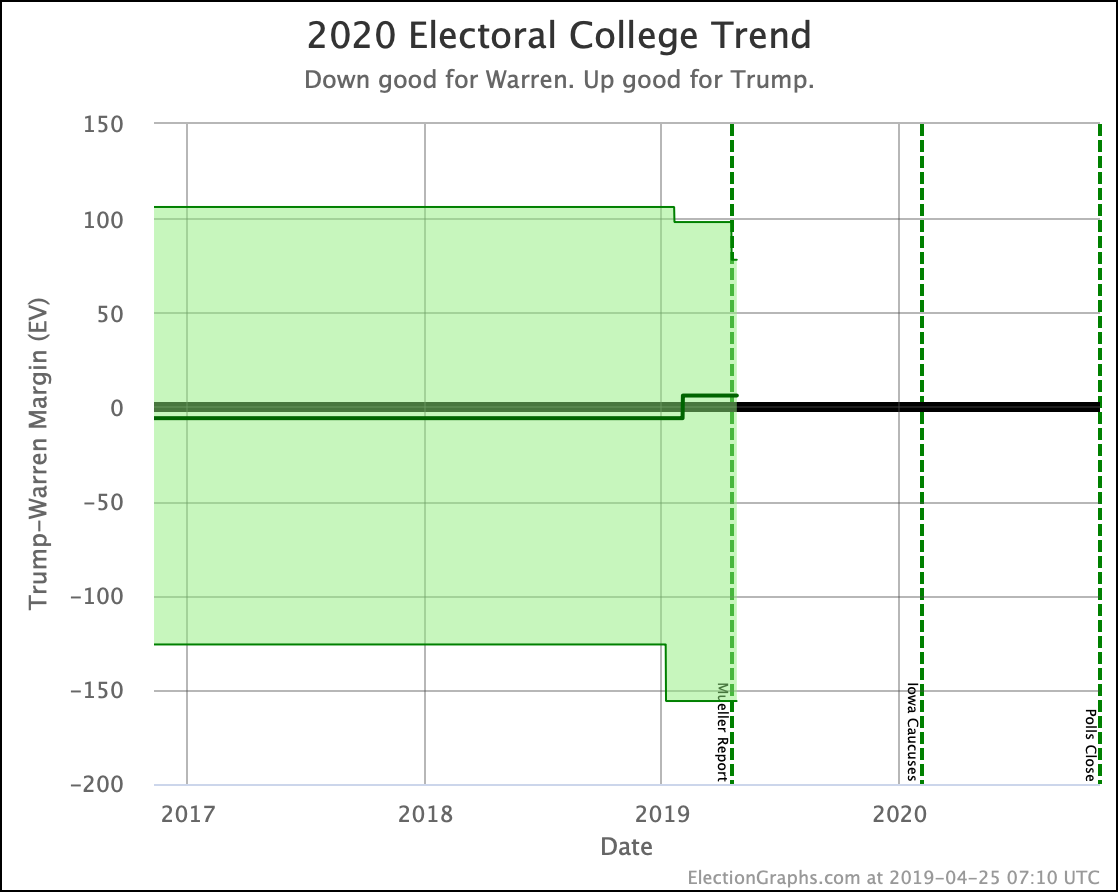
The Warren vs. Trump "bubble" now looks like this:

This change makes the scenario where "Trump wins all of the close states" weaker. But note that the center line (every state goes to the current leader in the poll average) still gives the election to Trump over Warren.

Of the five best-polled matchups at the moment, Biden and Sanders beat Trump. O'Rourke, Warren, and Harris all lose to Trump.

All five of these matchups are incredibly close though. These are all tossups, with Biden doing just a smidge better than the others.

We are more than 18 months out right now, lots will change before the election, so these aren't predictions ā€” just statements of how things look today.

In addition to the big picture stuff above, a quick look at all five states with polls since the last update to see not just the category changes, but the movement within the categories.

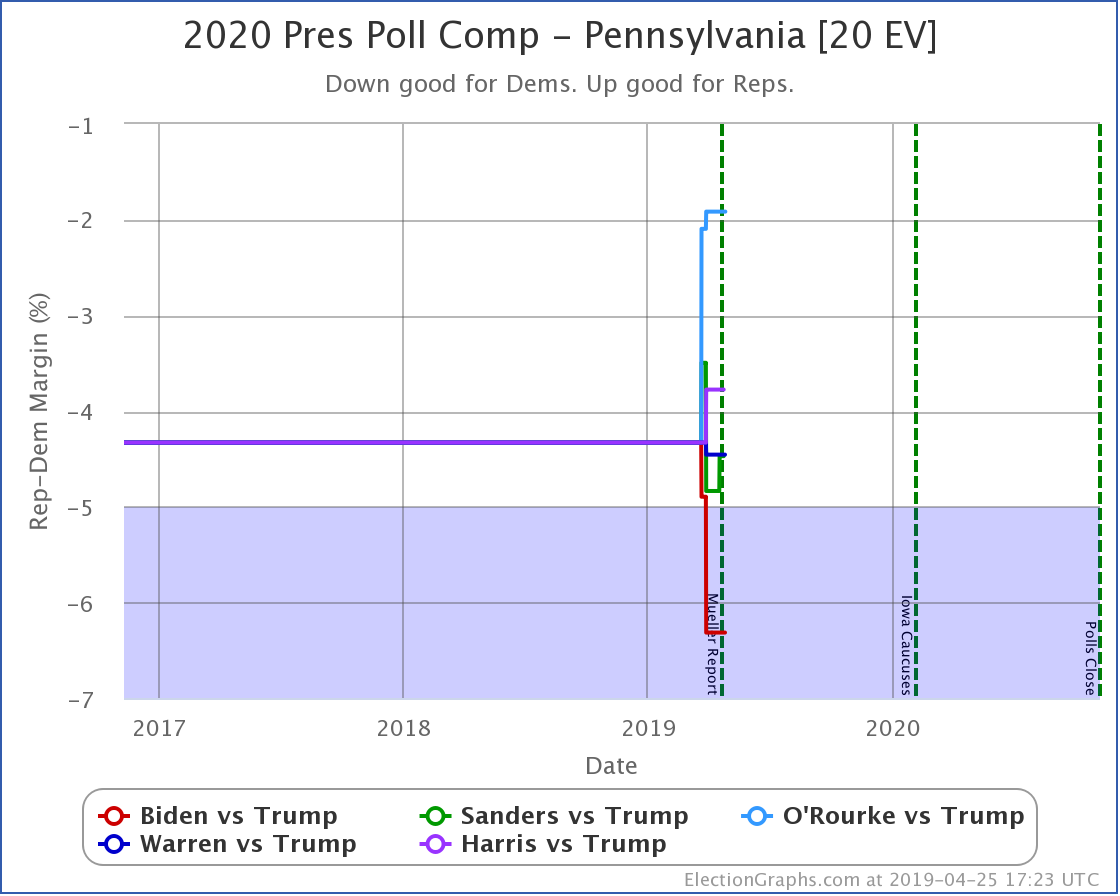
In Pennsylvania, Biden has a "strong" lead against Trump (6.3%). All the rest are in the "weak"Ā category (less than 5% ahead of Trump). Of these, O'Rourke does the worst.

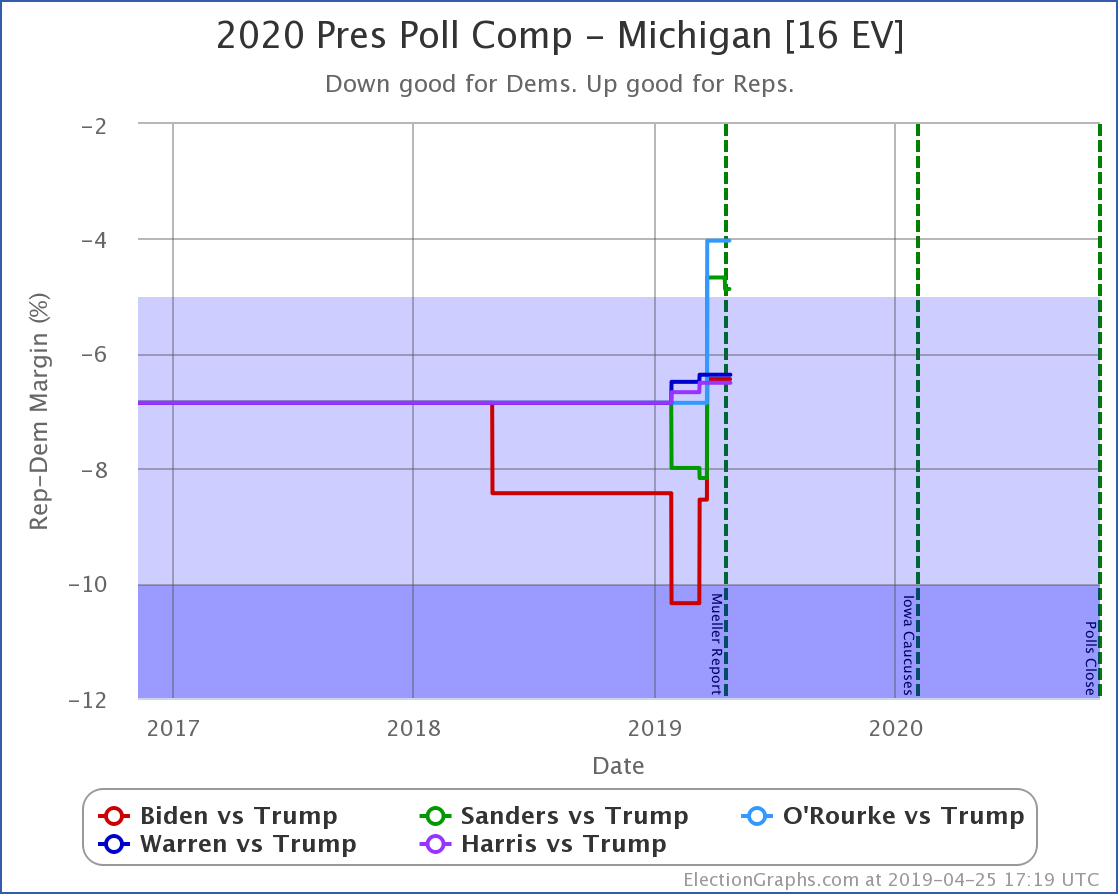
Wisconsin is one of the better-polled states so far. O'Rourke and Sanders have weak leads (less than 5%) over Trump, while Warren, Biden, and Harris now are classified as "Strong Dem" (more than 5% but less than 10%) over Trump. Biden's lead is not what it once was though, and now Michigan joins New Hampshire as one of the few states where Biden is not doing better than the other Democrats. Harris leads Trump by 6.5% compared to Biden's 6.4% lead. OK, yeah, close enough to not be a difference that matters. But given that it is such a rarity, it is worth noting.

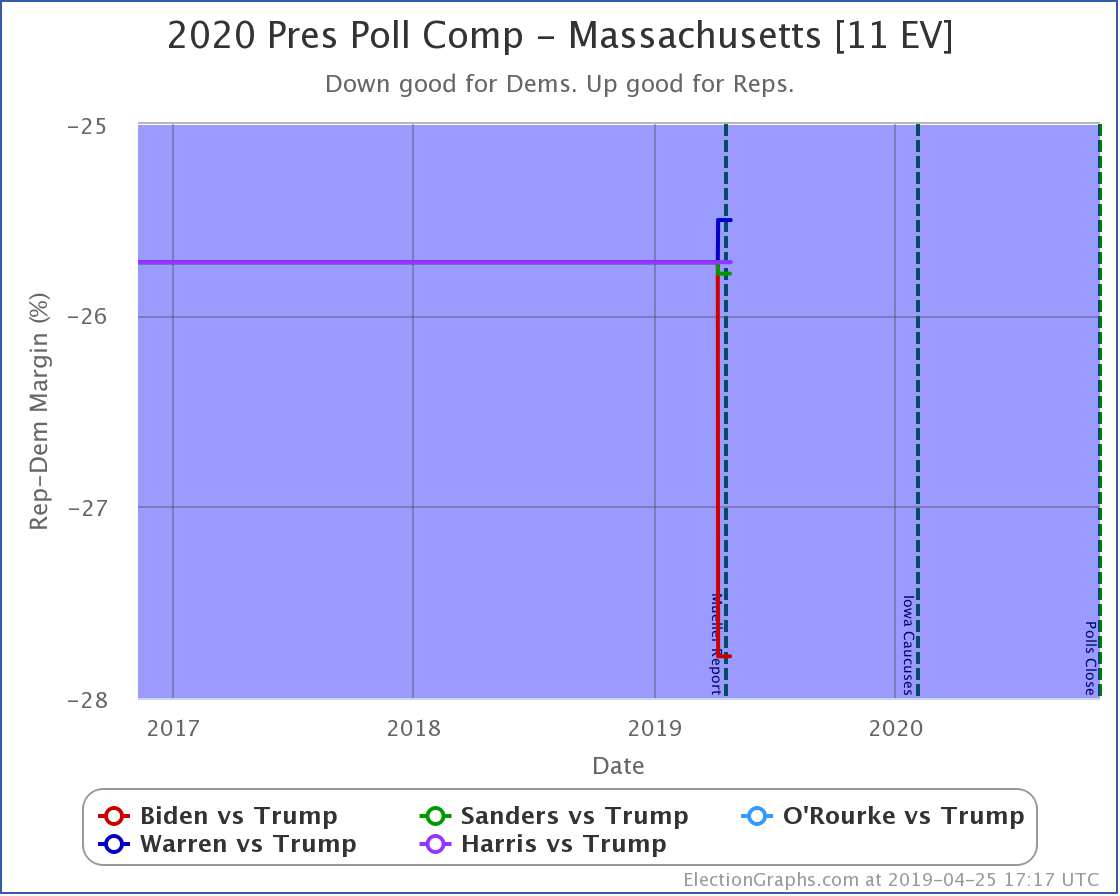
In Massachusetts, all five Democrats have solid leads (more than 10%) against Trump. Biden does best. Warren does worst.

In Wisconsin, O'Rourke and Harris have leads in the "weak" category. Biden, Sanders, and Warren have leads in the "strong" category. Biden is doing best against Trump. O'Rourke is doing worst against Trump.

In Nevada, all five Democrats lead Trump weakly. Biden does best. Warren does worst.

That's it for now.

558.1 days until polls start to close on Election Day 2020.

For more information:

This post is an update based on the data on the Election Graphs Electoral College 2020 page. Election Graphs tracks a poll-based estimate of the Electoral College. The charts, graphs, and maps in the post above are all as of the time of this post. Click through on any image to go to a page with the current interactive versions of that chart, along with additional details.

Follow @ElectionGraphs on Twitter or Election Graphs on Facebook to see announcements of updates. For those interested in individual poll updates, follow @ElecCollPolls on Twitter for all the polls as I add them. If you find the information in these posts informative or useful, please consider visiting the donation page.