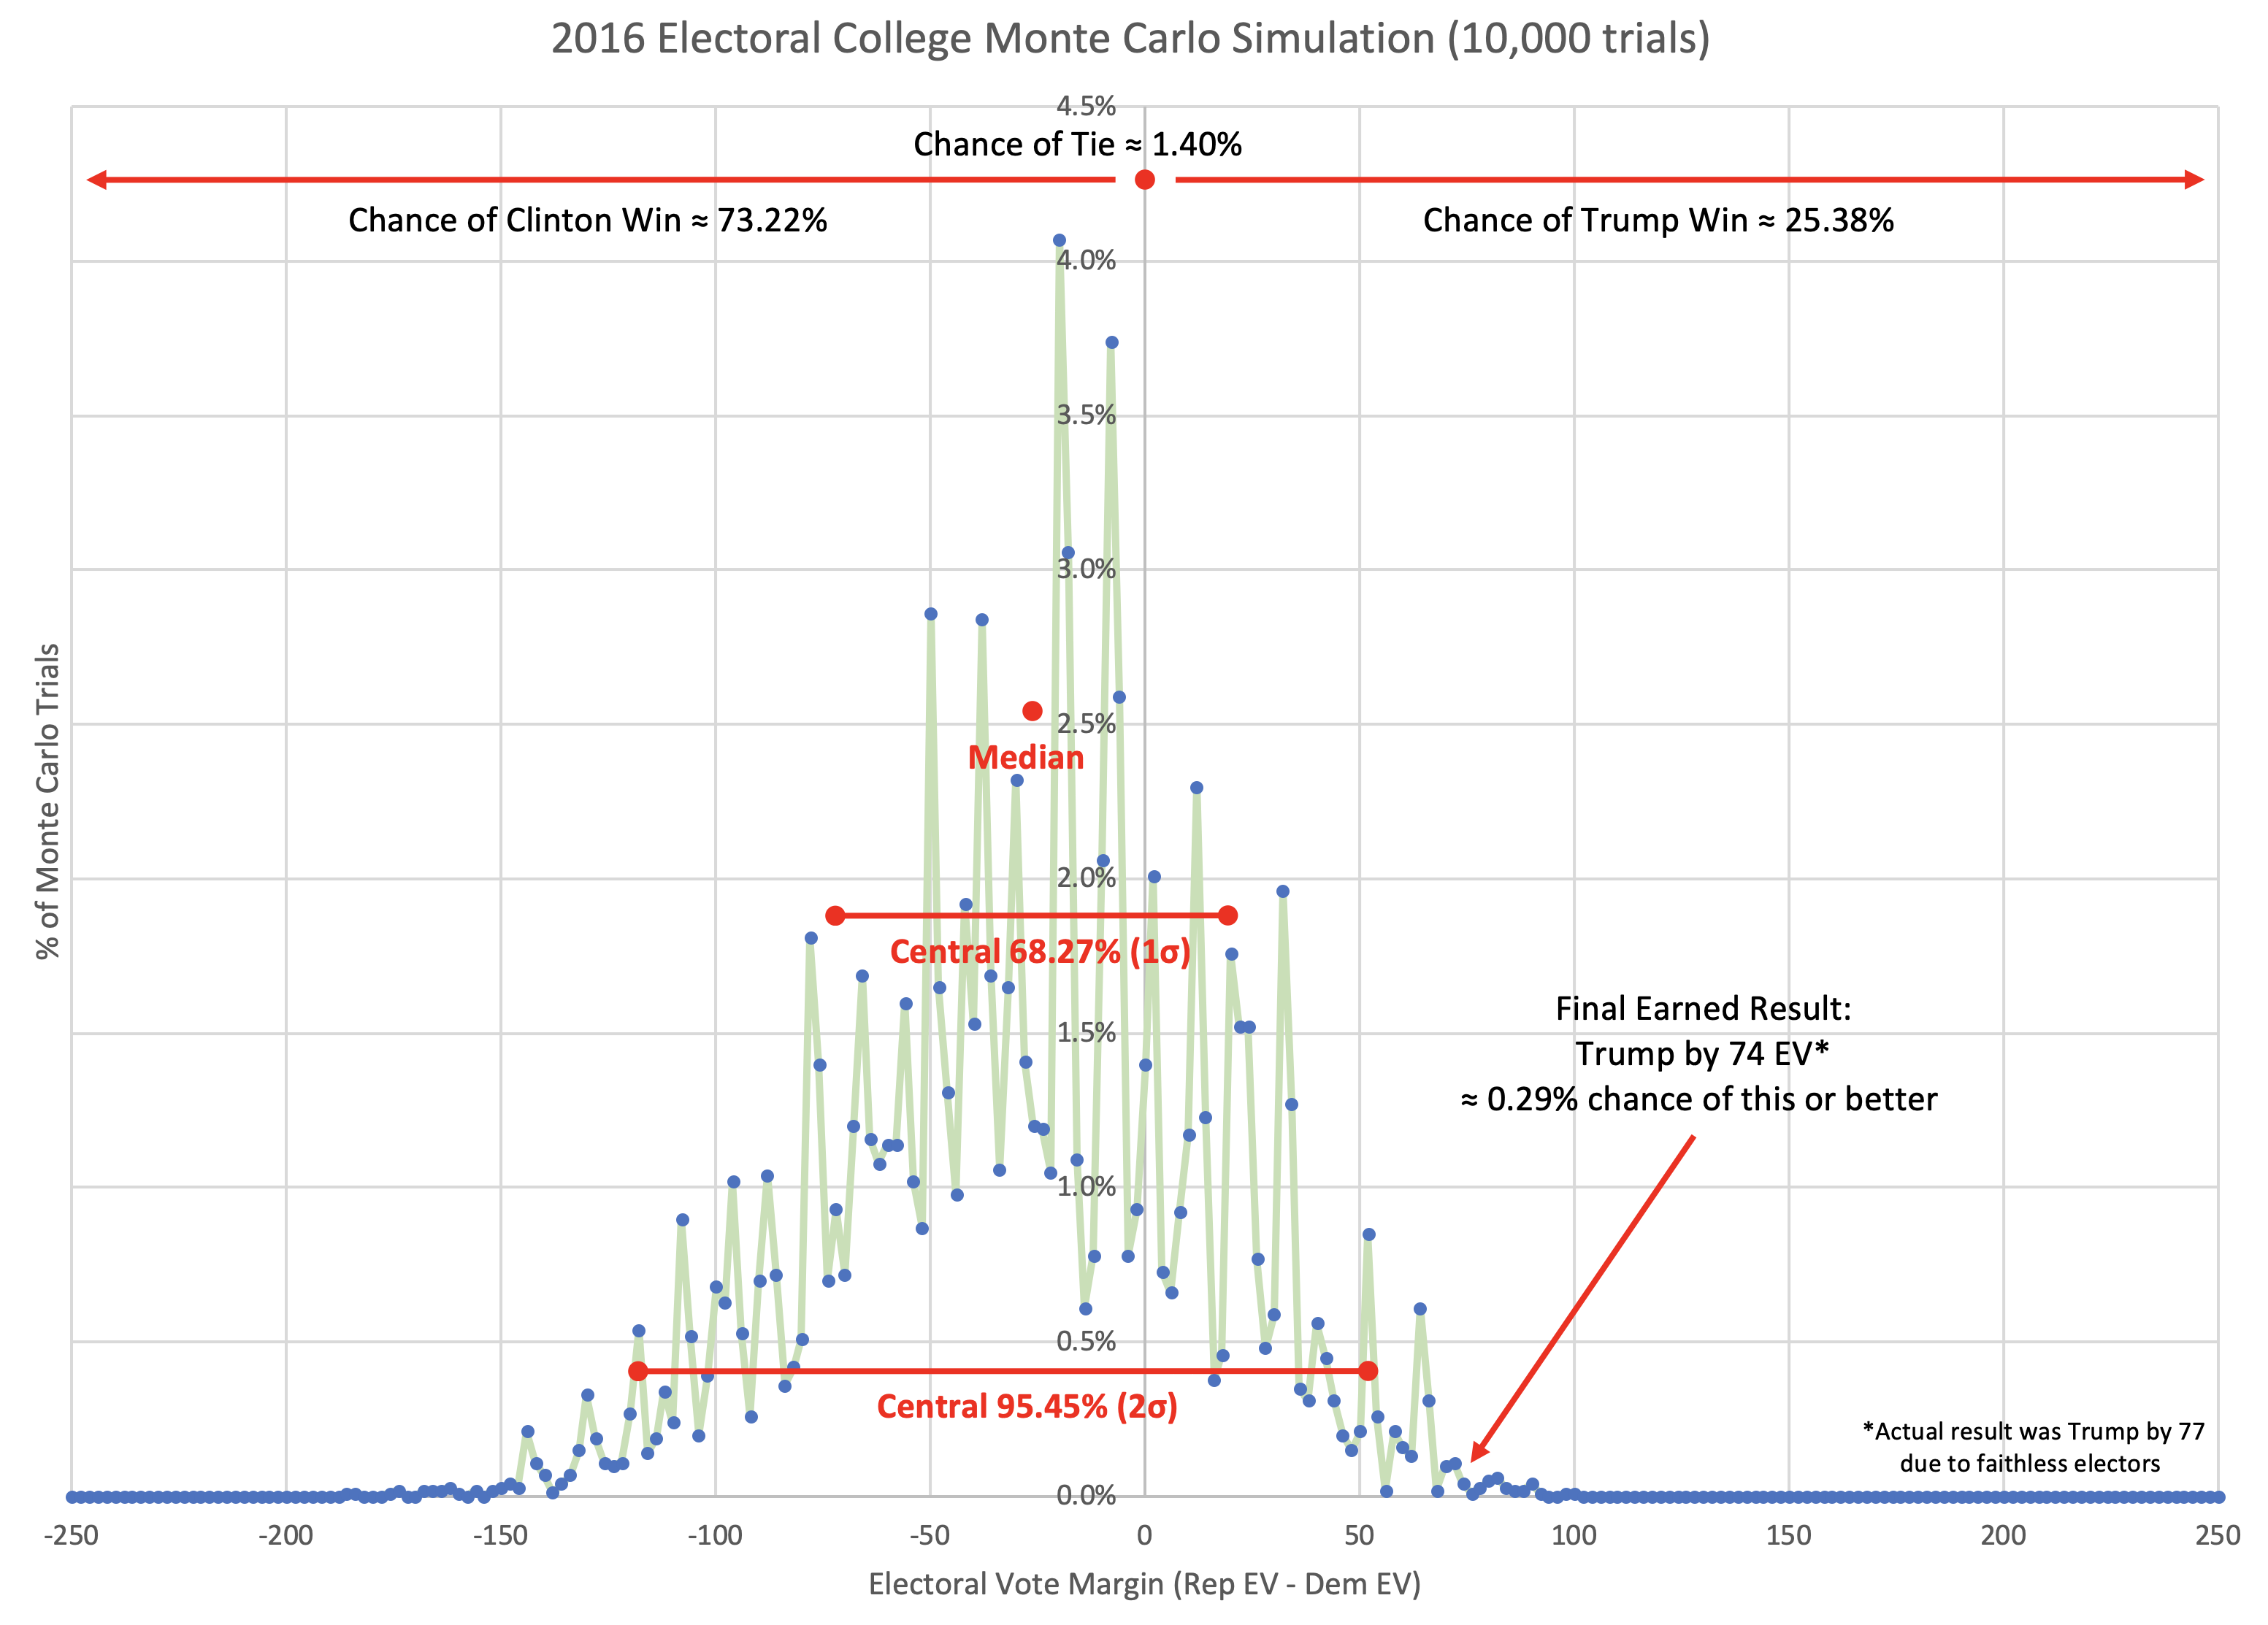
A couple of months ago, Election Graphs added charts showing how the odds of candidates winning each state evolved. Since then we have referred to those odds quite a bit, and have also discussed how I can combine those individual state by state odds through a Monte Carlo simulation.
I started doing those simulations offline and occasionally reporting results based on that here on the blog. But these were still only manual simulations I was doing offline. Nothing on the ElectionGraphs.com pages for Election 2020 showed this.
Well, a couple of weekends ago, I fixed that, and have done a bit of debugging since, so it is ready to talk about here. I have started with the comparison page where you can look at how various candidate pairs stack up against each other.
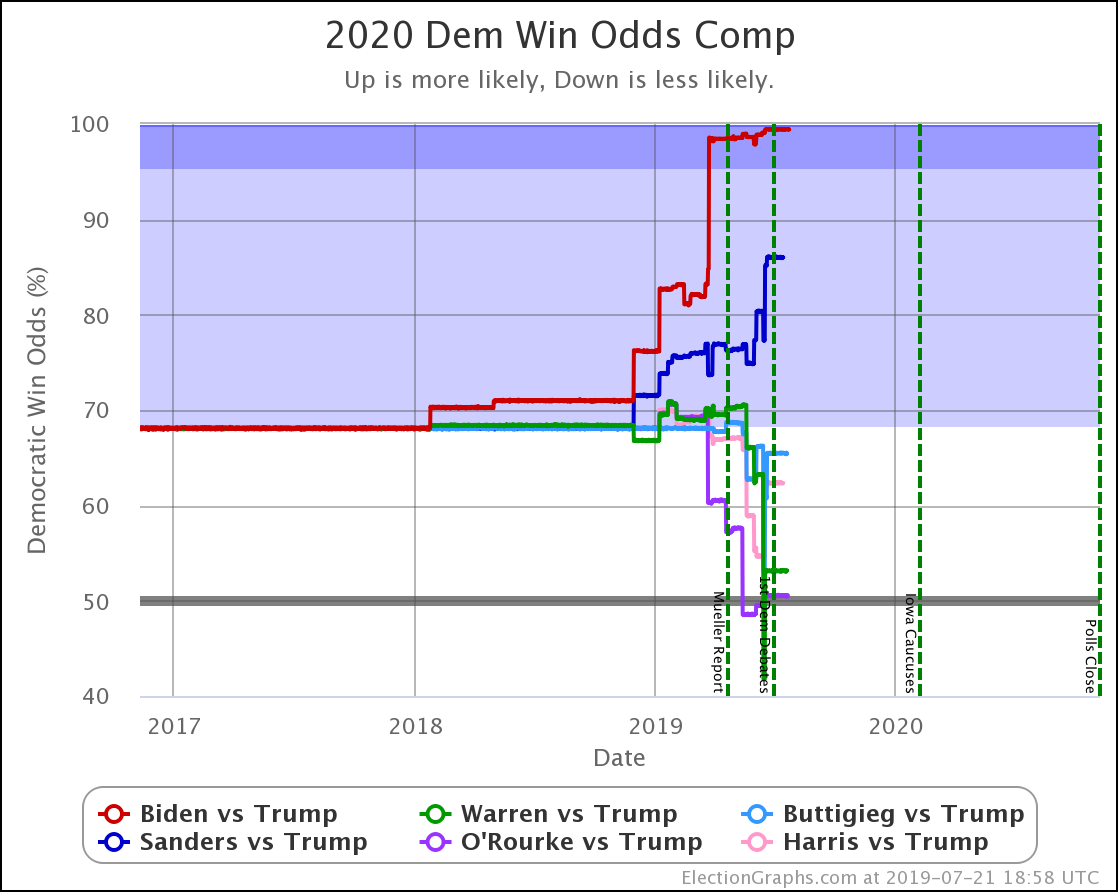
Here is the key chart:
This chart shows the evolution over time of the odds of the Democrats winning as new state polls have come in. The comparison page also shows graphs for the odds of a Republican win, if you prefer looking at things from that point of view. Those two don't add up to 100% because there is of course also a chance of a 269-269 electoral college tie, and there is also a chart of that. Together the three will add to 100%.
The charts are automatically updated as I add new polls to my database.
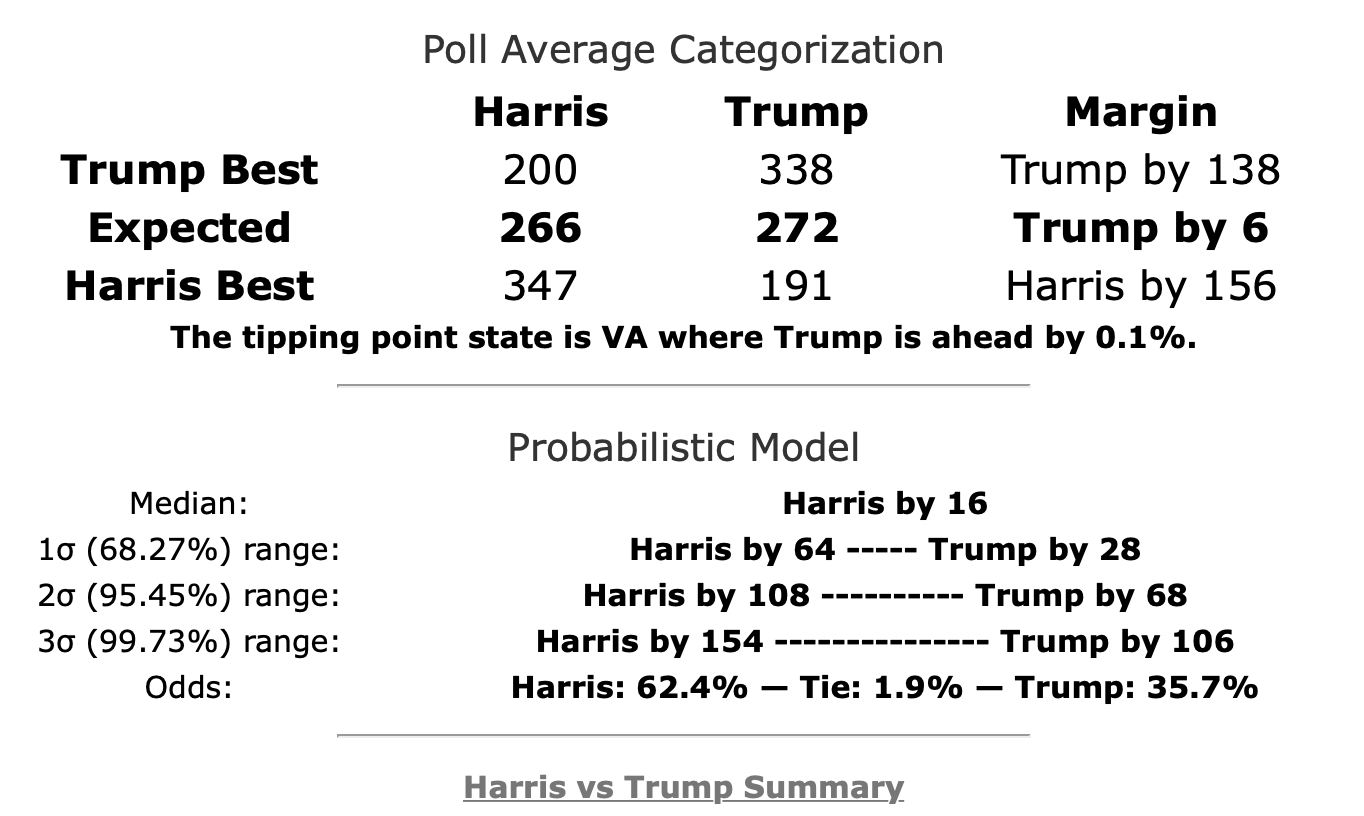
The summary block for each candidate pair on the comparison page has also been updated to include the win odds information:
For the moment this is only on the comparison page, not on the individual candidate pages. This summary also contains more detail than is available in the graphs at this point. I will be adding more charts to close that gap when I get a chance.
I've used the Harris vs. Trump summary as the example here because it (along with O'Rourke vs. Trump) contains something curious that requires a closer look. Namely, you'll notice that the "Expected" scenario (where every candidate wins all the states where they lead in the poll average) shows a different winner than the "Median" scenario (the "center" of the Monte Carlo simulations when sorted by outcome).
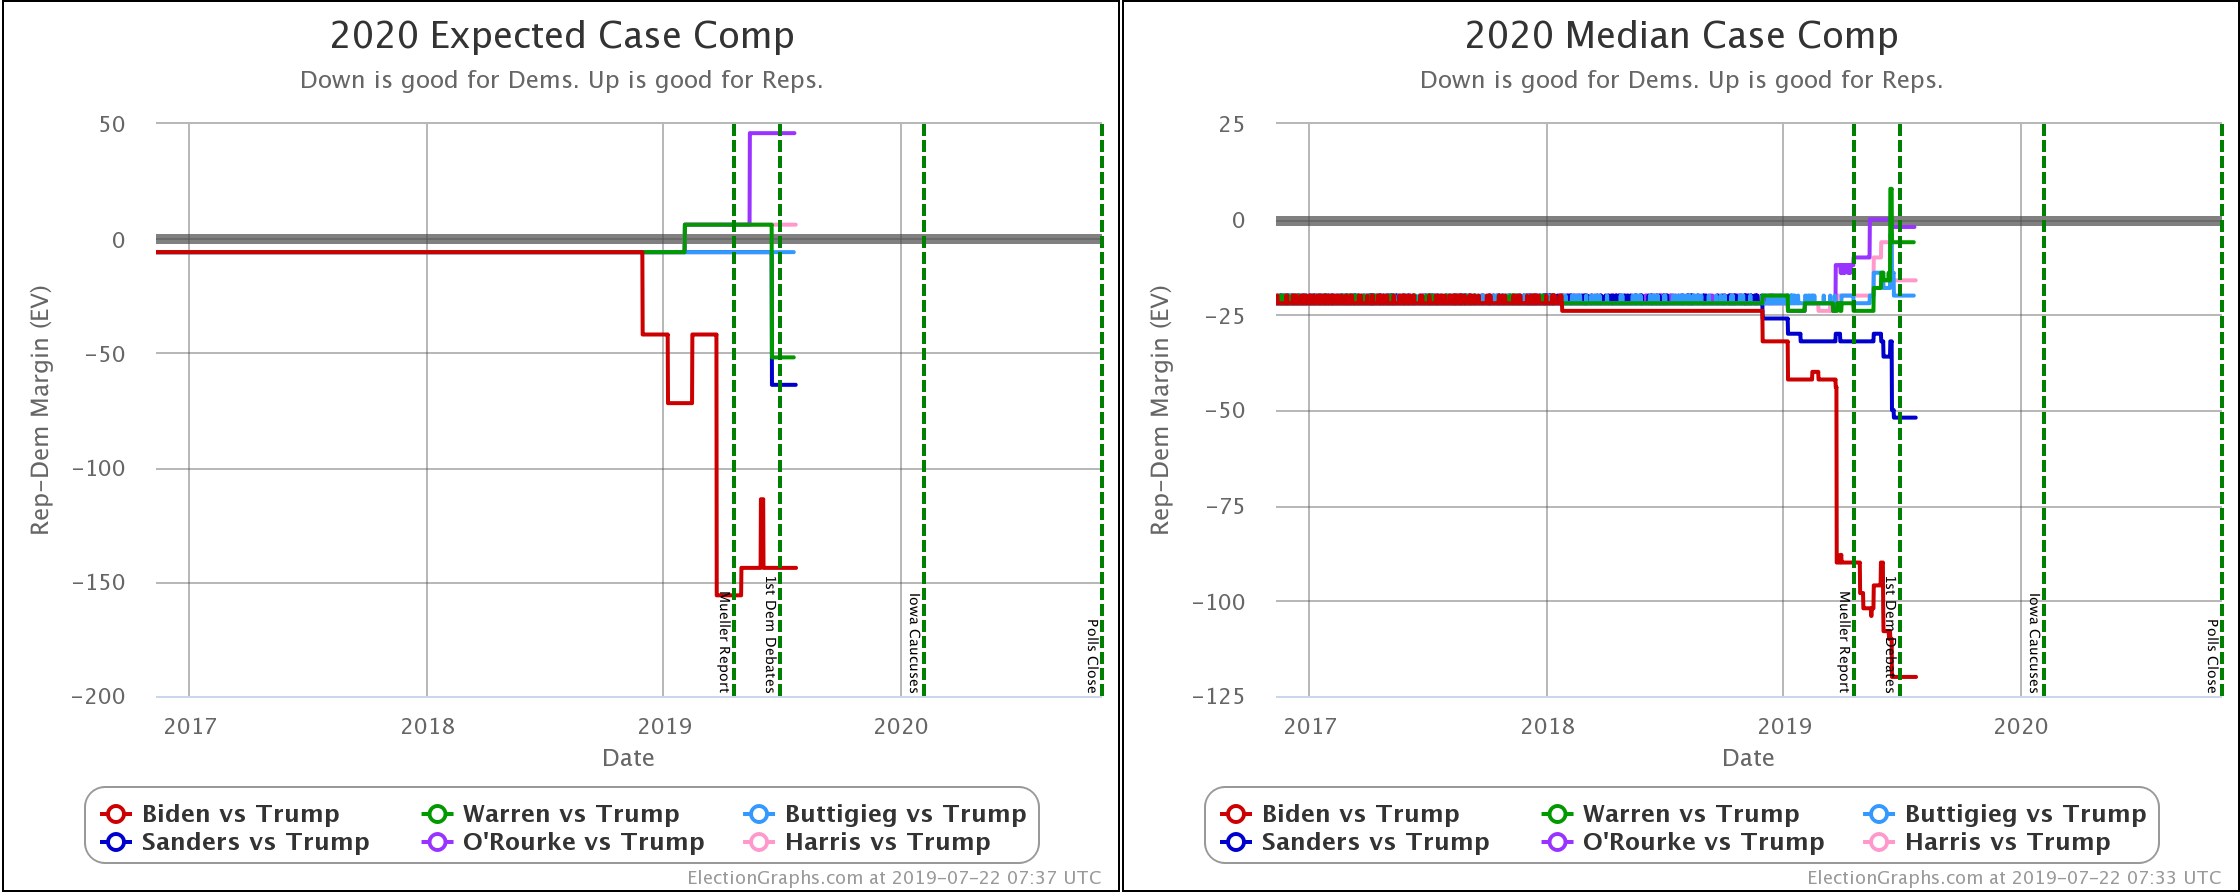
When you look at the charts for the expected case vs. the median case, it is evident that the median in the Monte Carlo simulations does not precisely track the expected case. In fact, in some instances, the trends don't even move in the same direction. So what is going on here?
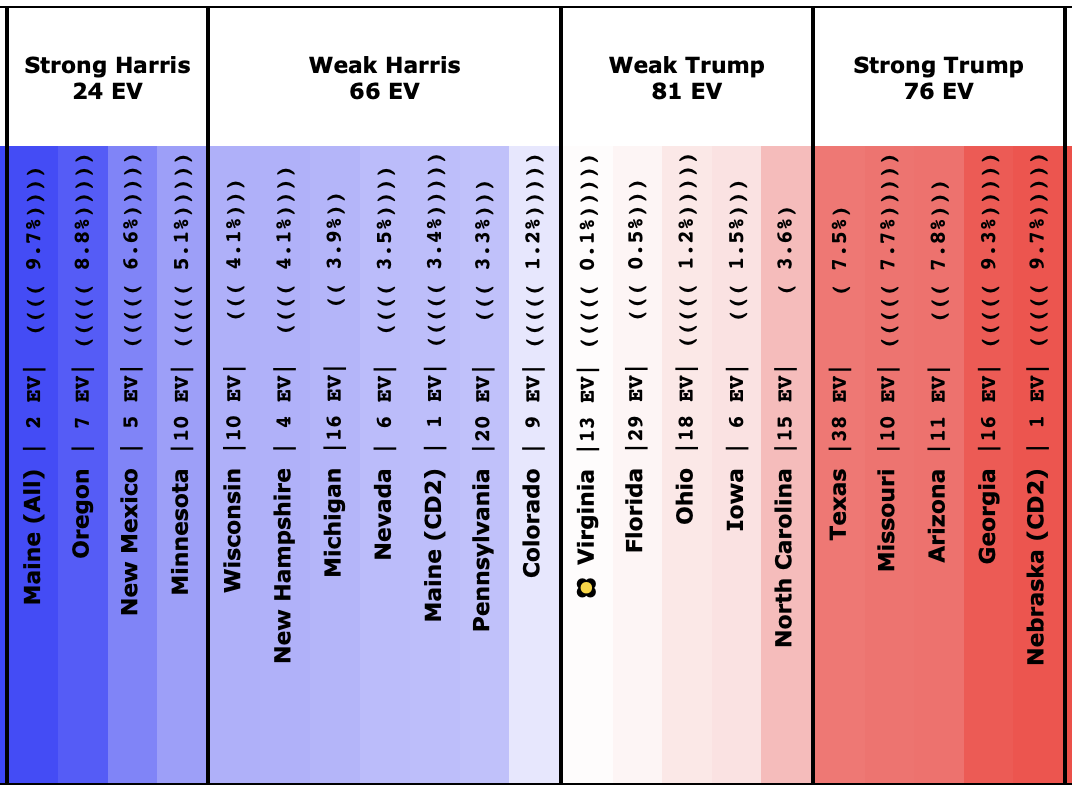
It would take some detailed digging to understand specific cases, but as an example, a quick look at the spectrum of the states for Harris vs. Trump can get some insights.
Now, I don't currently have a version of this spectrum showing win odds instead of the margin, but without that, you can still immediately see why even though Trump leads by six electoral votes "if everybody wins the states they lead", Harris might win in the median case in a simulation that looks at the situation more deeply.
The key is the margins in the swing states. With only a six electoral vote margin, it only takes three electoral votes flipping to make a 269-269 tie, and 4 to switch the winner.
Fundamentally, there are four "barely Trump" states that have a good chance of ending up going to Harris, but only one "barely Harris" jurisdiction that has a decent chance of going to Trump.
Looking at the details:
Trump's lead in Virginia's (13 EV) poll average is only 0.1%, which translates into a 44.9% chance of a Harris win.
Trump's lead in Florida's (29 EV) poll average is only 0.5%, which translates into a 40.2% chance of a Harris win.
Trump's lead in Ohio's (18 EV) poll average is only 1.2%, which translates into a 30.9% chance of a Harris win.
Trump's lead in Iowa's (6 EV) poll average is only 1.5%, which translates into a 28.4% chance of a Harris win.
Those are all the states with a Trump lead where Harris has more than a 25% chance of winning the state. Harris only needs to win ONE of those states to end up winning nationwide. Doing the math, if the odds of winning are independent (which is not strictly true, but is probably a decent first approximation), there is an 83.7% chance that Harris will win at least one of these four states.
Now, there is one Harris state where Trump has a greater than 25% chance of winning. That would be Colorado, where Harris leads by 1.2%, which translates into a 41.6% chance of a Trump win. So that compensates a bit.
But in the end, with this mix of swing states, Harris wins more often than she loses in the simulations (62.4% of the time), and the median case is a narrow 16 EV Harris win.
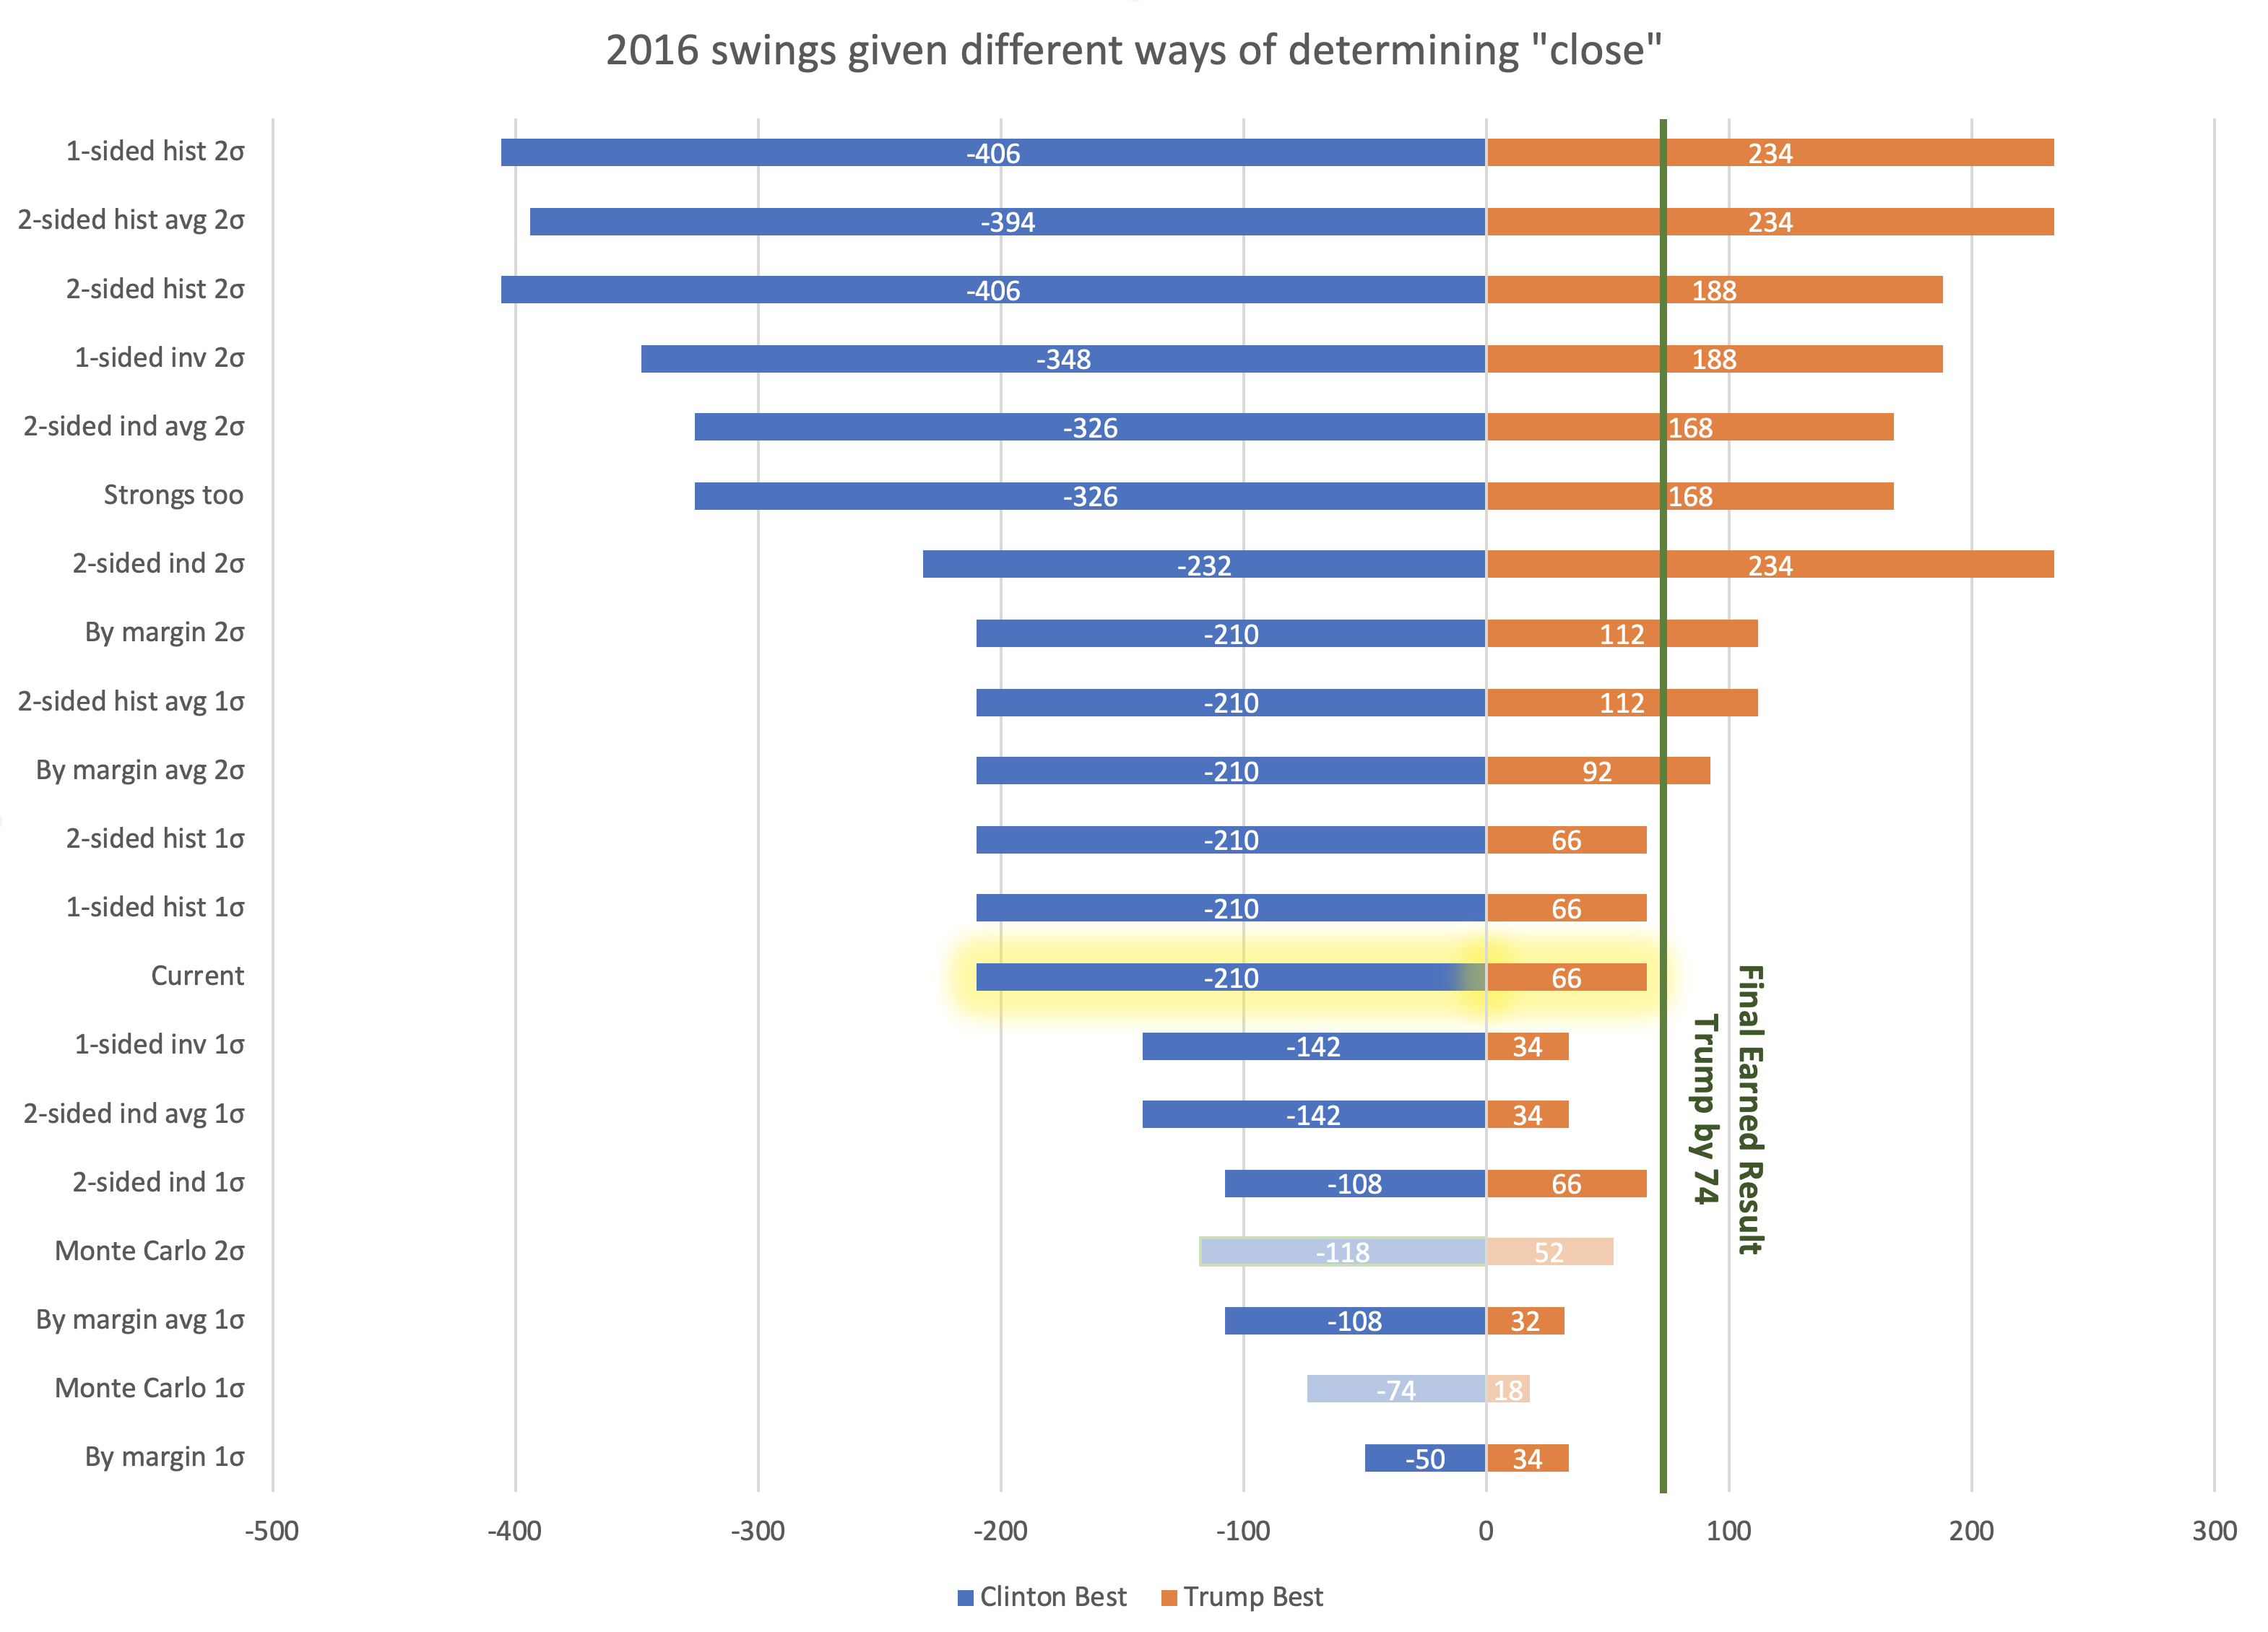
The straight-up "if everybody wins all the states they are ahead in" expected case metric is a decent way of looking at things as far as it goes. Election Graphs has used it, along with the tipping point, as the two primary methods of looking at how elections are trending in the analysis here from 2008 to 2016. And it has done pretty well. In those three elections, 155/163 ≈ 95.09% of races did indeed go to the candidates who were ahead in the poll average. That view has the advantage of simplicity.
But the Monte Carlo simulations (using state win probabilities based on Election Graph's previous results) give a way of quantifying how often the underdog wins states based on the margin, and how that rolls up into the national results. It can catch subtleties that are out of reach if you only look at who is ahead.
So from now on, Election Graphs will be looking at things both ways. The site will still have the expected case, tipping point, and "best cases" gotten from simply classifying who is leading and which states are close. But we'll also be looking at the probabilistic view. We may be looking at things the new way a bit more. But they will both be here.
Right now that information is on the national comparison page, the state detail pages, the state comparison pages, and the blog sidebar. There is still nothing about the probabilistic view on the candidate pages. That is next on the list once I get some time to put some things together.
469.6 days until polls start to close.
Stay tuned.
For more information:
This post is an update based on the data on the Election Graphs Electoral College 2020 page. Election Graphs tracks a poll-based estimate of the Electoral College. The charts, graphs, and maps in the post above are all as of the time of this post. Click through on any image to go to a page with the current interactive versions of that chart, along with additional details.
Follow @ElectionGraphs on Twitter or Election Graphs on Facebook to see announcements of updates. For those interested in individual poll updates, follow @ElecCollPolls on Twitter for all the polls as I add them. If you find the information in these posts informative or useful, please consider visiting the donation page.

