Welp, I seem to have gotten into a pattern of a blog update every 50 days, even though in my head I was aiming for every 28 days at this point. The last two posts were when there were about 500 and 450 days until the election, now there are about 400. Oops.
Posts will still accelerate as we get closer to the election of course, but the main place you should be looking for the current situation is not these blog posts anyway, it is the 2024 Electoral College page. That is updated regularly whenever new state level polls come out. At this point that is generally at least once a week, and often more frequently than that.
Because of that, I actually have now switched things around so if you just go to electiongraphs.com you will now end up there instead of the blog. You can always click through to the blog if you want, where I'll post occasional posts like this one summarizing how things have evolved lately. But you can see that from the graphs yourself too of course.
OK, before I go through the details of how things have changed over the last 50 days, here is the quick summary for those who don't want to read the rest:
- If a Biden vs Trump election was held today, it would still be a dead heat and could easily go either way. A ton of critical states are "too close to call".
- Biden has a narrow lead if you take the polls at face value, but given that on average in the last four election cycles polls have tended to underestimate the Republican, I still give Trump a slight edge on the probabilistic views.
- From November until June the trend was in Biden's direction. But some polls I added in August, which covered late June dates, bounced things back in Trump's direction a bit, and things have been pretty steady since then.
OK, now for all the detail for folks who want it.
I'm not going to count and list all the individual polls that have been entered since the last update like I have before. Takes too much time. For those who just want to see a list of all the polls, look here.
If you want updates on each and every poll as it comes out, as well as daily summaries of the status for the best polled matchup (currently Biden vs Trump), follow Election Graphs on Mastodon.
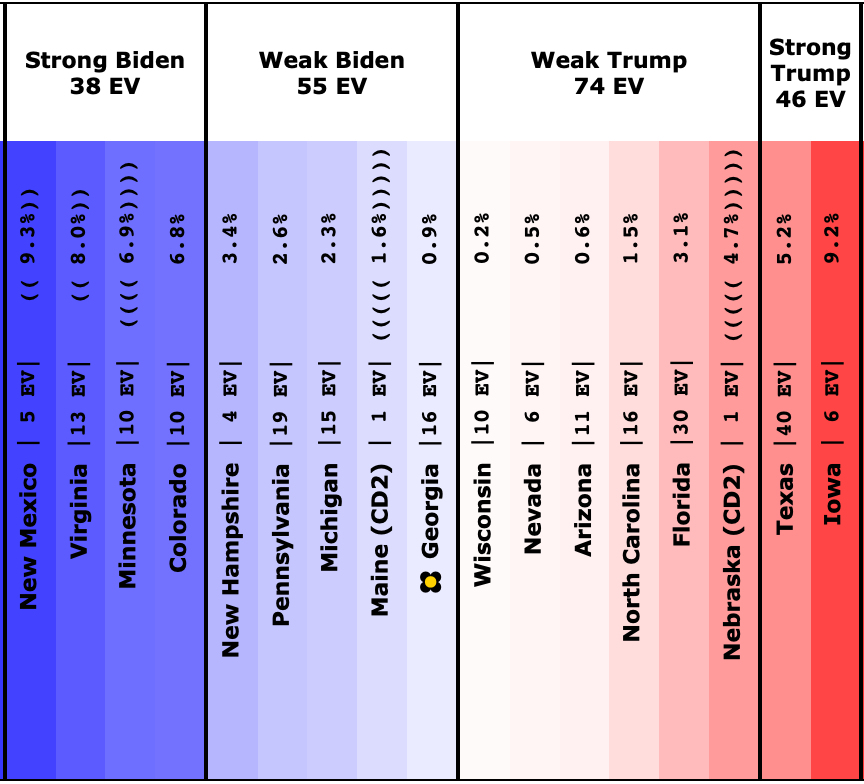
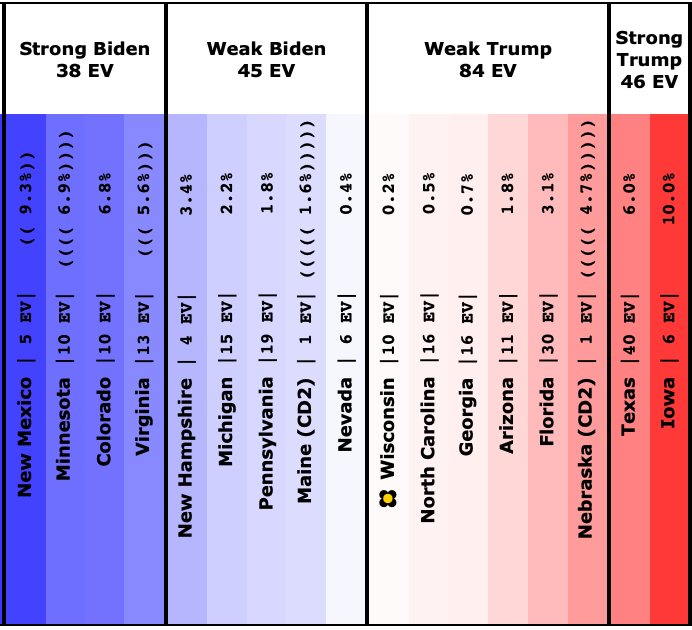
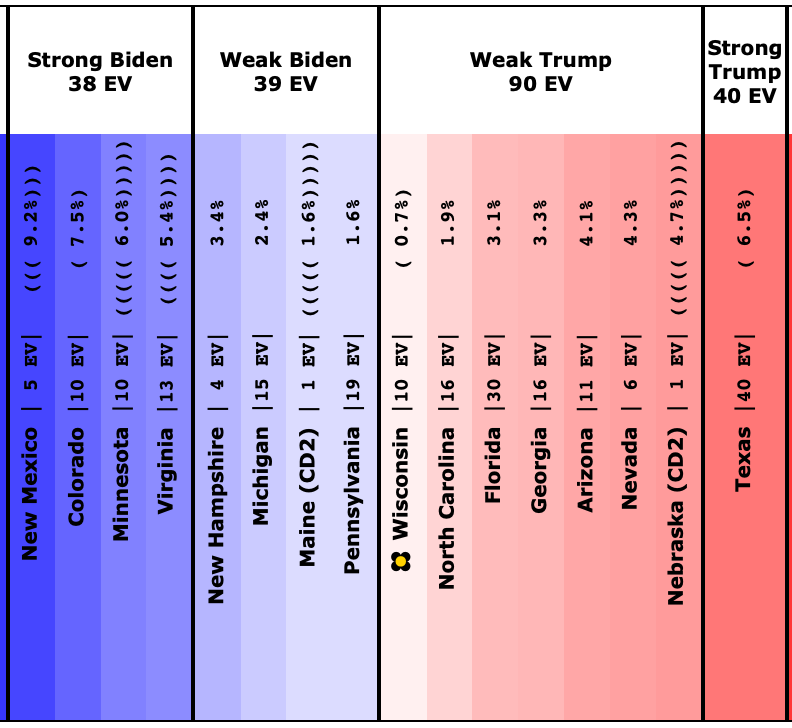
OK, so to get started, we will look at how the spectrum of close states has changed.
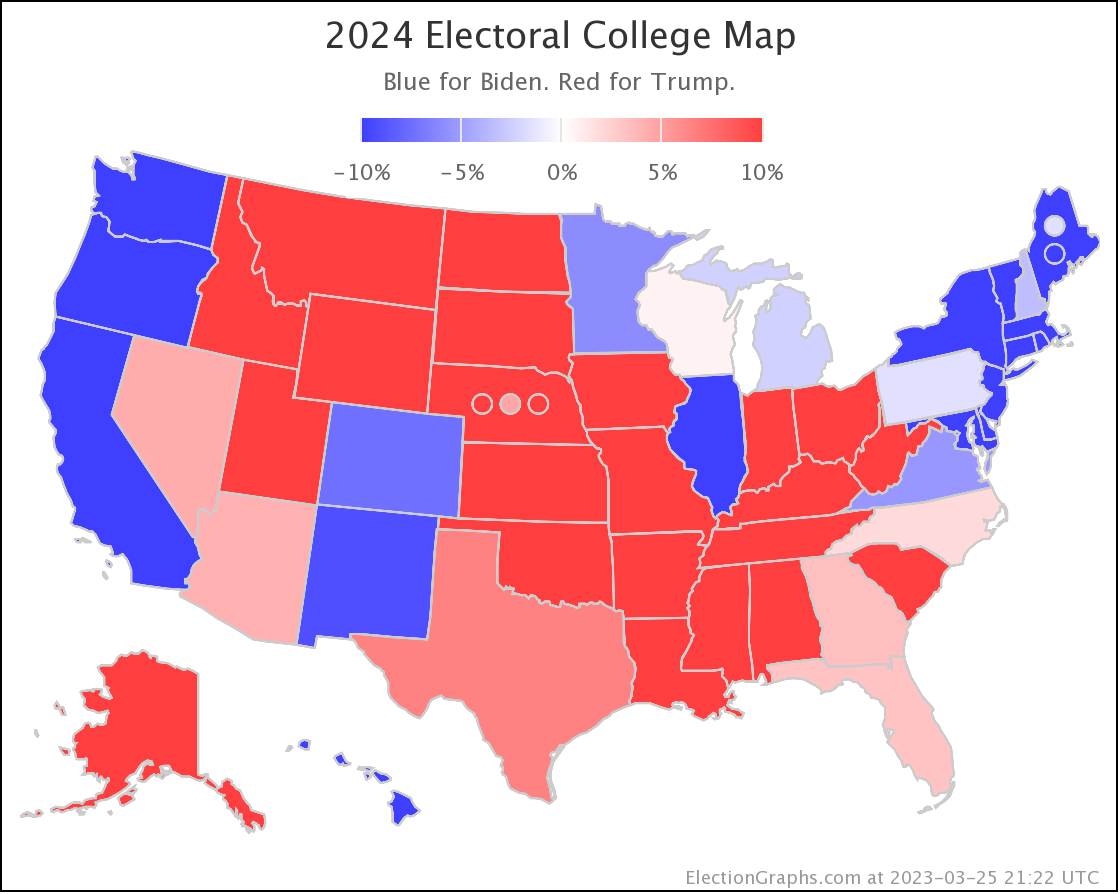
This is how it looked when I did the last blog post on 2023-08-13:
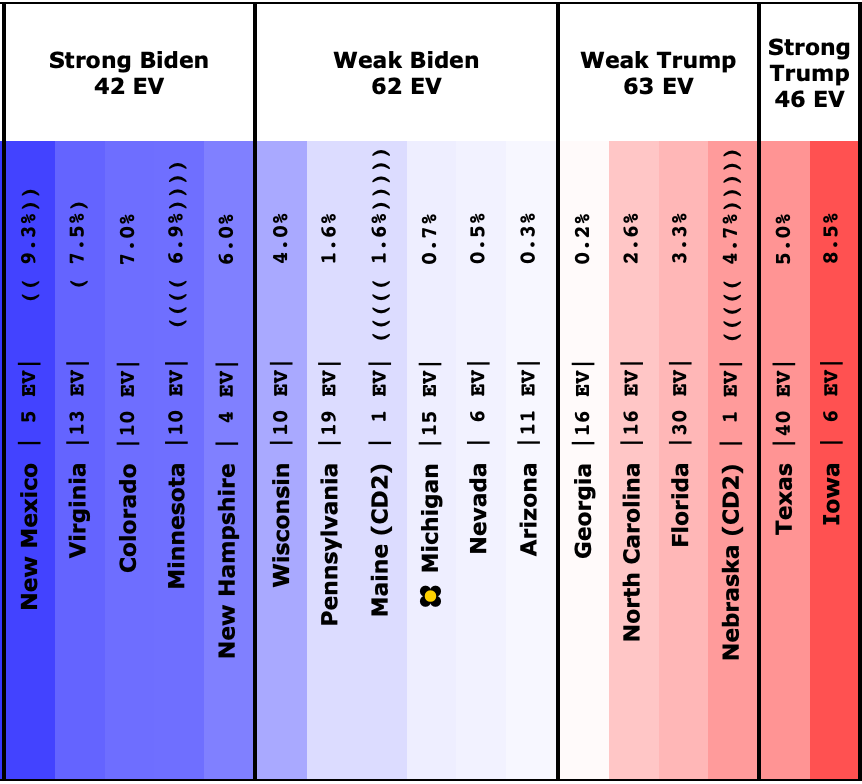
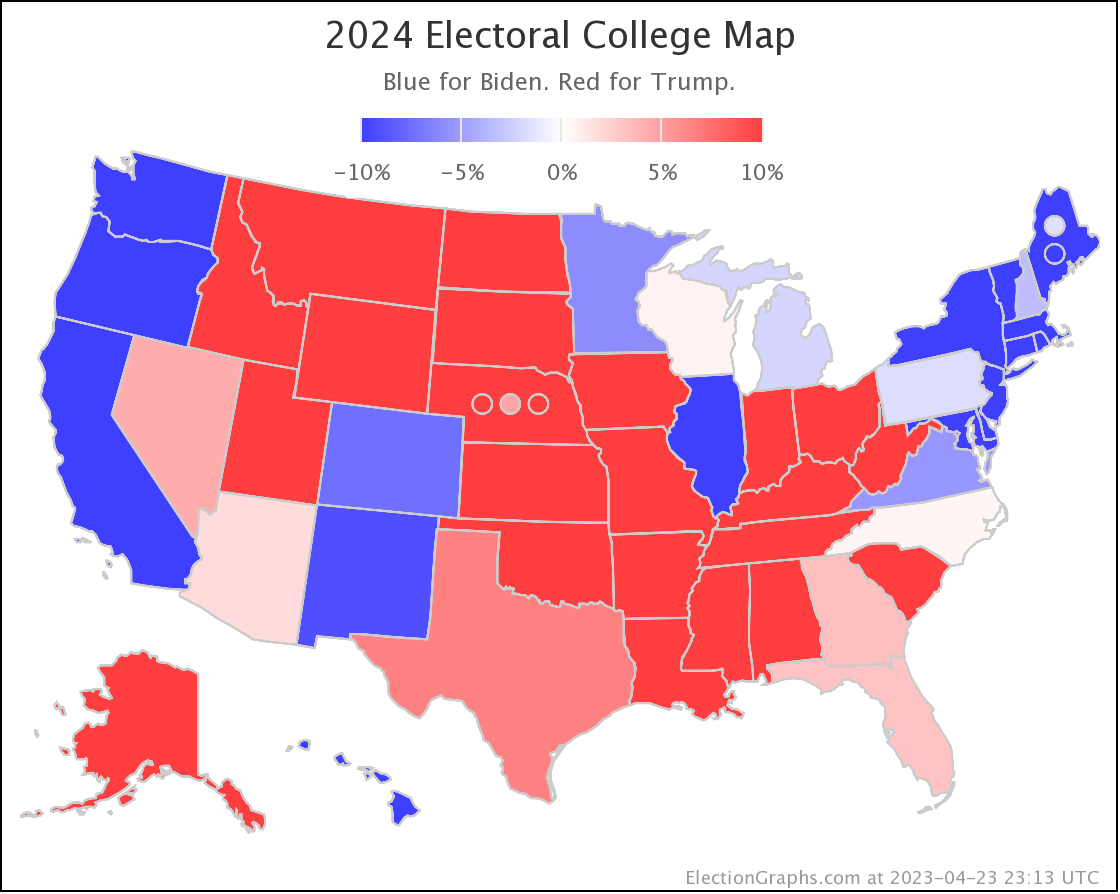
And here is how it looks now on 2023-10-02:
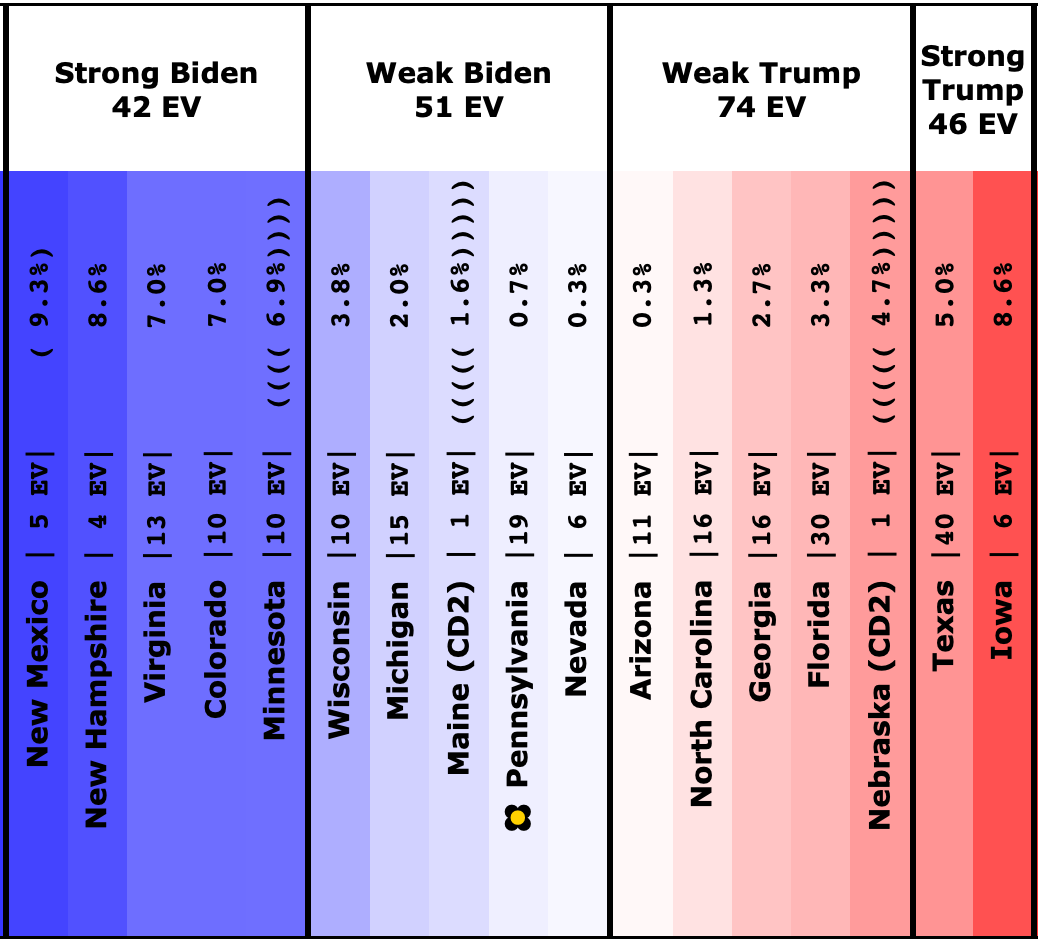
The states where the poll average moved toward Trump are:
- Pennsylvania (19 EV): Biden by 1.6% -> Biden by 0.7% (Trump+0.9%)
- Arizona (11 EV): Biden by 0.3% -> Trump by 0.3% (Trump+0.6%)
- Virginia (13 EV): Biden by 7.5% -> Biden by 7.0% (Trump+0.5%)
- Wisconsin (10 EV): Biden by 4.0% -> Biden by 3.8% (Trump+0.2%)
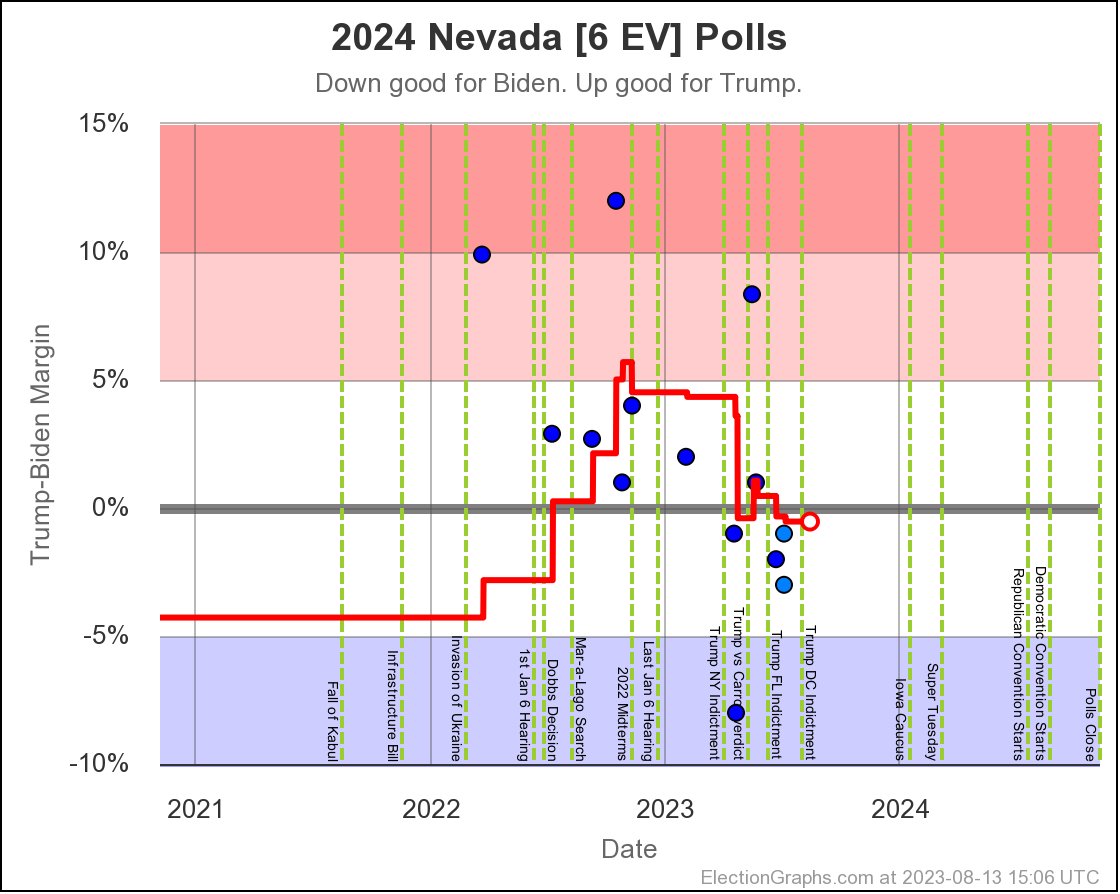
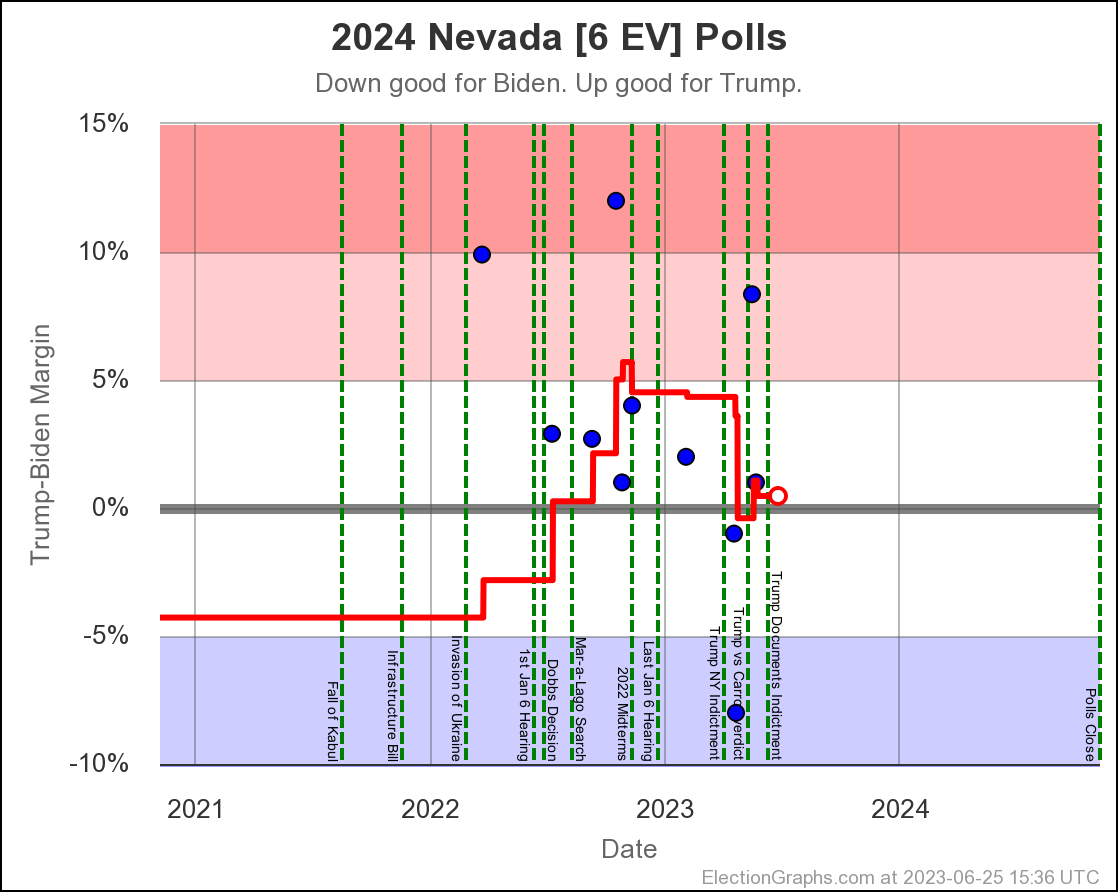
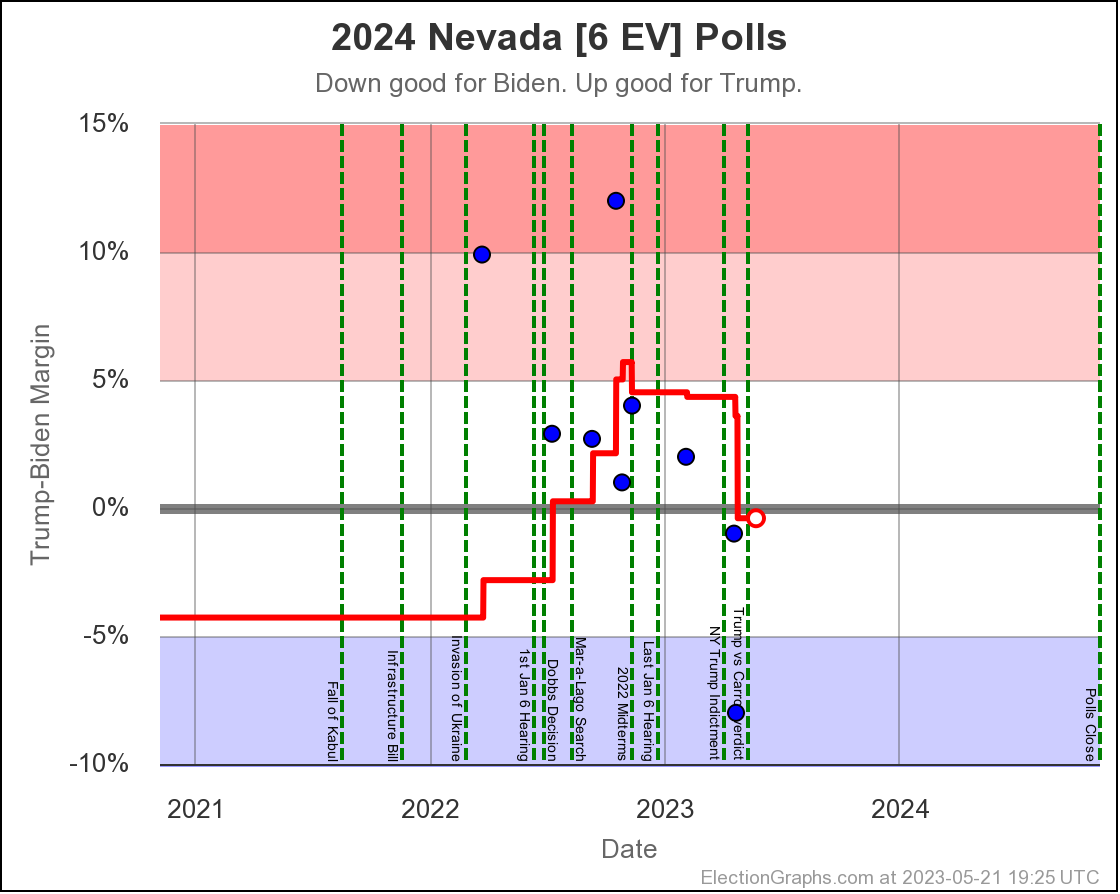
- Nevada (6 EV): Biden by 0.5% -> Biden by 0.3% (Trump+0.2%)
- Iowa (6 EV): Trump by 8.5% -> Trump by 8.6% (Trump+0.1%)
And the states where the poll average moved toward Biden are:
- Michigan (15 EV): Biden by 0.7% -> Biden by 2.0% (Biden+1.3%)
- North Carolina (16 EV): Trump by 2.6% -> Trump by 1.3% (Biden+1.3%)
- New Hampshire (4 EV): Biden by 6.0% -> Biden by 8.6% (Biden+2.6%)
Overall, this time more states in this center part of the spectrum are moving toward Trump than toward Biden.
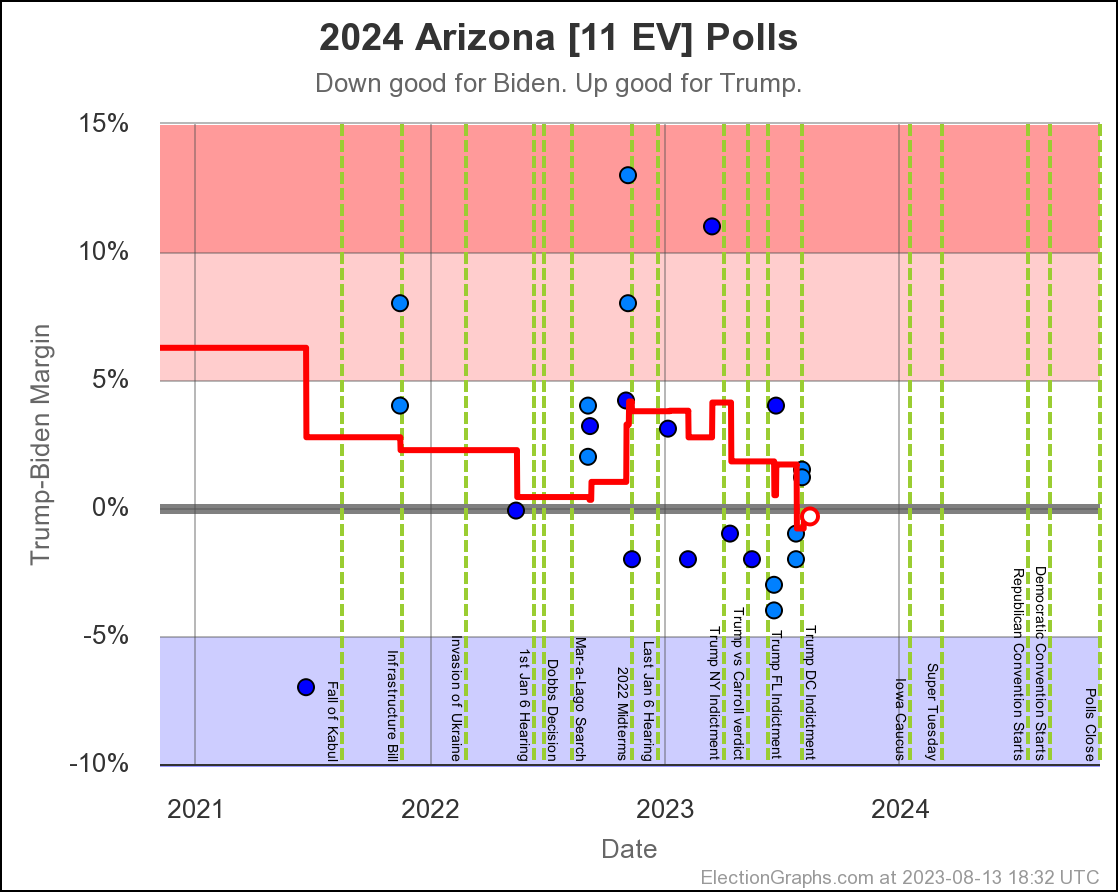
Only Arizona crossed the center line this time though. Lets see what is happening there:
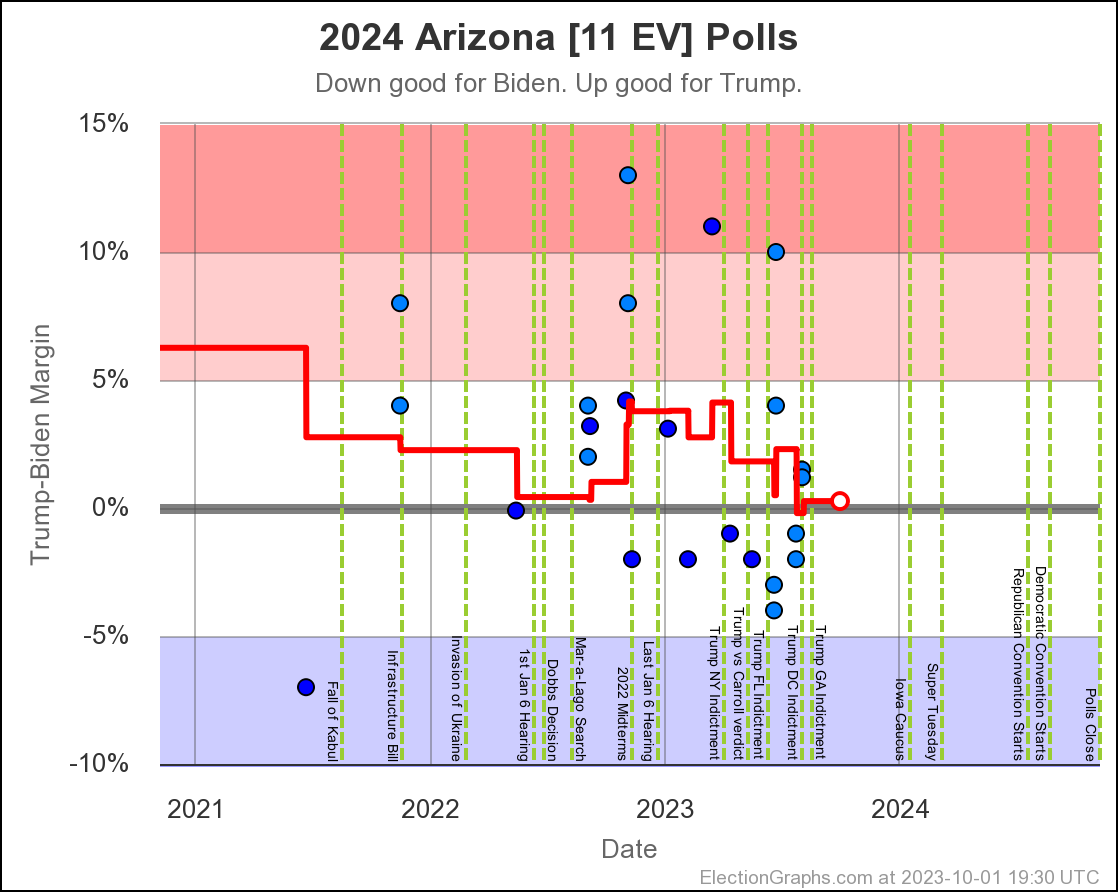
Last time Arizona was just barely on the Biden side. Now it is just barely on the Trump side. All but one of the 5 polls in the average show a margin under 5%.
The exception is a Prime poll that released 2 results. First was a 4% Trump lead in a straight Biden vs Trump matchup. Second was if you added a hypothetical unnamed No Labels candidate. That expanded Trump's lead to 10%. In the case of polls that release multiple results, I include them as their average within the larger average, so this shows a 7% Trump lead for aggregate of the two Prime results. Absent that, Arizona would still be slightly on the blue side. But I don't pick and choose polls to include. The average is the average.
Given we are right on the edge, it would be reasonable to expect Arizona to bounce back and forth around that centerline a bit as the next few Arizona polls come in.
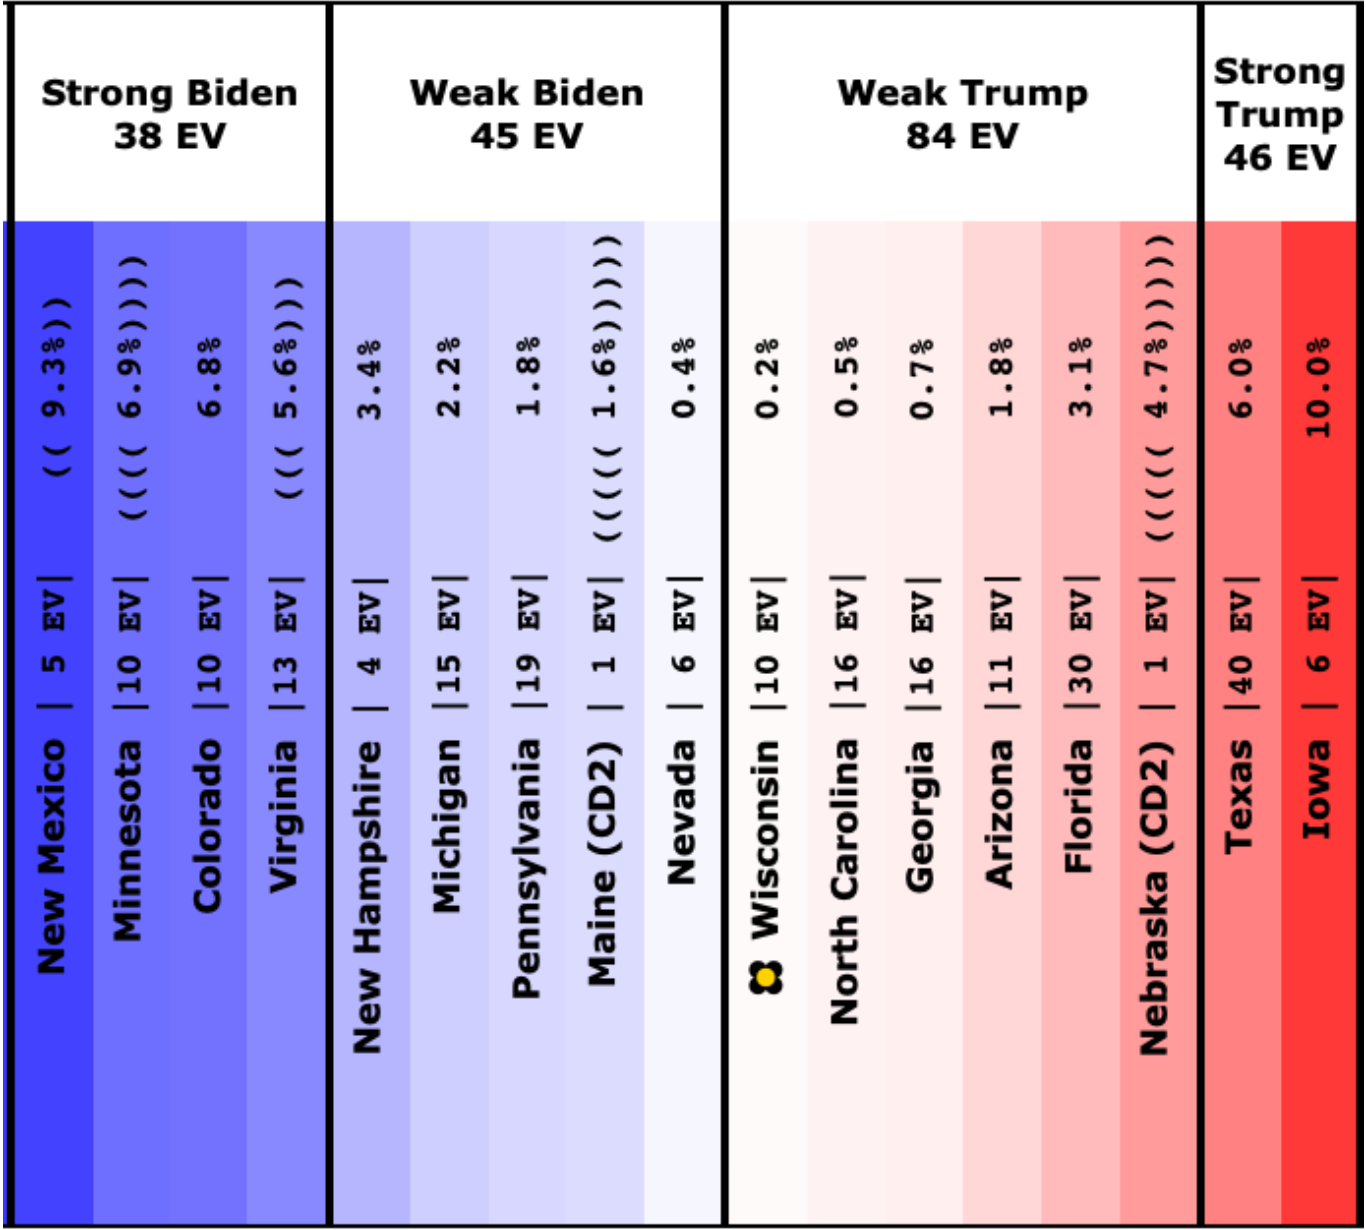
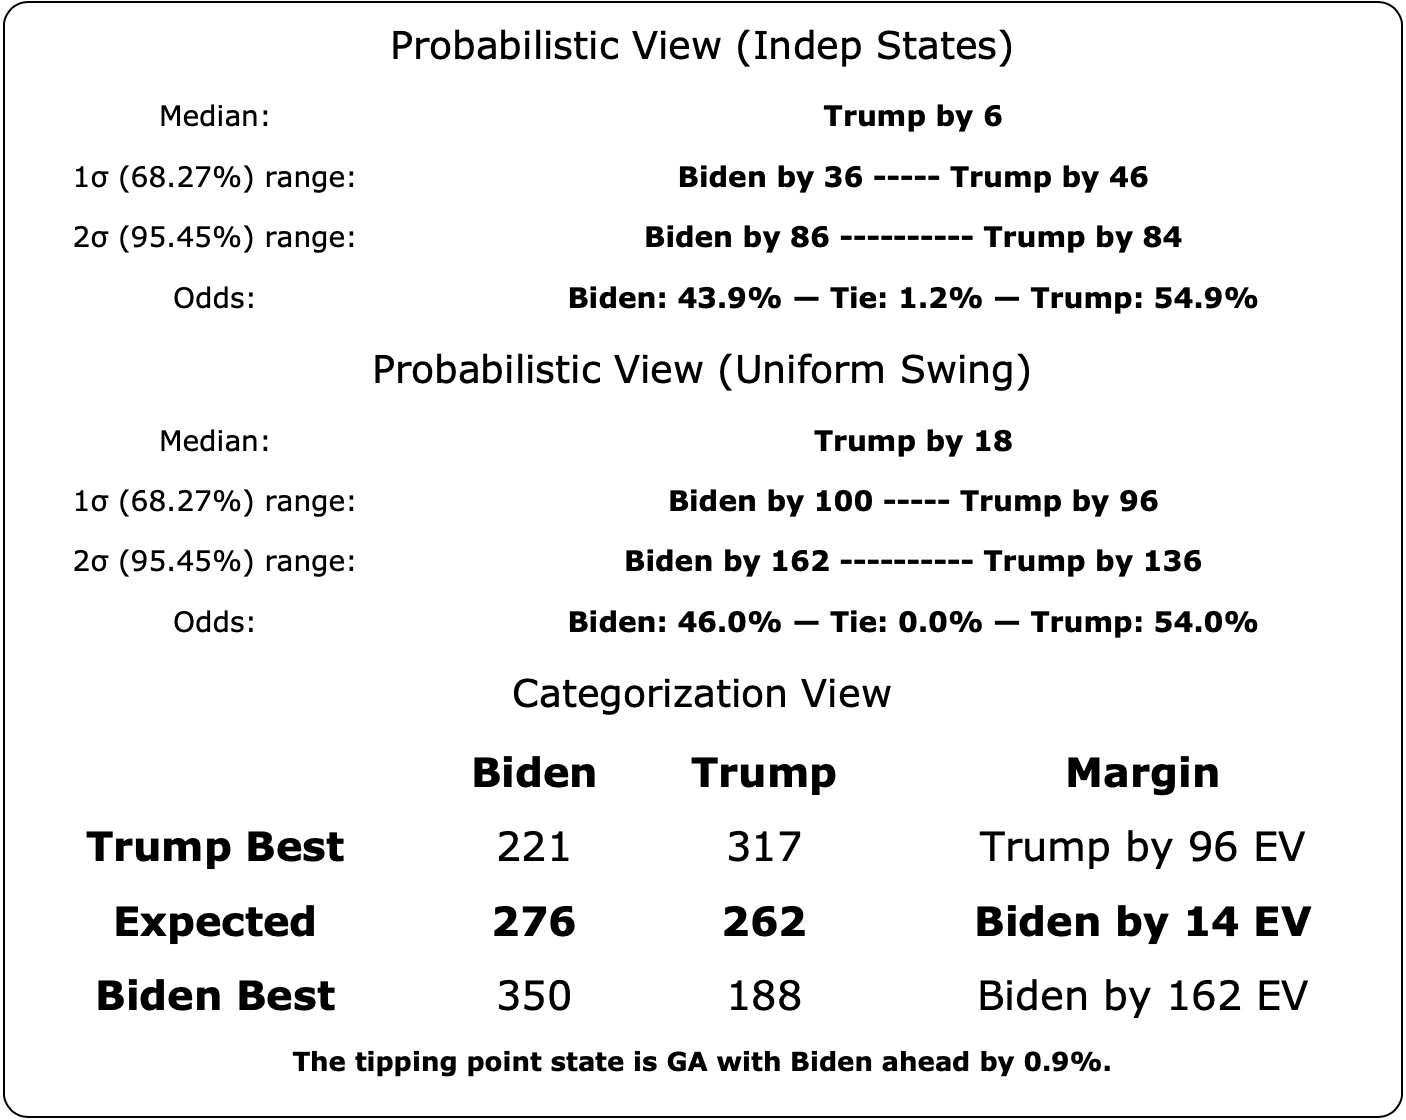
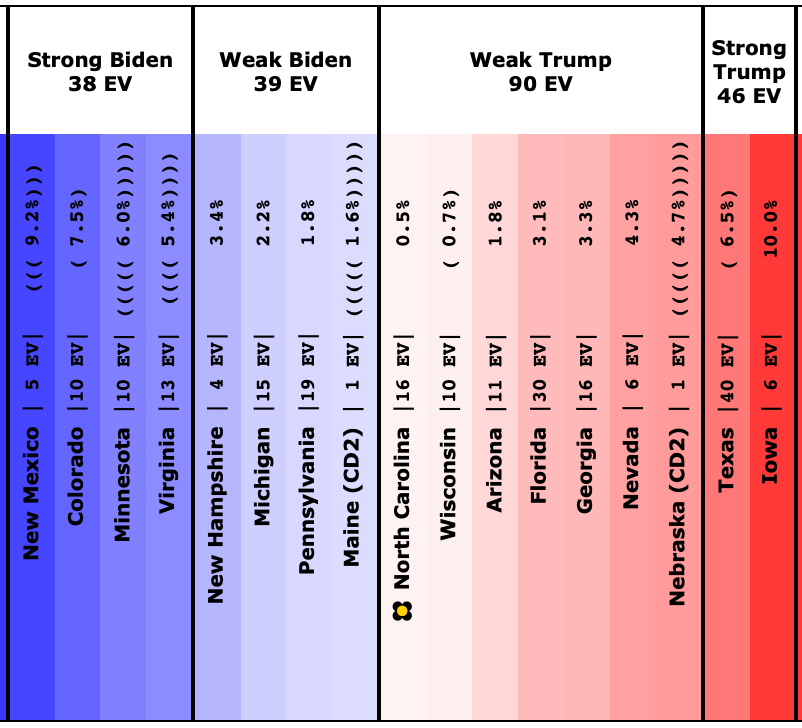
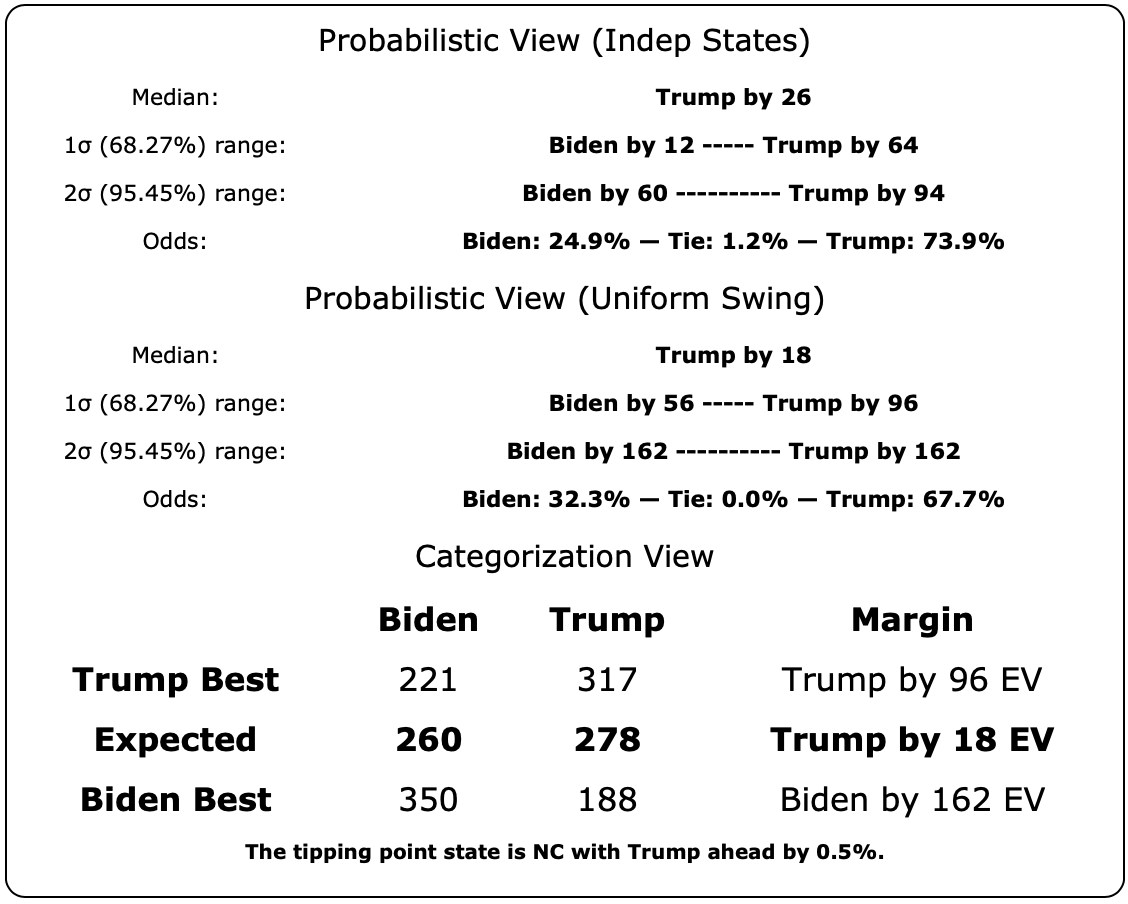
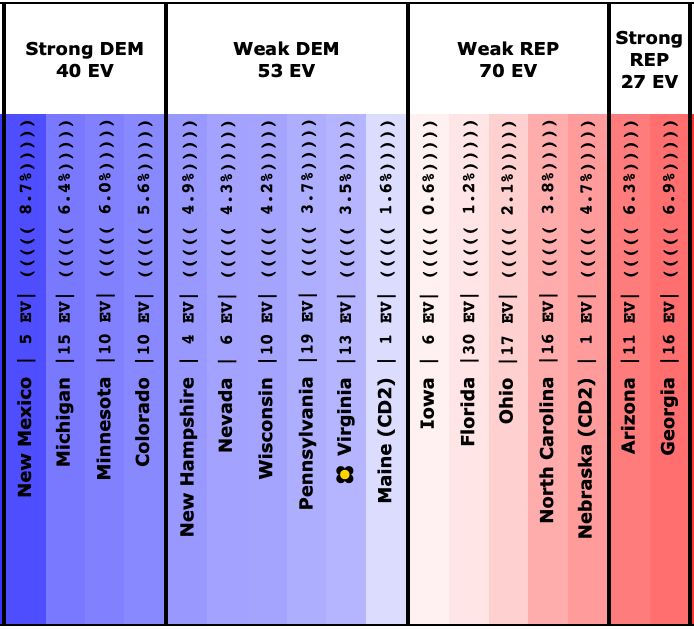
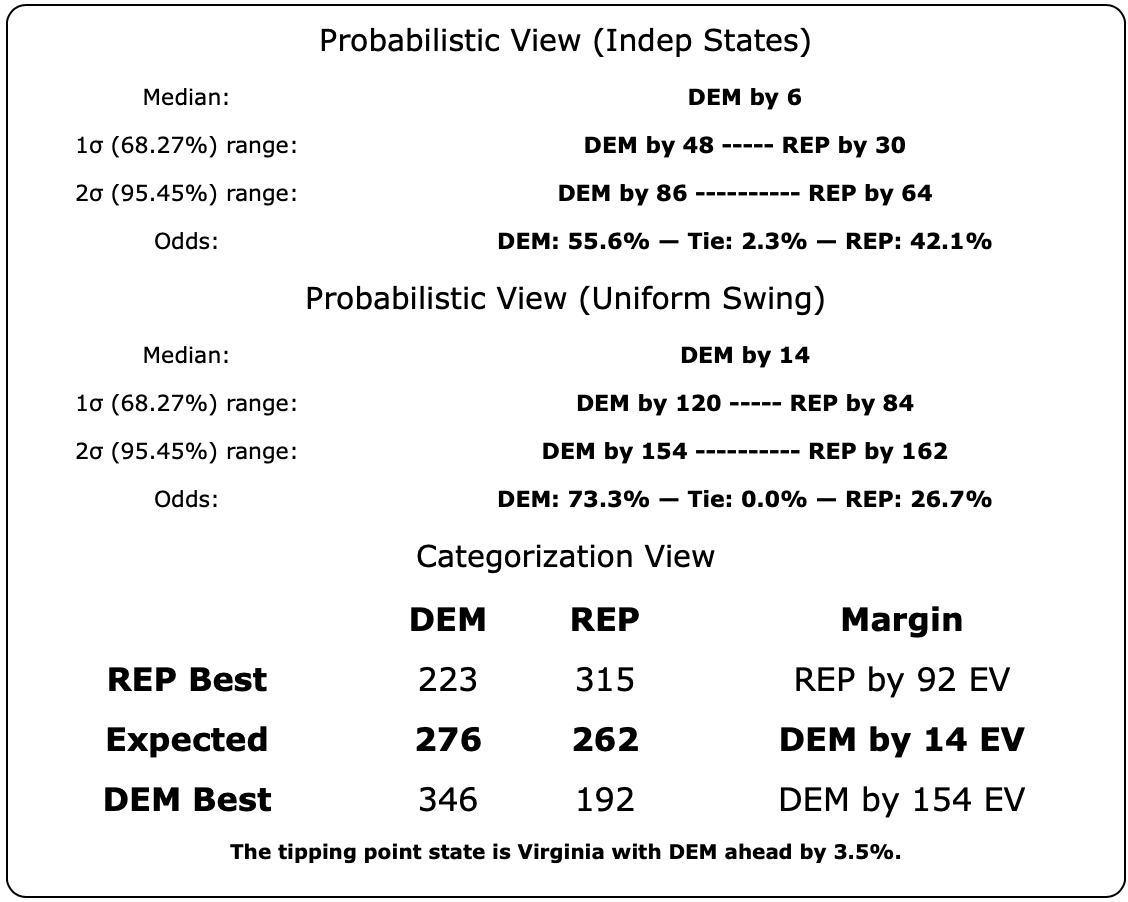
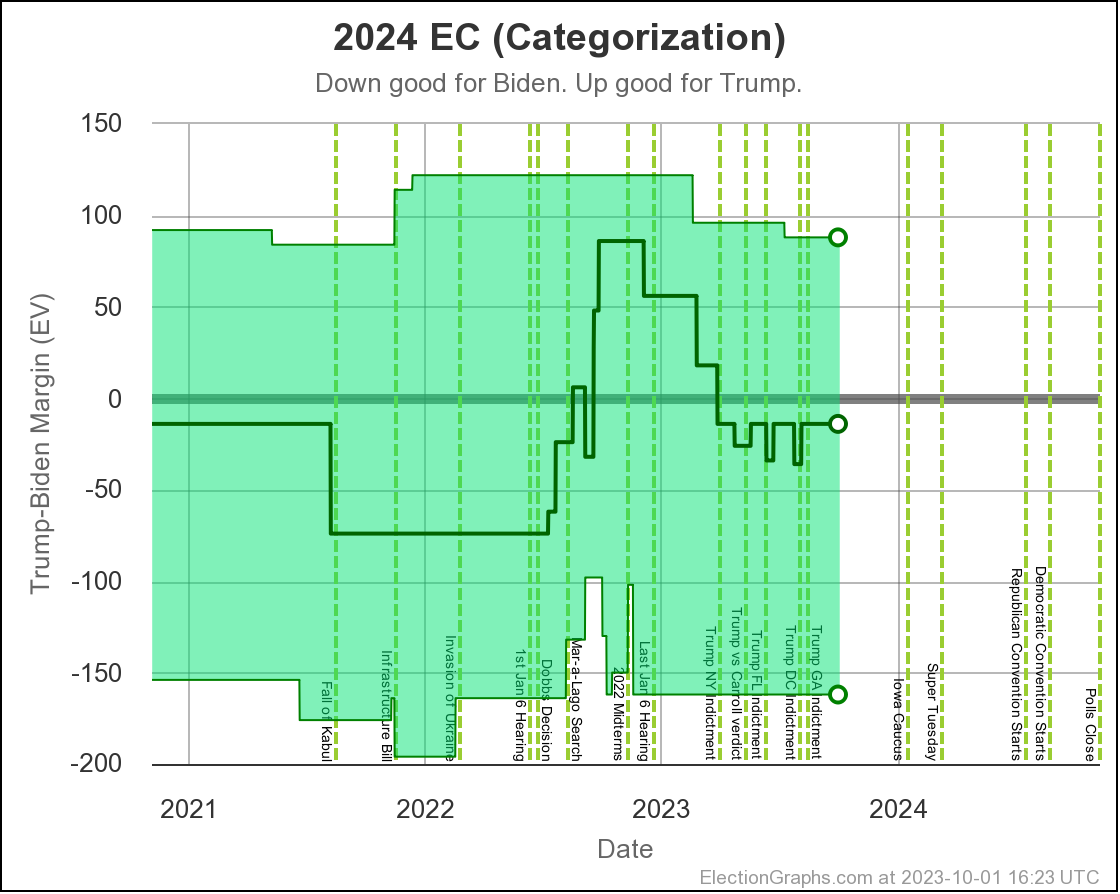
The same is true with all the "close states" really, although obviously some are closer to zero margin than others. They should all be considered states that could go either way, which is why in our summary, we show ranges of possibility, not point estimates. So here is what that looks like now:

Note that if you look at ANY of the ranges above, each looking at the situation in different ways, every single one of them includes either candidate winning. This is the nature of a close race.
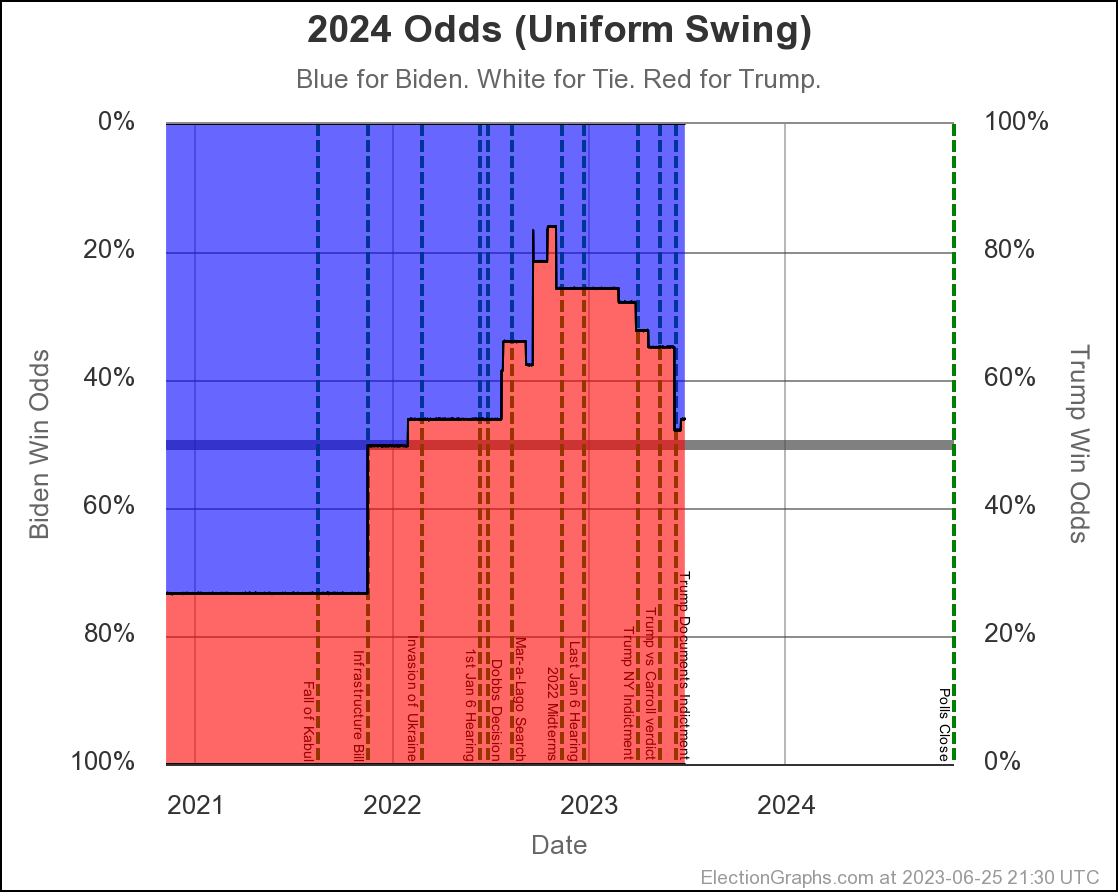
Both of my probabilistic views show Trump favored , while the straight up averages show Biden slightly favored. This is because the probabilistic views take into account that on average over the last four election cycles, the polls have underestimated the Republican in the closest states. But either way, they all show a race that could go either way.
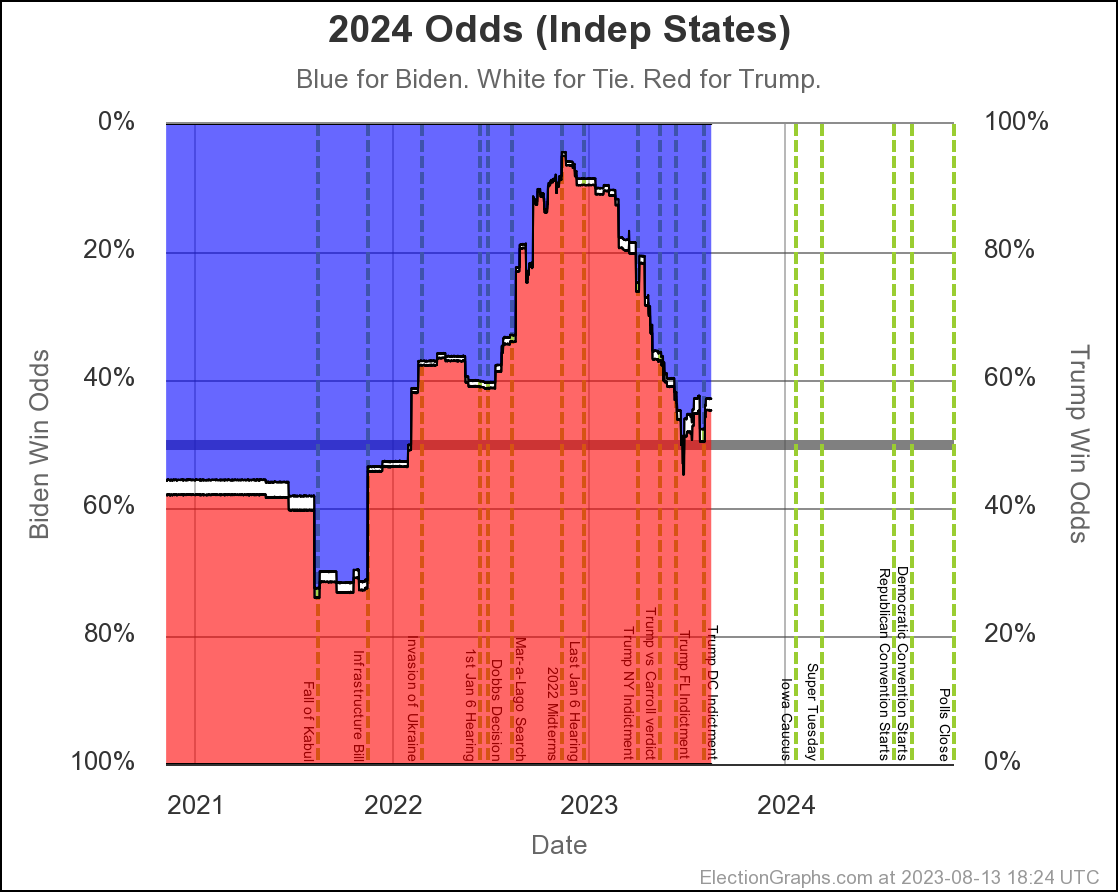
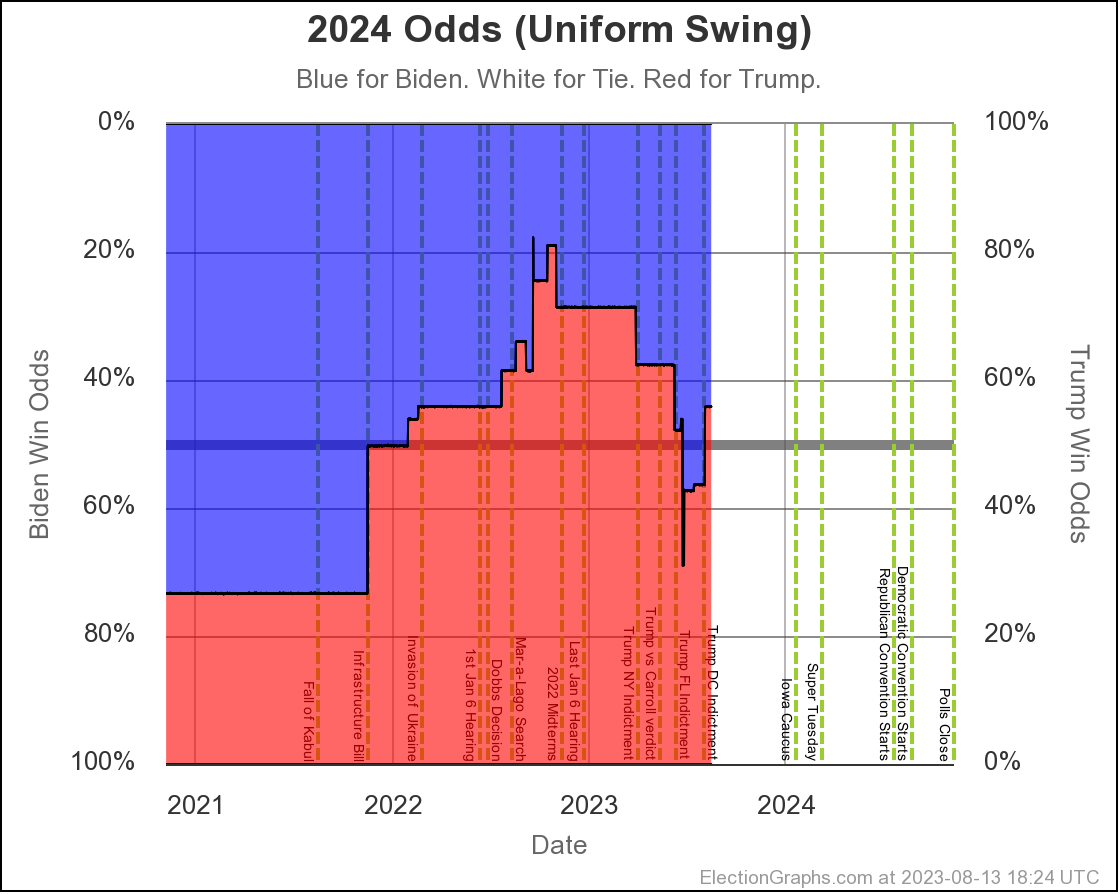
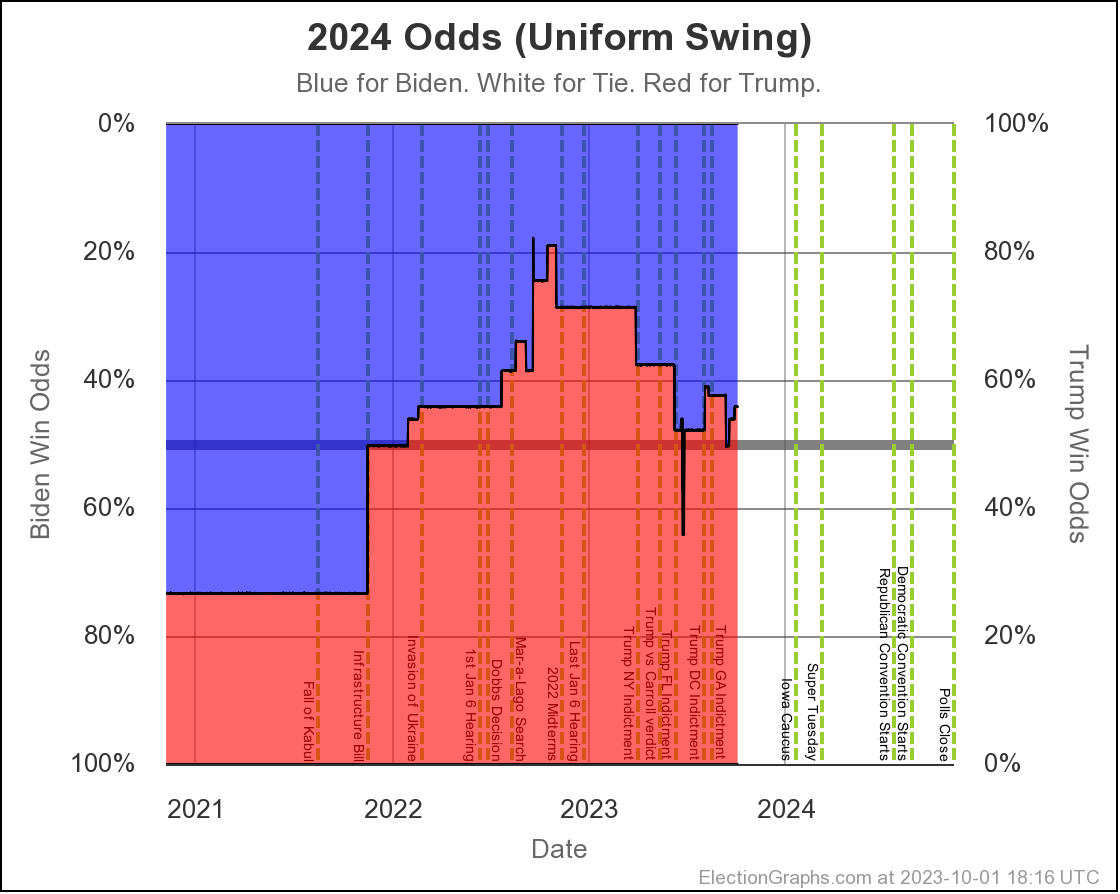
Lets look at the evolution of the Biden win odds in these blog post updates:
- 2023-03-25: Between 17.8% and 25.8%
- 2023-04-24: Between 24.9% and 32.3%
- 2023-05-21: Between 34.9% and 35.9%
- 2023-06-25: Between 43.9% and 46.0%
- 2023-08-13: Between 42.9% and 44.2%
- 2023-10-01: Between 35.7% and 44.2%
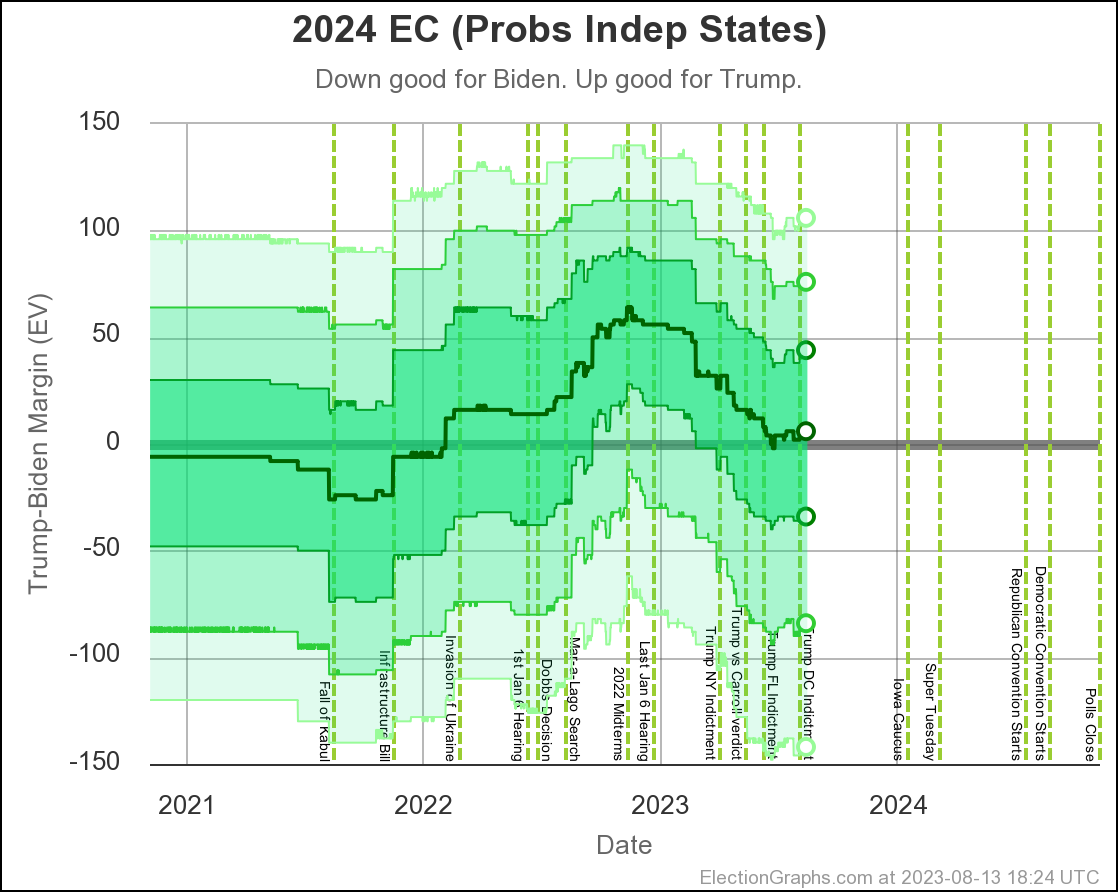
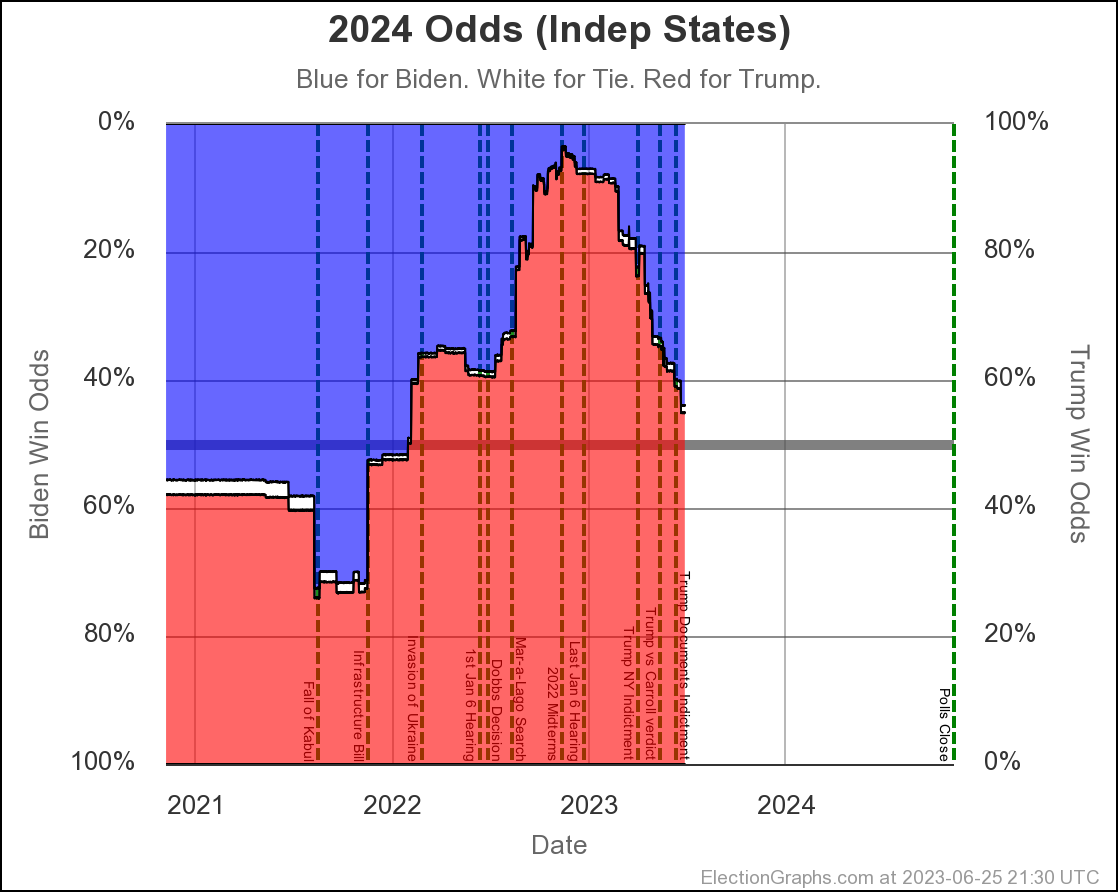
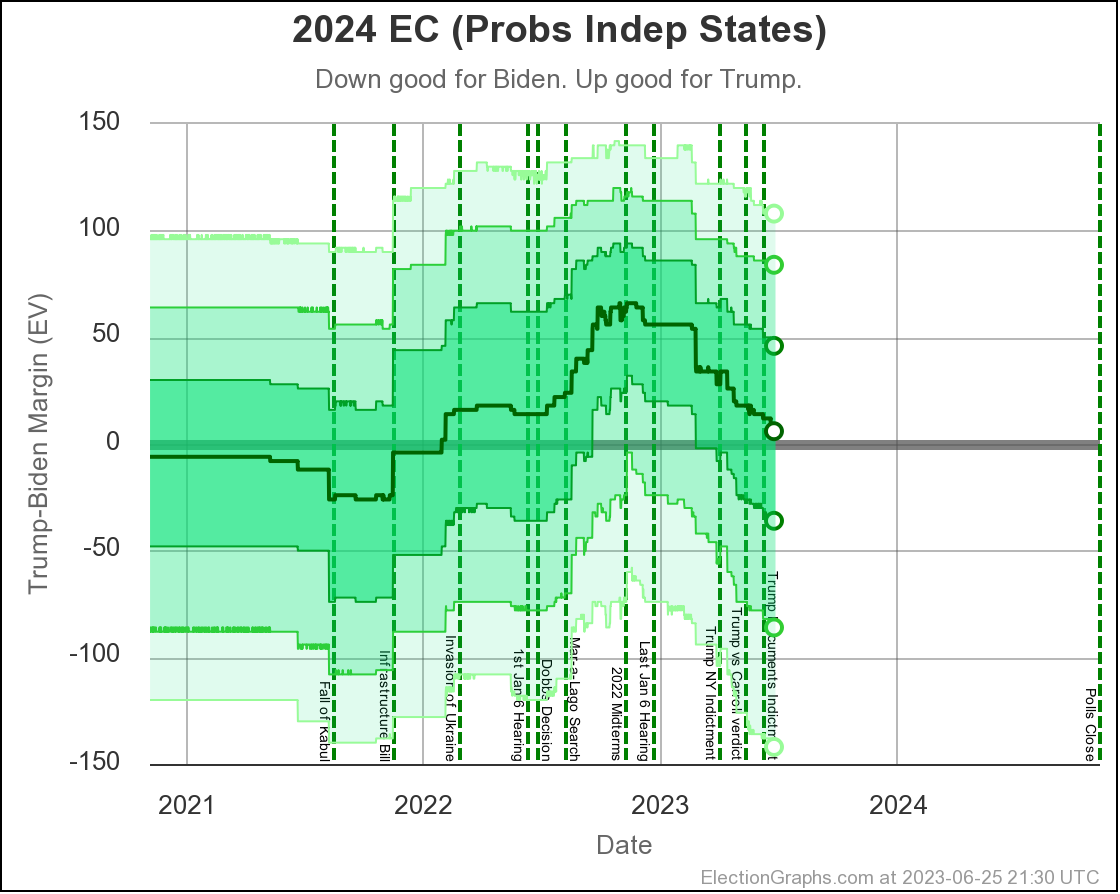
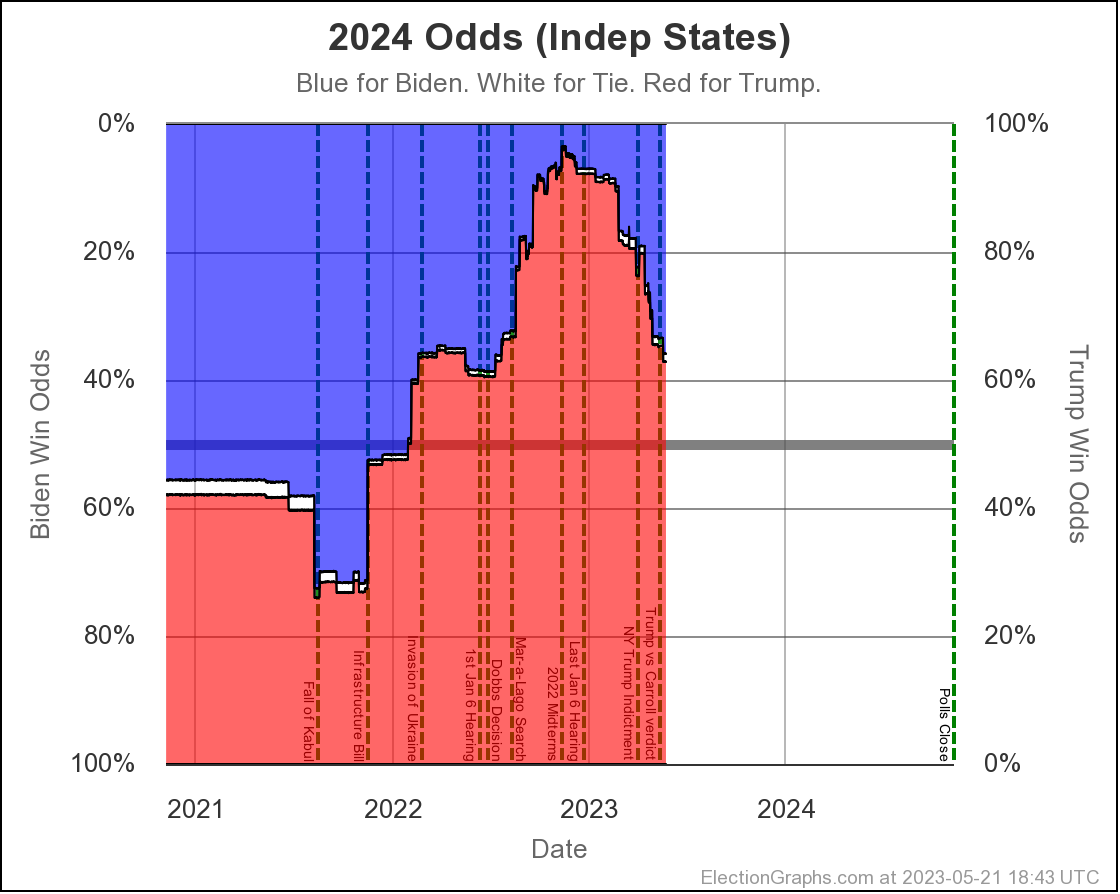
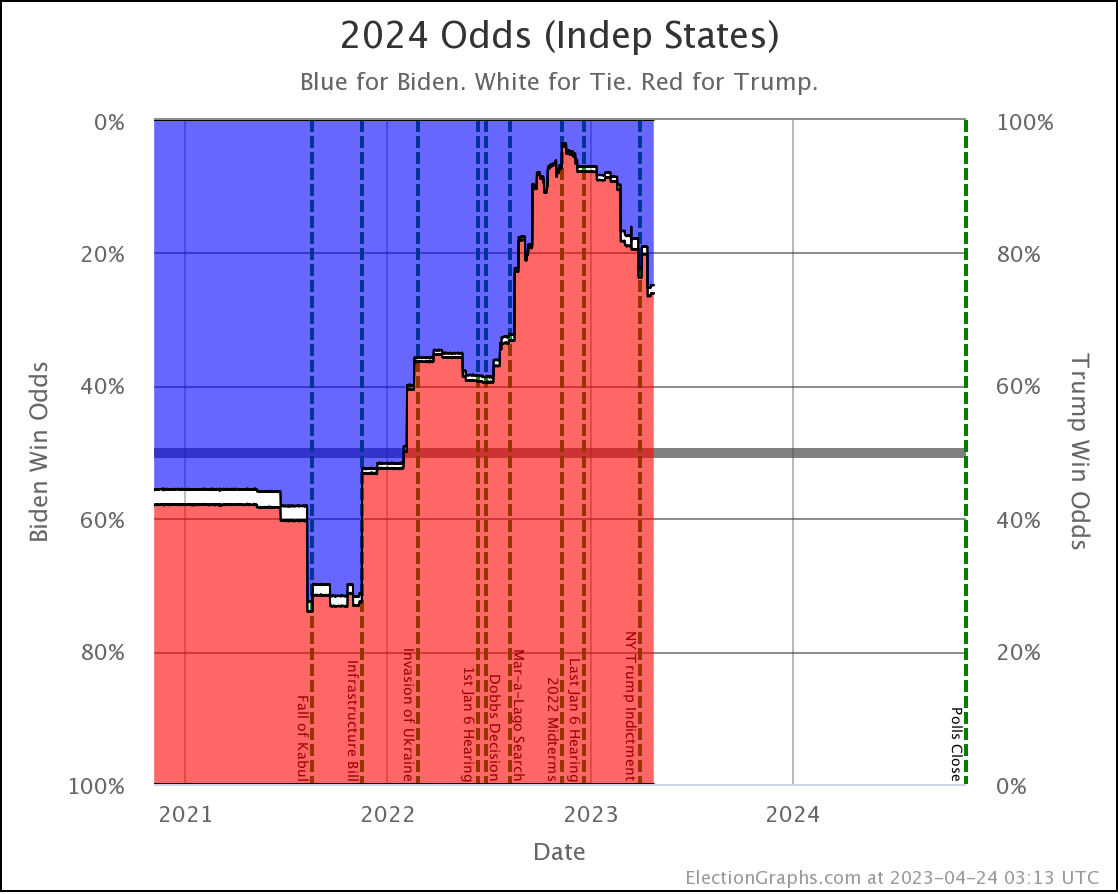
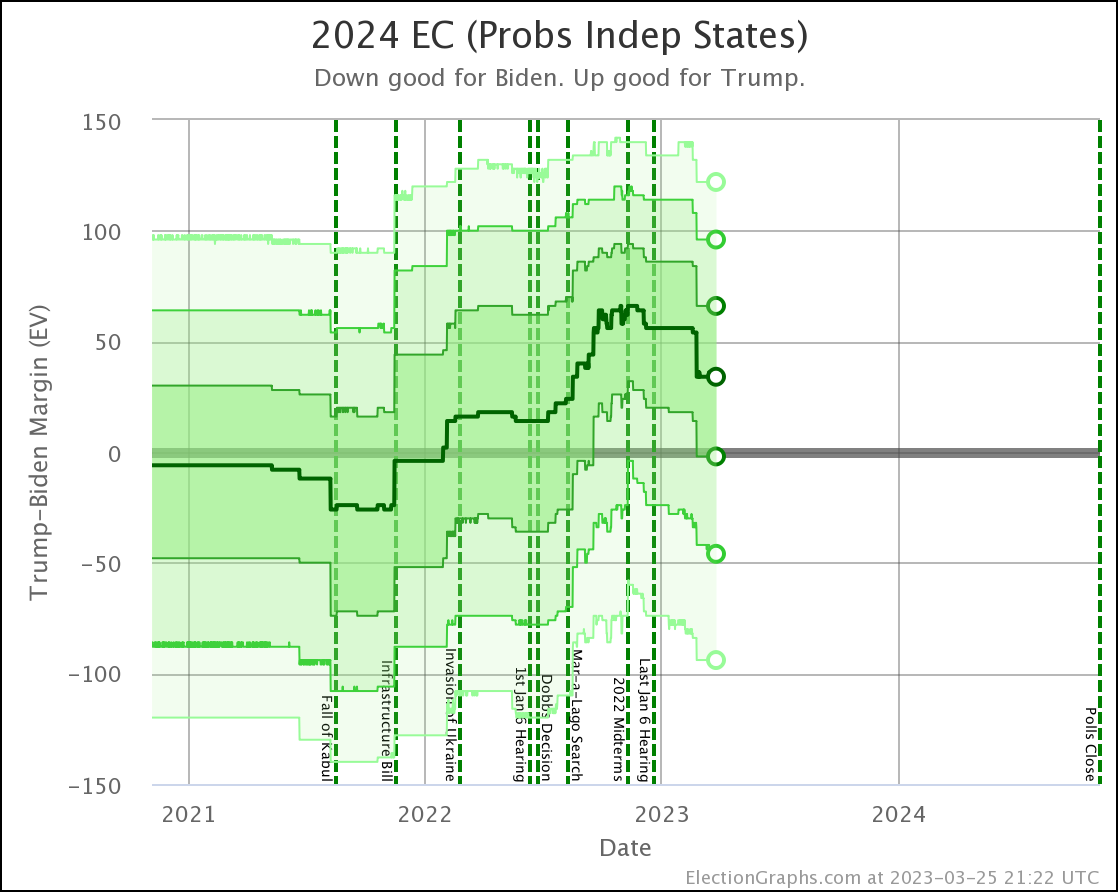
The net result of all the state level changes definitely puts Biden in a weaker position than at the last update. Lets look at the "Independent States" chart first, since it is the most dynamic:
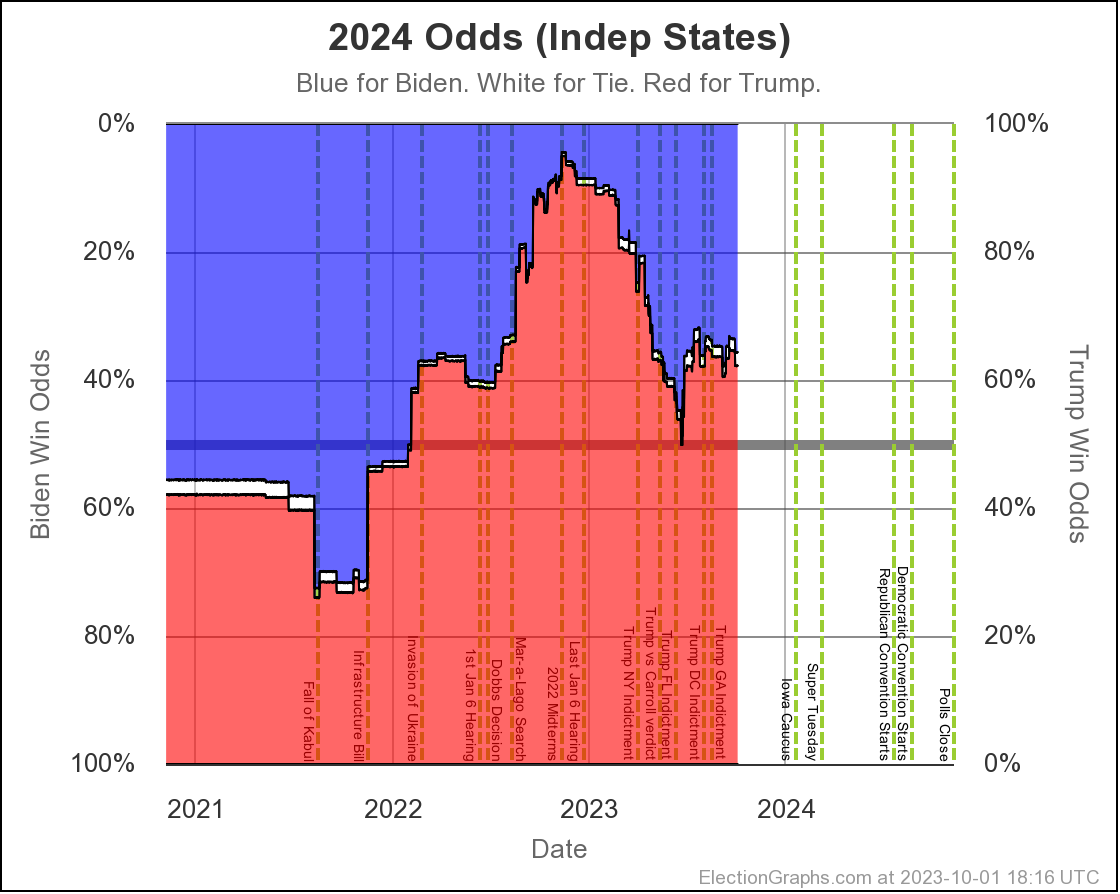
Where are we? Well, you can see that things were generally heading toward Biden from November 2022 until the end of June 2023, then things popped back up toward Trump a bit, and things have actually been pretty stable since then.
But wait, it popped back toward Trump at the end of June?
But the last update was in August I can hear you saying.
Yes. But remember that Prime poll in Arizona? The one with the No Labels alternative result? I had initially entered that data into the Election Graphs system with only the straight Biden vs Trump result when it came out in June. Sometime later I determined that I had made a mistake in not entering these secondary results on a whole bunch of polls, and went through a process over several weeks of fixing that.
Prime had released polls in Arizona, Georgia, Michigan, North Carolina, Nevada, Pennsylvania, and Wisconsin. All close states. These had generally been favorable to Trump anyway, and there already was a bit of a pop back in the Trump direction showing when I did the August update, but their results with the hypothetical No Labels candidate showed the 3P candidate helping Trump in every one of those states except North Carolina (where there was no impact).
On average in the Prime polls in those 7 states, the presence of a No Labels candidate helped Trump (and hurt Biden) by a net change of 4.3% on the margin.
So when I folded in the Prime data including No Labels in August, since these results were all good for Trump in a whole bunch of close states, it moved all the curves in the Trump direction from June through the present.
And we have been pretty stable since then. When these polls roll off the averages as new polls come in, if the new polls don't show the same impact, things will move back in Biden's direction a bit.
Of course, most other polls do not include a No Labels contender. If we actually end up with a No Labels candidate, these polls that included them may end up being the ones that are closer to right.
Once various possible 3P candidates become "real" rather than just hypothetical more polling outfits will include them. 3P candidates also usually fade as the election approaches though.
We shall see.
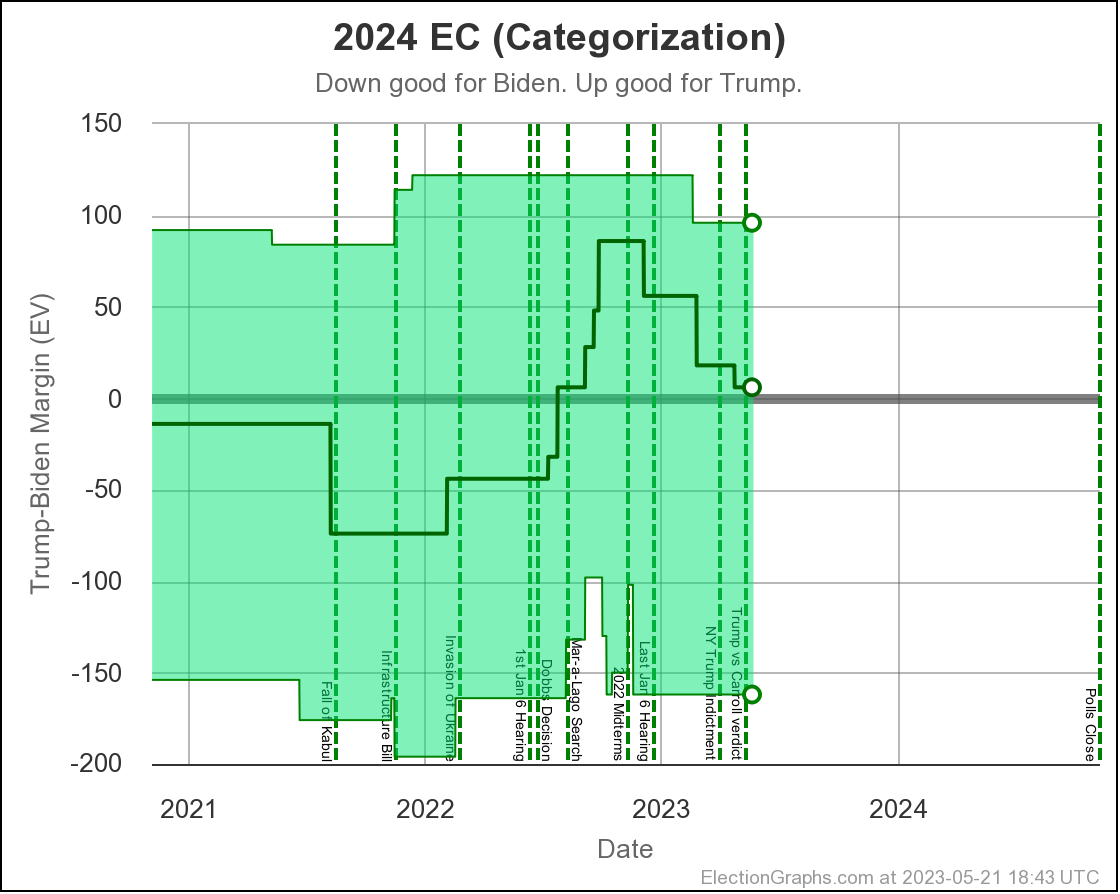
In terms of the actual Electoral College margin predicted by the Independent States view, the chart looks like this:
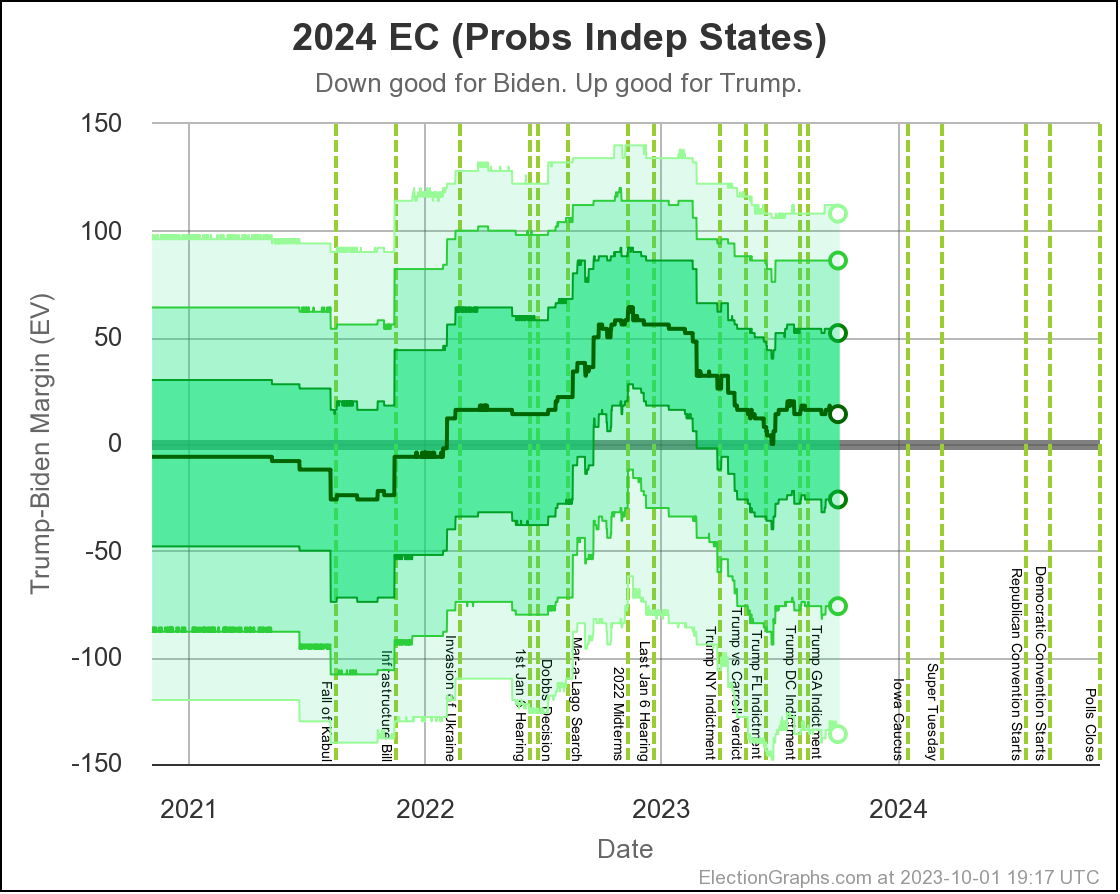
The tie line is well within the darkest band, which is the 1σ (68.27%) band. Every view shows a close race, so we should not be surprised.
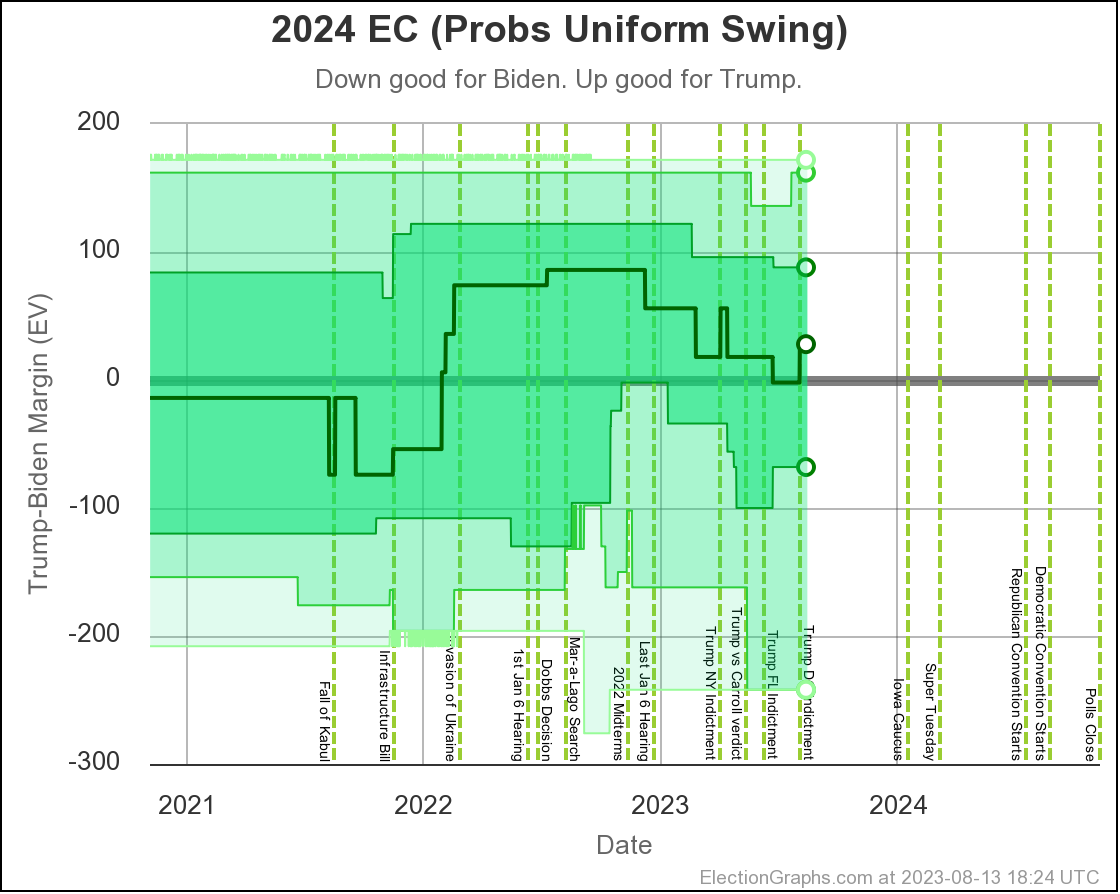
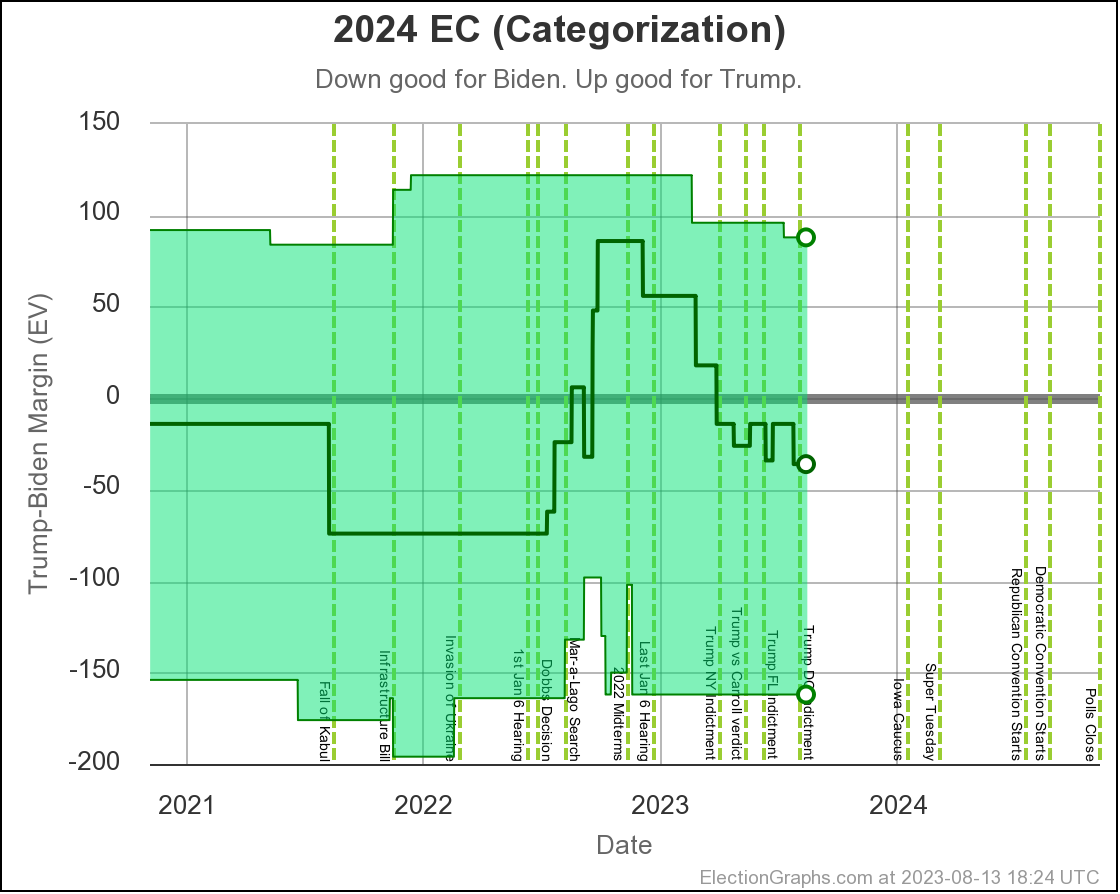
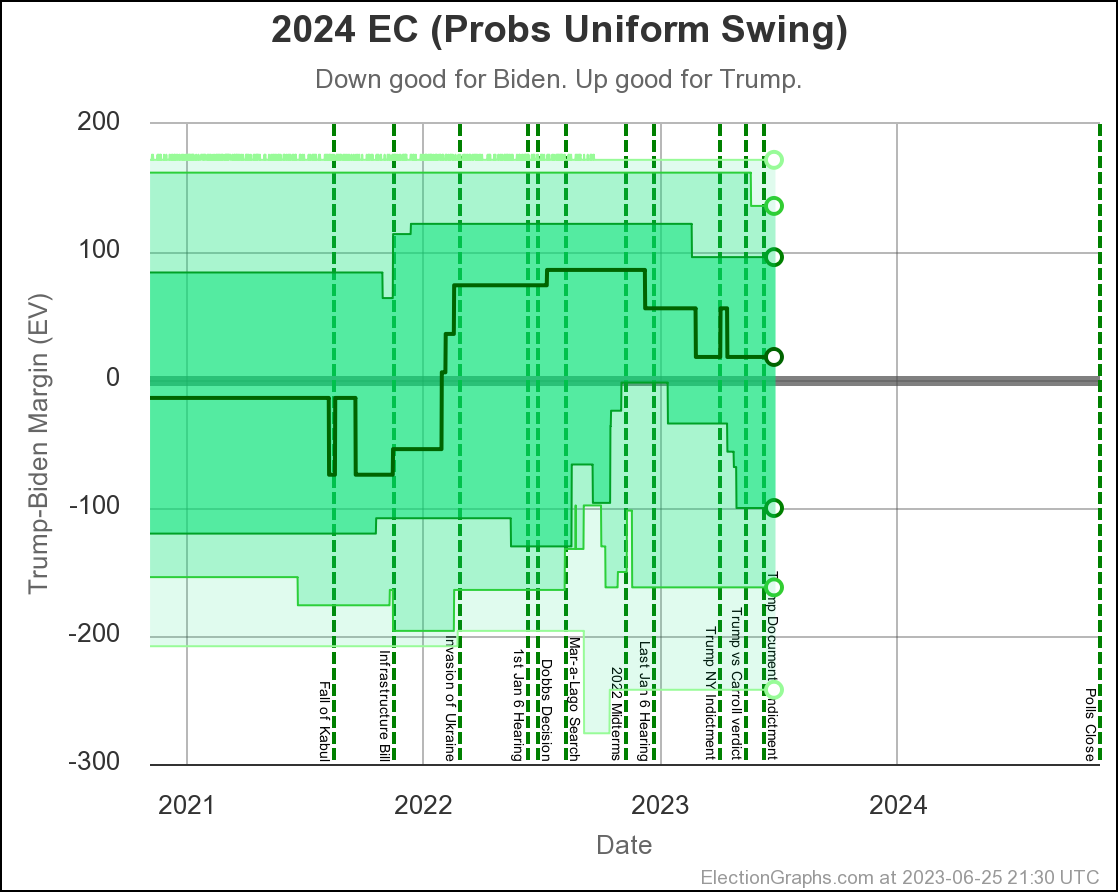
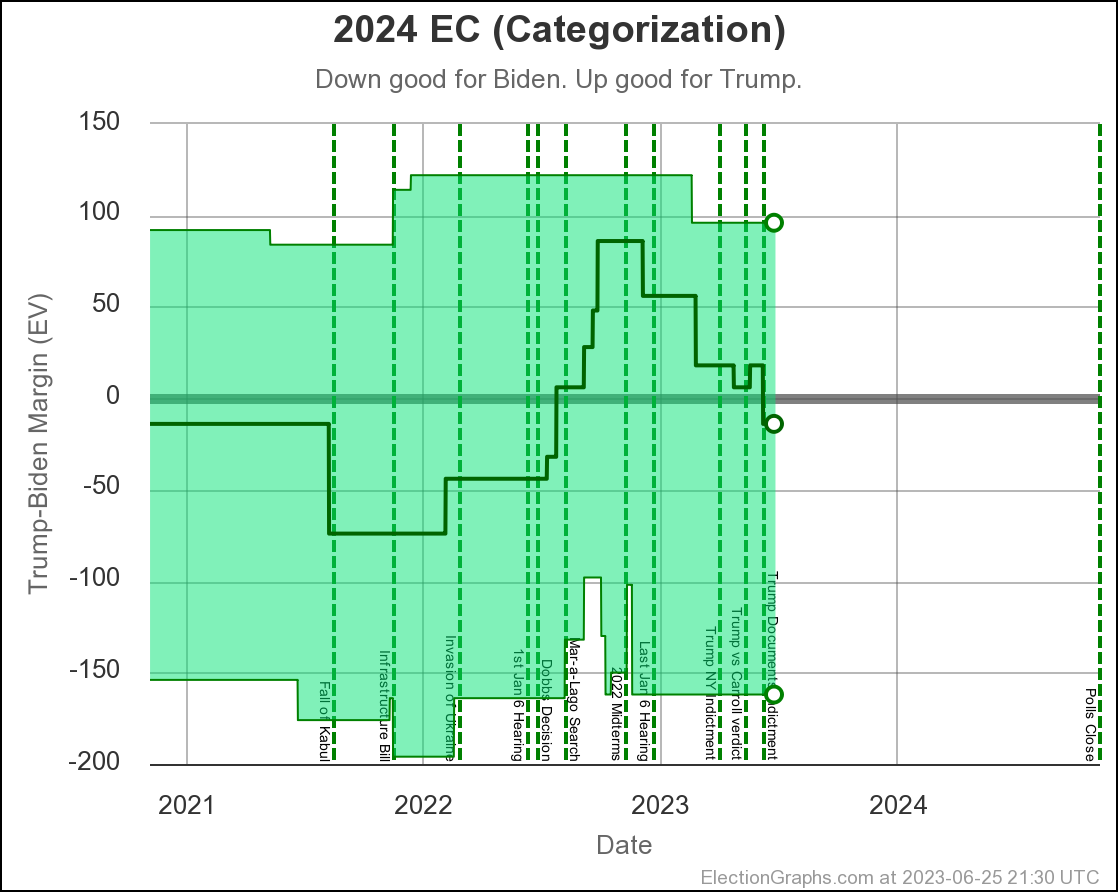
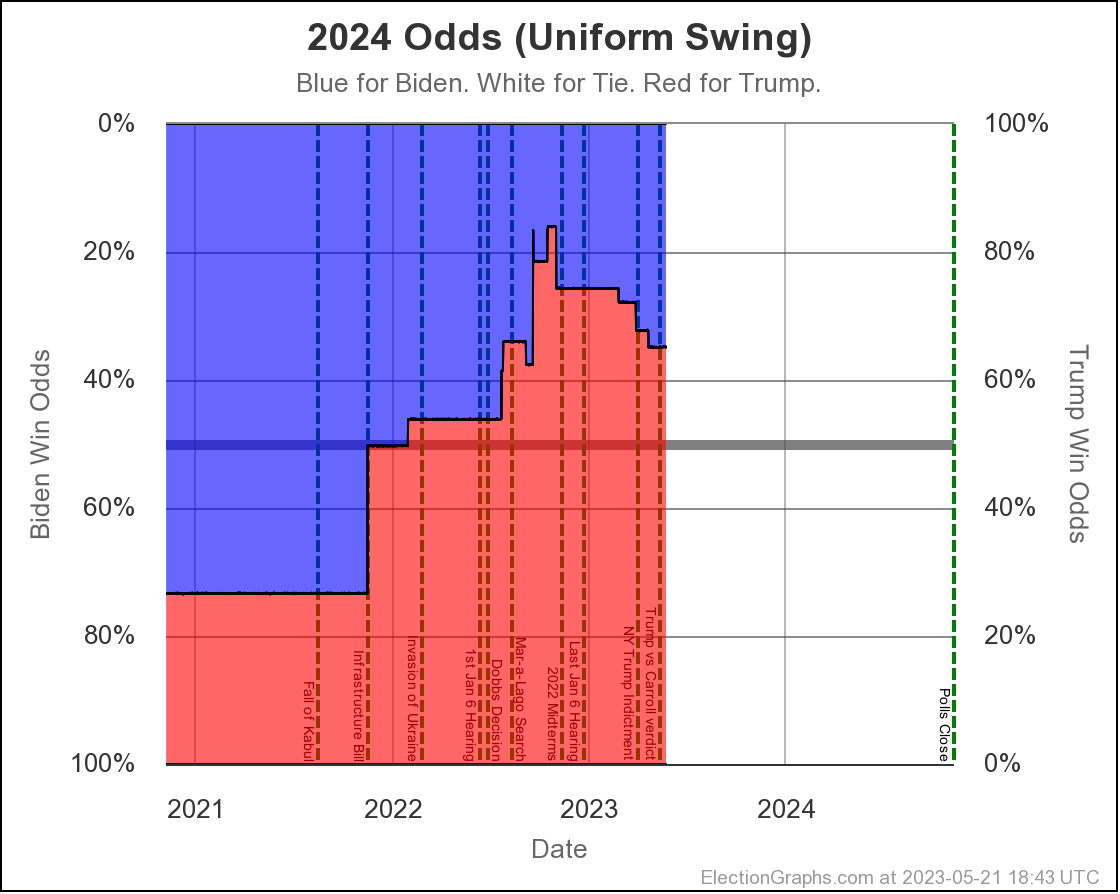
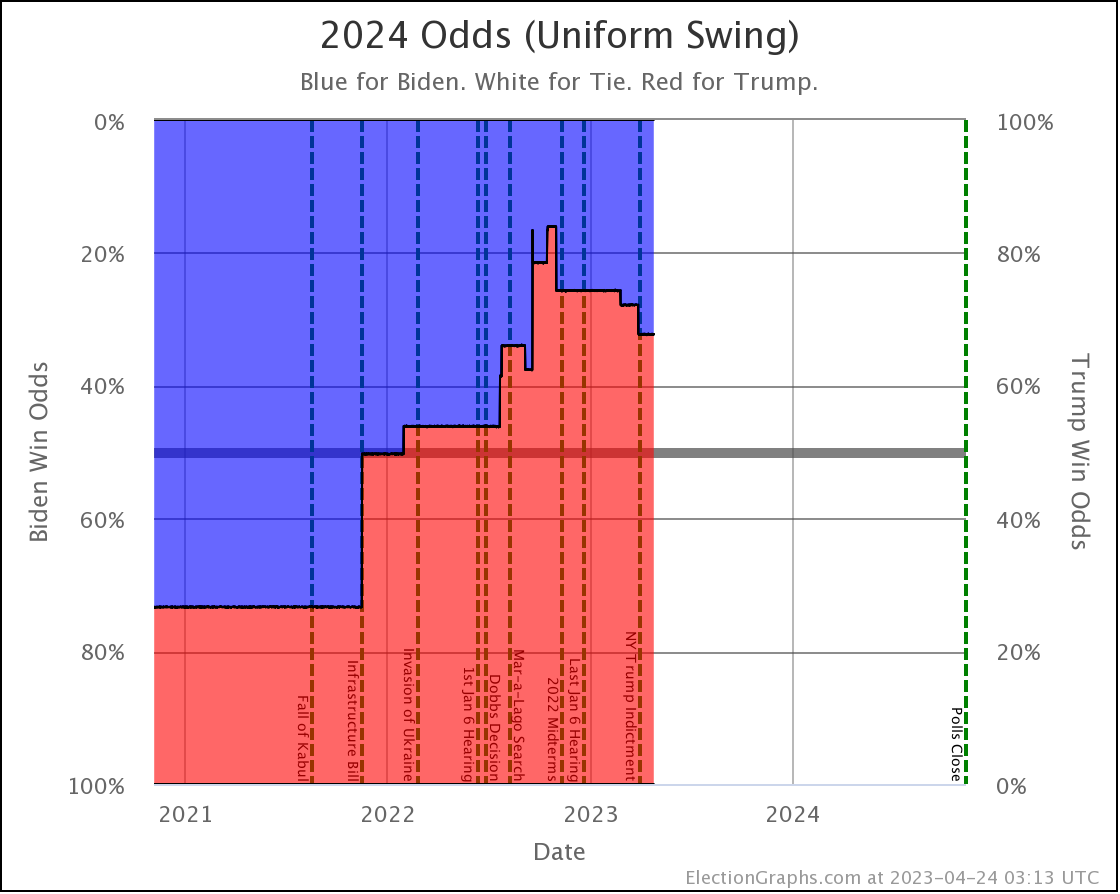
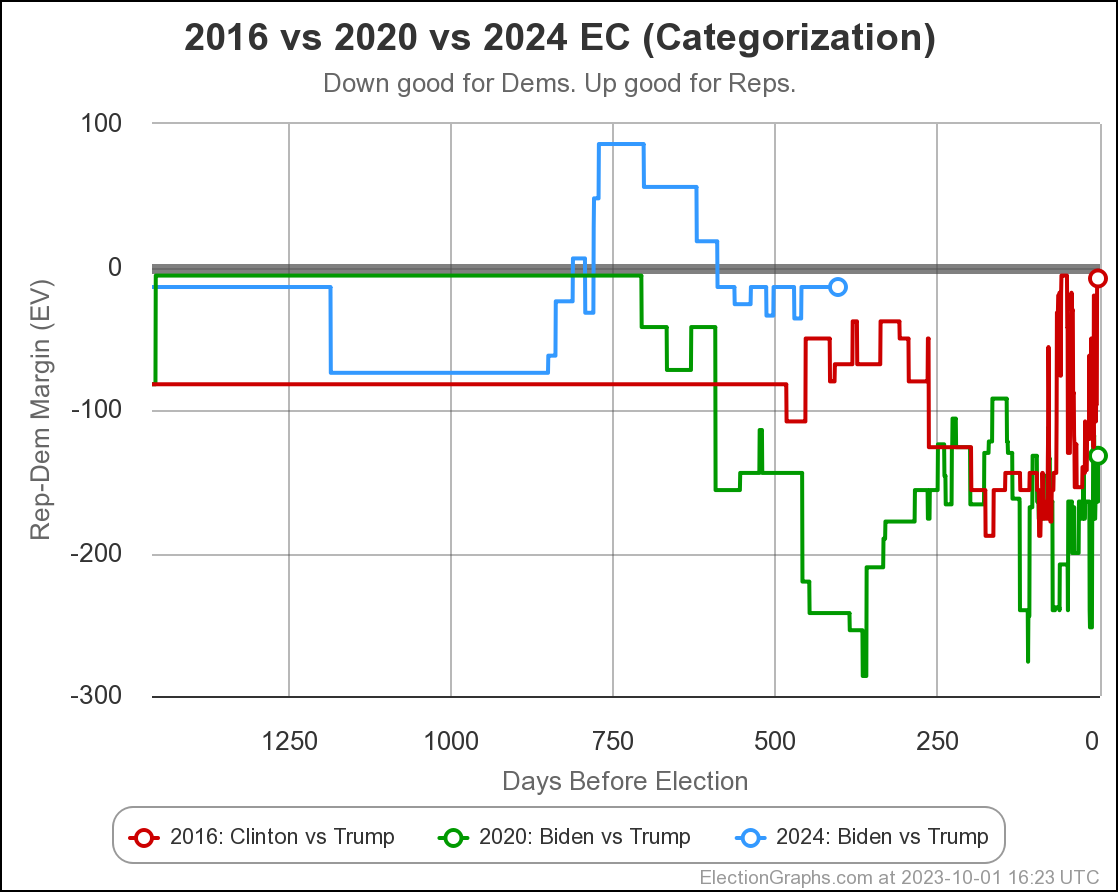
The two Uniform Swing views look similar, but with a wider range of outcomes and a "blockier" appearance:
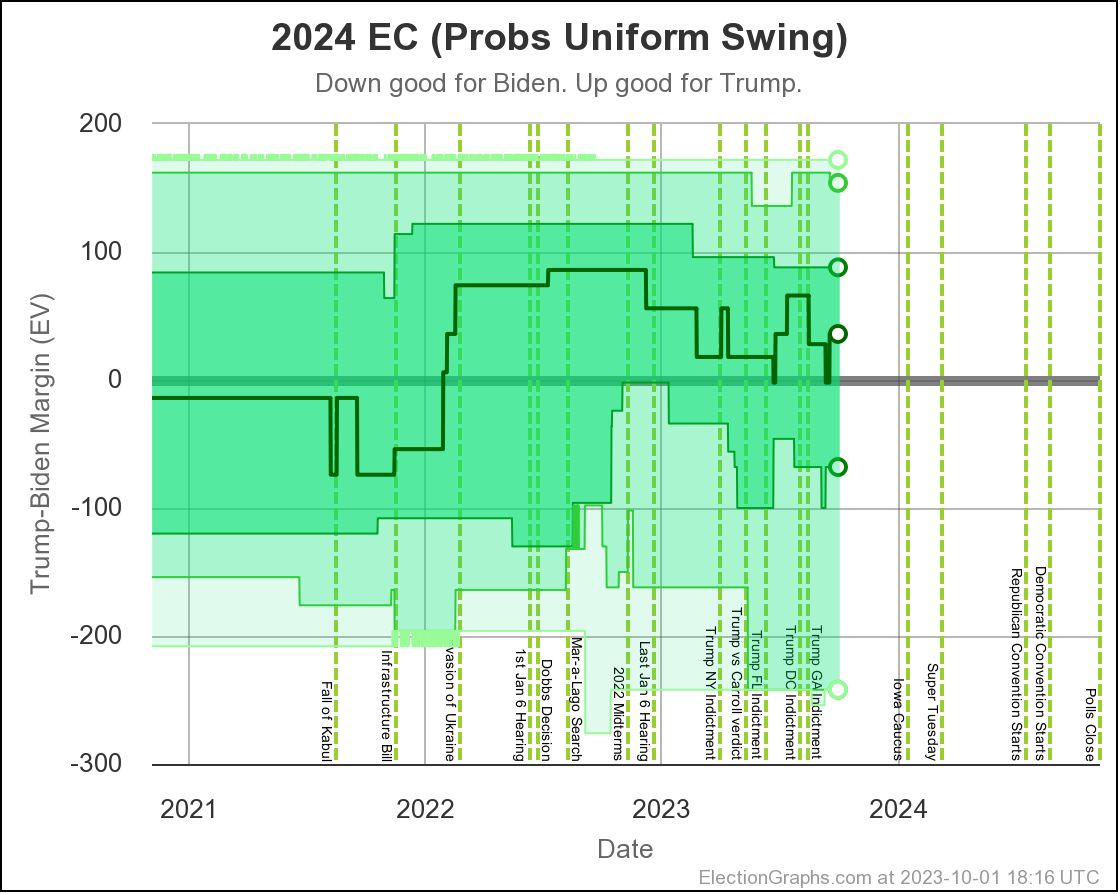
Just looking at straight poll averages, and considering any margin less than 5% too close to call, the midpoint has moved around a bit, but the overall range of possibilities hasn't changed all that much.
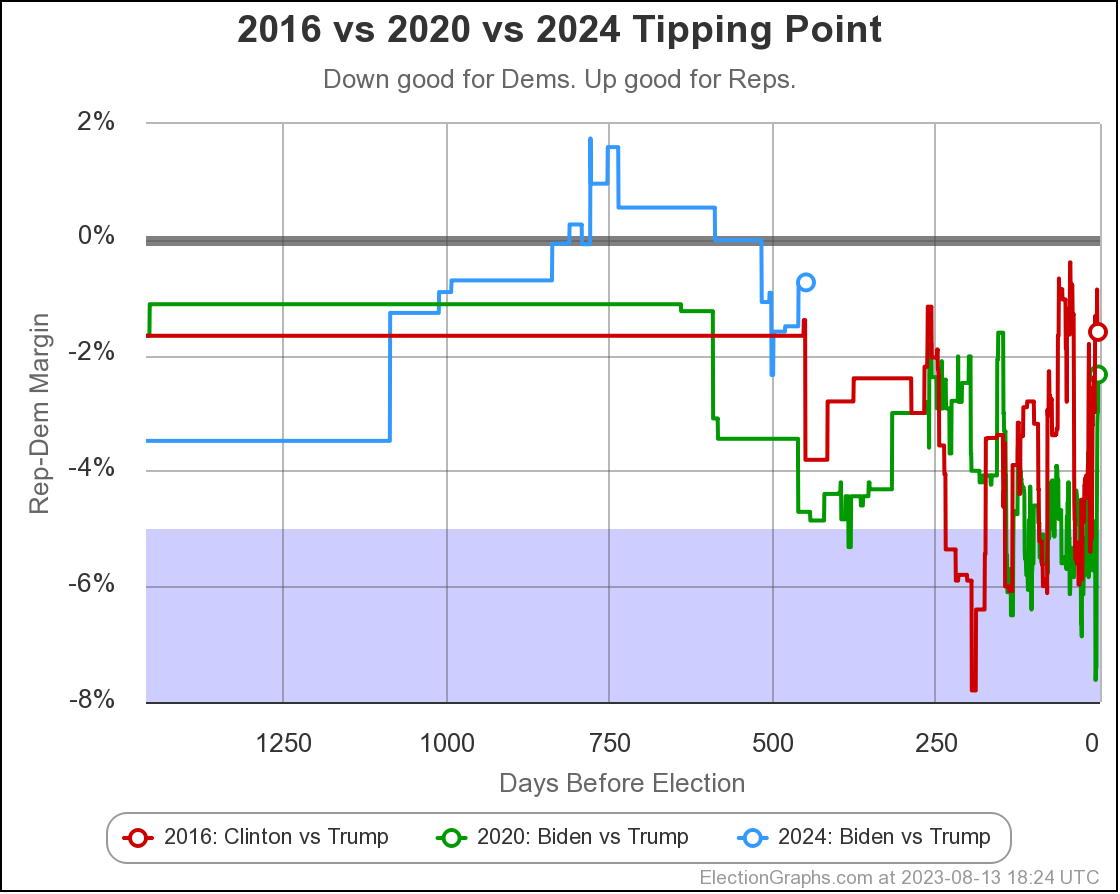
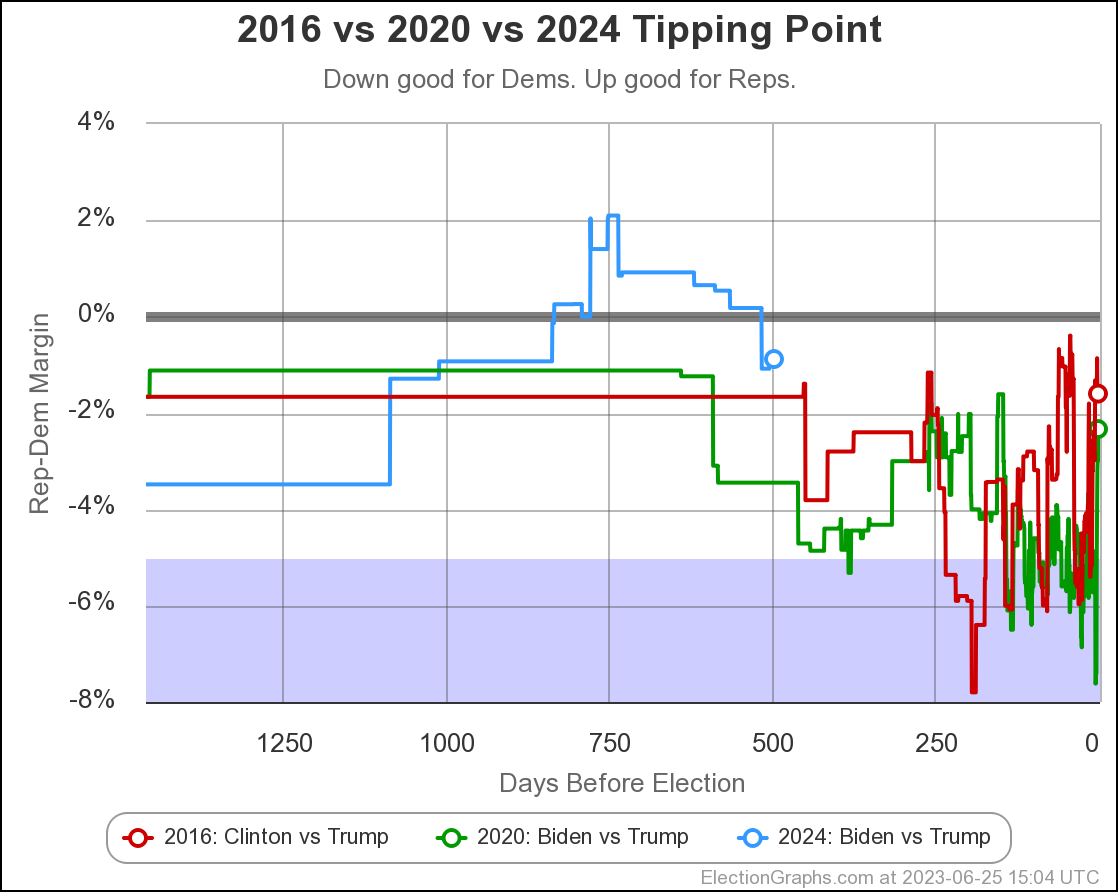
A better way to understand this "straight poll averages" view doesn't look at the electoral college margin, but instead how much the margin would have to change in the tipping point state to change the winner. Here is some history on the tipping point margin:
- 2023-03-25: Trump by 0.7% in Wisconsin
- 2023-04-24: Trump by 0.5% in North Carolina
- 2023-05-21: Trump by 0.2% in Wisconsin
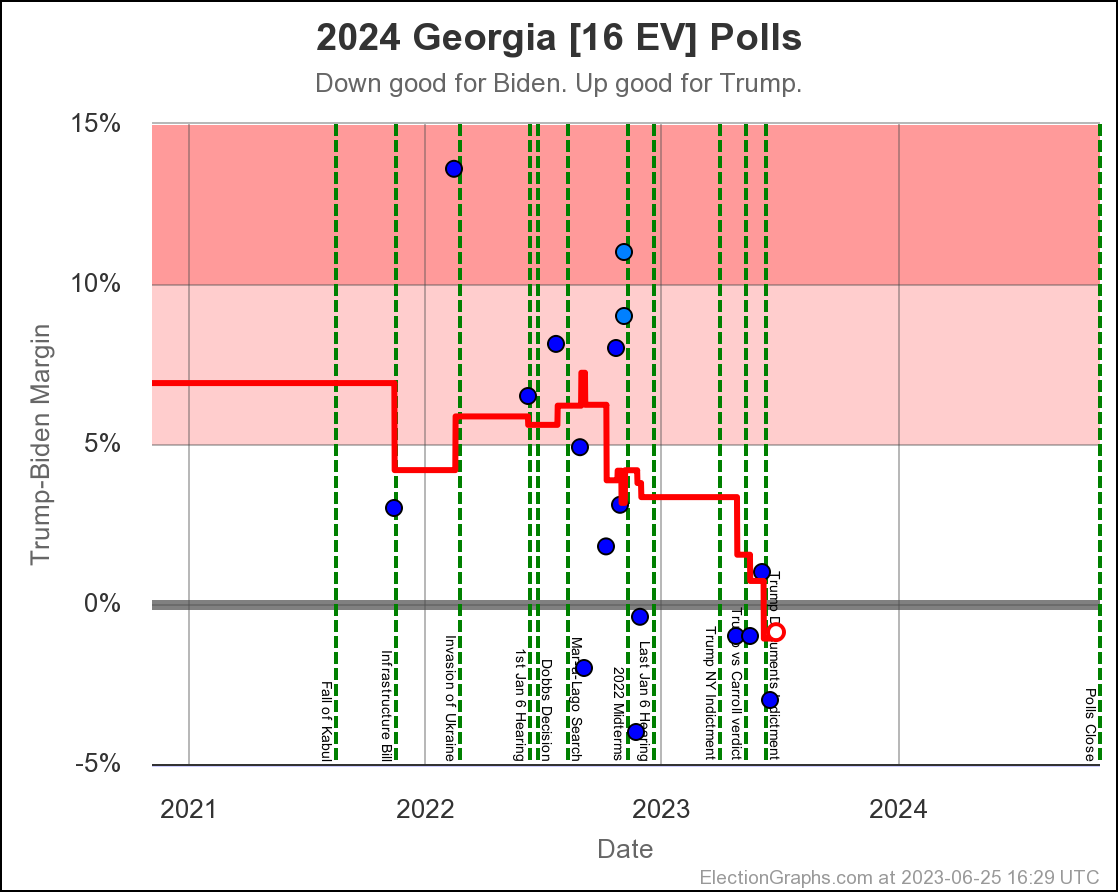
- 2023-06-25: Biden by 0.9% in Georgia
- 2023-08-13: Biden by 0.7% in Michigan
- 2023-10-02: Biden by 0.7% in Pennsylvania
And here is a graph of how this has evolved:
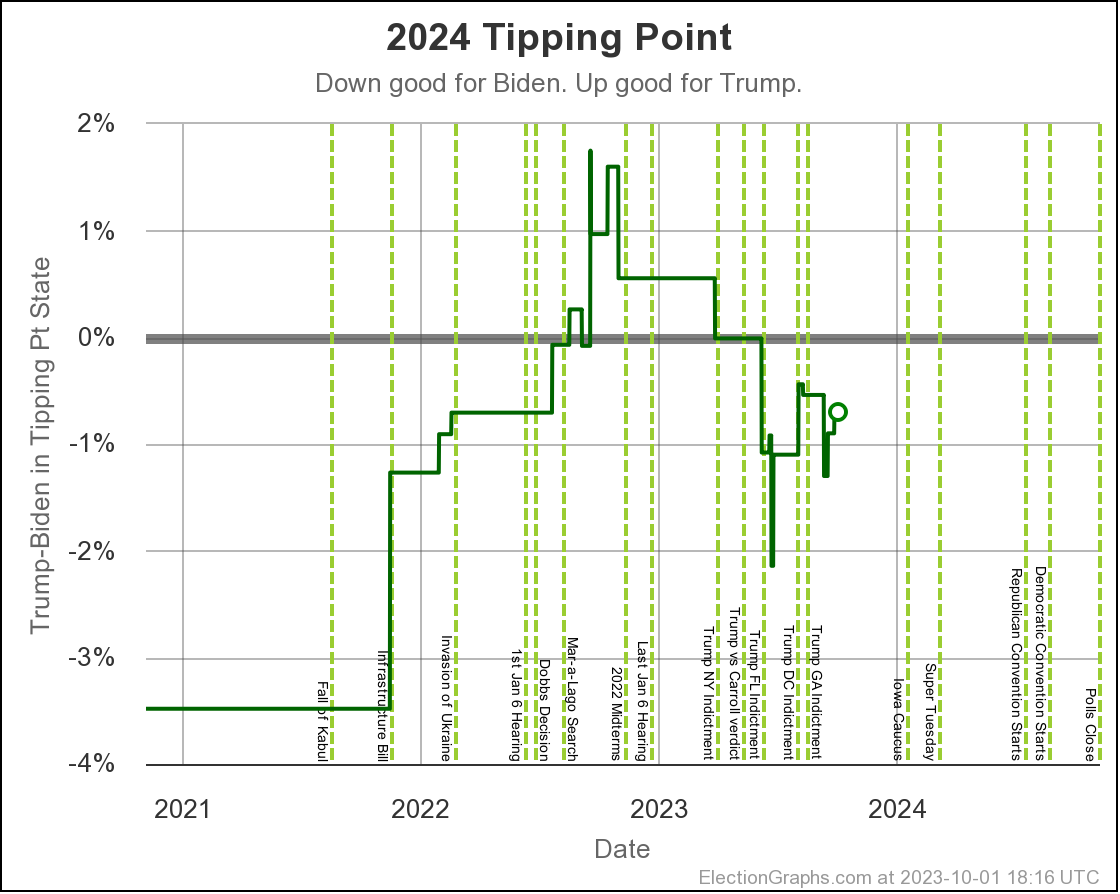
The picture of course matches the others. At the moment Biden leads in the state that would put him over the edge (Pennsylvania at the moment) by only 0.7%.
Leads that small are ephemeral, and possibly illusory.
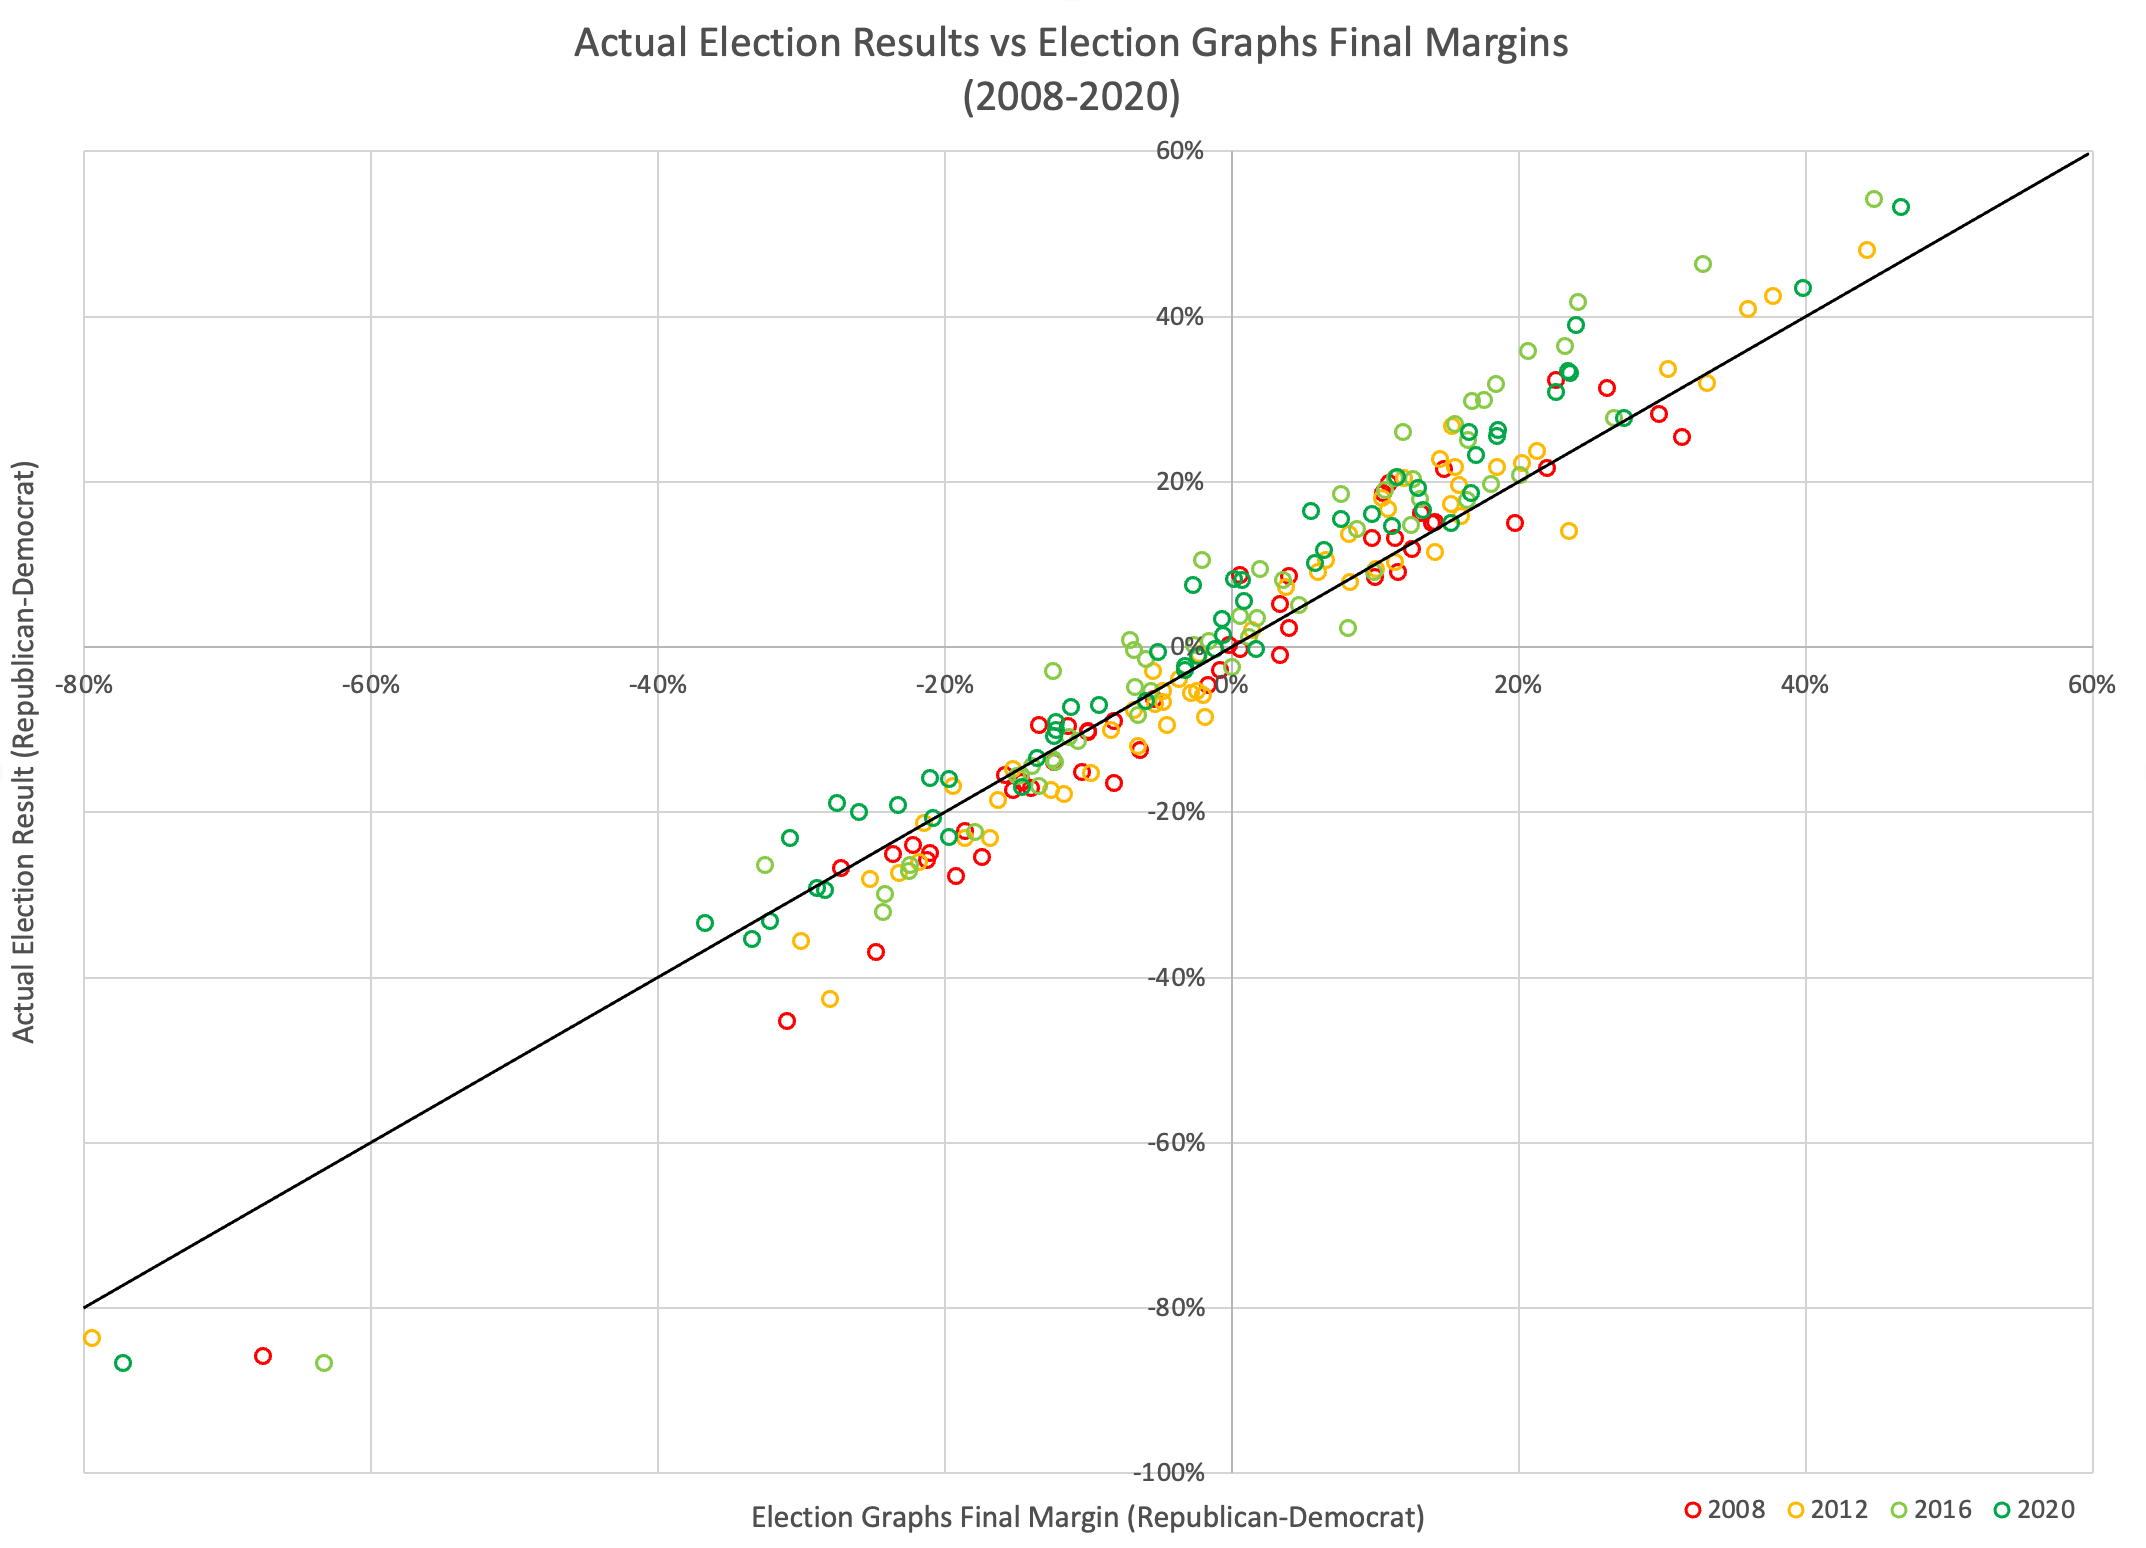
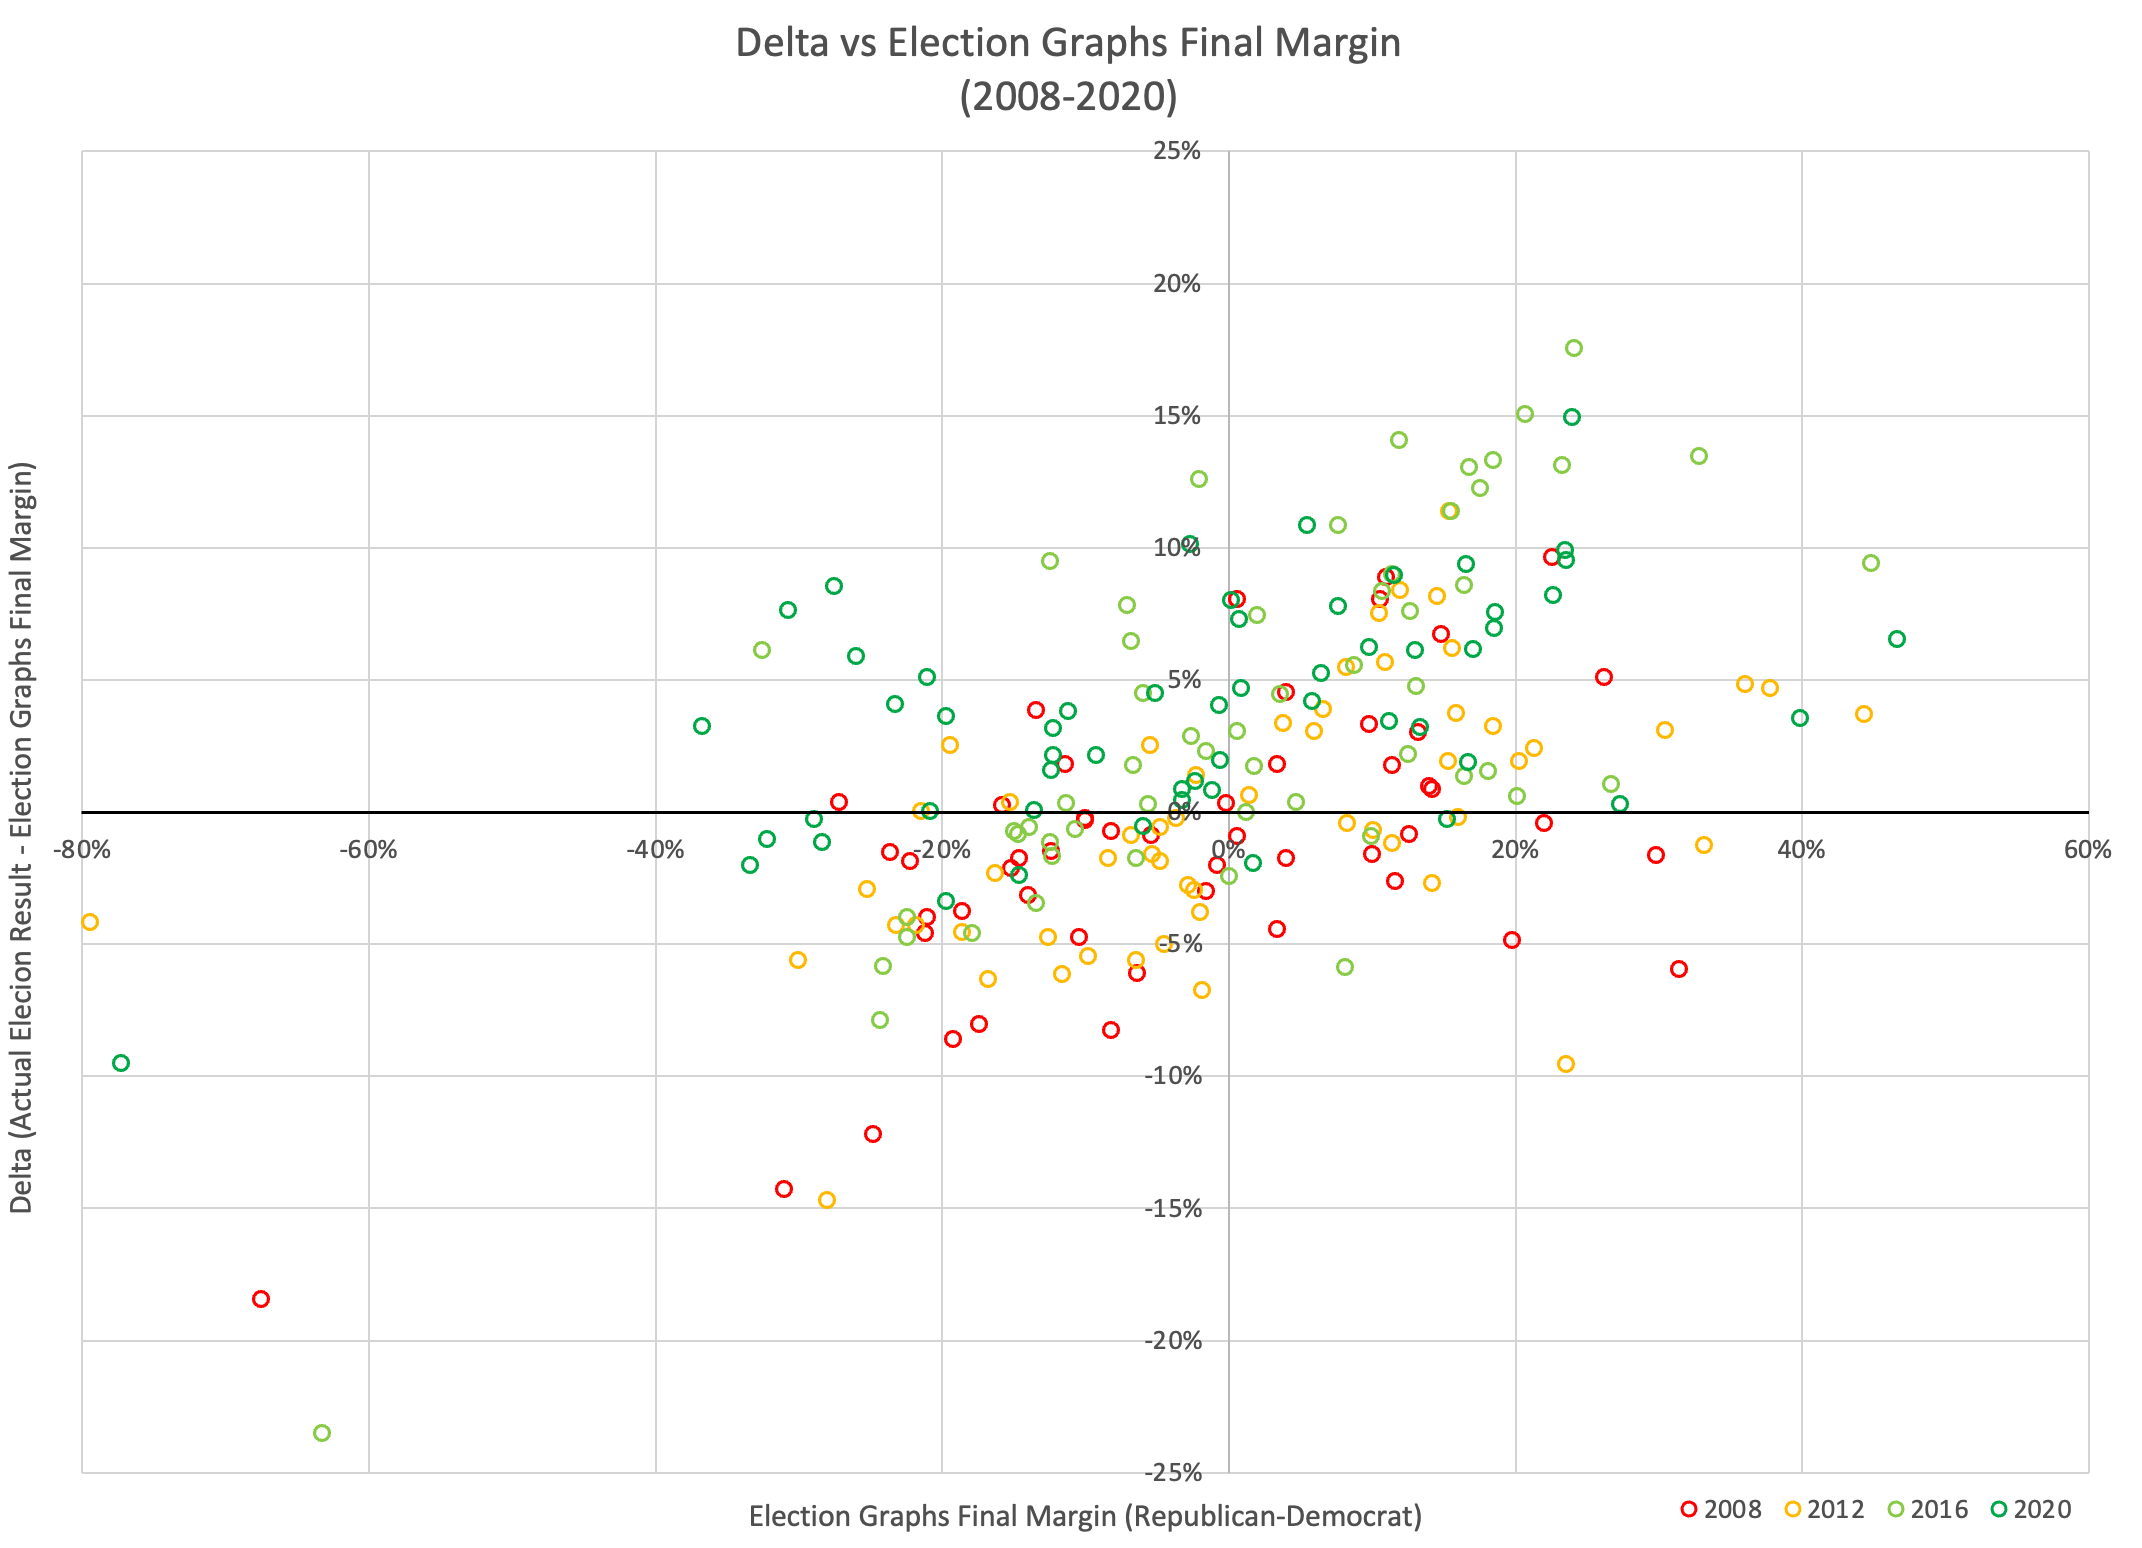
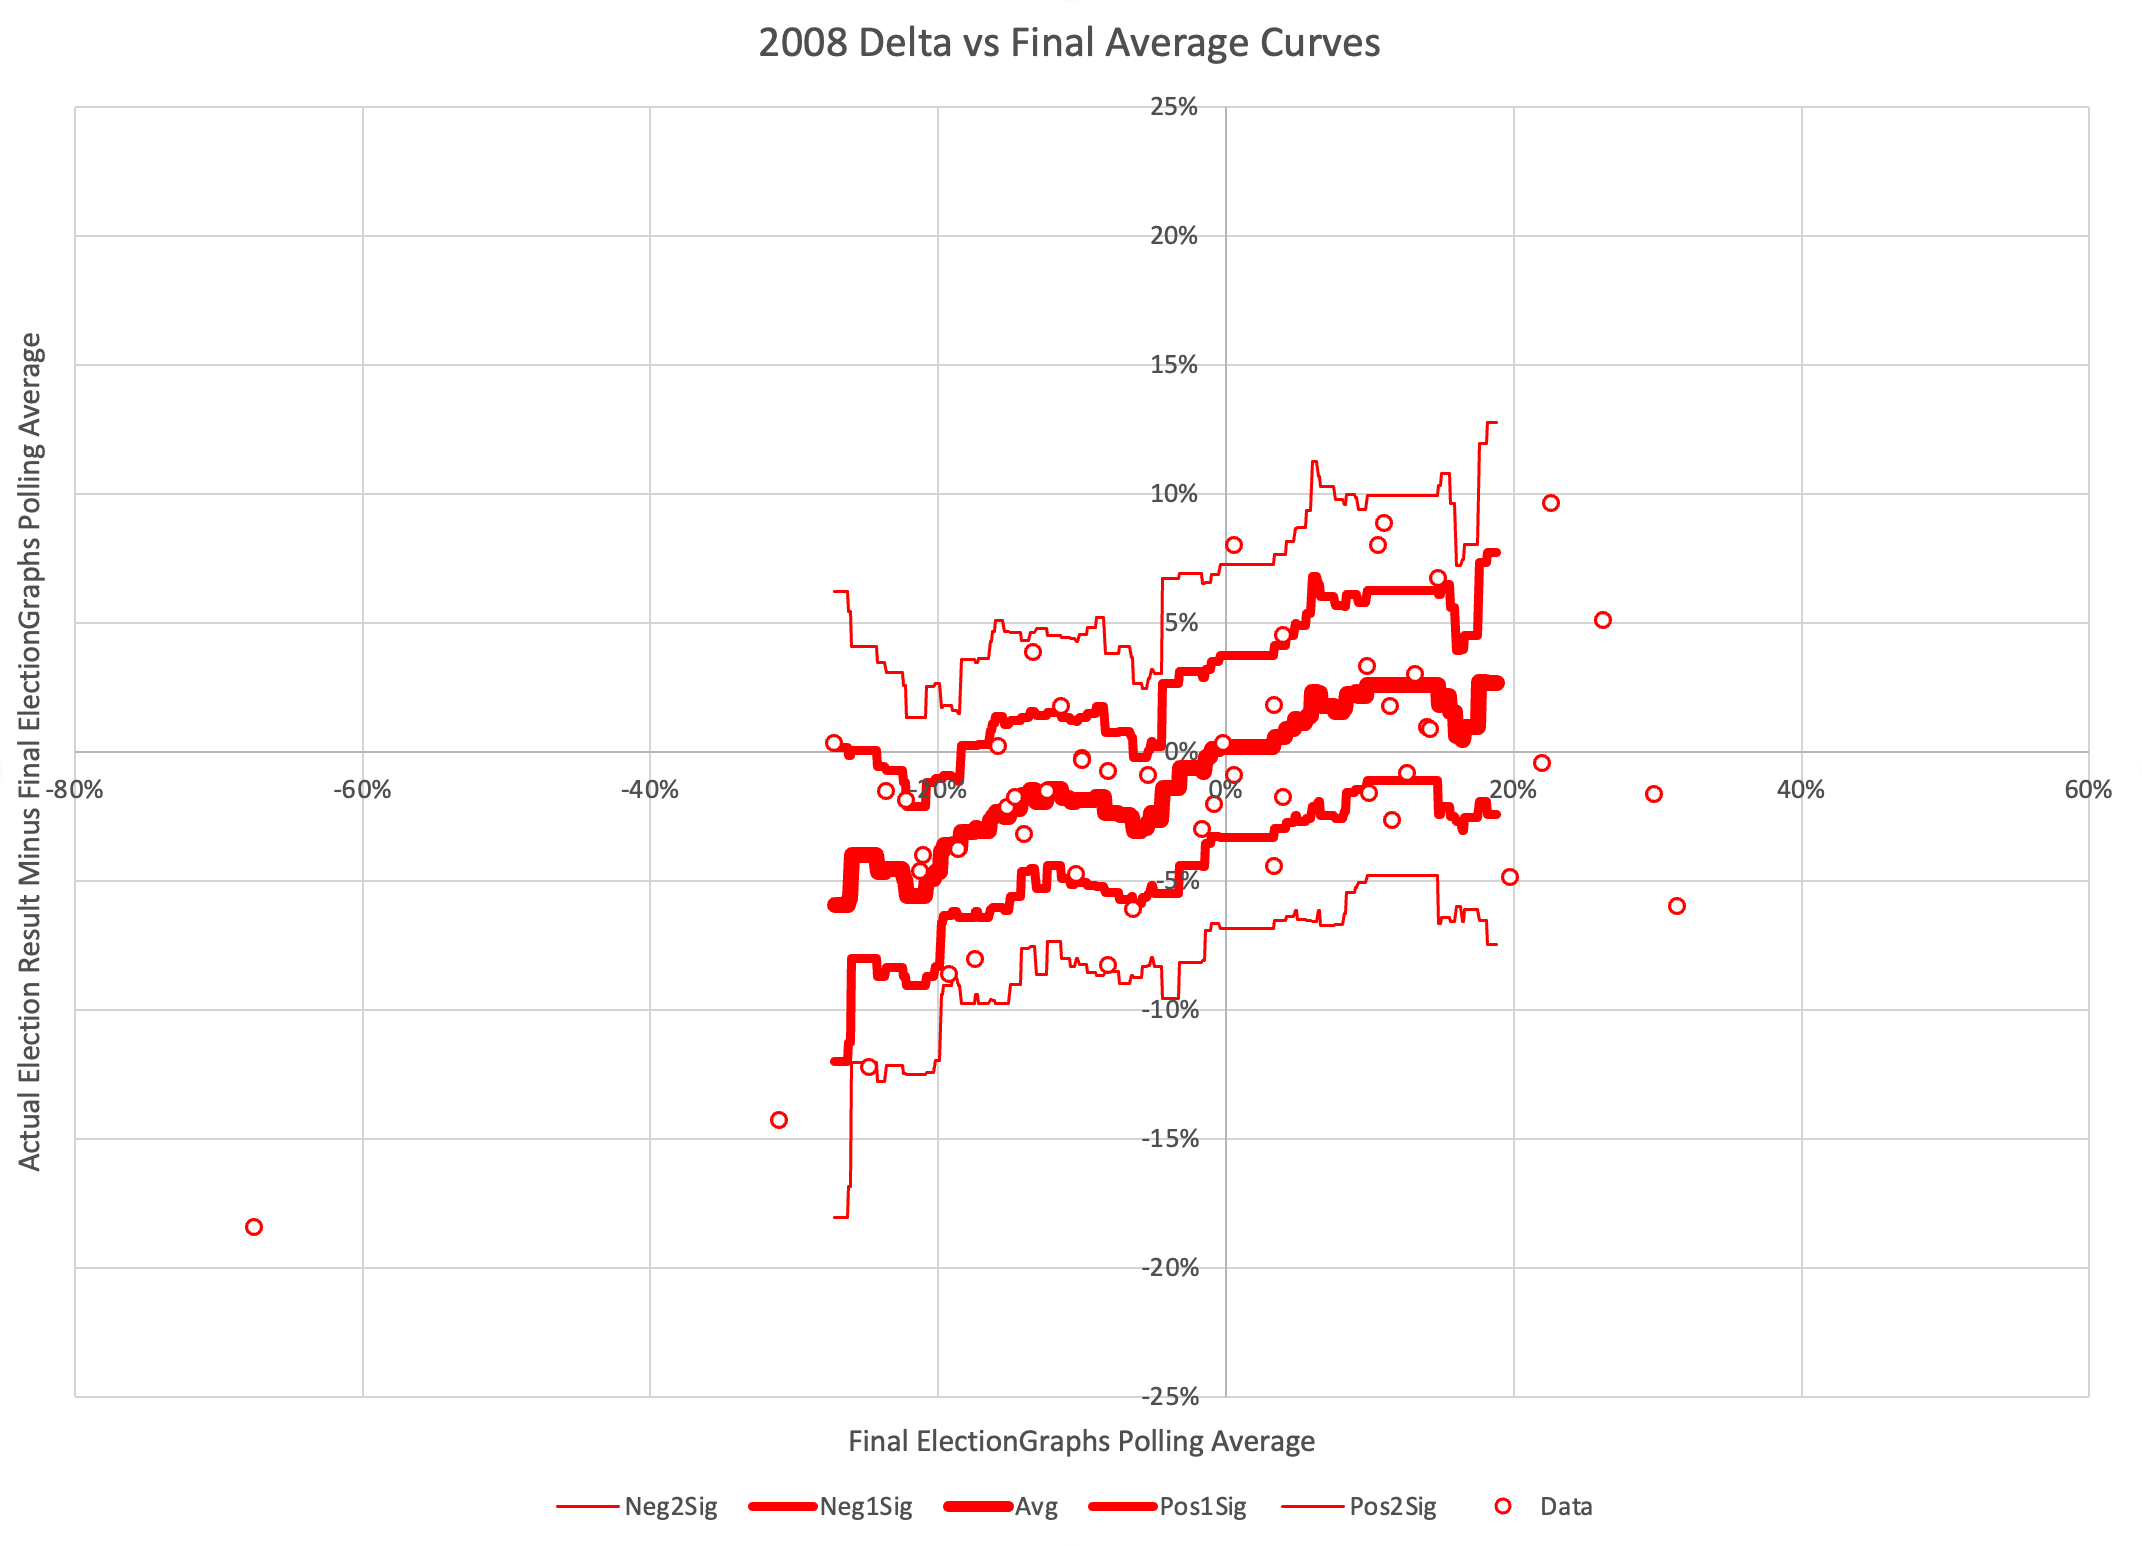
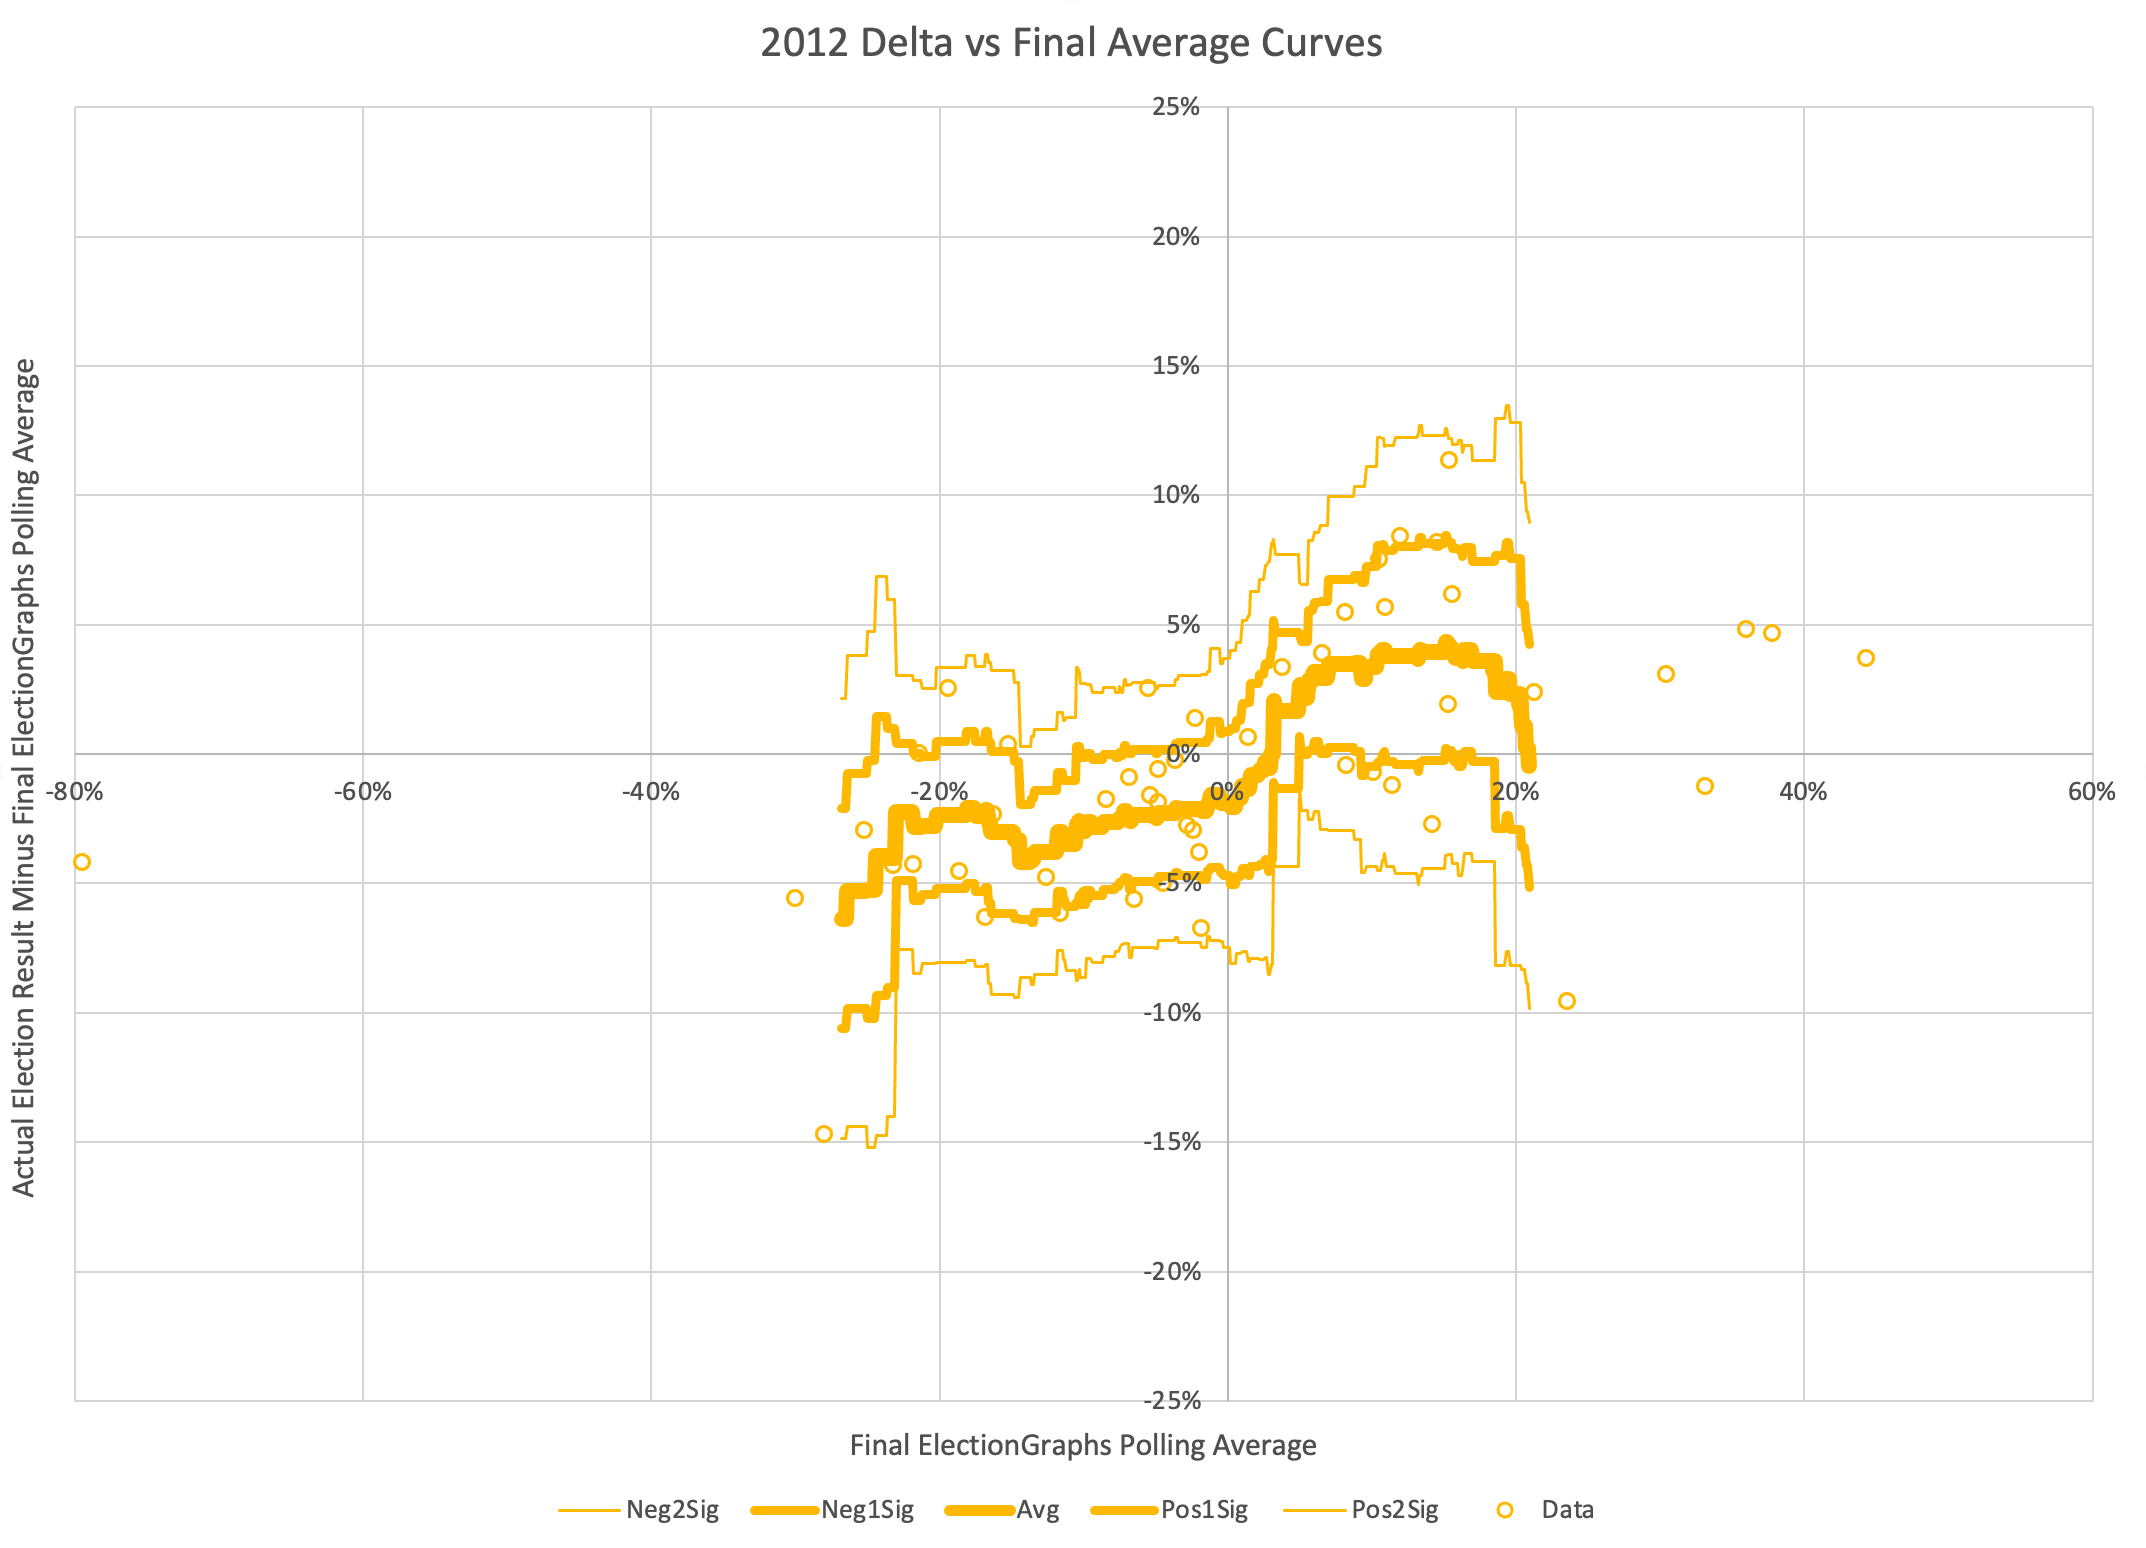
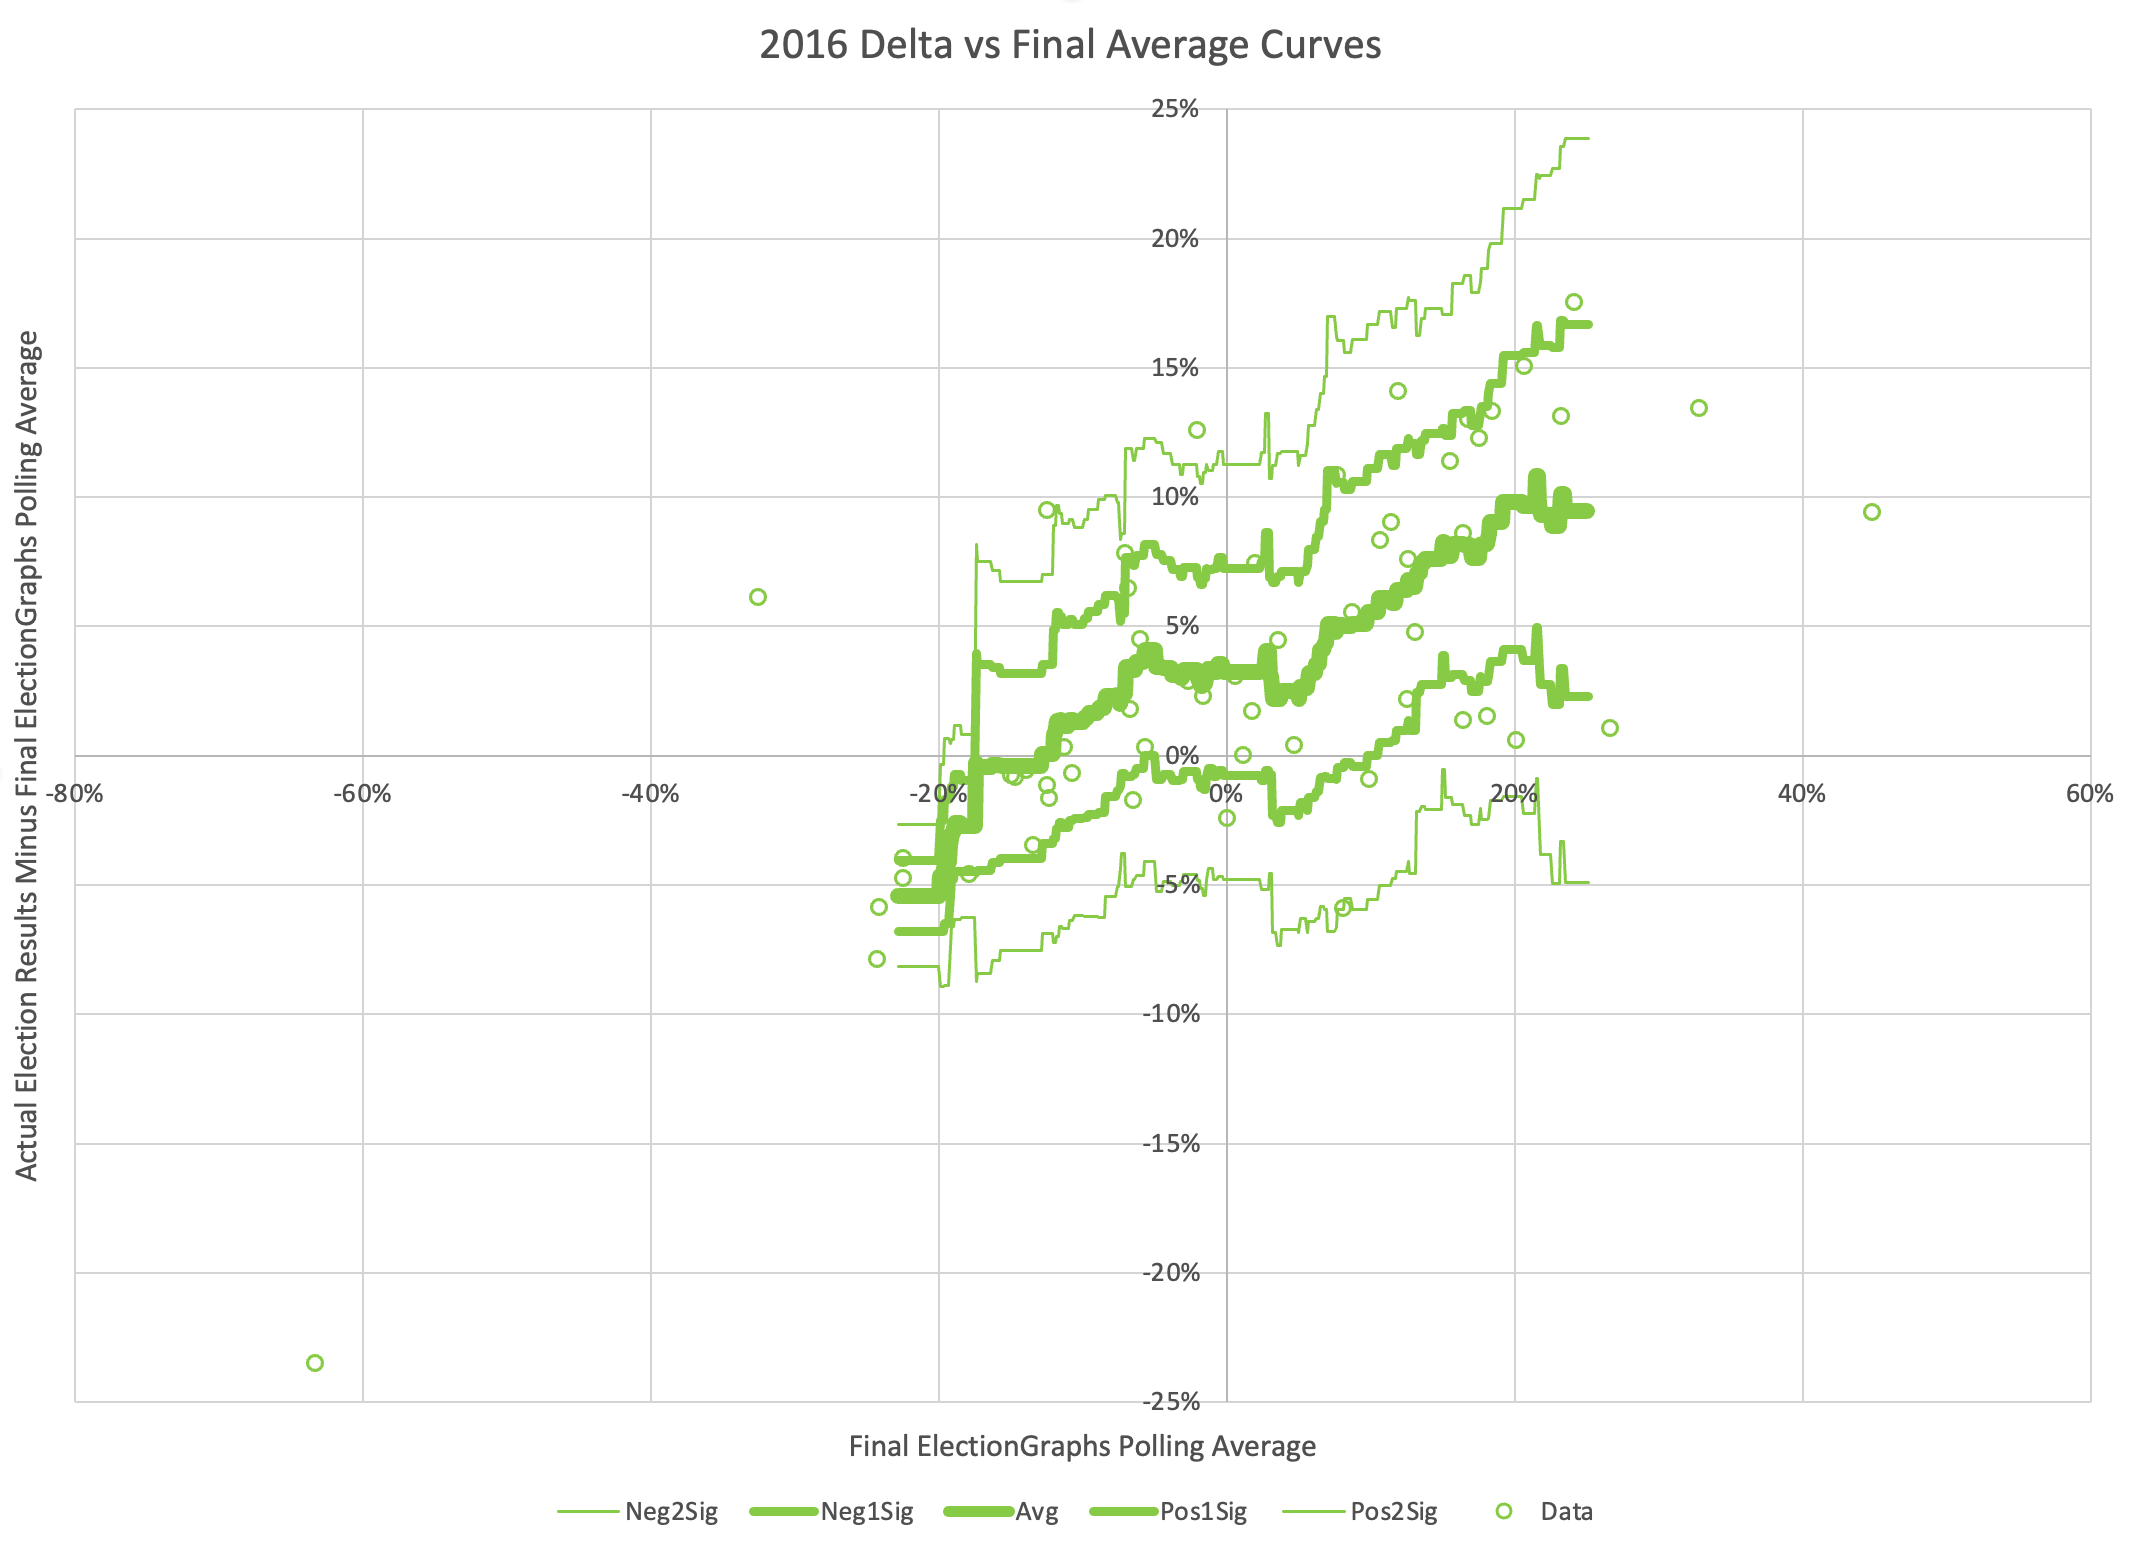
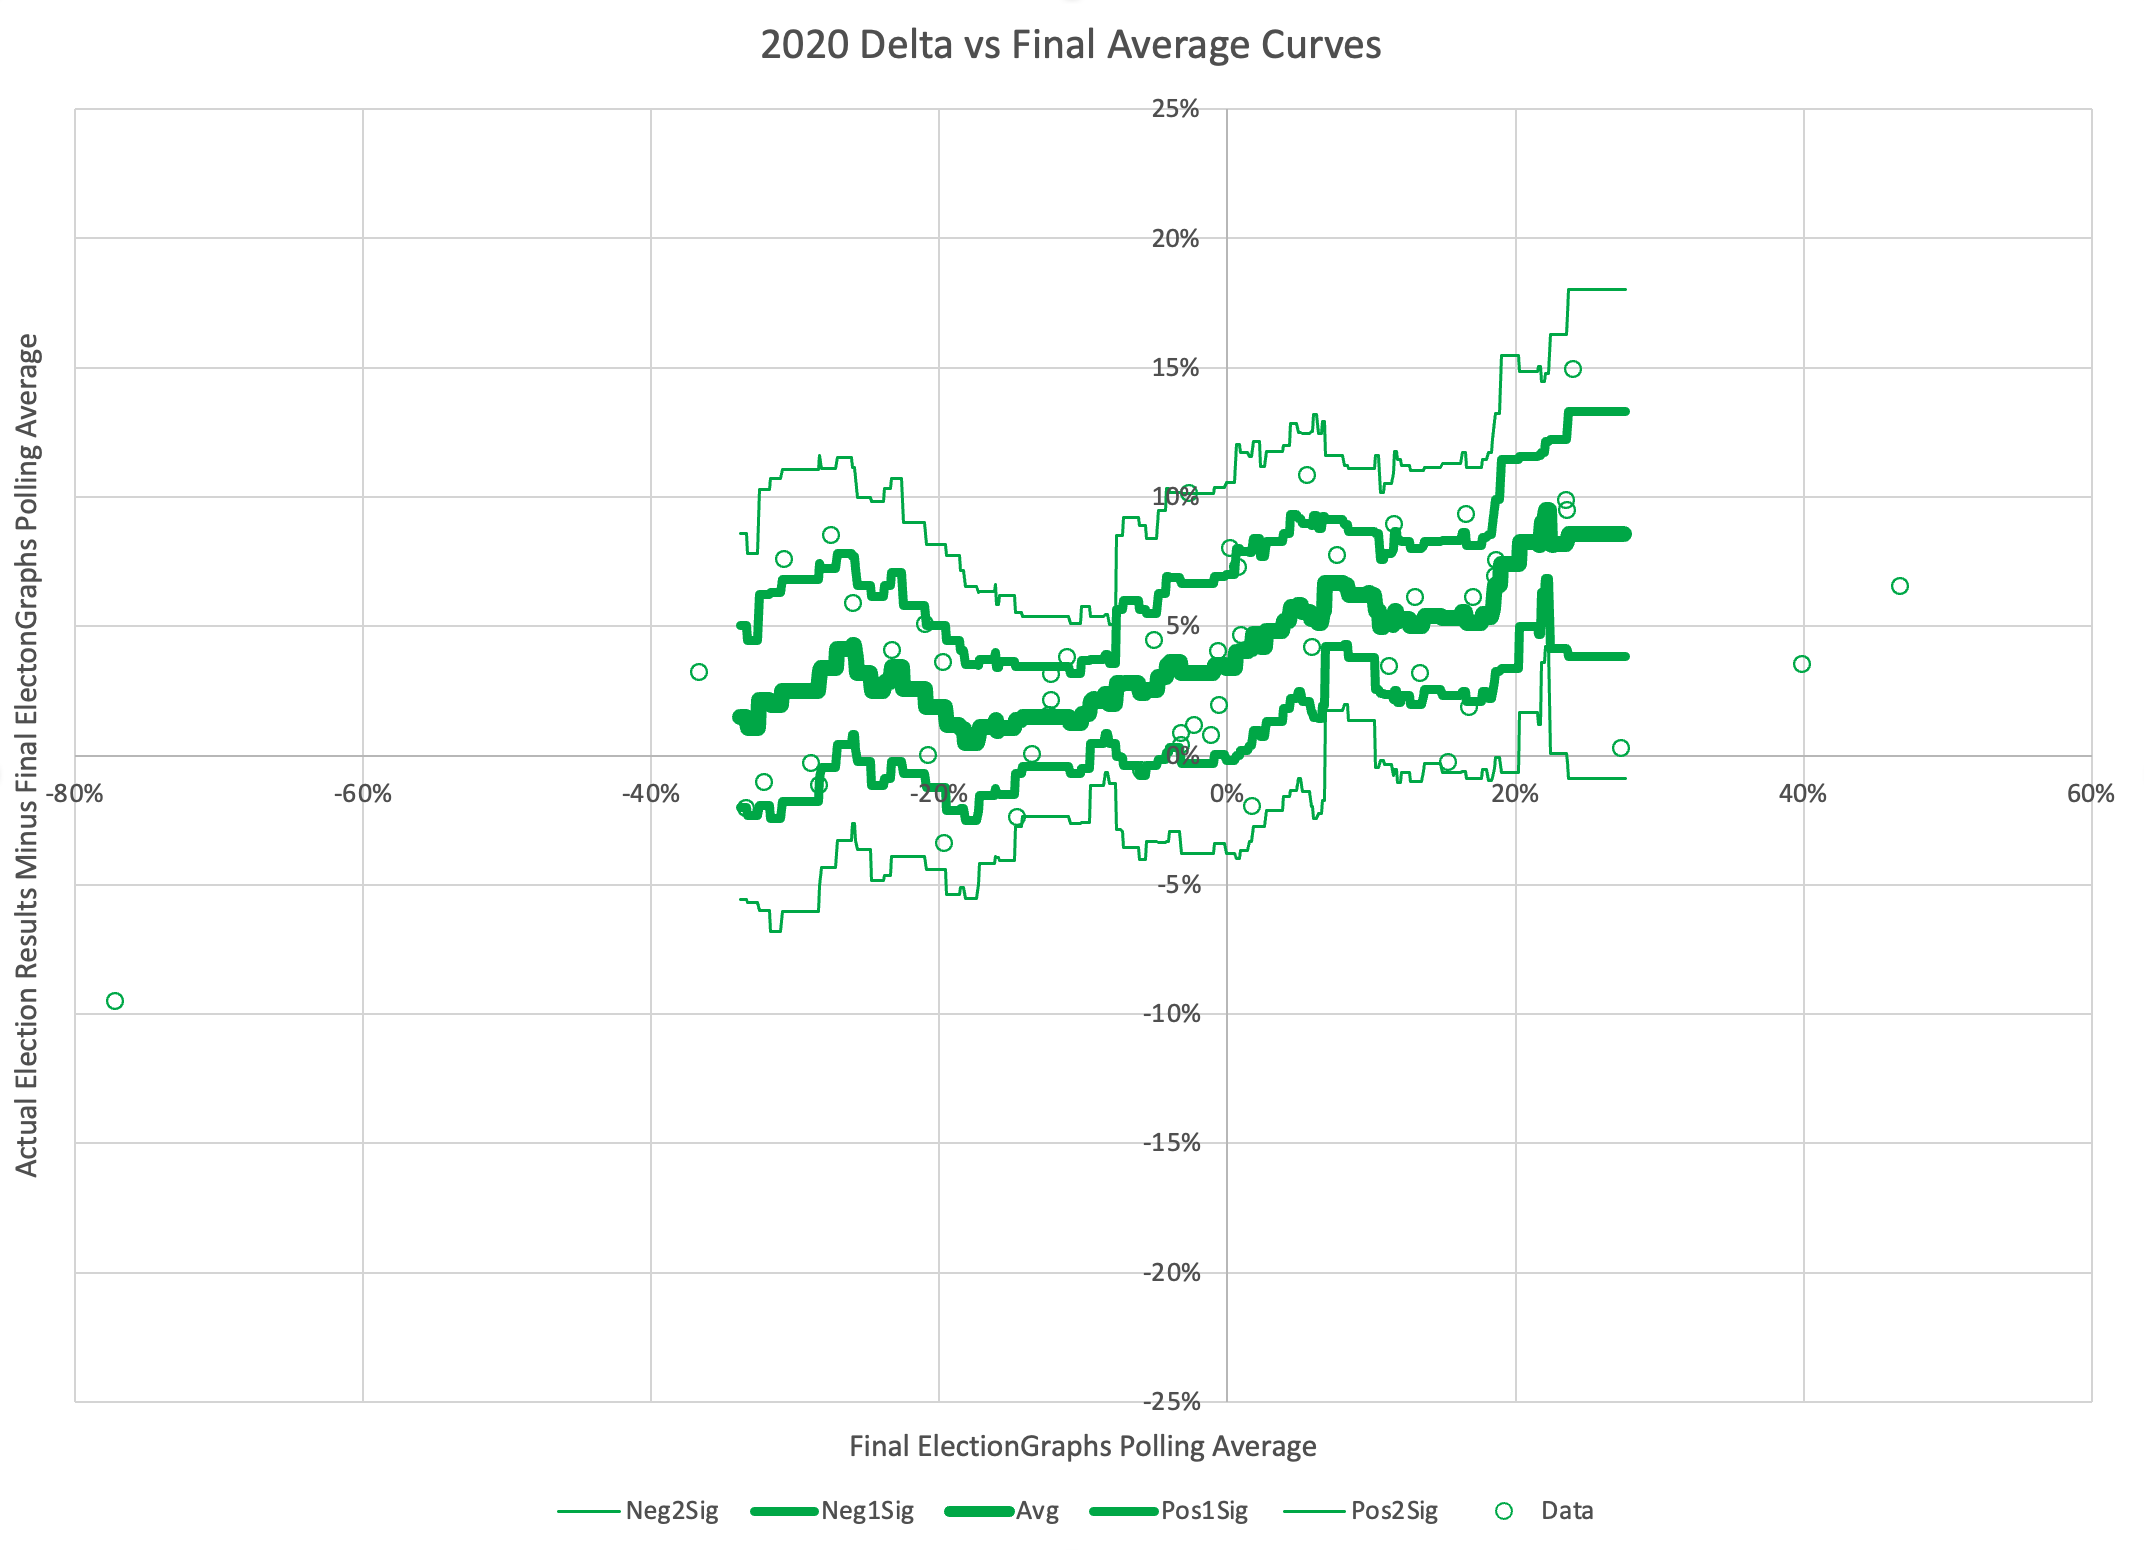
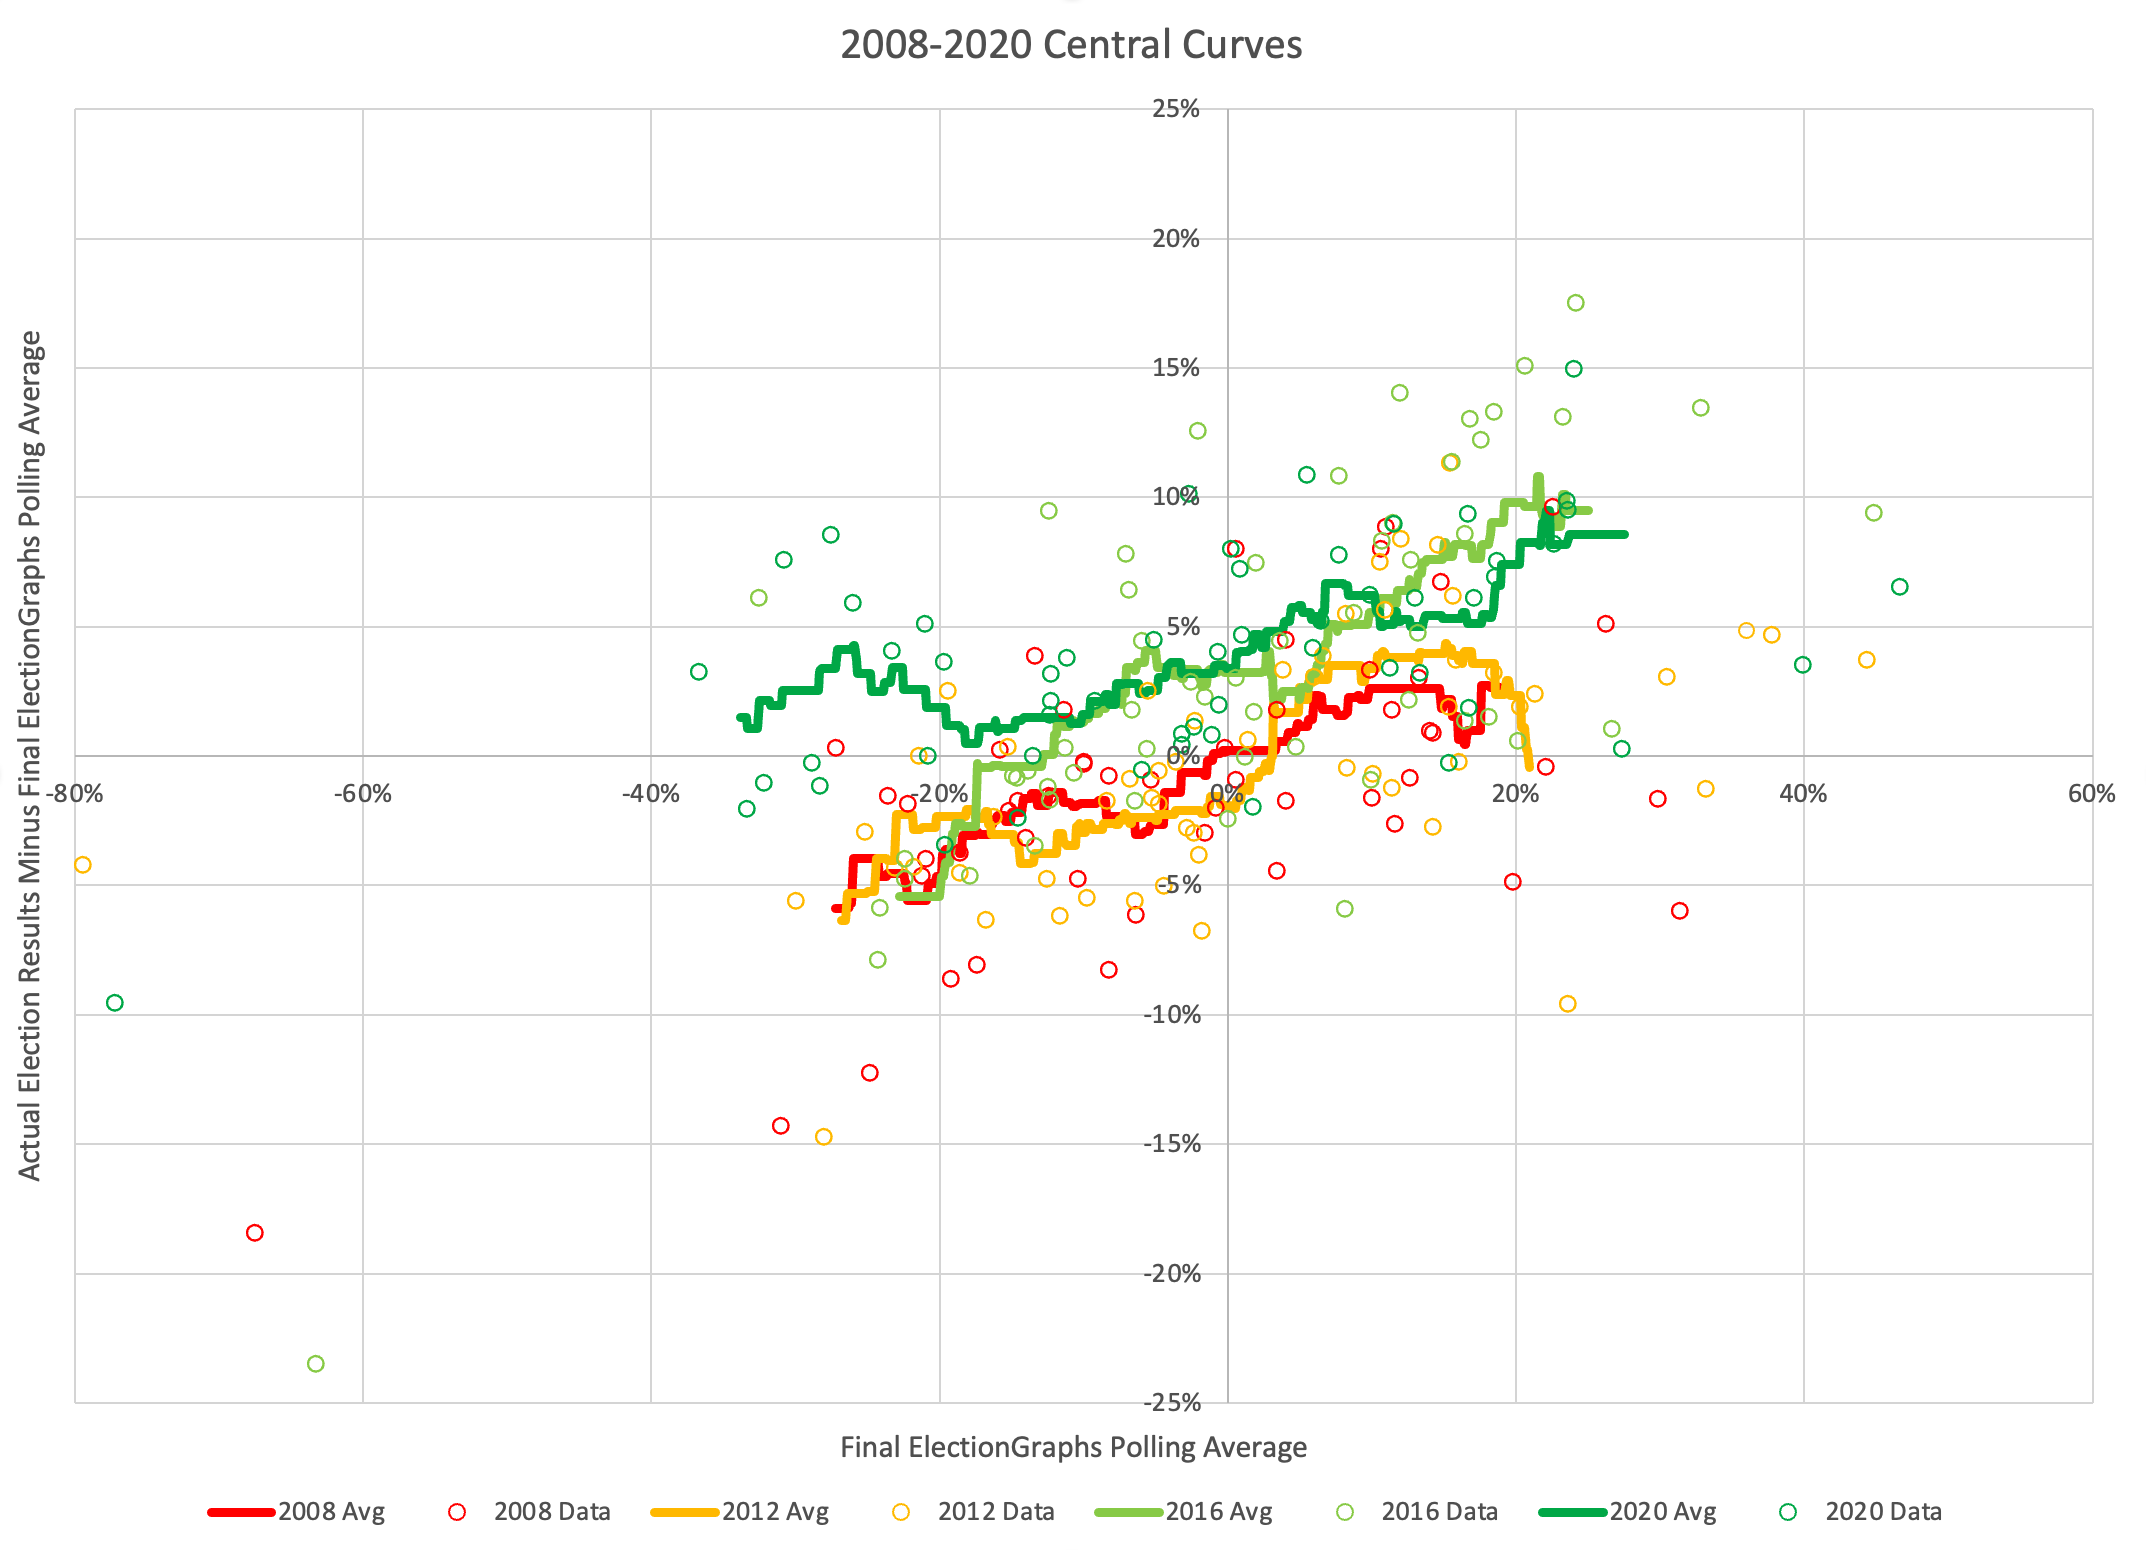
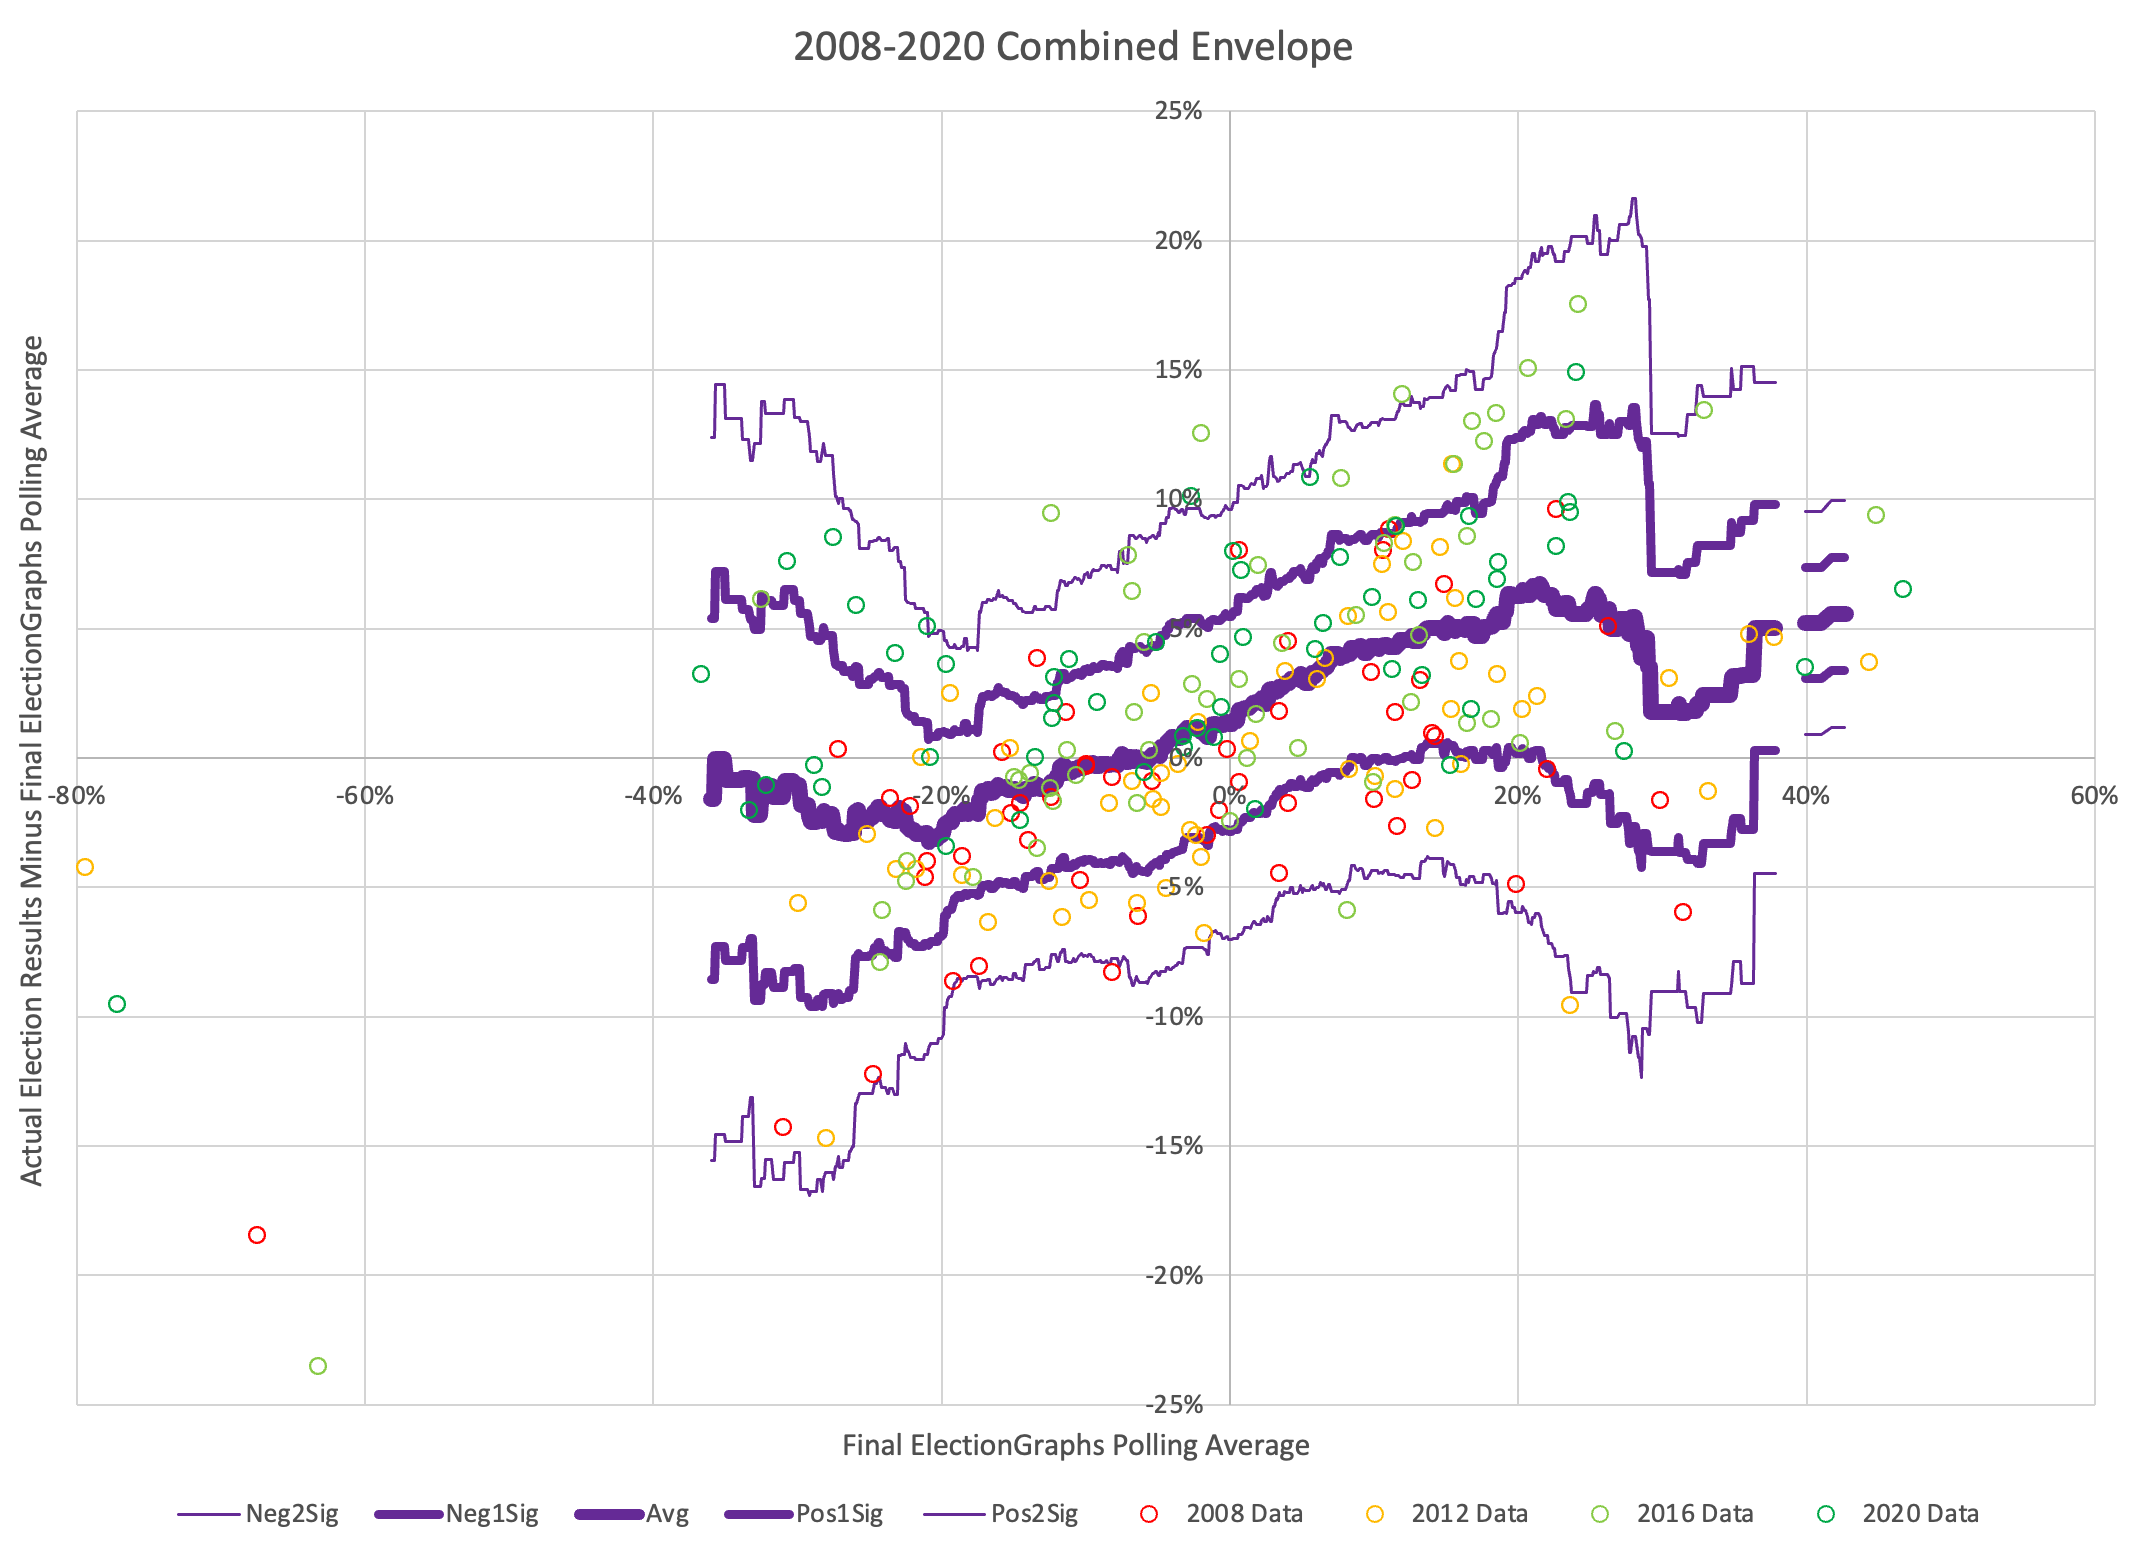
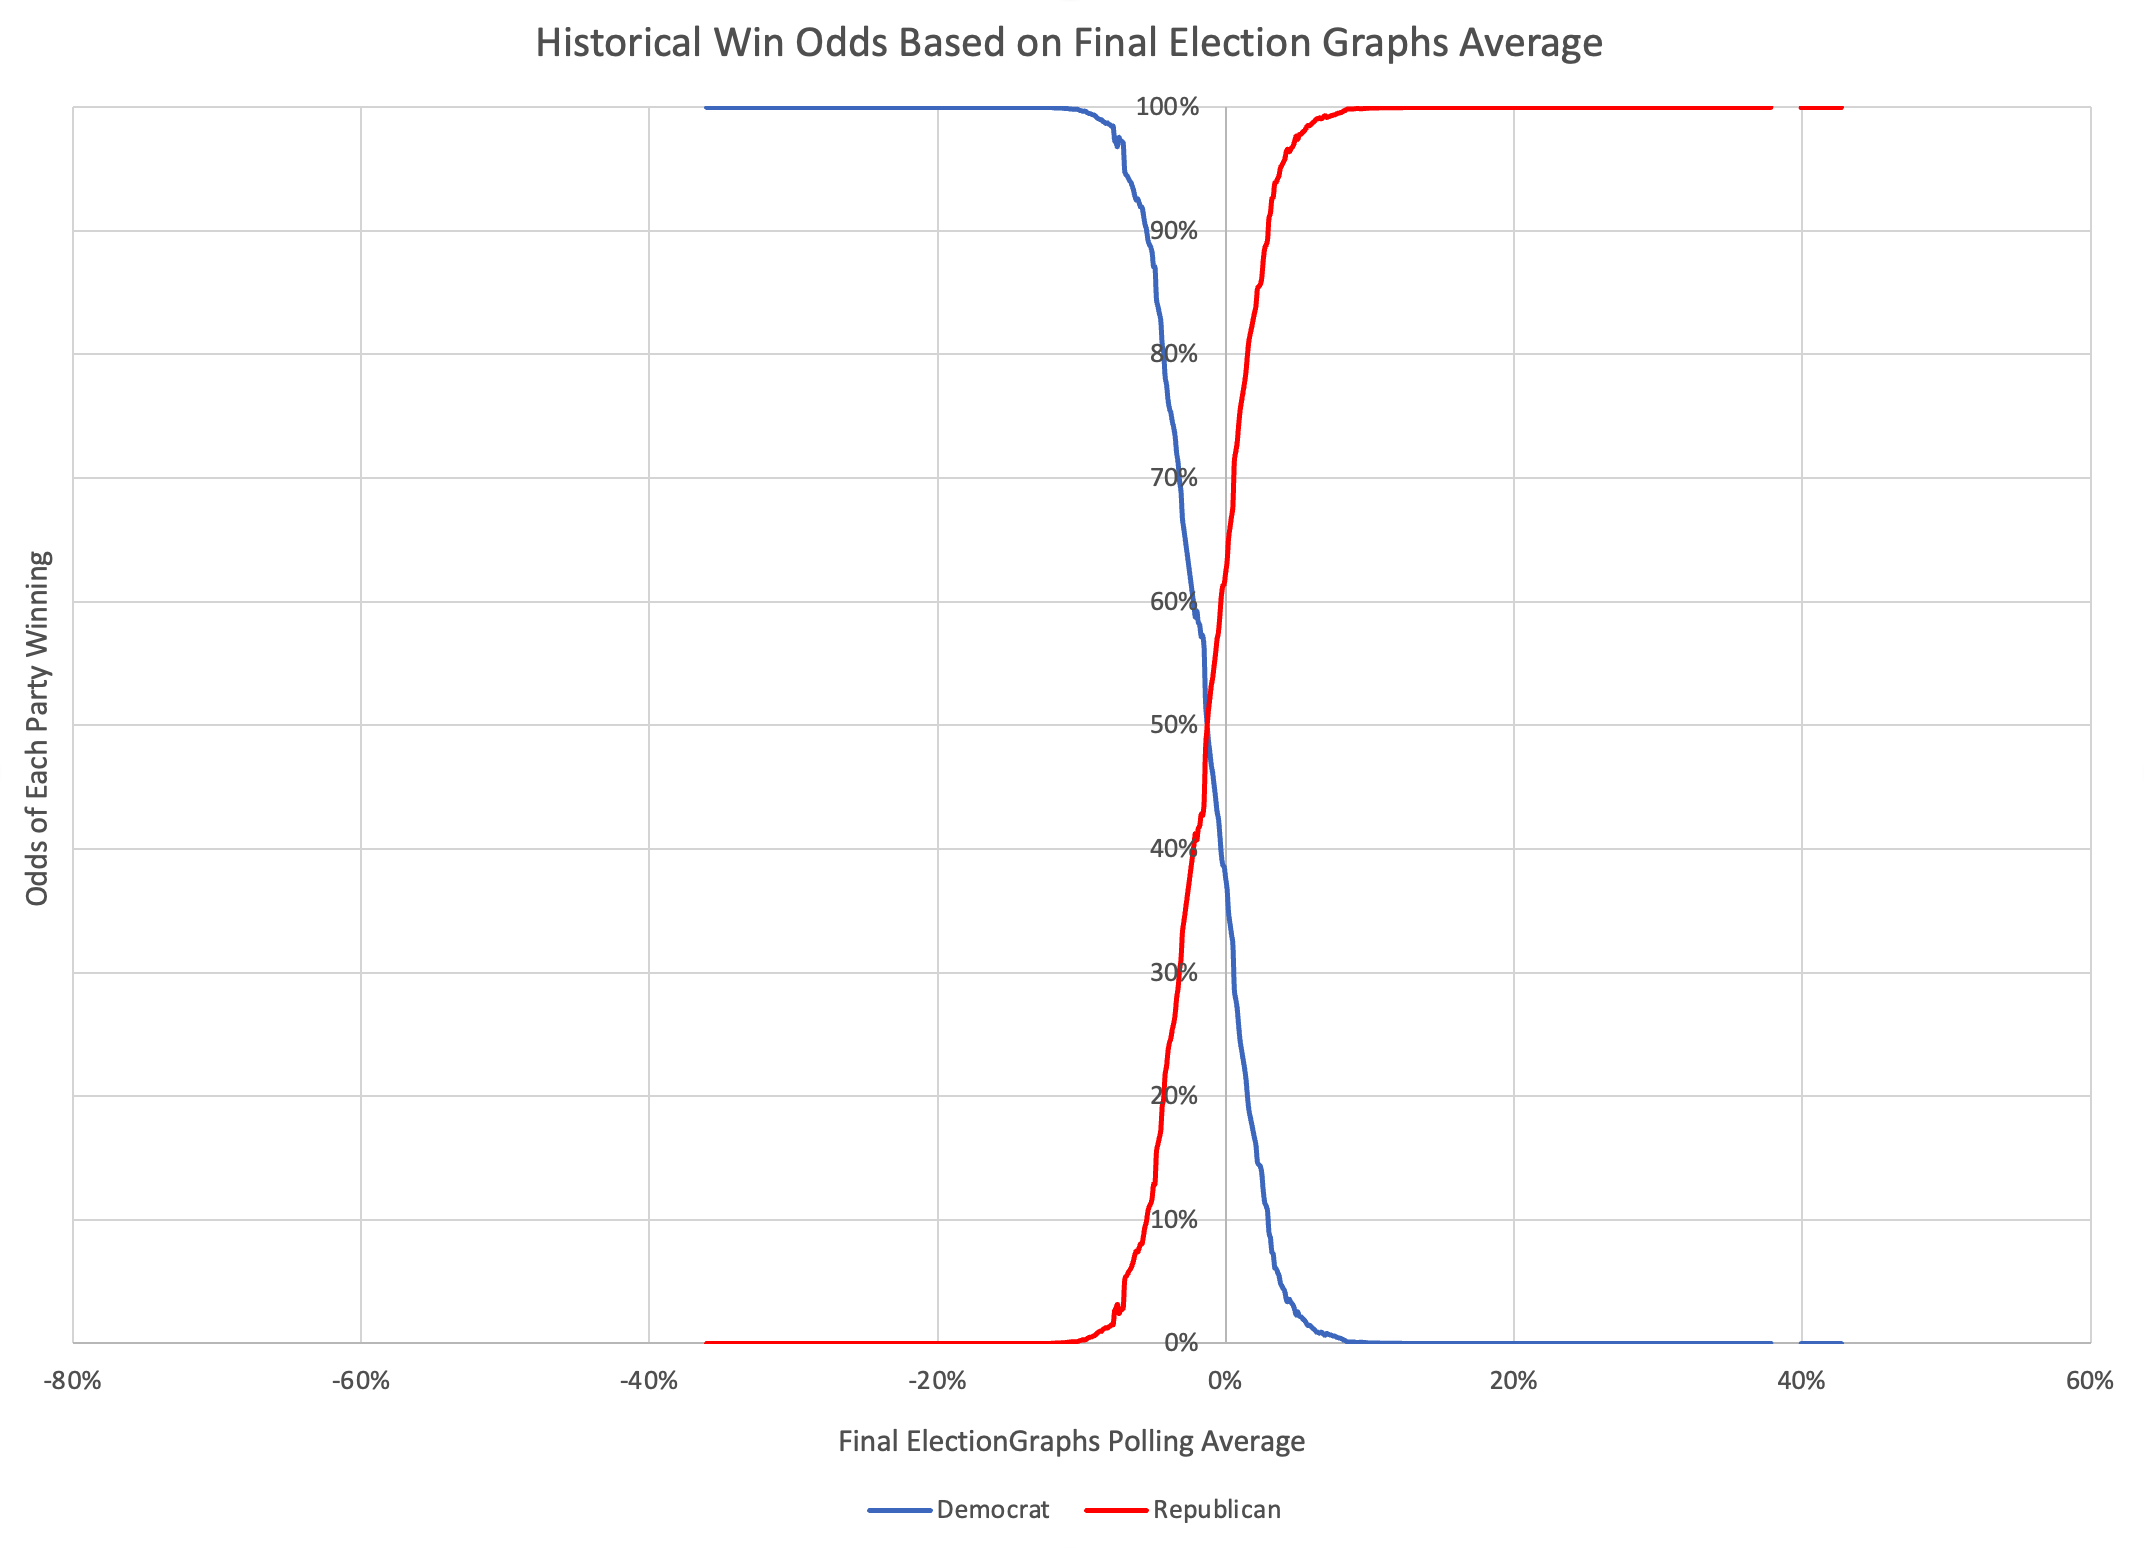
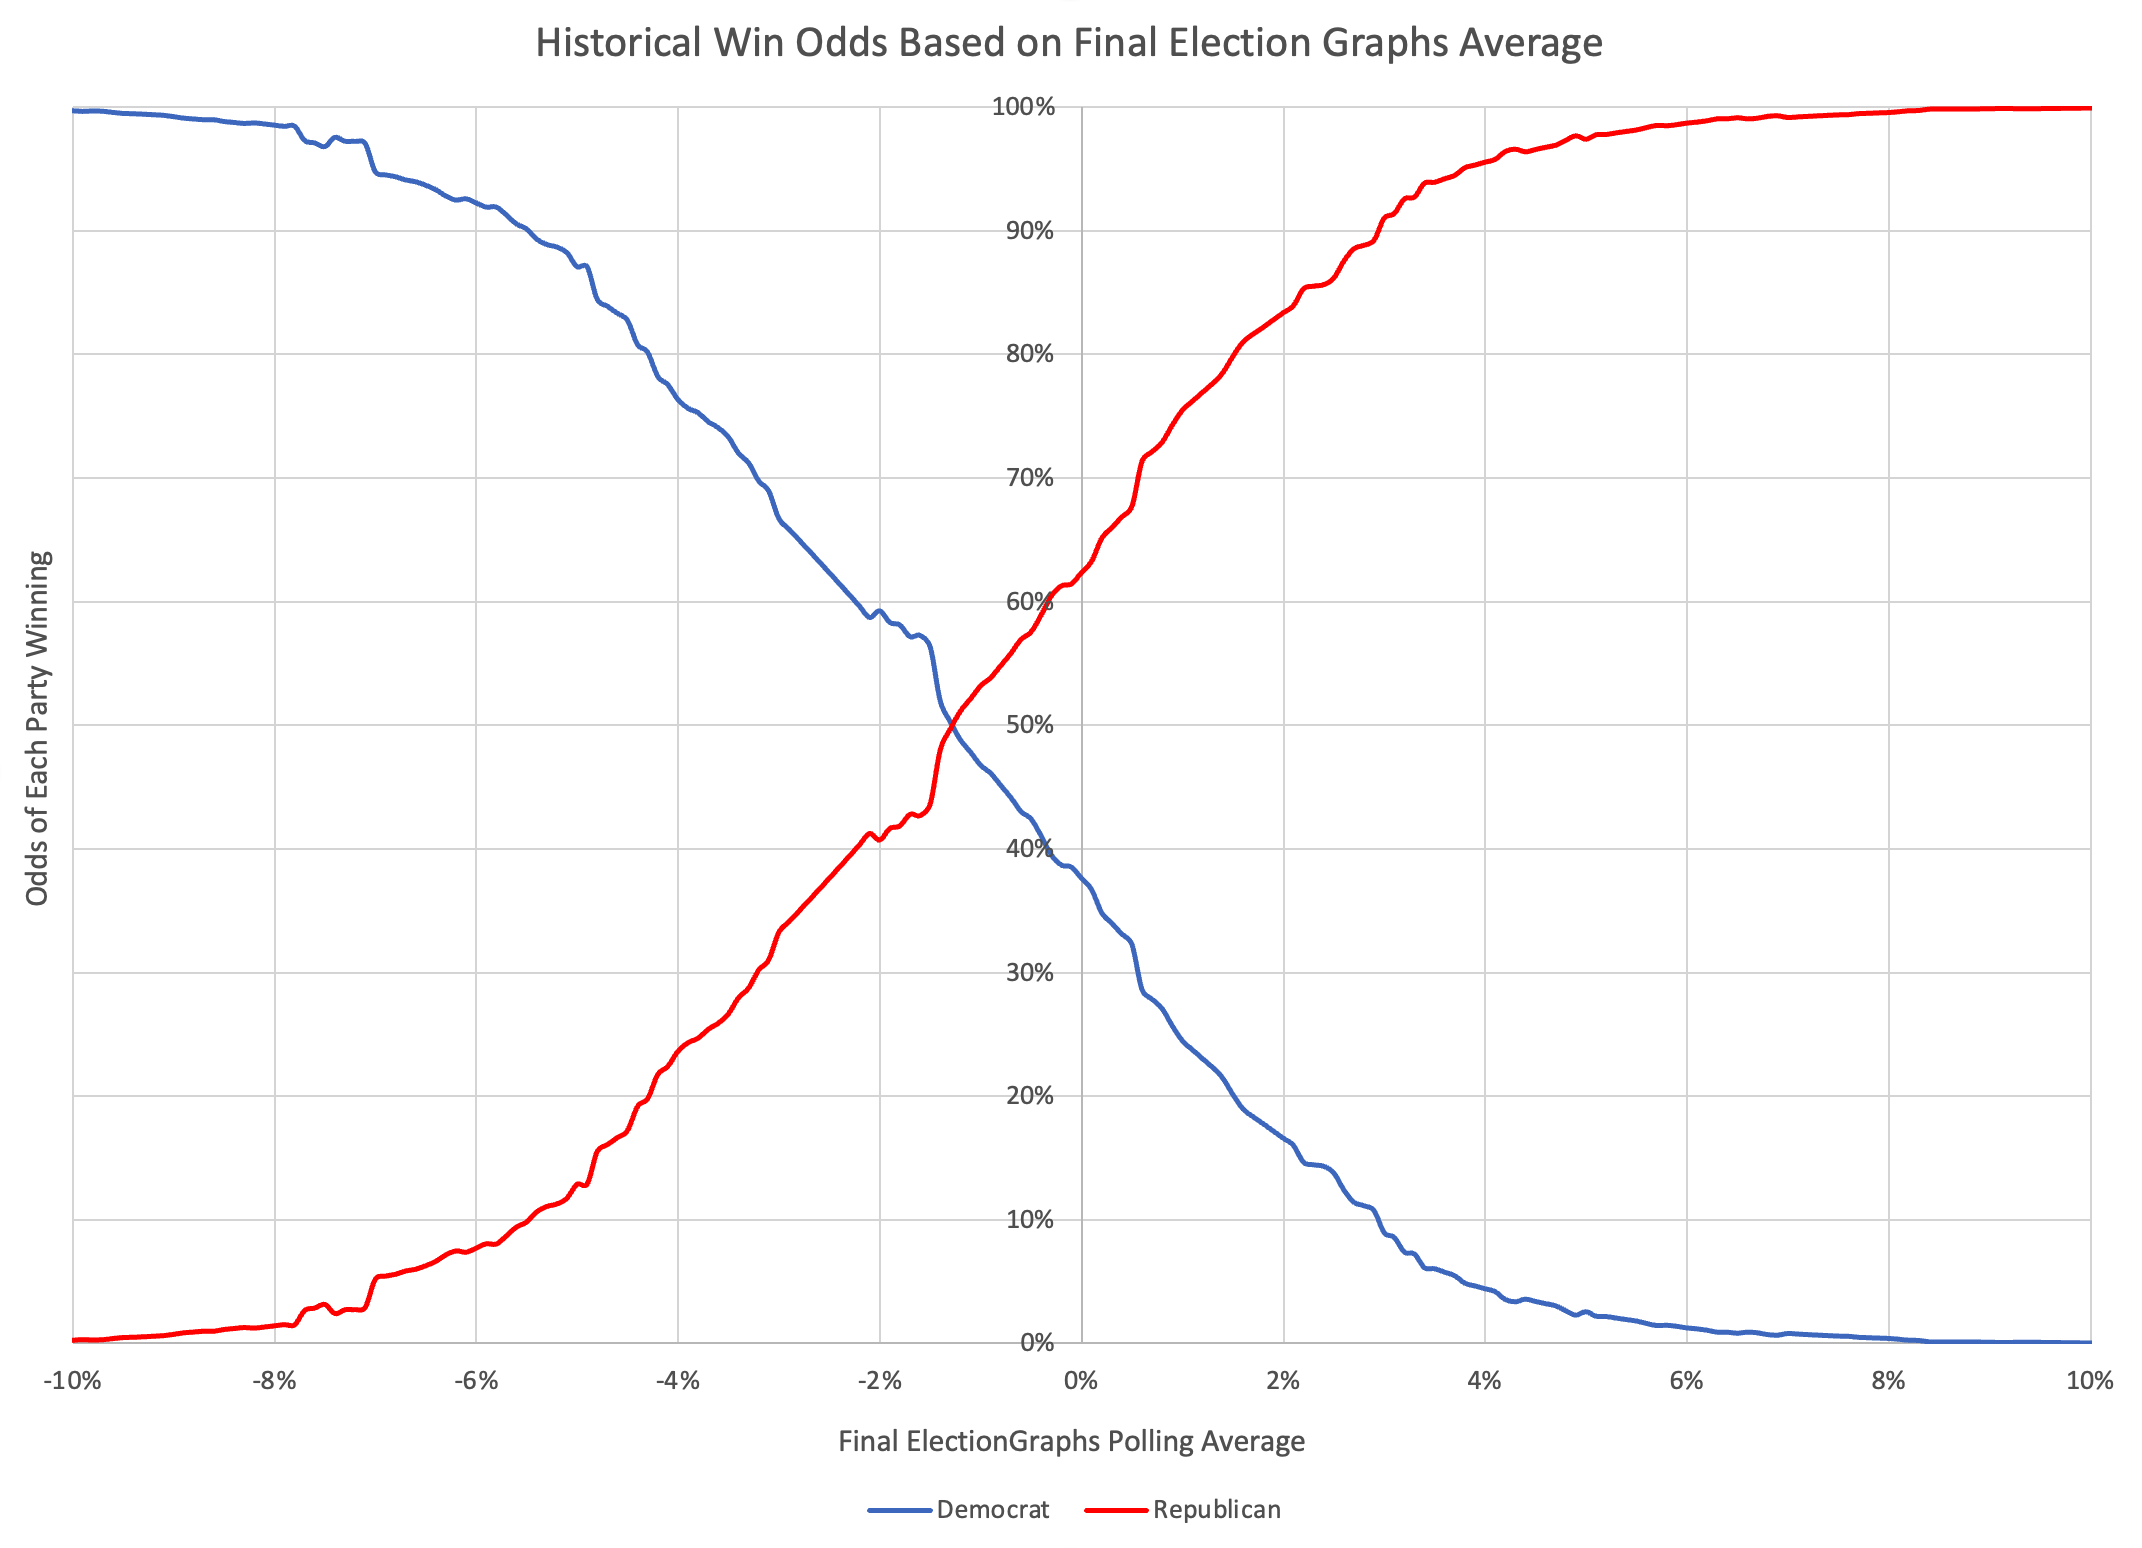
The probabilistic views here are all based on looking at the final election graphs averages in all the states compared to the actual election results in 2008 through 2020. Basically, in cases where Democrats were ahead by about 0.7%, they won only about 44% of the time.
So with Biden leading by 0.7% in the tipping point state, this is why the two probabilistic views give Trump an edge, even though the straight up poll averages give Biden a slight advantage.
Either way, the correct summary is "too close to call".
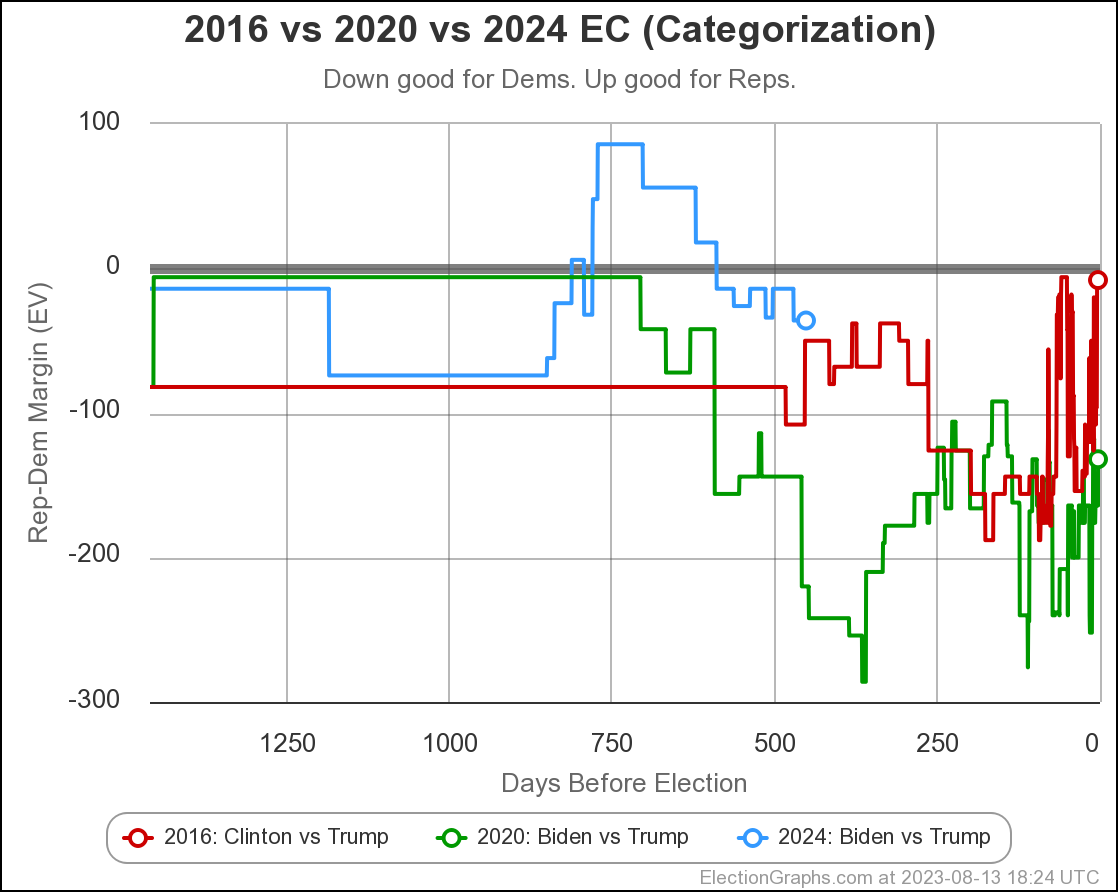
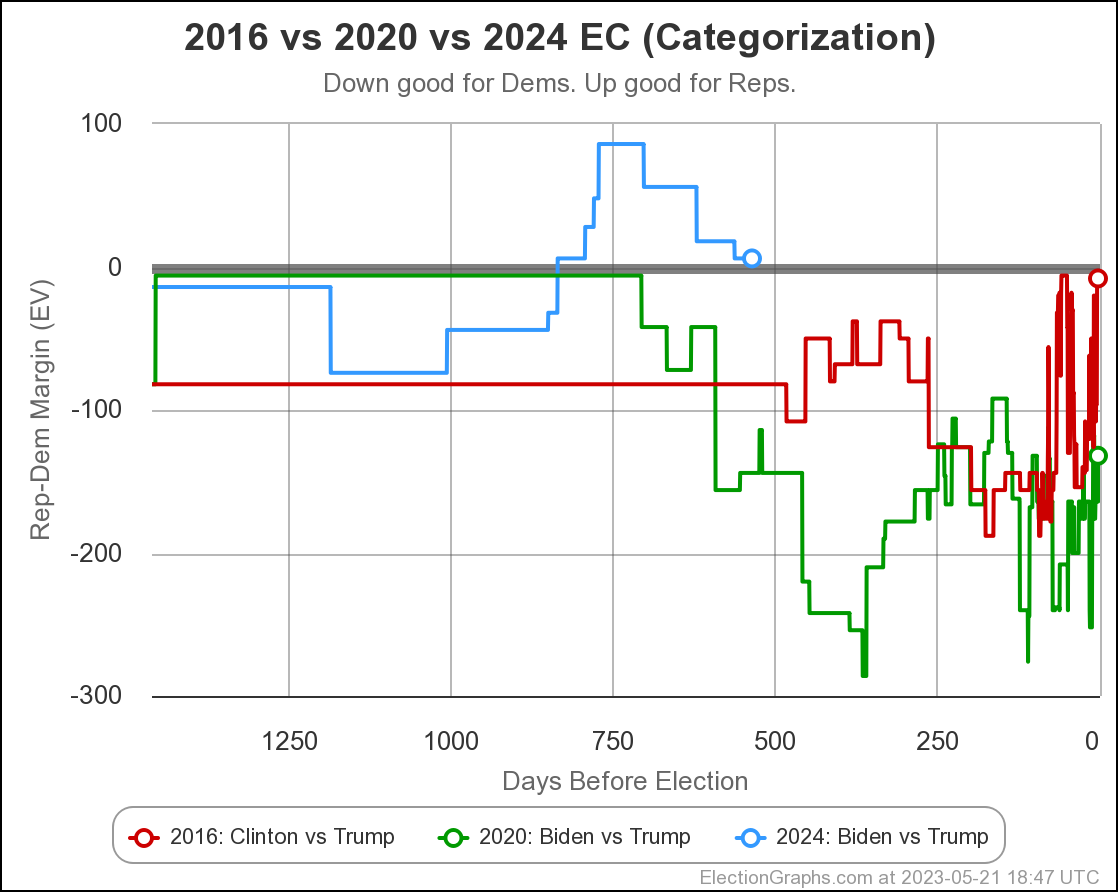
As usual, lets compare to 2016 and 2020 as well:
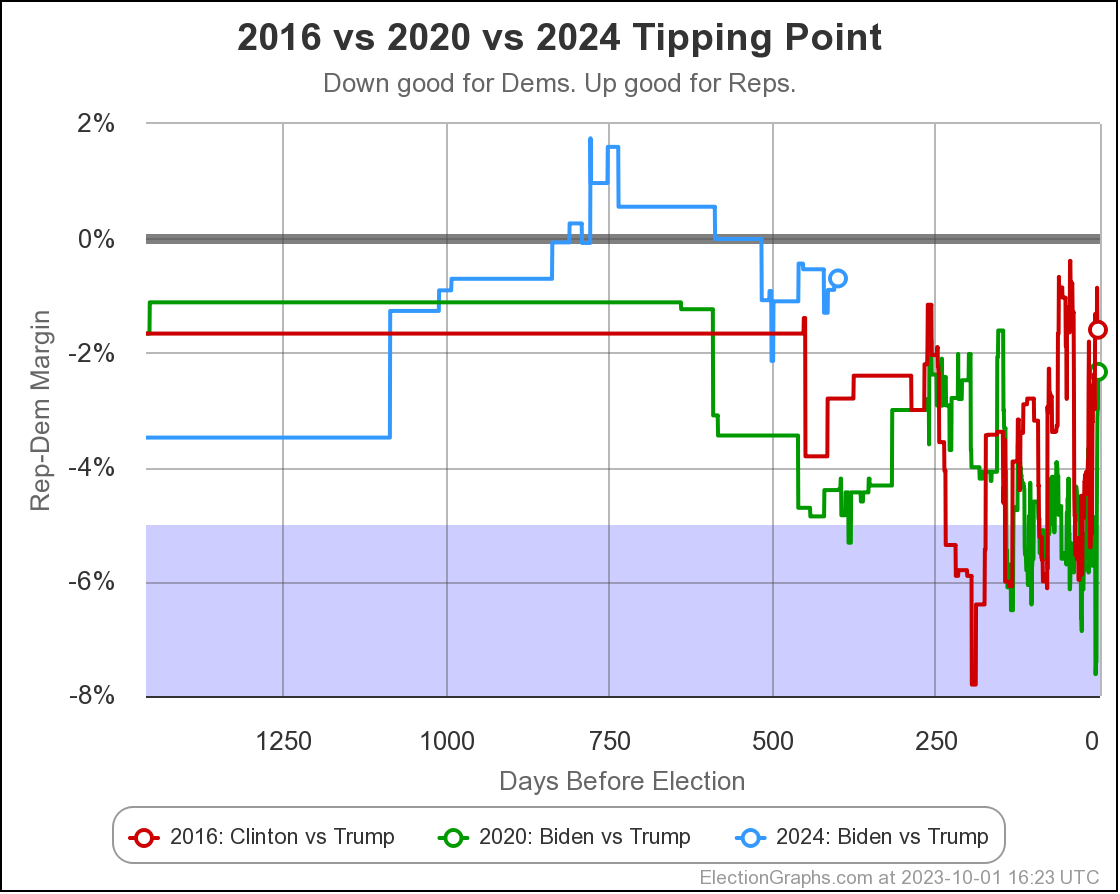
There are some arguments to be had related to Democratic over performance in midterms and special elections that while the polls may have underestimated the Republicans in 2016 and 2020, they may be underestimating the Democrats in 2024 like they did in 2012.
Maybe. There will be no way to tell until the votes are counted.
But at the moment, Biden continues to not only be weaker than he was against Trump in 2020, but in fact significantly weaker than Clinton was at the same point in 2016. There is a long time to go yet, but the Biden camp should not be happy with this position. Trump on the other hand should be heartened. Even with all of his mounting legal issues, he looks to be in a relatively strong position. For now anyway.
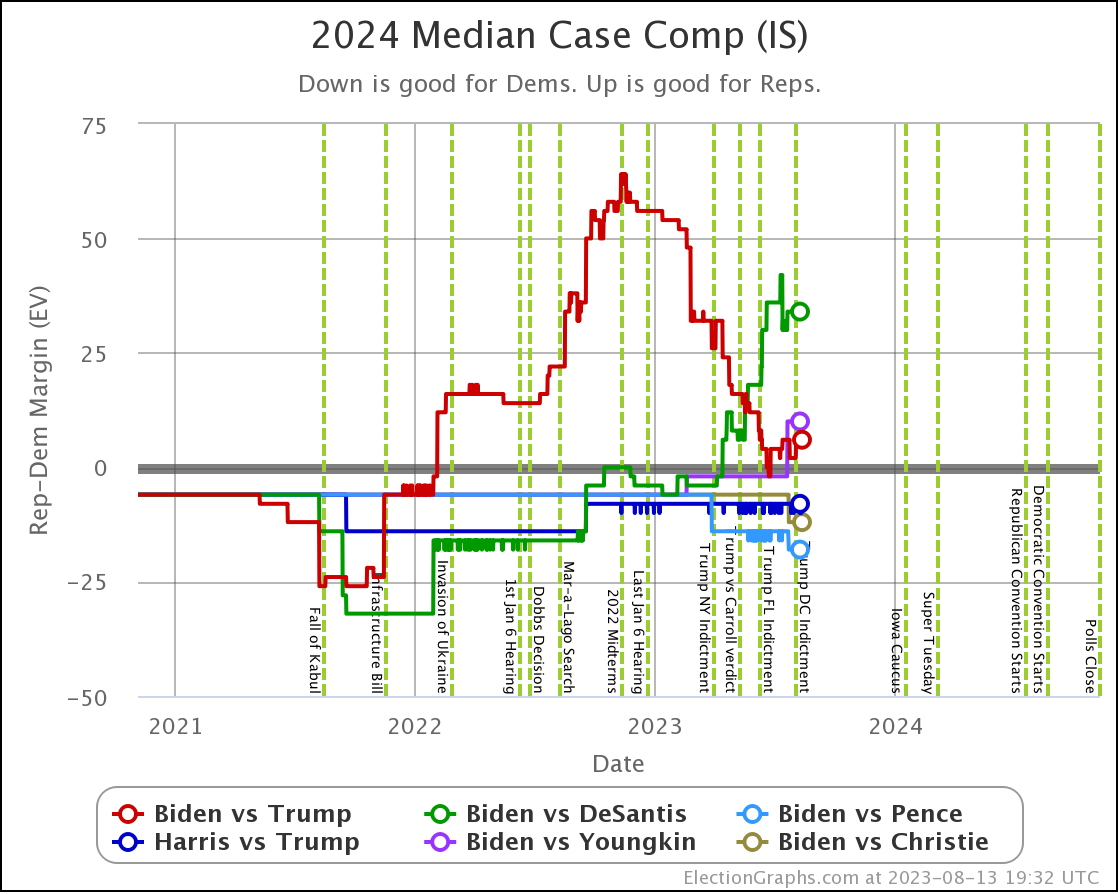
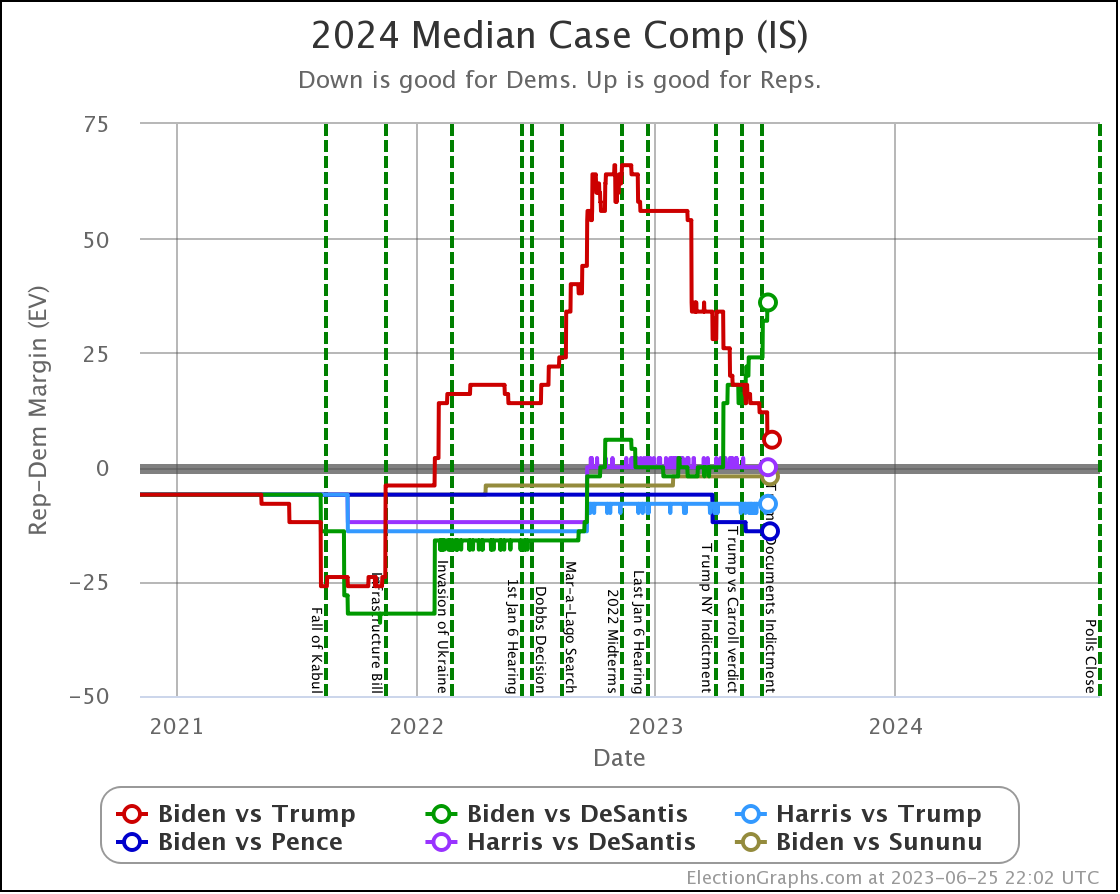
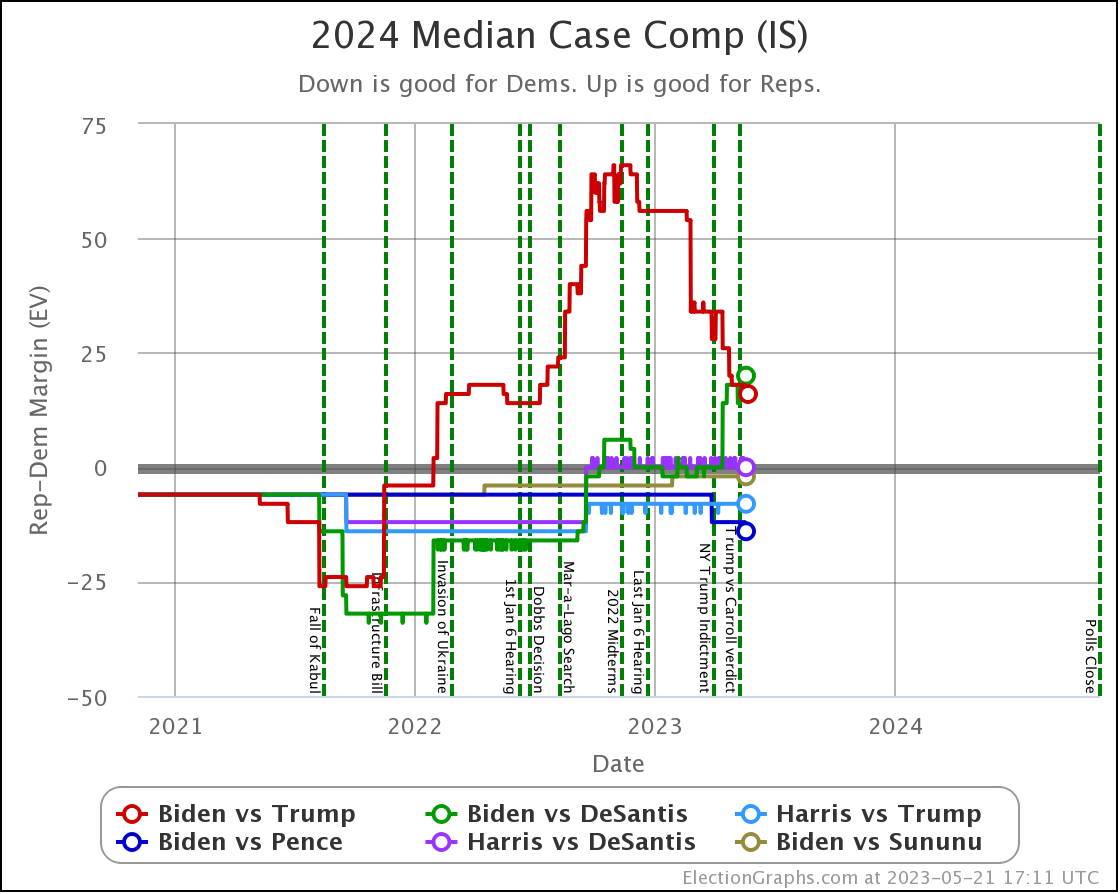
What if it isn't Biden vs Trump? OK, a quick look…
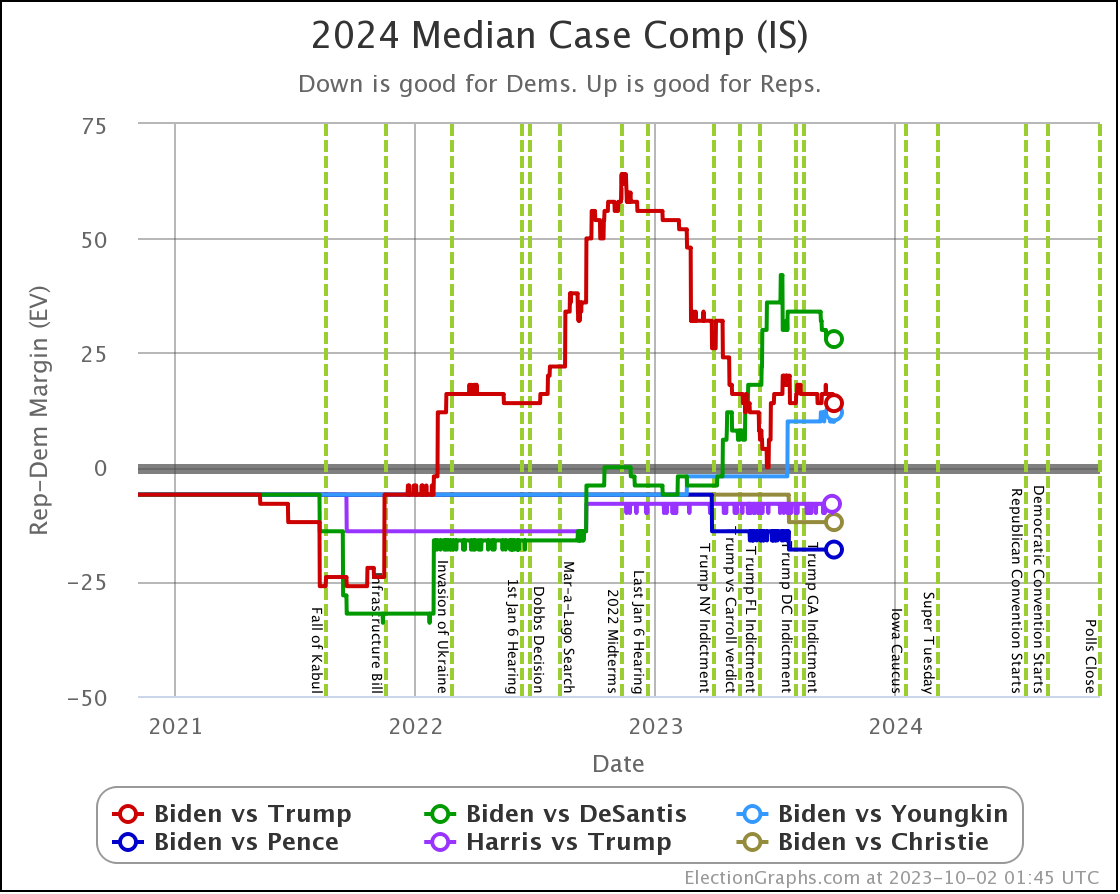
The above compares the median electoral college margin in the Independent States view between the 6 best polled candidate combinations.
Of these six though, Biden vs Trump is STILL the only one where I would say we have good reliable data.
Biden vs DeSantis is getting closer, but still needs to be taken with a grain of salt. There are still lots of "close states" where there haven't even been five polls yet.
And the other four combos on this chart? Just ignore them completely. There are only a smattering of polls on those combinations, not anywhere near enough to even remotely believe anything we see yet.
With those caveats, DeSantis does look stronger against Biden than Trump does on this chart at least.
Odds wise the Independent States view gives Biden only a 19.2% shot against DeSantis compared to 35.6% against Trump.
Looking at the Uniform Swing view however gives Biden a full 57.3% against DeSantis, better than his 44.2% against Trump.
So there is still a lot more uncertainty in the DeSantis picture.
Right now primary polling indicates both Biden and Trump are cruising to their respective nominations. If this ever changes, we'll pay more attention to the other possible combinations and dig a bit deeper.
For full Biden vs DeSantis info, look here.
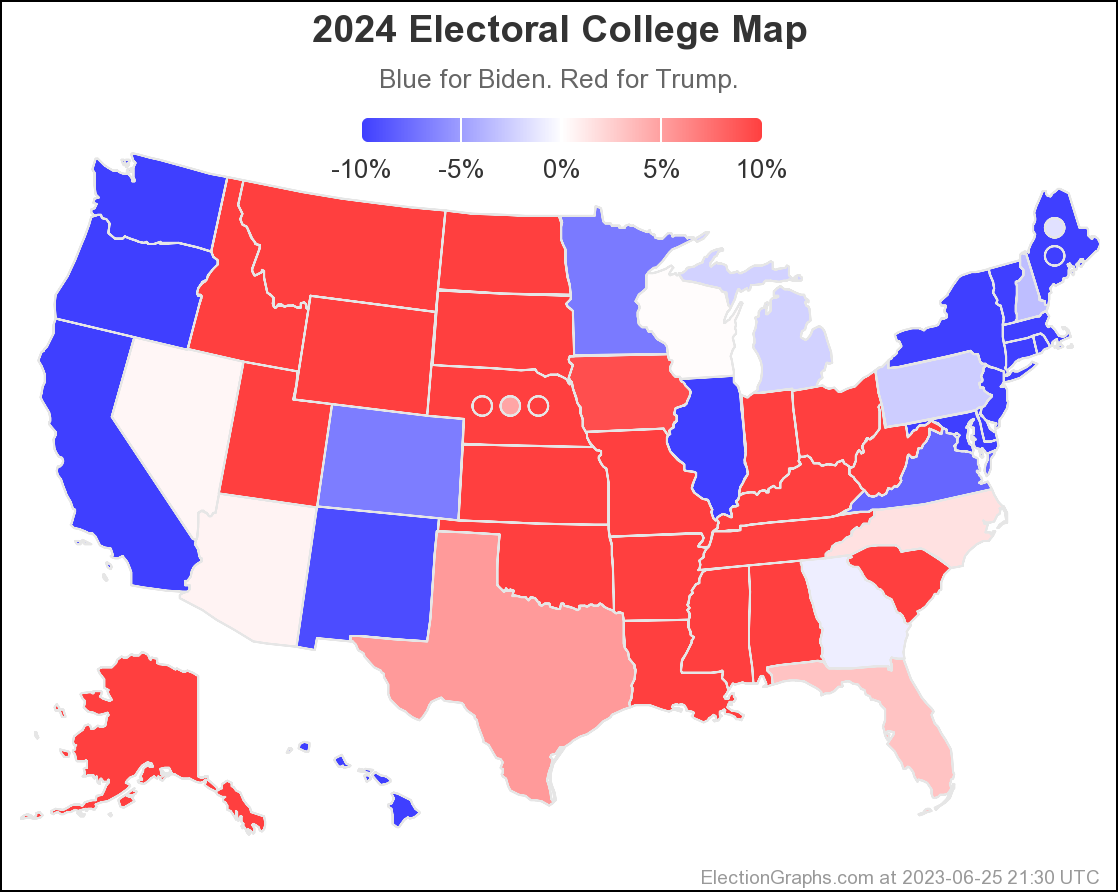
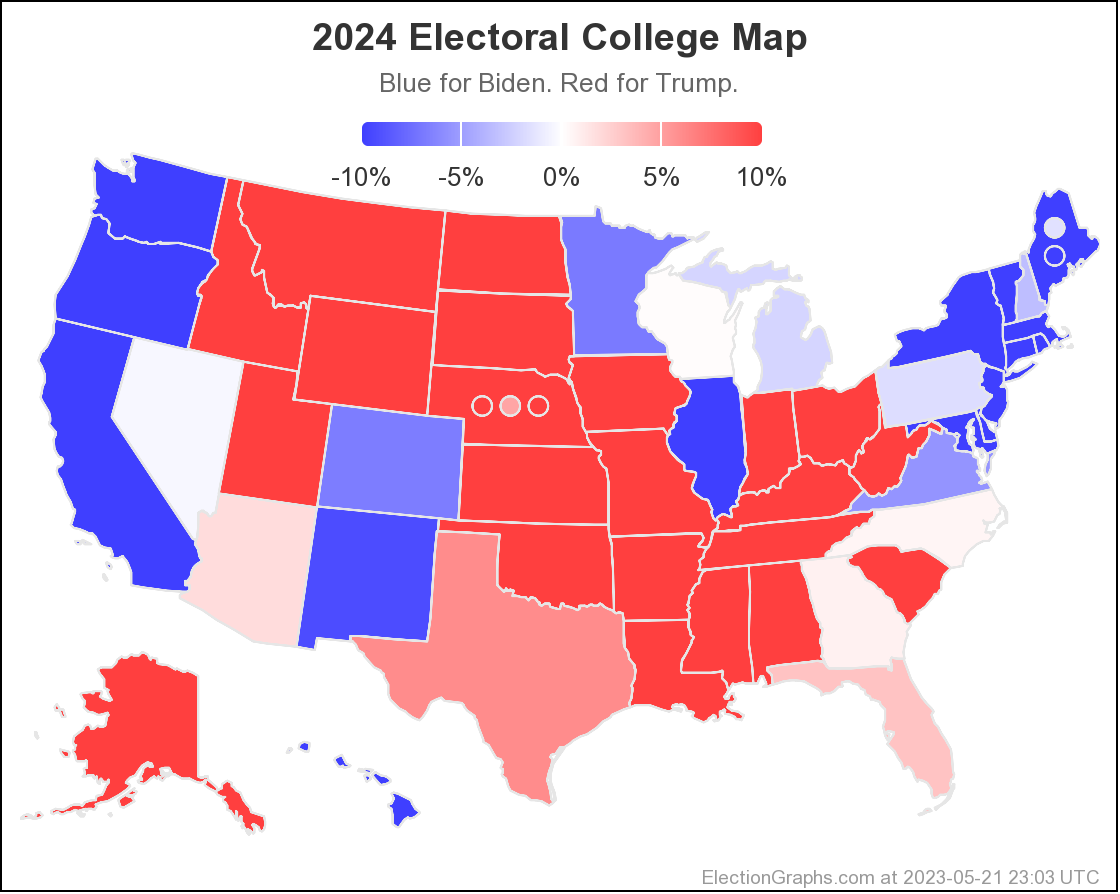
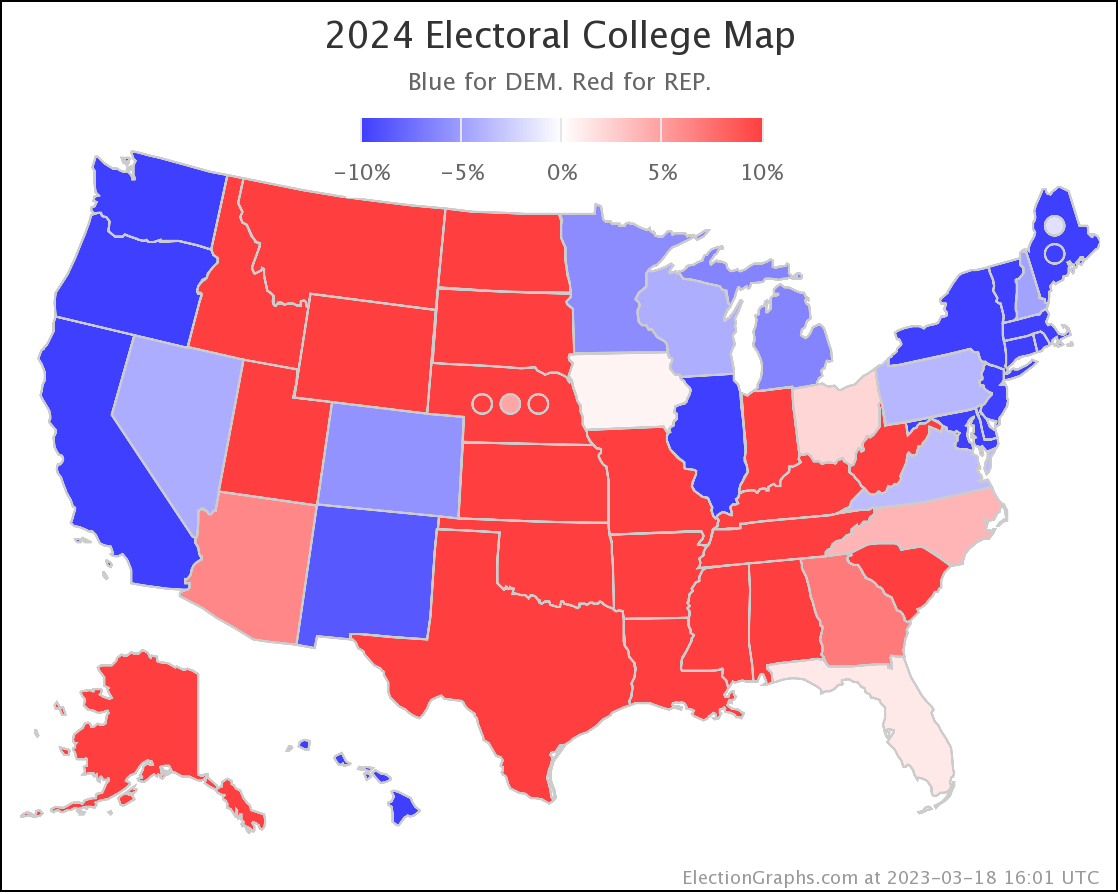
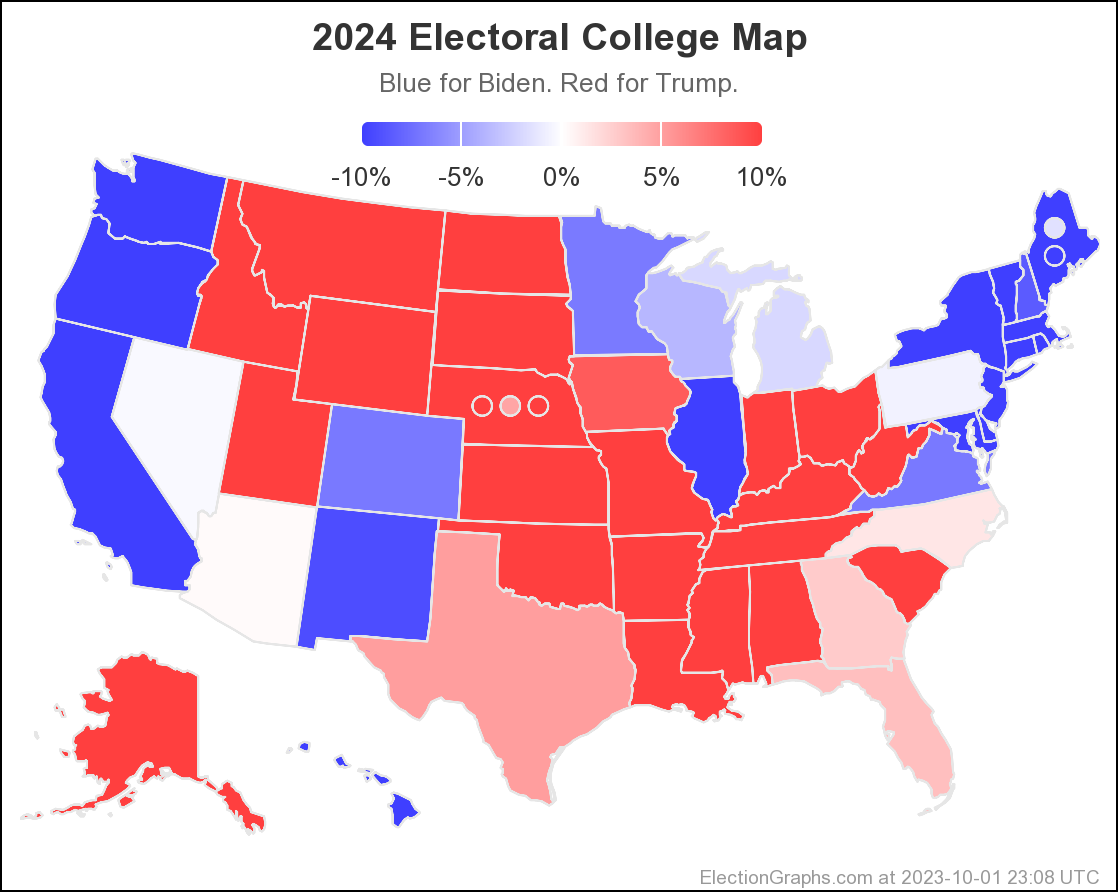
As I always do, I'm going to end with the current national Biden vs Trump map:
400.8 days until polls start to close on Election Night 2024. Hang tight.