
Since the last post about the general election a week ago on March 9th, there have been new polls in Arizona (x4), Michigan (x4), Pennsylvania (x2), Wisconsin (x3), North Dakota, Florida, Washington, Oklahoma, Iowa, and Kansas.
For the moment, although Sanders's chances are dim, there are still two candidates, so let's run through our usual charts, looking at just the two of them, and how things have changed since last week.
Let's start with the categorization view where we just see what the results would be if each candidate wins precisely the list of states where they lead in our poll averages.
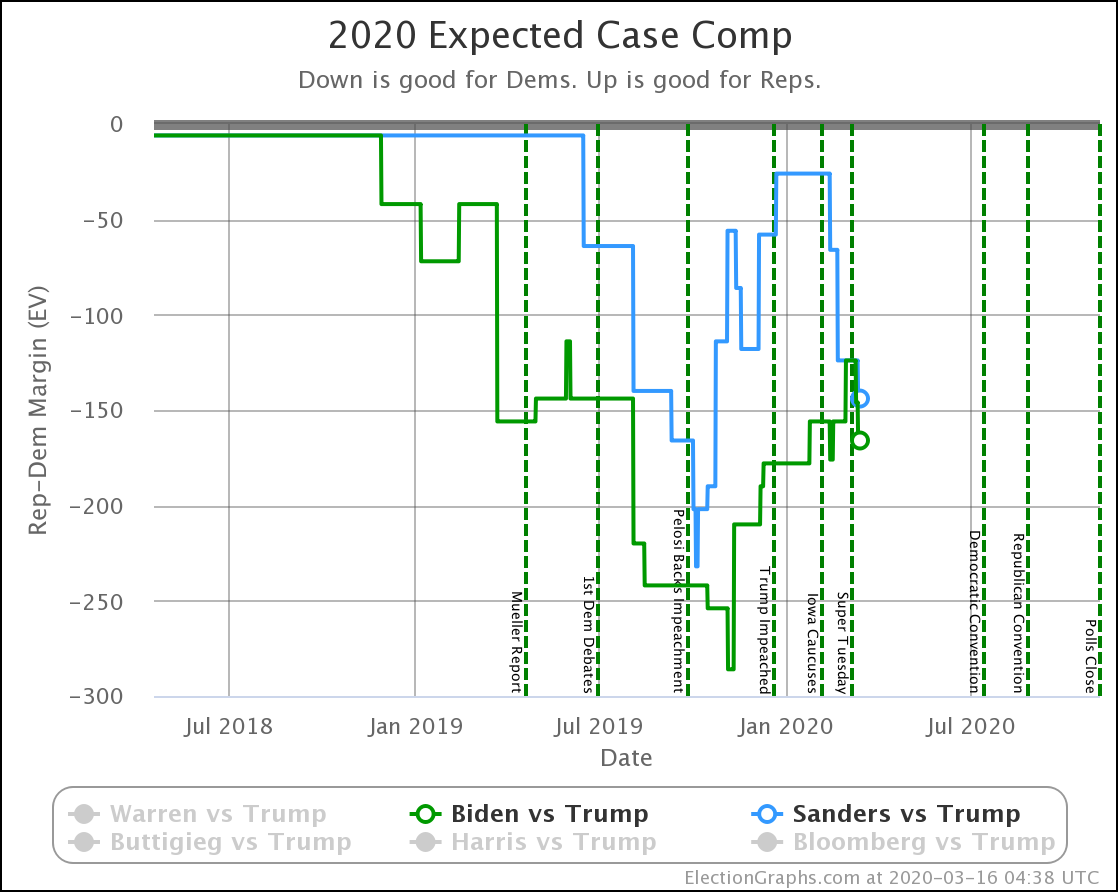
| Dem | 9 Mar | 16 Mar | 𝚫 |
| Biden | +124 | +166 | +42 |
| Sanders | +124 | +144 | +20 |
Both Democrats improve, but they no longer have identical maps. Since last week, both candidates flipped Wisconsin into the blue zone, but Biden also flipped Arizona.
What does that look like when you move to the more complicated probabilistic model?
The following shows the median case (half the time the Democrats do better than this, half the time Trump does better than this):
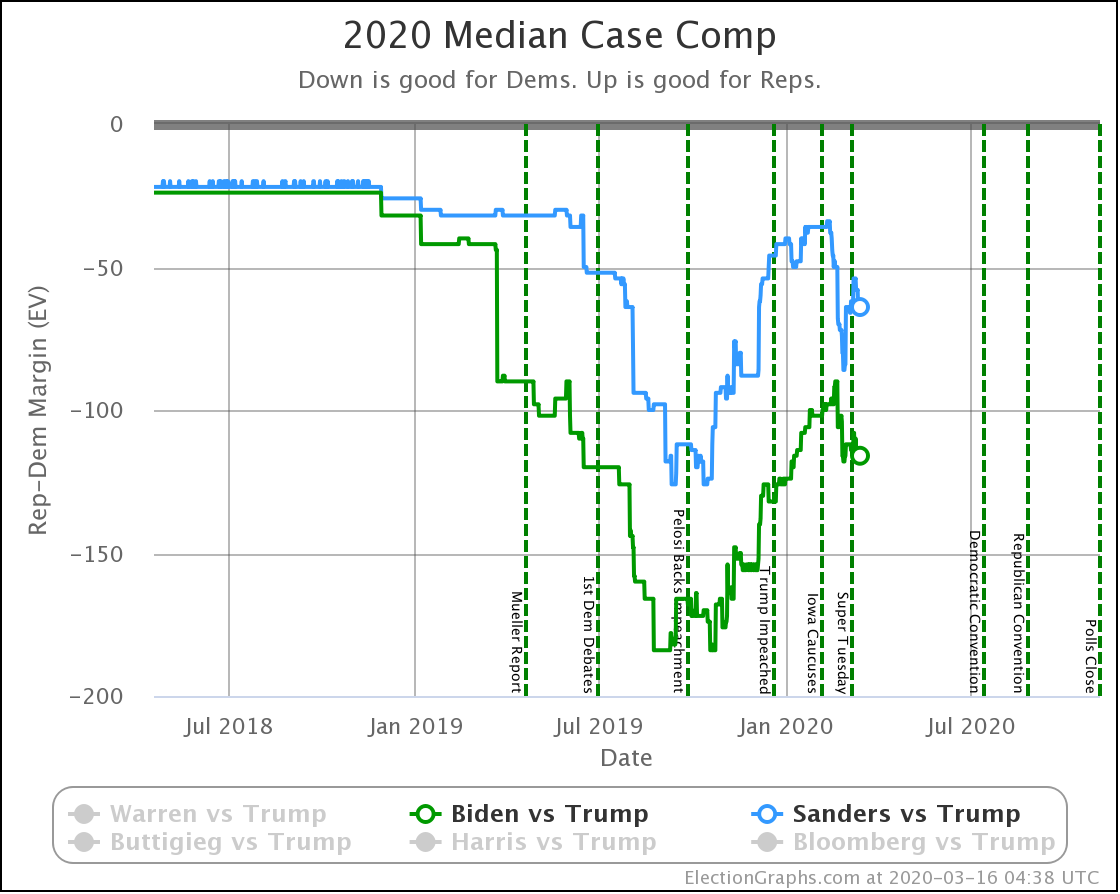
| Dem | 9 Mar | 16 Mar | 𝚫 |
| Biden | +116 | +116 | Flat |
| Sanders | +66 | +64 | -2 |
Both candidates improved when you just give everybody the states they lead. But when you take into account all of the poll movements, the median cases in the simulation barely change. Biden is flat; Sanders declines a bit.
Why? Because even though Biden and Sanders improved and pushed a couple of states over the centerline, other close states moved in the opposite direction, without changing their broad category.
Understanding this situation is the advantage of the probabilistic model. A 1% lead in a state is not the same as a 2% lead, is not the same as a 3% lead, even though they all fit into the "weak lead" category.
So what about the odds?
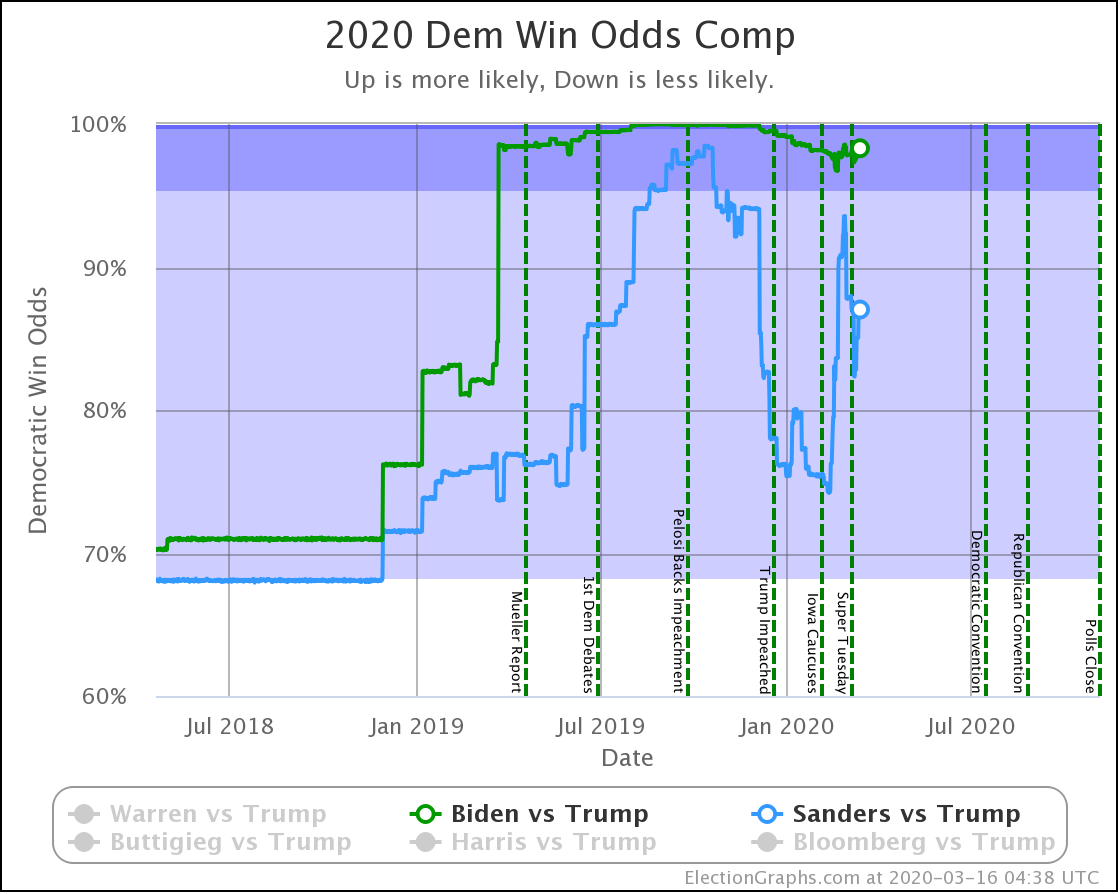
| Dem | 9 Mar | 16 Mar | 𝚫 |
| Biden | 98.3% | 98.3% | Flat |
| Sanders | 87.9% | 87.0% | -0.9% |
Like the median case, Biden is flat; Sanders is down a little.
Similarly, Biden has always had a better position against Trump than Sanders, but both of them are relatively strong.

| Dem | 9 Mar | 16 Mar | 𝚫 |
| Biden | +2.8% | +2.8% | Flat |
| Sanders | +1.5% | +1.4 | -0.1% |
Let's end with the tipping point though. The odds view is "if the election is held today". The tipping point shows how much polls need to shift to change the outcome.
Biden is the stronger of the two candidates against Trump. We have him at a 98.3% chance of winning if the election was today. But the tipping point is only a 2.8% Biden lead.
2.8% is a very small lead.
2.8% can easily be erased with a week of bad news.
98.3% now does not mean 98.3% in November.
But that is where things are today.
232.7 days until polls start to close.
For more information:
This post is an update based on the data on the Election Graphs Electoral College 2020 page. Election Graphs tracks a poll-based estimate of the Electoral College. The charts, graphs, and maps in the post above are all as of the time of this post. Click through on any image for current interactive versions of the chart, along with additional details.
Follow @ElectionGraphs on Twitter or Election Graphs on Facebook to see announcements of updates. For those interested in individual poll updates, follow @ElecCollPolls on Twitter for all the polls as I add them. If you find the information in these posts informative or useful, please consider visiting the donation page.
One thought on “And Then There Were Two”