
On March 4th, we posted an initial delegate status after Super Tuesday, but we noted that results were preliminary and would continue to shift and change as the votes got counted. That process is ongoing. It will be quite some time yet before those results are final.
But since in just a few hours we'll be in the thick of reporting delegate results for a new set of states, it seems like a good time to review how things have changed since the immediate election night results.
Bottom line, as the counting continued, Bloomberg lost lots of delegates to Biden, Sanders, and Warren.
Here is a quick before and after for the total delegates so far:
| Dem | 4 Mar | 𝚫 | 9 Mar |
| Biden | 667 | +26 | 693 |
| Sanders | 581 | +35 | 616 |
| Bloomberg | 140 | -70 | 70 |
| Warren | 76 | +9 | 85 |
| Buttigieg | 26 | 0 | 26 |
| Klobuchar | 7 | 0 | 7 |
| Gabbard | 2 | 0 | 2 |
So while Bloomberg did comparatively well in the vote that came in and was counted on election night, as later ballots came in, his delegate haul was cut in half.
Of those delegates, a full half ended up redistributed to Sanders, followed by Biden, then Warren.
I usually prefer looking at the charts of "% of delegates remaining needed to win," using "% of delegates allocated so far" on the x-axis. Still, in this case, it is useful to look at a chart showing delegate totals with the date on the x-axis:
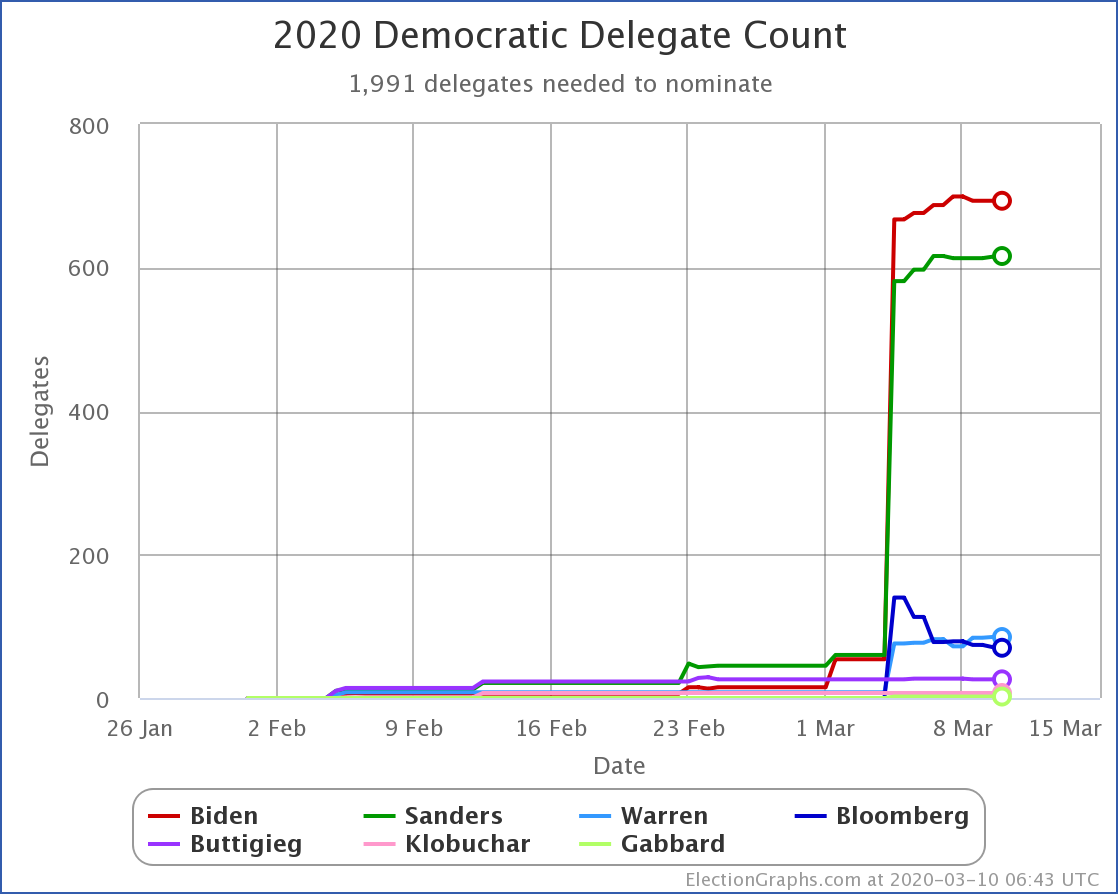
You can see the spike up for Bloomberg on election night, followed by those delegates draining away over the next few days, with Bloomberg eventually falling below Warren in the delegate totals, while both Biden and Sanders benefit from Bloomberg's losses.
Since Sanders got the lion's share of the delegates Bloomberg gave up, he closed the gap between himself and Biden from 86 delegates to 77 delegates.
But the raw number of delegates doesn't matter here. It is time to think once again about the percentage of the remaining delegates they need to win. And what that means for the 352 delegates allocated on March 10th.
With the election night estimate, Biden needed 53.39% of the remaining delegates to win (188 of the 352 on March 10th), while Sanders needed 56.85% of them (201 of the 352 on March 10th).
Updated with several additional days of vote counting, Biden needs 52.34% of the remaining delegates to win (185 of the 352 on March 10th), while Sanders needs 55.44% of them (196 of the 352 on March 10th).
While the numbers change a little bit, the overall picture remains the same.
Although mathematically still possible, the chances for a contested convention have almost disappeared. We will probably end up with a winner on the first ballot. With the current numbers, that is a lot easier for Biden than it will be for Sanders.
If you consider not just the pure mathematics of the current position described above, but also the current polling, the picture gets even more dire for Sanders.
So as returns come in from the March 10th contests, ignore who wins what states, and look at the total delegate numbers. Does either Biden or Sanders meet the marks listed above? Do both "% of remaining needed" lines continue to go up? Or does one swing down? If one goes up, does it go up high enough that a comeback is ridiculously unlikely?
We will do a blog post here once the election night results have stabilized. If you want hourly updates of the delegate counts, follow @ElecCollPolls on Twitter as well.
We'll know in just a few hours if Biden has wrapped this thing up, or if Sanders manages to keep the contest going.
125.4 days until the Democratic National Convention.
167.4 days until the Republican National Convention.
Update 2020-03-11 00:31 UTC – Of course, me posting about it does not stop the vote counting. Since the above, Bloomberg loses 8 more delegates. Of those 5 go to Biden, 2 go to Warren, and 1 goes to Sanders. Biden now needs 52.14% (184 of tonight's 352 delegates) to be on pace for a majority. Sanders now needs 55.40% (196 of tonight's 352 delegates) to be on pace for a majority.
For more information:
This post is an update based on the data on the Election Graphs 2020 Delegate Race page. Election Graphs tracks estimates of the convention delegate totals for both parties. The charts, graphs, and maps in the post above are all as of the time of this post. Click through on any image for the current interactive versions of that chart, along with additional details.
Follow @ElectionGraphs on Twitter or Election Graphs on Facebook to see announcements of new blog posts. For those interested in more granular updates of delegate updates or general election polling, follow @ElecCollPolls on Twitter. If you find the information in these posts informative or useful, please consider visiting the donation page.
One thought on “Super Tuesday Delegate Update”